Embed Size (px)
Citation preview

Enduring Value2012 Annual Report – Executive Summary:Our Financial, Environmental, Social and Governance Performance
About This Report
This is an executive summary of The Clorox Company 2012 annual report, which covers our financial, environmental, social and governance performance. The full fiscal year 2012 report can be found online at annualreport.thecloroxcompany.com. Questions or comments about this summary report and the full report can be directed to: [email protected].
Reporting Standards
We developed our full fiscal year 2012 report using the Global Reporting Initiative’s (GRI) G3.1 Reporting Guidelines, which provide a recommended framework and indicators for reporting on our financial, environmental, social and governance performance. We also sought third-party verification of our greenhouse gas emissions. Based on the numbers of disclosures we include, our full fiscal year 2012 report met a GRI-checked application of “B+”. Our GRI content index details the location of our GRI standard disclosures in our full fiscal year 2012 annual report and on our corporate website. For more information, please see our GRI index at annualreport.thecloroxcompany.com/ gri_index.
Reporting Period
Unless otherwise stated, the data in this report covers wholly owned and controlled operations during the period of July 1, 2011, through June 30, 2012. Environmental sustainability data is tracked on a calendar-year basis. In some instances, we have included data from prior years to show year-over-year comparisons. We plan to issue a combined report annually.
2012 Annual Report – Executive Summary:Our Financial, Environmental, Social and Governance Performance
Read the full 2012 annual report at: annualreport.thecloroxcompany.com
Contents
1 CEO Letter5 Company Profile6 Performance8 Products8 Planet9 People9 Purpose10 Governance and Leadership12 Board of Directors13 Stockholder Information
Information on the G3.1 Reporting Guidelines and application levels is available at globalreporting.org.
The Clorox Company | 1
On May 3, 1913, five men invested $500 to start a business, with the vision of fulfilling their American dream in a bottle of bleach. Initially challenged by operational issues and a lack of consumer awareness, the company almost folded. But two early investors, William and Annie Murray, could not afford to lose their investment. William stepped in, streamlined the company’s operations and arranged new financing. Annie had the brilliant idea to market the liquid bleach to homemakers with free samples in their family’s grocery store. Her customers loved it and told their friends.
Almost a century later, The Clorox Company is now a thriving $5.5 billion company with products marketed in more than 100 countries. About 8,400 people around the world continue to uphold the Murrays’ tenacious and innovative spirit and, like William and Annie, believe in the enduring value of The Clorox Company.
We’ve grown our business despite the challenging economic environment.
Today, Clorox people continue to strive for excellence, even in the face of tough economic times. Since fiscal year 2008, we have delivered solid results despite the economic recession and
the ongoing challenges of the economy. We have grown sales an average of nearly 3 percent during this period. Importantly, we have also delivered strong total stockholder returns of 59 percent, compared to an average of 47 percent by our peers and 16 percent by the S&P 500. In the last eight years, we have repurchased nearly 40 percent of our outstanding shares. Between share repurchases and increases in total annual dividends paid to stockholders, we have returned more than $5 billion in cash to our stockholders since fiscal year 2005.
And, in keeping with tradition, strong governance and values underpin our financial performance. Corporate responsibility (CR) is embedded in all aspects of our business, and we continue to step up our CR efforts because we believe doing the right thing is simply good business.
We delivered solid results in fiscal year 2012, and our leading brands are well positioned as the economy improves.
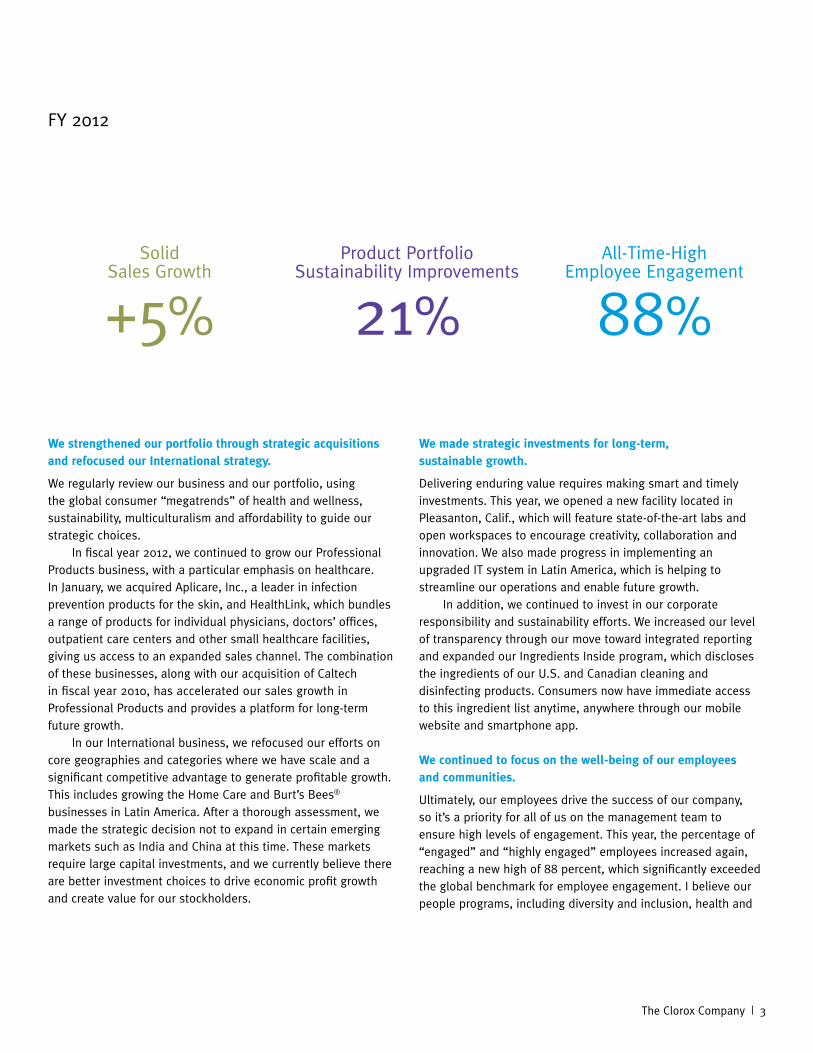
Turning to our fiscal year 2012 results, we continued to face a tough global economy, including rising commodity costs and high inflation in some of our international markets. Despite these challenges, we delivered 5 percent sales growth, due, in large part, to excellent execution across our “3D”
100 Years of Enduring Value
Clorox Stakeholders:
Donald R. Knauss | Chairman and Chief Executive Officer
2 | 2012 Executive Summary
demand-creation model of desire, decide and delight. We produced award-winning marketing communications to drive consumer desire, created standout product packaging and in-store promotions to compel purchase decisions at the point of decide and delivered superior-quality products to delight consumers. We strive to make products that are preferred by consumers versus competitors’ products. In fiscal year 2007, products with a strong consumer preference represented about 34 percent of our portfolio. In fiscal year 2012, that figure rose to 48 percent of our portfolio, and we aim to go higher over the coming years.
This year, we delivered record levels of product innovation, which contributed more than 3 percentage points of incremental sales growth. Fiscal year 2012 was the 10th consecutive year we’ve met or exceeded our annual innovation target of 2 percentage points of incremental sales growth from new products.
Since 2010, we have made sustainability improvements to 21 percent of our product portfolio, positioning us to exceed our 25 percent goal by 2013.
Innovation and improvements to our product portfolio helped us grow our U.S. market share, despite price increases we implemented across about 70 percent of our product portfolio over the last few years. We also were able to grow market share in our largest international region, Latin America.
One of our biggest challenges in fiscal year 2012 was pressure on our margins from inflation, rising commodity costs and strategic infrastructure investments, including an upgraded
information technology (IT) system in Latin America and our new Pleasanton, Calif., campus. We are focused on rebuilding our margins and have plans in place to drive both our top-line and bottom-line growth.
In light of the strategic investments we continued to make to support the long-term growth of our business, we are pleased with our fiscal year 2012 results, including:
n Earnings from continuing operations that were about flat versus the prior year.1,2
n Diluted net earnings per share from continuing operations of $4.10, an increase of 4 percent versus fiscal year 2011 diluted net earnings per share of $3.93.1,2
n Economic profit (EP) of $402 million, an increase of more than 2 percent, compared to $393 million in fiscal 2011.1,3
n Free cash flow of $428 million, or about 8 percent of net sales, versus $462 million, or about 9 percent of net sales, in fiscal year 2011, a decrease due, in some part, to margin compression and the strategic infrastructure investments noted above.1,4
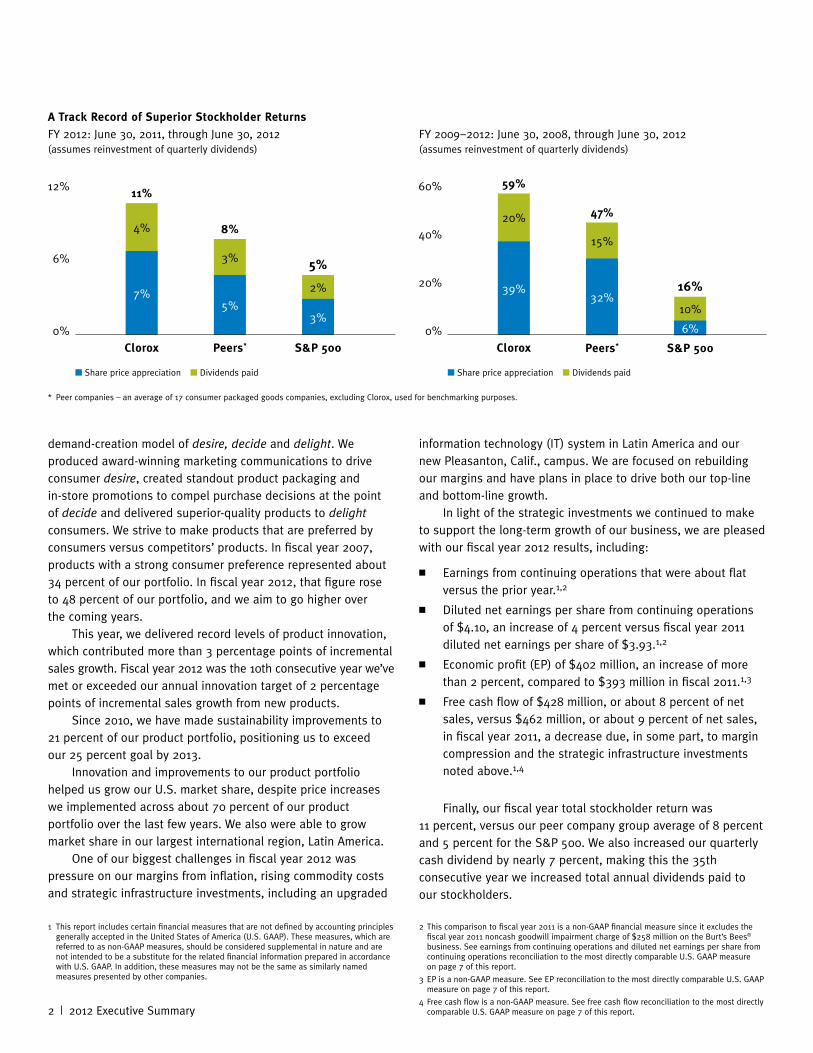
Finally, our fiscal year total stockholder return was 11 percent, versus our peer company group average of 8 percent and 5 percent for the S&P 500. We also increased our quarterly cash dividend by nearly 7 percent, making this the 35th consecutive year we increased total annual dividends paid to our stockholders.
A Track Record of Superior Stockholder Returns
FY 2012: June 30, 2011, through June 30, 2012(assumes reinvestment of quarterly dividends)
n Share price appreciation n Dividends paid
Clorox
11%
Peers*
8%
S&P 500
5%
12%
6%
0%
7%
4%
5%
3%
3%
2%
* Peer companies – an average of 17 consumer packaged goods companies, excluding Clorox, used for benchmarking purposes.
1 This report includes certain financial measures that are not defined by accounting principles generally accepted in the United States of America (U.S. GAAP). These measures, which are referred to as non-GAAP measures, should be considered supplemental in nature and are not intended to be a substitute for the related financial information prepared in accordance with U.S. GAAP. In addition, these measures may not be the same as similarly named measures presented by other companies.
2 This comparison to fiscal year 2011 is a non-GAAP financial measure since it excludes the fiscal year 2011 noncash goodwill impairment charge of $258 million on the Burt’s Bees® business. See earnings from continuing operations and diluted net earnings per share from continuing operations reconciliation to the most directly comparable U.S. GAAP measure on page 7 of this report.
3 EP is a non-GAAP measure. See EP reconciliation to the most directly comparable U.S. GAAP measure on page 7 of this report.
4 Free cash flow is a non-GAAP measure. See free cash flow reconciliation to the most directly comparable U.S. GAAP measure on page 7 of this report.
FY 2009–2012: June 30, 2008, through June 30, 2012 (assumes reinvestment of quarterly dividends)
n Share price appreciation n Dividends paid
Clorox
59%
Peers*
47%
S&P 500
16%
60%
40%
0%
20% 39%
20%
32%
15%
6%
10%
The Clorox Company | 3
Solid Sales Growth
+5%Product Portfolio
Sustainability Improvements
21%
We strengthened our portfolio through strategic acquisitions and refocused our International strategy.
We regularly review our business and our portfolio, using the global consumer “megatrends” of health and wellness, sustainability, multiculturalism and affordability to guide our strategic choices.
In fiscal year 2012, we continued to grow our Professional Products business, with a particular emphasis on healthcare. In January, we acquired Aplicare, Inc., a leader in infection prevention products for the skin, and HealthLink, which bundles a range of products for individual physicians, doctors’ offices, outpatient care centers and other small healthcare facilities, giving us access to an expanded sales channel. The combination of these businesses, along with our acquisition of Caltech in fiscal year 2010, has accelerated our sales growth in Professional Products and provides a platform for long-term future growth.
In our International business, we refocused our efforts on core geographies and categories where we have scale and a significant competitive advantage to generate profitable growth. This includes growing the Home Care and Burt’s Bees® businesses in Latin America. After a thorough assessment, we made the strategic decision not to expand in certain emerging markets such as India and China at this time. These markets require large capital investments, and we currently believe there are better investment choices to drive economic profit growth and create value for our stockholders.
We made strategic investments for long-term, sustainable growth.
Delivering enduring value requires making smart and timely investments. This year, we opened a new facility located in Pleasanton, Calif., which will feature state-of-the-art labs and open workspaces to encourage creativity, collaboration and innovation. We also made progress in implementing an upgraded IT system in Latin America, which is helping to streamline our operations and enable future growth.
In addition, we continued to invest in our corporate responsibility and sustainability efforts. We increased our level of transparency through our move toward integrated reporting and expanded our Ingredients Inside program, which discloses the ingredients of our U.S. and Canadian cleaning and disinfecting products. Consumers now have immediate access to this ingredient list anytime, anywhere through our mobile website and smartphone app.
We continued to focus on the well-being of our employees and communities.
Ultimately, our employees drive the success of our company, so it’s a priority for all of us on the management team to ensure high levels of engagement. This year, the percentage of “engaged” and “highly engaged” employees increased again, reaching a new high of 88 percent, which significantly exceeded the global benchmark for employee engagement. I believe our people programs, including diversity and inclusion, health and
All-Time-High Employee Engagement
88%
FY 2012
4 | 2012 Executive Summary
wellness, workplace safety, in-house training and development, and recognition, play a strong part in engaging both the heads and hearts of Clorox employees.
We also believe that vibrant, healthy communities play a significant role in the health of our business. That’s why The Clorox Company Foundation has awarded cash grants totaling more than $87 million to nonprofit organizations, schools and colleges since 1980. In fiscal year 2012, the foundation awarded $3.5 million in cash grants, and Clorox made product donations valued at $15 million.
We are committed to delivering enduring value for stakeholders today and into the future.
As we enter our centennial year and begin to refresh our strategic roadmap for 2020, we remain committed to having Clorox continue to be a smart, long-term investment.
Delivering value to our stockholders is our No. 1 priority, and we aim to be among the top third of companies in our peer group with respect to total stockholder returns over the coming years. Our track record of strong cash flow will enable us to continue to support our dividend, pursue strategic acquisitions and return excess cash to stockholders.
And to reach our ongoing goal of 3 percent to 5 percent annual sales growth, we are focused on three growth pillars: U.S. Retail, Professional Products and International. In our U.S. Retail business, which represents about 75 percent of our company sales, we will continue to grow our market share through our 3D demand-creation model. Within Professional Products, which represents about 4 percent of our total sales, we are focused on expanding our healthcare business
organically and through bolt-on acquisitions, like Aplicare, Inc. and HealthLink. And with our International business, which represents over 20 percent of our total sales, we plan to increase our focus on our current markets and capture value from our technology investments.
We also will continue to accelerate our innovation efforts and have raised our annual target for sales growth from new products from 2 percent to 3 percent. Indeed, one of the biggest lessons we learned during the recession is that providing consumers with affordable, high-quality products is the key to reinforcing the value proposition of our brands.
Clorox has come a long way since 1913. We have grown from an industrial bleach manufacturer to a global company with a diverse portfolio, with nearly 90 percent of our brands ranking No. 1 or No. 2 in market share. We have consistently delivered stockholder value even in the most challenging times. And we are a family of 8,400 employees around the world committed to delivering enduring value by focusing on our mission of making everyday life better, every day.
Thank you for your support.
Sincerely,
Donald R. KnaussChairman and Chief Executive OfficerAugust 24, 2012
* Source: Market share for U.S. retail brands (excluding Burt’s Bees® brand) are based on Information Resources, Inc. (IRI) Infoscan Data – Total U.S. Multi-Outlet (Food/Drug/Mass, Walmart, Sam’s, BJ’s, Family Dollar, Fred’s and DeCA) for 52 weeks ended June 24, 2012. Burt’s Bees® market share (as of June 2012) is based on IRI (Grocery & Drug), SPINS (natural grocery excluding Whole Foods) and customer data for Target, Walmart and Whole Foods. International market share data is from IRI as of June 2011.
Nearly 90% of our brands
rank No. 1 or No. 2in market share*
The Clorox Company | 5
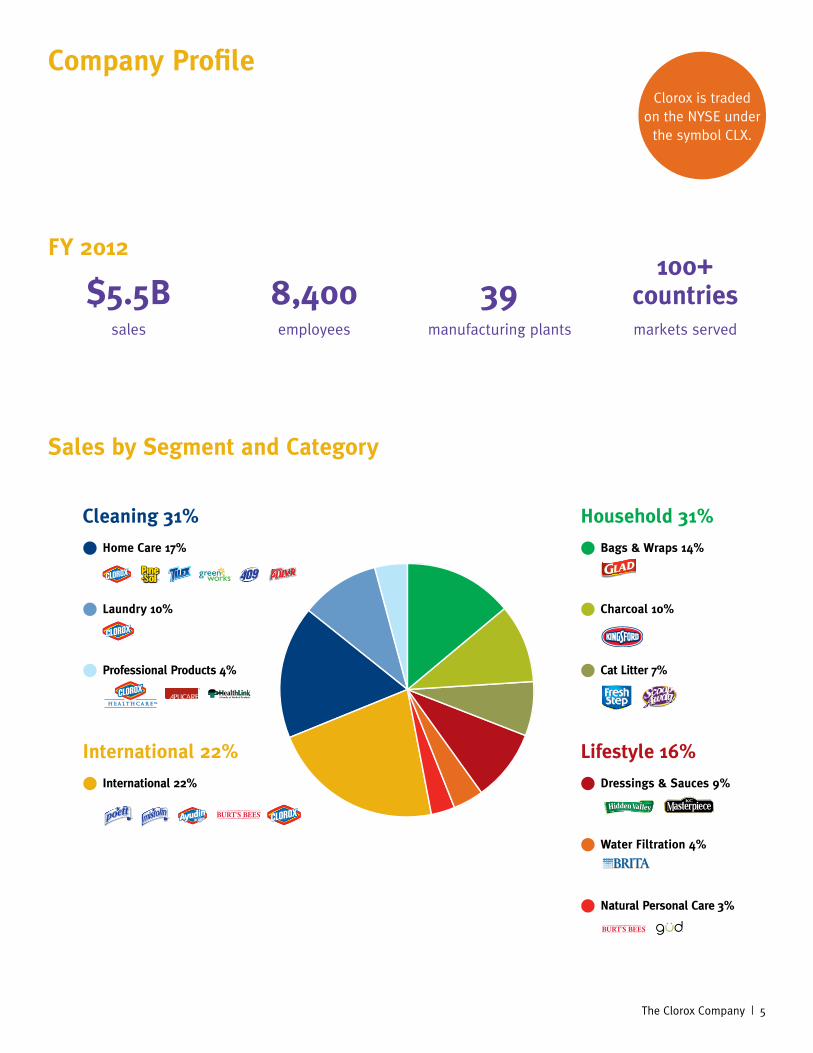
Household 31%
● Bags & Wraps 14%
● Charcoal 10%
● Cat Litter 7%
Lifestyle 16%
● Dressings & Sauces 9%
● Water Filtration 4%
● Natural Personal Care 3%
Company Profile
FY 2012
$5.5Bsales
8,400employees
39manufacturing plants
100+ countriesmarkets served
Clorox is traded on the NYSE under
the symbol CLX.
Cleaning 31%
● Home Care 17%
● Laundry 10%
● Professional Products 4%
International 22%
● International 22%
Sales by Segment and Category
BRANDCLEANER
®

6 | 2012 Executive Summary
PerformanceAchieving financial success with transparency and strong governance
$287‡
Earnings From Continuing Operations Before Interest and Taxes Margin (as a % of Net Sales)1 (non-GAAP)
18% 18%*
17%
* Excluding noncash Burt’s Bees® goodwill impairment charge
** Including noncash Burt’s Bees® goodwill impairment charge
13%**
$526‡$545† $543‡
† Non-GAAP
‡ GAAP
Net Sales
$ Millions
2010
$5,234
2011
$5,231
2012
$5,468
Earnings From Continuing Operations2
$ Millions
2010 2011 2012 2010 2011 2012
$392 $393$402
Economic Profit4
(non-GAAP)
$ Millions
2010 2011 2012
Net Cash Provided by Continuing Operations
$ Millions
$764
$690
$620
2010 2011 2012
Diluted Net Earnings Per Share From Continuing Operations2
$ Dollars
$3.69‡$3.93†
$4.10‡
† Non-GAAP
‡ GAAP
2010 2011 2012
$2.07‡
Free Cash Flow5
(non-GAAP)
$ Millions
$563
$462$428
2010 2011 2012
Return on Invested Capital3
(non-GAAP)
23.4%23.9% 24.2%
2010 2011 2012
The Clorox Company | 7
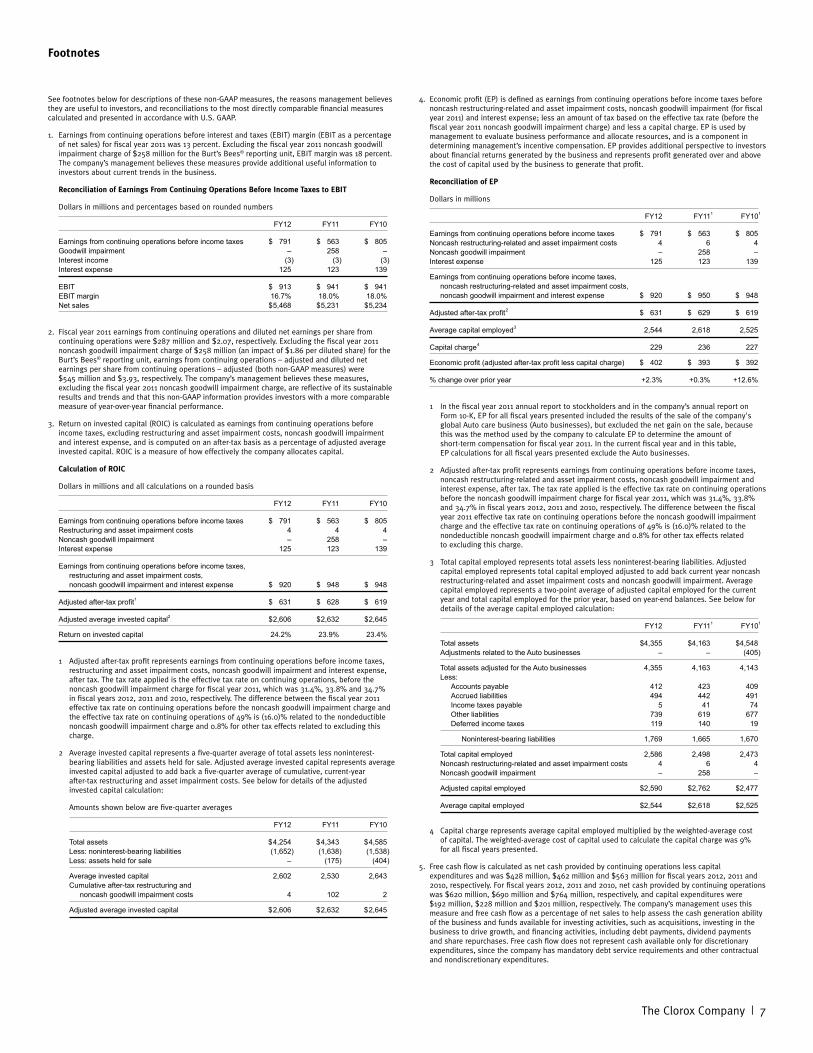
Footnotes
See footnotes below for descriptions of these non-GAAP measures, the reasons management believes they are useful to investors, and reconciliations to the most directly comparable financial measures calculated and presented in accordance with U.S. GAAP.
1. Earnings from continuing operations before interest and taxes (EBIT) margin (EBIT as a percentage of net sales) for fiscal year 2011 was 13 percent. Excluding the fiscal year 2011 noncash goodwill impairment charge of $258 million for the Burt’s Bees® reporting unit, EBIT margin was 18 percent. The company’s management believes these measures provide additional useful information to investors about current trends in the business.
Reconciliation of Earnings From Continuing Operations Before Income Taxes to EBIT
Dollars in millions and percentages based on rounded numbers
FY12 FY11 FY10
Earnings from continuing operations before income taxes $ 791 $ 563 $ 805Goodwill impairment – 258 –Interest income (3) (3) (3)Interest expense 125 123 139
EBIT $ 913 $ 941 $ 941EBIT margin 16.7% 18.0% 18.0%Net sales $ 5,468 $ 5,231 $ 5,234
2. Fiscal year 2011 earnings from continuing operations and diluted net earnings per share from continuing operations were $287 million and $2.07, respectively. Excluding the fiscal year 2011 noncash goodwill impairment charge of $258 million (an impact of $1.86 per diluted share) for the Burt’s Bees® reporting unit, earnings from continuing operations – adjusted and diluted net earnings per share from continuing operations – adjusted (both non-GAAP measures) were $545 million and $3.93, respectively. The company’s management believes these measures, excluding the fiscal year 2011 noncash goodwill impairment charge, are reflective of its sustainable results and trends and that this non-GAAP information provides investors with a more comparable measure of year-over-year financial performance.
3. Return on invested capital (ROIC) is calculated as earnings from continuing operations before income taxes, excluding restructuring and asset impairment costs, noncash goodwill impairment and interest expense, and is computed on an after-tax basis as a percentage of adjusted average invested capital. ROIC is a measure of how effectively the company allocates capital.
Calculation of ROIC
Dollars in millions and all calculations on a rounded basis
FY12 FY11 FY10
Earnings from continuing operations before income taxes $ 791 $ 563 $ 805Restructuring and asset impairment costs 4 4 4Noncash goodwill impairment – 258 –Interest expense 125 123 139
Earnings from continuing operations before income taxes, restructuring and asset impairment costs, noncash goodwill impairment and interest expense $ 920 $ 948 $ 948
Adjusted after-tax profit1 $ 631 $ 628 $ 619
Adjusted average invested capital2 $ 2,606 $ 2,632 $ 2,645
Return on invested capital 24.2% 23.9% 23.4%
1 Adjusted after-tax profit represents earnings from continuing operations before income taxes, restructuring and asset impairment costs, noncash goodwill impairment and interest expense, after tax. The tax rate applied is the effective tax rate on continuing operations, before the noncash goodwill impairment charge for fiscal year 2011, which was 31.4%, 33.8% and 34.7% in fiscal years 2012, 2011 and 2010, respectively. The difference between the fiscal year 2011 effective tax rate on continuing operations before the noncash goodwill impairment charge and the effective tax rate on continuing operations of 49% is (16.0)% related to the nondeductible noncash goodwill impairment charge and 0.8% for other tax effects related to excluding this charge.
2 Average invested capital represents a five-quarter average of total assets less noninterest-bearing liabilities and assets held for sale. Adjusted average invested capital represents average invested capital adjusted to add back a five-quarter average of cumulative, current-year after-tax restructuring and asset impairment costs. See below for details of the adjusted invested capital calculation:
Amounts shown below are five-quarter averages
FY12 FY11 FY10
Total assets $4,254 $4,343 $4,585Less: noninterest-bearing liabilities (1,652) (1,638) (1,538)Less: assets held for sale – (175) (404)
Average invested capital 2,602 2,530 2,643 Cumulative after-tax restructuring and noncash goodwill impairment costs 4 102 2
Adjusted average invested capital $2,606 $2,632 $2,645
4. Economic profit (EP) is defined as earnings from continuing operations before income taxes before noncash restructuring-related and asset impairment costs, noncash goodwill impairment (for fiscal year 2011) and interest expense; less an amount of tax based on the effective tax rate (before the fiscal year 2011 noncash goodwill impairment charge) and less a capital charge. EP is used by management to evaluate business performance and allocate resources, and is a component in determining management’s incentive compensation. EP provides additional perspective to investors about financial returns generated by the business and represents profit generated over and above the cost of capital used by the business to generate that profit.
Reconciliation of EP
Dollars in millions
FY12 FY111 FY101
Earnings from continuing operations before income taxes $ 791 $ 563 $ 805Noncash restructuring-related and asset impairment costs 4 6 4Noncash goodwill impairment – 258 –Interest expense 125 123 139
Earnings from continuing operations before income taxes, noncash restructuring-related and asset impairment costs, noncash goodwill impairment and interest expense $ 920 $ 950 $ 948
Adjusted after-tax profit2 $ 631 $ 629 $ 619
Average capital employed3 2,544 2,618 2,525
Capital charge4 229 236 227
Economic profit (adjusted after-tax profit less capital charge) $ 402 $ 393 $ 392
% change over prior year +2.3% +0.3% +12.6%
1 In the fiscal year 2011 annual report to stockholders and in the company’s annual report on Form 10-K, EP for all fiscal years presented included the results of the sale of the company's global Auto care business (Auto businesses), but excluded the net gain on the sale, because this was the method used by the company to calculate EP to determine the amount of short-term compensation for fiscal year 2011. In the current fiscal year and in this table, EP calculations for all fiscal years presented exclude the Auto businesses.
2 Adjusted after-tax profit represents earnings from continuing operations before income taxes, noncash restructuring-related and asset impairment costs, noncash goodwill impairment and interest expense, after tax. The tax rate applied is the effective tax rate on continuing operations before the noncash goodwill impairment charge for fiscal year 2011, which was 31.4%, 33.8% and 34.7% in fiscal years 2012, 2011 and 2010, respectively. The difference between the fiscal year 2011 effective tax rate on continuing operations before the noncash goodwill impairment charge and the effective tax rate on continuing operations of 49% is (16.0)% related to the nondeductible noncash goodwill impairment charge and 0.8% for other tax effects related to excluding this charge.
3 Total capital employed represents total assets less noninterest-bearing liabilities. Adjusted capital employed represents total capital employed adjusted to add back current year noncash restructuring-related and asset impairment costs and noncash goodwill impairment. Average capital employed represents a two-point average of adjusted capital employed for the current year and total capital employed for the prior year, based on year-end balances. See below for details of the average capital employed calculation:
FY12 FY111 FY101
Total assets $4,355 $4,163 $4,548Adjustments related to the Auto businesses – – (405)
Total assets adjusted for the Auto businesses 4,355 4,163 4,143Less: Accounts payable 412 423 409 Accrued liabilities 494 442 491 Income taxes payable 5 41 74 Other liabilities 739 619 677
Deferred income taxes 119 140 19
Noninterest-bearing liabilities 1,769 1,665 1,670
Total capital employed 2,586 2,498 2,473Noncash restructuring-related and asset impairment costs 4 6 4Noncash goodwill impairment – 258 –
Adjusted capital employed $2,590 $2,762 $2,477
Average capital employed $2,544 $2,618 $2,525
4 Capital charge represents average capital employed multiplied by the weighted-average cost of capital. The weighted-average cost of capital used to calculate the capital charge was 9% for all fiscal years presented.
5. Free cash flow is calculated as net cash provided by continuing operations less capital expenditures and was $428 million, $462 million and $563 million for fiscal years 2012, 2011 and 2010, respectively. For fiscal years 2012, 2011 and 2010, net cash provided by continuing operations was $620 million, $690 million and $764 million, respectively, and capital expenditures were $192 million, $228 million and $201 million, respectively. The company’s management uses this measure and free cash flow as a percentage of net sales to help assess the cash generation ability of the business and funds available for investing activities, such as acquisitions, investing in the business to drive growth, and financing activities, including debt payments, dividend payments and share repurchases. Free cash flow does not represent cash available only for discretionary expenditures, since the company has mandatory debt service requirements and other contractual and nondiscretionary expenditures.
8 | 2012 Executive Summary
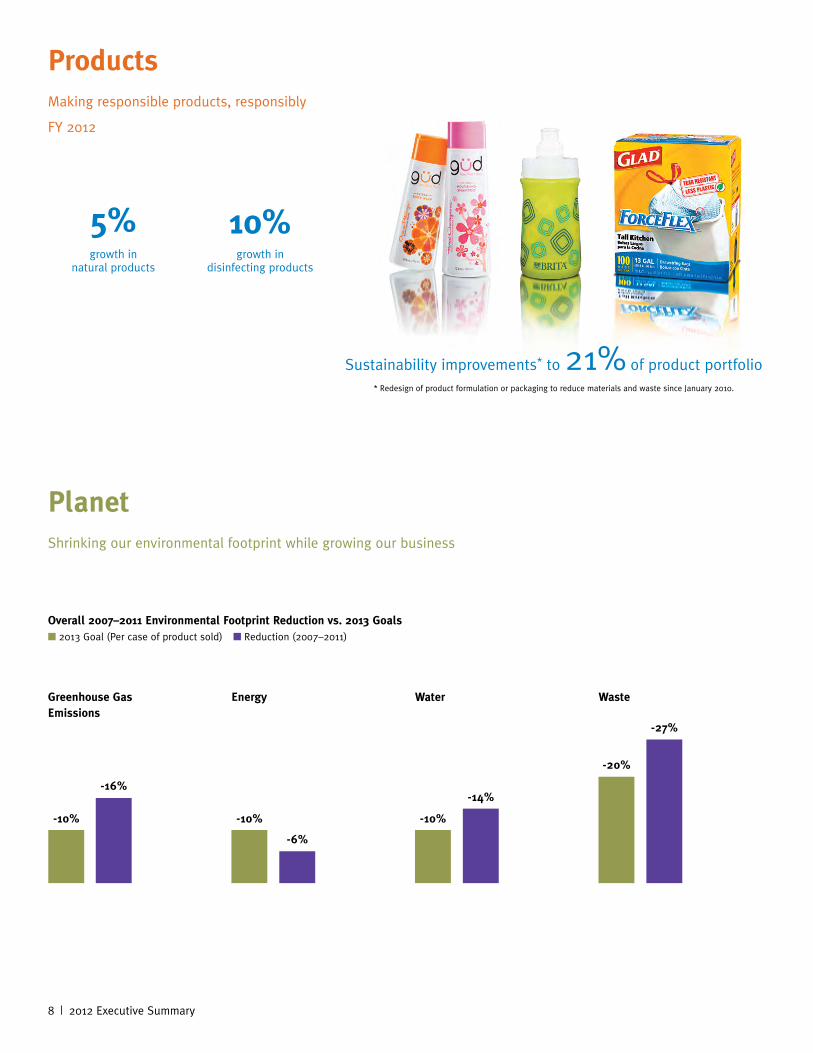
Products Making responsible products, responsibly
FY 2012
Greenhouse Gas Emissions
Energy
Overall 2007–2011 Environmental Footprint Reduction vs. 2013 Goalsn 2013 Goal (Per case of product sold) n Reduction (2007–2011)
Planet Shrinking our environmental footprint while growing our business
-10%
-16%
-10%
-6%
Waste
-20%
-27%
Water
-10%
-14%
5%growth in
natural products
10%growth in
disinfecting products
Sustainability improvements* to 21% of product portfolio* Redesign of product formulation or packaging to reduce materials and waste since January 2010.
The Clorox Company | 9
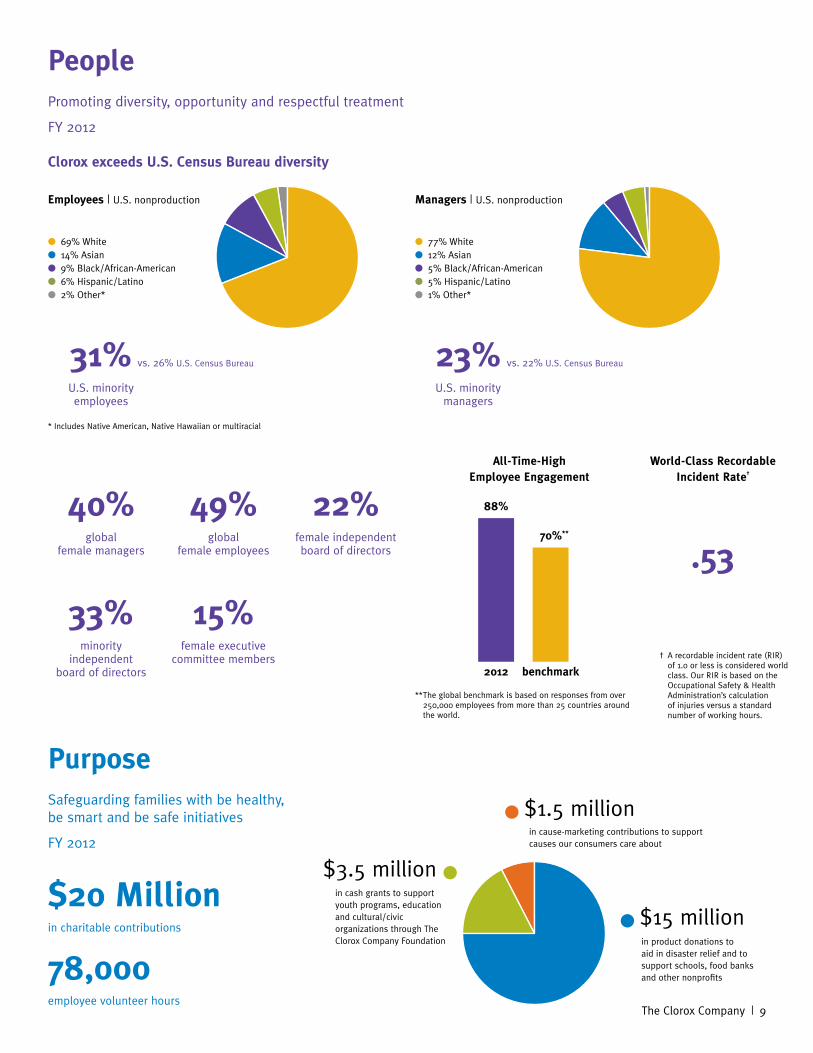
People Promoting diversity, opportunity and respectful treatment
FY 2012
Purpose Safeguarding families with be healthy, be smart and be safe initiatives
FY 2012
49%global
female employees
40%global
female managers
15%female executive
committee members
22%female independent board of directors
33%minority
independent board of directors
●$1.5 millionin cause-marketing contributions to support causes our consumers care about
$3.5 million ●in cash grants to support youth programs, education and cultural/civic organizations through The Clorox Company Foundation
●$15 millionin product donations to aid in disaster relief and to support schools, food banks and other nonprofits
All-Time-High Employee Engagement
.53
World-Class Recordable Incident Rate†
Employees | U.S. nonproduction
● 69% White● 14% Asian● 9% Black/African-American● 6% Hispanic/Latino● 2% Other*
* Includes Native American, Native Hawaiian or multiracial
vs. 26% U.S. Census Bureau
Managers | U.S. nonproduction
● 77% White● 12% Asian● 5% Black/African-American● 5% Hispanic/Latino● 1% Other*
31%U.S. minority employees
23%U.S. minority
managers
vs. 22% U.S. Census Bureau
** The global benchmark is based on responses from over 250,000 employees from more than 25 countries around the world.
† A recordable incident rate (RIR) of 1.0 or less is considered world class. Our RIR is based on the Occupational Safety & Health Administration’s calculation of injuries versus a standard number of working hours.
88%
2012
70%**
benchmark
$20 Million in charitable contributions
78,000employee volunteer hours
Clorox exceeds U.S. Census Bureau diversity
10 | 2012 Executive Summary
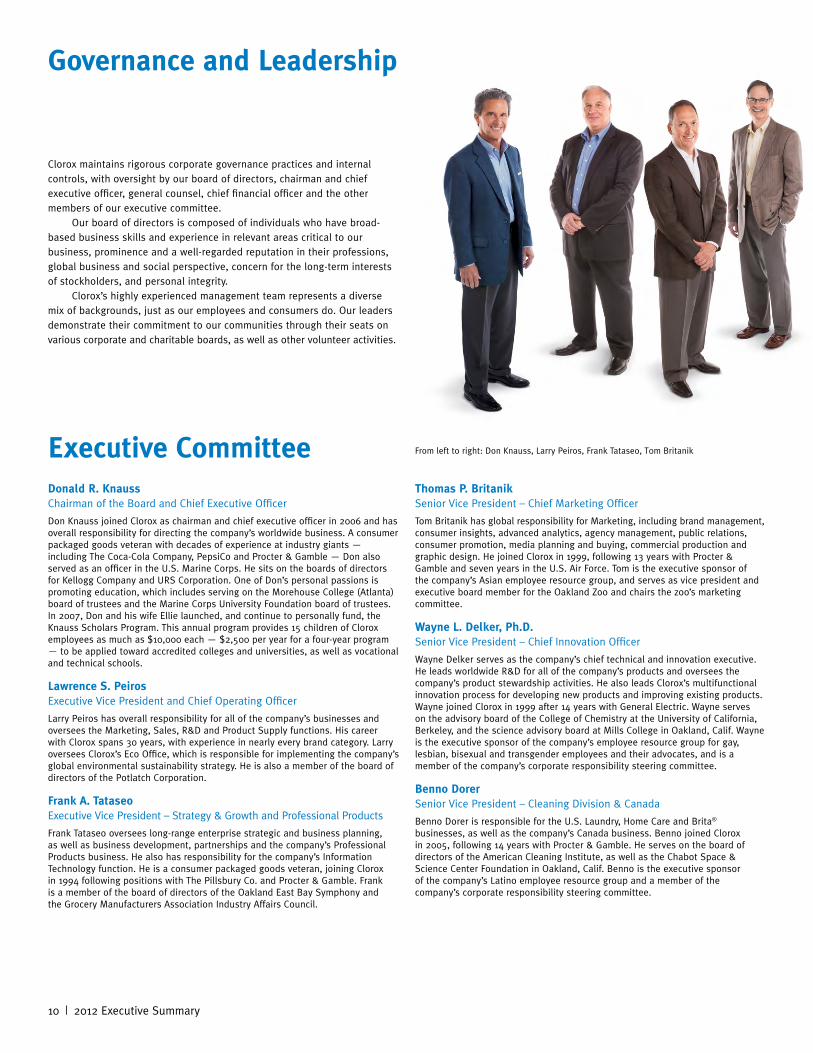
Donald R. KnaussChairman of the Board and Chief Executive Officer
Don Knauss joined Clorox as chairman and chief executive officer in 2006 and has overall responsibility for directing the company’s worldwide business. A consumer packaged goods veteran with decades of experience at industry giants — including The Coca-Cola Company, PepsiCo and Procter & Gamble — Don also served as an officer in the U.S. Marine Corps. He sits on the boards of directors for Kellogg Company and URS Corporation. One of Don’s personal passions is promoting education, which includes serving on the Morehouse College (Atlanta) board of trustees and the Marine Corps University Foundation board of trustees. In 2007, Don and his wife Ellie launched, and continue to personally fund, the Knauss Scholars Program. This annual program provides 15 children of Clorox employees as much as $10,000 each — $2,500 per year for a four-year program — to be applied toward accredited colleges and universities, as well as vocational and technical schools.
Lawrence S. PeirosExecutive Vice President and Chief Operating Officer
Larry Peiros has overall responsibility for all of the company’s businesses and oversees the Marketing, Sales, R&D and Product Supply functions. His career with Clorox spans 30 years, with experience in nearly every brand category. Larry oversees Clorox’s Eco Office, which is responsible for implementing the company’s global environmental sustainability strategy. He is also a member of the board of directors of the Potlatch Corporation.
Frank A. TataseoExecutive Vice President – Strategy & Growth and Professional Products
Frank Tataseo oversees long-range enterprise strategic and business planning, as well as business development, partnerships and the company’s Professional Products business. He also has responsibility for the company’s Information Technology function. He is a consumer packaged goods veteran, joining Clorox in 1994 following positions with The Pillsbury Co. and Procter & Gamble. Frank is a member of the board of directors of the Oakland East Bay Symphony and the Grocery Manufacturers Association Industry Affairs Council.
Thomas P. BritanikSenior Vice President – Chief Marketing Officer
Tom Britanik has global responsibility for Marketing, including brand management, consumer insights, advanced analytics, agency management, public relations, consumer promotion, media planning and buying, commercial production and graphic design. He joined Clorox in 1999, following 13 years with Procter & Gamble and seven years in the U.S. Air Force. Tom is the executive sponsor of the company’s Asian employee resource group, and serves as vice president and executive board member for the Oakland Zoo and chairs the zoo’s marketing committee.
Wayne L. Delker, Ph.D.Senior Vice President – Chief Innovation Officer
Wayne Delker serves as the company’s chief technical and innovation executive. He leads worldwide R&D for all of the company’s products and oversees the company’s product stewardship activities. He also leads Clorox’s multifunctional innovation process for developing new products and improving existing products. Wayne joined Clorox in 1999 after 14 years with General Electric. Wayne serves on the advisory board of the College of Chemistry at the University of California, Berkeley, and the science advisory board at Mills College in Oakland, Calif. Wayne is the executive sponsor of the company’s employee resource group for gay, lesbian, bisexual and transgender employees and their advocates, and is a member of the company’s corporate responsibility steering committee.
Benno DorerSenior Vice President – Cleaning Division & Canada
Benno Dorer is responsible for the U.S. Laundry, Home Care and Brita® businesses, as well as the company’s Canada business. Benno joined Clorox in 2005, following 14 years with Procter & Gamble. He serves on the board of directors of the American Cleaning Institute, as well as the Chabot Space & Science Center Foundation in Oakland, Calif. Benno is the executive sponsor of the company’s Latino employee resource group and a member of the company’s corporate responsibility steering committee.
Executive Committee
Clorox maintains rigorous corporate governance practices and internal controls, with oversight by our board of directors, chairman and chief executive officer, general counsel, chief financial officer and the other members of our executive committee.
Our board of directors is composed of individuals who have broad-based business skills and experience in relevant areas critical to our business, prominence and a well-regarded reputation in their professions, global business and social perspective, concern for the long-term interests of stockholders, and personal integrity.
Clorox’s highly experienced management team represents a diverse mix of backgrounds, just as our employees and consumers do. Our leaders demonstrate their commitment to our communities through their seats on various corporate and charitable boards, as well as other volunteer activities.
Governance and Leadership
From left to right: Don Knauss, Larry Peiros, Frank Tataseo, T0m Britanik
The Clorox Company | 11
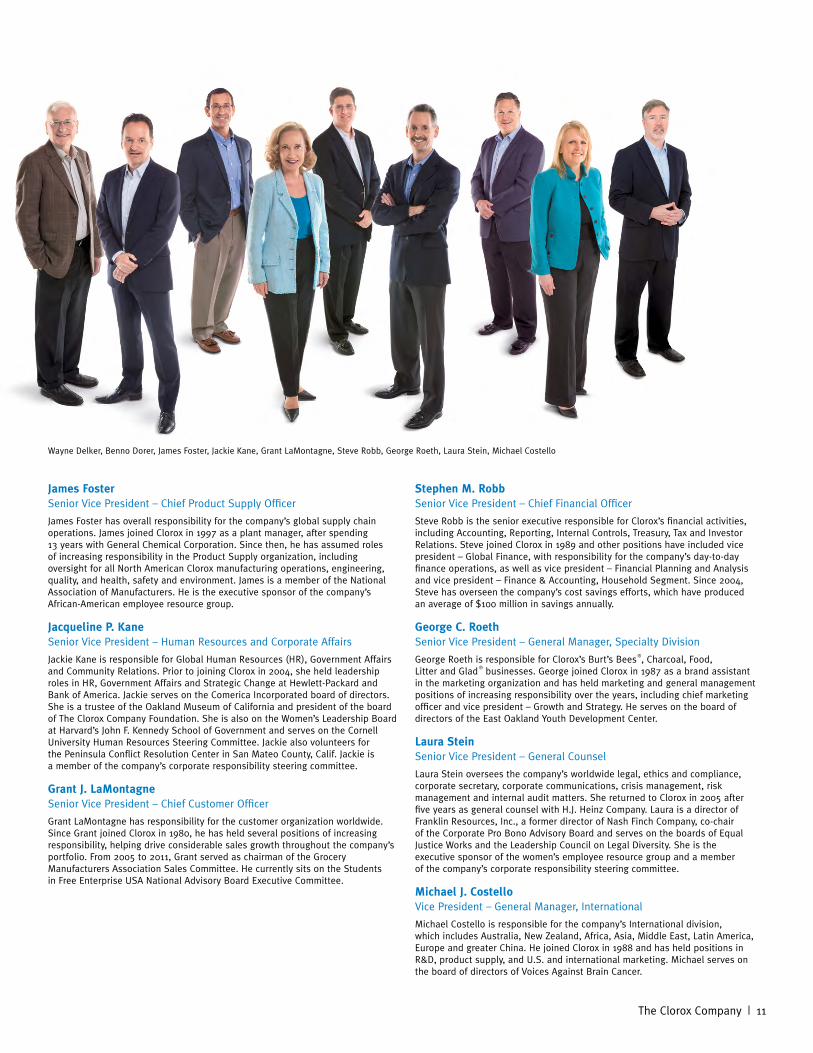
James FosterSenior Vice President – Chief Product Supply Officer
James Foster has overall responsibility for the company’s global supply chain operations. James joined Clorox in 1997 as a plant manager, after spending 13 years with General Chemical Corporation. Since then, he has assumed roles of increasing responsibility in the Product Supply organization, including oversight for all North American Clorox manufacturing operations, engineering, quality, and health, safety and environment. James is a member of the National Association of Manufacturers. He is the executive sponsor of the company’s African-American employee resource group.
Jacqueline P. KaneSenior Vice President – Human Resources and Corporate Affairs
Jackie Kane is responsible for Global Human Resources (HR), Government Affairs and Community Relations. Prior to joining Clorox in 2004, she held leadership roles in HR, Government Affairs and Strategic Change at Hewlett-Packard and Bank of America. Jackie serves on the Comerica Incorporated board of directors. She is a trustee of the Oakland Museum of California and president of the board of The Clorox Company Foundation. She is also on the Women’s Leadership Board at Harvard’s John F. Kennedy School of Government and serves on the Cornell University Human Resources Steering Committee. Jackie also volunteers for the Peninsula Conflict Resolution Center in San Mateo County, Calif. Jackie is a member of the company’s corporate responsibility steering committee.
Grant J. LaMontagneSenior Vice President – Chief Customer Officer
Grant LaMontagne has responsibility for the customer organization worldwide. Since Grant joined Clorox in 1980, he has held several positions of increasing responsibility, helping drive considerable sales growth throughout the company’s portfolio. From 2005 to 2011, Grant served as chairman of the Grocery Manufacturers Association Sales Committee. He currently sits on the Students in Free Enterprise USA National Advisory Board Executive Committee.
Stephen M. RobbSenior Vice President – Chief Financial Officer
Steve Robb is the senior executive responsible for Clorox’s financial activities, including Accounting, Reporting, Internal Controls, Treasury, Tax and Investor Relations. Steve joined Clorox in 1989 and other positions have included vice president – Global Finance, with responsibility for the company’s day-to-day finance operations, as well as vice president – Financial Planning and Analysis and vice president – Finance & Accounting, Household Segment. Since 2004, Steve has overseen the company’s cost savings efforts, which have produced an average of $100 million in savings annually.
George C. RoethSenior Vice President – General Manager, Specialty Division
George Roeth is responsible for Clorox’s Burt’s Bees®, Charcoal, Food, Litter and Glad ® businesses. George joined Clorox in 1987 as a brand assistant in the marketing organization and has held marketing and general management positions of increasing responsibility over the years, including chief marketing officer and vice president – Growth and Strategy. He serves on the board of directors of the East Oakland Youth Development Center.
Laura SteinSenior Vice President – General Counsel
Laura Stein oversees the company’s worldwide legal, ethics and compliance, corporate secretary, corporate communications, crisis management, risk management and internal audit matters. She returned to Clorox in 2005 after five years as general counsel with H.J. Heinz Company. Laura is a director of Franklin Resources, Inc., a former director of Nash Finch Company, co-chair of the Corporate Pro Bono Advisory Board and serves on the boards of Equal Justice Works and the Leadership Council on Legal Diversity. She is the executive sponsor of the women’s employee resource group and a member of the company’s corporate responsibility steering committee.
Michael J. CostelloVice President – General Manager, International
Michael Costello is responsible for the company’s International division, which includes Australia, New Zealand, Africa, Asia, Middle East, Latin America, Europe and greater China. He joined Clorox in 1988 and has held positions in R&D, product supply, and U.S. and international marketing. Michael serves on the board of directors of Voices Against Brain Cancer.
Wayne Delker, Benno Dorer, James Foster, Jackie Kane, Grant LaMontagne, Steve Robb, George Roeth, Laura Stein, Michael Costello
12 | 2012 Executive Summary
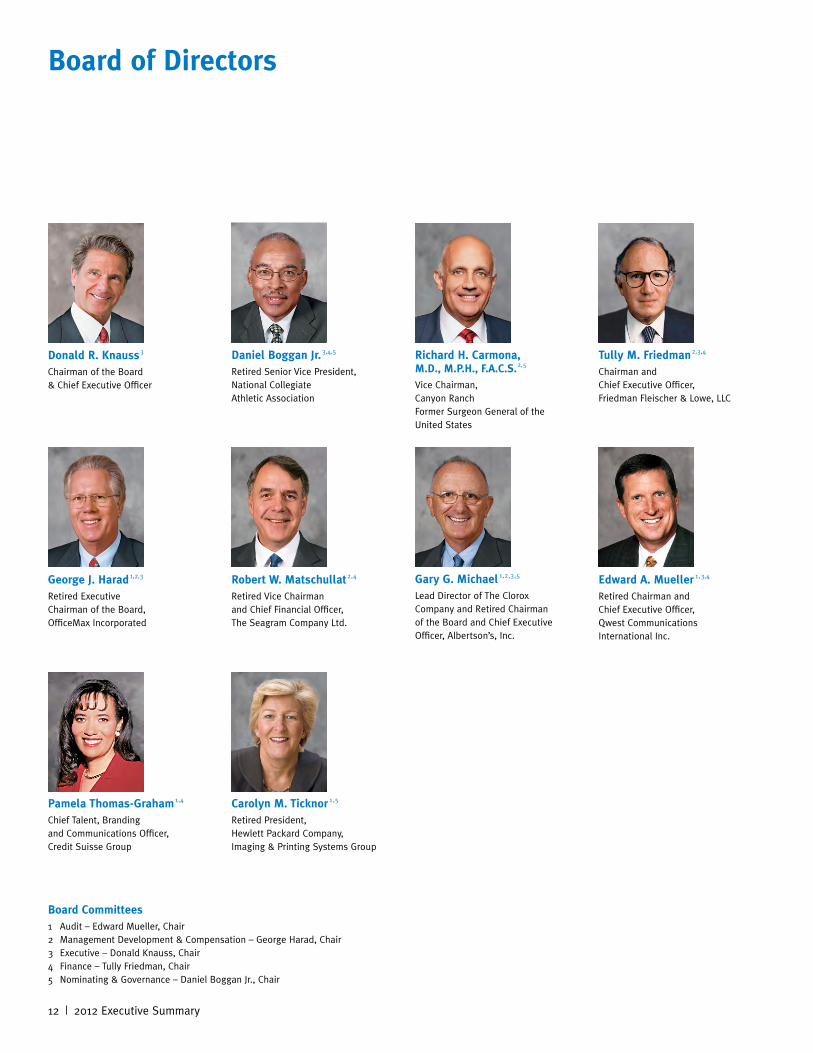
Board of Directors
Board Committees1 Audit – Edward Mueller, Chair2 Management Development & Compensation – George Harad, Chair3 Executive – Donald Knauss, Chair4 Finance – Tully Friedman, Chair5 Nominating & Governance – Daniel Boggan Jr., Chair
Donald R. Knauss3
Chairman of the Board & Chief Executive Officer
Tully M. Friedman2,3,4
Chairman and Chief Executive Officer, Friedman Fleischer & Lowe, LLC
Gary G. Michael 1,2,3,5
Lead Director of The Clorox Company and Retired Chairman of the Board and Chief Executive Officer, Albertson’s, Inc.
Pamela Thomas-Graham 1,4
Chief Talent, Branding and Communications Officer, Credit Suisse Group
Daniel Boggan Jr.3,4,5
Retired Senior Vice President, National Collegiate Athletic Association
George J. Harad 1,2,3
Retired Executive Chairman of the Board, OfficeMax Incorporated
Edward A. Mueller 1,3,4
Retired Chairman and Chief Executive Officer, Qwest Communications International Inc.
Carolyn M. Ticknor 1,5
Retired President, Hewlett Packard Company, Imaging & Printing Systems Group
Richard H. Carmona, M.D., M.P.H., F.A.C.S.2,5
Vice Chairman, Canyon Ranch Former Surgeon General of the United States
Robert W. Matschullat2,4
Retired Vice Chairman and Chief Financial Officer, The Seagram Company Ltd.
The Clorox Company | 13
Stock Listing and Number of Record Holders
The Clorox Company’s common stock is listed on the New York Stock Exchange, identified by the symbol CLX. As of July 31, 2012, the number of record holders of Clorox’s common stock was 12,566.
Transfer Agent, Registrar and Dividend Disbursing Agent
Inquiries relating to stockholder records, change of ownership, change of address and the dividend reinvestment/direct stock purchase plan should be sent to:
ComputershareP.O. Box 43078Providence, RI 02940-3078800-756-8200 or 781-575-2726TDD 800-952-9245 or 312-588-4110 for hearing impairedcomputershare.com/investor
Stockholder Information Service
Stockholders can call Clorox Stockholder Direct at 888-CLX-NYSE (259-6973) toll-free 24 hours a day to hear news and messages about Clorox, request company materials or get a 20-minute-delayed stock quote. The latest company news is also available at TheCloroxCompany.com.
Dividend Reinvestment/Direct Stock Purchase Plan
Clorox has authorized Computershare to offer a dividend reinvestment/direct stock purchase plan. Registered stockholders can purchase additional shares. Nonstockholders may join the plan with an initial investment, lump sum or bank debit. Most fees are paid by Clorox. For more information or plan materials, call 888-CLX-NYSE (259-6973) or contact Computershare (see above).
Management Report on Internal Control Over Financial Reporting
Clorox management, under the supervision and with the participation of the chief executive officer and the chief financial officer, has assessed the effectiveness of the company’s internal control over financial reporting as of June 30, 2012, and concluded that it is effective. For more information, see Item 9.A. of the company’s annual report on Form 10-K for the fiscal year ended June 30, 2012.
2012 Financial Information
Full financial statements for The Clorox Company are provided in the company’s 2012 proxy statement. Detailed financial information is available without charge through the following sources: The company’s proxy statement is available at TheCloroxCompany.com. The company’s annual report on Form 10-K for the fiscal year ended June 30, 2012, is available at TheCloroxCompany.com and through the SEC’s EDGAR database. Printed copies are available by calling 888-CLX-NYSE (259-6973).
Forward-Looking Statements
Except for historical information, matters discussed in the executive summary annual report are forward-looking statements and are based on management’s estimates, assumptions and projections. Actual results could vary materially. Please review the “Risk Factors” and “Management’s Discussion and Analysis of Financial Condition and Results of Operations” sections in the company’s annual report on Form 10-K for the fiscal year ended June 30, 2012, and subsequent SEC filings, for factors that could affect the company’s performance and cause results to differ materially from management’s expectations. The information in the Form 10-K report reflected management’s estimates, assumptions and projections as of August 24, 2012. Clorox has not made updates since then and makes no representation, express or implied, that the information is still current or complete. The company is under no obligation to update any part of this document.
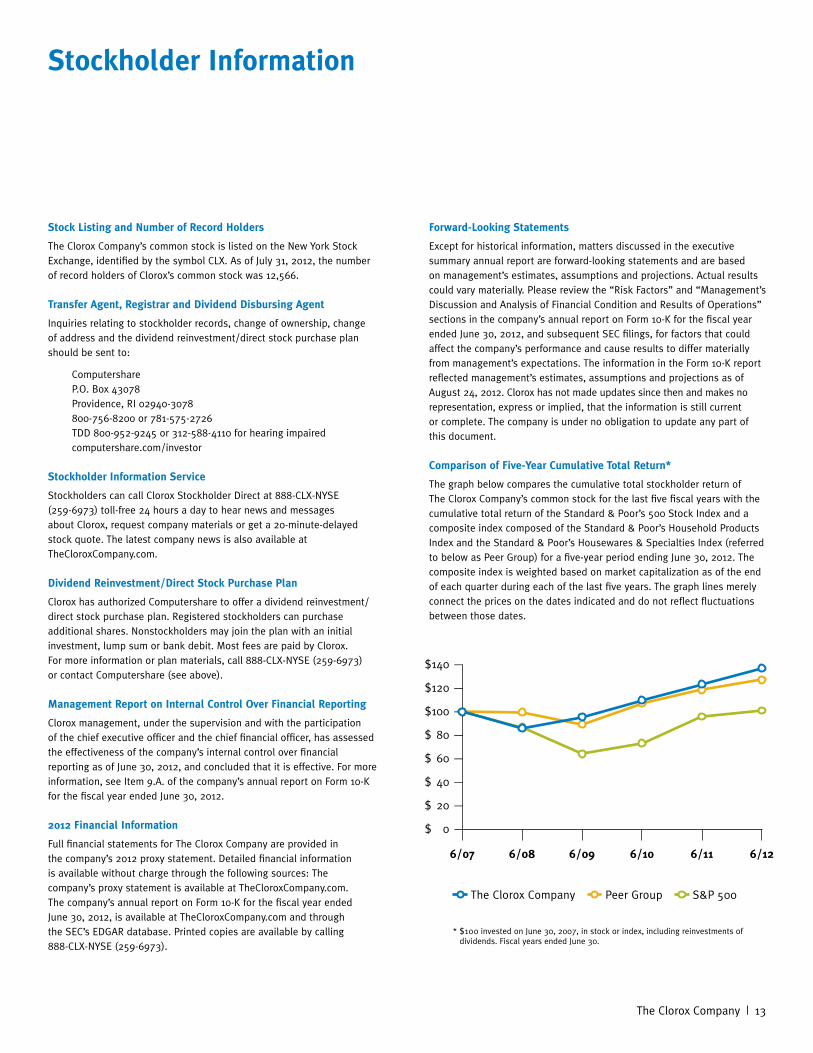
Comparison of Five-Year Cumulative Total Return*
The graph below compares the cumulative total stockholder return of The Clorox Company’s common stock for the last five fiscal years with the cumulative total return of the Standard & Poor’s 500 Stock Index and a composite index composed of the Standard & Poor’s Household Products Index and the Standard & Poor’s Housewares & Specialties Index (referred to below as Peer Group) for a five-year period ending June 30, 2012. The composite index is weighted based on market capitalization as of the end of each quarter during each of the last five years. The graph lines merely connect the prices on the dates indicated and do not reflect fluctuations between those dates.
Stockholder Information
The Clorox Company Peer Group S&P 500
* $100 invested on June 30, 2007, in stock or index, including reinvestments of dividends. Fiscal years ended June 30.
$140 —
6/07 6/08 6/09 6/10 6/11 6/12
$120 —
$100 —
$ 80 —
$ 60 —
$ 40 —
$ 20 —
$ 0
The Clorox Company1221 BroadwayOakland, CA 94612
TheCloroxCompany.com
2012 Annual Report:annualreport. thecloroxcompany.com
Printing this book on paper made with post-consumer recycled fiber saves*
Produced with the highest regard for the planet and its ecosystems, this report is the result of an extensive, collaborative effort of Clorox and its supply chain partners. Exceptional care was taken to utilize environmentally sustainable materials and responsible manufacturing processes to ensure a minimized environmental impact. This report was printed at Cenveo ColorGraphics using renewable resources and low-impact manufacturing principles. These practices include lean manufacturing, green chemistry principles, the recycling of residual materials, and the use of UV inks and coatings, which do not release any VOCs (volatile organic compounds) into the atmosphere. Carbon offsets matching the carbon signature of the paper, as well as the printing process, were purchased rendering this report carbon-neutral.
Trees 101 trees
Water 43,064 gallons
Energy 71,808,000 BTUs
Greenhouse Gases 9,382 pounds
Solid Waste 4,765 pounds
* Environmental impact savings results were derived from the Mohawk Environmental Calculator and are based on information from the Environmental Paper Network, as well as research done by the Paper Task Force. FSC® is not responsible for any calculations on saving resources by choosing this paper.
E Printed on Mohawk Via Paper, which is certified by the Forest Stewardship Council™ (FSC) and GreenSeal.org, is acid-free, contains 100% post-consumer fiber and is made with 100% renewable energy.