Embed Size (px)
Citation preview

Institut für Forschung in der Operativen Medizin (IFOM)
Endbericht:
„Systematische Auswertung des aktuellen Forschungsstands zum Kaiserschnitt“
Los 2: Zeitpunkt des geplanten Kaiserschnitts
IFOM - Institut für Forschung in der Operativen Med izin (Universität Witten / Herdecke)
Barbara Prediger, Stephanie Polus, Tim Mathes, Moni ka Becker, Nadja Könsgen, Dominique Rodil dos Anjos, Pauline Klassen , Stefanie Bühn,
Dawid Pieper
Datum: 26.08.16 Kontakt: Dr. Dawid Pieper IFOM - Institut für Forschung in der Operativen Medizin Kommissarischer Leiter: Univ.-Prof. Dr. Rolf Lefering Lehrstuhl für Chirurgische Forschung Fakultät für Gesundheit, Department für Humanmedizin Universität Witten/Herdecke Ostmerheimer Str. 200, Haus 38 51109 Köln
Tel.: 0221 98957-40 Fax: 0221 98957-30

2
Inhalt
Abbildungsverzeichnis ......................................................................................................................... 3
Tabellenverzeichnis .............................................................................................................................. 4
Abkürzungsverzeichnis ........................................................................................................................ 5
1. Fragestellung ............................................................................................................................... 6
2. Methoden ...................................................................................................................................... 7
2.1. Review-Protokoll ..................................................................................................................... 7
2.2. Einschlusskriterien ................................................................................................................ 7
2.3. Datenquellen und Suchstrategie ...................................................................................... 10
2.4. Studienselektion ................................................................................................................... 14
2.5. Datenextraktion ..................................................................................................................... 15
2.6. Risk of bias assessment ..................................................................................................... 15
2.7. Datensynthese ....................................................................................................................... 16
3. Ergebnisse der Literaturrecherche ...................................................................................... 17
4. Studienergebnisse ................................................................................................................... 19
4.1. Risk of Bias Bewertung ...................................................................................................... 19
4.2. Subgruppenanalyse ............................................................................................................. 28
4.3. Patienten ................................................................................................................................. 28
4.4. Interventionen ....................................................................................................................... 29
4.5. Kontrollen ............................................................................................................................... 29
4.6. Outcomes ............................................................................................................................... 29
4.7. Datensynthese der Ergebnisse ......................................................................................... 35
5. Diskussion .................................................................................................................................. 58
6. Appendix ..................................................................................................................................... 61
Appendix A: Cochrane Risk of Bias Tool ........................................................................................ 61
Appendix B: Newcastle Ottawa Scale ............................................................................................. 62
Appendix C: GRADE, Assessing the quality of a body of evidence ........................................... 64
Appendix D: Studiencharakteristika der eingeschlossenen Studien .......................................... 65
Appendix E: Ergebnisse der Studien ............................................................................................. 132
Appendix F: Liste der ausgeschlossenen Volltexte ..................................................................... 161

3
Abbildungsverzeichnis
Abbildung 1: Flow-chart ..................................................................................................................... 17
Abbildung 2: Risk of Bias Assessment ............................................................................................ 19
Abbildung 3: GRADE Evidence Profile, Hauptvergleich ............................................................... 36
Abbildung 4: GRADE Evidence Profile, Hauptvergleich RCT ..................................................... 48
Abbildung 5: Frühvergleich ............................................................................................................... 51
Abbildung 6: Zwillingsvergleich ........................................................................................................ 54

4
Tabellenverzeichnis
Tabelle 1: Einschlusskriterien ............................................................................................................. 9
Tabelle 2: Recherchestrategien Primärstudien .............................................................................. 11
Tabelle 3: Recherchestrategien Systematic Reviews ................................................................... 13
Tabelle 4: Recherchestrategien Studienregister ............................................................................ 14
Tabelle 5: Qualitätsbewertung der Kohortenstudien mit Newcastle Ottawa Scale .................. 20
Tabelle 6: Studiencharakteristika ..................................................................................................... 25
Tabelle 7: Vergleichsgruppen ........................................................................................................... 28
Tabelle 8: Respiratory Morbidity ....................................................................................................... 30
Tabelle 9: Maternal composite adverse events ............................................................................. 33

5
Abkürzungsverzeichnis
AWMF Arbeitsgemeinschaft der Wissenschaftlichen Medizinischen Fachgesellschaften
ÄZQ Ärztliches Zentrum für Qualität in der Medizin
CDSR Cochrane Database of Systematic Reviews
CPAP Continuous positive airway pressure
CS Caesarean Section
DARE Database of Abstracts of Reviews of Effects
DRKS Deutsches Register Klinischer Studien
GIN Guideline International Network
GRADE Grades of Recommendation, Assessment, Development, and Evaluation
HTA Health Technology Database
KI Konfidenzintervall
NGC National Guideline Clearinghouse
NICE National Institute for Health and Care Excellence
NICU Neonatal Intensive Care Unit
PICOS Patienten, Interventionen, Kontrollen, Endpunkte, Studientypen
PPHN persistent pulmonary hypertension of the newborn
RCOG Royal College of Obstetricians and Gynecologists
RCT Randomized Controlled Trial
RDS Respiratory Distress Syndrome
RR Relatives Risiko
SoF Summary of Findings
SSW Schwangerschaftswoche
TTN Transient Tachypnea of the newborn
WHO World Health Organization

6
1. Fragestellung
Für Los 2: Zeitpunkt des geplanten Kaiserschnitt wurde folgende Fragestellung definiert:
Welchen Einfluss hat der Zeitpunkt des elektiven Kaiserschnitts außerhalb der Frühgeburtlichkeit (37 + 0 Schwangerschaftswoche (SSW)) auf die maternale und neonatale Gesundheit

7
2. Methoden
2.1. Review-Protokoll
Für die Erstellung dieses Systematic Reviews wurde vorab ein Protokoll erstellt, das die methodische Vorgehensweise darlegt und mit den Kriterien der PRISMA Gruppe übereinstimmt.[1] Das Protokoll wurde nach Fertigstellung der Koordinierungsstelle „Kaiserschnittforschung“ (ansässig Universitätsklinikum Frankfurt, Prof. Louwen) zur Kommentierung freigegeben. Hinsichtlich der sekundären Outcomes ergaben sich während des Volltextscreening Ergänzungen, die nach Rücksprache mit der Koordinierungsstelle zu Änderungen des Protokolls führten. Zusätzlich als Endpunkt aufgenommen wurden: neonatale Mortalität, neonatales respiratorisches Distresssyndrom, neonatale vorübergehende Tachypnoe, neonataler Pneumothorax, neonatale Wiederbelebung, neonatale Sepsis, neonatale Hyperbilirubinämie bedarf Phototherapie, maternale Mortalität, maternale Hysterektomie und maternale Blutungen, einer die Transfusion/Behandlung bedürfen. Spezifiziert wurden Verweildauer auf der neonatalen Intensivstation ≥2 Tage, Hospitalisierung ≥5 Tage, Geburtsgewicht ≤2500g, Apgar-Score ≤6 und ≤3. Gestrichen wurden dafür Depression, depressive Symptome, Beatmung, CPAP-Beatmung und Antibiotikagabe.
2.2. Einschlusskriterien
Folgende Einschlusskriterien für Patienten, Intervention, Kontrollgruppe, Endpunkt und Studientyp (PICOS-Schema) wurden formuliert:
Population:
Eingeschlossene Patientinnen mussten Frauen mit elektivem Kaiserschnitt außerhalb der Frühgeburtlichkeit (37+0 SSW) sein. Dies war unabhängig davon, ob es sich um die erste oder eine weitere Geburt handelte und unabhängig vom vorherigen Geburtsmodus. Außerdem bezog sich die Frage nur auf Populationen gemäß Weltgesundheitsorganisation (WHO) Stratum-A. Dies sind Staaten mit sehr niedriger Kindersterblichkeit und Gesamtsterblichkeit, vorwiegend Staaten in Westeuropa, Nordamerika und Westpazifik.[2]
Intervention:
Die Intervention war die Durchführung des elektiven Kaiserschnitts in der 37 + 0 bis 38 +6 SSW
Kontrolle:
In der Kontrollgruppe sollte der Kaiserschnitt erst ab der 39 + 0 SSW stattfinden.
Outcomes:
Hatte die Intervention einen Einfluss auf:
Primäres Outcome:

8
• Einweisung auf die neonatale Intensivstation (neonatal intensive care unit (NICU)) aber auch neonatal critical care unit
Sekundäre Outcomes:
• NICU Verweildauer ≥2 Tage
• Neonatale Hospitalisierung ≥5 Tage
• Neonatale respiratorische Morbidität (gemäß Studienprotokoll)
• Neonatales respiratorisches Distresssyndrom (RDS)
• Neonatale vorübergehende Tachypnoe (TTN)
• Neonataler Pneumothorax
• Neonatale Wiederbelebung (gemäß Studienprotokoll)
• Neonatale Sepsis
• Neonatale Hypoglykämie
• Neonataler Apgar Score ≤3
• Neonataler Apgar Score ≤6
• Neonatale Hyperbilirubinämie (bedarf Phototherapie)
• Neonatales Geburtsgewicht ≤2500g
• Neonataler Tod
• Maternaler Tod
• Maternale Hysterektomie
• Maternale Blutung (bedarf Transfusion/Behandlung)
• Maternale unerwünschte Ereignisse (gemäß Studienprotokoll)
Studientyp:
Im Review sollten randomisierte-kontrollierte Studien (RCT), quasi randomisierte-kontrollierte Studien und Kohortenstudien untersucht werden. RCTs sollen Bias durch zufällige und damit gleichmäßige Verteilung von Risiken verringern. Bei Quasi-RCT ist zwar eine Randomisierung erwünscht, jedoch verfehlt die Art der Randomisierung das Prinzip der Randomisierung, z.B. eine Randomisierung nach dem Tag der Aufnahme im Krankenhaus entspricht nicht dem Zufallsprinzip.[3, 4] Kohortenstudien sind Beobachtungsstudien, die eine Kohorte mit der Intervention mit einer Kontrollgruppe vergleichen, jedoch teilen sich die Personen den Gruppen de facto selbst zu.[5]
Die Einschlusskriterien für die Fragestellung sind in Tabelle 1 zusammengefasst.

9
Tabelle 1: Einschlusskriterien
Population Intervention Kontrolle Outcome Studientyp
Zeitpunkt des Kaiserschnittes
Frauen mit elektiven Kaiserschnitt außerhalb der Frühgeburtlichkeit (37+0 SSW) (unabhängig davon, ob es sich um die erste oder eine weitere Geburt handelt und unabhängig vom vorherigen Geburtsmodus)
Elektiver Kaiserschnitt in der 37+0 bis 38+6 SSW
Elektiver Kaiserschnitt ab der 39+0 SSW
Primäres Outcome: • Einweisung auf die NICU
Sekundäre Outcomes: • NICU Verweildauer ≥2 Tage • Neonatale Hospitalisierung ≥5 Tage • Neonatale respiratorische Morbidität
(gemäß Studienprotokoll) • Neonatales RDS • TTN • Neonataler Pneumothorax • Neonatale Wiederbelebung (gemäß
Studienprotokoll) • Neonatale Sepsis • Neonatale Hypoglykämie • Neonataler Apgar Score ≤3 • Neonataler Apgar Score ≤6 • Neonatale Krampfanfälle • Neonatale Hyperbilirubinämie bedarf
Phototherapie • Neonatales Geburtsgewicht ≤2500g • Neonataler Tod • Maternaler Tod • Maternale Hysterektomie • Maternale Blutung bedarf
Transfusion/Behandlung • Maternale unerwünschte Ereignisse
• RCT • Quasi-RCT • Kohortenstudien
NICU: Neiónatal Intensive Care Unit; RCT: randomized controlled trial; RDS: Respiratory distress syndrome; SSW: Schwangerschaftswoche; TTN: Transient tachypnea of the newborn

10
2.3. Datenquellen und Suchstrategie
Es wurde im Mai 2016 eine systematische Recherche in MEDLINE, EMBASE, CENTRAL, CINAHL und Psycinfo durchgeführt. Zur Identifikation von systematischen Reviews wurden über den Zugang der Cochrane Library die Datenbanken Cochrane Database of Systematic Reviews (CDSR), Database of Abstracts of Reviews of Effects (DARE) und die Health Technology Database (HTA) recherchiert.
Die Suchstrategien wurden zunächst für eine Datenbank entwickelt und dann an jeweils andere Datenbanken und Suchoberflächen angepasst. Eine andere Person überprüfte mit Hilfe der PRESS Checkliste zur Überprüfung von elektronischen Suchstrategien die so entwickelte Recherche und passte sie gegebenenfalls an.[6] Tabelle 2 enthält die Suchstrategien bezüglich der Primärstudien. Tabelle 3 zeigt die Suchstrategie für CDSR, DARE, HTA und CENTRAL via CochraneLibrary.
Zur Identifikation von Leitlinien wurden die Datenbanken der Arbeitsgemeinschaft der Wissenschaftlichen Medizinischen Fachgesellschaften AWMF, Ärztliches Zentrum für Qualität in der Medizin (ÄZQ), Guideline International Network (GIN), National Guideline Clearinghouse (NGC) sowie die Homepages der folgenden Fachgesellschaften recherchiert:
• Schweizerische Gesellschaft für Gynäkologie und Geburtshilfe
• Society of Obstetricians and Gynaecologists of Canada
• The Royal College of Obstetricians and Gynaecologists
• Österreichischen Gesellschaft für Gynäkologie und Geburtshilfe
Zur Identifikation weiterer relevanter Literatur wurden die Referenzen der systematischen Reviews, Leitlinien und der eingeschlossenen Studien zu verwandten Fragestellungen geprüft.
Zusätzlich wurden auch die Studienregister ClinicalTrials (www.clinicaltrials.gov), Deutsches Register Klinischer Studien (DRKS) (www.drks.de) sowie EU Clinical Trials Register (https://www.clinicaltrialsregister.eu/) recherchiert. Tabelle 4 enthält die Suchstrategie der Studienregister.
Die Recherchen erfolgten ohne zeitliche und sprachliche Einschränkung. Lediglich die Leitlinienrecherche war auf Veröffentlichungen ab Juni 2011 beschränkt.

11
Tabelle 2: Recherchestrategien Primärstudien
Datenbank (Recherchedatum)
Suchstrategie
MEDLINE (23.05.2016) (neonatal[tiab] OR neo-natal[tiab] OR maternal[tiab] OR Perinatal[tiab] OR peri-natal[tiab] OR "Perinatal Care"[Mesh] OR “intensive care”[tiab] OR "Intensive Care Units"[Mesh] OR depressi*[tiab] OR "Depression, Postpartum"[Mesh] OR oxygen[tiab] OR bleeding[tiab] OR Apgar[tiab] OR hypoglycemia[tiab] OR "Hypoglycemia"[Mesh] OR hyperbilirubinemia[tiab] OR "Hyperbilirubinemia, Neonatal"[Mesh] OR “birth weight”[tiab] OR "Birth Weight"[Mesh] OR antibiotic*[tiab] OR respirator*[tiab] OR CPAP[tiab] OR "Continuous Positive Airway Pressure"[Mesh])
AND
(Cesarean[tiab] OR Caesarean[tiab] OR Cesarian[tiab] OR Caesarian[tiab] OR "Cesarean Section"[Mesh] OR C-Section[tiab] OR “C Section”[tiab] OR “C Sections”[tiab])
AND
(Timing[tiab] OR late[tiab] OR prior[tiab] OR delayed[tiab] OR time[tiab] OR week*[tiab])
AND
Elective[tiab]
EMBASE (25.05.2016) ('newborn intensive care'/de OR 'intensive care'/de OR 'intensive care unit'/de OR 'perinatal period'/de OR 'depression'/de OR 'oxygen'/de OR 'bleeding'/de OR 'Apgar score'/de OR 'hypoglycemia'/de OR 'hyperbilirubinemia'/de OR 'birth weight'/de OR neonatal:ti,ab OR neo-natal:ti,ab OR maternal:ti,ab OR perinatal:ti,ab OR peri-natal:ti,ab OR "intensive care":ti,ab OR depressi*:ti,ab OR oxygen:ti,ab OR bleeding:ti,ab OR apgar:ti,ab OR hypoglycemi*:ti,ab OR hyperbilirubinemia:ti,ab OR "birth weight":ti,ab OR antibiotic*:ti,ab OR respirator:ti,ab OR Cpap:ti,ab OR "Continuous Positive Airway Pressure":ti,ab)
AND
('cesarean section'/de OR cesarean:ab,ti OR caesarean:ab,ti OR cesarian:ab,ti OR caesarian:ab,ti OR 'c section':ab,ti OR 'c-sections':ab,ti)
AND
('time'/de OR timing:ab,ti OR late:ab,ti OR prior:ab,ti OR delayed:ab,ti OR time:ab,ti OR week*:ab,ti)
AND
(elective:ab,ti)

12
AND
Human/de
Limited on EMBASE and Articles, Articles + press, Reviews
CINAHL (23.05.2016) MW "Perinatal Care" OR MW "Intensive Care Units, Neonatal" OR MW "Intensive Care, Neonatal" OR MW "Intensive Care Units" OR (TI neonatal OR TI neo-natal OR TI maternal OR TI perinatal OR TI peri-natal OR TI "Intensive Care" OR TI "Intensive Care Units") OR (AB neonatal OR AB neo-natal OR AB maternal OR AB perinatal OR AB peri-natal OR AB "Intensive Care" OR AB "Intensive Care Units") OR MW "Depression Postpartum" OR MW "APGAR Score" OR MW Oxygen OR MW "Postpartum Hemorrhage" OR MW Hypoglycemia OR MW Hyperbilirubinemia OR MW "Hyperbilirubinemia, Neonatal" OR MW "Birth Weight" OR MW Antibiotics OR MW "Continuous Positive Airway Pressure" OR (TI depressi* OR TI oxygen OR TI bleeding OR TI Apgar OR TI hypoglycemi* OR TI hyperbilirubinemia OR TI "Birth Weight" OR TI antibiotic* OR TI respirator* OR TI cpap) OR (AB depressi* OR AB oxygen OR AB bleeding OR AB Apgar OR AB hypoglycemi* OR AB hyperbilirubinemia OR AB "Birth Weight" OR AB antibiotic* OR AB respirator* OR AB cpap)
AND
MW "Cesarean Section" OR MW "Cesarean Section, Elective" OR (TI Cesarean OR TI Caesarean OR TI Cesarian OR TI Caesarian OR TI C-Section OR TI "C Section") OR (AB Cesarean OR AB Caesarean OR AB Cesarian OR AB Caesarian OR AB C-Section OR AB "C Section")
AND
MW Time OR (TI time OR TI timing OR TI late OR TI prior OR TI delayed OR TI week) OR (AB time OR AB timing OR AB late OR AB prior OR AB delayed OR AB week)
AND
Elective
PsycInfo (24.05.2016) SU ("Neonatal Period" OR "Perinatal Period" OR "Neonatal Intensive Care" OR "Intensive Care") OR TI(neonatal OR neo-natal OR maternal OR perinatal OR peri-natal OR "Intensive Care") OR AB(neonatal OR neo-natal OR maternal OR perinatal OR peri-natal OR "Intensive Care") OR SU("Major Depression" OR "Postpartum Depression" OR "Oxygen" OR "Hemorrhage" OR "Hypoglycemia" OR "Birth Weight" OR antibiotics) OR TI(Depressi* OR oxygen OR bleeding OR apgar OR hypoglycemi* OR hyperbilirubinemia OR "birth weight" OR antibiotic* OR respirator* OR cpap OR "Continuous Positive Airway Pressure") OR AB(Depressi* OR oxygen OR bleeding OR apgar OR hypoglycemi* OR hyperbilirubinemia OR "birth

13
weight" OR antibiotic* OR respirator* OR cpap OR "Continuous Positive Airway Pressure")
AND
SU("Caesarean Birth") OR TI(cesarean OR caesaren OR cesarian OR caesarian OR C-section OR "C Section" OR "C Sections") OR AB(cesarean OR caesaren OR cesarian OR caesarian OR C-section OR "C Section" OR "C Sections")
AND
SU(time) OR TI(timing OR late OR prior OR delayed OR time OR week) OR AB(timing OR late OR prior OR delayed OR time OR week)
AND
TX elective
CENTRAL (23.05.2016) Siehe Recherchestrategien Systematic Reviews CDSR
Tabelle 3: Recherchestrategien Systematic Reviews
Datenbank (Recherchedatum)
Suchstrategie
Frage 1
CDSR, DARE, HTA, CENTRAL (23.05.2016)
#1 MeSH descriptor: [Perinatal Care] explode all trees 491
#2 MeSH descriptor: [Critical Care] explode all trees 2044
#3 MeSH descriptor: [Intensive Care Units] explode all trees 3056
#4 MeSH descriptor: [Depression, Postpartum] explode all trees 356
#5 MeSH descriptor: [Hypoglycemia] explode all trees 1390
#6 MeSH descriptor: [Hyperbilirubinemia] explode all trees 451
#7 MeSH descriptor: [Birth Weight] explode all trees 1262
#8 MeSH descriptor: [Continuous Positive Airway Pressure] explode all trees 822
#9 (neonatal or neo-natal or maternal or Perinatal or peri-natal or "intensive care" or depressi* or oxygen or bleeding or Apgar or hypoglycemia or hyperbilirubinemia or "birth weight" or "Birth Weight" or antibiotic* or respirator* or CPAP) 193467
#10 MeSH descriptor: [Cesarean Section] explode all trees

14
2674
#11 (Cesarean or Caesarean or Cesarian or Caesarian or C-Section or "C Section" or "C Sections") 7488
#12 MeSH descriptor: [Time] explode all trees 60403
#13 (Timing or late or prior or delayed or time or week*) 395145
#14 elective 16602
#15 #1 or #2 or #3 or #4 or #5 or #6 or #7 or #8 or #9 194320
#16 #10 or #11 7488
#17 #12 or #13 396806
#18 #15 and #16 and #17 and #14 792
Tabelle 4: Recherchestrategien Studienregister
Thema (Recherchedatum)
Suchstrategie
ClinicalTrials (20.06.2016) (cesarean OR caesarean OR sectio) AND (elective OR )
EU Clinical Trials (20.06.2016)
(cesarean OR caesarean OR sectio) AND (elective OR )
DRKS (20.06.2016) : (kaiserschnitt OR sectio OR caeserian OR cesarian) AND (elektiv* OR elective OR wunsch)
2.4. Studienselektion
Die identifizierten Treffer wurden in ein Literaturverwaltungsprogramm (EndNote) überführt und auf Duplikate überprüft. Die in den Datenbanken und über die Handrecherche identifizierte Literatur wurde von zwei Gutachtern unabhängig selektiert. Zunächst wurden die Abstracts sämtlicher in den Datenbanken erzielten Treffer auf Erfüllung der a-priori definierten Einschlusskriterien hin geprüft und anschließend, bei potentieller Relevanz, die Volltexte geprüft. Unstimmigkeiten wurden bis zum Konsens diskutiert.

15
2.5. Datenextraktion
Die gesamte Datenextraktion wurde von einem Gutachter vorgenommen und zur Verifizierung von einem zweiten Gutachter kontrolliert. Jegliche Differenz wurde bis zum Konsens diskutiert. Die nachfolgenden Daten wurden extrahiert:
• Studientyp
• Setting (Ort, Krankenhaus, etc)
• Rekrutierungszeitraum
• Teilnehmer (Ausschlusskriterien, Anzahl randomisiert/analysiert/Drop-out, Charakt-eristika)
• Intervention/Exposition
• Kontrolle
• Zielgröße
• Hauptergebnis
Für kontinuierliche Variablen wurde der Mittelwert bzw. die Mittelwertdifferenz mit Konfidenzintervallen angegeben. Für dichotome Variablen wurden nach Möglichkeit die relativen Effektmaße (Odds Ratio, Relatives Risiko, Hazard Ratio) mit Konfidenzintervallen angegeben. Die statistische Signifikanz wurde mit Konfidenzintervallen oder alternativ mit p-Werten angegeben. Die relativen Effektmaße wurden vereinheitlicht, sodass die Kontrollgruppe immer die Referenzkategorie darstellt (Nenner des Vergleichs). D.h. relative Effektmaße >1 für negative Endpunkte (z.B. Einweisung auf NICU) bedeuten, dass die Interventionsgruppe unterlegen ist (höhere Zahl der Einweisungen in der Interventionsgruppe). Umgekehrt gilt der Zusammenhang für Effektmaße <1. Die Ergebnisse wurden zu diesem Zweck ggf. umgepolt. Die Darstellung erfolgt soweit nicht anders angegeben, entsprechend der As-Treated-Population.
Um eine Meta-Analyse durchzuführen wurden die absoluten Zahlen der einzelnen Studien angegeben und gepoolt. Um Daten aller Studien für die Meta-Analyse zu erhalten, wurden die Autoren der Studien, die nur adjustierte Werte publizierten, nach rohen (nicht adjustierten) Werten kontaktiert.
2.6. Risk of bias assessment
Alle als relevant identifizierte Literatur wurde hinsichtlich ihres Verzerrungspotentials bewertet. Die Bewertung wurde jeweils durch zwei Gutachter unabhängig voneinander durchgeführt. Unstimmigkeiten wurden ausdiskutiert.
Die Bewertung der RCTs wurde anhand des Cochrane Risk of Bias Tool durchgeführt, siehe Appendix B. Hiermit werden Aspekte untersucht, die Hinweise auf das mögliche Vorliegen verschiedener Bias-Arten geben können. Folgende Kategorien wurden bewertet: Selection Bias, Performance Bias, Detection Bias, Attrition Bias, Reporting Bias, Other Bias. Dabei wurden Selection Bias, Reporting Bias und Other Bias für die gesamte Studie erhoben, während Performance Bias, Detection Bias und Attrition Bias für jeden Endpunkt einzeln bewertet wurden. Dies soll unterschiedliche Bewertungen ermöglichen, die z.B. durch

16
verschiedene Drop out Raten (Attrition Bias) bei unterschiedlichen Endpunkten nötig werden.[4] Die Bewertung der Kohortenstudien erfolgte mit der Newcastle-Ottawa Scale, siehe Appendix C. Hierbei werden die drei Kategorien Selection, Comparability und Outcome bewertet. Bei Erfüllung eines Kriteriums werden Sterne zugeteilt, insgesamt können neun Sterne erreicht werden. In der Kategorie Selection werden die Auswahl der Interventionsgruppe und die der Kontrollgruppe, die Messung der Exposition und die Auswahl des Outcomes mit maximal 4 Sternen bewertet. In der Kategorie Comparability wird gefragt, ob eine Adjustierung der Ergebnisse stattfindet und kann mit maximal zwei Sternen bewertet werden. Die Kategorie Outcome bewertet die Messung des Outcomes, die Länge des Follow-up und die Patientenzahl im Follow-up mit bis zu drei Punkten.[7]
2.7. Datensynthese
Der „Body of Evidence“ wurde mit "Grades of Recommendation, Assessment, Development, and Evaluation" (GRADE) bewertet. Im Rahmen der Leitlinienerstellung eignet sich GRADE besonders gut, da es basierend auf den GRADE Ergebnissen entsprechende Handlungsempfehlungen auf Basis der vorhandenen Evidenzlage aussprechen kann. Zur Bewertung werden zum einen der Studientyp und zum anderen Einschränkungen der Ergebnisse herangezogen. Dabei werten die Risk of Bias Bewertung, Inkonsistenzen und Ungenauigkeit der Ergebnisse, Indirekte Vergleiche und Publikationsbias die Ergebnisse um ein bis zwei Stufen ab. Allerdings können große Effekte, Dosis-Wirkungs-Beziehung und wenn Effekte durch andere Störvariablen und Bias beeinflusst werden könnten, die Ergebnisse um ein bis zwei Stufen aufwerten.[4]
Für das Management der Ergebnisse wurde der von der Cochrane Collaboration zur Verfügung gestellte Review Manager 5.3 verwendet. Die Software GRADEPro wurde verwendet, um die Summary of Findings (SoF) Tables zu erstellen, die sich aus GRADE heraus ergeben. Mit der Software Review Manager 5.3 wurde auch die Meta-Analyse berechnet. Berechnungen des relativen Risikos (RR) erfolgten mit dem Mantel-Haenszel Test mit unter Berücksichtigung von Random Effects. Der RR wurde immer mit dazugehörigen 95% Konfidenzinterval (KI) angegeben. Wenn möglich wurden die Ergebnisse aus mehr als einer Studie gepoolt. Wenn es nur eine einzige Studie gab, wurde für diese auch das RR mit zugehörogen KI berechnet. Forest- und Funnel Plots wurden mithilfe von Review Manager 5.3 erstellt.
17
3. Ergebnisse der Literaturrecherche
Im Rahmen der systematischen Recherche nach Primärstudien wurden in den Datenbanken Medline, EMBASE, CENTRAL, CINAHL und Psycinfo 2610 Treffer identifiziert, von denen 97 potentiell relevant erschienen und im Volltext überprüft wurden. Die Überprüfung der Volltexte resultierte in 28 Studien, die die Einschlusskriterien erfüllten und eingeschlossen wurden.
Im Rahmen der systematischen Recherche nach systematischen Übersichtsarbeiten konnten in den Datenbanken CDSR, DARE und HTA 288 Treffer identifiziert werden. Die Sichtung der Abstracts ergab, dass keiner die Einschlusskriterien erfüllte.
Die Recherche in Studienregistern ergab zwei Treffer, diese waren jedoch bereits bei der Suche der anderen Datenbanken identifiziert wurden, und wurden ausgeschlossen, da es sich somit um bereits publizierte und identifizierte Studien handelte.
Im Weiteren wurde ein Referenzcheck durchgeführt. Dies resultierte in zehn potentiell relevante Titel, von denen letztlich sechs in diese Arbeit eingeschlossen wurden.
Der Verlauf der Studienauswahl ist in Abbildung 1 dargestellt. Die Listen der ausgeschlossenen Volltexte sind in Appendix F aufgeführt.
Abbildung 1: Flow-chart
Zwei Publikationen von Zanardo et al. 2004 wurden zusammengefasst, da es sich um eine Studie handelte.[8, 9] Zwei weitere Publikationen (Chiossi et al. 2013 und Tita et al. 2009)
Treffer in den Datenbanken
(n = 2898)
Weitere Treffer ermittelt per
Handrecherche
(n = 10)
Geprüfte Treffer
(n = 2908)
Ausgeschlossene
Titel/Abstracts
(n = 2805)
Geprüfte Artikel als
Volltextversion
(n = 103)
Ausgeschlossene
Artikel
(n = 70)
Population: 18
Intervention: 12
Comparator: 2
Outcome: 4
Duplikat: 4
Kein Volltext vorhanden: 1
Studientyp: 29
Eingeschlossene Studien/Artikel
(n = 33)

18
befassten sich ebenfalls mit dem gleichen Datensatz und Fragestellung. Hier wählten wir Chiossi et al. 2013, die die leicht größere Studienpopulation hatten; Tita et al. 2009 wurde lediglich für die Outcomes genommen, die Chiossi et al. 2013 nicht evaluierte.[10-12] Auch Vilchez et al. 2014 und 2015 entsprachen einer Studie.
Die Leitlinienrecherche vom 17.05.2016 ergab zwei Leitlinien, die des National Institute for Health and Care Excellence (NICE) „Caesarean section” und die des Royal College of Obstetricians and Gynecologists (RCOG), die eine Empfehlung zu der Fragestellung abgeben.[13, 14] Beide Leitlinien empfehlen einen elektiven Kaiserschnitt nicht vor der 39+0 SSW durchzuführen, da es zu einem erhöhten Risiko für respiratorische Morbidität kommen kann. In der NICE Leitlinie heißt es zu der Empfehlung zu “Timing of planned Caesarean section (CS) - The risk of respiratory morbidity is increased in babies born by CS before labour, but this risk decreases significantly after 39 weeks. Therefore planned CS should not routinely be carried out before 39 weeks.”[13]. Bei RCOC heißt es “Elective repeat caesarean section (ERCS) - The risk of perinatal death with ERCS is extremely low, but there is a small increase in neonatal respiratory morbidity when ERCS is performed before 39+0 weeks of gestation. The risk of respiratory morbidity can be reduced with preoperative course of antenatal corticosteroids. […]ERCS delivery should be conducted after 39+0 weeks of gestation” [14]
Die zugrundeliegende Evidenz wurde jedoch bereits in der Literaturrecherche in den Datenbanken identifiziert oder erfüllte nicht die Einschlusskriterien.

19
4. Studienergebnisse
Im folgenden Abschnitt folgt eine kurze Darstellung der wichtigsten Ergebnisse. Ergänzt werden die Ergebnisse durch detaillierte Tabellen, die aus Review Manager 5.3 exportiert wurden.
Es wurden 33 Publikationen für die Beantwortung der Fragestellung in diesen Review eingeschlossen und ausgewertet. Dabei handelt es sich bei allen Studien um veröffentlichtes Material. Es wurde eine RCT (Glavind et al. 2013) und 33 Kohortenstudien eingeschlossen.[15] In Tabelle 5 sind die allgemeinen Charakteristika der eingeschlossenen Studien dargestellt. Acht Studien fanden in den USA statt, von denen bezogen sich allerdings zweimal zwei Studien auf dasselbe Register. Vier Studien kamen aus Japan, fünf aus den Niederlanden und die anderen Studien kamen jeweils aus weiteren europäischen Ländern und Australien. Die meisten Studien fanden in den Jahren 2000 bis 2011 statt.
4.1. Risk of Bias Bewertung
Mit dem Cochrane Risk of Bias Tool konnte nur eine Studie, die RCT von Glavind et al., bewertet werden.
Abbildung 2: Risk of Bias Assessment
Die Kohortenstudien wurden mit der Newcastle-Ottawa Scale bewertet (s. Tabelle 6)

20
Tabelle 5: Qualitätsbewertung der Kohortenstudien m it Newcastle Ottawa Scale
Study Selection Comparability Outcome
Representativeness of the exposed cohort
Selection of the non exposed cohort
Ascertainment of exposure
Demonstration that outcome of interest was not present at start of study
Comparability of cohorts on the basis of the design or analysis
Assessment of outcome
Was follow-up long enough for outcomes to occur
Adequacy of follow up of cohorts
Alderdice et al 2005
* * * *
NICU admissions, Respiratory morbidity
* * *
Bailit 2010 * * * * **
NICU admission, Apgar score <3 (asphyxia), sepsis
* * *
Balchin 2008 * * * * ** RDS, TTN
* * *
Chiossi et al 2013
* * * * **
NICU admissions, maternal outcomes
Neonatal outcomes (incl. respiratory morbidity)
* * *
Clark 2009 * * * * NICU admission
* * *

21
Doan et al 2014 * * * * *
NICU admissions, neonatal outcomes (incl. respiratory morbidity)
* * *
Farchi et al. 2010
* * * * ** Respiratory morbidity
* * *
Finn et al 2016 * * * * * *
NICU admissions, neonatal outcomes (incl. respiratory morbidity)
* * *
Gawlik et al 2015
* * * * **
NICU admissions, Apgar Score, birth weight
* * *
Graziosi et al 1998
* * *
Respiratory morbidity, phototherapy, NICU admission, incubator time
*
Hansen et al 2008
* * * * ** Respiratory morbidity
* * *
Many et al 2006 * * * ** Respiratory morbidity
* * *
Matsuo et al 2008
* * * * ** Neonatal outcomes (incl. respiratory morbidity), maternal complications

22
* * *
McAlister et al 2013
* * * * ** NICU admissions
* * *
Melamed 2013 * * * * **
NICU admission, respiratory morbidity, TTN, RDS, pneumothorax, 5-min Apgar <7, hypoglycemia, phototherapy
* * *
Morrison et al. 1995
* * * * **
NICU admissions with respiratory morbidity
* * *
Nakashima et al 2014
* * * * **
NICU admissions, neonatal outcomes ( incl. respiratory morbidity)
* * *
Nir et al. 2012 * * * * ** NICU admissions
* * *
Parikh 2014 * * *
NICU admission, neonatal mortality, >5 days nursery
* *
Resende et al. 2015
* * * * ** NICU admissions, neonatal outcomes ( incl. respiratory morbidity)

23
* * *
Terada 2014 * * * *
Oxygen supplementation, respiratory support
* * *
Tita 2009 * * * * **
RDS, NICU admission, hypoglycemia, ventilation, composite adverse event/death
* * *
Tracy 2007 * * * * * NICU admission
* * *
Vidic 2016 * * * * *
NICU admission, respiratory distress, APGAR, hypoglycemia
*
Vilchez 2015 * * * * **
Neonatal, infant, early
Mortality
* * *
Vilchez 2014 * * * * **
NICU admission, APGAR-score ≤6, surfactant use, antibiotics use, neonatal seizures

24
Wilmink 2010 * * * * **
NICU admission, respiratory diseases, neonatal adverse events
* * *
Wilmink 2012 * * * * ** NICU admission
* * *
Yamazaki 2003 * * * TTN, apnea, hypoglycemia
* * *
Zanardo 2004A&B
* * * *
Respiratory distress syndrome, transient tachypnea, PPV resuscitation
* * *
Zandaro 2007 * * * * Pneumothorax, respiratory morbidity
* * *

25
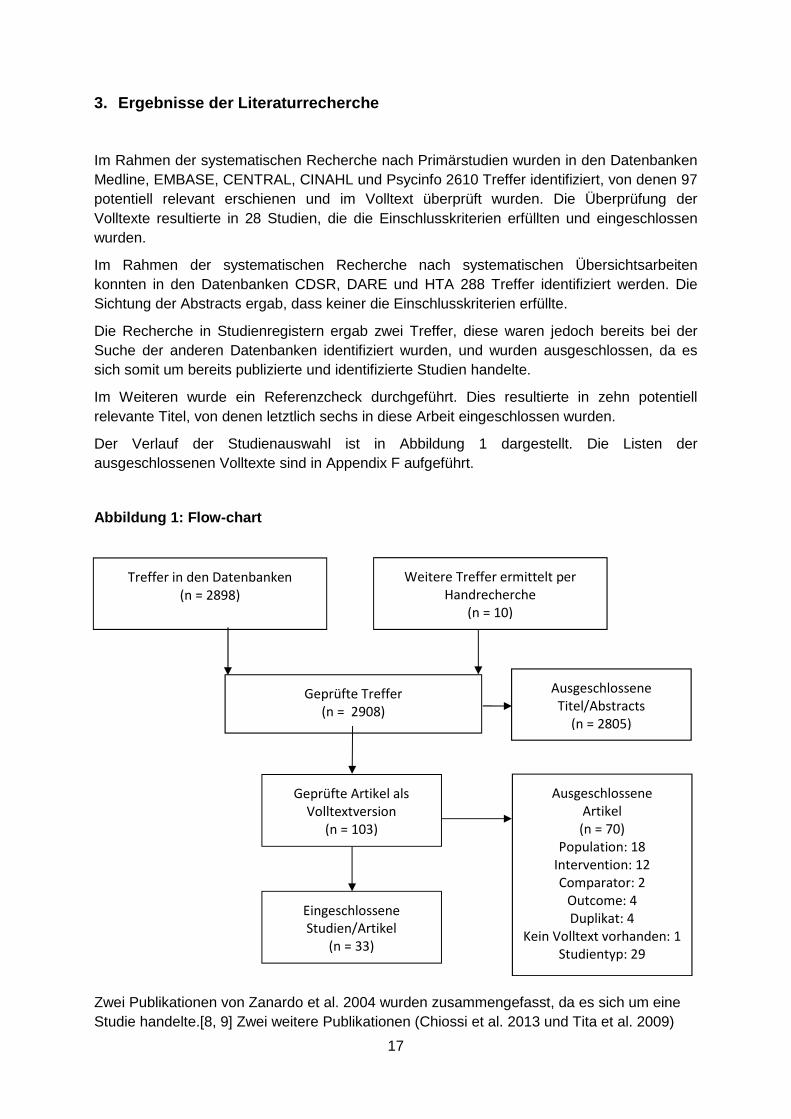
Tabelle 6: Studiencharakteristika
Studie Studientyp Setting Rekrutierungszeitraum
Patientenzahl SSW >1 Kaiserschnitt
Alderdice et al. 2005
Kohortenstudie Nordirland, multizentrisch 2001-2002 2.553 37, 38, 39, 40, 41 Nein
Bailit et al. 2010 Kohortenstudie USA, multizentrisch 2002-2008 3.959 34, 35, 36, 37, 38, 39, 40, 41, 42
Nein
Balchin et al. 2008 Kohortenstudie England, London, multizentrisch
1988-2000 20.891 37, 38, 39, 40 Nein
Chiossi et al. 2013 Kohortenstudie USA, multizentrisch, Tita 2009 gleiche Erhebung
1999-2002 14.865 37, 38, 39, 40, 41 Ja
Clark et al. 2009 Kohortenstudie USA, multizentrisch 2007 1.851 37, 38, ≥39 Subgruppen für erster Kaiserschnitt & Wiederholter
Doan et al. 2014 Kohortenstudie Australien (Queensland), Unizentrisch
1998-2009 14.447 37-38, 39-41 Nein
Farchi et al. 2010 Kohortenstudie Italien (Lazio), multizentrisch
2003-2005 13.329 37, 38, 39, 40-41 Ja
Finn et al. 2016 Kohortenstudie Irland (Cork), unizentrisch 2008-2012 4.242 37, 38, 39, 40, 41 Nein
Gawlik et al. 2015 Kohortenstudie Deutschland (Heidelberg), unizentrisch
2006-2011 503 37, 38-41 Ja

26
Glavind et al. 2013 RCT Dänemark, multizentrisch 2009-2011 1.274 38, 39 Nein
Graziosi et al. 1998
Kohortenstudie Niederlande (Utrecht), unizentrisch
1990-1995 272 37, 38, 39, 40, 41 Nein
Hansen et al. 2008 Kohortenstudie Dänemark (Aarhus), unizentrisch
1998-2006 2.687 37, 38, 39, 40, 41 Nein
Many et al. 2006 Kohortenstudie Israel (Tel Aviv), - - 278 38, 39, 40, 41 Nein
Matsuo et al. 2008 Kohortenstudie Japan (Osaka), unizentrisch 1994-2005 364 37, 38, ≥39 Nein
McAlister et al. 2013
Kohortenstudie USA, multizentrisch 2008-2009 4.125 37-38, 39-41 Nein
Melamed et al. 2014
Kohortenstudie Israel (Tel Aviv), unizentrisch
2010-2011 377 38, 39 ≥2 vorherige Kaiserschnitte
Morrison et al. 1995
Kohortenstudie England (Cambridge), unizentrisch
1985-1993 2.341 37, 38, 39, 40, ≥41
Nein
Nakashima et al. 2014
Kohortenstudie Japan, unizentrisch 2006-2012 684 37, 38 Nein
Nir et al. 2012 Kohortenstudie Israel, unizentrisch 2007-2009 1050 37-38, ≥39 Nein
Parikh et al. 2014 Kohortenstudie USA, multizentrisch 2008-2011 14.613 37, 38, ≥39 Nein
Resende et al. 2014
Kohortenstudie Portugal, unizentrisch 2003-2013 3.123 37-38, 39-41 Nein
Terada et al. 2014 Kohortenstudie Japan (Tokyo), unizentrisch 2006-2013 1.936 37, 38, 39-40, 41 Nein
Tita et al. 2009 Kohortenstudie USA, multizentrisch, siehe 1996-2006 13.258 37, 38, 39, 40, 41, Ja
27
Chiossi 2009 42
Tracy et al. 2007 Kohortenstudie Australien, multizentrisch 1999-2002 43.059 37, 38, 39, 40, 41 Nein
Vidic et al. 2016 Kohortenstudie Slowenien, multizentrisch 2002-2012 7.364 37, 38, 39, 40, ≥41
Nein
Vilchez et al. 2014 Kohortenstudie USA, multizentrisch, Vilchez 2015 gleiche Erhebung
2004-2008 785.340 37, 38, 39, 40, 41 Ja
Vilchez et al. 2015 Kohortenstudie USA, multizentrisch, siehe Vilchez 2014
2004-2008 483.052 37, 38, 39, 40, 41 Ja
Wilmink et al. 2010 Kohortenstudie Niederlande, multizentrisch 2000-2006 20.973 37, 38, 39, 40, 41, 42
Nein
Wilmink et al. 2012 Kohortenstudie Niederlande, multizentrisch, Zwillingsgeburten
2000-2007 4.557 35, 36, 37, ≥38 Nein
Yamazaki et al. 2003
Kohortenstudie Japan (Nagaoka), unizentrisch
1998-2000 96 37, 38 Nein
Zanardo et al. 2004, zwei Publikationen
Kohortenstudie Italien, unizentrisch 1998- 2000
1284 37,38,39-41 Nein
Zanardo et al. 2007
Kohortenstudie Italien, multizentrisch 2002-2003 9988 37, 38, 39 and 40-41+6
Nein

28
4.2. Subgruppenanalyse
Nachdem die Volltexte gesichtet waren und der Einschluss festgelegt war, wurden posthoc verschiedene Subgruppen gebildet. Zum einen hatte sich gezeigt, dass die Studien unterschiedliche Zeitpunkte aufführten. Der Großteil der Studien verglich einzelne Wochen miteinander und die Wochen reichten von der 37+0 bis zur 42+6 SSW. Bis auf drei Studien beinhalteten jedoch alle Studien den Vergleich <39 und ≥39 SSW. Nach Rücksprache mit der Koordinierungsstelle wurde festgelegt, alle Ereignisse zwischen 37+0 bis 38+6 SSW zu akkumulieren und mit den akkumulierten Werten ≥39+0 SSW zu vergleichen. Dies war der Hauptvergleich der auch den Empfehlungen der Leitlinien von NICE und RCOG entspricht, die einen Kaiserschnitt erst nach der 38+6 SSW empfehlen.[13, 14] Weiterhin gab es zwei Subgruppen: Studien, die Patientinnen einschlossen, die sowohl vorherige Kaiserschnitte erlebt hatten als auch jene, die noch keinen erlebt hatten, wurden in die Gruppe „elective Caesarean Section (CS)“ eingeschlossen. Die Studien, die Patientinnen untersuchten, die ausschließlich mind. einen vorherigen Kaiserschnitt erlebt hatten, wurden in die Gruppe „repeat elective CS“ eingeschlossen. Hier gab es eine Studie, bei der das Einschlusskriterium war mindestens zwei vorherige Kaiserschnitte gehabt zu haben.[16] Zwei weitere Studien, die nur die 37+0-6 SSW mit der 38+0-6 SSW verglichen (Nakashima et al. 2014, Yamazaki et al. 2003), wurden in einem Frühvergleich dargestellt.[17, 18] Im Zwillingsvergleich wurde die einzige Studie aufgeführt, die ausschließlich Zwillingsgeburten untersuchte (Wilmink et al. 2012).[19] In Tabelle 6 sind die einzelnen Vergleiche mit den analysierten Zeiträumen dargestellt.
Tabelle 7: Vergleichsgruppen
Vergleich Interventionsgruppe Kontrollgruppe
Hauptvergleich mit Subgruppe „elective CS“ und „elective repeat CS“ Kohortenstudien
37+0 – 38+6 ≥39+0
Hauptvergleich RCT 38 (38+1-38+5) 39 (38+6-39+5)
Frühvergleich 37+0 – 6 38+0 – 6
Zwillingsvergleich Zwillinge 35+0 – 37+6 Zwillinge 38+0 – 41+6
4.3. Patienten
Der Umfang der eingeschlossenen Patienten variierte und beträgt im Median 3.624 (Spannweite: 96 - 785.340, siehe Tabelle 5). Die eingeschlossenen Studien untersuchten überwiegend Geburten ohne Komplikationen und ohne Risikofaktoren sowie Neugeborene mit Fehlbildungen. Das mittlere Alter der eingeschlossenen Patientinnen lag zwischen 30 und 35 Jahren. Nur Chiossi et al. (2013) berichteten von Frauen unter 30 Jahre im Mittel, wobei das Alter mit steigender SSW abnahm (37+0 - 38+6 SSW MW:30,6, 41+0-6 SSW MW:28,1).[10] Neben den vier Studien, die in Japan durchgeführt wurden, wurden alle anderen Studien in den USA, Australien und Europa durchgeführt und schlossen mindestens ca. 50% Patienten mit kaukasischer Herkunft (soweit angegeben). Im Hauptvergleich waren Zwillingsgeburten zumeist ausgeschlossen. Nur eine Studie berichtete von elf

29
Zwillingsgeburten, die aber mit den 194 Einlingsgeburten gemeinsam ausgewertet wurden.[20] Das Gestationsalter wurde in 13 Studien anhand der letzten Menstruation in Kombination mit Ultraschall bewertet.[8-10, 16, 19, 21-29] In vier Studien wurde das Gestationsalter alleine mit Ultraschall bewertet.[15, 18, 30, 31] Von den achtzehn Studien, die „elective CS“ untersuchten, gaben 13 nähere Angaben zum Verhältnis der Studienpopulation an mit einer ungefähr gleichen Proportion von Frauen mit vorherigem Kaiserschnitt (ca. 50-67%, außer Graziosi et al. 1998 mit 25%). Die ausführlichen Patientencharakteristika sind in Anhang C aufgeführt.
4.4. Interventionen
Die untersuchte Intervention war ein elektiver Kaiserschnitt in der 37+0 bis 38+6 SSW in der Hauptgruppe. In die Auswertung wurden alle Studien einbezogen, die Angaben zu diesem Zeitraum machten, d.h. sowohl Studien die nur die 38+0-6 SSW als auch die 37+0 bis 38+6 SSW auswerteten. Weiterhin wurden die beiden Wochen, sofern sie einzeln berichtet wurden, akkumuliert. Die Intervention der Frühgruppe fand in der 37+0-6 SSW, und in der Zwillingsgruppe 35+0 bis 37+6 SSW statt. Eine besondere Definition des Zeitraumes nutzte Melamed et al. 2014 (37+4 - 38+3 vs. ≥ 38+4) Gezählt wurde diese im Hauptvergleich.[16] Die RCT Glavind et al. untersuchte 38 (38+1-38+5) vs. 39 (38+6-39+5) SSW.[15] Eine Studie des Frühvergleich, Yamazaki et al. 2010, nutzte den Zeitraum 37+0-3 vs. 37+4-38+6.
4.5. Kontrollen
Als Kontrollgruppe wurden im Hauptvergleich SSW ≥39 untersucht, im Frühvergleich 38+0-6 SSW, und im Zwillingsvergleich 38+0 – 41+6 SSW.
4.6. Outcomes
NICU Admission (Einweisung auf die NICU)
19 Studien erhoben das Outcome NICU Admission.[10, 15-17, 19-21, 23, 24, 26, 28, 32-39] Im Hauptvergleich der 37+0 bis 38+6 vs. ≥39 SSW konnten 16 Studien mit aufgenommen werden. Diese wiederum unterteilten sich in „elective CS“ mit 13 Studien und „repeat elective CS“ mit vier Studien (Clark et al. 2009 hatte beide Gruppen einzeln analysiert). Es zeigte sich ein Relatives Risiko (RR) von 1,78 [95%KI 1,55, 2,06] in der „elective CS“ Gruppe und damit eine um 1,78-fach erhöhtes Risiko in der Interventionsgruppe auf die NICU eingewiesen zu werden.[20, 21, 23, 26, 28, 32-39] Die „Repeat elective CS“ Gruppe zeigt ein RR von 1,60 [95%KI 1,20, 2,14].[10, 16, 24, 33] Die RCT von Glavind et al. 2013 zeigte ein RR von 1,14 [95%KI 0,88, 1,48].[15]
Im Frühvergleich konnte eine Studie zugeordnet werden. Diese zeigte ein RR von 2,01 [95%KI 1,05, 3,84].[17] Die Zwillingsstudie von Wilmink et al. 2012 zeigte ein RR von 8,65 [95%KI 1,96, 38,27] für die Interventionsgruppe.[19] In allen Gruppen konnten hinsichtlich der NICU Admission ein signifikant erhöhtes RR für einen elektiven Kaiserschnitt bei weniger als 39 Gestationswochen gezeigt werden.

30
NICU length of stay ≥2 days (NICU Verweildauer ≥2 Tage)
Die Verweildauer auf der NICU wurde im Hauptvergleich in drei Studien analysiert. Doan et al. 2014 und Finn et al. 2016 wurden gepoolt und es ergab sich ein RR von 1,93 [95%KI 1,52, 2,45].[21, 23] Glavind et al. zeigte ein RR von 1,03 [95%KI 0,67, 1,59].[15]
Neonatal respiratory morbidity (neonatale respirat orische Morbidität (gemäß Studienprotokoll))
Insgesamt wurde das Outcome Respiratory morbidty in 16 Studien erhoben. Dabei wurde das Outcome unterschiedlich definiert, siehe Tabelle 7. Hauptsächlich wurden TTN oder RDS in die Definition miteinbezogen, weiterhin auch Pneumothorax, Beatmung und Sauerstoffzufuhr.
Tabelle 8: Respiratory Morbidity
Studie Respiratory Morbidity definiert als… Alderdice et al. 2005 NICU admission mit TTN oder RDS Balchin et al. 2008 TTN oder RDS Doan et al. 2014 Neonatal Critical Care Unit (NCCU), die Intensiv- oder Spezialpflege
anbietet, mit jeder respiratorischen Diagnose: RDS, TTN, persistent pulmonary hypertension of the newborn (PPHN), Pneumothorax
Farchi et al. 2010 pulmonary interstitial emphysema/Pneumothorax,TTN, RDS, schwere Asphyxie (Asphyxie und 5-minute Apgar score <7) und andere neonatale respiratorische Probleme, respiratorische Therapie (Sauerstoffzufuhr, nasal CPAP)
Finn et al. 2016 RDS und TTN und continuous positive airway pressure (CPAP) Glavind et al.2013 Mechanische Beatmung, 3 oder mehr Tage mit Sauerstoffzufuhr
oder CPAP Behandlung während NICU Aufenthalt Hansen et al. 2008 TTN, RDS oder PPHN Many et al. 2006 Sauerstoff, Beatmung, Antibiose Melamed et al. 2014 RDS, TTN, Pneumothorax, CPAP, mechanische Beatmung Morrison et al. 1995 NICU Admission mit RDS, TTN und Sauerstoffzufuhr Nakashima et al. 2014
Tachypnoe, Retraktion, Grunzen, Zyanose
Resende et al. 2015 TTN, RDS, Sauerstoff oder Beatmung Terada et al. 2014 RDS/TTN die Sauerstoffzufuhr oder andere Unterstützung
(Beatmung, CPAP) benötigen Tita et al. 2009 RDS oder TTN Wilmink et al. 2010 RDS, TTN, Pneumothorax, air leakage, intermittierende Überdruck
Beatmung, CPAP, Sauerstoffzufuhr Yamazaki et al. 2003
TTN oder Apnoe
In der Subgruppe “elective CS” wurden 10 Studien gepoolt. Es ergab sich ein RR von 2,44 [95%KI 2,10, 2,84].[20-23, 25, 27, 28, 31, 37, 40] Die RCT von Glavind et al. 2013 zeigte ein RR von 1,33 [95%KI 0,91, 1,95]. [15] In der Subgruppe “repeat elective CS” wurden drei Studien gepoolt und es ergab sich ein RR von 1.63 [1.44, 1.86][16, 41, 42] Der Frühvergleich führte mit dem Pooling beider Studien zu einem RR von 3,22 [95%KI 1,70, 6,11].[17, 18]
Neonatal RDS (Neonatales respiratorisches Distresss yndrom)
Neun Studien erhoben das Outcome RDS. In der Subgruppe „elective CS“ ergaben sechs davon ein RR von 2.64 [95%CI 2.00, 3.49]. [8, 21, 28, 30, 34, 39] In der Subgruppe „Repeat

31
elective CS“ wurden zwei Studien gepoolt und ergaben ein RR von 2,36 [95%KI 1,83, 3,05] [10] [16] Wilmink et al. stellten in ihrer Zwillingsstudie ein RR von 11,98 [95%KI 1,52, 94,43] für RDS fest.[19]
TTN (Neonatale vorübergehende Tachypnoe)
Insgesamt erhoben neun Studien TTN. Fünf Studien wurden in der „Elective CS“ Gruppe gepoolt und ergaben ein RR von 2,15 [95%KI 1,75, 2,64] [21, 23] [8, 28, 30] Zwei Studien wurden in der „Repeat elective CS” Gruppe gepoolt und ergaben ein RR von 1,50 [95%KI 1,27, 1,77] [10] [16]. In der Frühgruppe untersuchten nur Yamazaki et al. 2003 TTN, ein RR von 2,50 [95%KI 0,84, 7,42] wurde ermittelt[18]. Wilmink et al. 2012 erreichen wiederum ein signifikant erhöhtes RR für das Outcome TTN (4,92 [95%KI 2,46, 9,87]).[19] Wilmink et al. 2012 zeigten in der Zwillingsstudie ein RR von 4,92 [95%KI 2,46, 9,87].[19]
Neonatal Pneumothorax (Neonataler Pneumothorax)
Drei Studien in der Subgruppe „Elective CS“ zeigten ein RR von 3,12 [95%KI 1,60, 6,10]. [21] [30] [29]. In der Subgruppe „Repeat elective CS“ erhob nur eine Studie, Melamed et al. 2014, das Outcome Pneumothorax (RR 0,43 [95%KI 0,03, 6,78]).[16] Willmink et al. 2012 zeigten im Zwillingsvergleich ein RR von 6,65 [95%KI 0,32, 138,47][19]. Damit kann man nur in der Gruppe „Elecitve CS“ von einem signifikanten Unterschied sprechen.
Neonatal Resuscitation (Neonatale Wiederbelebung (g emäß Studienprotokoll))
Insgesamt konnten sechs Studien identifiziert werden, die Wiederbelebung untersuchten. Dabei war der Begriff Wiederbelebung unterschiedlich definiert. Doan et al. 2014 sprachen von „positive pressure ventilation, cardiac compression/ resusciation drugs“[21], Tita et al. 2009 von „cardiopulmonary resuscitation or ventilator support within 24 hours after birth“[42]. Wilmink et al. definiert in beiden Studien Wiederbelebung als „endotracheal artificial respiration and/or administration of buffers and/or other“[19]. Zanardo et al. 2004 definieren alles als Wiederbelebung von intravenöser oder intratrachealer Pharmakotherapie, Thoraxkompression, Überdruckbeatmung, oropharyngeal suction, Stimulation, Trocknung/Wärmung. Resende et al. 2015 geben keine weitere Definition an.[37, 43]
In der Subgruppe „elective CS“ beträgt das RR für Wiederbelebung 1,17 [95%KI 1,05, 1,30][21, 28, 37, 43] in der Subgruppe „repeat elective CS“ (nur Tita et al. 2009) 2,69 [95%KI 1,75, 4,15].[42] Wilmink et al. 2012 zeigt im Zwillingsvergleich ein RR von 2,66 [95%KI 0,49, 14,51], welches nicht signifikant ist.[19]
Neonatal sepsis (Neonatale Sepsis)
Acht Studien berichten über Sepsis, dabei geben allerdings nur vier Studien den Begriff „Sepsis“ an und nur zwei Studien, beide Wilmink et al. definieren es als „sepsis, including both clinically suspected patients as well as proven infections with positive cultures“[19, 28]. CHiossi et al. 2013, Bailit et al. 2010 und Resende et al. 2015 definieren es nicht weiter. Finn et al. und Glavind et al. 2013 geben nur Antibiotikagabe an, während Nakashima et al. 2014 Infektion definiert als „the need for antibiotics and an associated serum C-reactive protein level of ≥ 0.25 mg/dL. Blood samples were also collected for culture.“ Melamed et al. 2014 geben Infektionen an, diese werden aber nicht weiter definiert.[10, 16, 37, 44] [15, 17, 19, 28]
In der Gruppe „elective CS“ liegt das RR für Sepsis bei 1,43 [95%KI 0,95, 2,18].[28, 32, 37]

32
Chiossi et al. 2013 und Melamed et al. 2014 wurden in der Gruppe „repeat electice CS“ gepoolt und erreichten ein RR von 1,64 [95%KI 1,40, 1,93][10, 16]. Die RCT von Glavind et al. 2013 berichtet ein RR von 1,22 [95%KI 0,61, 2,45][15]. Der Frühvergleich zeigt ein RR von 0,75 [95%KI 0,15, 3,71] durch Nakashima et al. 2014[17]. Und der Zwillingsvergleich mit Wilmink et al. 2012 ein RR von 3,11 [95%KI 0,80, 11,99][19].
Neonatal hypoglycemia (Neonatale Hypoglykämie)
Neun Studien berichteten Hypoglykämie des Neugeborenen. Vier in der Gruppe „elective CS“ mit einem RR von 1,48 [95%KI 1,26, 1,74][21, 28, 37, 39] und zwei in der Gruppe „repeat elective CS“ RR 3,75 [95%KI 2,64, 5,32][16, 42]. Auch im Frühvergleich wurden beide Studien gepoolt und ergaben ein RR von 3,02 [95%KI 1,47, 6,20].[17, 18] Die Zwillingsstudie von Willmink et al 2012 ergab ein RR von 4,70 [95%KI 3,15, 7,01][19].
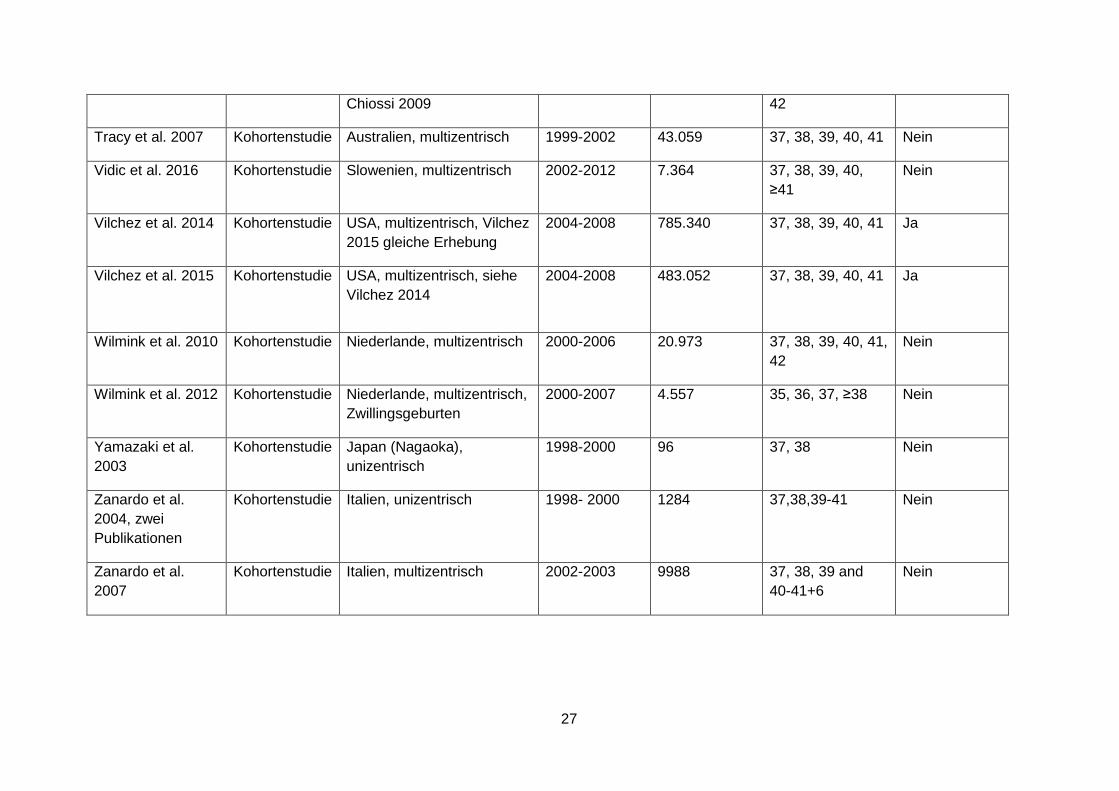
Neonataler Apgar Score ≤3
Es lagen vier Studien mit einem Apgar Score ≤3 vor. Für „elective CS“ waren dies Bailit et al. 2010 und Wilmink et al. 2010 mit einem gepoolten RR von 1,58 [95%KI 0,70, 3,56] und für „repeat elective CS“ gab es nur Chiossi et al. 2013 mit einem RR von 2,17 [95%KI 0,83, 5,70][10, 28, 32]. Im Zwillingsvergleich zeigte Willmink et al 2012 ein RR von 2,66 [95%KI 0,24, 29,33][19]. Die Ergebnisse waren nicht signifikant.
Neonataler Apgar Score ≤6
Nur der Hauptvergleich lagen Daten für einen Apgar Score ≤6 vor. In der Gruppe „Elective CS“ zeigten drei Studien ein RR von 1,63 [95%KI 1,13, 2,36].[21, 28, 39] und in der Gruppe „Repeat elective CS“ zeigte Melamed et al. 2014 ein RR von 0,32 [0,07, 1,41].[16]
Neonatal hyperbilirubinemia requiering phototherapy (Neonatale Hyperbilirubinämie bedarf Phototherapie)
Sieben Studien erhoben Hyperbilirubinämie. Definiert wurde es in allen Studien als „Hyperbilirubinämie, die einer Phototherapie bedarf“. In der Subgruppe „elective CS“ konnten fünf Studien gepoolt werden, die ein RR von 2,09 [95%KI 1,54, 2,82] ergaben.[21, 28, 34, 37, 39]. In der Gruppe „Repeat elective CS“ konnte nur Melamed et al. 2014 analysiert werden und berichtete ein RR von 0,43 [95%KI 0,16, 1,11].[16] Weiterhin wurde im Frühvergleich Nakashima et al. 2014 einbezogen und berechnete ein RR von 1,22 [95%KI 0,76, 1,94][17]. Damit konnte nur in der Subgruppe „elective CS“ ein signifikantes Ergebnis gezeigt werden.
Neonatal birth weight ≤2500g (Neonatales Geburtsgewicht ≤2500g)
Insgesamt berichteten sechs Studien das Outcome Geburtsgewicht ≤2500g. Für die Subgruppe „Elective CS“ wurden die Studien von Finn et al. 2016 und Wilmink et al. 2010 gepoolt und ergaben ein RR von 3,33 [95%KI 2,63, 4,21].[23, 28] Tita et al. 2009 zeigte in der Subgruppe „Repeat elective CS“ ein RR von 2,45 [95%KI 1,77, 3,38].[42] Auch im Zwillingsvergleich zeigte sich ein signifikant erhöhtes RR von 4,70 [95%KI 3,95, 5,60].[19] Im Frühvergleich konnten beide Studien gepoolt werden, dies ergab ein (nicht signifikant erhöhtes) RR von 1,40 [95%KI 0,48, 4,13].[17, 18]
Neonatal hospitalization ≥5 days (Neonatale Hospitalisierung ≥5 Tage)

33
Sechs Studien berichteten von einer Hospitalisierung des Neugeborenen ≥5 Tage. Vier Studien wurden in „elective CS“ gepoolt und ergaben ein RR von 1,58 [95%KI 1,03, 2,42].[28, 36, 37, 39] Tita et al. 2009 zeigte bei „Repeat elective CS“ ein RR von 1,55 [95%KI 1,33, 1,80]. [42] Wilmink et al. 2012 errechnete ein RR von 3,68 [95%KI 3,05, 4,44].[19]
Neonatal death (Neonataler Tod)
Nur im Hauptvergleich wurden Studien identifiziert, die neonatal death erhoben. Drei Studien in „elective CS“ poolten ein RR von 1,28 [95%KI 0,73, 2,23].[12, 21, 36] In „repeat elective CS“ konnte nur Chiossi et al. 2013 berücksichtigt werden, da Melamed et al. 2014 keine Ereignisse berichtete. Es ergab sich ein RR von 1,69 [95%KI 0,69, 4,16].[10, 16] Somit waren die erhöhten RR für neonatal death nicht signifikant.
Maternal death (Maternaler Tod)
Chiossi et al. 2013 berichtet maternal death als Outcome und zeigt ein RR von 0,38 [95%KI 0,04, 3,40].[10] Glavind et al. 2013 führen maternal death auch als Outcome auf, es gab jedoch keine Todesfälle.[15]
Maternal hysterectomy (Maternale Hysterektomie)
Bailit et al. 2010 berichtet über Hysterektomien und zeigt ein RR von 0,43 [95%KI 0,04, 4,14].[32] Auch hier wird das Outcome von Glavind et al. 2013 aufgeführt, aber es finden keine Ereignisse statt.[15]
Maternal bleeding needing transfusion/treatment (Ma ternale Blutung bedarf Transfusion/Behandlung)
In der „repeat elective CS“ berichten zwei Studien über maternal bleeding und zeigen ein RR von 1,21 [95%KI 0,65, 2,24].[10, 16] Auch Glavind et al. 2013 berichtet maternal bleeding mit RR 0,75 [95%KI 0,32, 1,77].[15]
Maternal composite adverse events (Maternale unerwü nschte Ereignisse)
Maternal composite adverse events wurden in vier Studien erhoben. In Tabelle 8 ist die Definition des jeweiligen Outcomes dargestellt. Trotz der recht unterschiedlichen Definitionen wurde das Outcome maternal composite adverse events mit Absprache der Koordinierungsstelle als ein Outcome – quasi als allgemeine unerwünschte Ereignisse einer Kaiserschnittoperation – zusammengefasst.
Nur Matsuo et al. 2008 berichtet Maternal composite adverse events in der „elective CS“ mit einem RR von 38,50 [95%KI 5,29, 280,15].[30] Glavind et al. 2013 berichtet ein RR von 0,91 [95%KI 0,65, 1,27].[15] In der Subgruppe „repeat elective CS“ konnten zwei Studien gepoolt werden, CHiossi et al. 2013 und Melamed et al. 2014, und ergaben ein RR von 0,98 [95%KI 0,48, 2,02].[10, 16]
Tabelle 9: Maternal composite adverse events
Studie Maternal composite adverse events
Chiossi et al. 2013 including death, pulmonary edema, cesarean hysterectomy, pelva or abdominal abscess, deep vein thrombosis/pulmonary embolism,

34
pneumonia, blood transfusion
Glavind et al. 2013 including death, cesarean hysterectomy, deep vein thrombosis/pulmonary embolism, uterine incision lateral tear, injury to bowel or bladder, procedural or anaesthesia complications, rupture or dehiscence, bleeding needing treatment, re-operation, antiobiotics
Matsuo et al. 2008 including blood loss >2 L, total abdominal hysterectomy, wound dehiscence, severe adhesions, retained gauze, pyelonephritis, deep vein thrombosis, pulmonary edema, postpartum cardiomyopathy, angina attack
Melamed et al. 2014 presence any of the following complications: post partum infectious morbidity, general anesthesia, postpartum hemorrhage (defined subjectively by the surgeon or by a decrease of more than 3 g/dL in post-operative hemoglobin levels), intestinal or bladder laceration, dehiscence or rupture of uterine scar, accidental extension of uterine scar, need for inverted-T incision, cesarean hysterectomy, postpartum relaparotomy, complications of surgical scar, paralytic ileus, admission to intensive care unit, venous thromboembolism or hospitalization for more than 5 days

35
4.7. Datensynthese der Ergebnisse
Die Datensynthese wurde mithilfe von GRADE durchgeführt. Jeder Vergleich erhielt ein eigenes GRADE Evidence Profile, siehe Abbildungen 3-7. Die Qualitätsbewertung reichte von „very low“ bis „moderate“. Abstufungen in der Qualität lagen hauptsächlich am Studiendesign, einer hohen Heterogenität und dem Verzerrungspotential der eingeschlossenen Studien (Risk of Bias). Die Qualität wurde bei einigen Outcomes aufgewertet, da ein großer Effekt berichtet wurde.

36
Abbildung 3: GRADE Evidence Profile, Hauptvergleich
Author(s):
Date:
Question: Cohort studies: Elective CS in 37-38 weeks compared to ≥ 39 weeks for neonatal and maternal health
Setting:
Bibliography: . Timing of elective Caesarean Section beyond prematurity for neonatal and maternal health. Cochrane Database of Systematic Reviews [Year], Issue [Issue].
Quality assessment № of patients Effect
Quality Importance
№ of
studies
Study
design Risk of bias
Inconsistenc
y Indirectness Imprecision Other considerations
Cohort studies:
Elective CS in
37-38 weeks
≥ 39 weeks Relative
(95% CI)
Absolute
(95% CI)
Neonatal NICU admission - Elective CS
13 observation
al studies
not serious serious 1 not serious not serious none 4370/57767
(7.6%)
3140/62327
(5.0%)
RR 1.78
(1.55 to 2.06)
39 more
per 1.000
(from 28
more to 53
more)
⨁◯◯◯
VERY LOW
Neonatal NICU admission - Repeat elective CS
4 observation
al studies
not serious serious not serious not serious none 821/7188
(11.4%)
705/10134
(7.0%)
RR 1.60
(1.20 to 2.14)
42 more
per 1.000
(from 14
more to 79
more)
⨁◯◯◯
VERY LOW
Neonatal NICU length of stay ≥2 days - Elective CS

37
Quality assessment № of patients Effect
Quality Importance
№ of
studies
Study
design Risk of bias
Inconsistenc
y Indirectness Imprecision Other considerations
Cohort studies:
Elective CS in
37-38 weeks
≥ 39 weeks Relative
(95% CI)
Absolute
(95% CI)
2 observation
al studies
not serious not serious not serious not serious none 171/9288
(1.8%)
241/9401
(2.6%)
RR 1.93
(1.52 to 2.45)
24 more
per 1.000
(from 13
more to 37
more)
⨁⨁◯◯
LOW
Neonatal respiratory morbidity - Elective CS
10 observation
al studies
not serious not serious not serious not serious publication bias
strongly suspected
strong association 2
1657/43009
(3.9%)
603/30347
(2.0%)
RR 2.44
(2.10 to 2.84)
29 more
per 1.000
(from 22
more to 37
more)
⨁⨁◯◯
LOW
Neonatal respiratory morbidity - Repeat elective CS
3 observation
al studies
not serious not serious not serious not serious none 661/14607
(4.5%)
395/12344
(3.2%)
RR 1.63
(1.44 to 1.86)
20 more
per 1.000
(from 14
more to 28
more)
⨁⨁◯◯
LOW
Neonatal respiratory distress syndrome (RDS) - Elective CS

38
Quality assessment № of patients Effect
Quality Importance
№ of
studies
Study
design Risk of bias
Inconsistenc
y Indirectness Imprecision Other considerations
Cohort studies:
Elective CS in
37-38 weeks
≥ 39 weeks Relative
(95% CI)
Absolute
(95% CI)
6 observation
al studies
not serious not serious not serious not serious strong association 168/23659
(0.7%)
86/20604
(0.4%)
RR 2.64
(2.00 to 3.49)
7 more
per 1.000
(from 4
more to 10
more)
⨁⨁⨁◯
MODERATE
Neonatal respiratory distress syndrome (RDS) - Repeat elective CS
2 observation
al studies
not serious not serious not serious not serious strong association 150/6161
(2.4%)
95/9081 (1.0%) RR 2.36
(1.83 to 3.05)
14 more
per 1.000
(from 9
more to 21
more)
⨁⨁⨁◯
MODERATE
Neonatal transient tachypnea - Elective CS
5 observation
al studies
not serious not serious not serious not serious strong association 706/22055
(3.2%)
367/18814
(2.0%)
RR 2.15
(1.75 to 2.64)
22 more
per 1.000
(from 15
more to 32
more)
⨁⨁⨁◯
MODERATE
Neonatal transient tachypnea - Repeat elective CS

39
Quality assessment № of patients Effect
Quality Importance
№ of
studies
Study
design Risk of bias
Inconsistenc
y Indirectness Imprecision Other considerations
Cohort studies:
Elective CS in
37-38 weeks
≥ 39 weeks Relative
(95% CI)
Absolute
(95% CI)
2 observation
al studies
not serious not serious not serious not serious none 274/6161
(4.4%)
271/9081
(3.0%)
RR 1.50
(1.27 to 1.77)
15 more
per 1.000
(from 8
more to 23
more)
⨁⨁◯◯
LOW
Neonatal pneumothorax - Elective CS
3 observation
al studies
not serious not serious not serious serious 3 strong association 46/14284
(0.3%)
11/10471
(0.1%)
RR 3.12
(1.60 to 6.10)
2 more
per 1.000
(from 1
more to 5
more)
⨁⨁◯◯
LOW
Neonatal pneumothorax - Repeat elective CS
1 observation
al studies
not serious not serious not serious serious 3 none 1/264 (0.4%) 1/113 (0.9%) RR 0.43
(0.03 to 6.78)
5 fewer
per 1.000
(from 9
fewer to 51
more)
⨁◯◯◯
VERY LOW
Neonatal resuscitation - Elective CS

40
Quality assessment № of patients Effect
Quality Importance
№ of
studies
Study
design Risk of bias
Inconsistenc
y Indirectness Imprecision Other considerations
Cohort studies:
Elective CS in
37-38 weeks
≥ 39 weeks Relative
(95% CI)
Absolute
(95% CI)
4 observation
al studies
not serious not serious not serious not serious none 878/22722
(3.9%)
558/16708
(3.3%)
RR 1.17
(1.05 to 1.30)
6 more
per 1.000
(from 2
more to 10
more)
⨁⨁◯◯
LOW
Neonatal resuscitation - Repeat elective CS
1 observation
al studies
not serious not serious not serious not serious strong association 51/4737 (1.1%) 34/8506 (0.4%) RR 2.69
(1.75 to 4.15)
7 more
per 1.000
(from 3
more to 13
more)
⨁⨁⨁◯
MODERATE
Neonatal sepsis - Elective CS
3 observation
al studies
not serious not serious not serious not serious none 68/14792
(0.5%)
42/12327
(0.3%)
RR 1.43
(0.95 to 2.18)
1 more
per 1.000
(from 0
fewer to 4
more)
⨁⨁◯◯
LOW
Neonatal sepsis - Repeat elective CS

41
Quality assessment № of patients Effect
Quality Importance
№ of
studies
Study
design Risk of bias
Inconsistenc
y Indirectness Imprecision Other considerations
Cohort studies:
Elective CS in
37-38 weeks
≥ 39 weeks Relative
(95% CI)
Absolute
(95% CI)
2 observation
al studies
not serious not serious not serious not serious none 300/6161
(4.9%)
276/9081
(3.0%)
RR 1.64
(1.40 to 1.93)
19 more
per 1.000
(from 12
more to 28
more)
⨁⨁◯◯
LOW
Neonatal hypoglycemia - Elective CS
4 observation
al studies
not serious not serious not serious not serious none 408/24053
(1.7%)
246/21457
(1.1%)
RR 1.48
(1.26 to 1.74)
6 more
per 1.000
(from 3
more to 8
more)
⨁⨁◯◯
LOW
Neonatal hypoglycemia - Repeat elective CS
2 observation
al studies
not serious not serious not serious not serious strong association 61/2142 (2.8%) 66/8515 (0.8%) RR 3.75
(2.64 to 5.32)
21 more
per 1.000
(from 13
more to 33
more)
⨁⨁⨁◯
MODERATE
Neonatal Apgar score ≤3 - Elective CS
42
Quality assessment № of patients Effect
Quality Importance
№ of
studies
Study
design Risk of bias
Inconsistenc
y Indirectness Imprecision Other considerations
Cohort studies:
Elective CS in
37-38 weeks
≥ 39 weeks Relative
(95% CI)
Absolute
(95% CI)
2 observation
al studies
not serious not serious not serious serious 3 none 14/13365
(0.1%)
10/10631
(0.1%)
RR 1.58
(0.70 to 3.56)
1 more
per 1.000
(from 0
fewer to 2
more)
⨁◯◯◯
VERY LOW
Neonatal Apgar score ≤3 - Repeat elective CS
1 observation
al studies
not serious not serious not serious serious 3 strong association 10/5897 (0.2%) 7/8968 (0.1%) RR 2.17
(0.83 to 5.70)
1 more
per 1.000
(from 0
fewer to 4
more)
⨁⨁◯◯
LOW
Neonatal Apgar score ≤6 - Elective CS
3 observation
al studies
not serious not serious not serious not serious none 81/22626
(0.4%)
52/19761
(0.3%)
RR 1.63
(1.13 to 2.36)
2 more
per 1.000
(from 0
fewer to 4
more)
⨁⨁◯◯
LOW
Neonatal Apgar score ≤6 - Repeat elective CS

43
Quality assessment № of patients Effect
Quality Importance
№ of
studies
Study
design Risk of bias
Inconsistenc
y Indirectness Imprecision Other considerations
Cohort studies:
Elective CS in
37-38 weeks
≥ 39 weeks Relative
(95% CI)
Absolute
(95% CI)
1 observation
al studies
not serious not serious not serious very serious 3 strong association 3/264 (1.1%) 4/113 (3.5%) RR 0.32
(0.07 to 1.41)
24 fewer
per 1.000
(from 15
more to 33
fewer)
⨁◯◯◯
VERY LOW
Neonatal hyperbilirubinemia - Elective CS
5 observation
al studies
not serious serious 1 not serious not serious strong association 462/24192
(1.9%)
393/21590
(1.8%)
RR 2.09
(1.54 to 2.82)
20 more
per 1.000
(from 10
more to 33
more)
⨁⨁◯◯
LOW
Neonatal hyperbilirubinemia - Repeat elective CS
1 observation
al studies
not serious not serious not serious serious 3 strong association 8/264 (3.0%) 8/113 (7.1%) RR 0.43
(0.16 to 1.11)
40 fewer
per 1.000
(from 8
more to 59
fewer)
⨁⨁◯◯
LOW
Neonatal birth weight ≤2500g - Elective CS

44
Quality assessment № of patients Effect
Quality Importance
№ of
studies
Study
design Risk of bias
Inconsistenc
y Indirectness Imprecision Other considerations
Cohort studies:
Elective CS in
37-38 weeks
≥ 39 weeks Relative
(95% CI)
Absolute
(95% CI)
2 observation
al studies
not serious not serious not serious not serious strong association 341/12504
(2.7%)
95/12314
(0.8%)
RR 3.33
(2.63 to 4.21)
18 more
per 1.000
(from 13
more to 25
more)
⨁⨁⨁◯
MODERATE
Neonatal birth weight ≤2500g - Repeat elective CS
1 observation
al studies
not serious not serious not serious not serious strong association 87/4743 (1.8%) 63/8402 (0.7%) RR 2.45
(1.77 to 3.38)
11 more
per 1.000
(from 6
more to 18
more)
⨁⨁⨁◯
MODERATE
Neonatal hospitalisation > 5 days - Elective CS
4 observation
al studies
not serious serious 1 not serious not serious none 1925/19920
(9.7%)
2923/25756
(11.3%)
RR 1.58
(1.03 to 2.42)
66 more
per 1.000
(from 3
more to
161 more)
⨁◯◯◯
VERY LOW
Neonatal hospitalisation > 5 days - Repeat elective CS

45
Quality assessment № of patients Effect
Quality Importance
№ of
studies
Study
design Risk of bias
Inconsistenc
y Indirectness Imprecision Other considerations
Cohort studies:
Elective CS in
37-38 weeks
≥ 39 weeks Relative
(95% CI)
Absolute
(95% CI)
1 observation
al studies
not serious not serious not serious not serious none 297/4735
(6.3%)
344/8501
(4.0%)
RR 1.55
(1.33 to 1.80)
22 more
per 1.000
(from 13
more to 32
more)
⨁⨁◯◯
LOW
Neonatal death - Elective CS
3 observation
al studies
not serious not serious not serious not serious none 192/248967
(0.1%)
154/263145
(0.1%)
RR 1.28
(0.73 to 2.23)
0 fewer
per 1.000
(from 0
fewer to 1
more)
⨁⨁◯◯
LOW
Neonatal death - Repeat elective CS
2 observation
al studies
not serious not serious not serious serious 3 none 10/6161 (0.2%) 9/9081 (0.1%) RR 1.69
(0.69 to 4.16)
1 more
per 1.000
(from 0
fewer to 3
more)
⨁◯◯◯
VERY LOW
Maternal death - Repeat elective CS

46
Quality assessment № of patients Effect
Quality Importance
№ of
studies
Study
design Risk of bias
Inconsistenc
y Indirectness Imprecision Other considerations
Cohort studies:
Elective CS in
37-38 weeks
≥ 39 weeks Relative
(95% CI)
Absolute
(95% CI)
1 observation
al studies
not serious not serious not serious serious 3 none 1/5897 (0.0%) 4/8968 (0.0%) RR 0.38
(0.04 to 3.40)
0 fewer
per 1.000
(from 0
fewer to 1
more)
⨁◯◯◯
VERY LOW
Maternal bleeding (needing transfusion/treatment) - Repeat elective CS
2 observation
al studies
not serious not serious not serious serious 3 none 71/6161 (1.2%) 74/9081 (0.8%) RR 1.21
(0.65 to 2.24)
2 more
per 1.000
(from 3
fewer to 10
more)
⨁◯◯◯
VERY LOW
Maternal hysterectomy - Elective CS
1 observation
al studies
not serious not serious not serious serious 3 none 1/1492 (0.1%) 3/1928 (0.2%) RR 0.43
(0.04 to 4.14)
1 fewer
per 1.000
(from 1
fewer to 5
more)
⨁◯◯◯
VERY LOW
Maternal hysterectomy - Repeat elective CS

47
Quality assessment № of patients Effect
Quality Importance
№ of
studies
Study
design Risk of bias
Inconsistenc
y Indirectness Imprecision Other considerations
Cohort studies:
Elective CS in
37-38 weeks
≥ 39 weeks Relative
(95% CI)
Absolute
(95% CI)
2 observation
al studies
not serious not serious not serious serious 3 none 15/6161 (0.2%) 19/9081 (0.2%) RR 1.20
(0.61 to 2.36)
0 fewer
per 1.000
(from 1
fewer to 3
more)
⨁◯◯◯
VERY LOW
Maternal composite adverse events - Elective CS
1 observation
al studies
not serious not serious not serious Very serious 3
Strong association 26/129 (20.2%) 1/191 (0.5%) RR 38.50
(5.29 to 280.15)
196 more
per 1.000
(from 22
more to
1000
more)
⨁◯◯◯
VERY LOW
Maternal composite adverse events - Repeat elective CS
2 observation
al studies
not serious serious 1 not serious not serious none 139/6161
(2.3%)
125/9081
(1.4%)
RR 0.98
(0.48 to 2.02)
0 fewer
per 1.000
(from 7
fewer to 14
more)
⨁◯◯◯
VERY LOW

48
Abbildung 4: GRADE Evidence Profile, Hauptvergleich RCT
Author(s):
Date:
Question: RCT: Elective CS in 37-38 weeks compared to ≥ 39 weeks for neonatal and maternal health
Setting:
Bibliography: . Timing of elective Caesarean Section beyond prematurity for neonatal and maternal health. Cochrane Database of Systematic Reviews [Year], Issue [Issue].
Quality assessment № of patients Effect
Quality Importance № of
studies
Study
design Risk of bias
Inconsistenc
y Indirectness Imprecision Other considerations
RCT: Elective
CS in 37-38
weeks
≥ 39 weeks Relative
(95% CI)
Absolute
(95% CI)
Neonatal NICU admission - Elective CS
1 randomised
trials
serious 1 not serious not serious serious 2 none 101/635 (15.9%) 89/637 (14.0%) RR 1.14
(0.88 to 1.48)
20 more
per 1.000
(from 17
fewer to 67
more)
⨁⨁◯◯
LOW
Neonatal NICU length of stay ≥2 days - Elective CS
1 randomised
trials
not serious not serious not serious serious 2 none 39/635 (6.1%) 38/637 (6.0%) RR 1.03
(0.67 to 1.59)
2 more per
1.000
(from 20
fewer to 35
more)
⨁⨁⨁◯
MODERATE
Neonatal respiratory morbidity - Elective CS

49
Quality assessment № of patients Effect
Quality Importance № of
studies
Study
design Risk of bias
Inconsistenc
y Indirectness Imprecision Other considerations
RCT: Elective
CS in 37-38
weeks
≥ 39 weeks Relative
(95% CI)
Absolute
(95% CI)
1 randomised
trials
serious 1 not serious not serious serious 2 none 57/635 (9.0%) 43/637 (6.8%) RR 1.33
(0.91 to 1.95)
22 more
per 1.000
(from 6
fewer to 64
more)
⨁⨁◯◯
LOW
Neonatal sepsis - Elective CS
1 randomised
trials
serious 1 not serious not serious serious 2 none 17/635 (2.7%) 14/637 (2.2%) RR 1.22
(0.61 to 2.45)
5 more per
1.000
(from 9
fewer to 32
more)
⨁⨁◯◯
LOW
Maternal death - Elective CS
1 randomised
trials
not serious none 0/635 (0.0%) 0/637 (0.0%) not estimable -
Maternal bleeding (needing transfusion/treatment) - Elective CS
1 randomised
trials
not serious not serious not serious not serious none 9/636 (1.4%) 12/638 (1.9%) RR 0.75
(0.32 to 1.77)
5 fewer per
1.000
(from 13
fewer to 14
more)
⨁⨁⨁⨁
HIGH
Maternal hysterectomy - Elective CS

50
Quality assessment № of patients Effect
Quality Importance № of
studies
Study
design Risk of bias
Inconsistenc
y Indirectness Imprecision Other considerations
RCT: Elective
CS in 37-38
weeks
≥ 39 weeks Relative
(95% CI)
Absolute
(95% CI)
1 randomised
trials
not serious 0/636 (0.0%) 0/638 (0.0%) not estimable -
Maternal composite adverse events - Elective CS
1 randomised
trials
not serious not serious not serious serious 2 none 60/636 (9.4%) 66/638 (10.3%) RR 0.91
(0.65 to 1.27)
9 fewer per
1.000
(from 28
more to 36
fewer)
⨁⨁⨁◯
MODERATE
CI: Confidence interval; RR: Risk ratio
1. Personnel and participants not blinded, outcome not blinded 2. large confidence interval

51
Abbildung 5: Frühvergleich Author(s):
Date:
Question: Elective CS 37 week compared to 38 weeks for neonatal and maternal health
Setting:
Bibliography: . Timing of elective Caesarean Section beyond prematurity for neonatal and maternal health. Cochrane Database of Systematic Reviews [Year], Issue [Issue].
Quality assessment № of patients Effect
Quality Importance № of
studies
Study
design Risk of bias Inconsistency Indirectness Imprecision Other considerations
Elective CS 37
week 38 weeks
Relative
(95% CI)
Absolute
(95% CI)
Neonatal NICU admission
1 observational
studies
not serious not serious not serious not serious strong association 32/390 (8.2%) 12/294 (4.1%) RR 2.01
(1.05 to 3.84)
41 more
per 1.000
(from 2
more to 116
more)
⨁⨁⨁◯
MODERATE
Neonatal respiratory morbidity
2 observational
studies
not serious not serious not serious serious 1 none 42/438 (9.6%) 11/342 (3.2%) RR 3.22
(1.70 to 6.11)
71 more
per 1.000
(from 23
more to 164
more)
⨁◯◯◯
VERY LOW
Neonatal transient tachypnea

52
Quality assessment № of patients Effect
Quality Importance № of
studies
Study
design Risk of bias Inconsistency Indirectness Imprecision Other considerations
Elective CS 37
week 38 weeks
Relative
(95% CI)
Absolute
(95% CI)
1 observational
studies
not serious not serious not serious serious 1 none 10/48 (20.8%) 4/48 (8.3%) RR 2.50
(0.84 to 7.42)
125 more
per 1.000
(from 13
fewer to
535 more)
⨁◯◯◯
VERY LOW
Neonatal sepsis
1 observational
studies
not serious not serious not serious serious 1 none 3/390 (0.8%) 3/294 (1.0%) RR 0.75
(0.15 to 3.71)
3 fewer per
1.000
(from 9
fewer to 28
more)
⨁◯◯◯
VERY LOW
Neonatal hypoglycaemia
2 observational
studies
not serious not serious not serious serious 1 none 35/438 (8.0%) 9/342 (2.6%) RR 3.02
(1.47 to 6.20)
53 more
per 1.000
(from 12
more to 137
more)
⨁◯◯◯
VERY LOW
Neonatal hyperbilirubinemia
1 observational
studies
not serious not serious not serious not serious none 42/390 (10.8%) 26/294 (8.8%) RR 1.22
(0.76 to 1.94)
19 more
per 1.000
(from 21
fewer to 83
more)
⨁⨁◯◯
LOW

53
Quality assessment № of patients Effect
Quality Importance № of
studies
Study
design Risk of bias Inconsistency Indirectness Imprecision Other considerations
Elective CS 37
week 38 weeks
Relative
(95% CI)
Absolute
(95% CI)
Neonatal birth weight ≤2500g
2 observational
studies
not serious serious 1 not serious serious 1 none 75/438 (17.1%) 31/342 (9.1%) RR 1.40
(0.48 to 4.13)
36 more
per 1.000
(from 47
fewer to
284 more)
⨁◯◯◯
VERY LOW
CI: Confidence interval; RR: Risk ratio
1. large confidence interval
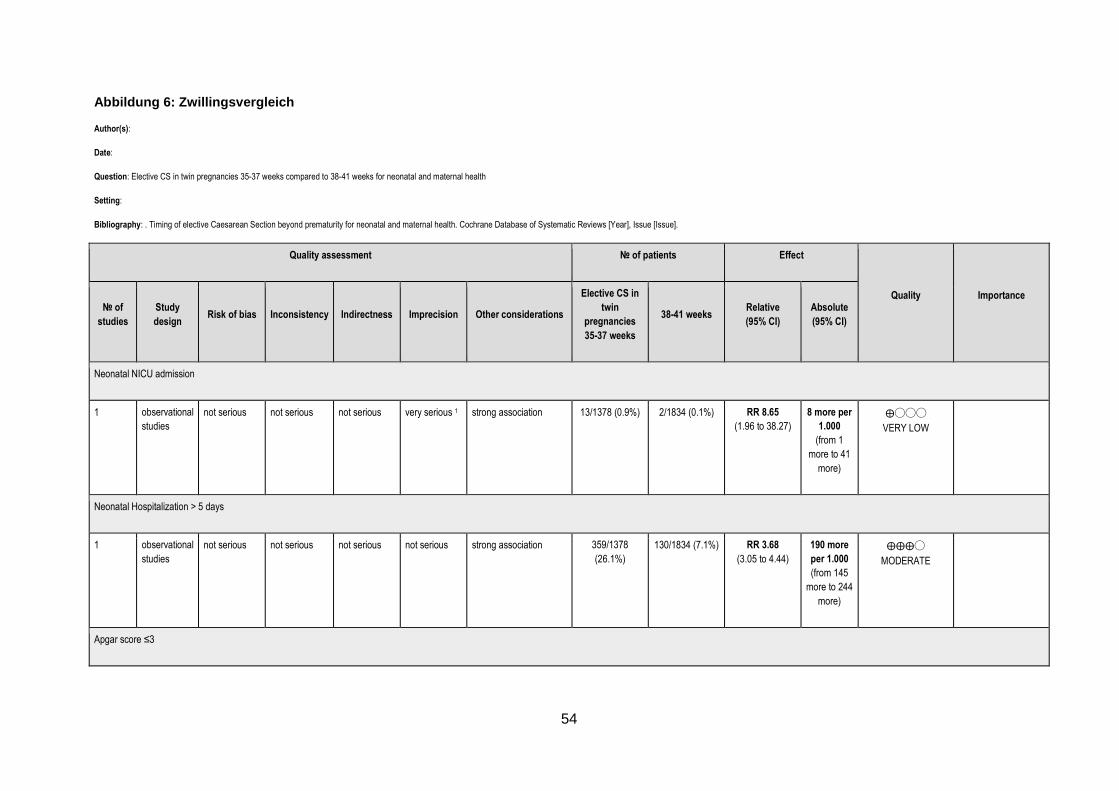
54
Abbildung 6: Zwillingsvergleich Author(s):
Date:
Question: Elective CS in twin pregnancies 35-37 weeks compared to 38-41 weeks for neonatal and maternal health
Setting:
Bibliography: . Timing of elective Caesarean Section beyond prematurity for neonatal and maternal health. Cochrane Database of Systematic Reviews [Year], Issue [Issue].
Quality assessment № of patients Effect
Quality Importance № of
studies
Study
design Risk of bias Inconsistency Indirectness Imprecision Other considerations
Elective CS in
twin
pregnancies
35-37 weeks
38-41 weeks Relative
(95% CI)
Absolute
(95% CI)
Neonatal NICU admission
1 observational
studies
not serious not serious not serious very serious 1 strong association 13/1378 (0.9%) 2/1834 (0.1%) RR 8.65
(1.96 to 38.27)
8 more per
1.000
(from 1
more to 41
more)
⨁◯◯◯
VERY LOW
Neonatal Hospitalization > 5 days
1 observational
studies
not serious not serious not serious not serious strong association 359/1378
(26.1%)
130/1834 (7.1%) RR 3.68
(3.05 to 4.44)
190 more
per 1.000
(from 145
more to 244
more)
⨁⨁⨁◯
MODERATE
Apgar score ≤3

55
Quality assessment № of patients Effect
Quality Importance № of
studies
Study
design Risk of bias Inconsistency Indirectness Imprecision Other considerations
Elective CS in
twin
pregnancies
35-37 weeks
38-41 weeks Relative
(95% CI)
Absolute
(95% CI)
1 observational
studies
not serious not serious not serious very serious 1 strong association 2/1378 (0.1%) 1/1834 (0.1%) RR 2.66
(0.24 to 29.33)
1 more per
1.000
(from 0
fewer to 15
more)
⨁◯◯◯
VERY LOW
Neonatal pneomothorax
1 observational
studies
not serious not serious not serious very serious 1 strong association 2/1378 (0.1%) 0.0% RR 6.65
(0.32 to 138.47)
0 fewer per
1.000
(from 0
fewer to 0
fewer)
⨁◯◯◯
VERY LOW
Neonatal respiratory distress outcome (RDS)
1 observational
studies
not serious not serious not serious very serious 1 strong association 9/1378 (0.7%) 1/1834 (0.1%) RR 11.98
(1.52 to 94.43)
6 more per
1.000
(from 0
fewer to 51
more)
⨁◯◯◯
VERY LOW
Neonatal resuscitation

56
Quality assessment № of patients Effect
Quality Importance № of
studies
Study
design Risk of bias Inconsistency Indirectness Imprecision Other considerations
Elective CS in
twin
pregnancies
35-37 weeks
38-41 weeks Relative
(95% CI)
Absolute
(95% CI)
1 observational
studies
not serious not serious not serious very serious 1 strong association 4/1378 (0.3%) 2/1834 (0.1%) RR 2.66
(0.49 to 14.51)
2 more per
1.000
(from 1
fewer to 15
more)
⨁◯◯◯
VERY LOW
Neonatal sepsis
1 observational
studies
not serious not serious not serious very serious 1 strong association 7/1378 (0.5%) 3/1834 (0.2%) RR 3.11
(0.80 to 11.99)
3 more per
1.000
(from 0
fewer to 18
more)
⨁◯◯◯
VERY LOW
Neonatal transient tachypnea
1 observational
studies
not serious not serious not serious very serious 1 strong association 37/1378 (2.7%) 10/1834 (0.5%) RR 4.92
(2.46 to 9.87)
21 more
per 1.000
(from 8
more to 48
more)
⨁◯◯◯
VERY LOW
Neonatal hypoglycemia

57
Quality assessment № of patients Effect
Quality Importance № of
studies
Study
design Risk of bias Inconsistency Indirectness Imprecision Other considerations
Elective CS in
twin
pregnancies
35-37 weeks
38-41 weeks Relative
(95% CI)
Absolute
(95% CI)
1 observational
studies
not serious not serious not serious serious 1 strong association 106/1378 (7.7%) 30/1834 (1.6%) RR 4.70
(3.15 to 7.01)
61 more
per 1.000
(from 35
more to 98
more)
⨁⨁◯◯
LOW
Low birth weigh (<=2500g)
1 observational
studies
not serious not serious not serious not serious strong association 491/1378
(35.6%)
139/1834 (7.6%) RR 4.70
(3.95 to 5.60)
280 more
per 1.000
(from 224
more to 349
more)
⨁⨁⨁◯
MODERATE
CI: Confidence interval; RR: Risk ratio
1. large confidence interval

58
5. Diskussion Zur Beantwortung der Frage „Welchen Einfluss hat der Zeitpunkt des elektiven Kaiserschnitts außerhalb der Frühgeburtlichkeit (37 + 0 Schwangerschaftswoche (SSW)) auf die maternale und neonatale Gesundheit?“ konnten 33 Publikationen identifiziert werden, die auf 30 Primärstudien beruhen. Dabei handelte es sich bei einer Studie um eine RCT (Glavind et al. 2013) und alle anderen Studien waren Kohortenstudien. Im Hauptvergleich konnten für beide Subgruppen „elective CS“ und „repeat elective CS“ signifikant erhöhte RR in der Interventionsgruppe für folgende Outcomes dargestellt werden: NICU admission, NICU length of stay ≥2 days, neonatal respiratory morbidity, neonatal RDS, neonatal TTN, neonatal resuscitation, neonatal hypoglycemia, Neonatal birth weight ≤2500g, neonatal hospitalisation > 5 days. In der Subrguppe „elective CS“ konnten weiterhin für neonatal pneumothorax, neonatal Apgar score ≤6, neonatal hyperbilirubinemia ein signifikant erhöhtes RR festgestellt werden. In der „Repeat elective CS“ Gruppe wurde wiederum ein signifikant erhöhtes RR für Neonatal sepsis erhoben. Die RCT von Glavind et al. aus dem Jahr 2013 lieferte keinerlei signifikante Werte. Man konnte auch insgesamt nur sehr kleine Unterschiede zwischen den beiden Gruppen sehen. Dies mag damit begründbar sein, dass in dem Vergleich den Glavind et al. anstrebte, die Kaiserschnitte in den beiden Gruppen nur maximal elf Tage auseinander lagen, während die Kohortenstudien eine Spanne der 37+0 bis (zum Großteil) 41+6 SSW untersuchen. Der Frühvergleich beruhte auf zwei Studien, Nakashima et al. 2014 und Yamazaki et al. 2013. Nakashima et al 2014. vergleicht die 37+0-6 mit der 38+0-6 SSW, während Yamazaki et al 2003, die 37+0-3 mit der 37+4-38+6 SSW vergleicht. Yamazaki et al. 2003 hat also einen früheren „späten“ Kaiserschnittzeitpunkt. Dennoch können in den gepoolten Daten der beiden Studien ein signifikant erhöhtes RR in der Interventionsgruppe für neonatal respiratory morbidity und für neonatal hypoglycemia gezeigt werden. Weiterhin zeigt Nakashima et al. 2014 eine signifikant höhere NICU Admission in der Interventionsgruppe. Auch im Zwillingsvergleich konnte Wilmink et al. 2012 signifikant erhöhte RRs bei NICU admissions, neonatal RDS, TTN, neonatal hospitalization > 5 days, neonatal hypoglycemia, neonatal low birth weigh (≤2500g) zeigen. Die Effekte waren hier besonders groß, und brachten auch teilweise sehr weite Konfidenzintervalle mit sich. Dies liegt vermutlich daran, dass der Vergleich schon Kinder vor der „Reife“ (37+0 SSW) einschloss, nämlich ab der 35+0 SSW und es insgesamt kleine Patientenzahlen waren. Es gab wenige Ergebnisse, die auf einen protektiven Faktor des frühen Kaiserschnitts hindeuteten. Melamed et al. zeigte hinsichtlich neonatal pneumothorax, neonatal hyperbilirubinemia und neonatal Apgar Score ≤6 ein RR unter 1. Dies war jedoch nicht signifikant und die Fallzahl (bzw. die Patientenzahl) waren zu gering, um eine Aussage darüber treffen zu können. Hinsichtlich der maternalen Komplikationen zeigte Chiossi et al. 2013 ein RR unter 1 (maternal death). Aber auch dies rührt von sehr geringen Fallzahlen (1 in der Interventionsgruppe, 4 in der Kontrollgruppe). Ebenso erscheint in Bailit et al. 2010 ein RR <1 bei maternal hysterectomy, welches auch auf kleinen Fallzahlen beruhen kann. Melamed et al. 2014 zeigt bei maternal composite adverse events ein RR von 0,68 [95%KI 0,48, 0,97]. Hier sind die Fallzahlen deutlich höher und anhand des Konfidenzintervals lässt sich Signifikanz ableiten. Chiossi et al. 2013 und Matsuo et al. 2008 kommen allerdings auf den gegenteiligen Effekt. Hier muss man einräumen, dass die Patientinnen, die Melamed et al. 2014 einschloss, alle bereits

59
mindestens zwei Kaiserschnitte erlebt hatten. Damit steigt insgesamt das Risiko für Komplikationen. Die Qualitätsbewertung mit der Newcastle-Ottawa Scale zeigte zwar eine hohe methodische Qualität, jedoch scheint es, als könnte die vollständige Qualität bzw. das Verzerrungspotential der eingeschlossenen Studien nicht ausreichend differenziert werden. Durch die besonderen Charakteristika der meisten eingeschlossenen Kohortenstudien, die auf Registerdaten basieren und der Endpunkt zugleich mit Beginn der Studie bzw. Einschluss der Patientinnen zusammentraf, war Punkt 4 „Demonstration that outcome of interest was not present at start of study“ nicht direkt relevant. Um jedoch das Bewertungsinstrument bzw. den Prozess nicht zu modifizieren, bewerteten wir diesen Aspekt für alle Studien positiv (d.h. mit Vergabe eines Sterns). Ein ähnliches Problem ergab sich mit „comparability of cohorts on the basis of the design or analysis“. Hier beantworteten wir den Punkt auch positiv, sobald die Studien für bestimmte bekannte Störvariablen, z.B. Alter oder BMI der Mutter, Geschlecht des Kindes etc. adjustierten, auch wenn wir für die Meta-Analyse absolute Zahlen einschlossen. Damit kann eine Überschätzung der Qualität entstanden sein. Die Schwierigkeit spiegelt die besondere Problematik wider, Kohortenstudien adäquat zu bewerten. Ein im Rahmen des Auftrags geeigneteres Bewertungsinstrument liegt leider bislang nicht vor. Zudem lässt sich das Instrument weniger gut in die Bewertung mit GRADE integrieren, da sich die Bewertung von Risk of Bias besser mit dem Cochrane Risk of Bias Tool ergänzt. Auch hierzu gibt es jedoch keine bessere Alternative. Auch die RCT wies ein hohes Verzerrungspotential auf, was vor allem an der mangelnden Verblindung des Outcome-Assessments lag. Besonders beim Outcome NICU admission errechnete sich in der Meta-Analyse ein hohes Maß an Heterogenität. Wie oben genannt, fehlt für viele Studien die Beschreibung des Patientenkollektivs. Dennoch erscheinen die Charakteristika, die berichtet wurden, über die Studien recht homogen. Allerdings ist vor allem bei NICU admission auffällig, dass die Studien aus einer Vielzahl verschiedener Länder kommen. Mögliche Landesspezifische Richtlinien und medizinische Ausbildung können zu einem unterschiedlichen Umgang in der Versorgungspraxis führen. Es kann allerdings auch unterschiedliche Praktiken in verschiedenen Krankenhäusern eines Landes geben, Studien, die Daten aus nur einem Zentrum lieferten können dadurch das Verzerrungspotential erhöhen. Auch sind die SSW Angaben unterschiedlich, der Großteil zeigt zwar Ergebnisse für jede Woche von der 37+0 bis zur 41+6, jedoch schlossen manche Studien zum Beispiel Frauen lediglich bis Woche 40+6 ein oder spezifizierten nicht genau bis zu welchem Gestationstag die Patientinnen eingeschlossen wurden. Möglicherweise sind Risikoschwangerschaften bzw. –geburten zu den frühen Kaiserschnittterminen zugeteilt. Dies lässt sich jedoch nicht aufklären, da die Charakteristika nur selten den SSW zugeteilt sind. Auch reicht der Begriff elektiv von mütterlichem Wunsch bis zu Komplikationen. Auch können die Outcomes, die je nach Studienprotokoll anders definiert werden, z.B. Respiratory morbidity, unterschiedliche Ergebnisse hervorrufen und ein Pooling wie es hier stattfand, kann zu Über- oder Unterschätzung eines Effekts kommen. Der Forschungsstand zum Thema Zeitpunkt des elektiven Kaiserschnitts ist gut und regelmäßig werden neue Register ausgewertet. In dieser Arbeit ist ein Kollektiv mit einer sehr hohen Patientenzahl untersucht worden, womit die Ergebnisse dieser Arbeit eine hohe Signifikanz haben. Dennoch gibt es weiteren Bedarf an hochqualitativer Forschung.

60
Für eine Übertragung auf den deutschen Kontext fehlen Informationen über Richtlinien und Vorgehensweisen zur klinischen Praxis, die in den hier analysierten Studien zu Grunde liegen. Allerdings kann man insgesamt schließen, dass ein elektiver Kaiserschnitt nicht vor der 39+0 SSW erfolgen sollte, da insbesondere neonatale Morbidität mit einer erhöhten Wahrscheinlichkeit auftreten kann.

61
6. Appendix
Appendix A: Cochrane Risk of Bias Tool
Domain Support for judgement Review authors’ judgement
Selection bias
Random sequence generation Describe the method used to generate the allocation sequence in sufficient detail to allow an assessment of whether it should produce comparable groups.
Selection bias (biased allocation to interventions) due to inadequate generation of a randomised sequence.
Allocation concealment Describe the method used to conceal the allocation sequence in sufficient detail to determine whether intervention allocations could have been foreseen in advance of, or during, enrolment.
Selection bias (biased allocation to interventions) due to inadequate concealment of allocations prior to assignment.
Performance bias
Blinding of participants and personnel Assessments should be made for each main outcome (or class of outcomes).
Describe all measures used, if any, to blind study participants and personnel from knowledge of which intervention a participant received. Provide any information relating to whether the intended blinding was effective.
Performance bias due to knowledge of the allocated interventions by participants and personnel during the study.
Detection bias
Blinding of outcome assessment Assessments should be made for each main outcome (or class of outcomes).
Describe all measures used, if any, to blind outcome assessors from knowledge of which intervention a participant received. Provide any information relating to whether the intended blinding was effective.
Detection bias due to knowledge of the allocated interventions by outcome assessors.
Attrition bias
Incomplete outcome data Assessments should be made for each main outcome (or class of outcomes).
Describe the completeness of outcome data for each main outcome, including attrition and exclusions from the analysis. State whether attrition and exclusions were reported, the numbers in each intervention group (compared with total randomized participants), reasons for attrition/exclusions where reported, and any re-inclusions in analyses performed by the review authors.
Attrition bias due to amount, nature or handling of incomplete outcome data.
Reporting bias
Selective reporting State how the possibility of selective outcome reporting was examined by the review authors, and what was found.
Reporting bias due to selective outcome reporting.
Other bias.
Other sources of bias State any important concerns about bias not addressed in the other domains in the tool. If particular questions/entries were pre-specified in the review’s protocol, responses should be provided for each question/entry.
Bias due to problems not covered elsewhere in the table.
Higgins JPT, Altman DG, Sterne JAC. Chapter 8: Assessing risk of bias in included studies. In: S HJG, editor. Cochrane Handbook for Systematic Reviews of Interventions Version 510 (updated March
2011). www.cochrane-handbook.org.: The Cochrane Collaboration; 2011.

62
Appendix B: Newcastle Ottawa Scale
NEWCASTLE - OTTAWA QUALITY ASSESSMENT SCALE
COHORT STUDIES
Note: A study can be awarded a maximum of one star for each numbered item within the Selection and Outcome categories. A maximum of two stars can be given for Comparability
Selection
1) Representativeness of the exposed cohort
a) truly representative of the average _______________ (describe) in the community *
b) somewhat representative of the average ______________ in the community *
c) selected group of users eg nurses, volunteers
d) no description of the derivation of the cohort
2) Selection of the non exposed cohort
a) drawn from the same community as the exposed cohort *
b) drawn from a different source
c) no description of the derivation of the non exposed cohort
3) Ascertainment of exposure
a) secure record (eg surgical records) *
b) structured interview *
c) written self report
d) no description
4) Demonstration that outcome of interest was not p resent at start of study
a) yes *
b) no
Comparability
1) Comparability of cohorts on the basis of the des ign or analysis
a) study controls for _____________ (select the most important factor) *
b) study controls for any additional factor * (This criteria could be modified to indicate specific control for a second important factor.)
Outcome
1) Assessment of outcome
a) independent blind assessment *
b) record linkage *
c) self report
d) no description

63
2) Was follow-up long enough for outcomes to occur
a) yes (select an adequate follow up period for outcome of interest) *
b) no
3) Adequacy of follow up of cohorts
a) complete follow up - all subjects accounted for *
b) subjects lost to follow up unlikely to introduce bias - small number lost - > ____ % (select an adequate %) follow up, or description provided of those lost) *
c) follow up rate < ____% (select an adequate %) and no description of those lost
d) no statement
GA Wells, B Shea, D O'Connell, J Peterson, V Welch, M Losos, P Tugwell, The Newcastle-Ottawa Scale (NOS) for assessing the quality of nonrandomised studies in meta-analyses, 2014
http://www.ohri.ca/programs/clinical_epidemiology/oxford.asp
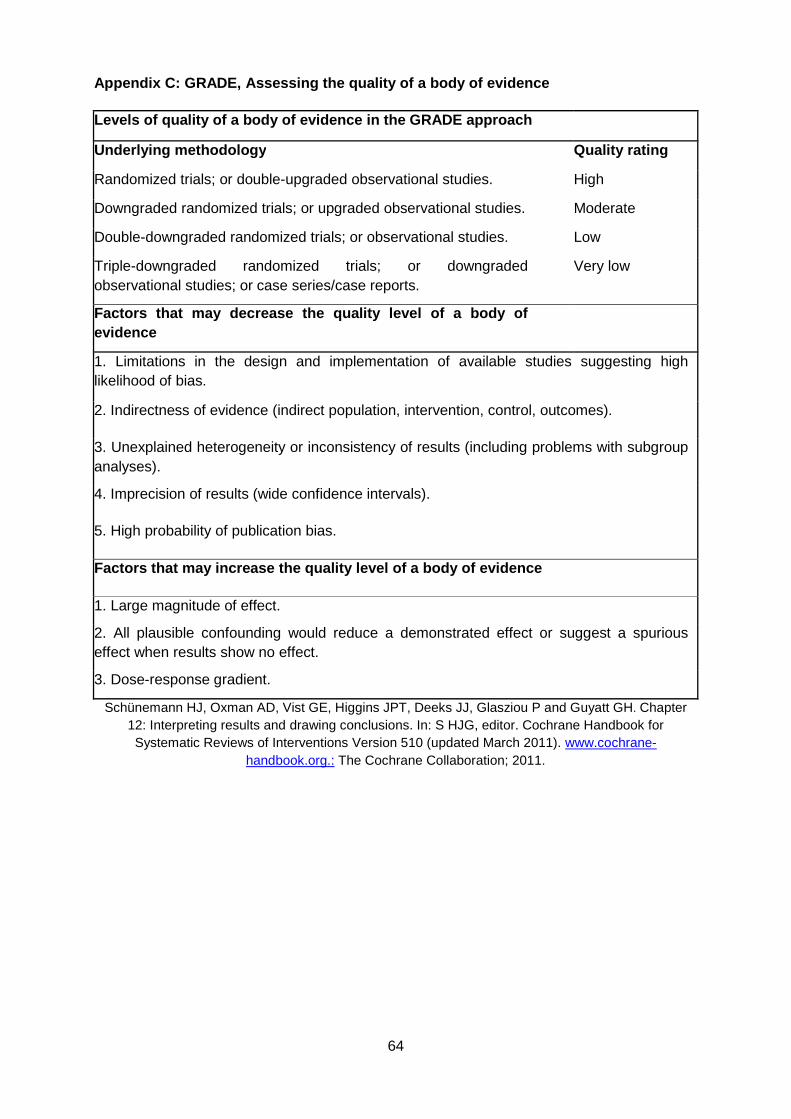
64
Appendix C: GRADE, Assessing the quality of a body of evidence
Levels of quality of a body of evidence in the GRAD E approach
Underlying methodology Quality rating
Randomized trials; or double-upgraded observational studies. High
Downgraded randomized trials; or upgraded observational studies. Moderate
Double-downgraded randomized trials; or observational studies. Low
Triple-downgraded randomized trials; or downgraded observational studies; or case series/case reports.
Very low
Factors that may decrease the quality level of a bo dy of evidence
1. Limitations in the design and implementation of available studies suggesting high likelihood of bias.
2. Indirectness of evidence (indirect population, intervention, control, outcomes).
3. Unexplained heterogeneity or inconsistency of results (including problems with subgroup analyses).
4. Imprecision of results (wide confidence intervals).
5. High probability of publication bias.
Factors that may increase the quality level of a bo dy of evidence
1. Large magnitude of effect.
2. All plausible confounding would reduce a demonstrated effect or suggest a spurious effect when results show no effect.
3. Dose-response gradient.
Schünemann HJ, Oxman AD, Vist GE, Higgins JPT, Deeks JJ, Glasziou P and Guyatt GH. Chapter 12: Interpreting results and drawing conclusions. In: S HJG, editor. Cochrane Handbook for Systematic Reviews of Interventions Version 510 (updated March 2011). www.cochrane-
handbook.org.: The Cochrane Collaboration; 2011.

65
Appendix D: Studiencharakteristika der eingeschloss enen Studien
Alderdice 2005
Methods Studytype: retrospective Cohort-Study (chart-review)
Setting: several maternity units, North Ireland
Recruitment period: 04.2001 - 03.2002
Participants Characteristics
Women according to gestational week at delivery:
week 37 (37+0-6)
n= 208 (neonates = 237)
week 38 (38+0-6)
n= 897 (neonates = 928)
week 39 (39+0-6)
n= 1072 (neonates = 1075)
week 40 (40+0-6)
n= 192 (neonates = 192)
week 41 (41+0-6)
n= 120 (neonates = 121)
Included Patients: 237 / 928 / 1075 / 192 / 121
Analysed Patients: 237 / 928 / 1075 / 192 / 121
Drop outs: -
Women who delivered by ELCS and neonate transmitted to NICU
n= 205
Reasons for ELCS (in %)
repeat CS: 52
maternal request: 24
breech presentation: 21
Interventions elective CS at different gestational weeks at term (37 or 38 or 39 or 40 or 41)

66
Outcomes Neonatal intensive care unit admission
Neonatal outcomes: NICU admission with transient tachypnoea of newborn/respiratory distress syndrome
Notes
CS = Caesarean section; ELCS = Elective caesarean section; NICU = Neonatal intensive care unit;
Bailit 2010
Methods Studytype: retrospective Cohort-Study (chart-review)
Setting: 10 institutions, USA
Recruitment period: 2002 - 2008
Participants Exclusion criteria:
- multiple pregnancy
- nonvertex deliveries
- gestational age 34 weeks or 42 weeks
- foetus with anomaly
- pregnancies complicated by placenta previa or accreta or with a prior uterine scar (cesarean or myomectomy)
- missing onset of labor data
Characteristics
Women with singleton pregnancy:
all (week 34 - 42):
n= 3959
Maternal age (in years): 30.1, SD: 6.6
delivery BMI: 34.1, SD: 7.6
Ethnicity (in %):
Caucasian(white/non-hispanic): 51.0
Black/non-hispanic: 21.2
Hispanic: 16.7

67
Asian/Pacific islander: 4.8
other: 6.3
Nulliparous (in %): 63.9
Interventions elective CS at different gestational weeks at term (37 or 38 or 39 or 40 or 41 or 42)
Outcomes Neonatal intensive care unit admission
Neonatal outcomes: asphyxia, ventilation use, sepsis, NICU length of stay
Maternal outcomes: hyterectomy
Notes
BMI = Body mass index; CS = Caesarea section; NICU= Neonatal intensive care unit; SD = Standard deviation
Chiossi 2013
Methods Studytype: retrospective analysis of prospective Cohort-Study
Setting: 19 academic centers, USA
Recruitment period: 1999-2002
Participants Exclusion criteria:
- multiple pregnancy
- women in early labor undergoing repeated cesarean delivery
- foetus with major congenital anomaly
- women whose ulimate choice of a type of delivery could not be reasonably classified
- infant <500g
Characteristics
Women with singleton pregnancy and prior cesarean section according to gestational week at delivery:
week 37 (37+0-6)

68
n= 1,296
Maternal age (years): 30.6, SD: 5.6
delivery BMI: 34.1, SD: 7.6
Ethnicity (i%):
Caucasian: 48.1
Black: 22.3
Hispanic: 24.3
other: 5.3
Married (%): 68.4
Payer (%):
Medicaid or none: 48.7
other: 51.3
Smoker (%): 11.9
Prior CS (%):
1: 54.6
2: 32.3
3 or more: 13.1
Maternal disease* (%): 35.1
week 38 (38+0-6)
n= 4,601
Maternal age (years): 30.6, SD: 5.4
delivery BMI: 33.2, SD: 6.9
Ethnicity (in %):
Caucasian: 53.7
Black: 18.5
Hispanic: 23.2
other: 4.6
Married (%): 72.6

69
Payer (%):
Medicaid or none: 40.0
other: 60.0
Smoker (%): 11.1
Prior CS (%):
1: 61.1
2: 29.7
3 or more: 9.2
Maternal disease* (%): 23.8
week 39 (39+0-6)
n= 6,941
Maternal age (years): 29.8, SD: 5.4
delivery BMI: 33.6, SD: 6.9
Ethnicity (%):
Caucasian: 44.6
Black: 21.3
Hispanic: 29.8
other: 4.3
Married (%): 65.2
Payer (%):
Medicaid or none: 50.8
other: 49.2
Smoker (%): 12.7
Prior CS (%):
1: 60.5
2: 31.8
3 or more: 7.7
Maternal disease* (%): 19.9

70
week 40 (40+0-6)
n= 1,492
Maternal age (years): 28.7, SD: 5.8
delivery BMI: 33.8, SD: 6.7
Ethnicity (%):
Caucasian: 32.9
Black: 25.9
Hispanic: 36.2
other: 5.0
Married: 57.6
Payer:
Medicaid or none: 62.7
other: 37.3
Smoker (%): 12.2
Prior CS:
1: 72.6
2: 22.2
3 or more: 5.2
Maternal disease*: 13.8
week 41 (41+0-6)
n= 535
Maternal age (years): 28.1, SD: 5.9
delivery BMI: 34.5, SD: 6.6
Ethnicity (%):
Caucasian: 23.7
Black: 25.8
Hispanic: 44.3
other: 6.2

71
Married (%): 53.1
Payer (%):
Medicaid or none: 76.3
other: 23.7
Smoker (%): 10.1
Prior CS %):
1: 80.6
2: 16.4
3 or more: 3.0
Maternal disease* (%): 10.1
Included Patients: 1,296 / 4,601 / 6,941 / 1,492 / 535
Analysed Patients: 1,296 / 4,601 / 6,941 / 1,492 / 535
Drop outs: -
Interventions elective CS at different gestational weeks at term (37 or 38 or 39 or 40 or 41)
Outcomes Neonatal intensive care unit admission
Neonatal outcomes: death, respiratory distress syndrome, transient tachypnea, sepsis, seizure, 5min Apgar score 3 or less
Maternal outcomes: death, blood transfusion, composite outcome (including death, pulmonary edema, cesarean hysterectomy, pelva or abdominal abscess, deep vein thrombosis/pulmonary embolism, pneumonia, blood transfusion)
Notes * Asthma, diabetes, pregestational chronic hypertension with medication, seizure disorder, thyroid disease, renal disease, connective tissue disease
maternal outcomes reported
BMI = Body mass index; CS = Caesarean section; SD = Standard deviation

72
Clark 2009
Methods Studytype: Prospective observational study
Setting: 27 hospitals within the Hospital Corporation of America system
Recruitment period: 01.05.2007 - 31.07.2007
Participants Exclusion critera:
-delivery before gestation age 37
Characteristics
Women according to gestational week at delivery:
Weeek 37 (37+0-6)
Elective repeat ceasareans: 105
Elective primary ceasareans: 24
Week 38 (38+0-6)
Elective repeat cesarean: 696
Elective primary cesarean: 97
Week 39+
Elective repeat cesarean: 776
Elective primary cesarean: 153
Interventions elective CS at different gestational weeks at term (37 or 38 or 39)
Outcomes Neonatal intensive care unit admission
Neonatal Outcomes: weight of newborn, initial or subsequent admission to a newborn special care unit (defined as any unit other thanthe normal newborn unit), and length of newborn stay in the special care unit
Maternal Outcomes: initial cervical dilatation, initial blood pressure for women with hypertensive disease as the indication for delivery, agent used for induction, length of labor, route of delivery
Notes
CS = Caesarean section

73
Doan 2014
Methods Studytype: retrospective Cohort-Study (chart-review)
Setting: Mater Mothers’ Hospitals, Australia Queensland
Recruitment period: 1998-2009
Participants Exclusion criteria:
- multiple pregnancy
- women with pregnancy conditions (HIV/AIDS, autoimmune disease, hypertension, diabetes)
- neonates with congenital anomalies and stillbirths
Characteristics
Women according to gestational week at delivery:
week 37-38 (37 - 38+0-6)
n= 8657
Maternal age (in years): 32.8
delivery BMI (in %):
Underweight (<18.5 kg/m2): 4.97 Normal (18.5–24.9 kg/m2): 52.64
Overweight (25–29.9 kg/m2): 20.68 Obese (≥30 kg/m2): 13.85 Unknown: 7.87
Ethnicity (in %):
Caucasian: 91.31
Indigenous: 0.66 Asian: 4.89 Other: 3.14
Marital status (in %):
Married/living together: 95.82
Single: 3.12 Seperated/Divorced/Widowed: 1.05
Socio-economic status (in %):
Quintile 1: 5.59 Quintile 2: 2.58

74
Quintile 3: 7.72 Quintile 4: 28.72
Quintile 5: 55.40
Private insurance (in %): 75.87
Smoker (in %): 7.21
Nulliparous (in %): 29.28
Primary CS (in %): 45.82
Indication for CS (in %):
Fetal: 1.64 Abnormal presentation: 11.40 Previous CS: 53.77 Previous poor obstetric history: 1.33 Obstetric complication: 7.18 Maternal request: 14.49
Maternal comorbidity: 6.86 Unknown: 0.09 Other: 3.23
Assisted reproductive technology (in %): 9.8
General anesthesia (in %): 2.24
Baby gender male (in %): 51.62
Birth weight (in g): 3350
week 39-41 (39 - 41+0-6)
n= 5790
Maternal age (in years): 32.2
delivery BMI (in %):
Underweight (<18.5 kg/m2): 4.3 Normal (18.5–24.9 kg/m2): 53.49
Overweight (25–29.9 kg/m2): 20.45 Obese (≥30 kg/m2): 13.16 Unknown: 8.60
Ethnicity (in %):
Caucasian: 89.34
Indigenous: 1.09 Asian: 5.51

75
Other: 4.06
Marital status (in %):
Married/living together: 94.46
Single: 4.72 Seperated/Divorced/Widowed: 0.82
Socio-economic status (in %):
Quintile 1: 5.98 Quintile 2: 2.09 Quintile 3: 7.95 Quintile 4: 28.62
Quintile 5: 55.35
Private insurance (in %): 64.37
Smoker (in %): 8.49
Nulliparous (in %): 32.83
Primary CS (in %): 46.93
Indication for CS (in %):
Fetal: 1.02 Abnormal presentation: 15.08 Previous CS: 52.68 Previous poor obstetric history: 1.23 Obstetric complication: 5.98 Maternal request: 14.75
Maternal comorbidity: 4.87 Unknown: 0.03 Other: 4.37
Assisted reproductive technology (in %): 6.61
General anesthesia (in %): 1.43
Baby gender male (in %): 50.52
Birth weight (in g): 3539
Included Patients: 8657/5790
Analysed Patients: 8657/5790
Drop outs: -
Interventions elective CS at different gestational weeks at term (37 + 38 or

76
39 - 41)
Outcomes Neonatal intensive care unit admission (NCCU Neonat al critical care unit) ≥1day
Neonatal outcomes: death, respiratory distress syndrome, transient tachypnea, pneumothorax, jaundice requiring phototherapy, hypoglycaemia, 5min Apgar score <7, , resuscitation (positive pressure ventilation, cardiac compression/ resusciation drugs), serious respiratory morbidity (admission to the Neonatal Critical Care Unit (NCCU), either intensive or special care, with respiratory morbidity and receiving assisted ventilation via mechanical ventilation and/or CPAP for ≥4 h), birth weight
Notes
AIDS = Acquired immunodeficiency syndrome; BMI = Body mass index; CPAP = Continuous positive airway pressure; CS = Caesarean section; HIV = human immunodeficiency virus
Farchi 2010
Methods Studytype: retrospective Cohort-Study (chart-review)
Setting: several hospitals, Italy Lazio region
Recruitment period: 2003-2005
Participants Exclusion criteria:
- women with chronic and pregnancy-related diseases
- neonates with congenital anomalies and intrauterine fetal growth retardation
Characteristics
Women with prior CS according to gestational week at delivery:
week 37 (37+0-6)
n= 2139
week 38 (38+0-6)
n= 7467
week 39 (39+0-6)
n= 672
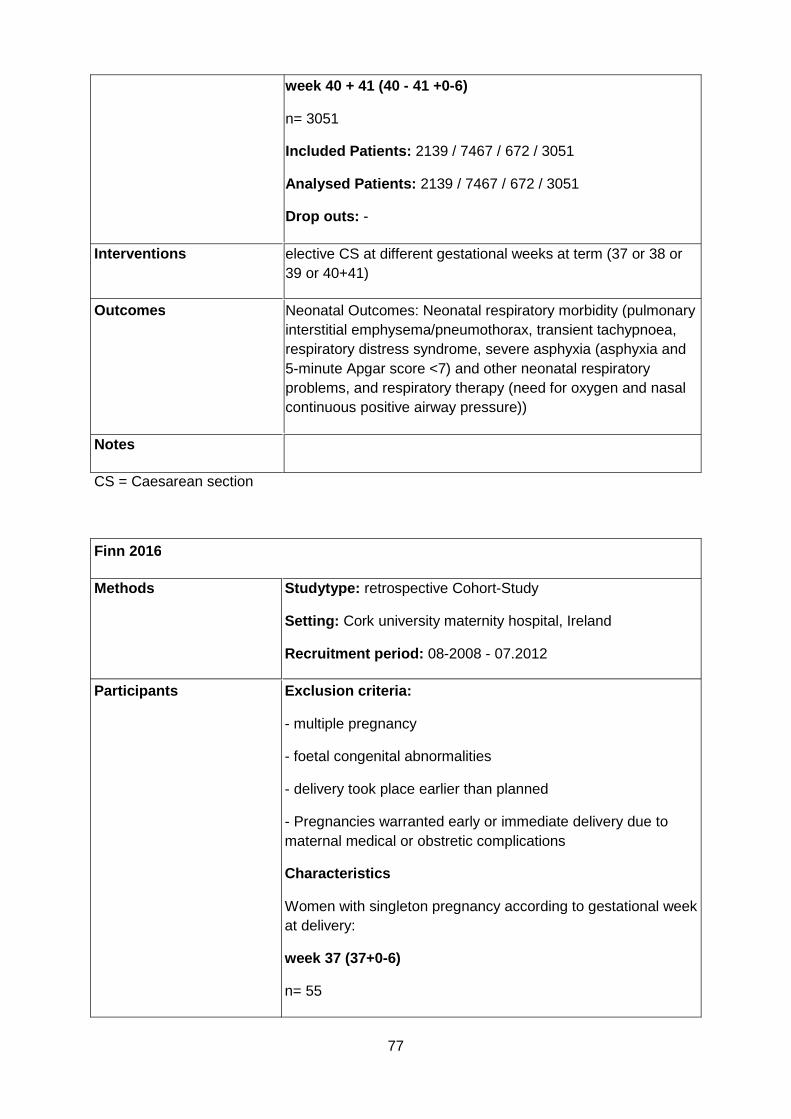
77
week 40 + 41 (40 - 41 +0-6)
n= 3051
Included Patients: 2139 / 7467 / 672 / 3051
Analysed Patients: 2139 / 7467 / 672 / 3051
Drop outs: -
Interventions elective CS at different gestational weeks at term (37 or 38 or 39 or 40+41)
Outcomes Neonatal Outcomes: Neonatal respiratory morbidity (pulmonary interstitial emphysema/pneumothorax, transient tachypnoea, respiratory distress syndrome, severe asphyxia (asphyxia and 5-minute Apgar score <7) and other neonatal respiratory problems, and respiratory therapy (need for oxygen and nasal continuous positive airway pressure))
Notes
CS = Caesarean section
Finn 2016
Methods Studytype: retrospective Cohort-Study
Setting: Cork university maternity hospital, Ireland
Recruitment period: 08-2008 - 07.2012
Participants Exclusion criteria:
- multiple pregnancy
- foetal congenital abnormalities
- delivery took place earlier than planned
- Pregnancies warranted early or immediate delivery due to maternal medical or obstretic complications
Characteristics
Women with singleton pregnancy according to gestational week at delivery:
week 37 (37+0-6)
n= 55

78
Maternal age (in years): 33.1, SD: 4.5
Private health insurance (in %): 41.8
Parity (in %):
0: 12.7
1: 38.2
2: 25.5
3 or more: 23.6
Infant sex (male in %): 45.5
Birth weight (in g): 3034, SD: 419
Apgar score 1 min: median 9 range 3
Apgar score 5 min: median 10 range 1
Age at admission to NICU (in h): 13.8 +/- 32.9
Indication for CS (in %)*:
Previous CS: 67.3
Prior obstetic complication: 7.3
Transverse lie: 25.5
Maternal disease**: 10.9
Maternal request: 0
Macrosomia (>4.5kg): 0
week 38 (38+0-6)
n= 576
Maternal age (in years): 34.5, SD: 4.6
Private health insurance (in %): 53.3
Parity (in %):
0: 12.3
1: 37.5
2: 30.2
3 or more: 20.0

79
Infant sex (male in %): 46.4
Birth weight (in g): 3370, SD: 465
Apgar score 1 min: median 9 range 7
Apgar score 5 min: median 10 range 3
Age at admission to NICU (in h): 20.0 +/- 30.2
Indication for CS (in %)*:
Previous CS: 76.7
Prior obstetic complication: 3.1
Transverse lie: 11.8
Maternal disease**: 7.8
Maternal request: 1.2
Macrosomia (>4.5kg): 0
week 39 (39+0-6)
n= 2872
Maternal age (in years): 33.6, SD: 4.5
Private health insurance (in %): 43.0
Parity (in %):
0: 14.8
1: 46.2
2: 28.3
3 or more: 10.7
Infant sex (male in %): 50.9
Birth weight (in g): 3549, SD: 430
Apgar score 1 min: median 9 range 9 Apgar score 5 min: median 10 range 5
Age at admission to NICU (in h): 21.8 +/- 32.6
Indication for CS (in %)*:
Previous CS: 74.6
Prior obstetic complication: 4.6

80
Transverse lie: 17.2
Maternal disease**: 2.7
Maternal request: 1.2
Macrosomia (>4.5kg): 0.6
week 40 (40+0-6)
n= 503
Maternal age (in years): 33.2, SD: 4.6
Private health insurance (in %): 37.8
Parity (in %):
0: 17.3
1: 56.3
2: 20.1
3 or more: 6.3
Infant sex (male in %): 51.1
Birth weight (in g): 3640, SD: 443
Apgar score 1 min: median 9 range 7
Apgar score 5 min: median 10 range 2
Age at admission to NICU (in h): 24.5 +/- 36.8
Indication for CS (in %)*:
Previous CS: 73.0
Prior obstetic complication: 3.0
Transverse lie: 18.3
Maternal disease**: 2.2
Maternal request: 1.0
Macrosomia (>4.5kg): 1.6
week 41 (41+0-6)
n= 236
Maternal age (in years): 32.6, SD: 4.6

81
Private health insurance (in %): 27.1
Parity (in %):
0: 8.1
1: 80.1
2: 10.6
3 or more: 1.2
Infant sex (male in %): 52.1
Birth weight (in g): 3903, SD: 485
Apgar score 1 min: median 9 range 4
Apgar score 1 min: median 10 range 1
Age at admission to NICU (in h): 23.4 +/- 23.7
Indication for CS (in %)*:
Previous CS: 86.4
Prior obstetic complication: 1.3
Transverse lie: 9.31
Maternal disease**: 0.4
Maternal request: 0.0
Macrosomia (>4.5kg): 2.1
Included Patients: 55 / 576 / 2872 / 503 / 236
Analysed Patients: 55 / 576 / 2872 / 503 / 236
Drop outs: -
Interventions elective CS at different gestational weeks at term (37 or 38 or 39 or 40 or 41)
Outcomes Neonatal intensive care unit admission,
Neonatal outcomes: length of stay in NICU ≥2d, respiratory distress syndrome, transient tachypnea, composite outcome (hypoglycaemia, jaundice, sepsis, 1min Apgar score <7), antibiotics received
And all as a composite
birth weight

82
Notes *More than one indication possible
** placenta praevia, back/pelvis problems and fibroids
respiratory distress syndrome, transient tachypnea, mechanical ventilation, CPAP reported as one (respiratory outcome)
hypoglycaemia, jaundice, sepsis, 1min Apgar score <7 reported as one (other outcome)
CS = Caesarean section; CPAP = Continuous positive airway pressure; NICU = Neonatal intensive care unit; SD = Standard deviation
Gawlik 2015
Methods Studytype: retrospective Cohort-Study (Chart-review)
Setting: Heidelberg University Hospital, Germany
Recruitment period: 01.2006 - 12.2011
Participants Exclusion criteria:
- multiple pregnancy
- foetus with major congenital anomaly
- women with other medical or obstretical conditions that would warrant early or immediate delivery or influence foetal post-partum performance
- pre-gestational diabetes
- women with onset of labor
Characteristics
Women with singleton pregnancy and prior casarean section according to gestational week at delivery:
week 37 (37+0-6)
n= 226
Maternal age (in years): 32.88, SD: 5.49
week 38-41 (41+0-6)
n =277
Maternal age (in years): 33.5, SD: 5.1

83
Drop -Outs : n=14 excluded because of missing values
Interventions elective CS at different gestational weeks at term (37 or 38-41)
Outcomes Neonatal intensive care unit admission,
Neonatal Outcomes: birth weight, Apgar Score at 1', 5' and 10'
Notes
SD = Standard deviation; CS = Caesarean sectio
Glavind 2013
Methods Studytype: RCT (open-label)
Setting: Seven hospitals with neonatal department, Denmark
Recruitment period: 03.2009 - 06.2011
Participants Exclusion criteria:
- Multiple pregnancy
- age < 18 years
- language difficulties requiering interpreter
- estimated risk of CS being undertaken before 39+5 weeks
- Women with: placenta praevia, high blood pressure, elevated level of liver enzymes, type 1 diabetes/gestational diabetes
- any fetal condition warranting delivery before 39+5 weeks
Characteristics
Women with singleton pregnancy according to gestational week at delivery:
week 38 (38+1-38+5)
n= 636
Maternal age (in years): 32.1, SD: 4.4
BMI ≥ 30 (in %): 16.8
Smoker (in %): 10
Nulliparous (in %): 19.8

84
Previous CS (in %):
0: 39.8
≥1: 60.2
Previous VB (in %):
0: 67.0
≥1: 33.0
Indication for CS (in %)*:
≥2 Previous CS: 20.1
Transverse lie: 17.9
Maternal disease**: 8.5
Previously complicated birth: 12.3
Maternal request: 41.2
week 39 (38+6-39+5)
n= 638
Maternal age (in years): 31.6, SD: 4.6
BMI ≥ 30 (in %): 17.4
Smoker (in %): 13
Nulliparous (in %): 18.3
Previous CS (in %):
0: 40.0
≥1: 60.0
Previous VB (in %):
0: 66.0
≥1: 34.0
Indication for CS (in %)*:
≥2 Previous CS: 16.0
Transverse lie: 14.1
Maternal disease**: 8.9
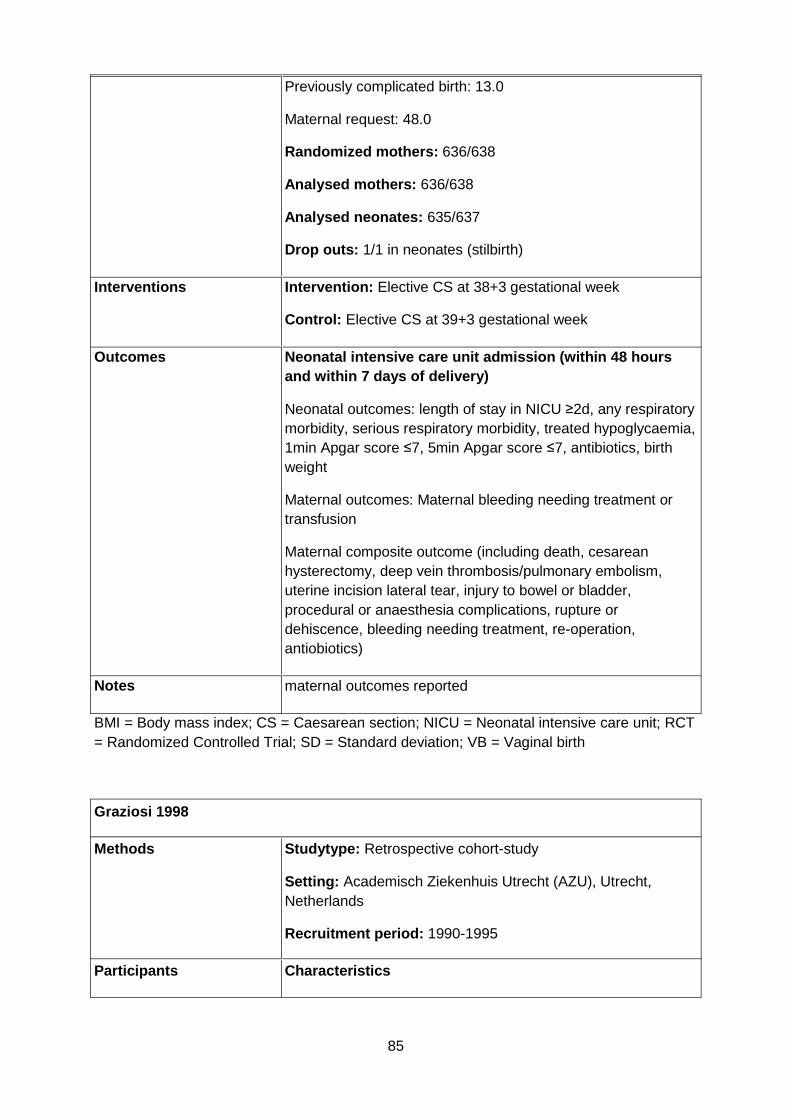
85
Previously complicated birth: 13.0
Maternal request: 48.0
Randomized mothers: 636/638
Analysed mothers: 636/638
Analysed neonates: 635/637
Drop outs: 1/1 in neonates (stilbirth)
Interventions Intervention: Elective CS at 38+3 gestational week
Control: Elective CS at 39+3 gestational week
Outcomes Neonatal intensive care unit admission (within 48 hours and within 7 days of delivery)
Neonatal outcomes: length of stay in NICU ≥2d, any respiratory morbidity, serious respiratory morbidity, treated hypoglycaemia, 1min Apgar score ≤7, 5min Apgar score ≤7, antibiotics, birth weight
Maternal outcomes: Maternal bleeding needing treatment or transfusion
Maternal composite outcome (including death, cesarean hysterectomy, deep vein thrombosis/pulmonary embolism, uterine incision lateral tear, injury to bowel or bladder, procedural or anaesthesia complications, rupture or dehiscence, bleeding needing treatment, re-operation, antiobiotics)
Notes maternal outcomes reported
BMI = Body mass index; CS = Caesarean section; NICU = Neonatal intensive care unit; RCT = Randomized Controlled Trial; SD = Standard deviation; VB = Vaginal birth
Graziosi 1998
Methods Studytype: Retrospective cohort-study
Setting: Academisch Ziekenhuis Utrecht (AZU), Utrecht, Netherlands
Recruitment period: 1990-1995
Participants Characteristics

86
Exclusion criteria:
- complications: preeclampsia, fetal distress, bleeding placenta previa, congenital anomalies and maternal diseases such as diabetes.
- the Caesarean section so could have taken place without problems at any desired time in the full-term periods.
Time of Elective caesarean section:
< 39 weeks: 137 (50%)
≥ 39 weeks: 135 (50%)
Reason for elective cesarean section; < 39 weeks vs. ≥ 39 weeks [n]:
Breech presentation: 31/ 29 repeated caesarean section: 24/ 25 obstetric prehistory: 24/ 25 cephalopelvine disproportion: 19/ 22 illness of the mother: 8/ 9 placenta previa: 9/ 5 fetal transverse position: 4/2 others: 18/18
Included Patients: 272
Analysed Patients: 272
Drop outs: -
Interventions elective CS at different gestational weeks at term (37, 38, 39, 40 ≥41)
Outcomes Neonatal intensive Care Unit Admission:
Neonatal Outcomes: Neonatal morbitity (respiratory morbidity, phototherapy) is defined as morbidity that required NICU admission. Therefore we used the sum of these two outcomes as number of NICU admissions
Respiratory morbidity, Phototherapy, days spent in NICU
Notes
CS = Caesarean section NICU = Neonatal intensive care unit
Hansen 2008

87
Methods Studytype: prospective Cohort-Study (Chart-review)
Setting: Aarhus University hospital, Denmark
Recruitment period: 01.1998 - 12.2006
Participants Exclusion criteria:
- Multiple pregnancy
- Pregnancies associated with intrauterine growth retardation, diabetes, pre-eclampsia, hypertension
- neonates with congenital malformations
Characteristics
Women with singleton pregnancy at delivery:
Maternal age <35y (in %): 83.1
BMI (in %)
BMI <24: 59.2
BMI ≥ 25: 21,54
Missing: 18.26
Delivered by CS (in %): 7.8
Smoker (>0 cigarettes/day in %): 10.24
Missing: 18.98 Alcohol intake in pregnancy (>1 units/week in %): 11.59 Missing: 20.44 Parity (in %): 0: 48.67 ≥1: 51.31 Marital status (in %): Married/living together: 74.67
Single: 2.8 Missing: 22.53 No of years of schooling (in %): ≥10: 71.28 <10: 5.75 Missing: 22.97
Elective CS:
Included Patients: 261 / 1173 / 1074 / 132 / 47
Analysed Patients: 261 / 1173 / 1074 / 132 / 47

88
Drop outs: -
Interventions elective CS at different gestational weeks at term (37 or 38 or 39 or 40 or 41)
Outcomes Neonatal Outcomes: Neonatal respiratory morbidity (any respiratory distress, transient tachypnoea, persistent pulmonary hypertension), serious respiratory morbidity (≥3 days continuous oxygen supplimentation, nasal CPAP, any period of mechanical ventilation)
Notes
BMI = Body mass index; CPAP = Continuous positive airway pressure; CS = Caesarean section
Many 2006
Methods Studytype: Prospective Cohort-Study
Setting: Tel Aviv, Israel
Recruitment period: -
Participants Exclusion criteria:
- Multiple pregnancy
- women delivered before or after booked date
- no documentation of first semester ultrasound
Characteristics
Women with singleton pregnancy at delivery:
Maternal age (in years): 32.1, SD:5
Number of children: 1.2, SD:1
Elective CS:
Included Patients: 62 / 128 / 70 / 18
Analysed Patients: 62 / 128 / 70 / 18
Drop outs: -
Interventions elective CS at different gestational weeks at term (38 or 39 or 40 or 41)

89
Outcomes Neonatal Outcomes: Neonatal respiratory morbidity (oxygen supplementation, ventilation, antibiotics)
Notes
CS = Caesarean section; SD = Standard deviation
Matuso 2008
Methods Studytype: prospective Cohort-Study
Setting: Osaka University Hospital, Japan
Recruitment period: 01.1994-12.2005
Participants Exclusion criteria:
Characteristics
Women at delivery:
Reasons for ELCS (in %):
Previous CS: 51.1
Breech presentation: 23.9
Placenta Previa: 11.3
Included Patients: 118 / 224 / 22
Analysed Patients: 103 / 191 / 15
Drop outs: 15 / 33 / 7 (CS done before scheduled date)
Interventions elective CS at different gestational weeks at term (37 or 38 or ≥39)
Outcomes Neonatal outcomes: Respiratory distress syndrome, transient tachycardia of the newborn, neonatal other (including hypocalcemia, transient hyperbilirubinemia, pneumothorax, neonatal infection (antibiotics), transient thrombocytopenia, hypoglycemia
Maternal outcomes: maternal sever ecomplications (including blood loss >2 L, total abdominal hysterectomy, wound dehiscence, severe adhesions, retained gauze, pyelonephritis, deep vein thrombosis, pulmonary edema, postpartum cardiomyopathy, angina attack)

90
Notes maternal outcomes reported
CS = Caesarea section; ELCS = Elective caesarea section
McAlister 2013
Methods Studytype: retrospective Cohort-Study (Secondary analysis)
Setting: 16 hospitals, USA southwest
Recruitment period: 2008-2009
Participants Exclusion criteria:
- Multiple pregnancy
- neonates born <37 and >41 weeks
- neonates with major birth anomalies
Characteristics
Women with singleton pregnancy at delivery:
Maternal age range: 12-55
Ethnicity (in%): White: 23.6
Black: 18.1
Hispanic: 50 Marital status Married(in %): 52.2 Highest education (in %): Graduation Equivalency Diploma/High school: 43 Baccalaureate: 13
Payer (in %): Private: 42
Medicaid: 35.7
Self-pay: 21.8
Elective CS:
Included Patients: 1579 / 2546
Analysed Patients: 1579 / 2546
Drop outs: -

91
Interventions elective CS at different gestational weeks at term (37-38 vs 39-41)
Outcomes Neonatal Intensive Care Unit Admission
Notes
CS = Caesarean section
Melamed 2014
Methods Studytype: retrospective cohort study
Setting: Medical center in Tel Aviv, Israel
Recruitment period: 2010-2011
Participants Exclusion criteria:
-placenta previa -suspected placenta accrete
-maternal cardiac
-renal or lung disease
-major fetal anomalies
-cases scheduled for CS prior to 37+4 weeks
Characteristics:
Women with two ore more cesareans who were scheduled for a repeat planned CS in a single tertiary medical center
Week 38 (37+4 - 38+3)
n = 264
Maternal age (years): 35.0 SD: 3.7
Maternal age (>35 years) (in%): 126 (47.7)
Gravidy (median (interquartile range)): 4 (3-5)
Parity (median (interquartile range)): 2 (2-3)
Scheduled gestational age for planned CS (weeks) (mean, SD): 38.0 SD 0.3
Pregestational diabetes (total (in%)): 7 (2.7)

92
Chronic hypertension (total (in%)): 3(1.1)
Preeclampsia (total (in%)): 8 (3.0)
FGR (510th centile): 3 (1.1)
Number of previous CS (median (interquartile range)): 2 (2-2)
2: 206 (78.0)
3: 51 (19.3)
>3: 7 (2.7)
Week 39 (>= 38+4)
n = 113
Maternal age (years): 35.1 SD: 3.3
Maternal age (>35 years) (in%): 52 (46.0)
Gravidy (median (interquartile range)): 4 (3-5)
Parity (median (interquartile range)): 2 (2-3)
Scheduled gestational age for planned CS (weeks) (mean, SD): 38.9 SD 0.3
Pregestational diabetes (total (in%)): 2 (1.8)
Chronic hypertension (total (in%)): 1 (0.9)
Preeclampsia (total (in%)): 0 (0.0)
FGR (510th centile): 2 (1.8)
Number of previous CS (median (interquartile range)): 2 (2-2)
2: 90 (79.6)
3: 17 (15.0)
>3: 6 (5.3)
Interventions elective CS at different gestational weeks at term (38 or 39)
Outcomes Neonatal Intensive Care Unit Admission
Neonatal Outcomes: Neonatal respiratory morbidity (respiratory distress syndrome (RDS), transient tachypnea of the newborn (TTN), pneumothorax, need for continuous positive airway pressure (CPAP) or mechanical ventilation) and Neonatal composite adverse outcome (perinatal mortality, neonatal respiratory morbidity, 5-min Apgar score55, umbilical cord

93
arterial pH57.0, admission to NICU, birth trauma, infectious morbidity, hypoglycemia or jaundice requiring phototherapy)
Maternal Outcomes: Maternal infectious morbidity (presence of postpartum fever (above 38.0 C, not within the first 24 h after birth), endometritis or any surgical site infection) and Maternal composite adverse outcome (presence any of the following complications: post partum infectious morbidity, general anesthesia, postpartum hemorrhage (defined subjectively by the surgeon or by a decrease of more than 3 g/dL in post-operative hemoglobin levels), intestinal or bladder laceration, dehiscence or rupture of uterine scar, accidental extension of uterine scar, need for inverted-T incision, cesarean hysterectomy, postpartum relaparotomy, complications of surgical scar, paralytic ileus, admission to intensive care unit, venous thromboembolism or hospitalization for more than 5 days)
Notes
CS = Caesarea section; FGR = Fetal growth restriction; SD = Standard deviation
Morrison 1995
Methods Studytype: prospective Cohort-Study
Setting: Rosie Maternity Hospital Cambridge, England
Recruitment period: 01.1985 - 12.1993
Participants Exclusion criteria:
- Infants with any evidence of infection including pneumonia or meconium aspiration syndrome
Characteristics
Deliveries according to gestational week
Elective CS:
Included Patients: 366 / 1063 / 505 / 243 / 164
Analysed Patients: 366 / 1063 / 505 / 243 / 164
Drop outs: -
Interventions elective CS at different gestational weeks at term (37 or 38 or 39 or 40 or ≥41)

94
Outcomes Neonatal Intensive Care Unit Admission with respiratory morbidity (RDS, TTN and oxygen supplimentation)
Notes The diagnosis of neonatal respiratory morbidity was established on the basis of characteristic clinical signs which included grunting, nasal flaring, retraction, tachypnoea and poor air entry, the radiographic features of either TTN (Avery et al. 1966) or the reticulogranular pattern of RDS.
CS = Caesarean section; RDS = respiratory distress syndrome; TTN = transient tachypnea of the newborn
Nakashima 2014
Methods Studytype: retrospective Cohort-Study
Setting: 1 hospital, Japan
Recruitment period: 01.2006 - 12.2012
Participants Exclusion criteria:
- Multiple pregnancy
- Pregnancies associated with intrauterine growth retardation, (gestational) diabetes, hypertension, placenta previa, low-lying placenta, placental abruption, other underlying diseases or obstetrical complications
- Prolonged labor, nonreassuring fetal status, premature rupture of membranes or labor onset
- fetal disorders
Characteristics:
Women with singleton pregnancy according to gestational week at delivery:
week 37 (37+0-6)
n = 390
Maternal age (in years, median with 25th/75th quartile): 35 (31-37)
Maternal age ≥35y (in %): 50.5
Nulliparous (in %): 25.1
Previous CS (in %): 70.0

95
Breech presentation (in %): 22.5
History of uterine surgery (in %): 7.5
Newborn birth: 2810 (2580-3024)
With low birth weight (in %): 17.9
Small gestattional age (in %): 4.4
Males (in %): 45.9
5 min Apgar score (median with 25th/75th quartile): 9 (9-10)
week 38 (38+0-6)
n = 294
Maternal age (in years, median with 25th/75th quartile): 34 (31-37)
Maternal age ≥35y (in %): 42.2
Nulliparous (in %): 22.8
Previous CS (in %): 71.5
Breech presentation (in %): 21.0
History of uterine surgery (in %): 7.5
Newborn birth: 2910 (2720-3100)
With low birth weight (%): 8.2
Small gestattional age (%): 5.1
Males (%): 43.5
5 min Apgar score (median with 25th/75th quartile): 10 (9-10)
Included Patients: 390 / 294
Analysed Patients: 390 / 294
Drop outs: -
Interventions elective CS at different gestational weeks at term (37 vs 38)
Outcomes Neonatal intensive care unit admission
Neonatal outcomes: any respiratory morbidity (e.g. tachypnea, retractions, grunting, cyanosis), assisted ventilation (CPAP), oxygen supplementation ≥24 h, hypoglycaemia, 5min Apgar score, antibiotics, sepsis, hyperbilirubinemia, birth weight

96
Notes
CPAP = Continuous positive airway pressure; CS = Caesarea section
Nir 2012
Methods Studytype: retrospective Cohort-Study (Chart-review)
Setting: 1 secondary medical center, Israel
Recruitment period: 2007 - 2009
Participants Exclusion criteria:
- Multiple pregnancy
- Pregnancies associated with maternal illness (e.g. preeclampsia), intrauterine growth retardation, gestational diabetes, placenta previa
- Neonates with congenital defect
- active delivery
- newborns born before completion of 37 weeks
Characteristics
Women with singleton pregnancy according to gestational week at delivery:
week 37-38 (38+0-6)
n = 596
week ≥39
n = 454
Included Patients: 596 / 454
Analysed Patients: 596 / 454
Drop outs: -
Interventions elective CS at different gestational weeks at term (37-38 vs ≥39)
Outcomes Neonatal intensive care unit admission (including low Apgar score, hypoglcaemia, dehydration, dyspnoea, jaundice, other)
Apgar Score at 1 and 5 minutes, length of stay

97
Notes The departments policy is that the nurses decide whether to measure the infants’ bilirubin levels. It emerged that they were measured more often among the newborns after the 37–38 weeks’ subgroup (36% vs. 29%, p = 0.023), but there was no difference in the mean bilirubin level between the two subgroups.
CS = Caesarea section
Parikh 2014
Methods Study type: retrospective cohort study
Setting: several clinics, USA
Recruitment period : 2008-2011
Participants Exclusion: :
multiple pregnancies
Characteristics:
Women with singleton pregnancy according to gestational week at delivery:
Maternal
37 weeks
n=553
Maternal age (in years): 32.4, SD: 5.3
Multiparous (in %): 93.5
Married (in %):82.5
Smoker (in %):1.8
BMI>=30 (in %): 33.6
Prenatal care during 1st trimester (in %): 97.8
38 weeks
n=3971
Maternal age (in years): 31.8, SD: 4.9
Multiparous (in %): 94.4

98
Married (in %): 86.8
Smoker (in %): 2.5
BMI>=30 (in %): 29.9
Prenatal care during 1st trimester (in %): 98.2
≥39 weeks
n=10089
Maternal age (in years): 32.0, SD: 4.8
Multiparous (in %): 92.8
Married (in %): 88.0
Smoker (in %): 1.9
BMI>=30 (in %): 28.8
Prenatal care during 1st trimester (in %): 98.4
2008
n=4164
Maternal age (in years): 31.7, SD: 4.9
Multiparous (in %):93.1
Married (in %):86.5
Smoker (in %):2.4
BMI>=30 (in %):30.3%
Prenatal care during 1st trimester (in %): 98.1
2009
n=4736
Maternal age (in years): 32.1, SD: 4.8
Multiparous (in %): 92.6
Married (in %): 88.2
Smoker (in %): 1.8
BMI>=30 (in %): 28.3
Prenatal care during 1st trimester (in %): 98.4

99
2010
n=3833
Maternal age (in years): 31.9, SD:4.8
Multiparous (in %): 93.9
Married (in %): 88.2
Smoker (in %): 2.0
BMI>=30 (in %): 29.8
Prenatal care during 1st trimester (in %): 98.4
2011
n=1880
Maternal age (in yrs): 31.9, SD: 4.8
Multiparous (in %): 93.7
Married (in %): 86.5
Smoker (in %): 2.1
BMI>=30 (in %): 28.5
Prenatal care during 1st trimester (in %): 98.1
Included patients: 14 613 (34.6%) of all women enrolled in program had scheduled cesarean delivery
Analysed patients: 14 613
Drop outs (reasons): insurance changes precluding the women from program participation or were lost to follow up.
Interventions elective CS at different gestational weeks at term (37 or 38 vs ≥39)
Outcomes Neonatal intensive care unit admission
Neonatal outcomes: neonatal mortality >5 nursery days
Notes Data from Alere health, thus conflict of interest is potentially high.
No absolute numbers given, only % à contact study authors
a geographically dispersed dataset of women enrolled in a pregnancy risk assessment and education program that is sponsored by employers and payers, administered by Alere

100
Inc. Upon enrollment women provide permission for the use of their de-identified personal health information for research and reporting purposes.
BMI = Body mass index; CS = Caesarea section; SD = Standard deviation
Resende 2015
Methods Studytype: retrospective Cohort-Study
Setting: 1 maternity hospital, Portugal
Recruitment period: 2003-2013
Participants Exclusion criteria:
- Multiple pregnancy
- Pregnancies associated with maternal illness (preeclampsia, poorly controlled diabetes mellitus, Rh isoimmunization), intrauterine growth retardation, premature rupture of membranes,
- Neonates with congenital malformations
Characteristics
Women with singleton pregnancy according to gestational week at delivery:
week 37-38 (38+0-6)
n = 1427
Maternal age (in years, median with min and max): 33 (14-46)
Maternal age ≥35y (in %): 35
Nulliparous (in %): 39
Gestational diabetes (in %): 6
Type of care (in %): Private physicians: 52
hospital: 38
health center: 2
health center and hospital: 7
Neonatal male (in %): 48

101
Birth weight (in g, median with min and max): 3170 (2380 - 5145)
<2500g (in %): 5
>4000g (in %): 5
>4500g (in %): 0.3
week 39-41 (41+0-6)
n = 1696
Maternal age (in years, median with min and max): 33 (16-46)
Maternal age ≥35y (in %): 35
Nulliparous (in %): 31
Gestational diabetes (in %): 6
Type of care (in %): Private physicians: 53
hospital: 30
health center: 2
health center and hospital: 13
Neonatal male (in %): 52
Birth weight (in g, median with min and max): 3402 (2420 - 5850)
<2500g (in %): 0.4
>4000g (in %): 9
>4500g (in %): 1
All:
Reasons for CS (in %): Prior CS: 55
Breech position: 28
Fetal-pelvic incompatibility: 6
malformation of the uterus/myomectomy: 1.6
Macrosomy: 1
Maternal diseases (eg HIV+): 8

102
Included Patients: (37 / 38 / 39 / 40 / 41) 323 / 1104 / 1170 / 483 / 43
Analysed Patients: 323 / 1104 / 1170 / 483 / 43
Drop outs: -
Interventions elective CS at different gestational weeks at term (37 or 38 or 39 or 40 or 41)
Outcomes Neonatal intensive care unit admission
Neonatal outcomes: respiratory morbidity (TTN, RDS, oxygen supplimentation, ventilation), hypoglycaemia, 1min Apgar score <5, sepsis, hyperbilirubinemia, resuscitation, birth weight <2500g, hospitalization ≥5 days
Notes
CS = Caesarean section; HIV = human immunodeficiency virus; RDS = respiratory distress syndrome; Rh = Rhesus; TTN = transient tachypnea of the newborn
Terada 2014
Methods Study type : retrospective cohort study
Setting: Japanese Red Cross Katsushika Maternity Hospital
Recruitment period: 2006-2013
Participants Exclusion criteria:
- labor pains; rupture of membranes; perinatal complications, such as pregnancy-induced hypertension, fetal anomalies, and fetal growth restriction (neonatal birth weight less than -1.5 SD of the reference range in Japan); or inaccurate gestational age.
- cesarean sections upon maternal request
Characteristics:
Neonates without respiratory disorders
(n=1810)
Maternal age (in years): 33.8, SD: 4.8
Nulliparity (in %): 26
Indication for CS (in %)

103
- previous CS: 65
- Breech presentation: 12
- placenta previa/low-lying placenta: 6.7
Gestational age at delivery (in weeks): 38.0, SD: 0.6
Neonatal sex male (in %): 51
Neonatal birth weight (in g): 2815, SD: 341
Apgar score at 1 minute <7 (in %): 1
Umbilical artery pH<7.1 (in %): 0.7
Neonates with respiratory disorders
(=141)
Maternal age (in years): 34.0, SD: 4.9
Nulliparity (in %): 23
Indication for CS (in %)
- previous CS: 70
- Breech presentation: 15
- placenta previa/low-lying placenta: 4.39
Gestational age at delivery (in weeks): 37.7, SD: 0.4
Neonatal sex male (in %):59
Neonatal birth weight (in g): 2757 SD: 358
Apgar score at 1 minute <7 (in %): 2.8
Umbilical artery pH<7.1 (%): 0
Included patients: (37 / 38 / 39-40 / 41) 892 / 896 / 105 / 43
Analysed patients: 892 / 896 / 105 / 43
Drop outs (reasons): -
Interventions Elective CS at different gestational weeks at term (37, 38, 39-40, 41)
Outcomes Neonatal outcomes: neonatal respiratory disorders (such as respiratory distress syndrome and transient tachypnea of the neonate requiring oxygen supplementation or respiratory support, such as intermittent mandatory ventilation and

104
continuous positive airway pressure
Notes Diagnoses were made by neonatologists with clinical and radiology data and the exclusion of other causes of respiratory distress
CS = Caesarea section; SD = Standard deviation
Tita 2009
Methods Study type : retrospective cohort study
Setting : 19 academic centers, USA
Recruitment period : 1996-2006
Participants Exclusion:
- multiple gestations
- fetus with a major congenital anomaly
- women with other medical or obstetrical conditions that would warrant early or immediate delivery.
Characteristics :
Maternal:
Week 37
N=834
Mean age (SD): 30,4 (5,5)
BMI at delivery (SD): 32,8 (7,3)
Ethnicity (in %)
Black: 19,18
White: 51.2
Hispanic: 24,1
Other ethnicity: 5,52
Married (in %): 68,82
Medicaid coverage (in %): 46,76
Private insurance (in %): 53,24
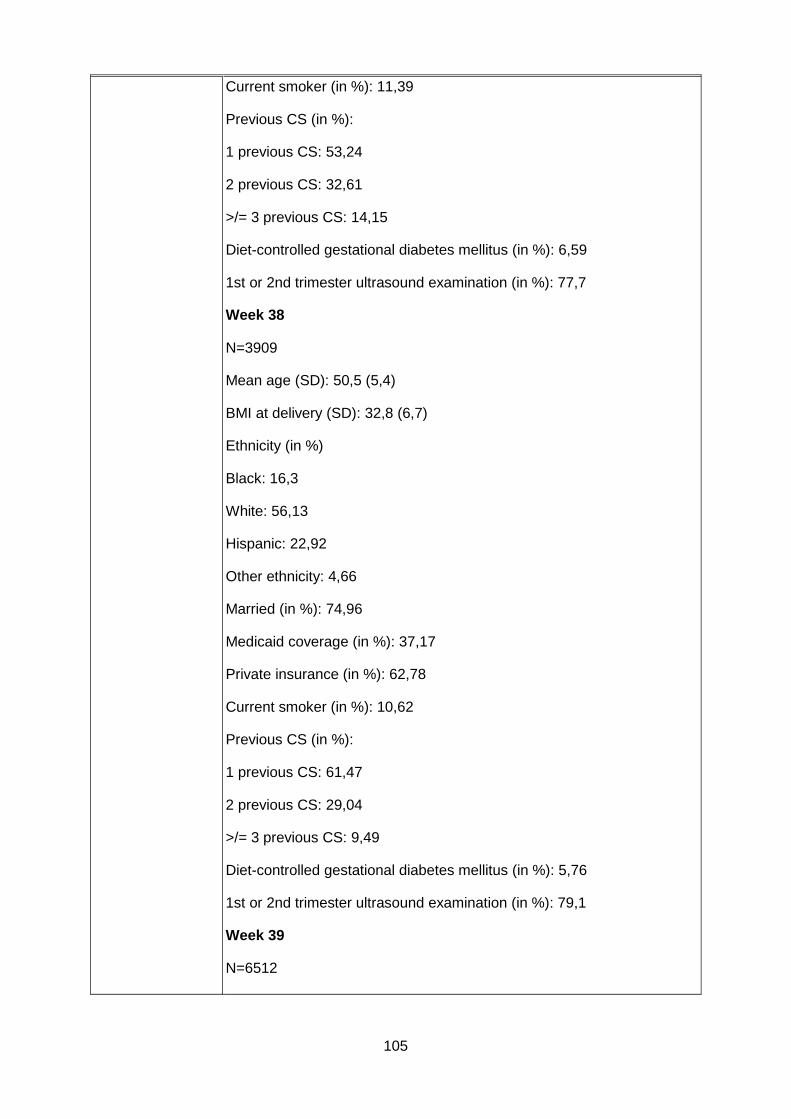
105
Current smoker (in %): 11,39
Previous CS (in %):
1 previous CS: 53,24
2 previous CS: 32,61
>/= 3 previous CS: 14,15
Diet-controlled gestational diabetes mellitus (in %): 6,59
1st or 2nd trimester ultrasound examination (in %): 77,7
Week 38
N=3909
Mean age (SD): 50,5 (5,4)
BMI at delivery (SD): 32,8 (6,7)
Ethnicity (in %)
Black: 16,3
White: 56,13
Hispanic: 22,92
Other ethnicity: 4,66
Married (in %): 74,96
Medicaid coverage (in %): 37,17
Private insurance (in %): 62,78
Current smoker (in %): 10,62
Previous CS (in %):
1 previous CS: 61,47
2 previous CS: 29,04
>/= 3 previous CS: 9,49
Diet-controlled gestational diabetes mellitus (in %): 5,76
1st or 2nd trimester ultrasound examination (in %): 79,1
Week 39
N=6512

106
Mean age (SD): 29,8 (5,6)
BMI at delivery (SD): 33,4 (6,7)
Ethnicity (in %)
Black: 19,84
White: 45,38
Hispanic: 30,57
Other ethnicity: 4,21
Married (in %): 65,89
Medicaid coverage (in %): 50,22
Private insurance (in %): 49,78
Current smoker (in %): 12,2
Previous CS (in %):
1 previous CS: 60,5
2 previous CS: 31,79
>/= 3 previous CS: 7,71
Diet-controlled gestational diabetes mellitus (in %): 5,38
1st or 2nd trimester ultrasound examination (in %): 78,82
Week 40
N=1385
Mean age (SD): 28,7 (5,7)
BMI at delivery (SD): 33,8 (6,8)
Ethnicity (in %)
Black: 24,26
White: 34,08
Hispanic: 36,39
Other ethnicity: 5,27
Married (in %): 59,21
Medicaid coverage (in %): 60,94

107
Private insurance (in %): 39,06
Current smoker (in %): 11,7
Previous CS (in %):
1 previous CS: 79,86
2 previous CS: 22,53
>/= 3 previous CS: 4,84
Diet-controlled gestational diabetes mellitus (in %): 3,76
1st or 2nd trimester ultrasound examination (in %): 68,01
Week 41
N=505
Mean age (SD): 27,9 (5,7)
BMI at delivery (SD): 34,5 (6,7)
Ethnicity (in %)
Black: 25,35
White: 23,17
Hispanic: 45,74
Other ethnicity: 5,74
Married (in %): 53,27
Medicaid coverage (in %): 76,83
Private insurance (in %): 23,17
Current smoker (in %): 10,12
Previous CS (in %):
1 previous CS: 80,59
2 previous CS: 16,44
>/= 3 previous CS: 2,97
Diet-controlled gestational diabetes mellitus (in %): 1,39
1st or 2nd trimester ultrasound examination (in %): 60,99
Week >/= 42

108
N=113
Mean age (SD): 27,4 (0,9)
BMI at delivery (SD): 34,6 (7,1)
Ethnicity (in %)
Black: 27,43
White: 17,7
Hispanic: 46,02
Other ethnicity: 8,85
Married (in %): 46,9
Medicaid coverage (in %): 79,65
Private insurance (in %): 20,35
Current smoker (in %): 8,85
Previous CS (in %):
1 previous CS: 72,57
2 previous CS: 23,01
>/= 3 previous CS: 4,42
Diet-controlled gestational diabetes mellitus (in %): 2,65
1st or 2nd trimester ultrasound examination (in %): 55,75
Neonatal:
Week 37
Male sex (n): 425
Birth weight mean (in g, SD): 3218 (469)
SGA (in %): 12,47
LGA (in %): 25,18
Week 38
Male sex (n): 1966
Birth weight mean (in g, SD): 3418 (447)
SGA (in %): 8,39

109
LGA (in %): 28,79
Week 39
Male sex (n): 3281
Birth weight mean (in g, SD): 3505 (451)
SGA (in %): 11,67
LGA (in %): 27,13
Week 40
Male sex (n): 704
Birth weight mean (in g, SD): 3583 (467)
SGA (in %): 13,35
LGA (in %): 31,53
Week 41
Male sex (n): 270
Birth weight mean (in g, SD): 3714 (473)
SGA (in %): 8,89
LGA (in %): 32,59
Week 42
Male sex (n): 56
Birth weight mean (in g, SD): 3673 (467)
SGA (in %): 3,57
LGA (in %): 33,93
Included patients: (37 / 38 / 39 / 40 / 41 / 42)
number: 834 / 3909 / 6512 / 1385 / 505 / 113
Analysed patients:
Differ according to outcome (i.e. in 38 and 39 weeks they are some missing), see results
The infants were followed up until discharge from the hospital or 120 days after birth, whichever came first.
Drop outs (reasons):

110
Interventions Elective repeat CS at weeks 37, 38, 39, 40, 41, 42
Outcomes hypoglycemia, composite respiratory morbidity, resuscitation, birthweight <=2500g, hospitalisation > 5 days
Notes Same dataset as used in Chiossi 2013, therefore other outcomes not included
SGA: Small for gestational age
LGA: Large for gestational age
BMI = Body mass index; CS = Caesarea section; SD = Standard deviation
Tracy 2007
Methods Study type : retrospective cohort study
Setting : several hospitals, Australia
Recruitment period : 1999-2002
Participants Exclusion criteria :
- younger than 20 or older than 34 years
- multiple pragnancies
- no birth to a live singleton baby of normal size (10th-90th birthweight percentile)
- no presenting in the cephalic position
- not born at term (37-41 wk gestation)
- hypertension or diabetes and pregnancy-induced hypertension or gestational diabetes
Characteristics:
- Characteristics not shown for CS with no labor separately but for all modes of deliveries
Included patients: (37 / 38 / 39 / 40 / 41)
- low risk primiparas 626 / 2742 / 2202 / 1396 / 653
- low risk multiparas 1877 / 17242 / 11555 / 3686 / 1080
Analysed patients : separate analysis of primi- and multiparas
- low risk primiparas 626 / 2742 / 2202 / 1396 / 653

111
- low risk multiparas 1877 / 17242 / 11555 / 3686 / 1080
Drop outs (reasons): All numbers differ through the report without explanation given
Interventions Low risk singleton pregnancies and CS with no labor.
Outcomes Neonatal Intensive Care Unit Admission : the admission to neonatal intensive care refers to admission to any level of neonatal support from a special care nursery to a neonatal inten- sive care unit, where incubators, oxygen therapy, cardiorespiratory monitoring, intravenous fluid therapy, and tube feeding may be routinely offered. The type of neonatal intensive care and complex support varies by category or level of unit in Australia is fully described elsewhere (24).
Notes Study authors contacted for absolute numbers of babies admitted to NICU and total absolute number per gestational week
National Perinatal Data Collection, which is a national database of cross-sectional data on all births collected from each state and territory and validated by the Australian Institute of Health and Welfare
CS = Caesarean sectio; NICU = Neonatal intensive care unit
Vidic 2016
Methods Study type: retrospective cohort study
Setting: Slovenian National Information Perinatal System (NPIS). The NPIS registers all deliveries in Slovenia at 22 weeks of pregnancy or when the fetuses weighs 500 g. Registration is mandatory by law and more than 140 variables are entered immediately postpartum into a computerized database.
Recruitment period: 2002–2012
Participants Exclusion criteria:
- multiple pregnancies
- complicated pregnancies
- no elective cesarean section (defined as abdominal delivery performed before onset of labor after 37 weeks gestation)
- history of any chronic diseases or gestational complications

112
- no clear indication for cesarean section (previous uterine scar or fetal non-cephalic presentation as indication for cesarean section. Cesarean section upon maternal request is not allowed in Slovenia)
Characteristics:
- Age: Mothers who had an elective cesarean before 38 weeks were older than mothers who had an elective cesarean at later in pregnancy (31.5 ± 4.7 years at 38 weeks gestation vs. 30.3 ± 4.4 years at 40 weeks, p<0.05).
- BMI, parity: no difference in BMI and parity between the groups.
- Antenatal course of steroids to enhance lung maturity was administered more often to women who delivered earlier: 28 (8.2%), 55 (3.1%), 24 (0.8%), 21 (1.2%), 7 (1.7%) for births at 37, 38, 39, 40, and 41 weeks, respectively).
Included patients : (37 / 38 / 39 / 40 / ≥41) 343 / 1753 / 3140 / 1718 / 410
Analysed patients: 343 / 1753 / 3140 / 1718 / 410
Drop outs (reasons): -
Interventions Elective CS at 37, 38, 39, 40, and ≥41 weeks
Outcomes Neonatal Intensive Care Unit Admission: hospitalization > 5 days and number of fetal / neonatal deaths
Neonatal outcomes: 5 min Apgar score ≤6, respiratory distress syndrome (tachypnea, grunting, flaring of the nostrils, retractions and need for supplemental oxygen), hypoglycemia (plasma glucose level of less than 1.8 mmol/L in the first 24 h of life and less than 2.5mmol/L thereafter), hyperbilirubinemia (need for phototherapy according to nomograms published by American Academy of Pediatrics [9]),
Notes Slovenian National Information Perinatal System (NPIS). The NPIS registers all deliveries in Slovenia at 22 weeks of pregnancy or when the fetuses weighs 500 g. Registration is mandatory by law and more than 140 variables are entered immediately postpartum into a computerized database.
BMI = Body Mass Index; CS: Caesarean Section; NPIS = National Information Perinatal System

113
Vilchez 2014
Methods Study type: retrospective cohort study (Author claims case series)
Setting: several hospitals, USA
Recruitment period: 2004–2008
Participants Exclusion criteria:
- multiple pregnancy
- no method of delivery repeat cesarean
- multiple pregnancy,
- attempted trial of labor,
- fetal anomalies,
- history of diabetes mellitus, and
- hypertensive disorders including eclampsia.
Characteristics:
86289 (10.99%) were delivered at term (40 weeks), and 699051 (89.01%) were delivered between 36 and 39 weeks, with 413007 delivering between 36–38 weeks (52%).
Regarding maternal race, 101086 (12.87%) mothers were African-American, and 654 028 (83.28%) were Caucasian (whites)
Included patients : 785340
Analysed patients: 785340
Drop outs (reasons): -
Interventions elective repeat CS
Outcomes Neonatal Intensive Care Unit Admission
Neonatal outcomes:
5 min APGAR Score ≤6, surfactant use, antibiotics use, neonatal seizures
Notes Study authors contacted for absolute numbers of outcomes and total n for gestational week
all births registered in the 50 States of the US, the District of

114
Columbia, and New York City. Data are drawn from the Linked Birth–Infant Death Data Files from the Vital Statistics Data of the Center of Disease Control and Prevention (CDC) of the United States from the years 2004-2008.
- ‘‘R’’ states reporting data on ERCD were included for the analysis
CS = Caesarean Section; CSC = Center of Disease Control and Prevention; ERCD = Elective Repeat Caesarean Delivery
Vilchez 2015
Methods Study type: retrospective cohort study
Setting: several hospitals, USA
Recruitment period: 2004–2008
Participants Exclusion criteria:
- multiple pregnancies
- no method of delivery by repeat cesarean
- attempted trial of labor
gestational age at delivery under 37 or over 41
· any reported congenital anomalies and risk factors such as diabetes, chronic hypertension and pregnancy-related hypertensive disorders including eclampsia.
Characteristics:
Maternal:
394 885 Whites (81,8%), 59480 Blacks (12,3%),
2963 American-Indians (0,61%), 25724 Asians (31%)
Neonatal:
51% female, 49% male
Included patients (n): 483,052
Analysed patients: (n) 483,052
Drop outs (n, reasons): -
[S1]how come no hispanics are mentioned here? Vilchez 2015a

115
is on hispanic population
Interventions elective repeat CS at term (weeks 37, 38, 39, 40, 41)
Outcomes Neonatal outcomes: early death (when the demise occures at less than 7 days), neonatal death (less than 28 days) and infant death (less than 1 year)
Notes The Linked Birth–Infant Death Data Files from the Vital Statistics Data of the Center of Disease Control and Prevention (CDC) of the United States
CDC = Center of Disease Control and Prevention; CS = Caesarean Section
Wilmink 2010
Methods Study type: retrospective cohort study
Setting: the Netherlands, data from The Netherlands Perinatal Registry (PRN), hospitals that systematically registered neonatal follow-up.
Recruitment period: Jan. 1,2000, through Dec. 31, 2006
Participants Exclusion criteria:
- no indication for an elective cesarean section (included repeat cesarean section, breech presentation, traumatic first pregnancy, maternal request)
-pregnancies complicated by intrauterine fetal deaths
-emergency cesarean sections
-multiple pregnancies
- fetus with congenital anomalies
-elective cesarean sections after spontaneous rupture of membranes or signs of labor
- mothers with an adverse medical or obstetric history and/or complications of pregnancy that could influence the risk for neonatal morbidity
Characteristics:
Week 37
(n=1734)

116
Maternal
Mean age (mean): 32.1, SD: 4.6
Race/ethnic group (in %):
Western: 91.5
Asian: 1.7
Other: 6.8
Primiparas (in %): 34.3
Socioeconomic status (in %):
Very high: 21.0
High: 21.2
Normal: 19.4
Low: 19.7
Very low: 18.6
Infants
Male (in %): 49.3
Position (in %):
Vertex: 55.2
Breech: 39.7
Other: 5.1
Week 38
(n=10139)
Maternal
Mean age (mean): 31.9, SD: 4.4
Race/ethnic group (in %)
Western: 91.7
Asian: 1.5
Other: 6.8
Primiparas (in %): 36.6

117
Socioeconomic status (in %):
Very high: 20.2
High: 21.7
Normal: 19.1
Low: 18.6
Very low: 20.4%
Infants
Male (in %): 48.7
Position (in %):
Vertex: 46.9
Breech: 49.6
Other: 3.5
Week 39
(n=6647)
Maternal
Mean age (mean): 32.0, SD: 4.5
Race/ethnic group (in %):
Western: 91.2
Asian: 1.7
Other: 7.1
Primiparas (in %): 41.3
Socioeconomic status (in %):
Very high: 22.2
High: 20.4
Normal: 18.2
Low: 17.9
Very low: 21.6
Infants

118
Male (in %): 47.7
Position (in %)
Vertex: 44.3.
Breech: 4.0
Other: 3.5
Week 40 (n=1274)
Maternal
Mean age (mean): 31.9, SD: 4.7
Race/ethnic group (in %)
Western: 87.2
Asian: 2.7
Other: 8.3
Primiparas (in %): 32.9
Socioeconomic status (in %):
Very high: 18.8
High: 21.3
Normal: 17.8
Low: 17.6
Very low: 24.5
Infants
Male (in %): 52.0
Position (in %)
Vertex: 59.3
Breech: 36.0
Other: 4.6
Week 41
(n=782)
Maternal

119
Mean age (mean): 31.7, SD: 4.5
Race/ethnic group (in %):
Western: 89.4
Asian: 1.3
Other: 9.4
Primiparas (in %): 37.7
Socioeconomic status (in %):
Very high: 19.8
High: 23.8
Normal: 17.5
Low: 16.6
Very low: 22.4
Infants
Male (in %): 51.4
Position (in %):
Vertex: 60.9
Breech: 35.8
Other: 3.3
Week 42
Maternal
Mean age (mean, SD): 31.7 (4.5)
Race/ethnic group (in %)
Western: 88.4
Asian: 0.8
Other: 10.9
Primiparas (in %): 39.3
Multiparas (in %): 60.7
Socioeconomic status (in %):
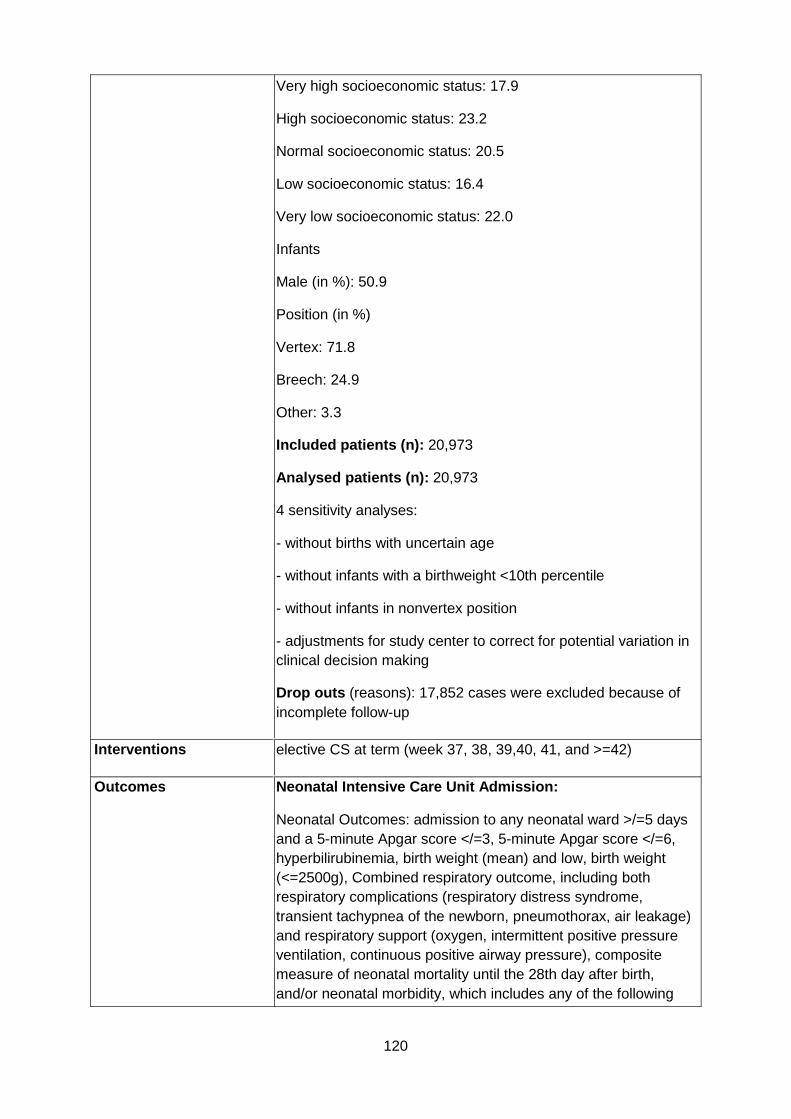
120
Very high socioeconomic status: 17.9
High socioeconomic status: 23.2
Normal socioeconomic status: 20.5
Low socioeconomic status: 16.4
Very low socioeconomic status: 22.0
Infants
Male (in %): 50.9
Position (in %)
Vertex: 71.8
Breech: 24.9
Other: 3.3
Included patients (n): 20,973
Analysed patients (n): 20,973
4 sensitivity analyses:
- without births with uncertain age
- without infants with a birthweight <10th percentile
- without infants in nonvertex position
- adjustments for study center to correct for potential variation in clinical decision making
Drop outs (reasons): 17,852 cases were excluded because of incomplete follow-up
Interventions elective CS at term (week 37, 38, 39,40, 41, and >=42)
Outcomes Neonatal Intensive Care Unit Admission:
Neonatal Outcomes: admission to any neonatal ward >/=5 days and a 5-minute Apgar score </=3, 5-minute Apgar score </=6, hyperbilirubinemia, birth weight (mean) and low, birth weight (<=2500g), Combined respiratory outcome, including both respiratory complications (respiratory distress syndrome, transient tachypnea of the newborn, pneumothorax, air leakage) and respiratory support (oxygen, intermittent positive pressure ventilation, continuous positive airway pressure), composite measure of neonatal mortality until the 28th day after birth, and/or neonatal morbidity, which includes any of the following

121
adverse events: severe resuscitation (defined as endotracheal artificial respiration and/or administration of buffers and/or other), sepsis (including both clinically suspected patients as well as proven infections with positive cultures), respiratory complications (registered as respiratory distress syndrome, wet lung syndrome or tran- sient tachypnea of the newborn, pneu- mothorax, or air leakage), respiratory support (oxygen, intermittent positive pressure ventilation, continuous posi- tive airway pressure), hypoglycemia (de- fined as a serum or plasma glucose level of 2.5 mmol/L), neurologic morbidity (described as convulsions or intracranial hemorrh
Notes in table 2 apgar score </=6, under "outcome measures" apgar score </=7
CS = Caesarean Section; SD = Standard deviation
Wilmink 2012
Methods Study type: retrospective cohort study
Setting: several hospitals, Netherlands,
Recruitment period: Jan. 1, 2000, through Dec. 31, 2007
Participants Exclusion criteria:
- singleton pregnancies
- no twin pregnancy beyond >35 weeks of gestation
- no neonates born by an elecitve CS >35 weeks of gestation
-neonates born by a planned CS registered with a maternal and/or fetal indication or born by an emergency CS
-all twins of which 1 fetus was missing in the registration were excluded
-eventually twins of which at least 1 fetus had a congenital anomaly
-twins of mothers with an adverse medical or obstetric history and/or a complication of pregnancy that could influence the risk for neonatal morbidity
Characteristics:
35 weeks

122
Newborn_(n=104)
male (in %): 49.0
Position (in %):
Vertex: 49.0
Breech: 46.2
Other: 4.8
Missing: 0
Birthweight (mean): 2304, SD: 334
Below 2500 g (in %): 66.4
Light for gestational age (<p10) (in %): 19.2
Heavy for gestational age (>p90) (in %): 0
Maternal
(n=52)
Age at delivery (mean): 31.4, SD:5.0
0-35 (in %): 73.1
>35 (in %): 26.9
Race/ethnic group (in %):
Western: 92.3
Other: 7.7
Primiparas (in %): 57.7
Socioeconomic status (in %):
Very High: 19.2
High: 21.2
Normal: 13.5
Low: 25.0
Very low: 21.1
Missing 0
36 weeks:
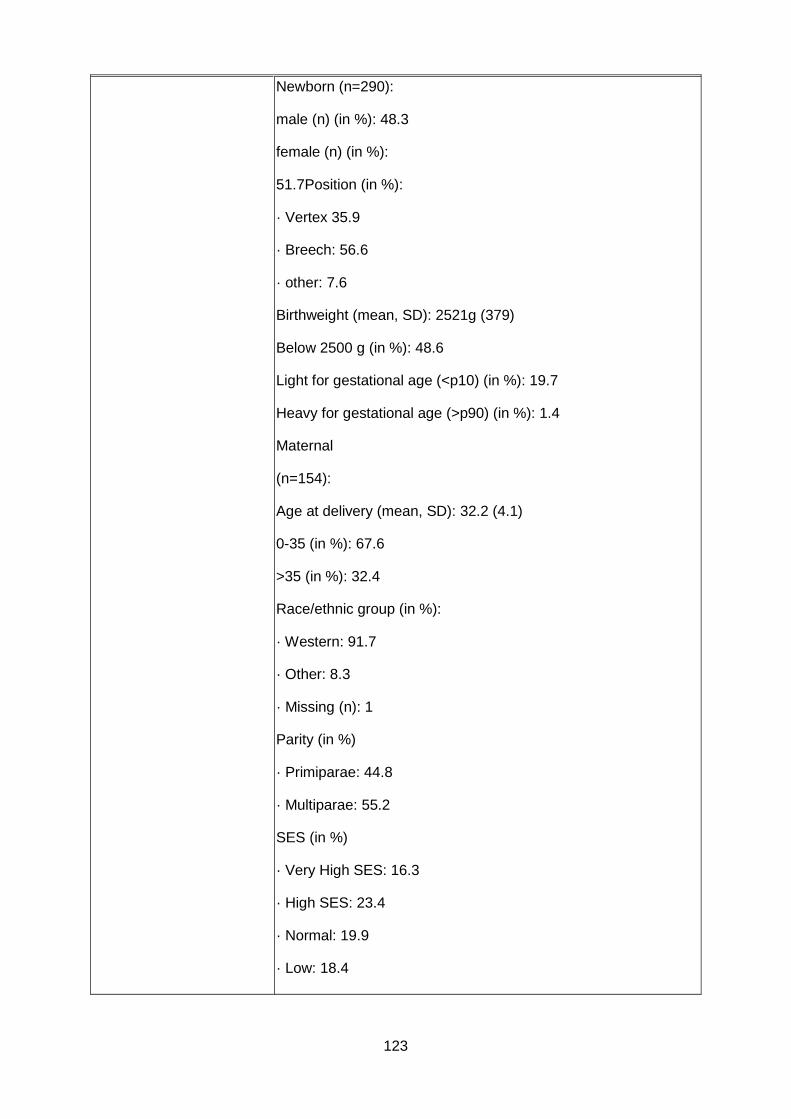
123
Newborn (n=290):
male (n) (in %): 48.3
female (n) (in %):
51.7Position (in %):
· Vertex 35.9
· Breech: 56.6
· other: 7.6
Birthweight (mean, SD): 2521g (379)
Below 2500 g (in %): 48.6
Light for gestational age (<p10) (in %): 19.7
Heavy for gestational age (>p90) (in %): 1.4
Maternal
(n=154):
Age at delivery (mean, SD): 32.2 (4.1)
0-35 (in %): 67.6
>35 (in %): 32.4
Race/ethnic group (in %):
· Western: 91.7
· Other: 8.3
· Missing (n): 1
Parity (in %)
· Primiparae: 44.8
· Multiparae: 55.2
SES (in %)
· Very High SES: 16.3
· High SES: 23.4
· Normal: 19.9
· Low: 18.4

124
· Very low: 22.0
· Missing (n): 4
37 weeks
Newborn (n=984):
male (in %): 49.2
female (in %): 50.8
Position (in %):
· Vertex: 30.6
· Breech: 58.2
· other: 11.2
· missing (n): 4
Birthweight (mean, SD): 2700 g (375)
Below 2500 g (in %): 28.6
Light for gestational age (<p10) (in %): 24.5
Heavy for gestational age (>p90) (in%): 0.8
Maternal
(n=492):
Age at delivery (mean, SD): 32.0 (4.4)
0-35 (%): 70.5
>35: (in %) 29.5
Race/ethnic group (in %):
· Western: 87.6
· Other: 12.4
· Missing (n): 2
Parity (in %):
· Primiparae: 46.3
· Multiparae: 53.7
SES (in %)

125
· Very High SES: 19.0
· High SES: 21.9
· Normal: 18.8
· Low: 17.1
· Very low: 23.3
Missing: 12
38+0-41+6 weeks
Newborn (n=850)
male (in %): 46.1
female (in %): 53.9
Position (in %):
· Vertex 35.1
· Breech: 55.4
· other: 9.5
Birthweight (mean, SD): 2878 g (401)
Below 2500 g (in %): 16.4
Light for gestational age (<p10) (n): 33.7
Heavy for gestational age (>p90) (n): 0.7
Maternal
(n=425):
Age at delivery (mean, SD): 32.4 (4.7)
0-35 (in %): 64.0
>35: 36.0
Race/ethnic group (in %):
· Western: 86.7
· Other: 13.3
· Missing (n):3
Parity (in %):

126
· Primiparae: 47.3
· Multiparae: 52.7
SES (in %)
· Very High SES: 19.8
· High SES: 20.0
· Normal: 18.1
· Low: 16.5
· Very low: 25.5
Missing (n): 6
Included patients : 4557 neonates through elective CS from 54,082 liveborn neonates of twin pregnancies (including week 35)
Analysed patients :
35 /36 /37 />=38 weeks
Neonates (total: 2228): 104/290/984/850
Mothers (n): 52 /145/ 492/ 425
Drop outs (reasons):
one of both neonates was not present in the registration (N=157),, congenital anomalies (n=206), registered as elective but present medical conditions: history of maternal cor vitium, chronic hypertension, diabetes mellitus, gestational diabetes, (pre-)eclampsia, HELLP, gestational hypertension, active rhesus or other bloodtype antagonism, placenta previa, placental abruption, AIDS, meconium stained fluid, rupture of membranes before cesarean, chorioamnionitis, fetal distress, syphilis, toxoplasmosis, german measles, cytomegalovirus or herpes, n = 360; No registration of neonatal follow up, n = 1606
Interventions Elective CS of uncomplicated twin pregnancies weeks 35,36,37, and >=38 weeks
Outcomes Neonatal Intensive Care Unit Admission: admission to any neonatal ward for >/= 5 days
Neonatal Outcomes: severe adverse neonatal outcome (composite outcome), defined as a composite measure of neonatal mortality until the 28th day, or neonatal morbidity: a 5-minute Apgar score </=3, convulsions, intracranial hemorrhage,

127
respiratory morbidity registered as pneumothorax or respiratory distress syndrome, respiratory support by intermittent positive pressure ventilation, severe resuscitation (defined as endotracheal artificial ventilation and/or administration of buffers), and/or sepsis, including both clinically suspected patients as well as proven infections with positive cultures. mild neonatal morbidity, a composite of: respiratory morbidity registered as transient tachypnea of the newborn, respiratory support with continuous positive airway pressure or oxygen, or hypoglycemia (defined as a serum or plasma glucose level of 2.5 mmol/L).
Notes They study the group from 35 weeks of gestation onward, as twin pregnancies are a special case
Data from The Netherlands Perinatal Registry (PRN), hospitals that systematically registered neonatal follow-up.
AIDS = Acquired immunodeficiency syndrome; CS = Caesarean Section; HELLP = Hemolysis, elevated liver enzymes, low platelet count; SD = Standard deviation; SES = Socioeconomic status
Yamazaki 2003
Methods Study type: retrospective cohort study
Setting: Nagaoka Red Cross Hospital, Japan
Recruitment period: January 1998 and December 2000
January 1998 and December 2000
Participants Exclusion:
-multiple pregnancies
-pregnancy with placenta previa
-pregnancy of women who had a diversity of medical complications
Characteristics:
Breech presentation (n = 48)
Previous cesarean section (n = 41)
Cephalopelvic disproportion (n = 7)
37+0-3 (n=48)

128
male/Female (%): 52.08/47.92
Birthweight (mean): 2811.6, SD:312.4
Birthweight >=2500g (%): 89.58
low birth weight, below 2500g (%): 10.41
37+4-38+6 (n=48)
male/Female (%): 45.83/54.17
Birthweigh (mean, SD): 2769.9, SD: 249.3
birthweight >=2500g (%): 85.42
low birth weight, below 2500g (%): 14.58
Included patients: 48 / 48
Analysed patients: 48 / 48
Drop outs (reasons): -
Interventions Elective CS at 37+0-3 vs 37+4-38+6 gestational weeks
Outcomes Neonatal Outcome: Tachypnea (TTN), Apnea, Hypoglycemia, TTN and hypoglycemia, Apnea and hypoglycemia, low birth weight (≤2500g)
Notes There seems to be a labelling mistake for Table 4 (breathing difficulty, hypoglycemia)
CS = Caesarean Section; SD = Standard deviation; TTN = Transient tachypnea of the newborn
Zanardo 2004A&B
Methods Study type: retospective cohort study
Setting: Maternity Department of Padua University, Italy. (level III center)
Recruitment period: January 1998 to December 2000
Participants Exclusion:
-conditions during pregnancy that might increase risk to the neonate, including acute and chronic maternal illnesses, disorders of pregnancy, fetal abnormalities, fetal distress or potential fetal asphyxia insult, and fetal growth retardation

129
Characteristics:
of all mother-infant pairs who underwent elective cesarean section (n=1,284)
Indication (in %)
Previous CS: 51
Breech presentation: 27
Twin pregnancy: 8
Suspected cephalo- pelvic disproportion: 5
Nulliparous aged 35 years: 2
Fear of labor: 1
In 6% of elective cesarean sections, the indications for delivery were miscellaneous and included other malpresentations, uncomplicated placenta previa, retinopathy, and myopathies
Maternal:
Age (mean, SD): 30.9 (2.3)
Nulliparae (in %): 42
Neonatal:
Gestational age (mean, SD): 38.8 (1.2)
Weight: 3.16 (0.5)
Male: 55%
Apgar <=5 at 1 min (n): 21
Apgar <=5 at 1 min (n): 4
NICU admission (n): 17
RDS (n): 29
TTN: 12
Pneumonia: 1
Length of hospital stay (days, mean, SD): 6 (0.9)
Included patients: 1284
Analysed patients: 1284
Drop outs (reasons): -

130
Interventions
Outcomes Neonatal Outcomes: positive pressure ventilation (PPV) resuscitation by laryngeal mask airway (LMA) or tracheal tube (TT)
Notes Contact study authors for absolute numbers of elective cesarean section and PPV resuscitation of each gestational week
CS = Caesarean; LMA = Laryngeal mask airway; PPV = positive pressure ventilation; TT =Tracheal tube
Zanardo 2007
Methods Study type: retrospective cohort study
Setting: Veneto region, northeastern Italy, Pediatric Departments of Universities Padua and Verona, Level 3 reference centers and 4 Level 3 hospitals
Recruitment period: 1 January 2002 - 31 December 2003
Participants Women who underwent elective CS between 37 0/7 and 41 6/7 weeks gestation.
Characteristics:
37+0-6 / 38+0-6 / 39+0-6 / 40+0-41+6 weeks of gestation
Included patients : 1492 / 4006 / 2490 / 2000
Analysed patients: 1492 / 4006 / 2490 / 2000
Drop outs (reasons): -
Interventions Elective CS at weeks 37, 38, 39 and 40-41+6
Outcomes Neonatal Outcomes: Number with pneumothorax
Respiratory morbidity: iatrogenic RDS requiring mechanical ventilation (e.g.pulmonary air leak, pulmonary hypertension, or both).
„Infants with iatrogenic RDS requiring mechanical ventilation was remarkably high. Two-thirds of newborns’ courses were complicated by a pulmonary air leak, pulmonary hypertension, or both conditions. Half of electively delivered newborns suffered these sequelae.“ But in results section same absolute numbers as pneomothorax; therefore cases of pneomothorax also

131
included under respiratory morbidity.
Notes The study compares the incidence of pneumothorax and respiratory morbidity among women who had elective cesarean section with emergency CS and vaginal delivery
CS = Caesarean Section; RDS = Respiratory distress syndrome
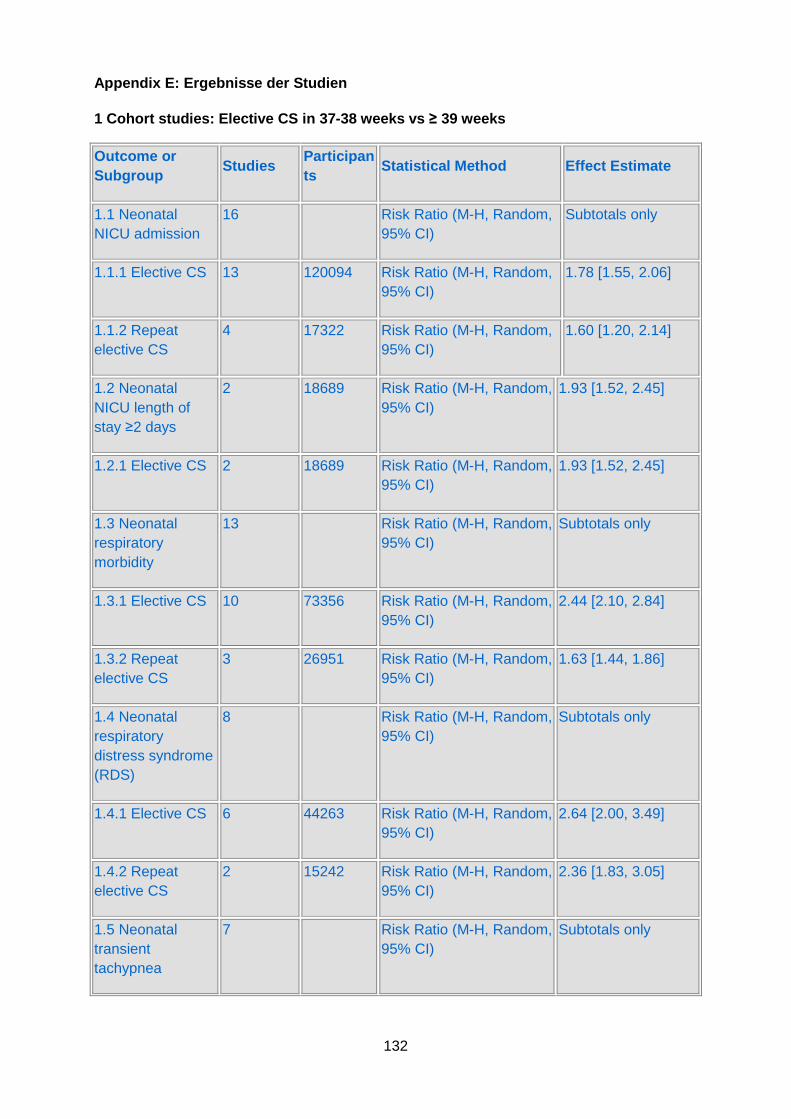
132
Appendix E: Ergebnisse der Studien
1 Cohort studies: Elective CS in 37-38 weeks vs ≥ 39 weeks
Outcome or Subgroup
Studies Participants
Statistical Method Effect Estimate
1.1 Neonatal NICU admission
16 Risk Ratio (M-H, Random, 95% CI)
Subtotals only
1.1.1 Elective CS 13 120094 Risk Ratio (M-H, Random, 95% CI)
1.78 [1.55, 2.06]
1.1.2 Repeat elective CS
4 17322 Risk Ratio (M-H, Random, 95% CI)
1.60 [1.20, 2.14]
1.2 Neonatal NICU length of stay ≥2 days
2 18689 Risk Ratio (M-H, Random, 95% CI)
1.93 [1.52, 2.45]
1.2.1 Elective CS 2 18689 Risk Ratio (M-H, Random, 95% CI)
1.93 [1.52, 2.45]
1.3 Neonatal respiratory morbidity
13 Risk Ratio (M-H, Random, 95% CI)
Subtotals only
1.3.1 Elective CS 10 73356 Risk Ratio (M-H, Random, 95% CI)
2.44 [2.10, 2.84]
1.3.2 Repeat elective CS
3 26951 Risk Ratio (M-H, Random, 95% CI)
1.63 [1.44, 1.86]
1.4 Neonatal respiratory distress syndrome (RDS)
8 Risk Ratio (M-H, Random, 95% CI)
Subtotals only
1.4.1 Elective CS 6 44263 Risk Ratio (M-H, Random, 95% CI)
2.64 [2.00, 3.49]
1.4.2 Repeat elective CS
2 15242 Risk Ratio (M-H, Random, 95% CI)
2.36 [1.83, 3.05]
1.5 Neonatal transient tachypnea
7 Risk Ratio (M-H, Random, 95% CI)
Subtotals only

133
1.5.1 Elective CS 5 40869 Risk Ratio (M-H, Random, 95% CI)
2.15 [1.75, 2.64]
1.5.2 Repeat elective CS
2 15242 Risk Ratio (M-H, Random, 95% CI)
1.50 [1.27, 1.77]
1.6 Neonatal pneumothorax
4 Risk Ratio (M-H, Random, 95% CI)
Subtotals only
1.6.1 Elective CS 3 24755 Risk Ratio (M-H, Random, 95% CI)
3.12 [1.60, 6.10]
1.6.2 Repeat elective CS
1 377 Risk Ratio (M-H, Random, 95% CI)
0.43 [0.03, 6.78]
1.7 Neonatal resuscitation
5 Risk Ratio (M-H, Random, 95% CI)
Subtotals only
1.7.1 Elective CS 4 39430 Risk Ratio (M-H, Random, 95% CI)
1.17 [1.05, 1.30]
1.7.2 Repeat elective CS
1 13243 Risk Ratio (M-H, Random, 95% CI)
2.69 [1.75, 4.15]
1.8 Neonatal sepsis
5 Risk Ratio (M-H, Random, 95% CI)
Subtotals only
1.8.1 Elective CS 3 27119 Risk Ratio (M-H, Random, 95% CI)
1.43 [0.95, 2.18]
1.8.2 Repeat elective CS
2 15242 Risk Ratio (M-H, Random, 95% CI)
1.64 [1.40, 1.93]
1.9 Neonatal hypoglycemia
6 Risk Ratio (M-H, Random, 95% CI)
Subtotals only
1.9.1 Elective CS 4 45510 Risk Ratio (M-H, Random, 95% CI)
1.48 [1.26, 1.74]
1.9.2 Repeat elective CS
2 10657 Risk Ratio (M-H, Random, 95% CI)
3.75 [2.64, 5.32]
1.10 Neonatal Apgar score ≤3
3 Risk Ratio (M-H, Random, 95% CI)
Subtotals only
1.10.1 Elective CS 2 23996 Risk Ratio (M-H, Random, 95% CI)
1.58 [0.70, 3.56]

134
1.10.2 Repeat elective CS
1 14865 Risk Ratio (M-H, Random, 95% CI)
2.17 [0.83, 5.70]
1.11 Neonatal Apgar score ≤6
4 Risk Ratio (M-H, Random, 95% CI)
Subtotals only
1.11.1 Elective CS 3 42387 Risk Ratio (M-H, Random, 95% CI)
1.63 [1.13, 2.36]
1.11.2 Repeat elective CS
1 377 Risk Ratio (M-H, Random, 95% CI)
0.32 [0.07, 1.41]
1.12 Neonatal hyperbilirubinemia
6 Risk Ratio (M-H, Random, 95% CI)
Subtotals only
1.12.1 Elective CS 5 45782 Risk Ratio (M-H, Random, 95% CI)
2.09 [1.54, 2.82]
1.12.2 Repeat elective CS
1 377 Risk Ratio (M-H, Random, 95% CI)
0.43 [0.16, 1.11]
1.13 Neonatal birth weight ≤2500g
3 Risk Ratio (M-H, Random, 95% CI)
Subtotals only
1.13.1 Elective CS 2 24818 Risk Ratio (M-H, Random, 95% CI)
3.33 [2.63, 4.21]
1.13.2 Repeat elective CS
1 13145 Risk Ratio (M-H, Random, 95% CI)
2.45 [1.77, 3.38]
1.14 Neonatal hospitalisation > 5 days
5 Risk Ratio (M-H, Random, 95% CI)
Subtotals only
1.14.1 Elective CS 4 45676 Risk Ratio (M-H, Random, 95% CI)
1.58 [1.03, 2.42]
1.14.2 Repeat elective CS
1 13236 Risk Ratio (M-H, Random, 95% CI)
1.55 [1.33, 1.80]
1.15 Neonatal death
5 Risk Ratio (M-H, Random, 95% CI)
Subtotals only
1.15.1 Elective CS 3 512112 Risk Ratio (M-H, Random, 95% CI)
1.28 [0.73, 2.23]
1.15.2 Repeat elective CS
2 15242 Risk Ratio (M-H, Random, 95% CI)
1.69 [0.69, 4.16]

135
1.16 Maternal death 1 Risk Ratio (M-H, Random, 95% CI)
Subtotals only
1.16.2 Repeat elective CS
1 14865 Risk Ratio (M-H, Random, 95% CI)
0.38 [0.04, 3.40]
1.17 Maternal bleeding (needing transfusion/treatment)
2 Risk Ratio (M-H, Random, 95% CI)
Subtotals only
1.17.2 Repeat elective CS
2 15242 Risk Ratio (M-H, Random, 95% CI)
1.21 [0.65, 2.24]
1.18 Maternal hysterectomy
3 Risk Ratio (M-H, Random, 95% CI)
Subtotals only
1.18.1 Elective CS 1 3420 Risk Ratio (M-H, Random, 95% CI)
0.43 [0.04, 4.14]
1.18.2 Repeat elective CS
2 15242 Risk Ratio (M-H, Random, 95% CI)
1.20 [0.61, 2.36]
1.19 Maternal composite adverse events
3 Risk Ratio (M-H, Random, 95% CI)
Subtotals only
1.19.1 Elective CS 1 320 Risk Ratio (M-H, Random, 95% CI)
38.50 [5.29, 280.15]
1.19.2 Repeat elective CS
2 15242 Risk Ratio (M-H, Random, 95% CI)
0.98 [0.48, 2.02]
1.20 NICU admission Adjusted ORs for Vilchez et al. 2014
1 Other data No numeric data
1.21 Apgar Score ≤6 Asjusted ORs for Vilchez et al. 2014
1 Other data No numeric data
1.22 Neonatal antibiotics use Adjusted OR for Vilchez et al. 2014
1 Other data No numeric data
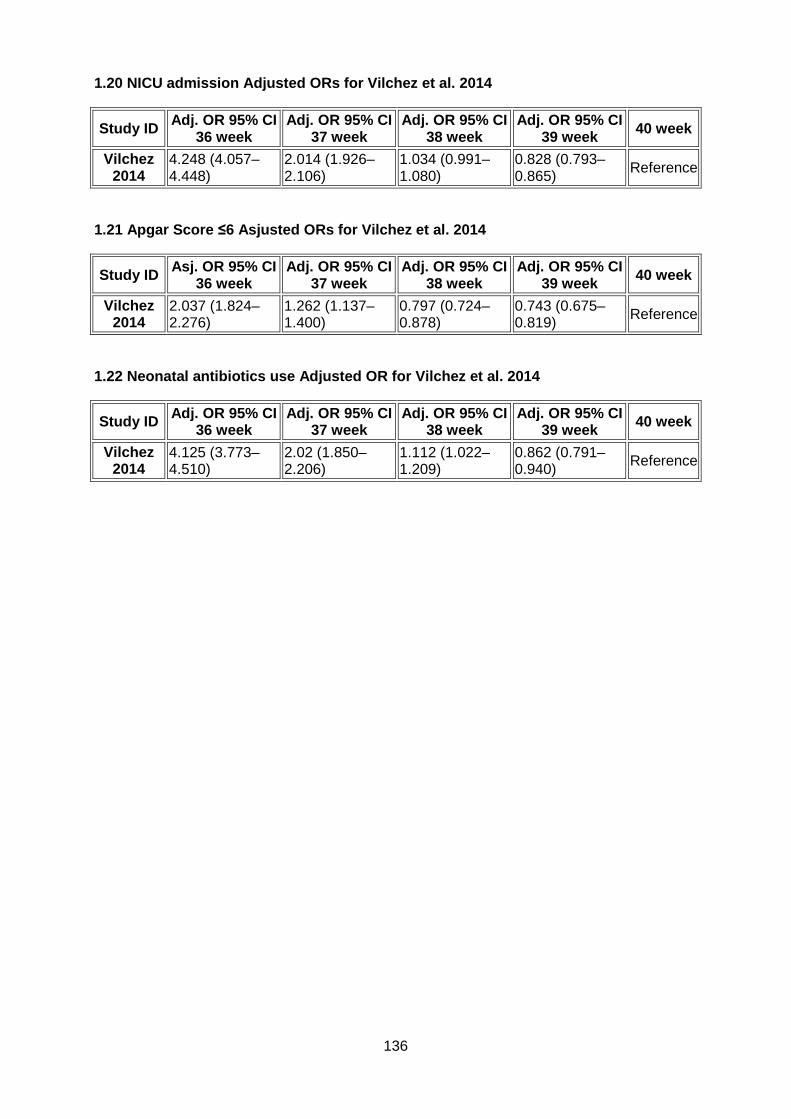
136
1.20 NICU admission Adjusted ORs for Vilchez et al. 2014
Study ID Adj. OR 95% CI 36 week
Adj. OR 95% CI 37 week
Adj. OR 95% CI 38 week
Adj. OR 95% CI 39 week 40 week
Vilchez 2014
4.248 (4.057–4.448)
2.014 (1.926–2.106)
1.034 (0.991–1.080)
0.828 (0.793–0.865) Reference
1.21 Apgar Score ≤6 Asjusted ORs for Vilchez et al. 2014
Study ID Asj. OR 95% CI 36 week
Adj. OR 95% CI 37 week
Adj. OR 95% CI 38 week
Adj. OR 95% CI 39 week 40 week
Vilchez 2014
2.037 (1.824–2.276)
1.262 (1.137–1.400)
0.797 (0.724–0.878)
0.743 (0.675–0.819) Reference
1.22 Neonatal antibiotics use Adjusted OR for Vilch ez et al. 2014
Study ID Adj. OR 95% CI 36 week
Adj. OR 95% CI 37 week
Adj. OR 95% CI 38 week
Adj. OR 95% CI 39 week 40 week
Vilchez 2014
4.125 (3.773–4.510)
2.02 (1.850–2.206)
1.112 (1.022–1.209)
0.862 (0.791–0.940) Reference

137
2 RCT: Elective CS in week 38 (38+1-38+5) vs 39 (38 +6-39+5)
Outcome or Subgroup
Studies Participants
Statistical Method Effect Estimate
2.1 Neonatal NICU admission
1 Risk Ratio (M-H, Random, 95% CI)
Subtotals only
2.1.1 Elective CS 1 1272 Risk Ratio (M-H, Random, 95% CI)
1.14 [0.88, 1.48]
2.2 Neonatal NICU length of stay ≥2 days
1 Risk Ratio (M-H, Random, 95% CI)
Subtotals only
2.2.1 Elective CS 1 1272 Risk Ratio (M-H, Random, 95% CI)
1.03 [0.67, 1.59]
2.3 Neonatal respiratory morbidity
1 Risk Ratio (M-H, Random, 95% CI)
Subtotals only
2.3.1 Elective CS 1 1272 Risk Ratio (M-H, Random, 95% CI)
1.33 [0.91, 1.95]
2.8 Neonatal sepsis 1 Risk Ratio (M-H, Random, 95% CI)
Subtotals only
2.8.1 Elective CS 1 1272 Risk Ratio (M-H, Random, 95% CI)
1.22 [0.61, 2.45]
2.17 Maternal death 1 Risk Ratio (M-H, Random, 95% CI)
Subtotals only
2.17.1 Elective CS 1 1272 Risk Ratio (M-H, Random, 95% CI)
Not estimable
2.18 Maternal bleeding (needing transfusion/treatment)
1 Risk Ratio (M-H, Random, 95% CI)
Subtotals only
2.18.1 Elective CS 1 1274 Risk Ratio (M-H, Random, 95% CI)
0.75 [0.32, 1.77]
2.19 Maternal hysterectomy
1 Risk Ratio (M-H, Random, 95% CI)
Subtotals only
2.19.1 Elective CS 1 1274 Risk Ratio (M-H, Random, Not estimable

138
95% CI)
2.20 Maternal composite adverse events
1 Risk Ratio (M-H, Random, 95% CI)
Subtotals only
2.20.1 Elective CS 1 1274 Risk Ratio (M-H, Random, 95% CI)
0.91 [0.65, 1.27]

139
3 Elective CS 37 week vs 38 weeks
Outcome or Subgroup
Studies Participants
Statistical Method Effect Estimate
3.1 Neonatal NICU admission
1 684 Risk Ratio (M-H, Random, 95% CI)
2.01 [1.05, 3.84]
3.2 Neonatal respiratory morbidity
2 780 Risk Ratio (M-H, Random, 95% CI)
3.22 [1.70, 6.11]
3.3 Neonatal transient tachypnea
1 96 Risk Ratio (M-H, Random, 95% CI)
2.50 [0.84, 7.42]
3.4 Neonatal sepsis 1 684 Risk Ratio (M-H, Random, 95% CI)
0.75 [0.15, 3.71]
3.5 Neonatal hypoglycaemia
2 780 Risk Ratio (M-H, Random, 95% CI)
3.02 [1.47, 6.20]
3.6 Neonatal hyperbilirubinemia
1 684 Risk Ratio (M-H, Random, 95% CI)
1.22 [0.76, 1.94]
3.7 Neonatal birth weight ≤2500g
2 780 Risk Ratio (M-H, Random, 95% CI)
1.40 [0.48, 4.13]

140
4 Elective CS in twin pregnancies 35-37 weeks vs 38 -41 weeks
Outcome or Subgroup
Studies Participants
Statistical Method Effect Estimate
4.1 Neonatal NICU admission
1 3212 Risk Ratio (M-H, Random, 95% CI)
8.65 [1.96, 38.27]
4.2 Neonatal respiratory distress outcome (RDS)
1 3212 Risk Ratio (M-H, Random, 95% CI)
11.98 [1.52, 94.43]
4.3 Neonatal transient tachypnea
1 3212 Risk Ratio (M-H, Random, 95% CI)
4.92 [2.46, 9.87]
4.5 Neonatal pneomothorax
1 3212 Risk Ratio (M-H, Random, 95% CI)
6.65 [0.32, 138.47]
4.6 Neonatal hospitalization > 5 days
1 3212 Risk Ratio (M-H, Random, 95% CI)
3.68 [3.05, 4.44]
4.7 Neonatal Apgar score ≤3
1 3212 Risk Ratio (M-H, Random, 95% CI)
2.66 [0.24, 29.33]
4.8 Neonatal resuscitation
1 3212 Risk Ratio (M-H, Random, 95% CI)
2.66 [0.49, 14.51]
4.9 Neonatal sepsis 1 3212 Risk Ratio (M-H, Random, 95% CI)
3.11 [0.80, 11.99]
4.10 Neonatal hypoglycemia
1 3212 Risk Ratio (M-H, Random, 95% CI)
4.70 [3.15, 7.01]
4.11 Neonatal low birth weigh (<=2500g)
1 3212 Risk Ratio (M-H, Random, 95% CI)
4.70 [3.95, 5.60]
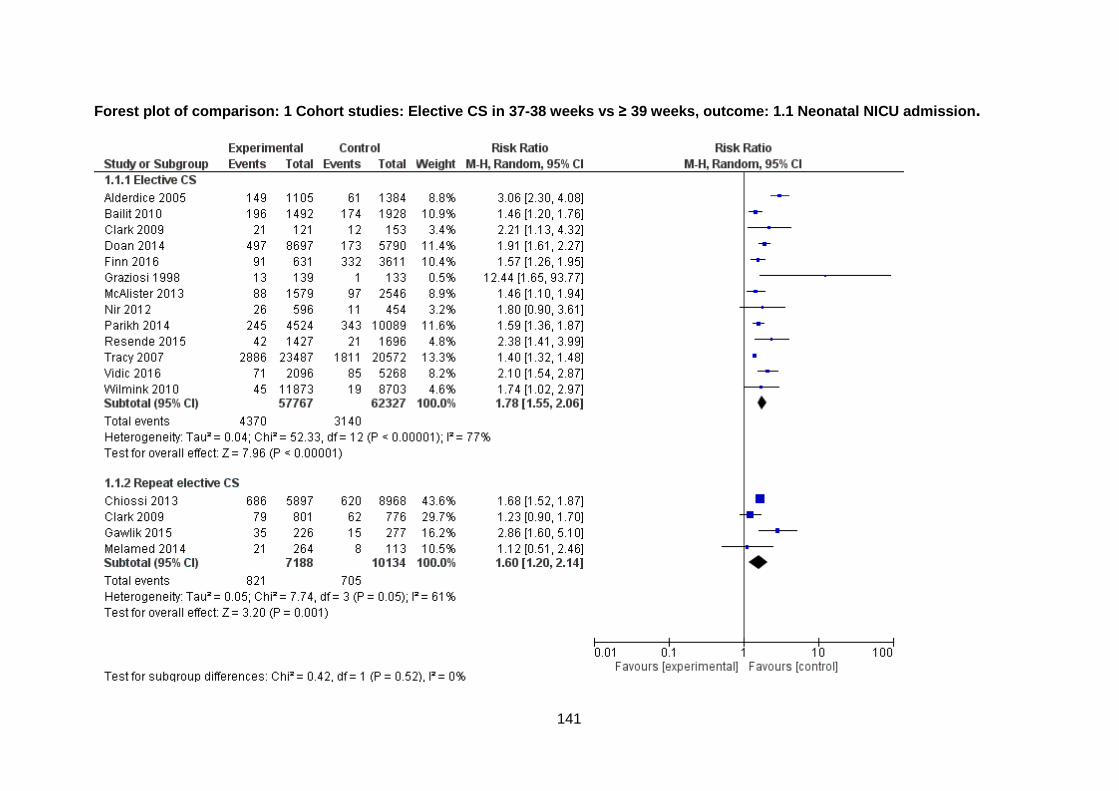
141
Forest plot of comparison: 1 Cohort studies: Electi ve CS in 37-38 weeks vs ≥ 39 weeks, outcome: 1.1 Neonatal NICU admission .

142
Forest plot of comparison: 1 Cohort studies: Electi ve CS in 37-38 weeks vs ≥ 39 weeks, outcome: 1.2 Neonatal NICU length of sta y ≥2 days.

143
Forest plot of comparison: 1 Cohort studies: Electi ve CS in 37-38 weeks vs ≥ 39 weeks, outcome: 1.3 Neonatal respiratory morbid ity.

144
Forest plot of comparison: 1 Cohort studies: Electi ve CS in 37-38 weeks vs ≥ 39 weeks, outcome: 1.4 Neonatal respiratory distre ss syndrome (RDS).

145
Forest plot of comparison: 1 Cohort studies: Electi ve CS in 37-38 weeks vs ≥ 39 weeks, outcome: 1.5 Neonatal transient tachypne a.

146
Forest plot of comparison: 1 Cohort studies: Electi ve CS in 37-38 weeks vs ≥ 39 weeks, outcome: 1.6 Neonatal pneumothorax.

147
Forest plot of comparison: 1 Cohort studies: Electi ve CS in 37-38 weeks vs ≥ 39 weeks, outcome: 1.7 Neonatal resuscitation.

148
Forest plot of comparison: 1 Cohort studies: Electi ve CS in 37-38 weeks vs ≥ 39 weeks, outcome: 1.8 Neonatal sepsis.

149
Forest plot of comparison: 1 Cohort studies: Electi ve CS in 37-38 weeks vs ≥ 39 weeks, outcome: 1.9 Neonatal hypoglycemia.

150
Forest plot of comparison: 1 Cohort studies: Electi ve CS in 37-38 weeks vs ≥ 39 weeks, outcome: 1.10 Neonatal Apgar score ≤3.

151
Forest plot of comparison: 1 Cohort studies: Electi ve CS in 37-38 weeks vs ≥ 39 weeks, outcome: 1.11 Neonatal Apgar score ≤6.

152
Forest plot of comparison: 1 Cohort studies: Electi ve CS in 37-38 weeks vs ≥ 39 weeks, outcome: 1.12 Neonatal hyperbilirubinemi a.

153
Forest plot of comparison: 1 Cohort studies: Electi ve CS in 37-38 weeks vs ≥ 39 weeks, outcome: 1.13 Neonatal birth weight ≤2500g.

154
Forest plot of comparison: 1 Cohort studies: Electi ve CS in 37-38 weeks vs ≥ 39 weeks, outcome: 1.14 Neonatal hospitalisation > 5 days.

155
Forest plot of comparison: 1 Cohort studies: Electi ve CS in 37-38 weeks vs ≥ 39 weeks, outcome: 1.15 Neonatal death.

156
Forest plot of comparison: 1 Cohort studies: Electi ve CS in 37-38 weeks vs ≥ 39 weeks, outcome: 1.17 Maternal bleeding (needing transfusion/treatment).

157
Forest plot of comparison: 1 Cohort studies: Electi ve CS in 37-38 weeks vs ≥ 39 weeks, outcome: 1.18 Maternal hysterectomy.

158
Forest plot of comparison: 1 Cohort studies: Electi ve CS in 37-38 weeks vs ≥ 39 weeks, outcome: 1.19 Maternal composite adverse events.

159
Forest plot of comparison: 3 Elective CS 37 week vs 38 weeks, outcome: 3.2 Neonatal respiratory morbid ity.
Forest plot of comparison: 3 Elective CS 37 week vs 38 weeks, outcome: 3.5 Neonatal hypoglycaemia.

160
Forest plot of comparison: 3 Elective CS 37 week vs 38 weeks, outcome: 3.7 Neonatal birth weight ≤2500g.

161
Appendix F: Liste der ausgeschlossenen Volltexte
Primärstudien
Aksoy, H., et al., Blood loss in elective cesarean section: is there a difference related to the type of anesthesia? A randomized prospective study. J Turk Ger Gynecol Assoc, 2015. 16(3): p. 158-63.
Amorim, M.M., et al., Elective caesarean section at 38 versus 39 weeks of gestation: neonatal and maternal outcomes in a randomised controlled trial Are we trivialising neonatal intensive care unit admissions? Bjog, 2013. 120(13): p. 1702.
Ashton, D.M., Elective delivery at less than 39 weeks. Curr Opin Obstet Gynecol, 2010. 22(6): p. 506-10.
Bailey, B.A., J.G. McCook, and C. Chaires, Burden of elective early-term births in rural Appalachia. South Med J, 2014. 107(10): p. 624-9.
Caughey, A.B., Elective induction of labour is associated with decreased perinatal mortality and lower odds of caesarean section at 40 and 41 weeks. Evid Based Med, 2013. 18(3): p. 117-8.
Caughey, A.B., Elective induction of labour is associated with decreased perinatal mortality and lower odds of caesarean section at 40 and 41 weeks. Evid Based Med, 2014. 19(6): p. 236.
Caughey, A.B. Elective caesarean section at 38 weeks versus 39 weeks: Neonatal and maternal outcomes in a randomised controlled trial. Obstetrical and Gynecological Survey, 2014. 69, 3-5 DOI: 10.1097/01.ogx.0000442812.42484.57.
Caughey, A.B., Systematic review and meta-analysis: Elective induction of labour is associated with decreased perinatal mortality and lower odds of caesarean section at 40 and 41 weeks. Evidence-Based Medicine, 2014. 19(6): p. 236.
Cho, Y., et al., Elective ceasarean section at 38 weeks versus 39 weeks: neonatal and maternal outcomes in a randomised controlled trial. Bjog, 2014. 121(13): p. 1748.
Dietz, H.P., The timing of elective caesarean deliveries and early neonatal outcomes in singleton infants born 37-41 weeks' gestation. Aust N Z J Obstet Gynaecol, 2014. 54(6): p. 602.
Dietz, H.P., The timing of elective caesarean deliveries and early neonatal outcomes in singleton infants born 37-41 weeks' gestation...he timing of elective caesarean deliveries and early neonatal outcomes in singleton infants born 37-41 weeks' gestation. Australian & New Zealand Journal of Obstetrics & Gynaecology, 2014. 54(6): p. 602-602 1p.
Doan, E., K. Gibbons, and D. Tudehope, Re: the timing of elective caesarean deliveries and early neonatal outcomes in singleton infants born 37-41 weeks' gestation. Aust N Z J Obstet Gynaecol, 2014. 54(6): p. 602-3.
Doan, E., K. Gibbons, and D. Tudehope, Re: The timing of elective caesarean deliveries and early neonatal outcomes in singleton infants born 37-41 weeks' gestation...Re: The timing of elective caesarean deliveries and early neonatal outcomes in singleton infants born 37–41 weeks’ gestation. Australian & New Zealand Journal of Obstetrics & Gynaecology, 2014. 54(6): p. 602-603 2p.
Dodd, J.M., et al., Timing of birth for women with a twin pregnancy at term: a randomised controlled trial. BMC Pregnancy Childbirth, 2010. 10: p. 68.
Dodd, J.M., et al., Elective birth at 37 weeks of gestation versus standard care for women with an uncomplicated twin pregnancy at term: The Twins Timing of Birth Randomised Trial. BJOG: An International Journal of Obstetrics and Gynaecology, 2012. 119(8): p. 964-973.

162
Dodd, J.M. and C.A. Crowther, Elective delivery of women with a twin pregnancy from 37 weeks' gestation. Cochrane Database Syst Rev, 2003(1): p. Cd003582.
Edge, N. and B.W.J. Mol Timing of elective caesarean section: A decision analysis. Journal of paediatrics and child health, 2015. 51, 116 DOI: 10.1111/jpc.12884-7.
Ehrenthal, D.B., et al., Neonatal outcomes after implementation of guidelines limiting elective delivery before 39 weeks of gestation. Obstet Gynecol, 2011. 118(5): p. 1047-55.
Ertugrul, S., et al., Evaluation of neonatal outcomes in elective repeat cesarean delivery at term according to weeks of gestation. J Obstet Gynaecol Res, 2013. 39(1): p. 105-12.
Ganchimeg, T., et al., Optimal Timing of Delivery among Low-Risk Women with Prior Caesarean Section: A Secondary Analysis of the WHO Multicountry Survey on Maternal and Newborn Health. PLoS One, 2016. 11(2): p. e0149091.
Glavind, J., Author's reply: elective caesarean section at 38 versus 39 weeks of gestation: neonatal and maternal outcomes in a randomised controlled trial. Bjog, 2013. 120(13): p. 1703-4.
Glavind, J., et al., Authors' reply: Elective ceasarean section at 38 weeks versus 39 weeks: neonatal and maternal outcomes in a randomised controlled trial. Bjog, 2014. 121(13): p. 1748-9.
Glavind, J., et al. Do pregnant women prefer timing of elective cesarean section prior to versus after 39 weeks of gestation? Secondary analyses from a randomized controlled trial. The journal of maternal-fetal & neonatal medicine : the official journal of the European Association of Perinatal Medicine, the Federation of Asia and Oceania Perinatal Societies, the International Society of Perinatal Obstetricians, 2014. 27, 1782-6 DOI: 10.3109/14767058.2013.879707.
Glavind, J., et al. Timing of elective cesarean section and neonatal morbidity: A randomized controlled trial. International journal of gynaecology and obstetrics, 2012. 119, S358 DOI: 10.1016/S0020-7292%2812%2960707-3.
Glavind, J., et al., Authors' reply: elective caesarean section at 38 versus 39 weeks of gestation: neonatal and maternal outcomes in a randomised controlled trial Are we trivialising neonatal intensive care unit admissions? Bjog, 2013. 120(13): p. 1702-3.
Glavind, J., et al., Authors' reply: Elective caesarean section at 38 versus 39 weeks of gestation: balance between the perceived benefits and potential drawbacks. Bjog, 2014. 121(7): p. 907-8.
Gouyon, J.B., et al., Severe respiratory disorders in term neonates. Paediatr Perinat Epidemiol, 2008. 22(1): p. 22-30.
Graziosi, G.C., et al., [Elective cesarean section is preferred after the completion of a minimum of 38 weeks of pregnancy]. Ned Tijdschr Geneeskd, 1998. 142(42): p. 2300-3.
Hankins, G.D., S.M. Clark, and M.B. Munn, Cesarean section on request at 39 weeks: impact on shoulder dystocia, fetal trauma, neonatal encephalopathy, and intrauterine fetal demise. Semin Perinatol, 2006. 30(5): p. 276-87.
Hansen, A.K., et al., Elective caesarean section and respiratory morbidity in the term and near-term neonate. Acta Obstet Gynecol Scand, 2007. 86(4): p. 389-94.
Hoffmire, C.A., et al., Elective delivery before 39 weeks: the risk of infant admission to the neonatal intensive care unit. Matern Child Health J, 2012. 16(5): p. 1053-62.
Hourani, M., F. Ziade, and M. Rajab, Timing of planned caesarean section and the morbidities of the newborn. N Am J Med Sci, 2011. 3(10): p. 465-8.

163
Howell, E.A., et al., Association between hospital-level obstetric quality indicators and maternal and neonatal morbidity. Jama, 2014. 312(15): p. 1531-41.
Hutcheon, J.A., et al., Maternal, care provider, and institutional-level risk factors for early term elective repeat cesarean delivery: a population-based cohort study. Matern Child Health J, 2014. 18(1): p. 22-8.
Lavery, S. and D. Harvey, Neonatal respiratory morbidity and mode of delivery at term: influence of timing of elective cesarean section. Br J Obstet Gynaecol, 1995. 102(10): p. 843.
Lavoue, V., et al., Caesarean section at term: the relationship between neonatal respiratory morbidity and microviscosity in amniotic fluid. Eur J Obstet Gynecol Reprod Biol, 2013. 169(2): p. 239-43.
Le Guennec, J.C., et al., Elective delivery and the neonatal respiratory distress syndrome. Can Med Assoc J, 1980. 122(3): p. 307-9.
Little, S.E., et al., The effect of obstetric practice change to reduce early term delivery on perinatal outcome. J Perinatol, 2014. 34(3): p. 176-80.
Mally, P.V., N.T. Agathis, and S.M. Bailey, Early term infants are at increased risk of requiring neonatal intensive care. World J Pediatr, 2016. 12(1): p. 76-81.
Martinez-Nadal, S., et al., [Neonatal morbidity in early-term newborns]. An Pediatr (Barc), 2014. 81(1): p. 39-44.
Matsuo, K., K. Shimoya, and T. Kimura, Elective cesarean delivery at 38 weeks' gestation: is the timing too early?...Tita TNA, Landon MB, Spong CY, Lai Y, Leveno KJ, Varner MW et al. Eunice Kennedy Shriver NICHD Maternal fetal medicine units network. Timing of elective repeat cesarean delivery at term and neonatal outcomes. N Engl J Med 2009;360:111-20. Journal of Perinatal Medicine, 2009. 37(5): p. 569-569 1p.
Melhado, L., Even at term, timing of cesarean is linked to adverse outcomes. Perspectives on Sexual and Reproductive Health, 2009. 41(2): p. 130-131.
Mohammed, A.B., A.I. Bayo, and M.F. Abu-Jubara, Timing of elective repeated cesarean delivery in patients with previous two or more cesarean section. J Matern Fetal Neonatal Med, 2013. 26(1): p. 10-2.
Mostafa Hefny, S., et al., The neonatal respiratory outcome in relation to timing of elective cesarean section at 38 versus 39week gestation: A single center based study. Egyptian Pediatric Association Gazette, 2013. 61(2): p. 78-82.
Nicholl, M.C. and M.A. Cattell, Getting evidence into obstetric practice: appropriate timing of elective caesarean section. Aust Health Rev, 2010. 34(1): p. 90-2.
Nicoll, A.E., et al., An audit of neonatal respiratory morbidity following elective caesarean section at term. Scott Med J, 2004. 49(1): p. 22-5.
Ojidu, J.I., Delaying planned caesarean delivery until 39 completed weeks of gestation: the experience of a district general hospital. J Obstet Gynaecol, 1999. 19(2): p. 142-5.
Pallasmaa, N., U. Ekblad, and M. Gissler, Severe maternal morbidity and the mode of delivery. Acta Obstet Gynecol Scand, 2008. 87(6): p. 662-8.
Phaloprakarn, C., S. Tangjitgamol, and S. Manusirivithaya, Timing of elective cesarean delivery at term and its impact on maternal and neonatal outcomes among Thai and other Southeast Asian pregnant women. J Obstet Gynaecol Res, 2016.

164
Riskin, A., et al., Does cesarean section before the scheduled date increase the risk of neonatal morbidity? Isr Med Assoc J, 2014. 16(9): p. 559-63.
Robinson, C.J., et al., Timing of elective repeat cesarean delivery at term and neonatal outcomes: a cost analysis. Am J Obstet Gynecol, 2010. 202(6): p. 632.e1-6.
Roy, P. and R. Jose Respiratory morbidity in term infants delivered by elective lower segment caesarean section-a randomized control trial. International Journal of Gynecology and Obstetrics. ( var.pagings), 2015. 131, E289.
Ryan, C.A. and P. Hughes, Neonatal respiratory morbidity and mode of delivery at term: influence of timing of elective caesarean section. Br J Obstet Gynaecol, 1995. 102(10): p. 843-4.
Salim, R. and E. Shalev, Health implications resulting from the timing of elective cesarean delivery. Reprod Biol Endocrinol, 2010. 8: p. 68.
Salim, R. and E. Shalev, Timing of elective repeat cesarean delivery at term and maternal perioperative outcomes. Obstet Gynecol, 2011. 117(6): p. 1437; author reply 1437-8.
Salim, R. and E. Shalev, Timing of elective repeat cesarean delivery at term and maternal perioperative outcomes...Obstet Gynecol. 2011 Feb;117(2 Pt 1):280-6. Obstetrics & Gynecology, 2011. 117(6): p. 1437-1437 1p.
Sanu, O., Elective caesarean section at 38 versus 39 weeks of gestation: neonatal and maternal outcomes in a randomised controlled trial. Bjog, 2013. 120(13): p. 1703.
Sholapurkar, S.L., Elective caesarean section at 38 versus 39 weeks of gestation: balance between the perceived benefits and potential drawbacks. Bjog, 2014. 121(7): p. 907.
Stock, S.J., et al., Outcomes of induction of labour in women with previous caesarean delivery: a retrospective cohort study using a population database. PLoS One, 2013. 8(4): p. e60404.
Tanger, H.L., et al., [Less neonatal morbidity with elective caesarean sections at term: local guideline for elective caesarean section is effective]. Ned Tijdschr Geneeskd, 2010. 154: p. A1201.
Tanger, H.L., et al., Less neonatal morbidity after an elective cesarean section following a gestation period of 39 weeks. Nederlands Tijdschrift voor Geneeskunde, 2010. 154(26): p. 1224-1228.
Tuuli, M.G. and A.O. Odibo, Neonatal outcomes in relation to timing of repeat cesarean delivery at term. Womens Health (Lond Engl), 2009. 5(3): p. 239-42.
Vidic, Z., et al., Timing of elective cesarean section and neonatal morbidity: a population-based study. Journal of Maternal-Fetal and Neonatal Medicine, 2015.
Wax, J.R., et al., Contribution of elective delivery to severe respiratory distress at term. Am J Perinatol, 2002. 19(2): p. 81-6.
Wilmink, F.A., et al., [Timing of elective term caesarean sections; trends in the Netherlands]. Ned Tijdschr Geneeskd, 2014. 158: p. A6951.
Yee, W., H. Amin, and S. Wood, Elective cesarean delivery, neonatal intensive care unit admission, and neonatal respiratory distress. Obstet Gynecol, 2008. 111(4): p. 823-8.
Reviews

165
Dodd, J.M., et al., Elective birth at 37 weeks' gestation for women with an uncomplicated twin pregnancy. Cochrane Database Syst Rev, 2014. 2: p. Cd003582.
Glavind, J. and N. Uldbjerg, Elective cesarean delivery at 38 and 39 weeks: neonatal and maternal risks. Curr Opin Obstet Gynecol, 2015. 27(2): p. 121-7.
Tzur, T., et al., Timing of elective repeat caesarean section: maternal and neonatal morbidity and mortality. J Matern Fetal Neonatal Med, 2011. 24(1): p. 58-64.

166
Referenzen
1. Moher, D., et al., Preferred Reporting Items for Systematic Reviews and Meta-Analyses: The
PRISMA Statement. PLoS Med, 2009. 6(7): p. e1000097.
2. WHO. List of Member States by WHO Region and Mortality Stratum. 2016 [cited 2016
07.06.2016]; Available from: http://www.who.int/choice/demography/mortality_strata/en/.
3. Fletcher RH, F.S., Wagner EH, Haerting J., Klinische Epidemiologie : Grundlagen und
Anwendung. Deutschsprachige Ausg. 2. Aufl. . 2007, Hans Huber Verlag GmbH, 2007.
4. Higgins, J., Green, S (editors). Cochrane Handbook for Systematic Reviews of Interventions
Version 5.1.0 [updated March 2011]. The Cochrane Collaboration, 2011. Available from
www.cochrane-handbook.org.
5. ÄZQ. Klinische Studie. 2015 09.06.2016]; Available from:
http://www.leitlinien.de/leitlinienmethodik/leitlinien-glossar/glossar/klinische-studie.
6. Valtonen, M., J. Kanto, and P. Rosenberg, Comparison of propofol and thiopentone for
induction of anaesthesia for elective caesarean section. Anaesthesia, 1989. 44(9): p. 758-62.
7. Wells, G., Shea, B, O'Connell, D, Peterson, J, Welch, V, Losos, M, Tugwell, P. The Newcastle-
Ottawa Scale (NOS) for assessing the quality of nonrandomised studies in meta-analyses. Available from: http://www.ohri.ca/programs/clinical_epidemiology/oxford.asp.
8. Zanardo, V., et al., Neonatal respiratory morbidity risk and mode of delivery at term:
influence of timing of elective caesarean delivery. Acta Paediatr, 2004. 93(5): p. 643-7.
9. Zanardo, V., et al., The influence of timing of elective cesarean section on neonatal
resuscitation risk. Pediatr Crit Care Med, 2004. 5(6): p. 566-70.
10. Chiossi, G., et al., Timing of delivery and adverse outcomes in term singleton repeat cesarean
deliveries. Obstet Gynecol, 2013. 121(3): p. 561-9.
11. Vilchez, G., et al., Maternal race and neonatal outcomes after elective repeat cesarean
delivery. J Matern Fetal Neonatal Med, 2014. 27(4): p. 368-71. 12. Vilchez, G., et al., Risk of neonatal mortality according to gestational age after elective repeat
cesarean delivery. Arch Gynecol Obstet, 2015.
13. National Institute for Health and Care Excellence (NICE). Caesarean section. 2011
17.05.2016]; Available from: https://www.nice.org.uk/guidance/cg132.
14. Royal College of Obstetricians and Gynecologists (RCOG). Birth after Previous Caesarean
Birth. 2015 17.05.2016]; Available from: https://www.rcog.org.uk/en/guidelines-research-
services/guidelines/gtg45/.
15. Glavind, J., et al., Elective caesarean section at 38 weeks versus 39 weeks: neonatal and
maternal outcomes in a randomised controlled trial. Bjog, 2013. 120(9): p. 1123-32.
16. Melamed, N., et al., Timing of planned repeat cesarean delivery after two or more previous
cesarean sections--risk for unplanned cesarean delivery and pregnancy outcome. J Matern
Fetal Neonatal Med, 2014. 27(5): p. 431-8.
17. Nakashima, J., et al., Elective Cesarean section at 37 weeks is associated with the higher risk
of neonatal complications. Tohoku J Exp Med, 2014. 233(4): p. 243-8.
18. Yamazaki, H., et al., Neonatal clinical outcome after elective cesarean section before the
onset of labor at the 37th and 38th week of gestation. Pediatr Int, 2003. 45(4): p. 379-82.
19. Wilmink, F.A., et al., Neonatal outcome following elective cesarean section of twin
pregnancies beyond 35 weeks of gestation. Am J Obstet Gynecol, 2012. 207(6): p. 480.e1-7.
20. Alderdice, F., et al., Admission to neonatal intensive care with respiratory morbidity following
'term' elective caesarean section. Ir Med J, 2005. 98(6): p. 170-2. 21. Doan, E., K. Gibbons, and D. Tudehope, The timing of elective caesarean deliveries and early
neonatal outcomes in singleton infants born 37–41 weeks' gestation. Australian and New
Zealand Journal of Obstetrics and Gynaecology, 2014. 54(4): p. 340-347.
22. Balchin, I., MB ChB, MSc, John C. Whittaker, BSc (Hons), PhD, Ronald F. Lamont, DM, FRCOG,
and M. and Philip J. Steer, FRCOG, Timing of Planned Cesarean Delivery by Racial Group.
Obstet Gynecol Clin North Am, 2008. 111: p. 659–66.

167
23. Finn, D., et al., Neonatal outcomes following elective caesarean delivery at term: a hospital-
based cohort study. J Matern Fetal Neonatal Med, 2016. 29(6): p. 904-10.
24. Gawlik, S., et al., Timing of elective repeat caesarean does matter: Importance of avoiding
early-term delivery especially in diabetic patients. J Obstet Gynaecol, 2015. 35(5): p. 455-60.
25. Many, A., et al., Neonatal respiratory morbidity after elective cesarean section. J Matern Fetal
Neonatal Med, 2006. 19(2): p. 75-8.
26. McAlister, B.S., M. Tietze, and S. Northam, Early term birth: the impact of practice patterns
on rates and outcomes. West J Nurs Res, 2013. 35(8): p. 1026-42.
27. Morrison, J.J., J.M. Rennie, and P.J. Milton, Neonatal respiratory morbidity and mode of
delivery at term: influence of timing of elective caesarean section. Br J Obstet Gynaecol, 1995. 102(2): p. 101-6.
28. Wilmink, F.A., et al., Neonatal outcome following elective cesarean section beyond 37 weeks
of gestation: a 7-year retrospective analysis of a national registry. Am J Obstet Gynecol,
2010. 202(3): p. 250.e1-8.
29. Zanardo, V., et al., The influence of timing of elective cesarean section on risk of neonatal
pneumothorax. J Pediatr, 2007. 150(3): p. 252-5.
30. Matsuo, K., et al., Is 38 weeks late enough for elective cesarean delivery? International
Journal of Gynecology and Obstetrics, 2008. 100(1): p. 90-91.
31. Terada, K., et al., Timing of elective cesarean singleton delivery and neonatal respiratory
outcomes at a Japanese perinatal center. J Nippon Med Sch, 2014. 81(4): p. 285-8. 32. Bailit, J.L., et al., Maternal and neonatal outcomes by labor onset type and gestational age.
Am J Obstet Gynecol, 2010. 202(3): p. 245.e1-245.e12.
33. Clark, S.L., et al., Neonatal and maternal outcomes associated with elective term delivery. Am
J Obstet Gynecol, 2009. 200(2): p. 156.e1-4.
34. Graziosi, G.C.M., et al., Elective caesarean section preferably after at least 38 complete weeks
of pregnancy. Nederlands Tijdschrift voor Geneeskunde, 1998. 142(42): p. 2300-2303.
35. Nir, V., E. Nadir, and M. Feldman, Late better than early elective term Cesarean section. Acta
Paediatr, 2012. 101(10): p. 1054-7.
36. Parikh, L., et al., Timing and consequences of early term and late term deliveries. J Matern
Fetal Neonatal Med, 2014. 27(11): p. 1158-62. 37. Resende, M.C., L. Santos, and I. Santos Silva, [Neonatal Morbidity in Term Newborns Born by
Elective Cesarean Section]. Acta Med Port, 2015. 28(5): p. 601-7.
38. Tracy, S.K., M.B. Tracy, and E. Sullivan, Admission of term infants to neonatal intensive care: a
population-based study. Birth, 2007. 34(4): p. 301-7.
39. Vidic, Z., et al., Timing of elective cesarean section and neonatal morbidity: a population-
based study. J Matern Fetal Neonatal Med, 2016. 29(15): p. 2460-2.
40. Hansen, A.K., et al., Risk of respiratory morbidity in term infants delivered by elective
caesarean section: cohort study. Bmj, 2008. 336(7635): p. 85-7.
41. Farchi, S., et al., Timing of repeat elective caesarean delivery and neonatal respiratory
outcomes. Arch Dis Child Fetal Neonatal Ed, 2010. 95(1): p. F78. 42. Tita, A.T., et al., Timing of elective repeat cesarean delivery at term and neonatal outcomes.
N Engl J Med, 2009. 360(2): p. 111-20.
43. Zanardo, V., et al., Neonatal resuscitation by laryngeal mask airway after elective cesarean
section. Fetal Diagn Ther, 2004. 19(3): p. 228-31.
44. Bailit, J.L., et al., Maternal and neonatal outcomes by labor onset type and gestational age.
American journal of obstetrics and gynecology, 2010. 202(3): p. 245.e1-245.e12.