Embed Size (px)
Citation preview

End-User Mapping: Next Generation Request
Routing for Content Delivery
Fangfei Chen
Akamai Technologies
150 Broadway
Cambridge, MA
Ramesh K. Sitaraman
University of
Massachusetts, Amherst
& Akamai Technologies
Marcelo Torres
Akamai Technologies
150 Broadway
Cambridge, MA
ABSTRACTContent Delivery Networks (CDNs) deliver much of the world’sweb, video, and application content on the Internet today. Akey component of a CDN is the mapping system that uses theDNS protocol to route each client’s request to a “proximal”server that serves the requested content. While traditionalmapping systems identify a client using the IP of its nameserver, we describe our experience in building and rolling-out a novel system called end-user mapping that identifiesthe client directly by using a prefix of the client’s IP ad-dress. Using measurements from Akamai’s production net-work during the roll-out, we show that end-user mappingprovides significant performance benefits for clients who usepublic resolvers, including an eight-fold decrease in map-ping distance, a two-fold decrease in RTT and content down-load time, and a 30% improvement in the time-to-first-byte.We also quantify the scaling challenges in implementing end-user mapping such as the 8-fold increase in DNS queries. Fi-nally, we show that a CDN with a larger number of deploy-ment locations is likely to benefit more from end-user map-ping than a CDN with a smaller number of deployments.
1. INTRODUCTIONContent Delivery Networks (CDNs) deliver much of the
world’s web sites, video portals, e-commerce applications,social networks, and file downloads. As an example, Aka-mai’s CDN currently serves 15-30% of all web traffic from alarge distributed platform of over 170,000 servers deployedin over 102 countries and 1300 ISPs around the world [2].The CDN hosts and delivers content on behalf of thousandsof enterprises and organizations that represent a microcosmof the Internet as a whole, including business services, finan-Permission to make digital or hard copies of all or part of this work for personalor classroom use is granted without fee provided that copies are not made ordistributed for profit or commercial advantage and that copies bear this noticeand the full citation on the first page. Copyrights for components of this workowned by others than the author(s) must be honored. Abstracting with credit ispermitted. To copy otherwise, or republish, to post on servers or to redistribute tolists, requires prior specific permission and/or a fee. Request permissions [email protected] ’15, August 17 - 21, 2015, London, United Kingdomc� 2015 Copyright held by the owner/author(s). Publication rights licensed to
ACM. ISBN 978-1-4503-3542-3/15/08. . . $15.00DOI: http://dx.doi.org/10.1145/2785956.2787500
Content&Server&
Client&
Origin&
Mapping&System&
Overlay&Transport&
Figure 1: A Content Delivery Network
cial services, travel, manufacturing, automotive, media, en-tertainment, e-commerce, software, gaming, and the publicsector. The clients1 who access content on Akamai’s CDNare a representative sample of Internet users from nearly ev-ery country, every major ISP, and use every major device.
The goal of a CDN is to host and deliver content and ap-plications to clients around the world with high availabil-ity, performance, and scalability [13, 21]. Akamai’s CDNachieves its goal by deploying a large number of serversin hundreds of data centers around the world, so as to be“proximal” in a network sense to clients. To understand theoverall architecture of the CDN, we enumerate the steps in-volved when a client accesses content hosted on the CDN.As shown in Figure 1, when the client accesses a Web page,the domain name of the Web page is translated to the IP ad-dress (shortened to “IP” in this paper) of a server that is live,has sufficient capacity, and is proximal to the client. Thedomain name translation is provided by the CDN’s mappingsystem that we study in this paper. The client requests con-tent from the server assigned to it by the mapping system. Ifthe server has the content in cache, it serves the content tothe client. Otherwise, the server requests the content fromthe origin servers that are operated by the content provider
1In this paper, we use the term “client” to denote the end-user or his/her device such as a cell phone, desktop or laptopthat is connected to the Internet and is running software suchas a browser capable of accessing Web pages.

and and serves it to the client. For a more detailed discussionof CDN evolution and architecture, we refer to [21].
A central component of Akamai’s CDN is its mappingsystem. The goal of the mapping system is to maximize theperformance experienced by the client by ensuring quickerdownloads of the accessed content. To speedup the down-loads, the mapping system routes each client request to a“proximal” server that can be reached by the client with lowlatency and loss. Further, the mapping system ensures thatthe chosen server is live, not overloaded, and is likely to con-tain the requested content. The last consideration reduces theprobability of a cache miss at the server that would result inthe content being fetched from origin with longer responsetimes. Conceptually, the mapping system can be viewed ascomputing the following complex time-varying function:
MAPt : ⌃Internet⇥⌃Akam⇥Domain⇥LDNS ! IPs. (1)
At each time t, MAPt takes as input the current state of theglobal Internet ⌃Internet, including detailed real-time knowl-edge of connectivity, liveness, latency, loss, and throughputinformation; the current state of Akamai’s CDN ⌃Akam, in-cluding real-time knowledge of liveness, load, and other in-formation about servers and routers of the CDN; the domainname of the content that is being accessed by the client;and, the local recursive domain name server (LDNS) thatmakes the request for domain name resolution on behalf ofthe client. The mapping system returns two or more IPs2 ofthe CDN’s servers that can serve the requested content.
Akamai’s mapping system routes trillions of client requestsper day, controlling tens of terabits per second of contenttraffic served to clients world-wide. On a typical day, thereare 6.4 million LDNS servers located in 240 countries mak-ing 1.6 million DNS queries per second (cf. Figure 2), rep-resenting 30 million client requests per second around theglobe. Ever since the first CDNs were built at Akamai nearlysixteen years ago [13], the mapping system has been the sub-ject of much research to improve its responsiveness and ac-curacy. However, as represented in Equation 1, traditionalmapping systems at CDNs make request routing decisionsbased on the identity of the client’s LDNS rather than that ofthe client itself. We call this NS-based mapping and can beinaccurate in cases when the LDNS is not in a “similar” lo-cation as the client, i.e., when the network characteristics ofthe LDNS is not a good proxy for that of the client. This fun-damental limitation arises from the use of the domain namesystem (DNS) protocol that allows the mapping system tolearn the identity of the LDNS but not the client on whosebehalf the domain name translation request is made.
To rectify the limitations of the DNS protocol, Google,Akamai and others industry players have recently proposedan extension to the DNS protocol that allows a recursivename server to specify a prefix of the client’s IP (usuallya /24 prefix) when requesting domain name translations onbehalf of a client [11]. For the first time, this mechanism al-
2While the mapping system checks liveness before return-ing the IP of a server, more than one server is returned as aadditional precaution against transient failures.
010
2030
4050
60
Req
uest
s pe
r sec
ond
(milli
on)
Jan 07 Jan 10 Jan 13 Jan 16 Jan 19
0
1
2
3
4
5
6
Que
ries
per s
econ
d (m
illion
)
Client requestsDNS queries
Figure 2: Client requests served (left axis) and DNS queriesresolved (right axis) by the mapping system. When the map-ping system resolves a DNS query from a LDNS, multiplecontent requests from clients that use that LDNS may follow.
lows the novel possibility of building a mapping system thathas direct knowledge about the client and uses it to providemore accurate mappings. We call such a system end-usermapping. The insights gained from building and rolling-outAkamai’s end-user (EU) mapping system is our focus.
Our contributions. We list key contributions below.1. The limitations of NS-based mapping caused by dis-
crepancies in the locations of clients and LDNSes have beenknown for over a decade [24]. However, we provide the firstpublic analysis of clients and their LDNSes at a global scaleacross the entire Internet using data from 584 thousand nameservers and 3.76 million /24 client IP blocks across 37294AS’es and 238 countries across the world.
2. Our work presents the architecture and real-world roll-out of Akamai’s end-user mapping, a major conceptual ad-vance in mapping technology. We capture the performanceimpact of the roll-out on actual clients around the world.Web performance is a complex phenomena that is influencedby the global state of the Internet, the connectivity of theclient, properties of Web sites and their hosting infrastruc-ture, and a multitude of other factors. Our work capturesthe impact of the new mapping paradigm in a real-world set-ting providing insights that are hard to obtain in a controlledexperimental setting.
3. End-user mapping requires both measurements andanalysis to be performed at a much larger scale, as mappingdecisions are made at a much finer granularity. Using ex-tensive data from clients and their LDNS architectures in theglobal Internet and measurements taken during the end-usermapping roll-out, we provide insights into the scaling con-siderations in using the EDNS0 client-subnet extension ofthe DNS protocol.
4. Using latency measurements from over 2500+ serverdeployment locations around the world to 8K representativeclient IP blocks that generate the most traffic on the Internet,we study the important question of how deployments impactthe performance of traditional NS-based and end-user map-ping. We show that end-user mapping provides more incre-mental benefits for a CDN with servers in a large numberof deployed locations than a CDN deployed in fewer loca-tions. Further, we expose an inherent limitation of NS-basedmapping in reducing latencies for the worst 1% of clients.

Roadmap. In Section 2, we describe the architecture ofa traditional NS-based mapping system and how end-usermapping can be incorporated into this architecture using theEDNS0 client-subnet extension. In Section 3, we analyzethe relative locations of clients and their LDNSes in the globalInternet with the view of understanding the benefits that weare likely to see from rolling-out end-user mapping. In Sec-tions 4 and 5, we analyze the performance and scalabilityimpact of our roll-out of end-user mapping system to clientswho use public resolvers. In Section 6, we study the role ofserver deployments in end-user mapping. In Section 7 wepresent related work and conclude in Section 8.
2. THE MAPPING SYSTEMA Web site hosted on Akamai typically delegates author-
ity for its domain names to authoritative name servers thatare part of the mapping system. Further, each client usesa “local” domain name server3 (LDNS) that works in a re-cursive fashion to provide domain name translations for theclient. The LDNS that provides domain name service forthe client is typically hosted by the Internet Service Provider(ISP) who provides Internet connectivity to the client. Alter-nately, the LDNS could be an public resolver that is a nameserver deployed by a third-party provider that can be usedby the client. The location of the LDNS with respect to theclient depends on the DNS architecture of the name serviceprovider, whether it be an ISP or a public resolver providersuch as Google DNS [5] or OpenDNS [7].
To better illustrate Akamai’s mapping system, we tracethrough the steps of how a client interacts with the system toobtain a domain name resolution (see Figure 3).
(1) Suppose that the client wants to access content at someWeb site that is hosted on Akamai. The client requests itsLDNS to resolve the domain name of the Web site.
(2) LDNS works in a recursive mode as follows. If theLDNS has a valid name resolution for the requested domainin its cache, it responds to the client with the relevant IPs.Otherwise, the LDNS forwards the request to an authorita-tive name server for the requested domain.
(3) The authoritative name server responds with a validresolution to the LDNS. LDNS caches the response and inturn forwards the response to the client.
Note that a DNS response from an authoritative name serveris associated with a TTL (time-to-live) that dictates how longthe response is valid. TTL’s are tracked and enforced asthe response is forwarded and cached downstream by nameservers and resolvers, including the LDNS and the client’sresolver. When the TTL expires, the cached entry is madeinvalid, requiring a new DNS resolution.
NS-based versus end-user mapping. In a traditional NS-based mapping system, the LDNS does not forward any in-formation about the client when it contacts the authorita-tive name servers in step (2) above. Hence, the mappingsystem does not know the IP of the client that requestedthe name resolution and assigns edge servers entirely based3Despite its name, a LDNS may not be very “local” to theclient, the key rationale for end-user mapping.
TOPOLOGYDISCOVERY SCORING
(authoritative)
LOAD BALANCING
LOCALGLOBAL
TOP LEVEL LOW LEVELPERIODIC REAL-TIME
NETWORK MEASUREMENT
INTERNET
Server Assignment
DNS
LDNS(recursive)CLIENT
CONTENT
DATA
MappingSystem
NAME SERVERS
Figure 3: The architecture of the mapping system
LDNS(recursive)
CLIENT(A.B.C.D)
ContentDownload
(authoritative)NAME SERVERSSERVER
(E.F.G.H)
E.F.G.H
foo.net?
foo.net?for A.B.C.D/24
E.F.G.Hfor A.B.C.D/20
Figure 4: Example of interaction between the client, LDNS,and Akamai’s name servers with the EDNS0 extension.
on the IP of its LDNS. However, in end-user mapping, theLDNS forwards a prefix of the client’s IP to the authorita-tive name servers in step (2) above using the newly-proposedEDNS0 client-subnet extension. This enables the end-usermapping to use additional client information in providingdomain name translations as we describe next.
2.1 End-User MappingEnd-user mapping deployed recently at Akamai uses the
identity of the client rather than its LDNS. Conceptually,end-user mapping (EUMAP) computes the following timevarying function.
EUMAPt : ⌃Internet ⇥⌃Akam ⇥Domain⇥Client ! IPs.
(2)Compared to NS-based mapping (see Equation 1), end-usermapping uses the client information to make more accuratemapping decisions, even in cases where the LDNS and theclient are not proximal to each other. A key enabler for ourend-user mapping design is a recent Internet draft to extendthe DNS protocol called the EDNS0 client-subnet extensionthat allows recursive name servers to forward informationabout the client as a part of their DNS request [11]. Figure 4shows the interaction between the client, recursive, and au-thoritative name servers for an example domain foo.net

when the name servers support the EDNS0 protocol exten-sion. The client with IP A.B.C.D contacts its LDNS toresolve foo.net. With extension support, when the LDNSforwards the request for foo.net to an authoritative nameserver it can append a /x prefix of the IP of the client whoinitiated the request, where the prefix4 used is generally /24.(By /x prefix we mean the first x bits of the IP.) The authori-tative name servers, which in the case of a domain hostedon Akamai is part of the mapping system, responds withserver IPs appropriate for a /y prefix of the client’s IP wherey x, i.e., the name server can return a resolution that isvalid for a superset of the client’s /x IP block. (By client’s/x IP block, we mean the set of IPs that have same first xbits as the client’s IP.) The DNS resolution provided by theauthoritative name server can be cached for the duration ofthe TTL by downstream recursive name servers such as theLDNS. However, the cached resolution is only valid for theIP block for which it was provided and not for any client IPsthat do not belong to the block.
2.2 Mapping System ArchitectureThe mapping system consists of three major functional
components as shown in Figure 3 that we describe in turn.We also use data collected from the network measurementcomponent below for our analysis.1) Network Measurement. Both the global Internet andAkamai’s CDN are monitored and measured. The data thatneeds to be collected on both counts is enormous and varied.The Internet is a large “patchwork” of 71K autonomous sys-tems (AS’s) that interconnect with each other in complex andever-changing ways. The server and network components ofAkamai’s CDN are deployed in clusters in more than a thou-sand networks around the globe. A few major sources ofdata collected include:
(i) AS-level information is collected by Akamai’s BGPcollectors installed around the Internet that initiate BGP ses-sions with ISP’s and periodically records the BGP sessionstate. This information is used to understand which IPs be-long to which AS, how AS’es connect with each other, etc.
(ii) Geographic information such as the city, state, coun-try, and continent is deduced for IPs around the world usingvarious data sources and geolocation methods [1].
(iii) Name server information is collected using the DNSrequest logs for Akamai-hosted domains from name servers(i.e., LDNSes) around the world.
(iv) Network-level measurements include path informa-tion, latency, loss, and throughput between different pointson the Internet.
(v) Liveness and load. Liveness and load information ofall components of Akamai’s CDN is collected in real-time,including servers and routers.2) Server Assignment. The server assignment componentuses network measurement data to create a real-time topo-logical map of the Internet that captures how well the differ-ent parts of the Internet connect with each other, a process
4A prefix longer than /24 is discouraged to retain client’sprivacy.
called topology discovery. The topological map is then usedto evaluate what performance clients of each LDNS is likelyto see if they are assigned to each Akamai server cluster, aprocess called scoring. Different scoring functions that in-corporate bandwidth, latency, packet loss, etc can be used fordifferent traffic classes (web, video, applications, etc). Theload balancing module assigns servers to each client requestin two hierarchical steps: first it assigns a server cluster foreach client, a process called global load balancing. Next, itassigns server(s) within the chosen cluster, a process calledlocal load balancing. To perform these tasks, the load bal-ancer uses the output of scoring to evaluate candidate serverchoices that yield the highest performance for each client re-quest and combines that information with liveness, capacity,and other real-time information about the CDN. The loadbalancing algorithms are described in greater detail in [19].3) Name Servers. Akamai has a large distributed systemof name servers around the world that act as authorities forAkamai-hosted domain names. For example, a content provi-der hosted on Akamai can CNAME their domain to an Aka-mai domain, for example, www.whitehouse.gov couldbe CNAME’d to the Akamai domain of e2561.b.akamaiedge.net.The authority for the latter domain is in turn delegated toan Akamai name server that is typically located in an Aka-mai cluster that is close to the client’s LDNS. This dele-gation step implements the global load balancer choice ofcluster for the client’s LDNS, so different clients could re-ceive different name server delegations. Finally, the dele-gated name server returns “A” records for two or more serverIPs to be used by the client for the download, implementingthe choices made by the local load balancer.
3. UNDERSTANDING CLIENTS ANDTHEIR NAME SERVERS
To motivate the need for end-user mapping, we start byanalyzing the locations of clients relative to their recursivename servers (i.e., LDNS) in the global Internet. To obtainan accurate picture we need to match a large characteristicset of clients around the world with their respective LDNSes.The matched client-LDNS pairs can then be located usingour geo-location database [1] to provide the geographic lo-cation and network information needed for the analysis.
3.1 Collecting Client-LDNS pairsAssociating a client with its LDNS has some intrinsic dif-
ficulties. Both the LDNS’s request for a domain name reso-lution and the client’s subsequent request for an URL on thatdomain are logged at Akamai’s authoritative name serversand content servers respectively. One potential approachis to match these requests to obtain client-LDNS pairings.However, matching the requests is tricky and inexact sincethe two requests can be spaced within a time window equalto the TTL of the domain name. Further, when the client re-ceives a cached response from its LDNS, the LDNS makesno corresponding downstream request to Akamai’s author-itative name servers. While there are heuristic ways of ob-taining a smaller sample of client-LDNS pairs [24], our chal-

lenge is to obtain a large characteristic and definitive set ofpairs that have good coverage of the clients who generatetraffic on the global Internet.
To obtain a large set of pairs, we use Akamai’s downloadmanager called NetSession [3]. NetSession is installed onclient devices and is used to perform downloads in a fasterand more reliable fashion. Software and media publishersopt-in to use Netsession features to improve http deliveryperformance for their content. Once they opt-in, clients useNetsession to download that content. Thus, Netsession hasa large, representative installed base of clients around theworld, making it an ideal measurement platform for our anal-ysis. More than 30 million unique NetSession clients per-form transactions every month.
NetSession was instrumented to collect LDNS informa-tion as follows. Each NetSession client maintains a persis-tent connection with a NetSession control plane. Even if theclient is behind a NAT, it can reliably learn its external clientIP from this persistent connection. NetSession clients alsofound their LDNS server performing a “dig” command on aspecial Akamai name whoami.akamai.net. The client-LDNS association was then sent to Akamai’s cloud storagefor processing. The LDNS information for clients aroundthe world were then aggregated in the cloud to the granular-ity of /24 client IP blocks. Specifically, for each /24 clientIP block, the process generates the set of IPs correspondingto the LDNSes used by the clients in that address block. Foreach LDNS in the set, the relative frequency with which thatLDNS appeared was computed.
Using the above process, we collected LDNS data fromMarch 24 to April 7, 2014. On average, about 14.8 mil-lion records were processed per day during the course of ourdata collection. Client-LDNS association data for a total of3.76 million /24 client IP blocks was computed in aggre-gate. While the clients that use NetSession are generally afraction of the total active clients in any given /24 client IPblock, our coverage of /24 client IP blocks is representativeand significant of the overall Internet. In particular, the /24client IP blocks in our dataset account for about 84.6% ofthe total global client demand5 served by Akamai. The num-ber of distinct LDNSes in our data set was just over 584,000.Thus, our data set is a large representative cross-section ofclients and LDNSes in the global Internet.
To derive client-LDNS distance estimates, we use Aka-mai’s Edgescape [1] geo-location database that uses registrydata and network data distilled from transactions handled byover 170,000 Akamai servers in 102 countries and over athousand ISP deployments around the world to establish ge-ographical location and network information for IPs aroundthe world. Edgescape can provide the latitude, longitude,country and autonomous system (AS) for an IP. For IPs inmobile networks, the mobile gateway location is used as thereference location. To derive the distance between a client-LDNS pair we use the latitude and longitude information tocompute the great circle distance between the two locations.
5Client demand is a measure of the amount of content trafficdownloaded by a client (or by clients in an IP block).
0%
10%
20%
30%
40%
10 100 1000 10000Client−LDNS distance (miles)
Perc
ent o
f clie
nt d
eman
d
Figure 5: Histogram of client-LDNS distance for clientsacross the global Internet.
0
2500
5000
7500
IN TR VN MX
BR ID AU RU IT JP US
MY
CA
DE FR GB NL
AR TH CH ES HK
KR SG TW
Country
Clie
nt−L
DN
S di
stan
ce (m
iles)
Figure 6: Client-LDNS distances by country.
3.2 How far are clients from their LDNSesFigure 5 shows the overall global distribution of client
LDNS distances. Nearly half of the client population is lo-cated very close to its LDNS. The most typical distance liesin a range that is no greater than the diameter of a metropoli-tan area. At around 200-300 miles, there is a noteworthyincrease in the marginal distribution. At around 5000 miles,there is another increase that can be attributed to the smallnumber of clients that use LDNS that are either across theAtlantic or Pacific oceans.
Breakdown by country. Breaking these distances downby country, Figure 6 is a box-plot6 representing the 5th, 25th,median, 75th, and 95th quantiles of the per-country distribu-tions. We list data for the top 25 countries as measured byaggregate client demand. Overall, most countries have a me-dian distance that is fairly small, though India, Turkey, Viet-nam and Mexico have median distances over 1000 miles. In-dia, Brazil, Australia, and Argentina have significant popu-lations whose LDNSes are very far away as over a quarter ofthe population is served by LDNSes whose distance is over
6All box plots in this paper show 5th, 25th, 50th, 75th and95th percentiles.
4500 miles. Western Europe sees low distances appearing ina small band. However, Korea and Taiwan are significant inhaving the smallest distances. This is not surprising consid-ering the well-developed Internet infrastructure and the con-centration of populations within a small geographical area inthe major cities in these countries. Japan has a small mediandistance but a significant fraction of clients have LDNSesthat are far away. One reason is clients at multi-national cor-porations with centralized LDNSes deployed outside Japan.
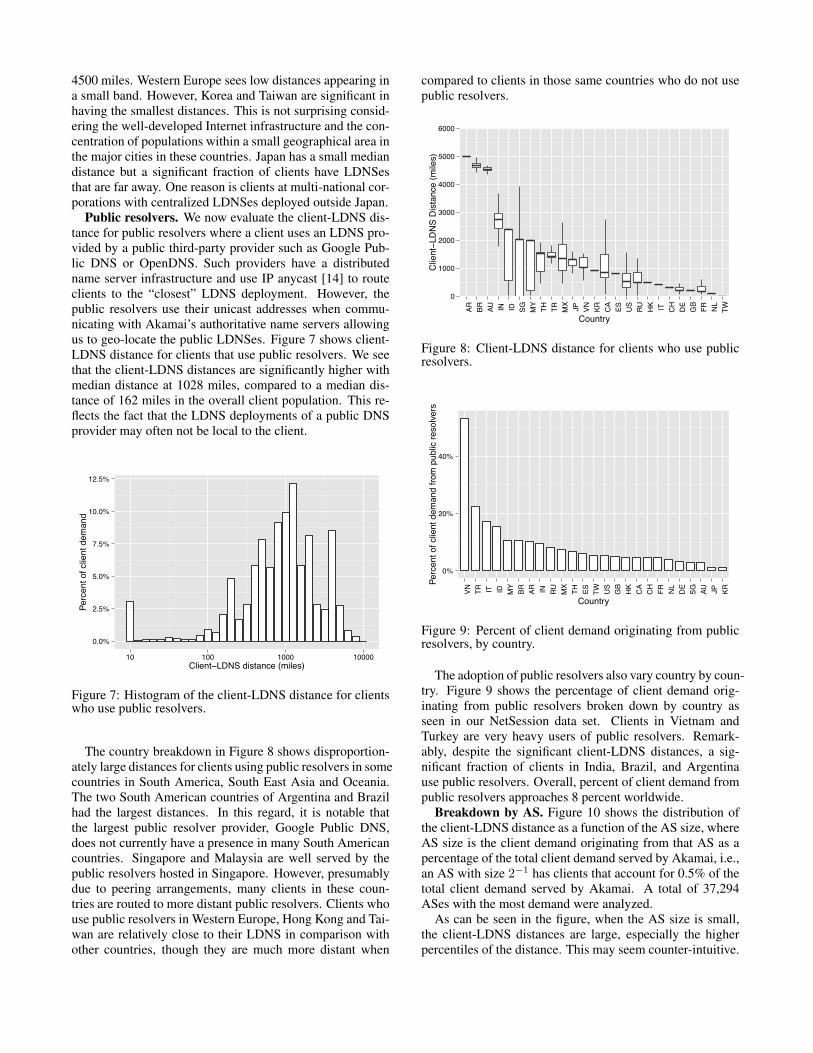
Public resolvers. We now evaluate the client-LDNS dis-tance for public resolvers where a client uses an LDNS pro-vided by a public third-party provider such as Google Pub-lic DNS or OpenDNS. Such providers have a distributedname server infrastructure and use IP anycast [14] to routeclients to the “closest” LDNS deployment. However, thepublic resolvers use their unicast addresses when commu-nicating with Akamai’s authoritative name servers allowingus to geo-locate the public LDNSes. Figure 7 shows client-LDNS distance for clients that use public resolvers. We seethat the client-LDNS distances are significantly higher withmedian distance at 1028 miles, compared to a median dis-tance of 162 miles in the overall client population. This re-flects the fact that the LDNS deployments of a public DNSprovider may often not be local to the client.
0.0%
2.5%
5.0%
7.5%
10.0%
12.5%
10 100 1000 10000Client−LDNS distance (miles)
Perc
ent o
f clie
nt d
eman
d
Figure 7: Histogram of the client-LDNS distance for clientswho use public resolvers.
The country breakdown in Figure 8 shows disproportion-ately large distances for clients using public resolvers in somecountries in South America, South East Asia and Oceania.The two South American countries of Argentina and Brazilhad the largest distances. In this regard, it is notable thatthe largest public resolver provider, Google Public DNS,does not currently have a presence in many South Americancountries. Singapore and Malaysia are well served by thepublic resolvers hosted in Singapore. However, presumablydue to peering arrangements, many clients in these coun-tries are routed to more distant public resolvers. Clients whouse public resolvers in Western Europe, Hong Kong and Tai-wan are relatively close to their LDNS in comparison withother countries, though they are much more distant when
compared to clients in those same countries who do not usepublic resolvers.
0
1000
2000
3000
4000
5000
6000
AR BR AU IN ID SG MY
TH TR MX JP VN KR CA ES US
RU HK IT CH DE
GB
FR NL
TW
Country
Clie
nt−L
DN
S D
ista
nce
(mile
s)
Figure 8: Client-LDNS distance for clients who use publicresolvers.
0%
20%
40%VN TR IT ID M
YBR AR IN RU M
XTH ES TW U
SG
BH
KC
AC
H FR NL
DE
SG AU JP KR
Country
Perc
ent o
f clie
nt d
eman
d fro
m p
ublic
reso
lvers
Figure 9: Percent of client demand originating from publicresolvers, by country.
The adoption of public resolvers also vary country by coun-try. Figure 9 shows the percentage of client demand orig-inating from public resolvers broken down by country asseen in our NetSession data set. Clients in Vietnam andTurkey are very heavy users of public resolvers. Remark-ably, despite the significant client-LDNS distances, a sig-nificant fraction of clients in India, Brazil, and Argentinause public resolvers. Overall, percent of client demand frompublic resolvers approaches 8 percent worldwide.
Breakdown by AS. Figure 10 shows the distribution ofthe client-LDNS distance as a function of the AS size, whereAS size is the client demand originating from that AS as apercentage of the total client demand served by Akamai, i.e.,an AS with size 2
�1 has clients that account for 0.5% of thetotal client demand served by Akamai. A total of 37,294ASes with the most demand were analyzed.
As can be seen in the figure, when the AS size is small,the client-LDNS distances are large, especially the higherpercentiles of the distance. This may seem counter-intuitive.

0
1000
2000
3000
4000
5000
2−10 2−9 2−8 2−7 2−6 2−5 2−4 2−3 2−2 2−1
Percent of client demand from AS
Med
ian
clie
nt−L
DN
S di
stan
ce (m
iles)
Figure 10: Client-LDNS distance as a function of AS size.
But, the reason is that smaller AS’es include small local ISPswho are more likely to “outsource” their name server infras-tructure to other providers. The reason for the outsourcing iseconomic in nature as the ISP may not want to own and op-erate a name server infrastructure. So, the ISP may choosethe inexpensive option of using a public resolver operatedby a provider such as Google Public DNS, OpenDNS, Level3, UltraDNS, etc. The “outsourcing” of DNS services oftencauses the LDNSes to be non-local, leading to larger client-LDNS distances. A different category of small AS’es withlarge client-LDNS distances are enterprises with geographi-cally diverse branch offices who for operational convenienceuse a centralized name server infrastructure deployed in onlyone of those offices. Given the large client-LDNS distances,we expect end-user mapping to benefit a large fraction ofclients of small AS’es.
Large ISPs typically operate their own name server infras-tructures for their clients. Such infrastructure often consistsof LDNSes that are deployed in multiple geographically dis-tributed locations. To direct clients to the “nearest” LDNS,the IP anycast [16, 15] mechanism is often used. This ex-plains the smaller values of client-LDNS distance despite thelarge geographical area covered by these global ISPs. How-ever, IP anycast has many known limitations [23] that canresult in a fraction of the clients being routed to far awayLDNS locations. Thus, end-user mapping may be beneficialfor clients of large ISPs also.
3.3 How far are clients that use the sameLDNS from each other?
A client cluster is a set of clients that use the same LDNS.The clients on the Internet can be partitioned into client clus-ters, one cluster for each LDNS. We define the radius of aclient cluster to be the mean distance of the clients in thecluster to the centroid of the cluster7. In traditional NS-basedmapping, a client cluster is the unit for making server assign-ment decisions, i.e., all clients in a client cluster are assigned
7Distances are computed using the latitude and longitude ofthe clients from our geo-location database. The radius andcentroid use client demands as the weights.
the same set of server IPs, since they use the same LDNS (cf.Equation 1). If a client cluster of a LDNS has a small ra-dius, i.e., the clients are close together, a more sophisticatedform of NS-based mapping could still be effective, even ifthe client-LDNS distances are large. The reason is that themapping system could discover the client cluster and assignservers that provide good performance for the entire clus-ter. However, if the client cluster has a large radius, i.e., theclients are far away from each other, there may be no singleserver assignment for the entire cluster that is optimal forall clients in it. Thus, it is inherently difficult for NS-basedmapping to perform well when the client cluster has a largeradius, even knowing client-LDNS pairings.
Figure 11 reaffirms that on an overall basis a large fractionof clients are close to their LDNSes and the cluster radii aresmall. However, focusing on the subset of LDNSes that arepublic resolvers, we see that not only are client-LDNS dis-tances large, but cluster radii are large as well. In fact, 99%of the public resolver demand originates from client clus-ters with radii between 470 to 3800 miles. The figure alsoshows that for public resolvers the mean cluster-LDNS dis-tance tends to be larger than the cluster radius. This impliesthat the LDNS is often not deployed at a “central” locationwithin the client cluster that it serves, i.e., near the centroidthat minimize the mean client-LDNS distance. This is inpart due to the fact that a public resolver provider does nothave fine-grained control over which clients in which loca-tions use their service. e.g., clients from countries where theprovider has no deployments often use the service.
0%
25%
50%
75%
100%
10 2500 5000Distance (miles)
Cum
ulat
ive p
erce
nt o
f clie
nt d
eman
d
Cluster radius (all LDNS)Client−LDNS mean distance (all LDNS)Cluster radius (public resolvers)Client−LDNS mean distance (public resolvers)
Figure 11: CDFs of mean client-LDNS distance and clus-ter radius for all LDNSes and for the subset that are publicresolvers.
4. PERFORMANCE IMPACTWe present our experience and insights obtained in de-
ploying end-user mapping for clients around the world in thefirst half of 2014. During this period, Akamai began the roll-out of end-user mapping for clients who use public resolverssuch as Google Public DNS and OpenDNS. The reasons forinitially targeting clients who use public resolvers were two-fold. Based on our analysis of client-LDNS distances in Sec-tion 3, we concluded that clients who use public resolvers

are more likely to benefit from end-user mapping, since theytend to be farther away from their LDNSes (cf. Figure 7)and also had large client cluster radii (cf. Figure 11). Fur-ther, public resolver providers such as Google Public DNSand OpenDNS support the EDNS0 client-subnet extensionthat is required for end-user mapping. The end-user map-ping roll-out8 started on March 28th 2014 and completed onApril 15th 2014. We present insights based on performancemeasurements made before, during, and after the roll-out.
4.1 Performance metricsThe performance experienced by clients who download
web content can be characterized in many different but com-plimentary ways. We use the following four metrics mea-sured from real-world clients downloading content from Aka-mai to evaluate the performance. Each metric sheds lighton a different facet of mapping and client-perceived perfor-mance. Note that we expect all these metrics to decrease(smaller is better) when end-user mapping is rolled out.
1) Mapping distance is the great circle distance betweena client and the server to which it was assigned by the map-ping system. This is a purely geographical metric with nonetwork-related component.
2) Round trip time (RTT) between the client and theserver to which it was assigned. This is simply the TCPRTT measured from the server’s TCP stack. This is purely anetwork-related metric.
3) Time to first byte (TTFB) is the duration from whenthe client makes a HTTP request for the base web page towhen the first byte of the requested web page was receivedby the client. This quantity is measured from the client’sbrowser and includes three components: (i) the time for theclient’s request to reach the server, (ii) time for the server toconstruct the web page, and (iii) time for the first chunk ofthe web page to reach the client. Note that end-user mappingis expected to decrease both the first and third component ofTTFB above by reducing the server-client RTT. However,since many base web pages are “dynamic” and need to bepersonalized for the client, the second component of con-structing the web page may involve fetching personalized el-ements from the origin. Overlay transport is used to speeduporigin-server communication [26], though such transport isnot impacted by the end-user mapping roll-out. Thus, weexpect TTFB to show more modest reductions as end-usermapping impacts only some of its time components.
4) Content download time is the duration from the re-ceiving of the first byte of the page to completing the down-load of the rest of the web page, including the content em-bedded in the page. This metric is also measured from theclient’s browser. The embedded content of web pages aretypically more static and cacheable and includes CSS, im-ages, and JavaScript that are not personalized to the client.Thus, unlike TTFB, we expect this metric to be significantly
8We are unaware of any other Akamai software releasesor Internet events happening during the roll-out period thatcould confound our measurements and conclusions.
impacted by the end-user mapping roll-out as this metric isdominated by client-server latencies.
4.1.1 High and low expectation countriesTo better understand the performance impact, we classify
the countries into two groups: a “high expectation” groupwhere we expect end-user mapping to have a greater impactand a “low expectation” group where we expect the impactto be lower. Our client-LDNS analysis in Section 3.2 givesus an idea of what benefits to expect in which countries.Specifically, Figure 8 shows the proximity of clients to theirLDNS for major countries. Using this analysis, we split themajor countries into two halves. We define the high expecta-tion group to be those clients who reside in countries wherethe median distance to a public resolver is more than 1000miles and the low expectation group to be those whose me-dian distance is under 1000 miles. We aggregate and presentthe performance metrics separately for these two groups, aswe expect them to show different behaviors.
4.2 Collecting performance informationWe collected performance metrics from a large and char-
acteristic set of clients around the world before, during, andafter the end-user mapping roll-out. We used Akamai’s RealUser Measurement (RUM) system [4] for our client-side per-formance measurements. RUM inserts JavaScript into se-lect web pages delivered by Akamai. That JavaScript runsinside the client’s browser when the page is downloadedby the client. The performance measurement is made us-ing the industry-standard navigation timing [6] and resourcetiming APIs [8]. Using these APIs, the JavaScript runninginside the client’s browser collects precise timing informa-tion when the page download is in progress, including whenthe DNS lookup started and completed, when the TCP con-nection was initiated, when the fetch request was sent out,when the first byte of the response was received, and whenall the page content was fully downloaded. Using these tim-ing milestones, metrics such as TTFB and content downloadtime can be computed. The timing measurements performedin client browsers around the world was sent to a backendcloud storage system and was subsequently analyzed to pro-duce the aggregate statistics we provide in this section.
We collected RUM measurements from a wide selectionof Web sites and clients around the world from Jan 1, 2014 toJune 30th, 2014, a period that includes the end-user mappingrollout from March 28th to April 15th. Since the roll-outonly impacts clients who use public resolvers, we identifiedsuch clients using our client-LDNS pairing data described inSection 3.1 and extracted RUM data from only those qual-ified clients. Figure 12 shows the total number of qualifiedRUM measurements collected and used in our analysis fromboth high and low expectation countries. Our data set has 33million to 58 million measurements per month, each monthfrom Jan to June 2014, for a total of 273 million measure-ments. The measurement volume shows an increasing trendon account of more downloads from qualified clients of thepages measured by RUM.
Our goal is to measure performance for a large and char-

acteristic cross section of clients, Web sites, devices, andconnectivities across the global Internet. To achieve that wemeasured 6,388 domain names and 2.5 million unique URLsaccessed by 149,826 unique clients. Our data set includes allmajor client platforms such as Windows, FreeBSD, Linux,Android, iOS, and game consoles, and all major browsers in-cluding Firefox, Opera, Chrome, and IE. Further, our clientsuse a variety of ways to access the Internet including cellu-lar, WiFi, 3G, 4G, DSL, cable modem, and fiber.
0
10
20
30
Dec Jan Feb Mar Apr May JunMea
sure
men
ts p
er m
onth
(milli
on m
easu
rem
ents
)
expectationhighlow
Figure 12: Number of RUM measurements per month.
4.3 Performance AnalysisWe analyze the mapping distance, RTT, TTFB, and con-
tent download time for clients who use public resolvers be-fore, during, and after the roll-out.
1) Mapping distance. Mapping distance shows a signif-icant improvement during the roll-out period of March 28thto April 15th. Figure 13 shows for the high expectationgroup, the mean mapping distance dropped from over 2000miles on average to around 250 miles. Even the low expec-tation countries experienced shorter mapping distance: theaverage mapping distance went from 400 miles to 200 miles.
Figure 14 shows the CDF of the mapping distances forboth high and low expectation countries both before and af-ter the roll-out is completed. The period after the roll-outis April 15th or later and the period before the roll-out isMarch 28th or earlier. Note that all percentiles see improve-ment. But, there is a drastic decrease in the mapping dis-tance around the 90th percentile for high expectation coun-tries from 4573 miles to 936 miles. The decrease is due toimproved mapping distance for clients in large countries likeIndia and Brazil who use public resolvers located in South-east Asia and North America respectively (cf. Figure 8).
2) RTT. Recall that RTT measures the latency between theclient and the server assigned to that client. Unlike mappingdistance, RTT reflects the state of the network path such aspropagation delay, and congestion. As shown in Figure 15,the average RTT for the high expectation group droppedfrom 200ms to 100ms, a significant 50% decrease. But,the improvement for the low expectation group was mod-est. Figure 16 shows the CDF of the RTT for both high andlow expectation countries before and after the roll-out. All
0
1000
2000
Jan Feb Mar Apr May Jun Jul
Map
ping
dis
tanc
e (m
iles)
expectationhighlow
Figure 13: Daily mean of mapping distance.
0%
25%
50%
75%
100%
0 2000 4000 6000 8000Mapping distance (miles)
Cum
ulat
ive p
erce
nt o
f RU
M m
easu
rem
ents
low expectation after rolloutlow expectation before rollouthigh expectation after rollouthigh expectation before rollout
Figure 14: CDFs of mapping distance.
percentiles show improvement. For instance, the 75th per-centile of the RTT decreases significantly from 220 ms to137 ms for the high expectation countries.
3) Time-to-First-Byte. As noted earlier, TTFB includesaspects that are not impacted by better mapping decisions,such as the computation time to generate and transmit a dy-namic web page. Consequently, the gains expressed as apercentage are lower but still significant. Figure 17 showsthat the mean TTFB of the high expectation countries de-creased from around 1000 ms to 700 ms, a 30% improve-ment. Figure 18 shows the CDF of the TTFB for both highand low expectation countries before and after the roll-out.All percentiles show improvement. For instance, the 75thpercentile of the TTFB decreases from 1399 ms to 1072 msfor the high expectation countries and from 830 ms to 667ms for the low expectation ones.
4) Content Download Time. Figure 19 shows a reductionfrom 300 ms to 150 ms for the high expectation countries, a50% reduction. Recall that content download time is domi-nated by server-client latencies and the decrease is more cor-related with corresponding decrease in RTT. The improve-ment for the low expectation group is small as the downloadtime is already small. Figure 20 shows the CDF of the con-tent download time for high and low expectation countriesbefore and after the roll-out. All percentiles show improve-ment, e.g., the 75th percentile of the download time reduces

0
100
200
300
Jan Feb Mar Apr May Jun Jul
RTT
(ms)
expectationhighlow
Figure 15: Daily Mean of Round Trip Time (RTT).
0%
25%
50%
75%
100%
0 200 400 600RTT (ms)
Cum
ulat
ive p
erce
nt o
f RU
M m
easu
rem
ents
low expectation after rolloutlow expectation before rollouthigh expectation after rollouthigh expectation before rollout
Figure 16: CDFs of Round Trip Time (RTT).
from 272 ms to 157 ms for the high expectation group andfrom 192 ms to 102 ms for the low expectation one.
4.4 Why Download Performance MattersFrom our results above, we can conclude that end-user
mapping provides significant performance benefits to clientswho use public resolvers, especially in those countries whereclient-LDNS distances are high. Faster download times suchas those provided by end-user mapping are key to a betterInternet experience, resulting in web pages that load morequickly and videos that start playing sooner. Better down-load performance enhances the client’s experience of a con-tent provider’s Web site, more satisfied clients in turn favor-ably impact the business of the content provider, allowingthe content provider to invest in even greater performanceenhancements, forming a “virtuous cycle” [25]. As an ex-ample, an oft-cited recent study by Walmart labs [12] con-cluded that the download time of Web pages in Walmart’se-commerce site impacts the buying behavior of its users.By correlating RUM performance measurements collectedfor Walmart.com with back-end business metrics, the studyconcluded that a 100 ms decrease in web page downloadtime can result in a 1% increase in revenue and a 1 sec-ond decrease can result in up to a 2% increase in conversion
500
750
1000
1250
Jan Feb Mar Apr May Jun Jul
Tim
e to
firs
t byt
e (m
s)
expectationhighlow
Figure 17: Daily Mean of Time to First Byte (TTFB).
0%
25%
50%
75%
100%
0 1000 2000 3000Time to first byte (ms)
Cum
ulat
ive p
erce
nt o
f RU
M m
easu
rem
ents
low expectation after rolloutlow expectation before rollouthigh expectation after rollouthigh expectation before rollout
Figure 18: CDFs of Time to First Byte (TTFB).
rates9. Numerous other studies show how even a few 100ms increase in page download times of a Web site can de-crease revenues, page views, searches per user, etc [9]. Infact, it is widely held in industry that a Web site that is fasterthan its competing sites by as little as 250 ms has a signif-icant business advantage to be reckoned with [18]. In ad-dition, search engines rank faster Web sites ahead of slowerones and clients often associate greater brand reputation withfaster Web sites. Thus, the “need for speed” is a singular fo-cus for content providers and the CDNs alike and “shavingoff” even tens of milliseconds of Web download times fora cross-section of clients is deemed worthy and important.Besides faster download times, the decrease in mapping dis-tance and RTT due to end-user mapping often means thatthe client-server path crosses fewer AS boundaries, peeringpoints and transnational cable links, hence reducing the like-lihood of congestion and failure. Thus, end-user mappingmay result in more stable and reliable client-server paths.
4.5 The Benefits of EDNS0 AdoptionTo deploy end-user mapping beyond the current set of
clients, the client’s ISP needs to adopt the EDNS0 exten-
9Conversion rate is a key metric for e-commerce sites and isthe percentage of visitors to the site who buy a product.

0
100
200
300
400
Jan Feb Mar Apr May Jun Jul
Con
tent
dow
nloa
d tim
e (m
s)
expectationhighlow
Figure 19: Daily mean of content download time.
0%
25%
50%
75%
100%
0 250 500 750 1000Content download time (ms)
Cum
ulat
ive p
erce
nt o
f RU
M m
easu
rem
ents
low expectation after rolloutlow expectation before rollouthigh expectation after rollouthigh expectation before rollout
Figure 20: CDFs of content download time.
sion for their DNS services. Our results shed light on theperformance benefits such adoption would yield and pro-vides a strong impetus for its adoption. For instance, ex-cluding the public resolvers, we know that 6.2% of the re-maining client demand originates from clients whose LDNSare at least 1000 miles away. Extrapolating from our resultsfor similar clients using public resolvers, we could expecta similar 50% reduction in RTT and content download timefor these clients. Likewise, excluding the public resolvers,clients with LDNSes between 500 to 1000 miles account for5.3% of remaining client demand. Extrapolating from sim-ilar clients who use public resolvers, we can speculate thatthese clients will see a 24% decrease in RTTs and contentdownload times. Of course, 54% of the remaining clientdemand will see no benefit at all from end-user mapping,since they have local LDNSes. However, the fact that at least11.5% of the remaining client demand will see a significantenough performance improvement is sufficient impetus toEDNS0 adoption.
5. SCALING CHALLENGESEnd-user mapping is challenging since it makes mapping
decisions at potentially a much finer granularity than tradi-tional NS-based mapping. There are orders of magnitude
more clients than there are name servers on the global In-ternet. An end-user mapping system must perform morefine-grain network measurements and provide resolutions ata finer scale across the global Internet than a NS-based map-ping, leading to scaling considerations discussed below.
5.1 Tradeoffs in choosing the mapping unitsA mapping unit is the finest-grain set of client IPs for
which server assignment decisions are made by the map-ping system. A traditional NS-based mapping system uses aLDNS as the mapping unit, i.e., all clients in the client clus-ter that use a LDNS are mapped together as a unit. An end-user mapping system could use /x client IP blocks that parti-tion the client IP space, where x 24. A natural first choiceis /24 client IP blocks since LDNSes that support the EDNS0extension currently use /24 IP blocks in their queries.
To understand the scaling issues in switching from NS-based to end-user mapping, let us first examine the numberof relevant /24 client IP blocks on the Internet in compari-son to the number of relevant LDNSes. We use our NetSes-sion data to first compute the demand generated by clientsin each /24 client IP block. We also computed the demandgenerated by each LDNS, where the LDNS demand is sim-ply the demand generated by clients who use that LDNS.We then sorted all the /24 client IP blocks (resp., LDNSes)in decreasing order of demand and plotted a CDF of the de-mand in Figure 21. In the data set, the total number of /24client IP blocks with non-zero demand is 3.76 million, while584 thousand LDNSes have non-zero demand. Suppose themapping system is required to measure and provide mappingdecisions for 95% of the total client demand on the Internet.As the figure shows, an NS-based mapping system need onlymeasure and analyze the top 25,000 LDNSes with the mostdemand, whereas an end-user mapping system must measureand analyze the top 2.2 million /24 client IP blocks, whichis several magnitudes higher. Likewise, to cover 50% of thetotal client demand, the top 1800 LDNSes with the most de-mand suffice, whereas nearly 430,000 of the /24 client IPblocks with the most demand are needed.
0%
25%
50%
75%
100%
1e+01 1e+02 1e+03 1e+04 1e+05 1e+06Number of client IP blocks or LDNS
Cum
ulat
ive p
erce
nt o
f tot
al d
eman
d
Client IP blocksLDNS
Figure 21: Number of /24 client IP blocks or LDNSes thatproduce a given percent of total global demand.
One heuristic approach to reducing the number of map-

● ● ● ●
0%
25%
50%
75%
100%
10 100 1000 10000Cluster radius (miles)
Cum
ulat
ive p
erce
nt o
f tot
al c
lient
dem
and
prefix● /24
/22/20/18/16/14/12/10/8
(a) Histogram of the cluster radius for /x client IP blocks.
0
100000
200000
300000
400000
/8 /10 /12 /14 /16 /18 /20 /22 /24Prefix length
Num
ber o
f clu
ster
s
(b) Number of /x client IP blocks with non-zero demand.
Figure 22: A smaller value of x yields fewer mapping units but larger cluster radius with less mapping accuracy.
ping units for end-user mapping is to use the IP blocks (i.e.,CIDRs) in BGP feeds that are the units for routing in the In-ternet. In particular, if a set of /24 IP blocks belong withinthe same BGP CIDR, these blocks can be combined sincethey are likely proximal in the network sense. We extracted517K unique CIDRs with non-zero traffic from BGP feedsacross the Internet from the network measurement compo-nent of the mapping system. By combining /24 IP blockswhenever they belong to the same BGP CIDR, we reduce thenumber of mapping units from 3.76 million to 444K. Notethat the same technique may be applied to reduce the numberof mapping units for /x IP blocks, for any value of x.
After applying the BGP CIDRs to reduce the number ofmapping units, there is still the tradeoff of what /x client IPblocks to choose as the mapping unit. One could reducethe number of mapping units by using coarser /x client IPblocks, i.e., by choosing a smaller value of x. However,when coarser IP blocks are used, the set of clients in a givenblock is larger and span a larger geographical area. This re-duces mapping accuracy as the client clusters that are theunits of mapping have a larger radius. Figure 22 providesthe exact tradeoff between the cluster radius which is a proxyfor mapping accuracy and the number of clusters that needto be measured and analyzed. It can be seen that /20 clientIP blocks are a worthy option as they reduce the number ofmapping units by a factor of 3 in comparison to /24 blocks.However, the clusters are still relatively small with 87.3% ofthe clusters having a radius of no more than 100 miles.
5.2 Dealing with greater DNS query ratesIn NS-based mapping, each LDNS stores one resolution
per domain name. However, with end-user mapping, differ-ent client IP blocks within the same client cluster may getdifferent resolutions for the same domain name. Thus, anLDNS that serves multiple client IP blocks may store multi-ple entries for the same domain name. Therefore, an LDNSmay make multiple requests to an authoritative name serverfor the domain name, one for each client IP block. This
can lead to a sharp increase in the LDNS queries seen bythe authoritative name servers of the mapping system. Fig-ure 23 shows the total DNS queries per second served bythe mapping system before, during, and after enabling end-user mapping for clients who use public resolvers. Prior tothe roll-out, the total queries per second served by Akamai’sname servers was 870K queries per second of which pub-lic resolvers targeted by the roll-out accounted for roughly33.5K queries per second. But after the rollout, the totalqueries per second on the Akamai network was 1.17 millionqueries per second of which public resolvers accounted for270K queries per second. Thus, the queries from public re-solvers increased by a factor of 270K/33.5K = 8, an increaselargely attributable to the roll-out10. The gradual increase inquery rate seen outside of the roll-out window is simply dueto the normal increase in Internet traffic over time.
600000
800000
1000000
1200000
1400000
1600000
Jan Feb Mar Apr May Jun Jul
Que
ries
per s
econ
d
Figure 23: DNS queries received by Akamai’s name serversfrom LDNSes showed a significant increase during the end-user mapping rollout.
10DNS queries increase when public resolvers turn on theEDNS0 extension. But, the performance improvements inSection 4.3 occur when Akamai gradually turned on end-user mapping for these public resolvers.

1
10
100
1000
0 0.1 0.2 0.3 0.4 0.5 0.6 0.7 0.8 0.9 1Popularity of Domain name and LDNS pairs (in queries per TTL)
Fact
or in
crea
se in
que
ry ra
te
Figure 24: More popular domain name and LDNS pairsshow a greater increase in query rate after the roll-out.
The popularity of a domain name among the clients ofan LDNS influences the factor increase in DNS queries forthat domain name when EDNS0 and end-user mapping areturned on. Prior to the end-user mapping roll-out, the queryrate for a domain name from a particular LDNS is at mostone query per TTL, since the LDNS can cache the transla-tion for the time of the TTL. We bucket each domain nameand LDNS pair according to the number of queries receivedper TTL prior to the roll-out. Figure 24 shows the factor in-crease in query rate for domain name and LDNS pairs thatfall into each bucket. Note that the more popular domainname and LDNS pairs that have pre-roll-out query rates closeto 1 query per TTL saw the largest increase in query ratewhen end-user mapping was rolled out, while less popu-lar domains saw little or no increase. The reason is that amore popular domain name is more likely to be accessedby clients in multiple client IP blocks of the LDNS’s clientcluster, each IP block requiring a separate domain name res-olution when EDNS0 is used. Fortunately, the domain nameand LDNS pairs in the highest popularity bucket in Figure 24accounted for only 11% of total pre-roll-out queries.
6. ROLE OF SERVER DEPLOYMENTSServer deployments play an important role in determining
client performance. More server deployment locations meanbetter performance for clients, since the mapping system hasmore options to choose a proximal server for each client.But, what role do deployments play in determining the ad-ditional performance benefits provided by end-user mappingover NS-based mapping? Should a CDN with a small num-ber of deployment locations adopt end-user mapping? For aCDN with a given set of deployment locations, what is morebeneficial: adding more deployment locations or incorporat-ing end-user mapping? How much can NS-based mappingbe improved by making it client-aware?
To provide intuition on these key what-if questions, con-sider a simplified model. Let a CDN have N deploymentlocations. The deployments partition the IP address spaceof the global Internet into sets Ei, 1 i N , such thatEi is the set of IPs for whom the i
th deployment location
is the most proximal among all deployments. Observe thatfor any client c, if c and its LDNS are both in some set Ei,both end-user mapping and traditional NS-based mappingwill pick a server in the i
th deployment location for clientc, i.e., there is no additional benefit for client c from usingend-user mapping. Thus, if a CDN has fewer deployments,each set Ei is likely larger and is hence more likely to con-tain both the client and its LDNS. Thus, we would expect aa CDN with fewer deployments to benefit less from end-usermapping than a CDN with more deployments. We quantifyanswers to this and other key questions using simulations.
Simulation Methodology. We create a universe U ofpossible deployment locations by using 2642 different lo-cations around the globe with Akamai servers. These de-ployments are spread over 100 countries and were chosento provide good coverage of the global Internet. Next, wechoose around 20K /24 IP blocks that account for most of theload on the Internet and further cluster them into 8K “pingtargets”, so as to cover all major geographical areas and net-works around the world. We then perform latency measure-ments using pings from each deployment U to each of the8K ping targets. For any client or LDNS, we find the clos-est of the 8K ping targets and use that as a proxy for la-tency measurements, i.e., the latency measurements to theping target are assumed to be the latency measurements tothe client or LDNS. Using the ping latency measurementsdescribed above, we simulate three mapping schemes, eachwith a varying number of deployment locations.
(1) NS-based mapping (NS): Map client to the deploymentlocation that has the least latency to the LDNS of that client.
(2) End-user mapping (EU): Map client to the deploymentlocation that has the least latency to the client’s /24 IP block.
(3) Client-Aware NS-based Mapping (CANS): For eachclient, find the cluster of clients that shares its LDNS. Mapclient to the deployment location that minimizes the traffic-weighted average of the latencies from the deployment to itscluster of clients.
Note that CANS mapping is an enhancement of pure NSmapping by using the latency measurements to the clientsof the LDNS, rather than just the latency measurement tothe LDNS. In situations where LDNS is far away from itsclients, but its clients are themselves relatively close together,CANS mapping could provide low latency mappings. CANsrequires tracking client-LDNS associations on an ongoingbasis on the global Internet, an additional complexity in com-parison with NS mapping. However, CANS can be viewedas a hybrid between NS and EU that uses client measure-ments but requires no specific knowledge about the client’sIP, i.e., it does not require the EDNS0 protocol extension.
We simulated the three mapping schemes above for a vary-ing number of deployment locations N chosen from the uni-verse U . We performed 100 random runs of our simulation,where we do the following in each run. We randomly or-der the deployments in U. Then, for each N , we simulate allthree mapping schemes assuming the first N deployments inthe random ordering. The simulation computes the traffic-weighted mean, 95th, and 99
th percentile latencies achievedby the three schemes. Finally, for each value of N , we av-
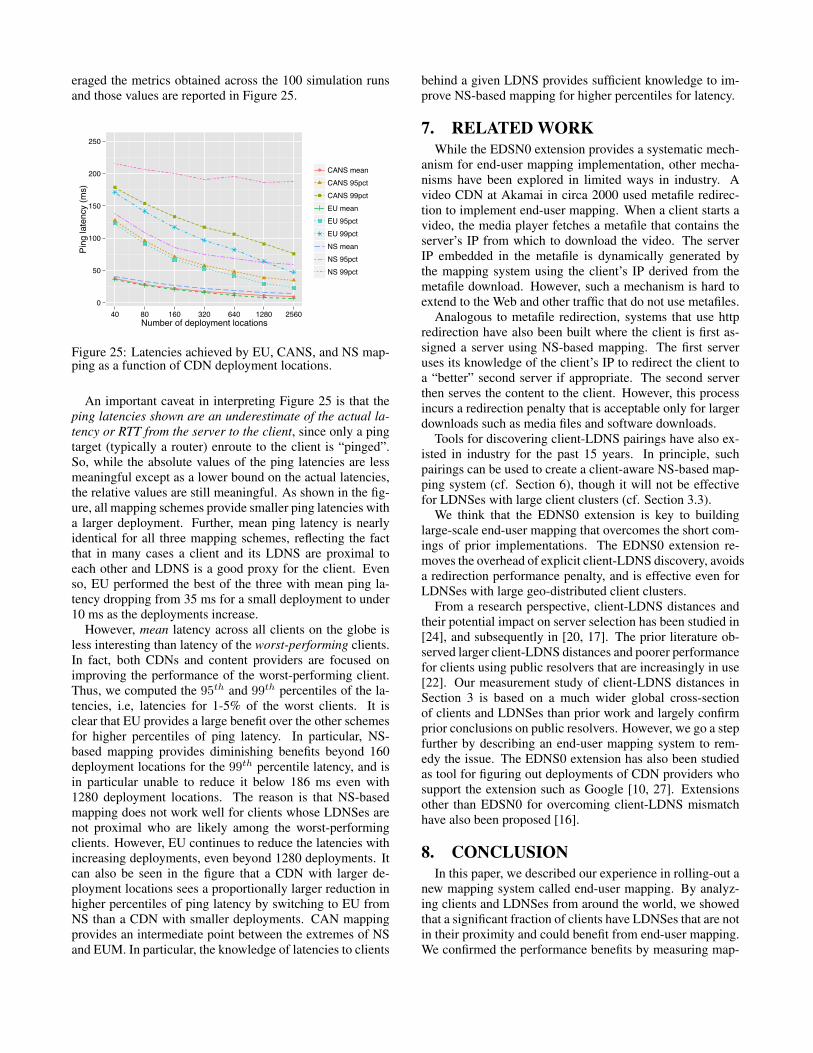
eraged the metrics obtained across the 100 simulation runsand those values are reported in Figure 25.
●
●●
●● ● ●
0
50
100
150
200
250
40 80 160 320 640 1280 2560Number of deployment locations
Ping
late
ncy
(ms)
● CANS meanCANS 95pctCANS 99pctEU meanEU 95pctEU 99pctNS meanNS 95pctNS 99pct
Figure 25: Latencies achieved by EU, CANS, and NS map-ping as a function of CDN deployment locations.
An important caveat in interpreting Figure 25 is that theping latencies shown are an underestimate of the actual la-tency or RTT from the server to the client, since only a pingtarget (typically a router) enroute to the client is “pinged”.So, while the absolute values of the ping latencies are lessmeaningful except as a lower bound on the actual latencies,the relative values are still meaningful. As shown in the fig-ure, all mapping schemes provide smaller ping latencies witha larger deployment. Further, mean ping latency is nearlyidentical for all three mapping schemes, reflecting the factthat in many cases a client and its LDNS are proximal toeach other and LDNS is a good proxy for the client. Evenso, EU performed the best of the three with mean ping la-tency dropping from 35 ms for a small deployment to under10 ms as the deployments increase.
However, mean latency across all clients on the globe isless interesting than latency of the worst-performing clients.In fact, both CDNs and content providers are focused onimproving the performance of the worst-performing client.Thus, we computed the 95
th and 99
th percentiles of the la-tencies, i.e, latencies for 1-5% of the worst clients. It isclear that EU provides a large benefit over the other schemesfor higher percentiles of ping latency. In particular, NS-based mapping provides diminishing benefits beyond 160deployment locations for the 99
th percentile latency, and isin particular unable to reduce it below 186 ms even with1280 deployment locations. The reason is that NS-basedmapping does not work well for clients whose LDNSes arenot proximal who are likely among the worst-performingclients. However, EU continues to reduce the latencies withincreasing deployments, even beyond 1280 deployments. Itcan also be seen in the figure that a CDN with larger de-ployment locations sees a proportionally larger reduction inhigher percentiles of ping latency by switching to EU fromNS than a CDN with smaller deployments. CAN mappingprovides an intermediate point between the extremes of NSand EUM. In particular, the knowledge of latencies to clients
behind a given LDNS provides sufficient knowledge to im-prove NS-based mapping for higher percentiles for latency.
7. RELATED WORKWhile the EDSN0 extension provides a systematic mech-
anism for end-user mapping implementation, other mecha-nisms have been explored in limited ways in industry. Avideo CDN at Akamai in circa 2000 used metafile redirec-tion to implement end-user mapping. When a client starts avideo, the media player fetches a metafile that contains theserver’s IP from which to download the video. The serverIP embedded in the metafile is dynamically generated bythe mapping system using the client’s IP derived from themetafile download. However, such a mechanism is hard toextend to the Web and other traffic that do not use metafiles.
Analogous to metafile redirection, systems that use httpredirection have also been built where the client is first as-signed a server using NS-based mapping. The first serveruses its knowledge of the client’s IP to redirect the client toa “better” second server if appropriate. The second serverthen serves the content to the client. However, this processincurs a redirection penalty that is acceptable only for largerdownloads such as media files and software downloads.
Tools for discovering client-LDNS pairings have also ex-isted in industry for the past 15 years. In principle, suchpairings can be used to create a client-aware NS-based map-ping system (cf. Section 6), though it will not be effectivefor LDNSes with large client clusters (cf. Section 3.3).
We think that the EDNS0 extension is key to buildinglarge-scale end-user mapping that overcomes the short com-ings of prior implementations. The EDNS0 extension re-moves the overhead of explicit client-LDNS discovery, avoidsa redirection performance penalty, and is effective even forLDNSes with large geo-distributed client clusters.
From a research perspective, client-LDNS distances andtheir potential impact on server selection has been studied in[24], and subsequently in [20, 17]. The prior literature ob-served larger client-LDNS distances and poorer performancefor clients using public resolvers that are increasingly in use[22]. Our measurement study of client-LDNS distances inSection 3 is based on a much wider global cross-sectionof clients and LDNSes than prior work and largely confirmprior conclusions on public resolvers. However, we go a stepfurther by describing an end-user mapping system to rem-edy the issue. The EDNS0 extension has also been studiedas tool for figuring out deployments of CDN providers whosupport the extension such as Google [10, 27]. Extensionsother than EDSN0 for overcoming client-LDNS mismatchhave also been proposed [16].
8. CONCLUSIONIn this paper, we described our experience in rolling-out a
new mapping system called end-user mapping. By analyz-ing clients and LDNSes from around the world, we showedthat a significant fraction of clients have LDNSes that are notin their proximity and could benefit from end-user mapping.We confirmed the performance benefits by measuring map-

ping distance, RTT, Time-To-First-Byte (TTFB), and con-tent download time during the roll-out. We showed that for“high-expectation” countries, clients using public resolverssaw an eight-fold decrease in mean mapping distance, a two-fold decrease in RTT and content download time, and a 30%improvement in the TTFB. We also quantified the scalingchallenges in implementing end-user mapping such as the 8-fold increase in DNS queries and the greater number of map-ping units that need to be measured and analyzed. Finally,we shed light on the role of deployments and showed that aCDN with a larger number of deployment locations is likelyto benefit more from end-user mapping than a CDN with asmaller number. While we only describe the roll-out of end-user mapping to clients who are using public resolvers, ouranalysis shows that a broad roll-out of this technology acrossthe entire Internet population will be quite beneficial. Forsuch a roll-out to occur, more ISPs would need to supportthe EDNS0 extension. We expect our work that quantifiesthe real-world benefits of end-user mapping to provide im-petus to a broader adoption of the EDNS0 extension.
9. ACKNOWLEDGEMENTSFirst and foremost, we thank the many engineers at Aka-
mai who designed, implemented and rolled-out end-user map-ping, making it possible for us to evaluate its impact. Specialthanks to Mike Conlen who helped collect DNS query data,to Pablo Alvarez who made key contributions to end-usermapping scoring, and to Jason Moreau who made major con-tributions to name server design. We thank our anonymousreferees for copious reviews that helped improve the paper.A special thanks to our shepherd Ethan Katz-Bassett whoprovided lots of great feedback that strengthened the paper.
10. REFERENCES[1] Akamai Edgescape. http://goo.gl/P68U6q.[2] Akamai Facts & Figures. http://goo.gl/Megx1b.[3] Akamai NetSession Interface. http://goo.gl/FOtjlz.[4] Akamai Real User Monitoring. http://goo.gl/8oiQyC.[5] Google Public DNS. https://goo.gl/p8cfJm.[6] Navigation Timing. http://goo.gl/ePcQrG.[7] OpenDNS. https://www.opendns.com/.[8] Resource Timing. http://goo.gl/5eYQtL.[9] Velocity and the bottom line. http://goo.gl/KTlcYR.
[10] M. Calder, X. Fan, Z. Hu, E. Katz-Bassett,J. Heidemann, and R. Govindan. Mapping theexpansion of Google’s serving infrastructure. InProceedings of the ACM Internet MeasurementConference, pages 313–326, 2013.
[11] C. Contavalli, W. van der Gaast, D. Lawrence, andW. Kumari. Client subnet in DNS requests. IETFInternet Draft, Nov. 2014.
[12] C. Crocker, A. Kulick, and B. Ram. Real usermonitoring at walmart.com: A story in three parts. InSan Francisco and Silicon Valley Web PerformanceGroup, Feb 2012. http://minus.com/msM8y8nyh.
[13] J. Dilley, B. M. Maggs, J. Parikh, H. Prokop, R. K.Sitaraman, and W. E. Weihl. Globally distributedcontent delivery. IEEE Internet Computing,6(5):50–58, 2002.
[14] X. Fan, J. Heidemann, and R. Govindan. Evaluatinganycast in the domain name system. In Proceedings ofthe IEEE INFOCOM, pages 1681–1689, 2013.
[15] T. Hardie. Distributing authoritative name servers viashared unicast addresses. RFC 3258, Apr. 2002.
[16] C. Huang, I. Batanov, and J. Li. A practical solution tothe client-LDNS mismatch problem. SIGCOMMComput. Commun. Rev., 42(2):35–41, Mar. 2012.
[17] C. Huang, D. A. Maltz, J. Li, and A. Greenberg.Public DNS system and global traffic management. InProceedings of the IEEE INFOCOM, pages2615–2623, 2011.
[18] S. Lohr. For impatient web users, an eye blink is justtoo long to wait. New York Times, Feb 2012.http://goo.gl/y70JgH.
[19] B. M. Maggs and R. K. Sitaraman. Algorithmicnuggets in content delivery. SIGCOMM Comput.Commun. Rev., July 2015.
[20] Z. M. Mao, C. D. Cranor, F. Douglis, M. Rabinovich,O. Spatscheck, and J. Wang. A precise and efficientevaluation of the proximity between Web clients andtheir local DNS servers. In USENIX Annual TechnicalConference, General Track, pages 229–242, 2002.
[21] E. Nygren, R. Sitaraman, and J. Sun. The AkamaiNetwork: A platform for high-performance Internetapplications. ACM SIGOPS Operating SystemsReview, 44(3):2–19, 2010.
[22] J. S. Otto, M. A. Sánchez, J. P. Rula, and F. E.Bustamante. Content delivery and the naturalevolution of DNS: remote DNS trends, performanceissues and alternative solutions. In Proceedings of theACM Internet Measurement Conference, pages523–536, 2012.
[23] S. Sarat, V. Pappas, and A. Terzis. On the use ofanycast in DNS. In Proceedings of the IEEE ICCCN,pages 71–78, 2006.
[24] A. Shaikh, R. Tewari, and M. Agrawal. On theeffectiveness of DNS-based server selection. InProceedings of the IEEE INFOCOM, volume 3, pages1801–1810, 2001.
[25] R. K. Sitaraman. Network performance: Does it reallymatter to users and by how much? In FifthInternational Conference on Communication Systemsand Networks (COMSNETS), pages 1–10. IEEE, 2013.
[26] R. K. Sitaraman, M. Kasbekar, W. Lichtenstein, andM. Jain. Overlay networks: An Akamai perspective. InAdvanced Content Delivery, Streaming, and CloudServices. John Wiley & Sons, 2014.
[27] F. Streibelt, J. Böttger, N. Chatzis, G. Smaragdakis,and A. Feldmann. Exploring EDNS-client-subnetadopters in your free time. In Proceedings of the ACMInternet Measurement Conference, 2013.