Embed Size (px)
Citation preview

Association for Information SystemsAIS Electronic Library (AISeL)
ICIS 1986 Proceedings International Conference on Information Systems(ICIS)
1986
END USER LEARNING BEHAVIOR IN DATAANALYSIS AND DATA MODELING TOOLSSirkka L. JarvenpaaUniversity of Texas at Austin
Jefry J. MacheskyWashington Square Capitol Inc.
Follow this and additional works at: http://aisel.aisnet.org/icis1986
This material is brought to you by the International Conference on Information Systems (ICIS) at AIS Electronic Library (AISeL). It has been acceptedfor inclusion in ICIS 1986 Proceedings by an authorized administrator of AIS Electronic Library (AISeL). For more information, please [email protected].
Recommended CitationJarvenpaa, Sirkka L. and Machesky, Jefry J., "END USER LEARNING BEHAVIOR IN DATA ANALYSIS AND DATA MODELINGTOOLS" (1986). ICIS 1986 Proceedings. 31.http://aisel.aisnet.org/icis1986/31

END USER LEARNING BEHAVIOR INDATA ANALYSIS AND DATA MODELING TOOLS
Sirkka L. JarvenpaaSchool of Business
University of Texas at Austin
Jefry J. MacheskyWashington Square Capitol Inc.
ABSTRACTThe research examined naive user analysts' learning of data analysis skills; namely. (1)the difficulty of learning data analysis, (2) the differential learning rates among develop-ment tools, and (3) the dimensions of the tools contributing to the learning differences. Atotal of fifty-six students participated in two experiments. The experiments involvedrepeaied trials of practice and feedback in drawing application-based data models. Onaverage, the participants were experienced end users of computer systems in organiz-ations. The two tools examined in the experiments were the logical data structure model(LDS), which is based on the entity-relationship concept, and the relational data model(RDM). The correctness of the models improved over the trials in both LDS and RDMgroups with LDS users performing better than RDM users, particularly in terms of repre-senting relationships. LDS users were found to be more top-down motivated in theirmethod of analysis than RDM users. The study suggests that among end users, the LDSformalism is more easily learned than the RDM formalism. The results also imply thatend-user training should stress conceptual top*wn analysis, not bottom-up outputdirected analysis.
INTRODUCTION languages, users (i.e., naive analysts) primarilyneed to describe the data and relationships forThe development of high quality systems by end an application (Harel and McLean, 1985). Littleusers requires effective training and tools that empirical research exists on how people learn tosupport and improve the users' problem-solving conceptualize, analyze, and design data.approaches (Davis, 1982; Alavi, 1985). Yet toprovide effective training and tools, we must un- The objective of this research is to investigatederstand the skills needed to perform analysis, how available development tools support naivedesign, and programming tasks. Much of the analysts in learning data analysis. The keyexisting behavioral work on development has in- questions of the research are: (1) How difficultvestigated programming (Pennington, 1982; is data analysis for naive analysts7 Does the rateSheil, 1981). Few studies have addressed analy- at which naive analysts learn vary for differentsis or design (Jeffries, et al., 1980; Vitalari and tools? And if so, which dimensions of a toolDickson, 1983). Within analysis and design, contribute to learning differences? The nextdata instead of procedure specification is of par- section presents the theoretical concepts under-ticular importance because with non-procedural lying the research and the propositions studied.
152
The research methodology and the analysis of Learningdata for the two experiments then follow.,Thepaper concludes with the discussion of the re- Anderson (1982) has proposed a three-stagesults obtained and directions for further learning model for cognitive skills (Figure 1).research. In the first (cognitive) stage, the instruction for
the skill being taught is encoded as a set ofdeclarative statements about the skill. This iscalled dedarative knowledge. In the second
CONCEPTUAL FRAMEWORK (associative) stage, a smooth procedure isworked out to perform the skill as the compiledstatements reveal their procedural form. This is
Data Analysis called procedural knowledge. In the third(autonomous) stage, the procedural form of the
Data analysis is concerned with the identifica- skill undergoes a process of continual refine-
tion and definition of data objects and relation- ment, which results in increased speed and ac-
ships required by the system under analysis.1 curacy in perforrnance of the skill. AutomationData analysis is a subset of systems analysis. is believed to occur primarily in low-level skillsWeinberg (1980) defines systems analysis as "the (Wiederbeck, 1985).examination, identification, and evaluation ofthe components (data and processes) and theirinterrelationships involved in systems..." (p. 6). Stage 1: Cognitive
Stage 2: AssociativeThe process of data analysis is primarily cog-nitive in nature; other skills, such as interper- Stage 3: Autonomoussonal interaction and organizational skills,facilitate the cognitive process. Data analysis in-volves (Jeffries, et. at., 1980; Borgida et. al., Figure 1.1985; Ridjanovic, 1985): 3-Stage Learning Model of Cognitive Skills.
1.partitioning the original problem Data analysis, like programming or reading, in-into a collection of subproblems volves both low- and high-level skills. Low-levelwith manageable data structures. skills include knowledge of the notation and
grammar of the formalism, and knowledge of2. deriving the relevant information the formation and meaning of a simple data
objects. model. High-level skills involve the knowledgeused to construct complex data models and may
3. understanding and representing the even require some level of automation of low-relationships among objects. level skills. The current research examines the
learning of low-level skills among naiveanalysts. We expect that:
4. formulating questions to refine anddiscover omissions or inconsisten- Proposition 1: Construction of even
cies in objects and relationships. simple data models requires learning.
These cognitive procedures used to accomplish the task of data analysis combine to form a cog-nitive skill or a set of cognitive skills. Tools for Data Analysis
The rate of learning is expected to vary by thetool used. A tool for data andlysis is any com-bination of formalism (notation and grammar)and method that helps an analyst interpret and
lNote that some authors USe the term 'data analysis' to represent the meaning of data. The tool thatrefer to a much broader range of tasks, including conceptual best supports naive analysts in their learningdesign, schema design and database design (e.g., Howe, data analysis skills is believed to be the one that1983). has the closest "cognitive fit" with the analyst's
153

natural skills and abilities. This is because naive oval to represent an entity, which is not likely toanalysts do not have the frequent exposure or be confused with a report. LDS also fulfills theconditioning to a particular tool necessary to ad- discriminality criterion better than RDM;just their behavior to the tool's idiosyncracies namely, there is one and only one symbol to ex-and limitations. Both (1) the formalism of the press each concept in.the formalism. RDM, ontool and (2) the method of analysis that the tool the other hand, uses a box for the three primarypromotes are believed to affect the cognitive fit. constructs.
First, we postulate that the tool that has a for- The differences in perceptual characteristics ofmalism with the greatest syntactical clarity and the LDS and RDM are expected to lead naivediscriminality in its notation and grammar puts analysts to produce data models differently. Thethe least amount of burden on a naive analyst's centrality and prominence of the symbol for anmemory and processing resources. The min- entity in LDS is expected to promote top-downimized mental load should favorably contribute processing. Ridjanovic (1985) has suggestedto cognitive fit and, in turn, to learning. Percep- that LDS leads a naive analyst to concentratetual obviousness of the syntactical notation has first on entities and relationships, followed bybeen argued by others to influence learning and attributes, thereby eliciting top-down processing.performance (Green, 1980). Conversely, due to the dominance of "attribute
boxes," a naive analyst using RDM is expected toSecond, a tool that promotes a top-down produc- proceed bottom-up, identifying attributes first,tion of data models is postulated to have a better then drawing a "box" around the attributes, andcognitive fit to a naive analyst than a tool that finally naming the "box." Another reason that apromotes a bottom-up production of models. bottom-up approach to data analysis is moreBottom-up processing entails abstraction from likely when using RDM than LDS is that RDMbasic inputs, or data, to general principles such does not force the analyst to draw entities (oras entities, whereas top-down processing relies relations). With RDM, attributes can be iden-on first deriving the general concepts, such as tified and grouped to form an entity.entities, followed by detailed attributes (Palmer,1975; Norman and Bobrow, 1976). Simon In summary, LDS is postulated to provide a bet-(1981) has argued that people process infor- ter "cognitive fit," and thus, result in fastermation more efficiently when complex struc- learning and more top-down motivated analysistures are represented in a top-down hierarchical than RDM. We expect that:fashion.
Proposition 2: LDS users produceTo test the arguments for the formalism and more accurate data models and in lessmethod of analysis, two data modeling tools are time than RDM usersselected for comparative testing: (1) logical datastructure (LDS), which is based on the entity- Proposition 3: LDS users adopt a top-relationship model, and (2) relational data down approach; RDM users adopt amodel (RDM)(see Carlis (1985) for an explana- bottom-up approach to data analysis.tion of the LDS formalism and Tsichritzis andLochovsky (1982) for an explanation of theRDM formalism). Note that the research onlyused the formalisms of the tools to examinelearning behavior in the construction of simple EXPERIMENTIstatic data models. The purpose of the researchwas not to establish the overall superiority of ei-ther formalism.) LDS is believed to have a for- Designmalism with greater syntactical clarity and dis-criminality than RDM (see Figure 2). An ex- The two treatrnent variables were (1) the dataample of perceptual clarity in LDS is the symbol modeling tool (RDM vs. LDS), and (2) theof a relationship. A line inherently implies con- mount of practice (number of trials). The de-nection. In contrast, a relationship in RDM is pendent variables were (1) accuracy of the datarepresented implicitly by a data element. The model produced, (2) time to draw the dataclarity of RDM is further reduced by the use of model, (3) knowledge about the notation anda 'table' as a relation, because novices might grammar of the formalism, and (4) approacheasily mistake a table for a report. LDS uses an followed in drawing the data model.
154

Entit
y/C
ardi
nalit
yId
entif
ier
Attr
ibut
eR
elat
ion
Figure 2. LDS and RDM Notation.LDS RDM
Notation Example Notation Example
(Name) Journal
f Journal- LY
2.46' AAB Foreign-ID Journal-ID
es Article )..# k / (Name) Article Published-in
ttlour-n 644Journal-Name
(Name) Journal
/ Journal (Name) Journal-Name
Journal-IDJournal
(Name)Journal (Name) · Journal-ID
,) C Ardde
Not Possible Using Standard Notation
lili\\V / I (Sh (Name) Article Published-in)) t-/ Foreign IDI Journal-ID
1:M Journal
Journal-ID
InferredFrom Placement of Foreign Identifier
155
Independent variables Task structure was controlled by keeping thepresentation sequence of task information con-
The tool variable consisted of providing subjects stant for each application. Each set of taskwith the notation and grammar for either the materials contained (1) a task description,LDS or RDM formalism, and instructions for which included the enterprise rules (e.g., an ar-carrying out the analysis (i.e., method). The in- ticle never appears in more than one journal),structions for RDM included rules to normalize (2) output requirements (e.g., a list of articlesmodels using the concept of functional depen- and authors including article-title and author-dency. Instructions to normalize were not in- name), and (3) sample output reports for the ap-cluded in LDS because it is argued that the use plication (see Appendix A). Task difficulty wasof LDS automatically results in normalized held constant by using applications that weremodels (Carlis, 1985). familiar and easy for people to understand, such
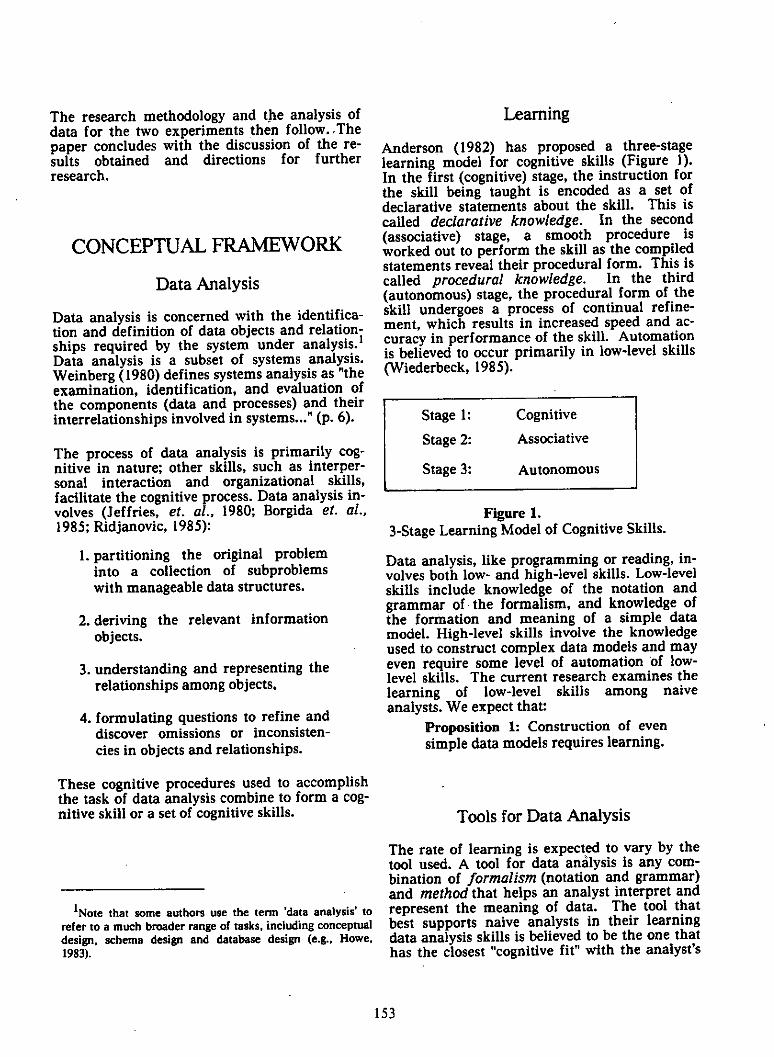
as keeping track of articles for future reference.Figure 3 illustrates the general data analysis me- Additionally, to insure that subjects could notthod that was included in instructions for both get the correct model by copying the model fromLDS and RDM groups. The method was in- previous tasks, none of the entities, attributes, orcluded because, while LDS and RDM for- relationships occurred more than once. To con-malisms were expected to guide the processing trol time pressure, the four tasks shared theof data for analysis, their subtle guidance was same time limit and had one-page task descrip-not considered sufficient help for naive analysts. tions with a mean of 261 words and a standardThe method in Figure 3 was constructed using deviation of 5 words.the data modeling literature (e.g., Carlis, 1985),introspections of an expert data analyst, an ex-perienced and a naive data analyst, and the se- Measurement of dependent variablescond author's practical experience in data analy-sis. The method was constructed so as not to im- Subjects were measured on four dependent vari-pose any direction for processing of data. Sub- ables.jects were free to process data either top-down,bottom-up, or some variation of both. 1. The.accuracy of data models pro-
duced was the primary measure ofThe practice variable consisted of exposing sub- procedural or skill knowledgejects to four experimental trials. Drawing a . gained by the subject. The accuracydata model for a particular application task con- was assessed against the "correct"stituted an experimental trial. The order of data model on three dimensions:presentation of the four tasks was balancedacross the subjects to control for order effects. a. the number of required en-
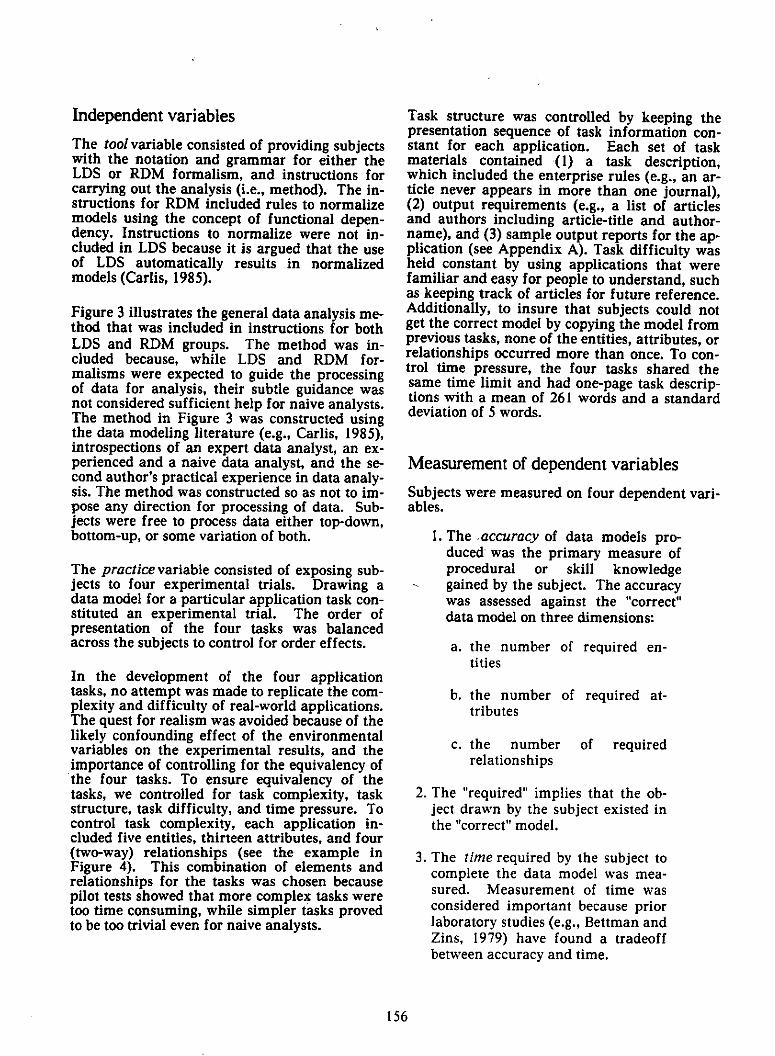
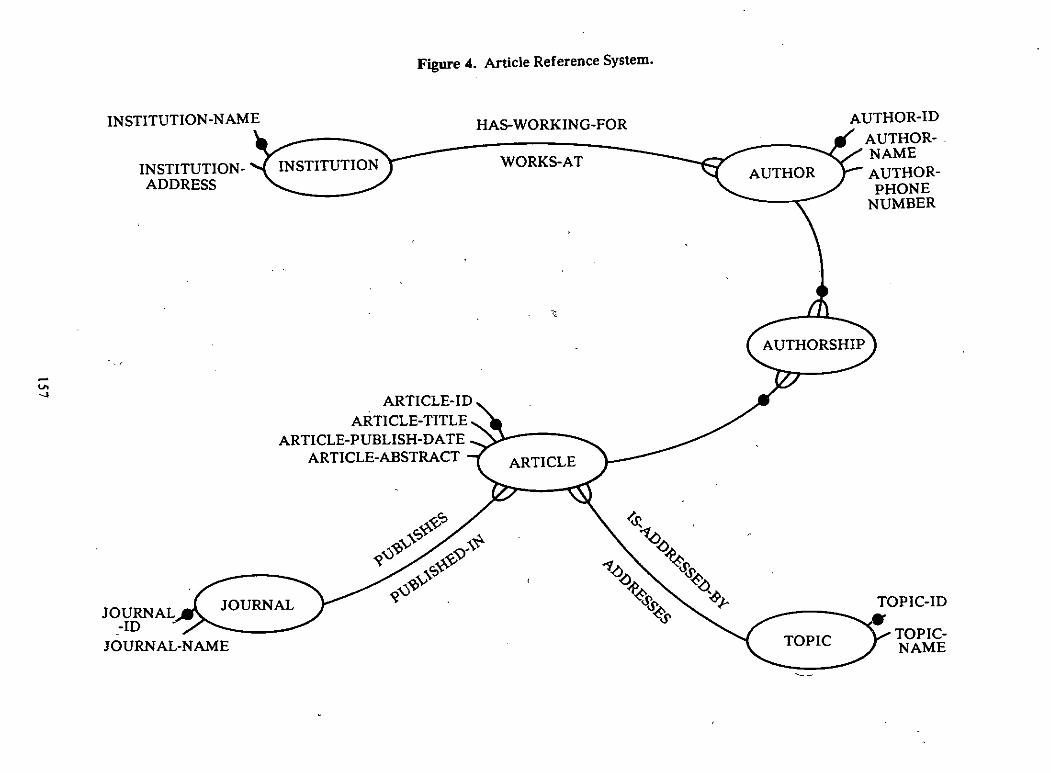
titiesIn the development of the four applicationtasks, no attempt was made to replicate the com- b. the number of required at-plexity and difficulty of real-world applications. tributesThe quest for realism was avoided because of thelikely confounding effect of the environmental c. the number of requiredvariables on the experimental results, and theimportance of controlling for the equivalency of relationshipsthe four tasks. To ensure equivalency of thetasks, we controlled for task complexity, task 2. The "required" implies that the ob-structure, task difficulty, and time pressure. To ject drawn by the subject existed incontrol task complexity, each application in- the "correct" model.cluded five entities, thirteen attributes, and four(two-way) relationships (see the example in 3. The time required by the subject toFigure 4). This combination of elements and complete the data model was mea-relationships for the tasks was chosen because sured. Measurement of time waspilot tests showed that more complex tasks were
considered important because priortoo time consuming, while simpler tasks provedto be too trivial even for naive analysts. laboratory studies (e.g., Bettman and
Zins, 1979) have found a tradeoffbetween accuracy and time.
156
L51
Figure 4. Article Reference System.
INSTITUTION-NAME HAS-WORKING-FOR AUTHOR-IDAUTHOR-
INSTITUTION- INSTITUTION WORKS-AT NAME
ADDRESSAUTHOR AUTHOR-
PHONENUMBER
AUTHORSHIP
ARTICLE-IDARTICLE-TITLE
ARTICLE-PUBLISH-DATEARTICLE-ABSTRACT ARTICLE
4
1%pJOURNAL % &85 TOPIC-ID
JOURNAL-ID
JOURNAL-NAME TOPIC TOPIC-NAME

l START )
.l.1
/have all \ the relevent YES information objects )
'\4rn identit,5/group an NO are all
attribute with attributesidentify an an entity grouped?
objectYES
specly NO does eachNO is the object YES an identifier entity have ana focus of thesystem? identifier?
YES
classify asis this object a an entityNO YEScharacteristic of are allspecify a NOsomething of relationshipsinterest to the relationship
system? specified?
YESlittle NO object a value of YES
a characteristic? create anthrowthe YES are there anyintersectionobject out N.M relationships?entity
NOclassify as classify asan attribute
a vaLUSdo two
reduce YES entities containredundancy the same
nformation?
NO
4. The subject's knowledge of thebasic notation and grammar of the verify the model YES NO
against the output is the modelformalism (i.e., declarative requirements and refined?knowledge) was tested via the reponsinterpretation accuracy instrument.Since declarative knowledge is a -prerequisite for procedural know- END )
ledge, it was hoped that the inter-pretation accuracy would explainsome of the observed differences in
- recognize the rules pertainingthe accuracy of data models produc-ed. The instrument required the sub- to representing relationshipsject to: of varying degrees.
- recognize the notation for dif- - specify the search path forferent constructs in the for- retrieving information usingmalism. the data model.
158

5. Whether the subject followed a top- designed a file. Seventy five percent (75%) were
down or bottom-up motivated ap- unfamiliar with any data modeling or data or
proach in constructing data models systems analysis tools; the rest indicated 'slight'familiarity. Subjects were randomly assigned to
was captured through the subject's one of the two treatments: LDS and RDM. Theverbalization of thoughts, or proto- experiment required three hours of the subject'scols. The protocols of the ten most time and was administered individually.fluent verbalizers from each treat-ment group were transcribed andexamined via an index that mea-sured the proportion of objects that Procedurethe subject conceptualized top-down(VS. bottom-up): Prior to the data modeling tasks, subjects com-
pleted a research participation consent form and- an entity (E) conceptualized an agreennent to keep the nature of the study
before (vs. after) its attributes confidential. As a performance incentive, sub-jects were informed that prize money of $50,
- an attribute (A) conceptual- $35, $25, and $10 would be awarded to the topized after (vs. before) its entity four performers on the data modeling tasks.
Next, subjects read the exercise scenario which- a relationship (R) conceptual- described the data analysis task within systems
ized in terms of entities (vs. in development and stressed the importance of notterms of attributes). relying on any other knowledge about the ap-
plications than what was described in the taskThe index ranged from -1 (pure bottom-up) to materials. Then, subjects were provided with in-
+ 1 (pure top-down), and was calculated for each structions on the analysis method as well as the
subject as below. notation and grammar rules for the formalism(seven pages). At the end of the instructions,the method for data analysis was summarized in
Note that subjects were only required to speak one page to provide a quick reference for thealoud during the second and fourth trials. This subjects. Subjects could refer to the instructionswas done because the pilot tests indicated that at any time.2 Once the subjects announced thatspeaking substantially tired the subjects which, they had completed reading the instructionsin turn, slowed down their rate of learning. (twenty to thirty minutes), they were providedHowever, while speaking might have slowed with a description, output requirements, sampledown the process of automating the analysis output reports for each application, and blankskills, verbal reports should not have altered sheets of paper for drawing the data models. Aperformance (see Ericsson and Simon, 1984). maximum of twenty-five minutes was allotted
for drawing a data model for each application.After completing their data model for one ap-plication, subjects were shown the "correct" data -
Subjects model prior to working on a data model for thenext application. After each trial, subjects were
Thirty six continuing education students en- asked to complete the interpretation accuracy
rolled in an introductory information systems instrument. During the second and fourth ap-
(IS) course participated in the study. On plications, subjects were asked to think aloud,
average, the students were 28 years old and had that is, verbalize their thoughts. During thethree and one-half years of full-time experience verbal report, it was sometimes necessary for thein business or administrative positions. Sixty experimenter to remind the subject to speak
four percent (64%) used computers daily at their alood. The experimenter, however, never
job and 81% at least weekly. Seventy eight per-cent (78016) had written at least one computerprogram; 64% reported that they had never 1The instructional material was extensively pilot-tested.
Index = f 9[ objects (E,A,R top-clown - # of objects (E,A,R) bottom-up)# of objects (E,A,R) top-down + #of objects (E,A,R) bottom-up
159

probed for specific motivations or reasons for Data from non-protocol trials of 1 and 3 werebehavior exhibited by the subject. The session examined to test Propositions 1 and 2 on learn-ended with a short debriefing. ing and tools. Protocol data from trials 2 and 4
were examined to test Proposition 3 on the me-thod of analysis. This division of data was per-formed because it was apparent from obser-vations of subjects that talking aloud created aResults significant additional burden on the subjects'mental resources; thus, protocol and non-
Table 1 shows summary statistics for the ac- protocol trials could not be compared directly.curacy of the data models produced, completiontime, and interpretation accuracy for the two The data from trials 1 and 3 were .analyzed inexperimental groups. Except for completion two steps. First, a doubly-multivariate analysistime, larger scores correspond to better perfor- of variance with repeated measures model wasmance. Simple observation of means suggests fitted to the data for data model accuracythat while improvement in performance oc- (number of required entities, attributes, andcurred in both groups, the LDS group performed relationships) and completion time (see Bock,generally better than the RDM group in all four 1975). A multivariate analysis was necessarytrials. Table 1 also shows that LDS users were because Pearson product-moment correlationmore top-down motivated in their method of coefficients indicated high correlation amonganalysis than RDM users. dependent variables. The results from mul-
Table 1. Means and Standard Deviations of Dependent Variablesfor LDS and RDM Treatment Groups.
Trial 1 Trial 2 Trial 3 Trial 4N Mean (SD) Mean (SD) Mean (SD) Mean (SD)
Required Entities(Max: 5) LDS 20 4.50 (1.24) 4.75 (0.44) 4.95 (0.22) 5.00 (0.00)
RDM 16 3.88 (2.85) 4.44 (0.96) 4.56 (0.63) 4.13(1.50)Required Attributes(Max: 13) LDS 20 10.70 (4.26) 11.75 (2.34) 12.20 (2.07) 11.90 (2.15)
RDM 16 8.25 (4.49) 11.12 (2.50) 11.56 (1.79) 11.38 (3.42)Required Relationships(one-directional)(Max: 8) LDS 20 6.60 (2.35) 6.10(2.63) 7.50(1.10) 7.00 (2.00)
RDM 16 1.25 (1.44) 2.88 (3.01) 4.50 (2.25) 3.50 (3.46)Completion Time(Max: 25) LDS 20 21.26 (4.19 20.56 (5.18) 16.26 (4.42) 17.22 (5.12)
RDM ' 16 24.50 (1.55) 23.64 (3.27) 21.88 (4.46) 21.93 (4.81)InterpretationAccuracy(Max: 11) LDS 20 8.00 (1.65) 8.05 (2.26) 8.70 (1.69) 8.75 (1.71)
RDM 16 6.25 (2.44) 7.75 (3.00 7.38 (2.78) 7.44 (2.31)Analysis Approach
(- 1 purely bottom-up; LDS 10 0.91 (0.24) 1.00 (0.00)+ 1 purely top-down) RDM 10 0.39 (0.57) 0.59 (0.59)
160

tivariate analysis showed that the tool used .0125 level from Trial 1 to Trial 3; no similar(between-subject factor), the amount of practice - improvement was observed in the RDM group.(within-subject factor), and their interactionswere significant at the .002 level. The interpretation accuracy data were analyzed
separately from performance data. The LDSThe second step in the analysis was to employ a group recognized the concepts and rules of theprocedure described by Messmer and Homans tool better than the RDM group at the .05 sig-(1980) to determine which dependent variable nificance level both in trials 1 (1=2.56) and 3produced significant effects. The procedure (t= 1.77). However, only the RDM group im-consists of a series of step-down tests in which a proved from Trial 1 to Trial 3 at .05 levelsingle dependent variable is tested while adjust- (1= 1.93). Overall, learning in both declarativeing for the effects of the other dependent vari- and procedural knowledge was observed acrossables. The adjustment entails entering the the trials. Learning was more pronounced inpreceding dependent variables as covariates for LDS than in RDM in all three components - en-tests on remaining dependent variables. Pro- tities, attributes, and relationships - although itgressively, all except the last dependent variable was significant at the .0125 level only forenter as covariates in the model. To use the pro- relationships. The data from the final question-cedure, data were recoded to fit a one-way naire also indicated that RDM users found theANOVA model. Because of the correlation be- task more difficult than LDS users (1=4.76;tween dependent variables, the individual state- P=.000).ment levels of significance were .0125 assuming.05 family level of significance (Neter and Was- The analysis of protocol reports indicated thatserman, 1974). LDS users were significantly more motivated to
use a top-down approach than RDM users inTo use the Messmer and Homans' approach, it both the second and fourth trials (F= 12.03,was necessary to set up a priori ordering of the p=.001). Eight out of ten LDS users were clas-importance of the dependent variables. Re- sified as purely top-down in the second andquired entities were selected as the most impor- fourth trials; two out of ten RDM users weretant dependent variable on the premise that cor- purely top-down in the second and fourth trials.rect conceptualization of entities is a prerequi-site for correct identification of relationships ,and attributes. Required relationships were thesecond most important variable on the premisethat it is easier to add attributes than relation-ships to an existing model or system. Attributes EXPERIMENT IIfollowed relationships in importance. Time wasconsidered least important because subjects weretold that they were to strive for accuracy of the The purpose of the second experiment was tomodels, not for maximum speed. Accuracy was examine the causes of poor performance amongemphasized because, in the initial stages of skill RDM users found in the first experiment.learning, performance improves in accuracy, Specifically, we investigated the ease of learningbut not necessarily in time (Anderson, 1982). the notation and grammar associated with the
RDM formalism, without the added procedureof normalization. This meant that the instruc-
Significant differences in the study were foundat the .0125 level only in relationships and in
tions for the method of analysis given to thecompletion time (relationships, F(3,59)=36.4; revised-RDM group of the second experimentcompletion time,F(3,57)=124.06). While a sig- were the same as in the LDS group of the firstnificant tool effect (between-subject factor) for experiment; only the formalisms of the toolsrequired relationships was detected across the
varied across groups. In the second experiment,
trials, pairwise contrasts showed that only the 20 subjects received the revised RDM treatment.RDM group improved at .0125 significance level No significant differences were found in subject
in required relationships from Trial 1 to Trial 3profiles between the first and second experi-
(within-subject factor). Completion time wasment.
not significantly different between LDS andRDM groups between-subject factor in Trial 1, The data for LDS and RDM from the first ex-but was significantly different in Trial 3. The periment were analyzed with data for theLDS group improved in completion time at the revised-RDM from the second experiment. The
161

procedures used to analyze the data were the good data models and recognize the concepts in-same as those used for Experiment I. The results volved in data analysis tools fairly quickly.showed that revised-RDM users performed bet- These findings are, of course, limited to the typeter than RDM users over the four trials except of structured tasks the subjects were exposed toin terms of entities. Nevertheless, LDS users in the study. Much more gradual proceduralstill performed significantly better than revised- learning patterns might be found in more com-RDM users in required relationships in Trials 1 plex analysis tasks. The results of the compara-and 3, and in completion time in Trial 3 (Tables tive effectiveness of LDS and RDM support2 and 3). Proposition 2. LDS users produced more ac-
curate data models and in less time than RDMIn terms of the analysis approach (see Table 2), users. The results also support Proposition 3.a significant difference in toI>down processing LDS users were more top-down motivated thanwas found between the three experimental RDM users in their method of analysis.groups (F=2.638, p=.043). The pairwise con-trasts indicated that revised-RDM users were The results from the experiments suggest thatless top-down motivated than LDS users in Trial low-level skills related to data analysis are2 (1= 1.83; p=.073) and in Trial 4 «=2.00; indeed learnable by novices over a relativelyp=.050). No significant differences existed be- short time within a set of structured tasks. Sub-tween RDM and revised-RDM users. jects rated their motivation high and were ob-
served by the experimenters to be highlymotivated in the experiments; thus, the experi-ments can be argued to have tested subjects'ability to learn about data analysis.
DISCUSSIONAnother noteworthy finding is that LDS was
The results from the two experiments provide more easily learned than RDM. The resultspartial support for Proposition 1. As expected, generally agree with the findings of Juhn anddata analysis required learning. Contrary to ex- Naumann (1985) who found that LDS ·is morepectations, participants were able to construct comprehensible than RDM. Our findings also
Table 2. Means and Standard Deviations for Dependent Variablesand Revised-RDM Treatment Groups.
Trial 1 Trial 2 Trial 3 Trial 4N Mean (SD) Mean (SD) Mean (SD) Mean (SD)
Required Entities(Max: 5) Rev.-RDM 20 3.55 (1.67) 3.95 (1.47) 4.40(1.19) 4.40 (0.75)
Required Attributes(Max: 13) Rev.-RDM 20 10.60 (4.37) 11.30 (3.33) 12.10 (2.92) 12.65 (0.67)
Required Relationships(one-directional)(Max: 8) Rev.-RDM 20 1.70 (2.77) 3.60 (3.65) 4.20 (3.66) 4.90 (3.40)
Completion Time(Max: 25) Rev.-RDM 20 24.14 (1.62) 20.89 (3.90) 18.76 (4.90) 17.79 (4.42)
InterpretationAccuracy(Max: 11) Rev.-RDM 20 6.95 (3.32) 7.25 (2.22) 7.30 (2.39) 7.65 (2.70)
Analysis Approach(-1 purely bottom-up;+ 1 purely top-down) Rev.-RDM 20 0.52 (0.55) 0.57 (0.59)
162

Table 3. Step Down Tests for Performance Measures LDS, RDM and Revised-RDM Groups.
EXPERIMENT I AND II
Performance Measure Order DF F Value Sig. of F
Required Entities 1 5,90 2.640 .028Required Attributes 3 5,88 1.716 .139Required Relationships 2 5,89 13.283 .000*
Completion Time 4 5,87 11.574 .000*
Significant at the .0125 level
extend the conclusion by Brosey and Schneider- Thus, further research on tools should con-man (1978) that people do not only better com- centrate on accumulating knowledge about theprehend, but also better construct relationships, features that increase cognitive fit. Future stu-if they are specified in a two-entity/two-way dies should investigate specific notation andfashion as in LDS. However, these results are grammar rules for relationships, attributes, andcontrary to those of Ridjanovic (1985) who did entities, as well as for concepts not covered innot find any differences in the quality of data the current experiments - dependency, com-representations between LDS and RDM users. posite keys, roles, and normal forms. Also, aPossibly, the analysts in the Ridjanovic study study investigating the recall of concepts andwere less sensitive to the type of tool used be- rules associated with tools after varying periodscause they were more experienced and educated of elapsed time (e.g., one week, one month,than the naive analysts in our study. Subjects in three months) would provide further insightthe Ridjanovic study also received classroom into the applicability of the tools for naivetraining in tools prior to the experiment. analysts, assuming that a typical naive analyst
employs data analysis tools quite infrequently.The results of the current study also indicate Further studies also need to examine whetherthat LDS users, who were more successful in the relative strengths of the tools are contingentgeneral, employed more conceptual top-down, on the complexity of the application tasks.rather than bottom-up output directed analysis.This finding supports the argument that top- In terms of learning, further research mightdown processing is a more natural approach for replicate the current study by examining thenaive analysts than bottom-up processing. The analyst's learning over a greater number of ex-tentative implication of this argument is that, perimental trials. However, the results fromcontrary to the advocacy of bottom-up output such studies might not be very relevant to naivedirected analysis for nonprocedural languages user analysts. Because of their infrequent ex-(Hayden, 1983), end-user training should stress posure to data analysis, user analysts may neverconceptual top-down analysis. progress beyond the beginning stages of the
learning curve. Instead of extending the lengthof the study, further research might experimentThe results also suggest that it is important for with different instructions or types of processthe data modeling formalism to have a percep- feedback to find ways to expedite the naivetually clear and discriminating notation for the analyst's learning. The results from such studies
different constructs. Analysis tools are very sel- should help to increase the effectiveness and ef-dom designed in light of the cognitive needs of ficiency of training programs in analysis which,their users, particularly of their more naive in turn, could mean improved quality of ap-users. However, a close cognitive fit is likely to plications.be critical in order for naive users to voluntarilyuse the tools, and moreover, use them success-fully. Voluntary use is essential because, unlikethe professional analyst, it is difficult to forcethe end-user to employ a particular analysistool.
163

Acknowledgement Procedural Languages," Journal Of SystemsManagement, June 1983, pp. 12-15.
The authors are indebted to Iris Vessey for her Howe, D.R. Data Analysis for Data Basedetailed comments on an earlier version of this Design, Edward Arnold, London, England,
1983.paper. We also thank Joni Johnson, DzenanRidjanovic, and V. Sambamurthy for their help Jeffries, R., Turner, AT., Polson, P.G., and At-
wood, M.E. "The Processes Involved inin the research project.Designing Software," Science Applications,Englewood, Colorado, 1980.
Juhn, S.H. and Naumann, J.D. "The Effective-REFERENCES ness of Data Representation Characteristicson User Validation," in Proceedings of the
Alavi, M. "Some Thoughts on Quality Issues of Sixth International Conference on Infor-End-User Developed Systems," Proceedings mation Systems, L. Gallegos, R. Welke, andof the 2lst ACM Annual Computer Person- J. Wetherbe (eds.), Indianapolis, Indiana,nel Research Conference, May 2-3, 1985, 1985, pp. 212-226.Minneapolis, Minnesota, pp. 200-207. Messmer, D.J. and Homans, R.E. "Methods for
Anderson, J.R. "Acquisition of Cognitive Skill," Analyzing Experiments with MultiplePsychological Review, Volume 89, Number Criteria," Decision Sciences, Volume 11,4,1982, pp. 369-406. Number 1,1980, pp. 42-57.
Bettman, J.R. and Zins, M.A. "Information For- Neter, J. and Wasserman, W. Applied Linearmat and Choice Task Effects in Decision Statistical Models, Richard D. Irwin,Making," Journal of Consumer Research, Homewood, Illinois, 1974.Volume 6, September 1979, pp. 141-153. Norman, D.A. and Bobrow, D.G. "On the Role
Bock, R.L. Multivariate Statistical Methods in of Active Memory Processes in PerceptionBehavioral Research, McGraw- Hill, New and Cognition," in The Structure of HumanYork, New York, 1975. Memory, C. N. Cofer (ed.), W.H. Freeman
Borgida, A. Greenspan, S., and Mylopoulos, and Company, San Francisco, California,J. "Knowledge Representation as the Basis 1976.for Requirements Specification," Computer, Palmer, S.E. "Visual Perception and WorldVolume 18, Number 4, April 1985, pp. Knowledge: Notes on a Model of Sensory-82-91. Cognitive Interaction," in Explorations in
Brosey, M. and Shneiderman, B. "Two Ex- Cognition, D. A. Norman andperimental Comparisons of Relational and D. E. Rumelhart (eds.), W.H. Freeman andHierarchical Database Models," Company, San Francisco, California, 1975.International Journal of Man-Machine Pennington, N. "Cognitive Components of Ex-Studies, Volume 10,1978, pp. 625-637. pertise in Computer Programming: A
Carlis, J.V. "Logical Data Structures," Working Review of the Literature," Cognitive SciencePaper #TR 85-23, University of Minnesota, Technical Report Series #46, University ofMinneapolis, Minnesota, 1985. Michigan, Ann Arbor, Michigan, 1982.
Davis, G.B. "Caution: User Developed Systems Ridjanovic, D. "Comparing Quality of Datacan be Dangerous to Your Organization, Representations Produced by NonexpertsMISRC-WP-82-04, University of Minnesota, Using Data Structure and Relational DataMinneapolis, Minnesota, 1982. Models," Unpublished Doctoral Dissertation,
Ericsson, K.A. and Simon, H.A. Protocol University of Minnesota, Minneapolis,Analysts: Verbal Reports as Data,The MIT Minnesota, 1985.Press, Cambridge, Massachusetts, 1984. Sheil, B.A. "The Psychological Study of
Green, T.R.G. "Programming as a Cognitive Programming," Computing Surveys, VolumeActivity," in Human Interaction with 13, Number 1, March 1981, pp. 101-120.Computers, H.T. Smith and T.R.G. Green Simon, H.A. The Sciences of the Artificial.(eds.), Academic Press, London, England, (2nd Ed.), The MIT Press, Cambridge, Mas-1980. sachusetts, 1981.
Harel, E.C. and McLean, E.R. "The Effects of Tsichritzis, D.C. and Lochovsky, F.H. DataUsing a Nonprocedural Computer Language Models, Prentice-Hall, Inc., Englewoodon Programmer Productivity," MIS Cliffs, New Jersey, 1982Quarterly. Volume 9, Number 2, June 1985, Vitalari, N.P. and Dickson, G.W. "Problempp. 109-120. Solving for Effective Systems Analysis: An
Hayden, R.L. "Design Strategy for Non- Experimental Exploration,"
164

Communications of the ACM, Volume 26,Number 11, November 1983, pp. 948-956.
Weinberg, V. Structured Analysts, Prentice-Hall, Inc., Englewood Cliffs, New Jersey,1980.
Wiederbeck, S. "Novice/Expert Differences inProgramming Skills," International JournalMan-Machine Studies. Volume 23, 1985,pp. 383-390.
Appendix A
Task: Article Reference SystemMost students quickly forget the articles they have read while in college. This is unfortunate
because articles can be a valuable reference, both during and after college. To help maintain thisvaluable reference source, you have decided to develop an Article Reference System that will keeptrack of the articles that you have read.
Conceptual ModelUSe the following conceptual modeI to guide your effort in designing the system:
An article can be published in only one journal, but you might read more than one article from thesame journal. You want to be able to reference an article by its topic and so you will assign only onetopic to a single article. however, you might read more than one article that has the same topic. Anarticle might have more than one author and a single author can write many articles. Each authorwill be associated with a single institution (i.e., University of Minnesota, Control Data) and it ispossible that a single institution will have more than one author who has written an article that youhave read.
Output RequirementsThe system should be able to provide the following information:
1. A list of articles including, article-id, article-title, article- publish-date, and article-abstract.
2. A list of journals and articles including, journal-id, journal- name. article-id and article-title.
3. A list of topics and articles including, topic-id, topic-name, article-id and article-title.
4. A list of articles and authors including, article-id, article- title, author-id and author-najme.
5. A list of the institutions that authors work for including, institution-name, institution-address, author-id, author-name and author-phone.
SAMPLE REPORTS OF THESE OUTPUT REQUIREMENTS ARE ATrACHED.
165

Report 1. Article ListArticle Article Article ArticleID Title Publish Date Abstract
01 Management Tips 07/01/81 Tips for Managers02 Computers Today 08/01/84 Computer Industry03 Investing 08/15/85 Investment Tips04 Motivation 02/15/85 Motivating Employees
Report 2. Journal ArticlesJournal Journal Article ArticleID Name ID Title
01 Fortune 03 Investing04 Motivation
02 Business Week 01 Management Tips02 Computers Today
Report 3. Topics AddressedTopic Topic Article ArticleID Name ID Title
04 Management 01 Management Tips
04 Motivation10 Computers 02 Computers Today20 Finance 03 Investing
Report 4. Authors of ArticlesArticle Article Author AuthorID Title ID Name
01 Management Tips 25 Dr. Pete Bright10 Martha Hodding
02 Computers Today 25 Dr. Pete Bright03 Investing 26 Mary Starr04 Motivation 01 Dr. Harry George
26 Mary Starr
166

Report 5. Institution
Institution Institution Author Author AuthorName Address ID Name Phone
Burroughs Corp. Detroit, MI 10 Martha Hodding 313-633-3949
Dayton-Hudson Minneapolis, MN 26 Mary Starr 612-345-3950
U of Minnesota Minneapolis, MN 01 Dr. Harry George 612-622-1111
25 Dr. Pete Bright 612-622-3212
167