Embed Size (px)
Citation preview
1
End Stage Renal Disease (ESRD) Quality Measure Development and Maintenance
Hemodialysis Adequacy Clinical Technical Expert Panel Summary Report Prepared by: Arbor Research Collaborative for Health and the University of Michigan Kidney
Epidemiology and Cost Center Conducted April 16-17, 2013 in Baltimore, MD
Sent to CMS on June 28, 2013
Contract No. 500-2008-00022I, Task Order No. HHSM-500-T0001
2
Table of Contents Technical Expert Panel Summary .................................................................................................................. 5
1. Introduction/Background: ........................................................................................................................ 7
2. Discussion of Urea Kinetics ....................................................................................................................... 8
2.1 Standardized (Std) Kt/V ....................................................................................................................... 9
2.1.1 Literature Review & Scientific Importance .................................................................................. 9
2.1.2 Scientific acceptability: .............................................................................................................. 10
2.1.3 Feasibility and usability: ............................................................................................................. 10
2.1.4 Review of existing measures: ..................................................................................................... 10
2.1.5 Recommendations ..................................................................................................................... 10
2.2 Surface Area Normalized (SAN) kt/V ................................................................................................ 10
2.2.1. Literature Review & Scientific Importance ............................................................................... 10
2.2.2 Scientific acceptability ............................................................................................................... 11
2.2.3 Feasibility and usability .............................................................................................................. 11
2.2.4 Review of existing measures ...................................................................................................... 11
2.2.5 Recommendations ..................................................................................................................... 11
3. Discussion of Adequacy Based on Nutritional Status ............................................................................. 12
3.1 Normalized Protein Catabolic Rate (nPCR) ....................................................................................... 12
3.1.1 Literature Review & Scientific Importance ................................................................................ 12
3.1.2 Feasibility & usability ................................................................................................................. 13
3.1.3. Scientific acceptability (reliability & validity) ............................................................................ 13
3.1.4 Review of existing measures ...................................................................................................... 14
3.1.5 Recommendations ..................................................................................................................... 14
3.1.6 Other recommendations ............................................................................................................ 14
3.2 Serum Albumin.................................................................................................................................. 14
3.2.1 Literature Review & Scientific Importance ................................................................................ 14
3.2.2 Scientific acceptability (reliability & validity) ............................................................................. 15
3.2.3 Feasibility & usability ................................................................................................................. 15
3.2.4 Review of existing measures: ..................................................................................................... 15
3.2.5 Recommendations ..................................................................................................................... 15
3.2.6 Other recommendations: .......................................................................................................... 16

3
4. Discussion of Adequacy Based on Considerations of Patient Safety as well as Optimum Fluid and Larger Molecular Clearance ........................................................................................................................ 16
4.1 Ultrafiltration Rate (UFR) .................................................................................................................. 16
4.1.1 Literature Review & Scientific Importance ................................................................................ 16
4.1.2 Feasibility & usability: ................................................................................................................ 17
4.1.3 Scientific acceptability (reliability & validity) ............................................................................. 17
4.1.4 Review of existing measures ...................................................................................................... 17
4.1.5 Recommendations* ................................................................................................................... 18
4.1.5 Other recommendations: .......................................................................................................... 18
4.2 Minimum time (length of dialysis) per session ................................................................................. 18
4.2.1 Literature Review & Scientific Importance: ............................................................................... 18
4.2.1 Feasibility & usability ................................................................................................................. 19
4.2.2 Scientific acceptability (reliability & validity) ............................................................................. 19
4.2.3 Review of existing measures ...................................................................................................... 20
4.2.4 Recommendation* *Please See Addendum for Revised Recommendations............................ 20
4.3 Rate of hospitalization due to fluid overload ................................................................................... 20
4.3.1 Literature Review & Scientific Importance: ............................................................................... 20
4.3.2 Review of existing measures ...................................................................................................... 21
4.3.3 Potential measure discussed at the TEP meeting, but not recommended ............................... 21
4.4 Interdialytic Weight Gain (IDWG) ..................................................................................................... 21
4.4.1 Literature Review & Scientific Importance: ............................................................................... 21
4.1.2 Scientific Acceptability (reliability & validity) ............................................................................ 21
4.2.2 Review of existing measures ...................................................................................................... 21
4.2.3 Measure discussed, but not recommended .............................................................................. 21
4.5 Intradialytic hypotension .................................................................................................................. 22
4.5.1 Literature Review & Scientific Importance ................................................................................ 22
4.5.2 Review of existing measures ...................................................................................................... 22
4.5.3 Measures discussed but not recommended .............................................................................. 22
4.6 Dialysate composition ....................................................................................................................... 22
4.6.1 Literature Review & Scientific Importance ................................................................................ 22
4.6.2 Review of existing measures ...................................................................................................... 23
4.6.3 Measures discussed but not recommended .............................................................................. 23
4
5. Additional Discussion on Impact of Timing on Kt/V: .............................................................................. 23
6. Conclusions ............................................................................................................................................. 24
7. Summary or Recommendations ............................................................................................................. 25
8. References .............................................................................................................................................. 27
5
Technical Expert Panel Summary The Centers for Medicare & Medicaid Services (CMS) has contracted with Arbor Research Collaborative for Health (Arbor Research) and the University of Michigan Kidney Epidemiology and Cost Center (UM-KECC) to develop End-Stage Renal Disease (ESRD) Quality Measures (QMs) for the following four measure areas:
• Mineral and Bone Disorder
• Hemodialysis Adequacy
• Preventive Care (Pneumococcal, Hepatitis B, and Influenza Vaccinations)
• Dialysis Adequacy for Pediatric Patients (Peritoneal Dialysis Adequacy [PD])
The purpose of the project is to develop measurements that can be used to provide quality care to Medicare beneficiaries.
Technical Expert Panel Objectives
The objectives of these ESRD C-TEPs were described in the charter that was approved by the C-TEPs. The C-TEPs were charged with providing expertise and input to Arbor Research on the development and implementation of measures that will be used to assess and improve the quality of care for Americans with ESRD. The C-TEPs were to provide guidance and assist in the development and specification of new quality measures in specific clinical areas. In addition, the C-TEP members were to consider potential measures using the framework of CMS and the National Quality Forum (NQF). The four evaluation criteria are: importance, scientific acceptability, feasibility, and usability.
Technical Expert Panel Meeting
The Preventive Care, Mineral and Bone Disorder, and Hemodialysis Adequacy TEP met in Baltimore, MD on April 16-17, 2013. The Pediatric Peritoneal Dialysis Adequacy TEP met via conference call on April 11 and April 17, 2013.
The TEPs were comprised of individuals with the following areas of expertise and perspectives:
• Topic Knowledge: ESRD • Performance Measurement • Quality Improvement • Consumer Perspective • Purchaser Perspective • Health Care Disparities

6
The following individuals participated in this TEP:
Name Title Organization Measure Area Disclosures
William Dant Chair of Dialysis Quality Initiative
Renal Support Network Dialysis Adequacy None
John Daugirdas, MD*
Professor of Medicine University of Illinois at Chicago
Dialysis Adequacy Consulted for Baxter, Genzyme, and B.Braun Medical**
Thomas Depner, MD
Professor of Medicine University of California Dialysis Adequacy None
Peter DeOreo, MD
Chief Medical Officer Centers for Dialysis Care Dialysis Adequacy Board of Directors for Arbor Research Collaborative for Health
Elizabeth Evans, DNP CWCN RN
Nurse Practitioner Renal Medicine Associates Dialysis Adequacy None
Stuart Goldstein, MD
Professor of Pediatrics University of Cincinnati College of Medicine
Dialysis Adequacy None
Eduardo Lacson, MD, MPH
Vice President, Clinical Science, Epidemiology and Research
Fresenius Medical Care NA Dialysis Adequacy Employee of Fresenius Medical Care**
Michael Rocco, MD MSCE
Professor of Internal Medicine/Nephrology
Wake Forest University School of Medicine
Dialysis Adequacy Consultant for DaVita
* Not present for in-person meeting, but participated in pre-TEP discussion.
**on the post-TEP teleconference, these individuals disclosed their association/involvement with the TiME trial. Discussion of this trial can be found in the addendum.

7
1. Introduction/Background: The TEP moderator began the meeting by initiating a general overview on quality improvement in patient care and the measure development process. One of the reasons for developing measures is to set standards for practice. The moderator emphasized that the discussions be kept separated from considerations of potential future use of measures in pay for performance programs. The TEP’s focus should be on clinical importance and evidence, and quality considerations. There may be generally accepted agreement on what is good/safe practice, but some challenges to developing a measure are determining whether or not there is enough evidence to support certain thresholds and whether or not these thresholds have meaningful associations with outcomes. Guidelines of grade 1A and 1B should be considered for performance measures. Evidence for measures can be obtained from both observational studies and randomized controlled trials (RCTs). The strengths and weaknesses of both types of studies were discussed. It was noted that RCTs have traditionally been rated higher than observational studies but that observational studies have an increasingly important role. It was also noted that there are fewer RCTs in nephrology compared with many other specialties. Even many large clinical trials, while contributing significantly to knowledge, have not necessarily changed clinical practice. Observational studies can provide additional insight, but are often associated with confounding with implications for inferring causal relationships. Over time newer statistical techniques to overcome these biases have significantly improved and the whole field of comparative effectiveness research has gained ground as it relates to comparisons of real world practices. Additionally, it was noted that while the gold standard in theory, RCTs often suffer from lack of heterogeneity due to their relatively strict eligibility criteria and therefore suffer have limitations such as lower generalizability, issues related to imperfect randomization, ability to test few interventions at a time, logistic barriers, cost, etc., amongst others.
Draft measure topics related to dialysis adequacy included but were not limited to the following: 1) Revising hemodialysis adequacy measures to include patients who receive frequent
hemodialysis or less than thrice weekly dialysis (focus on the potential use of standardized Kt/V); 2) Consider the potential utility of surface area normalized Kt/V (SANKt/V); and 3) Supplementing traditional urea kinetics’ based adequacy measures with
a) potential dialysis safety/fluid-weight management related measures such as those germane to rapidity or magnitude of fluid removal at dialysis, e.g.:
• ultrafiltration rate • length of hemodialysis sessions • frequency of intradialytic hypotension • interdialytic weight gain • hospitalization due to ‘fluid overload’, etc., with the underlying premise that
‘adequate’ dialysis should also be ‘safely’ delivered, and b) consider including the concept of ‘nutritional adequacy’ by considerations of measures that
provide assessment of nutritional status of patients at dialysis units. These measures in combination could potentially provide more information to assess the quality of dialysis care and allow a broader approach to dialysis adequacy than relying solely on urea kinetics’ based assessments. The TEP’s charge was to discuss potential measures with the goal of not only formulating recommendations for candidate measures that meet measure selection criteria formulated by CMS and the NQF (the national body the confers consensus endorsement status on quality measures), but also to address their definition and structure, including numerator, denominator, inclusion, exclusion criteria and whether or not risk-adjustment would be appropriate.
8
The TEP members agreed with the theme of broadening the scope of adequacy of dialysis. The clinical definitions for what is adequate in dialysis patients are not well-defined, and don’t capture all elements of optimum dialysis delivery. The majority of the TEP agreed that the focus should not only consider the technical/mechanical and more traditional definitions of adequacy (e.g., urea kinetics), but also areas of nutrition (‘nutritional adequacy’) and patient safety related aspects, as the ultimate goal was to improve quality of care and the overall health and well-being of patients. A TEP member noted that adequacy could be defined and prioritized into two categories: 1) patient safety and the management of the patient, which would include a whole host of things the care provider would need to do to provide adequate care and 2) the dialysis procedure itself, with small solute removal as priority followed by topics such as fluid management. While it was agreed that solute clearance was of high importance, most agreed on its own was not enough to improve the lives of patients, outcomes, and ignoring other factors (e.g., nutritional adequacy, patient safety by maintaining optimum ultrafiltration rate and ensuring adequate length of hemodialysis sessions particularly in the setting of thrice weekly dialysis, etc.) was not satisfactory.
The TEP went on to discuss availability of data in Medicare Claims as well as the newly available, national CROWNWeb data system. Limitations in the timing and reporting of data were noted. Missing data in CROWNWeb was thought to be due to erroneous data being scrubbed, such as out of range lab values on the day the measure was supposed to be reported. CROWNWeb contains both Medicare and non-Medicare patients and was felt to be advantageous as having non-Medicare patients in the data expands the generalizability of the measurements.
This report summarizes discussions of the in-person CMS ESRD Technical Expert Panel (TEP) meeting held in Baltimore, MD, April 16-17. Following the in-person meeting, further discussion was requested regarding the recommendations made for the following areas:
1) Treatment time 2) Ultrafiltration rate
All communications occurring subsequent to the in-person meeting will be included in an addendum to this report, to be published at a later time.
2. Discussion of Urea Kinetics Urea kinetic modeling has become an accepted standard for measuring and determining the adequacy of small (dialyzable) toxic solute removal during hemodialysis among patients on thrice weekly dialysis. However, urea kinetics is not representative of the kinetics of protein-bound compounds, middle molecules, and some small and water-soluble solutes. Additionally, urea clearance is a poor predictor of many key aspects of dialysis adequacy, e.g., symptoms, phosphorous control, volume control, blood pressure control, intradialytic hypotension (IDH), etc. As background, CMS had wanted the TEP to consider measure(s) that could be applied across different HD regimens by examining the possibilities of Standard (std) weekly Kt/V the concept of Body Surface Area normalized Kt/V (SAN Kt/V),
Minimally Adequate Hemodialysis has been defined in the 2006 K/DOQI in the following four guidelines. • 4.1 Minimally adequate dose: The minimally adequate dose of HD given 3 times per week to
patients with Kr less than 2 mL/min/1.73 m2 should be a spKt/V (excluding RKF) of 1.2 per dialysis. For treatment times less than 5 hours, an alternative minimum dose is a URR of 65%. (A)

9
• 4.2 Target dose: The target dose for HD given 3 times per week with Kr less than 2 mL/min/1.73 m2 should be a spKt/V of 1.4 per dialysis not including RKF, or URR of 70%. (A)
• 4.3 Dose reduction: In patients with residual urea clearance (Kr) greater than or equal to 2 mL/min/1.73 m2, the minimum session spKt/V can be reduced. One method of minimum dose reduction is described in CPR 4.4. In such patients, the target spKt/V should be at least 15% greater than the minimum dose. (B)
• 4.4 Missed and shortened treatments: Efforts should be made to monitor and minimize the occurrence of missed or shortened treatments. (B)
Additionally, there is one NQF endorsed HD adequacy measure (0249) which is defined as “Percentage of all adult (>=18 years old) patients in the sample for analysis who have been on hemodialysis for 90 days or more and dialyzing thrice weekly whose average delivered dose of hemodialysis (calculated from the last measurements of the month using the UKM or Daugirdas II formula) was a spKt/V >= 1.2 during the study period. “
The TEP reviewed the numerator and denominator statements for this measure and recommended that the rule for 3 times per week (spKt/V ≥ 1.2) be left unchanged, but that CMS should implement or suggest new levels for more frequently dialyzed patients. This can be done using Standardized Kt/V measurements for patients on more frequent dialysis.
2.1 Standardized (Std) Kt/V
2.1.1 Literature Review & Scientific Importance The TEP discussed the literature review to assess scientific importance. Standardized stdKt/V is an important metric to consider since the minimum spKt/V targets for different dialysis schedules should logically be different from a thrice times per week schedule. stdKt/V was designed to reflect a continuous weekly clearance equivalent across different numbers of sessions per week, akin to continuous weekly Kt/V use in PD. Using a formula for stdKt/V, it was possible to predict outcomes from PD as well as outcomes from HD based on frequency of sessions [Gotch 1998]. The Leypoldt equation is based on a fixed volume model [Leypoldt 2004]. A TEP member noted that there is already a degree of uncertainty about the accuracy of spKt/V. stdKt/V would presumably magnify the level of measurement error since the formula for stdKt/V involves a two-step conversion: spKt/V to eKt/V to stdKt/V. There are limitations in the ability to accurately attribute the sources of error to the changes made to the distribution of the measure. In particular, by how much would the difference in calculation potentially affect facility rankings? The exact effect was unknown among the group. However, it was suggested that changes in the distribution could be better understood using statistical techniques (e.g. cross-validation).
The use of stdKt/V is in line with justifications needed to propose a measure. There is clinical significance and proven usability. StdKt/V is a good compromise between frequency and dosage. However, it’s not certain if a universal threshold for stdKt/V would be linked to outcomes as presumably the purpose of providing higher frequency of dialysis is to increase the total delivered dose of dialysis. The KDOQI 2006 guidelines suggest that in the absence of dose-ranging outcomes data, minimum spKt/V targets for different schedules can be based on achieving a minimum stdKt/V of 2.0 per week [National Kidney Foundation 2006]. However, the TEP felt that this threshold was too low. The target for stdkt/V is not clear, and more data are needed for its justification in routine clinical use. The TEP noted that after data
10
are collected, a threshold cannot be established until a link to an outcome is established. The issue of a threshold will need to be revisited at a later time.
2.1.2 Scientific acceptability The concept is scientifically acceptable, based on rational provided by Gotch, and subsequent validation of the Daugirdas formula in the FHN study (Gotch 1998 , Daugirdas 2010, Chertow 2010, Daugirdas 2012).
2.1.3 Feasibility and usability Collecting the elements required for calculating stdKt/V is entirely feasible as the elements are currently available, but not required, in CROWNWeb. Additionally, the stdKt/V calculation can already be performed if a facility provides all the necessary data so it is usable.
2.1.4 Review of existing measures There are currently no NQF endorsed measures for stdKt/V
2.1.5 Recommendations The TEP recommended a reporting, process measure encouraging the submission of the data elements necessary to calculate stdKt/v for all eligible patients in a facility. The measure was defined as “Percent of adult HD patients in a facility with all necessary data elements reported to calculate the weekly Standard kt/V, on a monthly basis.”
a) Numerator/Denominator:
i) Denominator Inclusions (1) 18 or older (2) HD Patients (3) On Dialysis > 90 days (4) Same provider for 30 days.
ii) Numerator Definition: The number of patients with necessary data elements reported. The elements required for stdKt/V would include modality, birthdate, dialysis start date, prescribed sessions per week, spKt/V, spKt/V date, spKt/V method, delivered minutes of BUN Hemodialysis session, Pre BUN, post BUN, pre dialysis weight and unit of measurement, post dialysis weight and unit of measurement, residual urea clearance (optional), and vascular access type.
2.2 Surface Area Normalized (SAN) kt/V
2.2.1. Literature Review & Scientific Importance The TEP discussed the literature review to assess scientific importance. Surface area normalized SAN stdKt/V could be another potentially useful metric. The rationale for choosing volume (V) as a denominator for spKt/V was mostly out of ‘convenience’. SAN stdKt/V differs from spKt/V in that it uses surface area (SA) as the denominator instead of V. SA is important for a number of reasons. Women tend to have a higher surface area relative to their volume, and a study has shown that women are actually receiving a lower dosing when adjusting for SA [Ramirez 2012]. This was not seen when using either spKt/V or stdKt/V. In a study by Daugirdas [Daugirdas 2010], measurements of stdKt/V are shown by both women and men in the high dose arm of the HEMO study appeared to receive similar doses. When measured by surface area normalized stdKt/V (SAN stdKt/V), women and men in each of the study’s arms appeared to be receiving different doses - “The lowest surface-area-normalized dose
11
was received by women randomized to the conventional dose arm, possibly explaining the sex-specific response to higher dialysis dose.” [Daugirdas 2010].
Another reason SA is ideal is because dialyzers are selected based on BSA. SA also considers a second dimension while V is limited to only one. SA eliminates a lot of unknown error for V. It is possible that stdKt/V might have a greater amount of unknown error because it is still using V. On the other hand, the Daugirdas equation has not been validated using SA, and the importance of the Daugirdas equation is that it links together frequency and dosage. No target for SAN stdkt/V has been suggested. Once again, there is uncertainty about how this measurement changes the distribution across the whole population. The SAN stdKt/V is not up to date, and if we used this metric it would be changing the reference point similar to stdKt/V.
The TEP felt the significance of using a new metric (either stdKt/V or SAN stdKt/V) is that we have a growing population not getting their dialysis measured accurately. Since spKt/V measurements are good measurements, but no targets have been selected the TEP recommends that CMS collect the required elements for both stdKt/V and SAN stdKt/V.
2.2.2 Scientific acceptability The concept is scientifically acceptable, based on rational provided by Daugirdas [Daugirdas 2012], and subsequent validation of use of this correction in subsequent studies [Ramirez 2012].
2.2.3 Feasibility and usability Collecting the elements required for calculating SAN stdKt/V is entirely feasible as the elements are currently available, but not required, in CROWNWeb. Additionally, the SAN stdKt/V calculation can already be performed if a facility provides all the necessary data so it is usable.
2.2.4 Review of existing measures There are no existing NQF endorsed measures for SAN stdKt/V.
2.2.5 Recommendation* *Please see addendum for revised recommendations
The TEP recommended a reporting measure encouraging the submission of the data elements necessary to calculate SAN stdKt/v for all eligible patients in a facility. Percent of adult HD patients in a facility with all necessary data elements reported to calculate the weekly SAN stdKt/V, on a monthly basis
a. Numerator/Denominator i. Denominator Inclusions
1. 18 or older 2. HD Patients 3. On Dialysis > 90 days 4. Same provider for 30 days.
ii. Numerator Definition: 1. The number of patients with necessary data elements reported. The elements
required to calculate SAN stdKt/V include all elements required for stdKt/V as well as date of spKt/V measurement, Height and unit of Measurement, Sex, Race, Diabetes status.
12
3. Discussion of Adequacy Based on Nutritional Status A majority of the TEP members were in agreement about consideration of proposing nutritional measures indicative of the well dialyzed patient. Nutritional parameters have been shown as strong predictors of patient outcomes in multiple studies. At a fundamental level, adequate removal of uremic toxins is expected to lead to improved appetite encouraging greater food intake, thus leading to improved nutritional status. Initiation of dialysis leads to improved appetite in many patients who are often nauseated and anorexic prior to commencement of the renal replacement therapy. In a sense, nutritional measures could be viewed as intermediate outcomes of well-performed dialytic therapies. Importantly, there is emerging evidence from recently published open-label randomized trials/quality improvement projects that protein supplements improve patient outcomes [Cheu 2012, Lacson 2012]. Moreover nutritional parameters are already being used by providers in making management decisions and nutritional guidelines and thresholds exist for dialysis patients [National Kidney Foundation 2001, European Best Practice Guidelines 2007].
3.1 Normalized Protein Catabolic Rate (nPCR)
3.1.1 Literature Review & Scientific Importance Malnutrition has been found to be a significant factor associated to mortality and morbidity in dialysis. nPCR and normalized protein nitrogen appearance (nPNA) are both equivalent to dietary protein intake. While nPCR and nPNA are mathematically equivalent, there may be subtle differences in the language of what they are measuring. The relevant existing Clinical Practice Guidelines for Nutrition in CKD – K/DOQI (2000) include the following summary statements: i) nPCR is a valid and clinically useful measure of net protein degradation and protein intake in HD
patients (Evidence) ii) The Recommended Dietary Protein Intake for clinically stable HD patients is 1.2g/kg body
weight/day iii) At least 50% of DPI should be of high biological value
The TEP recognized that the guidelines for nPCR were very outdated. In practice, the suggested protein intake thresholds in the guidelines are potentially problematic because they may be too high and therefore difficult to achieve. The protein and energy intake in dialysis patients does not achieve these levels. Lower thresholds would likely need to be proposed based on the current standard of evidence.
There was TEP discussion whether a nutrition quality measure should be included under ‘dialysis adequacy’ since nutrition could really be used to improve adequacy of treatment for any disease. Dialysis is the treatment that gets the patient of out of the uremic state. There are a lot of things that can improve when the uremic stage improves and nutrition is one of them. Hence, nutrition is an indirect marker of dialysis, and an intermediate outcome on how we are treating patients. It was also not clear what level of improvement nutrition could provide. More specifically, within a range of dialysis dosage in adult patients it was uncertain if there was a threshold where nPCR improves and what this threshold is. Since nutrition is a marker of a uremic state it would be important to know at what point the nPCR becomes significant.
One the other hand, the TEP discussed that one key reason nutrition should be considered an important element in dialysis is that it is measured routinely in dialysis and both nPCR and albumin, for example, are strongly associated with mortality/morbidity outcomes. nPCR has also been shown to be correlated
13
with spKt/V in a number of studies from the mid to late 1990s. In general, spKt/V and nPCR show an increasing linear relationship up to a certain threshold on spKt/V [Mehrotra et al. Peritoneal Dialysis International 1997 and Saran et al. ASAIO 1998], beyond which there is a plateau in nPCR, i.e. no further increase. This suggests that while there may be a mathematical relationship between spKt/V and nPCR, since both are calculated using the same data elements, a biological link remains entirely plausible, especially in view of the non-linear relationship observed. Data from reported nPCR in CROWNWeb suggests that there is room for improvement in nutrition even if one considers a relatively low threshold nPCR of 0.8. A wide variation exists in protein intake as gauged by nPCR values for patients within facilities. This suggests its potential role as a quality measure in dialysis facilities. Action ability in response to low nPCR was discussed. The current nPCR standards as outlined in K/DOQI 2001 Nutrition Guidelines may not be achievable and could be frustrating for the clinical staff as some patients may always have lower potential for meeting these thresholds of protein intake. Therefore, a lower threshold may well need to be considered by the TEP. The best example of where nPCR has proven to be beneficial as a measure under the general topic of dialysis adequacy was in the pediatric dialysis populations. The 2000 KDOQI guidelines recommend that nPCR should be measured in these patients. This was recommended by the pediatric hemodialysis adequacy TEP in 2010 (NQF measure #1425), and received time limited endorsement by NQF in 2011. A study in adolescents showed that nPCR < 1.0 was highly predictive of patients that will lose weight. Outcomes were still worse in patients with smaller levels of nPCR, despite having normal spKt/V levels. nPCR has also been linked to patient outcomes in adult patients on dialysis and there is no a priori reason not to include a nutritional adequacy measure as an intermediate outcome measure of dialysis adequacy based on the rationale provided thus far.
Another concern raised during the discussion that it would be difficult to raise nPCR among facilities in regions or facilities located in poor socioeconomically disadvantaged areas and patients with multiple comorbidities. Admittedly, it is unclear how the national variation in nPCR relates to potential discrepancies and differences in comorbid conditions or in disadvantaged populations. nPCR may be more useful for improvement in dialysis in a select group of patients that respond. However, this argument was raised by one TEP member , (who stated that there had been no prospective outcome studies showing improved survival with intervention specifically targeted to increase nPCR), was not considered significant enough to exclude the nutritional measure from consideration and could be addressed by defining exclusion or risk-adjustment criteria. Furthermore, administration of dietary protein supplements in the few studies (Lacson 2012 and Ramirez 2012), while not directly measuring nPCR, attempted to increase protein intake in their patients directly by giving them protein supplements, with beneficial effects.
3.1.2 Feasibility & usability Reported nPCR is a data element that is readily available in CROWNWeb. nPCR is an accepted, reliable and valid measurement of dietary protein intake in patients.
3.1.3. Scientific acceptability (reliability & validity) nPCR is calculated by urea kinetic modeling software, based on urea generation rate in the interdialytic interval. It is considered a reliable and valid measure of dietary protein intake in hemodialysis, provided the individual subject is metabolically stable and does not have significant residual renal function. There was some discussion regarding the accuracy of reported nPCR by individual dialysis facilities due to the
14
variability of software used to calculate its value. However, just like Kt/V, facilities could be required to state the method used when reporting its value.
3.1.4 Review of existing measures There is one existing endorsed NQF measure for pediatric ESRD patients on hemodialysis. NQF measure #1425 “Measurement of nPCR for Pediatric Hemodialysis Patients” was developed by CMS for reporting the percentage of pediatric (less than 18 years old) in-center hemodialysis patients (irrespective of frequency of dialysis) with documented monthly nPCR measurements.
Numerator: Number of patients in the denominator with monthly nPCR measurements.
Denominator: Number of all pediatric (less than 18 years old) in-center hemodialysis patients (irrespective of frequency of dialysis). Excludes patients on home dialysis.
3.1.5 Recommendations* * Please See Addendum for revised recommendations The TEP tentatively proposed an outcome measure for nPCR based on discussions, however, it would be pending further review of the literature and discussion, post TEP.
3.1.5.1 Discussion of numerator denominator There was no numerator/denominator criteria recommended during the TEP. However, thresholds of nPCR were discussed that ranged from 0.8 to 1.2. Possible thresholds may be decided on after reviewing the published literature regarding the slope of the curve that exists between nPCR and spKt/V and determining an upper limit of the interaction. An average nPCR was recommended for reporting over a certain time period as opposed to one raw measurement in isolation. The denominator would include all adult HD patients with a non-missing reported nPCR from CROWNWeb. Exclusions would include patients with residual urea clearance. Possible risk-adjustments would be for patient demographics and comorbidities.
3.1.6 Other recommendations 1) It was recommended that the nPCR calculation be reported in CROWNWeb. 2) Analyze the relationships between nPCR versus spKt/V and nPCR versus albumin 3) Obtain further literature review to further inform the possible development of a measure,
including the decision on thresholds and justification for additional exclusion criteria.
3.2 Serum Albumin
3.2.1 Literature Review & Scientific Importance The TEP discussed the European Best Practice Guidelines that suggest serum albumin should be above 40 g/l by bromocresol green method. (Evidence level III). The K/DOQI Nutrition Guideline in Chronic Renal Failure 2000 suggest that pre-dialysis serum albumin equal should be equal to or greater than the lower limit of the normal range (approx 4.0g/dl for the bromcresol green method) in hemodialysis patients [National Kidney Foundation 2000]. The presence of acute or chronic inflammation limits the
15
specificity of this measure for nutrition alone. Serum albumin is considered a valid and clinically useful measure of protein energy nutritional status in maintenance HD patients. Multiple studies have shown that nutritional status is closely associated with mortality. Another study suggested that nutritional biomarkers are closely associated with quality of life (Spiegel 2008). In contrast, kt/V, mineral metabolism, and inflammatory marker were not significantly associated with QOL measures in the same study. In a retrospective matched-cohort study, reduced mortality and hospitalization was associated with patients that received an oral nutritional supplement. These were high-risk patients, which received a supplement if their albumin was 3.0 g/dL or less. Albumin was administered until the levels reached 4.0 g/dL. Albumin was shown to steadily increase with time on dialysis (Cheu 2012).
Albumin in the normal population is about 4.0 to 5.0 g/dL. When implementing a rule for addressing low serum albumin it would be useful to know if the patient had been prescribed an oral supplement. There could be a functional measure to monitor the number of patients who had an albumin below 3.5 or 3.8 and had received oral protein supplementation. This would allow a measure that shows response of the facility after discovering a low albumin level. However, an oral supplements indicator is not currently available in the data. There would need to be clinical information on the patients that are not eligible (e.g. have swallowing problems).
3.2.2 Scientific acceptability (reliability & validity) Albumin is a powerful predictor of health and mortality as well as QOL. It is often a combined marker of nutrition and inflammation. It has been shown to improve with oral protein supplementation. Its value is generally accepted by the community and is used by dieticians in risk stratifying and counseling patients.
3.2.3 Feasibility & usability Serum albumin is a data element that is regularly measured by hemodialysis facilities and is also readily available in CROWNWeb.
3.2.4 Review of existing measures There are no existing NQF endorsed measures assessing serum albumin levels.
3.2.5 Recommendations* *Please See Addendum for revised recommendations The TEP recommended an intermediate outcome measure for albumin that will be reported as the percent of patients with an average albumin below a certain threshold. Determination of the threshold is pending subsequent to extended literature review. The threshold would be averaged over a given number of months. Possible thresholds that were preliminarily discussed ranged between 3.5 - 4.0 g/dL . , based on a review of available evidence (Spiegel 2008, European Best Practice Guidelines Workgroup 2002, National Kidney Foundation 2006), but a more detailed literature review will be conducted prior to setting any threshold.
a) Numerator and denominator: i) Denominator Inclusions:
(1) 18 or older (2) HD Patients (3) Non-missing serum albumin data

16
(4) On Dialysis > 90 days Same provider for 30 days.
ii) Numerator Definition: (1) Number of patients with an average albumin below an unagreed upon threshold over a
given number of months. Possible thresholds that were discussed ranged between 3.5 - 4.0 g/dL.
iii) Exclusions: It would be reasonable to exclude patients with recent (within the last 30 days)
hospitalization and those new to dialysis (say within the first 90 days), or those with residual renal function and underlying heavy proteinuria (more than 3g/day).
iv) Risk adjustment:
Possible risk-adjustment may be used to account for patient characteristics across facilities.
3.2.6 Other recommendations There was a recommendation to conduct further literature review to investigate the methodology between plasma and serum albumin.
4. Discussion of Adequacy Based on Considerations of Patient Safety as well as Optimum Fluid and Larger Molecular Clearance Dialysis adequacy has broad implications for hemodialysis patients and their survival. In the United States, current guidelines measure dialysis adequacy based solely on small solute clearance considerations using concepts based on urea kinetics, ever since publication of the landmark National Cooperative Dialysis Study. Despite the majority of dialysis patients achieving targets for urea kinetics, the mortality rate among hemodialysis patients has remained unacceptably high. Hence there is a recognized need to broaden the concept of dialysis adequacy and examine other candidate measures in addition to those based on urea clearance alone. In this context, certain critically important components of the dialysis therapy such as ultrafiltration rate, length of hemodialysis sessions, avoidance of intradialytic hypotension (IDH) with resultant ‘myocardial stunning’, and close attention to fluid-weight management related measures, should be considered as potential domains fertile for quality measure development.
4.1 Ultrafiltration Rate (UFR)* *Please see addendum for revised recommendations
4.1.1 Literature Review & Scientific Importance The TEP members were in agreement with regards to the scientific importance of this potential measure. Ultrafiltration rate has a wide variability, and the published literature suggests that higher UFR is an independent predictor of mortality. UFR >10 ml/h/kg was associated with higher odds of intradialytic hypotension (OR=1.30; P=0.045) and a higher risk of mortality (RR=1.09; P=0.02) (Saran 2006). Since this publication there have been others confirming this association using multivariable analyses, thus corroborating its biological plausibility [Flythe 2011] and Movilli et al, which quotes a higher threshold UFR of 12 ml/h/kg as being associated with higher mortality [Movilli 2007]. The underlying thesis that faster UFR can lead to higher frequency of IDH and therefore ‘myocardial stunning’, a concept that has
17
been promulgated mostly by work from McIntyre et al, and is not limited to just potential for cardiac injury alone, but also has implications for recurrent central nervous system, intestinal and other organ perfusion related damage . There were no randomized clinical trials known to this TEP comparing different UFR strategies. The UK Renal Association Guideline 8.3 recommends that a maximum hourly ultrafiltration rate during hemodialysis should not exceed 10ml/kg/hour. UFR is calculated using pre and post dialysis weight (in kg) as well as delivered session time.
UFR = [(((∆ wt kg)*1000)/(delivered time/60))/post wt kg]
When performing the calculation using May 2012 CROWNWeb data, 39% of patients had a UFR ≥ 10 ml/kg/hr, and 11% of patients had a UFR ≥ 15 ml/kg/hr. The average UFR was 9.2 with a median of 8.7 ml/kg/hr.
4.1.2 Feasibility & usability The data elements needed to calculate UFR are readily available in CROWNWeb. UFR is easy to calculate and a relatively straightforward measure to understand. Ultrafiltration would be particularly easy to manage by controlling time on dialysis or its frequency. UFR > 10 is already a standard being used in some facilities. A TEP member noted that in those facilities a patient cannot go above UFR > 10 without specific orders to do so from a clinician. In the absence of accurately being able to measure absolute dry weight and calculate refilling this was felt to be a reasonable compromise. If in a given patient it was not possible to meet the fluid removal goal over a certain amount of time, an extra (i.e., 4th) dialysis treatment could well be considered or the option of prolonging treatment time would be the only alternative short term solution. UFR could thus be thought of as a preventative safety measure to ensure stable dialysis sessions. It would also potentially encourage facilities to consider prolonging treatment time and institute measures to reduce interdialytic weight gain in their patients.
4.1.3 Scientific acceptability (reliability & validity) This measure would be acceptable, reliable and considered valid by the scientific community based on the evidence reviewed by the TEP.
4.1.4 Review of existing measures There are no existing NQF endorsed measures for UFR. There was one previously proposed measure for UFR. The Centers for Medicare & Medicaid Services (CMS) Technical Expert Panel (TEP) held in 2010 on Fluid Weight Management recommended reporting the proportion of patients who did not receive an ultrafiltration (UF) rate greater than or equal to 15 mg/kg/hr in the reporting month. However, this measure did not pass importance criteria. At the time, lack of clinical guidelines as well as too few supporting metrics and limited published data did not provide the level of evidence needed to support a new measure endorsement. There was no clear evidence that a target of 15 ml/kg/hr was an appropriate standard of care. Since 2010, the evidence regarding ultrafiltration rate and its effect on patients has improved.
18
4.1.5 Recommendations* *Please See Addendum for revised recommendations
The TEP recommended a process measure for reporting the percent of patients with a UFR greater than 10 ml/kg/hr
a) Numerator/Denominator:
i) Denominator Inclusions (1) 18 or older (2) HD Patients (3) On Dialysis > 90 days (4) Same provider for 30 days. (5) Pre dialysis weight (kg) cannot be missing (6) Post dialysis weight (kg) cannot be missing (7) Delivered Time per Sessions cannot be missing
ii) Numerator Definition:
Number of patients with a UFR greater than 10 ml/kg/hr
iii) Exclusion or risk adjustment suggested: none considered.
4.1.5 Other recommendations Possible analyses or literature reviews could be performed to better understand was how increasing treatment time would affect UFR (e.g. at a facility level, what percentage of patients go down from 15 to 12 or 12 to 10 ml/kg/hr when the average treatment time is increased by 30 minutes).
4.2 Minimum time (length of dialysis) per session* *Please See Addendum for additional post-TEP discussions and changes to the recommendations
4.2.1 Literature Review & Scientific Importance The TEP noted that in Modern US dialysis practice, time on dialysis has not received the importance it deserves. In other words, the t in Kt/V has received short shrift in routine HD Practice, with focus almost entirely on achieving minimal urea removal goals over a relatively short time (typically 3-4 hours). During usual HD practice, ‘t’ is prolonged only if it is unavoidable, and almost grudgingly. Both providers and patients have been resistant to change this paradigm. On the other hand, voluntary shortening and skipping of dialysis are frequent in the US, in the setting of thrice weekly hemodialysis. Thus far there have been multiple publications addressing the importance of treatment time, including the landmark NCDS randomized clinical trial in which time on dialysis was directly addressed in a 2X2 factorial design (Lowrie 1981, Saran 2004). The results had shown a benefit in terms of lower hospitalization in the longer treatment time arm, but this result was ignored at the time due to a p-value of 0.06 for the estimate, despite earlier discontinuation of the trial and a relatively small sample size; subsequent focus on urea reduction as the more successful intervention per se, followed and short, ‘high efficiency’ HD became the norm. Much has since been written regarding this misinterpretation of the NCDS results.
19
The TEP was informed by one TEP member, that there was talk about potential implementation of a cluster randomized trial addressing the issue of treatment time, soon to be initiated by NIH, possibly in partnership with the LDOs. However, it was felt that results from such a trial were unlikely to be available for some years from now. Given the preponderance of evidence thus far, mostly from large, albeit well-analyzed observational studies and the NCDS trial, albeit a long time ago, that longer time on dialysis is potentially beneficial, and also because ‘time’ is generally recognized by several national guidelines as fundamentally important to optimum and safe delivery of dialysis.
UFR by itself, while related, does not directly address the issue of time per session of hemodialysis. While UFR is considered “multifactorial”, and may vary from session to session, time per HD session can be formulated as a more specific goal. A longer minimum dialysis session length not only ensures higher (i) small molecule clearance (i.e., Kt/V urea), but also has other advantages including, (ii) the possibility of greater clearance of sequestered ‘middle molecules’ (e.g. beta-2 microglobulin)(iii) permitting slower ultrafiltration rate, and consequently lower propensity for intradialytic hypotension and therefore, (iiv) greater potential for achieving optimum post-dialysis target weight.
A number of existing guidelines around the world recommend longer minimum treatment time of 4 hours, in addition to minimum targets for Kt/V, compared with K/DOQI, the widely used national source for HD guidelines, which recommended a minimum treatment time of only 3 hours.
• UK Renal Association (2009) Guideline 5.5 – adequate hemodialysis three times per week defined as
o a combination of the minimum recommended dialysis dose (URR >65% or eKt/V >1.2) and
o A minimum recommended treatment time per session (240mins).
• European Best Practice Guidelines 2002
o The Standard HD dose should be delivered 3 X 4 hours per week even if standards of adequacy such as dose expressed as eKt/V are reached, a minimum time of 3 X 4 hours is desirable
• K/DOQI 2006 update
o Minimum dialysis treatment time for thrice weekly dialysis with Kr less than 2ml/min should be at least 3 hours
4.2.1 Feasibility & usability Delivered time per session for hemodialysis patients is a data element available in CROWNWeb Delivered time per session is easy to collect and a relatively straightforward measure to understand. However, concerns were expressed by some TEP members that some facilities may have logistical or financial challenges in order to implement longer dialysis times.
4.2.2 Scientific acceptability (reliability & validity) Time intervals of as little as 30 minutes longer treatment time have been shown to be significantly associated with lower mortality (Saran 2006). A TEP member recommended that protocol could be adopted to require patients to be dialyzed for a minimum of 4 hours. Based on May 2012 CROWNWeb data, the mean delivered time per session was around 220 minutes, and raising the bar by at least 20
20
minutes was viewed as being a reasonable minimum target to achieve. The TEP decided to vote on the measure, given that this topic was extensively discussed and a number of studies were cited in support of a minimum 4-hour threshold (e.g., NCDS 1981, Saran 2006, Flythe 2012, Marshall 2006, and Tentori 2011). It was pointed out that in US data alone in some of the studies did not show a benefit for the 4-hour threshold (Tentori 2011, Ramirez 2012, Miller 2010). The vote was unanimously (7/7) in favor of this as a quality measure.
4.2.3 Review of existing measures There are no existing NQF endorsed measures for a minimum dialysis session length
4.2.4 Recommendation* *Please See Addendum for Revised Recommendations There was consensus among the TEP to recommend a minimum dialysis session length as a process measure with 4 hours as a minimum threshold but excluding patients with significant residual renal function (KrU ≥ 2.0 ml/min/1.73 m2), where an exception could be made.
a) Numerator and Denominator i) Denominator Inclusions
(1) 18 or older (2) HD Patients (3) On Dialysis > 90 days (4) Same provider for 30 days. (5) Delivered Time per Sessions cannot be missing (6) Rx_sessions_per_week cannot be missing (7) Dialyzed at 3 times per week
ii) Numerator Definition
Number of adult HD patients with a dialysis sessions length ≥ 240 mins
iii) Exclusions Patients with KrU ≥ 2.0 ml/min/1.73 m2 (should be measured during the previous three months. This is currently not a mandatory data element in CROWNWeb, and is rarely reported. The TEP encourages facilities that have patients with residual renal function to report this data element.)
iv) No risk-adjustments were recommended
4.3 Rate of hospitalization due to fluid overload
4.3.1 Literature Review & Scientific Importance The TEP noted that heart failure and fluid overload are common and a major cause of morbidity and mortality in the dialysis population. The rate of hospitalization due to CHF is relatively high (approx. 22% among Medicare dialysis patients from 2008-2011 and costs associated with events (CHF, pulmonary edema, etc.) are significant. The rate of hospitalization could be reduced by monitoring and taking measures to control fluid overload. A measure that specifically addresses hospitalization due to fluid overload/heart failure, as an outcome rather than a process measure, could potentially be an important facility level quality measure. Facilities ought to be highly motivated to prevent hospitalization due to fluid overload/heart failure.
21
4.3.2 Review of existing measures No existing measures were reviewed. The TEP members looked at ICD-9 codes of what is currently included in the Dialysis Facility Reports for hospitalization due to congestive heart failure.
4.3.3 Potential measure discussed at the TEP meeting, but not recommended This was a suggested, but not recommended, outcome measure that would address patient safety similar to SMR or SHR. A potential numerator would have been the number of patients admitted to the hospital with CHF associated to fluid overload in a given month or over a certain finite period of time. While fluid overload hospitalization demonstrates scientific importance the TEP members felt it was not ready for further development as the evidence was so far limited. It was uncertain whether or not lack of control of fluid overload is a true cause of CHF. There are issues with determining the exact cause of heart failure with administrative claims data. There are very specific criteria to consider CHF admissions. Although there was some evidence obtained from a published paper using ICD-9 codes, it does not guide the facility in what to do about it. There are also no data available in CROWNWeb for hospitalizations, heart failure, or fluid overload. ICD-9s associated with CHF and fluid overload can be identified by claims. There may not be enough information in claims data to adequately link together the two aspects: CHF and fluid overload. No further recommendations were therefore recommended for analysis or literature review.
4.4 Interdialytic Weight Gain (IDWG)
4.4.1 Literature Review & Scientific Importance IDWG is another measurement that could be used for fluid weight management, and can be estimated by calculating intradialytic weight loss (IDWL) as its surrogate as has been done in the literature (refs):
IDWL = [(pre dialysis weight (kg)/post dialysis weight (kg))/post dialysis weight (kg)]
Weight gain in between sessions reflects intake of food and fluid. Weight gain prompts high UFR, particularly if short treatment times are used. Sodium intake is the prime driver of thirst in dialysis patients and contributes to chronic fluid overload.
4.1.2 Scientific Acceptability (reliability & validity) In some earlier studies univariate analysis IDWG correlated with better nutritional indices (refs). However, several high quality, large observational studies have now shown that IDWG is independently associated with adverse outcomes.
4.2.2 Review of existing measures There are no existing NQF endorsed measures for intradialytic weight loss.
4.2.3 Measure discussed, but not recommended A potential measure would be the percent of patients with a change body weight greater than a percent of the post dialysis body weight. Possible ranges for numerator thresholds included < 2%, 2-5%, and >5%. This measure was not recommended because the elements needed to calculate interdialytic weight gain are also used in calculations for the UFR and the minimum session time measures as discussed above. There was general agreement that endorsing thresholds for UFR and minimum session’s times would address most of the added benefit that adding a measure separately for interdialytic weight gain would provide. There were no other recommendations for analysis or literature review in this topic area.

22
4.5 Intradialytic hypotension
4.5.1 Literature Review & Scientific Importance A definition of intradialytic hypotension used previously in the literature was: “any SBP drop of ≥ 30mmHg combined with a post-dialysis SBP of ≤ 100 mmHg was considered evidence of IDH” (Saran et al. 2006). The other component of this is an unstable session. Intradialytic hypotension has been tied to mortality and myocardial stunning. There are a few guidelines related to intradialytic hypotension:
• UK Renal Association (2009) Guideline 8.2: Recommended stepwise approach for reducing the
incidence of intradialysis hypotension: o restrict dietary sodium intake and review "dry weight" and antihypertensive drugs; o increase duration of HD to reduce the hourly ultrafiltration rate; o trial use of cool temperature dialysis.
• Canadian Society of Nephrology (CSN), 2006
o Blood Pressure Measurement – Timing and Targets o Reduce dialysate temperature when intradialytic hypotension limits
ultrafiltration. (Grade C)
4.5.2 Review of existing measures There are no existing NQF endorsed measures for intradialytic hypotension
4.5.3 Measures discussed but not recommended This area lacks both feasibility and usability. The calculation requires a pre to post dialysis calculation, and the data are not available in CROWNWeb or claims. Similar to intradialytic weight loss, setting thresholds to slow down UFR and increase the minimum session length would indirectly address this issue.
4.6 Dialysate composition
4.6.1 Literature Review & Scientific Importance The TEP discussed that some evidence suggests that dialysate composition represents an important safety concern for patients. Dialysate electrolyte composition could ensure patient safety in part by preventing sudden deaths that could occur if dialysate composition was suboptimal. If there was exposure to concentrations that could drive electrolytes out of the normal physiological ranges it could potentially put patients at risk. A comprehensive literature search has not been performed in this area and the TEP was unwilling to go too much into this topic for measure development at the present time.
In general, serum levels of electrolytes are not necessarily related directly to dialysate composition. An argument could be made to report both serum potassium and dialysate electrolyte values to be interpretable if one was to consider developing measures in this area.
Cardiopulmonary arrest deaths during dialysis are relatively infrequent, although deaths may occur shortly before or shortly after, and particularly early in the week (in the setting of thrice weekly dialysis). However, there was one finding that suggested that sudden death was associated with short treatment time, large ultrafiltration, low kt/V, and dialysate potassium composition of less than 3.0mEq/L (DOPPS, May 2012). Values of serum potassium above 5.5 to 6.0 are considered significant thresholds for

23
elevating the risk of mortality, although this is primarily from observational studies. Low serum potassium could also reflect malnutrition.
4.6.2 Review of existing measures There are no existing NQF endorsed measures for dialysate composition.
4.6.3 Measures discussed but not recommended There is also some degree of lack of scientific acceptability. Despite high associations, it’s not clear that potassium is a direct cause of these sudden deaths, or whether increasing potassium is going to prevent sudden deaths. There is a relatively large gap in the level of evidence in this category. When looking at patients with high IDWG, modulating sodium dialysate might be difficult. It may be hard to standardize dialysate composition as the patients need for sodium, potassium, etc., varies and blood pressure and IDWG may need to be managed appropriately and by other means. This area is also lacking feasibility and usability. The data for dialysate sodium is currently voluntarily reported in CROWNWeb. CROWNWeb indicates whether a prescribed dialysate sodium concentration exceeds 138 mEq/L for any dialysis session during the month. Approximately 80% of this data is currently missing in CROWNWeb. Serum potassium and serum bicarbonate are currently not collected, and obtaining dialysate composition elements in CROWNWeb would involve a significant amount of data collection that would be a burden on facilities.
5. Additional Discussion on Impact of Timing on Kt/V On day 2, a question was proposed by CMS regarding whether the timing of monthly labs at dialysis facilities influences the data that is reported. There was a concern about the potential for gaming of reported values among facilities. A current limitation of CROWNWeb is that values are only reported for the last draw of the month. Since only one measure is made for the month, it is hard to know whether or not the measure is representative for that month. For some clinical measures, the time in which the measure was taken is important (e.g. potassium). TEP members stated that there was a potential for bias because of this. The magnitude of the values may depend largely on when the event occurred (for example, day of the week, rather than timing within the month), and these values may show significant ties to events within relatively short time frames. A bias may also result from staff that may induce or convince nonadherent patients to stay on and act differently on days when the measurements are actually taken, for example in the case of Kt/V or reporting of treatment time. A question was raised on how to increase the representativeness of the data. It is not clear if a facility is reporting values favorably versus randomly. A possible alternative proposed by CMS was whether or not data collected as the first value of the month. The justification for using the first measurement of the month is because it provides a certain degree of randomization for sampling since the number and frequency of measurements fluctuate and are not universal among facilities. Collecting one measure at the beginning of the month also reduces the burden for getting clearance each month. However, many of the TEP members felt that the last of the month was still important because it represents the clinical decisions made to treat the patient at the beginning of the month. On the other hand, no one dialysis treatment is thought to be representative of the month. The first or last measurements of the month are not good enough alone as it takes away the clinician’s reaction to the patient’s conditions during the month. A possible compromise is to use a two-point method to reduce error. This would allow time to make clinical decisions to make appropriate changes that would reflect the appropriate treatment. In a
24
similar line of thinking, collecting pre and post BUN measurements reduces the potential for gaming on the post BUN measurement as it provides the relative change in values during a given month. One could also collect the prescription and the corresponding delivered data elements. As long as the delivered matches the prescribed you know that they are getting what they are supposed to. It was ultimately determined that a best measurement would be to report all the draws, but that would have an impact on the data burden for the facility. There was agreement that the last of the month inclusion did not create a substantial way for the facilities to game the system and potentially accounted for change in care by the facility, which actually shows good patient care.
6. Conclusions The 2013 HD adequacy TEP primarily addressed potential areas of improvement in competent, safe solute removal, and had been expanded to address larger issues beyond small solute clearance alone. The recommendations from the 2013 HD adequacy TEP included the development of two outcome measures (nPCR and serum albumin; pending further literature review post-TEP) and four process measures (collecting and reporting data elements for the calculation of standardized Kt/V and surface are normalized Kt/V, maximum ultrafiltration rate threshold and minimum length of hemodialysis sessions). An additional outcome measure was considered (hospitalization for heart failure/fluid overload), but not recommended.
There was a unanimous decision for an outcome measure to report the percent of treatment times at or above 4 hours. This measure would exclude patients with KrU ≥ 2.0 ml/min/1.73 m2. The TEP also agreed on a quality measure for reporting the percent of patients with a UFR greater than 10 ml/kg/hr. The TEP agreed that nPCR and albumin may be important outcome quality measures in order to ensure ‘nutritional adequacy’. The relationship Kt/V and nPCR were discussed. There was a discussion regarding the nature of this relationship (linear vs. non-linear), the threshold of Kt/V above which no further increase in nPCR is observed and whether this represented purely a mathematical vs. a biological relationship. There was uncertainty about the relationship between nPCR and serum albumin, and a concern about the “action-ability” for nPCR as well as toward improving serum albumin by protein supplementation. The methodology for using plasma versus serum albumin measurements will be investigated further. The TEP’s recommendation of a quality measure for nPCR is pending further literature review. The TEP agreed on a quality measure for albumin as the percent of patients with an average albumin below an unagreed upon threshold over a given number of months, which may require risk-adjustment or exclusions. There was agreement to not pursue any measures for IDWL, hospitalizations related to fluid overload/heart failure, intradialytic hypotension, or dialysate composition.
The TEP recommended developing process measures for UFR, treatment time, stdKt/V and SANKt/v. Specifically, the components required to calculate both the stdkt/V and the SANkt/V should be reported in CROWNWeb. The TEP accepted standard kt/V in order address need to serve the growing number of folks receiving treatment more than 3 times per week, to serve schedules with varying interdialytic times, to allow for observed variation in sex mortality, and emphasize the importance of serial measurements of residual renal function. The TEP has stressed that the standardized kt/V is a minimum target. Facilities should continue to follow the KDOQI guideline of spkt/V delivered ≥ 1.2 for three times per week, and to target spkt/V ≥ 1.3 to ensure the minimum target is reached. There are question about twice per week unless there are residual urea measurements. Spkt/V at three times per week should be translated to ekt/V translated to stdkt/V.
25
The TEP encouraged the use of online clearance (OLC) measurements, but felt it was too early to incorporate this methodology for measure development. It was deemed a promising technology with several different methods currently in use. There is no validation of methods for a gold standard and different “V” was being used for the calculation. The TEP felt that facilities use this technology as their internal quality control metric with immediate feedback to direct care staff. There is currently no practical path to collect or report OLC data at the national level.
The TEP also recommended strategies to help mitigate symptomatic hypotension that may predispose cardiac stunning. These include moderate UFR, longer treatment times, increased delivered dose of HD, cooler dialysate, O2 supplementation, alteration of cation concentration of dialysate, and modality changed to PD, nocturnal, or short daily. The concern for providing authority to use a 4th treatment was justified in this global context.
In general, the TEP felt modifications to UFR, session time, and kt/V would address the technical aspects of dialysis adequacy as well areas considered within a broader scope. The calculations for IDWL are also used for UFR and session time. Setting thresholds to slow down UFR and increase the minimum session length could indirectly address this issue of intradialytic hypotension. UFR, session time, and ktV are also modifiable factors associated with sudden cardiac death. The additional recommendations also offer strategies that could be used to further improve the safety and well-being of the patient.
7. Summary or Recommendations • Standardized (Std) Kt/V reporting measure reporting percent of adult HD patients in a facility
with all necessary data elements reported to calculate the weekly Standard Kt/V on a monthly basis.
o Denominator Inclusions 18 or older HD Patients On Dialysis > 90 days Same provider for 30 days.
o Numerator Definition The number of patients with necessary data elements reported. The elements
required for stdKt/V would include modality, birthdate, dialysis start date, prescribed sessions per week, spKt/V, spKt/V method, spKt/V collection date, delivered minutes of BUN Hemodialysis session, Pre BUN, post BUN, pre dialysis weight and unit of measurement, post dialysis weight and unit of measurement, residual urea clearance (optional), and vascular access type.
• Surface Area Normalized (SAN) stdKt/V reporting measure reporting the percent of adult HD patients in a facility with all necessary data elements reported to calculate the weekly SAN stdKt/V on a monthly basis.
o Denominator Inclusions 18 or older HD Patients On Dialysis > 90 days Same provider for 30 days.
o Numerator Definition
26
The number of patients with necessary data elements reported. The elements required to calculate SAN stdKt/V include all elements required for stdKt/V as well as date of spKt/V measurement, Height and unit of Measurement, Sex, Race, Diabetes status.
• Normalized Protein Catabolic Rate (nPCR) outcome measure o Tentatively proposed; pending further review of the literature and further discussion
post TEP.
• Serum Albumin intermediate outcome measure that will be reported as the percent of patients with an average albumin below a certain threshold. Note: Determination of the threshold is pending subsequent to extended literature review and further discussion post TEP.
o Denominator Inclusions: 18 or older HD Patients Non-missing serum albumin data On Dialysis > 90 days
Same provider for 30 days. o Numerator Definition:
Number of patients with an average albumin below an unagreed upon threshold over a given number of months. Possible thresholds that were discussed ranged between 3.5 - 4.0 g/dL.
o Exclusions: It would be reasonable to exclude patients with recent (within the last 30 days) hospitalization and those new to dialysis (say within the first 90 days), or those with residual renal function and underlying heavy proteinuria (more than 3g/day).
o Risk adjustment: Possible risk-adjustment may be used to account for patient characteristics across facilities.
• Ultrafiltration Rate (UFR) process measure for reporting the percent of patients with UFR > 10
ml/kg/hr.* o Denominator Inclusions
18 or older HD Patients On Dialysis > 90 days Same provider for 30 days. Pre dialysis weight (kg) cannot be missing Post dialysis weight (kg) cannot be missing Delivered Time per Sessions cannot be missing
o Numerator Definition Number of patients with a UFR greater than 10 ml/kg/hr
o Exclusion or risk adjustment suggested: none considered.
*Please see addendum for revised recommendations
• Minimum dialysis session length process measure with 4 hours as a minimum threshold, but excluding patients with significant residual renal function (KrU ≥ 2.0 ml/min/1.73 m2), where an exception could be made.*
27
o Denominator Inclusions 18 or older HD Patients On Dialysis > 90 days Same provider for 30 days. Delivered Time per Sessions cannot be missing Rx_sessions_per_week cannot be missing Dialyzed at 3 times per week
o Numerator Definition Number of adult HD patients with a dialysis sessions length ≥ 240 mins
o Exclusions Patients with KrU ≥ 2.0 ml/min/1.73 m2 (should be measured during the
previous three months. This is currently not a mandatory data element in CROWNWeb, and is rarely reported. The TEP encourages facilities that have patients with residual renal function to report this data element.)
o No risk-adjustments were recommended *Please see addendum for revised recommendations
8. References Arneson T, Liu J, Qiu Y et al. “Hospital Treatment for Fluid Overload in the Medicare Hemodiaysis Population”. Clinical Journal of the American Society of Nephrology : CJASN (2010) 5:1057-63. Charra B, Terrat JC, Vanel T, et al. “Long thrice weekly hemodialysis: the Tassin experience.” International Journal of Artificial Organs (2004) 27(4):265-83.
Cheu C, Pearson J, Dahlerus C et al. “Association between Oral Nutritonal Supplementation and Clinical Outcomes among Patients with ESRD.” Clinical Journal of the American Society of Nephrology (2012) 8(1): 100-7. Daugirdas JT, Greene T, Chertow GM, et al. "Can rescaling dose of dialysis to body surface area in the HEMO study explain the different responses to dose in women versus men?" Clinical journal of the American Society of Nephrology : CJASN (2010) 5:1628-36. PMID: 20595687
Daugirdas JT, Greene T, Depner TA, et al. "Modeled urea distribution volume and mortality in the HEMO Study." Clinical journal of the American Society of Nephrology : CJASN (2011) 6:1129-38. PMID: 21511841
Daugirdas JT, Leypoldt JK, Akonur A, et al. "Improved equation for estimating single-pool Kt/V at higher dialysis frequencies." Nephrology, dialysis, transplantation : official publication of the European Dialysis and Transplant Association - European Renal Association (2012). PMID: 22561585
European Best Practice Guidelines Working Group. “European Best Practice Guidelines for Haemodialysis (Part 1). Nephrology Dialysis Transplantation (2003) 17 [Suppl 7].
Flythe JE, Curhan GC, Brunelli SM. “Shorter length dialysis sessions are associated with increased mortality, independent of body weight.” Kidney International (2012) 83, 104–113.
28
Flythe JE, Kimmel SE, Brunelli SM. “Rapid fluid removal during dialysis is associated with cardiovascular morbidity and mortality.” Kidney International (2011) Jan; 79(2):250-7. PMID: 20927040
Gotch FA “The current place of urea kinetic modeling with respect to different dialysis modalities” Nephrology Dialysis Transplantation (1998) 13 [Suppl 6]: 10–14
Jadoul M, Thumma J, Fuller DS, et al. "Modifiable practices associated with sudden death among hemodialysis patients in the Dialysis Outcomes and Practice Patterns Study." Clinical journal of the American Society of Nephrology : CJASN (2012) 7:765-74. PMID: 22403271
Kalantar-Zadeh K, Regidor DL, Kovesdy CP, Van Wyck D, Bunnapradist S, Horwich TB, Fonarow GC. “Fluid retention is associated with cardiovascular mortality in patients undergoing long-term hemodialysis.” Circulation. 2009 Feb 10;119(5):671-9. doi: 10.1161/CIRCULATIONAHA.108.807362. Epub 2009 Jan 26.
Lacson E, Brunelli SM. "Hemodialysis treatment time: a fresh perspective." Clinical journal of the American Society of Nephrology : CJASN (2011) 6:2522-30. PMID: 21885788
Leypoldt J, Jaber B, Zimmerman D. “Predicting Treatment Dose for Novel Therapies Using Urea Standard Kt/V Seminars in Dialysis – Vol 17, No 2 (March-April) 2004 pp. 142 - 145
Lowrie EG, Lew NL. “Death Risk in HD patients: the predictive value of commonly measured variables and an evaluation of death rate differences between facilities.” American Journal of Kidney Disease (1990) 15; 458-452.
Lowrie EG, Liard NM, Parker TF et al. “Effect of the hemodialysis prescription of patient morbidity: report from the National Cooperative Dialysis Study.” New England Journal of Medicine (1981) 305(20):1176-81.
Marshall MR, Byrne BG, Kerr PG et al. “Associations of hemodialysis dose and session length with mortality risk in Australian and New Zealand patients.” Kidney International (2006) 69, 1229–1236.
Miller JE, Kovesdy CP, Nissenson AR et al. "Association of Hemodialysis Treatment Time and Dose With Mortality and the Role of Race and Sex". American Journal of Kidney Disease (2010) 55(1): 100-112.
Movilli E, Gaggia P, Zubani R, et al. “Association between high ultrafiltration rates and mortality in uraemic patients on regular haemodialysis. A 5-year prospective observational multicentre study.” Nephrology Dialysis Transplantation (2007) 22: 3547-3552.
Mutsert RD et al. Association between serum albumin and mortality in dialysis patients is partly explained by inflammation, and not by malnutrition. Am Journal of Clinical Nutrition (2009) 89:787-93
National Kidney Foundation. “Clinical practice guidelines for nutrition in chronic renal failure. K/DOQI, National Kidney Foundation.”American Journal Kidney Diseases. 2000 Jun;35(6 Suppl 2):S1-140.
National Kidney Foundation. KDOQI Clinical Practice Guidelines and Clinical Practice Recommendations for 2006 Updates: Hemodialysis Adequacy, Peritoneal Dialysis Adequacy and Vascular Access. Am J Kidney Dis 48:S1-S322, 2006 (suppl 1).
Owen WF et al. The urea reduction ratio and serum albumin concentration as predicators of mortality in patients undergoing HD. New England Journal of Medicine (1993) 329; 1001-6
29
Saran R, Bragg-Gresham JL, Levin NW, et al. “Longer treatment time and slower ultrafiltration in hemodialysis: associations with reduced mortality in the DOPPS.” Kidney International (2006) 69: 1222–28.
Saran R, Canaud B, Depner T et al. Dose of Dialysis: Key Lessons From Major Observational Studies and Clinical Trials. AJKD 44(5) Suppl 2 (November 2004) : ppS47-S53.
Spiegel BMR et al. Biomarkers and health-related quality of life in end-stage renal disease: a systematic review. Clinical Journal of the American Society of Nephrology: CJASN (2008)3; 1759-68
Tentori F, Zhang J, Li Y, Karaboyas A, Kerr P, Saran R, Bommer J, Port F, Akiba T, Pisoni R, Robinson B. “Longer dialysis session length is associated with better intermediate outcomes and survival among patients on in-center three times per week hemodialysis: results from the Dialysis Outcomes and Practice Patterns Study (DOPPS).” Nephrol Dial Transplant(2012)27(11):4180-8.
1
End Stage Renal Disease (ESRD) Quality Measure Development and Maintenance
Hemodialysis Adequacy Clinical Technical Expert Panel Summary Report Addendum Prepared by: Arbor Research Collaborative for Health and the University of Michigan Kidney
Epidemiology and Cost Center Conducted April 16-17, 2013 in Baltimore, MD
Sent to CMS on June 28, 2013
Contract No. 500-2008-00022I, Task Order No. HHSM-500-T0001
Addendum to the Hemodialysis Adequacy Clinical Technical Expert Panel Conducted April 16-17, 2013 in Baltimore, MD A summary report of the follow-up conference call held after the in-person TEP meeting
1.1 Introduction The following section summarizes the discussions and recommendations from the TEP following the in-person TEP conference held in Baltimore, MD.
Following the TEP meeting and circulation of the draft summary report, additional discussion was initiated via email by one TEP member who had not been present during the in-person meeting. The literature presented to the group was interpreted as showing possibly conflicting evidence for both a minimum treatment time as well as an ultrafiltration rate, presenting implications for the recommendations originally made at the in-person meeting. Given the additional comments on these two issues, the TEP requested that the post TEP conference call, originally scheduled for discussion of nutritional measures, be utilized to discuss the measures originally proposed for a minimum treatment time and ultrafiltration rate.
The Chair of the TEP concluded the post TEP conference call by confirming that decisions regarding four measures originally recommended by the TEP at the in-person meeting will need to be finalized via an e-mail ballot. The final voting ballot was distributed to each member of the TEP. The TEP members were asked to grade the measure based on the draft specifications for four measures that were originally recommended at the in-person meeting:
1. The stdKt/V reporting measure 2. The SAN stdKt/V reporting measure 3. Percent of patients with a UFR greater than 10 ml/kg/hr (process measure) 4. Minimum dialysis session length of 4 hours (process measure)
The ballot consisted of three questions:
2
1. Final grade for overall quality of evidence (A-D, definitions of each were included in the ballot). 2. Should this measure move forward in its current form? Please provide rationale. 3. Suggested revisions to measure specifications.
The votes were compiled and summarized on June 5th, 2013 by the chair of the TEP. The ballots that were developed to retain the original recommendations held at the in-person TEP only asked TEP members to grade and vote on treatment time. It did not contain an option for a higher ultrafiltration threshold, for which supporting evidence was also discussed during the post TEP conference call on (May 23rd, 2013). A second round of voting ballots for an ultrafiltration > 13 ml/kg/hr threshold were distributed to the TEP members on June 12th, 2013, and the final results for this measure were compiled and summarized on June 18th, 2013.
1.2 StdKt/V and SAN-stdKt/V
1.2.1 Additional Discussion There was no formal discussion of stdkt/V or SAN-stdkt/V following the in-person TEP.
1.2.2 Final Votes
Standardized (Stdkt/V) The level of evidence determined by the TEP ranged from A to C (grade A (4); grade B (2); grade C (2)), but 7 of 8 members voted “Yes” for this to be a reporting measure to collect all of the necessary elements needed for to calculate stdKt/V.
One TEP member voted “No”. They felt that the complex formulas for stdkt/V are “unintuitive” for physicians describing their therapy, and that the calculation of stdKt/V using a model based transformation from spKt/V into eKt/V into stdKt/V introduces too much unknown variability, which is not supported by clinical trials that could otherwise be used to establish an appropriate threshold for adequate Stdkt/V.
By majority vote, the TEP recommended a reporting measure encouraging the submission of the data elements necessary to calculate stdKt/v for all eligible patients in a facility.
Surface Area Normalized (SAN stdKt/V) The level of evidence determined by the TEP ranged from A to D (grade A (3); grade B (3); grade C (1); grade D (1)), but 6 of 8 TEP members voted “Yes” for a reporting measure to collect all of the necessary elements needed for to calculate SAN stdKt/V.
The two TEP members that voted “No” noted the limited number of studies supporting SAN stdkt/V, and that the grade of evidence was relatively low. Similar to stdKt/V there is still a lot of unknown variability,
3
which is not supported by clinical trials that could support an appropriate threshold for adequate SAN stdkt/V.
By majority vote, the TEP recommended a reporting measure encouraging the submission of the data elements necessary to calculate SAN stdKt/v for all eligible patients in a facility.
1.3 Minimum Treatment Time > 4 Hours for Hemodialysis Patients without Residual Kidney Function
1.3.1 Additional Discussion The original recommendation for treatment time made by the TEP at the in-person meeting had received a unanimous vote (7 of 7) among TEP members who were present for the TEP in-person meeting. Discussion about the original recommendation for treatment time measure a result of a TEP member (not present at the in-person meeting) presenting their interpretation of the literature and available evidence via email as part of their comments on the draft report describing the TEP’s decisions made at the in-person meeting. The TEP member questioned the presentation of evidence regarding the treatment time recommendation. It was suggested only studies that supported a threshold of 4 hours received full attention at the in-person discussion. For example, they cited recent US literature which showed mixed results for a treatment time threshold of 4 hours and lower mortality only when analysis was done by marginal structural modeling (Brunelli 2010). The TEP member expressed little confidence in the analysis as it had required sophisticated statistical techniques to prove the value of treatment time > 4 hours. They indicated that their confidence in the Marginal Structural Model (MSM) was low after reading a recent study published in CJASN that had looked at a HD vs. PD comparison using this statistical technique and found that peritoneal dialysis was associated with 48% lower mortality than hemodialysis over the first 2 years of dialysis therapy (Lukowsky 2013). They also pointed to evidence suggesting that 3 or 3 ½ hours, but not 4 hours, were acceptable as significant minimum treatment time thresholds, based on another US study (Miller 2010). Also, the TEP member further noted that a multicenter trial called TiMe was currently being planned specifically to more definitively address the effects of treatment time, and they expressed concern that the recommendation of a treatment time measure by CMS could block successful recruitment and hinder the progress of this trial. It was also indicated that the KDOQI guidelines published in 2006 (National Kidney Foundation 2006) had recommended a minimum treatment time of 3 hours. The TEP member supported a CMS quality measure at this threshold, with a caveat of waiting for more definitive findings from the TiMe trial. There was subsequent discussion about the recommendation over email and in response to these comments and issues regarding interpretation of the evidence related to treatment time as described in the summary of the TEP’s discussion at the April 16-17 in-person meeting. Arbor Research/UM-KECC scheduled a conference call with the TEP in order to fully address these subsequent comments and concerns raised over email in response to the draft TEP summary report.
During the post TEP conference call (May 23rd, 2013), the Arbor Research/UM-KECC moderator provided an overview of the available literature on dialysis treatment time and its associations with outcomes
4
(including mortality), including 2 recent publications which further demonstrated potential benefits of a minimum treatment time threshold of 4 hours. The first was an analysis of 14,643 US patients from a single dialysis chain, showing that compared with delivered session length >240 minutes, session length <240 minutes was associated with higher all-cause mortality (adjusted hazard ratio [95% confidence interval], 1.32 [1.03 to 1.69]) in multivariable and stratified analyses (Flythe 2013). Another paper published recently, based on an analysis of the Dry-Weight Reduction in Hypertensive Hemodialysis Patients (DRIP) trial, showed that patients receiving longer than 4 hour treatments demonstrated better blood pressure control in all treatment groups, whereas patients with shorter times on dialysis showed higher and more difficult to treat blood pressure (Tandon 2013). In preparation for this call, Arbor Research/UM-KECC had also initiated a preliminary evidence review of 15 papers in the form of an evidence table (see page 12). This document was distributed to the TEP prior to the call. A TEP member emailed the group prior to the conference call and expressed concern that the evidence supporting a 4-hour threshold for treatment time was not robust and mostly from observational studies and with variable outcomes related to treatment time. As an example, during the conference call the TEP member cited published data from the Japanese Dialysis Registry (Shinzato 1997). They indicated that this was an observational study on Japanese patients showing a relative mortality risk for a 3.0-3.5 hour treatment that was 4x (or 400%) higher than that of a treatment of 4-4.5 hours. They suggested this seemed implausible given what is known about the effects of treatment time. For comparison, they cited another observational US study published by Miller et al 2010, that found that mortality risk is higher for treatment times less than 3 hours (in women) and less than 3.5 hours (in men), but had demonstrated no beneficial effect over 3.5 hours (Miller 2010). They also cited the paper by Ramirez et al 2012, which had analyzed data from the Clinical Performance Measures (CPM) project on a cohort of US patients, primarily for studying the topic of surface area normalized stdKt/V, but where one of the analyses pertaining to treatment time had observed a non-significant trend toward higher mortality with longer treatment time (Ramirez 2012). The TEP member also stated their concern about the applicability of findings from non-US cohorts (Japan, Europe, Australia-New Zealand) to US dialysis patients. The TEP member also inquired as to why CMS was interested in proposing a measure prior to the consensus national guideline development process, noting that in the past CMS would propose measures based on published guidelines, not vice versa.
The group then discussed the upcoming TiME trial, being planned by the NIH in conjunction with two of the large dialysis chains. The application for the trial had been reviewed by a number of experts, who reviewed the available evidence and found that the question of recommended treatment time was unanswered and warranted a clinical trial. It was discussed that while a proposed quality measure related to treatment time may not prevent the trial from taking place, it may make it more difficult to conduct. Since this is one of few clinical trials that will have ever been performed on this topic, this may be something to consider when deciding to move forward with a measure on minimum session length or treatment time. The TiME trial had briefly been discussed at the in-person TEP meeting, but all TEP members were not aware at the time that it was being planned as a multicenter study sponsored by NIH and supported by two of the large dialysis chains.
5
A TEP member noted that the proposed measure of minimum treatment time of 4 hours may create unintended consequences for dialysis facilities. It may be hard to implement for patients who have been on dialysis for a long period of time and accustomed to shorter treatment times. It may also cause an issue with capacity of the dialysis units. Increasing patient’s treatment time simultaneously may push clinics over the edge in terms of staffing needs.
One of the TEP members stated that published European data (Saran 2006, Tentori 2012) had shown a link between longer treatment time and lower mortality, and that patients should have an interest in achieving those outcomes in the United States. However, studies that ask patients about treatment time usually report that patients are generally against longer treatments. Other TEP members observed that European countries may have better outcomes for reasons other than longer treatment time, such as better vascular access practices, for example.
The group discussed lowering the 4-hour threshold for the measure. A measure using 3 hours as the threshold for minimum time on dialysis was suggested, even though a large majority of patients already dialyze longer than this. The median treatment time in the US is currently around 3.75 hours. Based on available CROWNWeb data presented at the in-person TEP meeting, it was indicated to the TEP that since only a small fraction of patients in the US does not currently meet the measure at the 3 hour threshold, it would likely not be a meaningful threshold and therefore not pass the importance criteria required of quality measures by the NQF. While there was disagreement about proposing an alternative 3-hour threshold, the majority of the TEP members did not feel confident that there was enough evidence to support a 4-hour minimum either. When asked about a systematic review that he had recently authored in a peer-reviewed journal (Lacson 2011) in which the authors had concluded with the suggestion, “that a new treatment paradigm should consider a minimum adequate dialysis treatment time of 4 hours for the majority of patients, with anything shorter becoming the exception rather than the rule”, the TEP member responded that while he stood by the recommendation made in their review, based on their interpretation of published data, he hesitated to impose the minimum 4 hour threshold on the entire dialysis community as a mandatory performance measure as it would not preserve the physician’s choice and limit their freedom to practice medicine. The TEP member also indicated that in their dialysis facilities a 4 hour treatment threshold is recommended for all incident HD patients within their own facilities, but had no authority to recommend this to other providers. It was suggested by one TEP member that unless a 4-hour threshold could be graded with an A (based on the A-D grading scale used by the TEP), the TEP should not recommend the measure.
The grading scale specifies the following criteria for the A-D grades:
A: High quality of evidence, meaning “We are confident that the true effect lies close to that of the estimate of the effect.”
B: Moderate quality of evidence, meaning “The true effect is likely to be close to the estimate of the effect, but there is a possibility that it is substantially different.”
C: Low quality of evidence, meaning “The true effect may be to substantially different from the estimate of the effect.”

6
D: Very low quality of evidence, meaning “The estimate of effect is very uncertain, and often will be far from the truth.”
The TEP members took an informal vote at this time, with the results being:
A: 2
B: 1
C: 4
It was agreed that in view of the lack of consensus regarding how to interpret the evidence and literature on this topic, and a reversal of TEP’s original recommendation at the in person TEP meeting, the next step for the treatment time measure would be through a formal vote of all TEP members regarding the quality of evidence/support for this measure. This would take place via e-mail after the call, and Arbor Research/UM-KECC would make sure that the relevant evidence is available for download on the CTools website. TEP members were asked to submit their ballots to the chair and the Arbor Research support/administrative staff.
1.3.2 Final Votes In the e-mail vote conducted after the TEP conference call, the level of evidence determined by the TEP ranged from B to D (grade B (3); grade C (4); grade D (1)). 7 of 8 TEP members voted “No” on the proposed measure for a minimum treatment time of 4 hours, while one alternatively proposed a 3 hour target, another proposed a 3 ½ hour target, and another proposed that treatment time be a ‘reporting measure’ to collect data.
In summary, based on the above discussions that took place after the in person TEP meeting, the TEP’s final recommendation based on a formal re-vote (7 of 8 opposed) and grading of existing evidence, was to no longer move forward with a recommendation of a minimum treatment time > 4 hours, and to defer discussions regarding treatment time to a future TEP when more definitive evidence on the metric becomes available. This final vote represents a change to the recommendation made at the in-person TEP for a measure on minimum treatment time > 4 hours.
1.4 Ultrafiltration Rate in Hemodialysis Patients
1.4.1 Additional Discussion During the in-person meeting, the TEP had recommended a process measure for reporting the percent of patients at dialysis facilities with a UFR greater than 10 ml/kg/hr. This measure was reconsidered after a TEP member (not present at the in-person meeting or pre-meeting teleconferences) had raised an issue regarding the data. This comment was shared with the TEP via e-mail after the meeting and in response to their review of the draft TEP Summary Report. The premise of having a 10 ml/kg/hr threshold was based on a study that had conducted a secondary analysis of data from the HEMO study. This analysis showed that the risk of higher mortality in patients with a UFR at 10-13 ml/kg/hr versus <10 ml/kg/hr was relatively small (HR=1.06), and not statistically significant, while a statistically significant increase in mortality was reported when comparing ≥13 ml/kg/hr to < 10 ml/kg/hr (HR=1.71),
7
all after adjusting for confounding factors. A graphical representation of the relationship using a Cubic spline analysis showed a steep increase in both CV and all-cause mortality from 10 to 13 ml/kg/hr (Flythe 2011). The TEP member who raised concerns noted issues regarding this study. In particular, the model examining the relationship between UFR and mortality had been adjusted for interdialytic weight gain (IDWG), which they considered inappropriate. If, for example, treatment time was constant, UFR would be directly proportional to IDWG. Body size was not adjusted for in the paper, which the TEP member explained was a mistake, reducing the value of the study’s findings. Additionally, the paper did not analyze UFR, or the impact of changing UFR, during the follow-up period of the HEMO study after patients were randomized to the treatment arms of the trial.
The discussion continued with the TEP member outlining 4 key ways to reduce UFR in individual patients: 1) by extending treatment time, 2) by increasing frequency of dialysis sessions, 3) by lowering dietary sodium, and 4) by lowering dialysate sodium. Keeping these factors in mind one could make the case that the higher risk of mortality in smaller patients is due to high UFR or shorter treatment time that these individuals typically get, etc. This suggested a need to compare risk of mortality within body size strata and UFR.
While acknowledging that there may be potential issues with the statistical methods used in the Flythe paper, another TEP member stressed the fact that in their experience at 9 dialysis clinics the implementation of the 10ml/kg/hr UFR threshold had been feasible in their practice without any problems, although they had not published their experience in this regard. A UFR < 10 ml/kg/hr standard had already been implemented successfully in 9 clinics where they use a comprehensive approach to manage the interdialytic weight gain. This has been done in all sizes of patients and had required increasing treatment time in a relatively small proportion of individuals. There have been medication adjustments and dietary sodium restriction has been greatly highlighted in those dialysis units. The weight gains were progressively removed during the week to achieve the estimated/prescribed post dialysis target weight without additional hospitalizations for fluid overload. The TEP member had made the similar point during the in-person meeting which was acknowledged by the other members present at the meeting.
At the post TEP conference call there was general agreement among TEP members that UFR was an important issue, but the cutoff of 10ml/kg/hr may need to be revisited based on an evidence review. One TEP member noted that similar to treatment time, there are questions regarding the quality of evidence for an ultrafiltration rate measure. Additionally, the CROWNWeb data presented at the in-person TEP showed that the median ultrafiltration rate among facilities was approximately 10 ml/kg/hr, and a recommendation to alter this would affect a very large proportion of patients. A cutoff of 15 was suggested. However, there are few patients in the US who would report a rate higher than that. A cutoff 13 was suggested as a compromise. It was decided by the TEP chair that the final vote and additional evidence on this measure would take place over e-mail after the teleconference.
1.4.2 Final Vote The results of the grading and e-mail vote (June 5th, 2013) after the conference call indicated that the level of evidence determined by the TEP ranged from A to C (grade A (2); grade B (3); grade C (3)). TEP

8
member votes were mixed: 2/8 voted “Yes” for a quality measure related to the fraction of patients with UFR > 10 ml/kg/hr. Among the six that voted “No” on the measure, three still supported the measure if the threshold were to be raised to 13; one alternatively proposed that this only be a reporting measure to collect available data, and not be recommended as a quality performance measure.
Although the majority of the TEP was not in favor of a threshold of 10 ml/kg/hr proposed at the in-person TEP, there was some support for a UFR measure with a higher threshold of 13 ml/kg/hr proposed during the post TEP conference call. To ensure that all potential recommendations discussed were given equal consideration, a second voting ballot was sent to the TEP. As of June 18th, 2013, the grading for an upper limit of 13, ranged from A to C, and an exact grade was provided by 5 of 8 TEP members (grade A (2); grade B (1); grade C (2)). One TEP member did not provide a specific grade, but indicated it was not A, while the other two members did not provide any grade with their votes. Five members voted in principle for a measure with a threshold of UFR >13 ml/kg/hr. Three members voted no for UFR as a quality measure (with one noting support for UFR as a reporting measure only).
1.5 Final Recommendations: In summary, the final voting on the four measures originally recommended by the TEP at the in-person meeting resulted in the following final recommendations (as of June 18th, 2013):
1. The stdKt/V reporting measure a. 7 of 8 in favor b. No changes to original recommendations c. Numerator/Denominator:
i. Denominator Inclusions 1. 18 or older 2. HD Patients 3. On Dialysis > 90 days 4. Same provider for 30 days
ii. Numerator Definition: The number of patients with necessary data elements reported. The elements required for stdKt/V would include modality, birthdate, dialysis start date, prescribed sessions per week, spKt/V, spKt/V method, date of spKt/V measurement, delivered minutes of BUN Hemodialysis session, Pre BUN, post BUN, pre dialysis weight and unit of measurement, post dialysis weight and unit of measurement, residual urea clearance (optional), and vascular access type.
2. The SAN stdKt/V reporting measure
a. 6 of 8 in favor b. No changes to original recommendations c. Numerator/Denominator
i. Denominator Inclusions
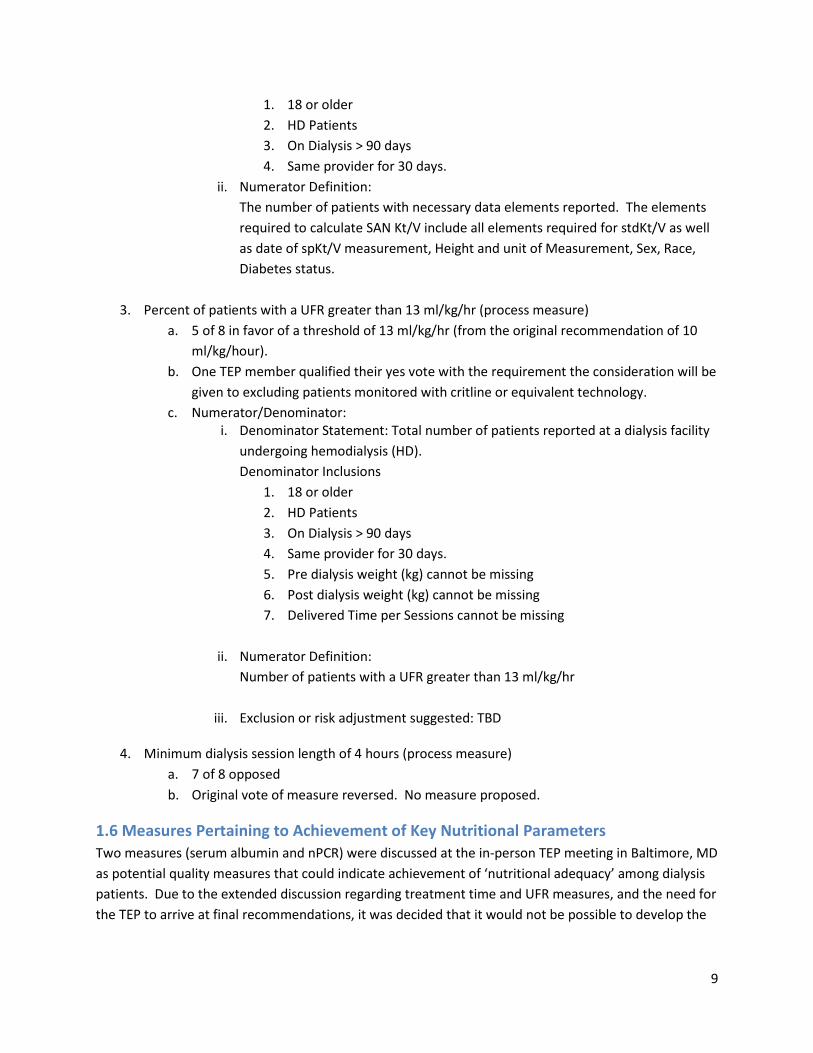
9
1. 18 or older 2. HD Patients 3. On Dialysis > 90 days 4. Same provider for 30 days.
ii. Numerator Definition: The number of patients with necessary data elements reported. The elements required to calculate SAN Kt/V include all elements required for stdKt/V as well as date of spKt/V measurement, Height and unit of Measurement, Sex, Race, Diabetes status.
3. Percent of patients with a UFR greater than 13 ml/kg/hr (process measure)
a. 5 of 8 in favor of a threshold of 13 ml/kg/hr (from the original recommendation of 10 ml/kg/hour).
b. One TEP member qualified their yes vote with the requirement the consideration will be given to excluding patients monitored with critline or equivalent technology.
c. Numerator/Denominator: i. Denominator Statement: Total number of patients reported at a dialysis facility
undergoing hemodialysis (HD). Denominator Inclusions
1. 18 or older 2. HD Patients 3. On Dialysis > 90 days 4. Same provider for 30 days. 5. Pre dialysis weight (kg) cannot be missing 6. Post dialysis weight (kg) cannot be missing 7. Delivered Time per Sessions cannot be missing
ii. Numerator Definition:
Number of patients with a UFR greater than 13 ml/kg/hr
iii. Exclusion or risk adjustment suggested: TBD
4. Minimum dialysis session length of 4 hours (process measure) a. 7 of 8 opposed b. Original vote of measure reversed. No measure proposed.
1.6 Measures Pertaining to Achievement of Key Nutritional Parameters Two measures (serum albumin and nPCR) were discussed at the in-person TEP meeting in Baltimore, MD as potential quality measures that could indicate achievement of ‘nutritional adequacy’ among dialysis patients. Due to the extended discussion regarding treatment time and UFR measures, and the need for the TEP to arrive at final recommendations, it was decided that it would not be possible to develop the
10
evidence base or the specifications for these potential nutrition measures at this time and that this exercise was best deferred to a future TEP for consideration.
1.7: Additional Suggestions by TEP members regarding potential data elements in CROWNWeb The following are additional issues that were presented via e-mail by one of the TEP members after the in-person TEP meeting. These suggestions and discussions did not impact the final recommendations made by the TEP above, as there was not adequate time for discussion of pros and cons for these types of recommendations by the other TEP members. The comments are provided here for informational purposes.
Measurement of residual kidney function (RKF) The importance of KDOQI recommended measurement of residual kidney function (RKF) on a regular basis in patients still making urine was emphasized. It was noted that reporting in CROWNWeb has been patchy thus far with a lot of missing data. A questionnaire approach to collecting RKF or measuring urine volume alone, were suggested as alternative approaches.
Adding treatment-specific questions to the annual QOL questionnaire The quality of life (QOL) instruments currently used are not dialysis specific, and there are no dialysis-specific questions. This limits knowledge regarding important factors such as post dialysis recovery time or tolerability of treatments, for example. It was recommended that CMS consider adding 4-5 dialysis specific questions to the annual QOL questionnaire.
Adding dialysate composition / temperature info to what is reported to CROWNWeb Dialysate composition is usually relatively fixed for most patients. Dialysate composition and temperature have been associated with outcomes. Therefore incorporating these data elements to future iterations of CROWNWeb may be useful.

11
1.8 Evidence Table for Treatment Time Authors Title/Year Type of Study
(N)
Analysis and outcomes
Session Length
Findings
Flythe, Curhan, Brunelli
“Disentangling the Ultrafiltration Rate-Mortality Association: The Respective Roles of Session Length and Weight Gain”/2013
Observational study with prevalent patients
N= 14, 643 total
1794 pts stratified by session length pair matched by IDWG
Mortality
240 min. Adjusted HR 1.32 (1.03-1.69); P =0.39
Tandon, Sinha, Agarwal
“Shorter delivered dialysis times associated with higher and more difficult to treat blood pressure”/2013
RCT
N= 150
Secondary analysis of data from RCT
Blood pressure
Overall median time of 3.6 hours
In the group in which dry weight was probed, BP improved more quickly in those patients with longer dialysis times
BP did not change in those patients whose dry weight was not probed regardless of time
Flythe, Curhan, Brunelli
“Shorter length dialysis sessions are associated with increased mortality, independent of body weight”/2012
Observational study with prevalent patients
N = 10,571 total
Stratified by session length, matched on covariates including weight
Primary endpoint mortality
240 minutes Unadjusted HR 1.11 (0.97-1.26; p =.12)
Adjusted HR 1.26 (1.07-1.48; p =.0005)
Tentori, Zhang, Li, Saran, et al
“Longer dialysis session length is associated with better intermediate outcomes and survival among patients on in-center three times per week hemodialysis: results from DOPPS”/2012
Observational study with prevalent patients in North America, Japan, Europe/ANZ (12 countries overall)
N=37,414
Association of treatment time with mortality and intermediate outcomes
Standard regression analyses and instrumental variable approaches
Time ranged from 180 minutes to 300 minutes
Longer treatment times associated with improved mortality and intermediate outcomes and differed across region
Ramirez, “ Dialysis Dose Observational Scaled Men Vant-adjusted showed “slight
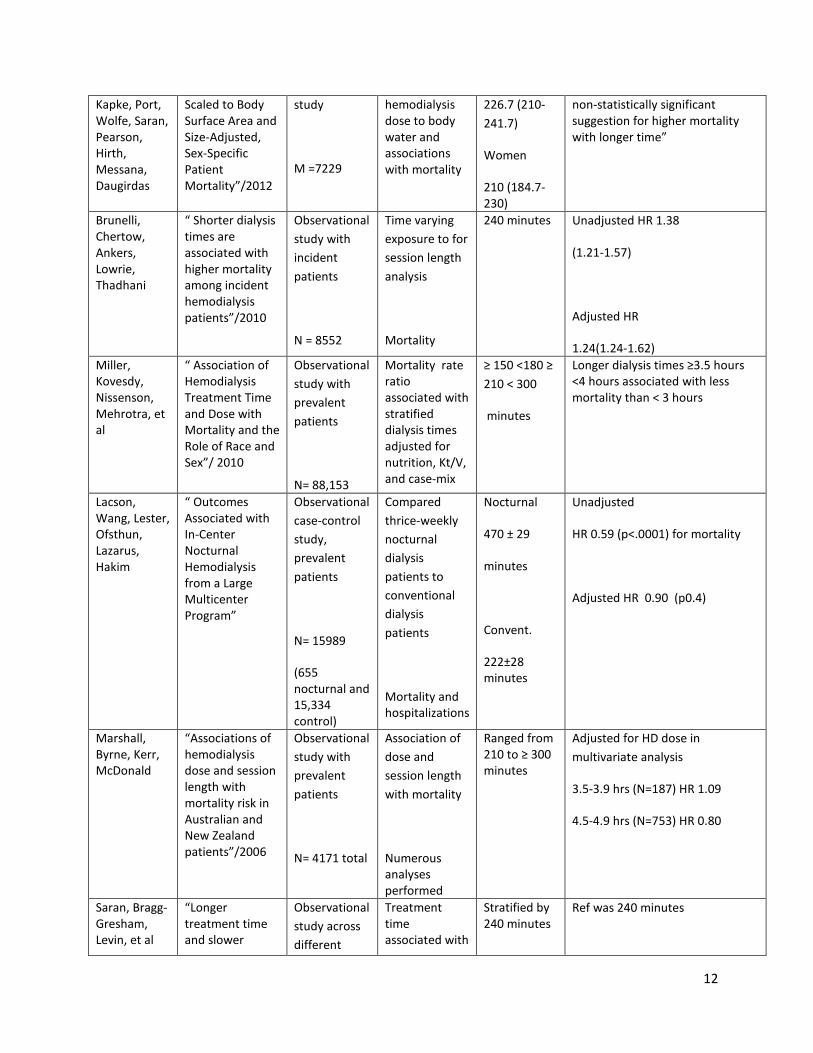
12
Kapke, Port, Wolfe, Saran, Pearson, Hirth, Messana, Daugirdas
Scaled to Body Surface Area and Size-Adjusted, Sex-Specific Patient Mortality”/2012
study
M =7229
hemodialysis dose to body water and associations with mortality
226.7 (210-241.7)
Women
210 (184.7-230)
non-statistically significant suggestion for higher mortality with longer time”
Brunelli, Chertow, Ankers, Lowrie, Thadhani
“ Shorter dialysis times are associated with higher mortality among incident hemodialysis patients”/2010
Observational study with incident patients
N = 8552
Time varying exposure to for session length analysis
Mortality
240 minutes Unadjusted HR 1.38
(1.21-1.57)
Adjusted HR
1.24(1.24-1.62) Miller, Kovesdy, Nissenson, Mehrotra, et al
“ Association of Hemodialysis Treatment Time and Dose with Mortality and the Role of Race and Sex”/ 2010
Observational study with prevalent patients
N= 88,153
Mortality rate ratio associated with stratified dialysis times adjusted for nutrition, Kt/V, and case-mix
≥ 150 <180 ≥ 210 < 300
minutes
Longer dialysis times ≥3.5 hours <4 hours associated with less mortality than < 3 hours
Lacson, Wang, Lester, Ofsthun, Lazarus, Hakim
“ Outcomes Associated with In-Center Nocturnal Hemodialysis from a Large Multicenter Program”
Observational case-control study, prevalent patients
N= 15989
(655 nocturnal and 15,334 control)
Compared thrice-weekly nocturnal dialysis patients to conventional dialysis patients
Mortality and hospitalizations
Nocturnal
470 ± 29
minutes
Convent.
222±28 minutes
Unadjusted
HR 0.59 (p<.0001) for mortality
Adjusted HR 0.90 (p0.4)
Marshall, Byrne, Kerr, McDonald
“Associations of hemodialysis dose and session length with mortality risk in Australian and New Zealand patients”/2006
Observational study with prevalent patients
N= 4171 total
Association of dose and session length with mortality
Numerous analyses performed
Ranged from 210 to ≥ 300 minutes
Adjusted for HD dose in multivariate analysis
3.5-3.9 hrs (N=187) HR 1.09
4.5-4.9 hrs (N=753) HR 0.80
Saran, Bragg-Gresham, Levin, et al
“Longer treatment time and slower
Observational study across different
Treatment time associated with
Stratified by 240 minutes
Ref was 240 minutes
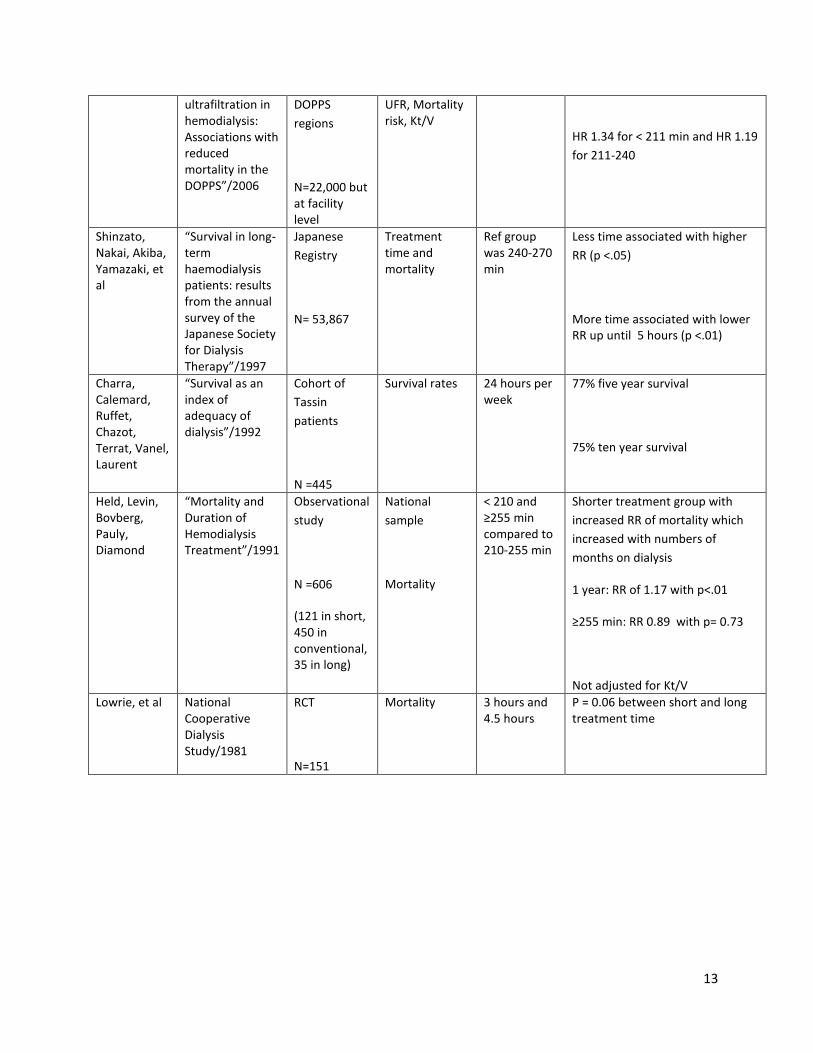
13
ultrafiltration in hemodialysis: Associations with reduced mortality in the DOPPS”/2006
DOPPS regions
N=22,000 but at facility level
UFR, Mortality risk, Kt/V
HR 1.34 for < 211 min and HR 1.19 for 211-240
Shinzato, Nakai, Akiba, Yamazaki, et al
“Survival in long-term haemodialysis patients: results from the annual survey of the Japanese Society for Dialysis Therapy”/1997
Japanese Registry
N= 53,867
Treatment time and mortality
Ref group was 240-270 min
Less time associated with higher RR (p <.05)
More time associated with lower RR up until 5 hours (p <.01)
Charra, Calemard, Ruffet, Chazot, Terrat, Vanel, Laurent
“Survival as an index of adequacy of dialysis”/1992
Cohort of Tassin patients
N =445
Survival rates 24 hours per week
77% five year survival
75% ten year survival
Held, Levin, Bovberg, Pauly, Diamond
“Mortality and Duration of Hemodialysis Treatment”/1991
Observational study
N =606
(121 in short, 450 in conventional, 35 in long)
National sample
Mortality
< 210 and ≥255 min compared to 210-255 min
Shorter treatment group with increased RR of mortality which increased with numbers of months on dialysis
1 year: RR of 1.17 with p<.01
≥255 min: RR 0.89 with p= 0.73
Not adjusted for Kt/V Lowrie, et al National
Cooperative Dialysis Study/1981
RCT
N=151
Mortality 3 hours and 4.5 hours
P = 0.06 between short and long treatment time
14
1.9 References Brunelli SM, Chertow GW, Ankers ED et al. "Shorter dialysis times are associated with higher mortality among incident hemodialysis patients." Kidney International (2010) 77(7):630-6.
Charra B, Terrat JC, Vanel T, et al. “Long thrice weekly hemodialysis: the Tassin experience.” International Journal of Artificial Organs (2004) 27(4):265-83.
Flythe JE, Curhan GC, Brunelli SM. "Disentangling the Ultrafiltration Rate-Mortality Association: The Respective Roles of Session Length and Weight Gain". Clinical Journal of the American Society of Nephrology (2013) Epub ahead of print.
Flythe JE, Kimmel SE, Brunelli SM. “Rapid fluid removal during dialysis is associated with cardiovascular morbidity and mortality.” Kidney International (2011) Jan; 79(2):250-7.
Flythe JE, Curhan GC, Brunelli SM. “Shorter length dialysis sessions are associated with increased mortality, independent of body weight.” Kidney International (2012) 83, 104–113.
Held PJ, Levin NW, Bovbjerg RR et al. "Mortality and Duration of Hemodialysis Treatment". Journal of the American Medical Association (1991) 265(7): 871-5.
Lacson E, Wang W, Lester K, et al. "Outcomes Associated with In-Center Nocturnal Hemodialysis from a Large Multicenter Program." Clinical Journal of the American Society of Nephrology (2010) 5(2): 220-26.
Lowrie EG, Liard NM, Parker TF et al. “Effect of the hemodialysis prescription of patient morbidity: report from the National Cooperative Dialysis Study.” New England Journal of Medicine (1981) 305(20):1176-81.
Lukowsky LR, Mehrota R, Kheifets L et al. "Comparing mortality of peritoneal and hemodialysis patients in the first 2 years of dialysis therapy: a marginal structural model analysis." Clinical Journal of the American Society of Nephrology (2013) (4):619-28.
Marshall MR, Byrne BG, Kerr PG et al. “Associations of hemodialysis dose and session length with mortality risk in Australian and New Zealand patients.” Kidney International (2006) 69, 1229–1236.
Miller JE, Kovesdy CP, Nissenson AR et al. "Association of Hemodialysis Treatment Time and Dose With Mortality and the Role of Race and Sex". American Journal of Kidney Disease (2010) 55(1): 100-112.
National Kidney Foundation. KDOQI Clinical Practice Guidelines and Clinical Practice Recommendations for 2006 Updates: Hemodialysis Adequacy, Peritoneal Dialysis Adequacy and Vascular Access. American Journal of Kidney Disease 48:S1-S322, 2006 (suppl 1).
Ramirez SP, Kapke A, Port FK et al. "Dialysis Dose Scaled to Body Surface Area and Size-Adjusted, Sex-Specific Patient Mortality." Clinical Journal of the American Society of Nephrology (2012) 7(12): 1977-87.

15
Saran R, Bragg-Gresham JL, Levin NW, et al. “Longer treatment time and slower ultrafiltration in hemodialysis: associations with reduced mortality in the DOPPS.” Kidney International (2006) 69: 1222–28.
Shinzato, Nakai, Akiba, Yamazaki, et al. “ Survival in long-term haemodialysis patients: results from the annual survey of the Japaneses Society for Dialysis Therapy” Nephrology Dialysis Transplantation 1997, 12: 884-888.
Tandon T, Sinha AD, Agarwal R. “Shorter delivered dialysis times associate with a higher and more difficult to treat blood pressure.: Nephrology Dialysis Transplantation (2013) Jan 24. Epub ahead of print.