Embed Size (px)
Citation preview

Contents lists available at ScienceDirect
Journal of Rural Studies
journal homepage: www.elsevier.com/locate/jrurstud
Empowerment in agricultural value chains: Mixed methods evidence fromthe PhilippinesHazel Malapita,∗, Catherine Ragasaa, Elena M. Martinezb, Deborah Rubinc, Greg Seymoura,Agnes Quisumbingaa International Food Policy Research Institute, Washington, DC, USAb Tufts University, Medford, MA, USAc Cultural Practice, LLC, Bethesda, MD, USA
A R T I C L E I N F O
Keywords:GenderValue chainsAgricultural marketsLivelihoodsWomen's empowerment
A B S T R A C T
Women's participation and empowerment in value chains are goals of many development organizations, butthere has been limited systematic, rigorous research to track these goals between and within value chains (VCs).We adapt the survey-based project-level Women's Empowerment in Agriculture Index (pro-WEAI) to measurewomen's and men's empowerment in the abaca, coconut, seaweed, and swine VCs in the Philippines and toinvestigate the correlates of empowerment. Results show that most women and men in all four VCs are dis-empowered, but unlike in many other countries, Filipino women in this sample are generally as empowered asmen. Pro-WEAI results suggest that respect within the household and attitudes about gender-based violence(GBV) are the largest sources of disempowerment for both women and men, followed by control over use ofincome and autonomy in income-related decisions. Excessive workload and lack of group membership are otherimportant sources of disempowerment, with some variation across VCs and nodes along VCs. Across all four VCs,access to community programs is associated with higher women's empowerment, and access to extension ser-vices and education are associated with higher men's empowerment. Our results show that, despite the relativelysmall gender gaps in the Philippines, persistent gender stereotypes influence men's and women's empowermentand VC participation.
1. Introduction
Over the last three decades, agricultural value chain (VC)1 devel-opment and interventions have proliferated as instruments for ruraltransformation and poverty reduction. However, achieving develop-ment outcomes while making VCs pro-poor, inclusive, and empoweringto women and disadvantaged groups is challenging (Barrientos et al.,2003; Maertens et al., 2011; Minten et al., 2009). Although tools andmethods to analyze efficiency and profitability of VCs have long been afocus of VC analysis, only recently have equity and distributional im-pacts been analyzed. Many studies now explicitly address gender in-equalities in value chain analysis (Getahun and Villanger, 2018; Rubinet al., 2019; Said-Allsopp and Tallontire, 2015; Van den Broeck et al.,2018) and the methodological ‘toolbox’ for gendered value chain
analysis is expanding (Mayoux and Mackie, 2009; Riisgaard et al.,2010, 2008; Rubin et al., 2009; Senders et al., 2012). Attention togender issues in VCs uncovered important insights into the unintendedconsequences of VC participation. Much of this work consisted of nar-rative and qualitative case studies and rapid assessments, rather thanstatistical inference and quantitative impact evaluation.
Embedded within broader social and economic institutions, VCs arenot gender neutral. Studies illustrate that VCs may reach and benefitwomen, but also highlight how VCs may exacerbate gender inequalities(Bain, 2010; Dolan and Humphrey, 2000; Raworth and Kidder, 2009).In global agricultural VCs, standards and codes of conduct can helpprotect poor and marginalized VC employees and actors (Said-Allsoppand Tallontire, 2015). Nevertheless, VCs can be a lever for genderequality and women's empowerment, stemming from greater
https://doi.org/10.1016/j.jrurstud.2020.04.003Received 12 September 2019; Received in revised form 29 January 2020; Accepted 6 April 2020
∗ Corresponding author. International Food Policy Research Institute, 1201 Eye Street, NW, Washington, DC, 20005-3915, USA.E-mail addresses: [email protected] (H. Malapit), [email protected] (C. Ragasa), [email protected] (E.M. Martinez),
[email protected] (D. Rubin), [email protected] (G. Seymour), [email protected] (A. Quisumbing).1 A value chain is the sequence of interlinked agents and markets that transforms inputs and services into products with attributes for which consumers are
prepared to pay. VC development often involves subsidies or competitive grants, capacity or skills development, inputs or information provision, policy or in-stitutional innovations, and other types of support aimed at different actors or aspects of the enabling environment.
Journal of Rural Studies xxx (xxxx) xxx–xxx
0743-0167/ © 2020 The Authors. Published by Elsevier Ltd. This is an open access article under the CC BY license (http://creativecommons.org/licenses/BY/4.0/).
Please cite this article as: Hazel Malapit, et al., Journal of Rural Studies, https://doi.org/10.1016/j.jrurstud.2020.04.003

entrepreneurship and employment opportunities. For example,Maertens and Verhofstadt (2013) show that women's wage employmentin the horticultural export sector improved primary school enrollmentof boys and girls.
Gendered responsibilities and time burdens may change withgreater commercialization and can also impact domestic care, foodproduction, or food security (Arndt et al., 2011; Atteraya et al.,2016; Elmhirst et al., 2017; Lyon et al., 2017; Shackleton et al.,2011). Evidence shows that women have limited access to resourcesand information, weaker control over assets and land, less ability todemand fair prices, and greater workloads compared to men, con-straining their capacity to engage and expand into higher valueagri-enterprises that often require a minimum amount of resourcesand training (Forsythe et al., 2016; Handschuch and Wollni, 2016;Meinzen-Dick et al., 2011; Quisumbing et al., 2015). Further, ascommercialization intensifies, women may lose control to men overproduction and marketing (Ashby et al., 2009; Forsythe et al.,2016). Synthesizing impact evaluations across eight agriculturaldevelopment projects, Johnson et al. (2016) find that projects thattarget only women without involving men risk increasing women'swork burdens and potential short-term backlash through increasedintimate partner violence. These studies show that to inform VCdevelopment programs, we need to assess how men and womenparticipate in and benefit from each node of VCs, and how theirinvolvement impacts workload and empowerment.
Empirical studies, both quantitative and qualitative, show incon-clusive results and trade-offs in women's participation, empowerment,wellbeing, and development outcomes. Many studies focus exclusivelyon women and on producers and laborers, with rare mention or analysisof men or of intermediary actors in the VC (e.g., processors, traders)(Schumacher, 2014). The ambiguity in assessing empowerment impactsalso stems partly from the different definitions of empowerment and thelack of consistency in empowerment metrics. In this paper, we defineempowerment as the process by which people expand their ability tomake strategic life choices, particularly in contexts in which this abilityhad been denied to them (Kabeer, 1999). An increasing number of VCstudies attempt to operationalize empowerment using narrative andqualitative approaches (Akter et al., 2017; Forsythe et al., 2016; Said-Allsopp and Tallontire, 2015; Shackleton et al., 2011). This papercontributes to this literature by using a sequential explanatory mixedmethods study design to analyze and compare women's and men'sempowerment along multiple stages of the VC—production, processing,and trading—in the abaca, coconut, seaweed, and swine value chains inthe Philippines. These are focus commodities of development programs:abaca, coconut, and seaweed are export-oriented, while swine is a fast-growing VC supplying the local market. Initial qualitative interviewsinformed the survey design; we then adapted the survey-based project-level Women's Empowerment in Agricultural Index (pro-WEAI)(Malapit et al., 2019a) to quantify and compare women's and men'sempowerment in these VCs. We also tested other survey modules notincluded in pro-WEAI to capture other possible constraints and sourcesof disempowerment in VCs. Finally, we conducted additional key in-formant interviews in the coconut and seaweed VCs to explain and addnuance to the quantitative results. To our knowledge, this paper is thefirst to measure, quantify, and compare women's and men's empower-ment within and across different agricultural VCs using mixed methods.
Our quantitative and qualitative data allow us to explore and testseveral hypotheses about gender gaps in empowerment within theseVCs. Our overarching hypothesis is that gender gaps in empowermentexist, but the nature and underlying correlates of these gaps differacross VCs and across VC nodes. We test the following specific hy-potheses:
(i) women are less empowered than men in this sample of VC parti-cipants in the Philippines;
(ii) among VC participants, participation in different value chains is
differentially associated with men's and women's empowerment;(iii) VC participants in higher nodes of the value chain (processing and
trading) are more empowered than participants in the productionnode;
(iv) socioeconomic factors, including wealth, livelihood sources, andeducation level, are associated with women's and men's empow-erment; and,
(v) access to external support, such as extension services and com-munity programs, is positively associated with women's and men'sempowerment.
Our data on both the primary woman and man within eachhousehold allow us to test the following hypotheses about intrahouse-hold inequality:
(i) women's (men's) participation in non-farm activities and wageemployment is negatively (positively) correlated to intrahouseholdinequality;
(ii) women's (men's) participation in the higher nodes of the VC(processing and trading) is negatively (positively) associated withintrahousehold inequality;
(iii) socioeconomic factors are associated with intrahousehold in-equality; poorer households and lower levels of education forwomen and men are associated with greater intrahousehold in-equality; and,
(iy) women's and men's relative access to external support, such asextension services and community programs, is negatively (posi-tively) associated with greater intrahousehold inequality.
This paper is structured as follows. Section 2 presents the Philippinecontext, the focus VCs, data sources, and methods. Section 3 presentsthe results, including the levels of empowerment, sources of dis-empowerment, and individual and household-level correlates of em-powerment and intrahousehold inequality. Section 4 discusses the im-plications of these results. Section 5 concludes with some key messagesand areas for future research.
2. Context, data, and methods
2.1. Context and study sites
In 2017, the Philippines was one of the fastest growing economies inAsia, with growth fueled mostly by exports. The movement of em-ployment out of agriculture, sustained remittance receipts, and thegovernment's conditional cash-transfer program contributed to povertyreduction (World Bank, 2018). However, the agriculture sector con-tinues to underperform, with production contracting by 1.3 percent andshedding 0.5 million jobs in 2016 (World Bank, 2016). Typhoons, poorinfrastructure, land-tenure issues, and other structural constraints limitagricultural productivity. Nevertheless, the agriculture sector, whichemployed 11.3 million people (30 percent of total employment) in2015, remains central to achieving inclusive and sustainable growth inthe country (PSA, 2016).
In 2012, women accounted for 16 percent of farm holders and op-erators and 28 percent of household members engaged in agriculture(PSA, 2012). In 2018, 14 percent of employed women worked inagriculture; while 30 percent of employed men worked in agriculture,and both have a declining trend (PSA, 2019a). Both women and menare involved in different stages of agricultural VCs, although specializedgender roles in agriculture are prominent in the Philippines, as inbroader Southeast Asia (Akter et al., 2017). Wage discrimination ispervasive and persistent in the agricultural labor market. Womenworkers in rice, corn, sugarcane and coconut farms received 7–10percent lower wages than men (PSA, 2019b). Valientes (2015) showsthat men wage workers in agriculture were paid 13 to 18 percent more,on average, than women between 2006 and 2009, and 74 percent of
H. Malapit, et al. Journal of Rural Studies xxx (xxxx) xxx–xxx
2

this gap was due to a gender gap rather than human capital differences.Similarly, Briones (2019) shows a wage bias against women (i.e., wagedifference for the same activity) at 21 percent. Overall, while Filipinoculture is relatively egalitarian and exhibits greater gender equality innational statistics compared to its neighboring countries (WEF, 2019),2
gendered stereotypes persist in households and workspaces that con-tinue to affect women's and men's participation and roles in agriculturalVCs.
This study focuses on abaca, coconut, seaweed, and swine VCs—allcommodities with high potential for growth and interventions fromgovernment and partners, and therefore designated as “target VCs.“3
The study was undertaken to provide rigorous diagnostics to inform thedesign of a planned large government program to develop and promotegreater inclusion in these 4 target VCs. The survey data were collectedin March–August 2017 using a purposive sampling design focusing ontop-producing provinces and villages and ensuring sufficient re-spondents for each VC and node.4 Information on these four VCs wascollected in six provinces in the Bicol and Visayas regions of the Phi-lippines. These regions are major producers of abaca, supplying anaverage of 39 and 24 percent, respectively, of domestic abaca produc-tion between 2009 and 2013 (Department of Agriculture, 2013). Co-conut, swine, and seaweed are produced across the country and aremajor industries in Bicol and Visayas. Data on each VC was collected intwo provinces, selected based on presence of production and processingactivities. Abaca and coconut data were collected in the provinces ofSorsogon and Leyte. During the field work, additional survey areas inAlbay and Southern Leyte were added due to difficulties in locatingabaca VC participants in Sorsogon and Leyte. Seaweed and swine datawere collected in Bohol and Cebu (Fig. 1).
The target sample size for each province-commodity group was 200households, totaling 400 households per commodity and 1600 house-holds for the entire survey (Fig. 2); 1264 households and 2811 in-dividuals were interviewed (see Appendix Tables B1 and B2). Thesehouseholds were distributed among 10 barangays in each of the twoprovinces for each commodity.5 The selected barangays have thehighest commodity production volume and/or land area in the pro-vince, according to the 2012 Census of Agriculture and Fisheries (PSA,2016) and are also likely to have households engaged in other VC ac-tivities.
In each barangay, a minimum of 20 households were surveyed.Producers were selected based on a listing of producers provided bybarangay leaders rather than through random sampling. The purposivesampling design was used to ensure that the sample represented variousVC roles, including production, processing, and trading.6 A screeningquestionnaire (see Appendix D) was used to identify households that
represent these three activities, as well as households with an adultwoman and man (dual-adult households [DHH]) and households withonly an adult woman (no adult man) (woman-only households [WOH]).Only households that selected one of the target VCs as their primarylivelihood were included in the survey. All households sampled in-cluded at least one adult involved in one of the target VCs. The pur-posive sampling implies that we are unable to correct for selection intoVCs.
2.2. Quantitative methodology
2.2.1. Measuring and comparing empowermentWe adapt the pro-WEAI, a survey-based tool to measure women's
and men's empowerment and inclusion in agricultural developmentprojects (Malapit et al., 2019a) to focus on aspects of empowermentrelevant to VCs. Unlike other empowerment measures (e.g., based onDemographic and Health Surveys), which do not typically cover bothmen and women, WEAI-type tools allow for direct comparison betweenwomen and men in the same household. Pro-WEAI offers additionaladvantages: it has explicit links to empowerment theory, uses bothquantitative and qualitative data to develop and validate the index, andwas designed collaboratively with 13 agricultural development projectsin Africa and South Asia to ensure that the components of the index arerelevant for different project settings (Malapit et al., 2019a). To captureempowerment across VCs, we modified the activity categories in thepro-WEAI questionnaire to include separate questions for each targetvalue chain. Additionally, we included questions about the empower-ment and inclusion of women and men in multiple stages of the VC (seeAppendix E). New indicators relevant to VCs that are not in pro-WEAIare included in this study. Given the importance of employment andlabor issues in VCs, these include autonomy in type of wage work,autonomy in working conditions, and attitudes about GBV perpetratedby an employer or landlord. We also included indicators specific to theVC that provides the household's main source of income—input inproductive decisions and control over use of income and outputs from
Fig. 1. Map of provinces and value chains surveyed.Source: Authors' illustration.
2 Out of 153 countries, the Philippines ranks 16th in the Global Gender Gapscore globally, and ranks 2nd out of 20 countries in the East Asia and the Pacificregion (WEF, 2019).
3 Consultations with the Philippine government informed the selection ofcommodities, provinces, and regions for data collection. See Malapit et al.(2019b) for background on the target commodities.
4 The purposive non-random selection of households could result in samplebias. Selected households were better connected to barangay leaders and lo-cated in relatively accessible areas of the barangay, so women in these house-holds may be more empowered than women elsewhere. This suggests that ourresults should be interpreted as the higher bound of the empowerment dis-tribution in the population.
5 The barangay is the smallest unit of local government in the Philippines.6 VC activities were defined as: Production – Respondents who work in
production activities from farming to harvesting, including feeding and care ofswine before consumption or sale. Processing – Respondents who process rawmaterials at home or through processing or agribusiness, including animalslaughter and simple to complex processing. Trading – Input sellers, traders,wholesalers, retailers, and employees working in businesses that conduct theseactivities. Respondents who were involved in multiple VCs and/or activitieswere categorized by the VC/activity that was their primary source of income.
H. Malapit, et al. Journal of Rural Studies xxx (xxxx) xxx–xxx
3

the main VC.7
The index is comprised of two sub-indices: (1) the Three Domains ofEmpowerment index (3DE) and (2) the Gender Parity Index (GPI). The3DE aggregates women's and men's achievements across 12 equally-weighted indicators that measure three types of agency: intrinsic, in-strumental, and collective (Table 1). The GPI compares the achieve-ments of women and men in the same household, aggregated for DHHs.
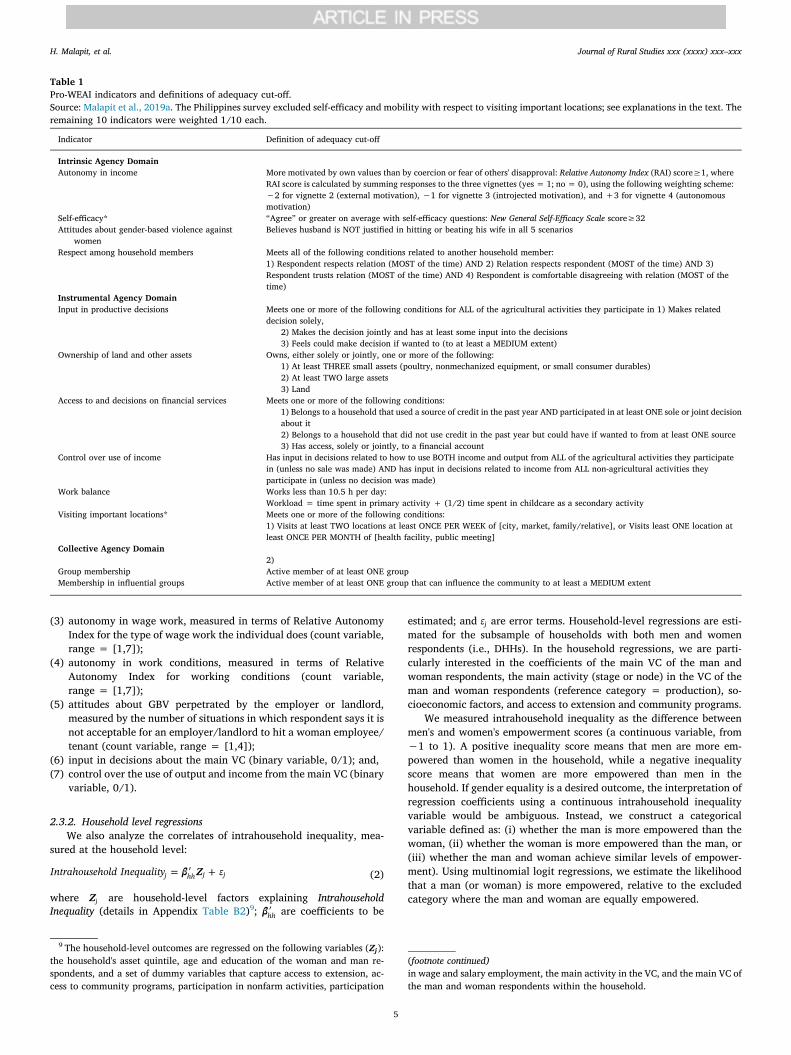
Indicators of intrinsic agency include autonomy in income, atti-tudes about gender-based violence (GBV), and respect among house-hold members; indicators of instrumental agency include input inproductive decisions, ownership of land and other assets, control overuse of income, access to and decisions on financial services, and workbalance; indicators of collective agency include group membershipand membership in influential groups. Two pro-WEAI indicators—self-efficacy (intrinsic agency) and visiting important locations (instru-mental agency)—were excluded from our survey. When this survey wasdesigned, self-efficacy was not a required indicator for pro-WEAI andwas excluded to shorten the questionnaire and minimize survey costs.Visiting important locations was excluded because constraints on mo-bility were not deemed important by our local partners given Filipinowomen's greater freedom of movement compared to the South Asiancountries where pro-WEAI has been collected. Table 1 provides thedefinitions and adequacy cut-offs for each indicator.
2.3. Identifying factors correlated with empowerment scores and gaps
We use regression analysis to examine the factors correlated withdifferent empowerment outcomes at the individual and householdlevel. At the individual level, we are concerned with empowerment ofindividuals i (Empowerment); at the household level, we analyze thedifference between empowerment outcomes of the primary man andwoman, which we broadly define as intrahousehold inequality ofhousehold j (Intrahousehold Inequality) (for DHHs, only).
2.3.1. Individual regressionsWe analyze correlates of individual empowerment:
= +XEmpowermenti ind i i (1)
where Xi are individual- and household-level factors explainingEmpowerment (details in Appendix Table B1)8; ind is a vector of coef-ficients to be estimated; and i are error terms to be estimated. In-dividual-level regressions are estimated separately for women and men.For these regressions, we are particularly interested in the coefficientsof the main VC of the respondent (reference category = seaweed), themain activity (stage or node) in the VC (reference = production), so-cioeconomic factors, and access to extension and community programs.
We use seven individual empowerment outcome variables(Empowerment). The first two indicators measure overall empowerment:
(1) whether the individual is empowered or not (a binary variable, 0/1);
(2) empowerment score based on 3DE (continuous variable, from 0 to1).
The remaining five indicators focus on empowerment regarding themain VC, extending beyond production:
Fig. 2. Survey design.Source: Authors' illustration. N = number of target observations; VC = value chain, PSA=Philippine Statistics Authority.
7 One limitation of WEAI-based measures is its focus on agricultural liveli-hoods, so respondents who do not have agriculture-based livelihoods would beclassified as disempowered. We address this limitation in this study by alsoincluding wage and salary employment but acknowledge that this measure isstill rooted in an agricultural value chain.
8 The individual-level outcomes are regressed on the following variables (Xi):whether the respondent is a man (in the pooled regression), whether the womanlives in a household with both a man and woman (dual-adult household, DHH),or household with only a woman present (woman-only household, WOH; in thewomen's regression), the household's asset quintile, whether married, age inyears, education level, and a set of dummy variables that capture access toextension, access to community programs, participation in nonfarm activities,participation in wage and salary employment, the main activity in the VC, andthe main VC of the respondent. The coefficient on the “man respondent”dummy variable indicates whether there are significant differences in em-powerment associated with being a man or a woman, whereas the woman-onlyhousehold dummy captures whether empowerment may differ for women de-pending on whether they live in a dual-adult household (with an adult womanand man present) or one with only a woman adult present. Municipality (town)or province fixed effects were also used in some of the models to control forlocation-related factors; and the results are largely robust to the inclusion oflocation-specific variables.
H. Malapit, et al. Journal of Rural Studies xxx (xxxx) xxx–xxx
4
(3) autonomy in wage work, measured in terms of Relative AutonomyIndex for the type of wage work the individual does (count variable,range = [1,7]);
(4) autonomy in work conditions, measured in terms of RelativeAutonomy Index for working conditions (count variable,range = [1,7]);
(5) attitudes about GBV perpetrated by the employer or landlord,measured by the number of situations in which respondent says it isnot acceptable for an employer/landlord to hit a woman employee/tenant (count variable, range = [1,4]);
(6) input in decisions about the main VC (binary variable, 0/1); and,(7) control over the use of output and income from the main VC (binary
variable, 0/1).
2.3.2. Household level regressionsWe also analyze the correlates of intrahousehold inequality, mea-
sured at the household level:
= +ZIntrahousehold Inequalityj hh j j (2)
where Zj are household-level factors explaining IntrahouseholdInequality (details in Appendix Table B2)9; hh are coefficients to be
estimated; and j are error terms. Household-level regressions are esti-mated for the subsample of households with both men and womenrespondents (i.e., DHHs). In the household regressions, we are parti-cularly interested in the coefficients of the main VC of the man andwoman respondents, the main activity (stage or node) in the VC of theman and woman respondents (reference category = production), so-cioeconomic factors, and access to extension and community programs.
We measured intrahousehold inequality as the difference betweenmen's and women's empowerment scores (a continuous variable, from−1 to 1). A positive inequality score means that men are more em-powered than women in the household, while a negative inequalityscore means that women are more empowered than men in thehousehold. If gender equality is a desired outcome, the interpretation ofregression coefficients using a continuous intrahousehold inequalityvariable would be ambiguous. Instead, we construct a categoricalvariable defined as: (i) whether the man is more empowered than thewoman, (ii) whether the woman is more empowered than the man, or(iii) whether the man and woman achieve similar levels of empower-ment). Using multinomial logit regressions, we estimate the likelihoodthat a man (or woman) is more empowered, relative to the excludedcategory where the man and woman are equally empowered.
Table 1Pro-WEAI indicators and definitions of adequacy cut-off.Source: Malapit et al., 2019a. The Philippines survey excluded self-efficacy and mobility with respect to visiting important locations; see explanations in the text. Theremaining 10 indicators were weighted 1/10 each.
Indicator Definition of adequacy cut-off
Intrinsic Agency DomainAutonomy in income More motivated by own values than by coercion or fear of others' disapproval: Relative Autonomy Index (RAI) score≥1, where
RAI score is calculated by summing responses to the three vignettes (yes = 1; no = 0), using the following weighting scheme:−2 for vignette 2 (external motivation), −1 for vignette 3 (introjected motivation), and +3 for vignette 4 (autonomousmotivation)
Self-efficacy* “Agree” or greater on average with self-efficacy questions: New General Self-Efficacy Scale score≥32Attitudes about gender-based violence against
womenBelieves husband is NOT justified in hitting or beating his wife in all 5 scenarios
Respect among household members Meets all of the following conditions related to another household member:1) Respondent respects relation (MOST of the time) AND 2) Relation respects respondent (MOST of the time) AND 3)Respondent trusts relation (MOST of the time) AND 4) Respondent is comfortable disagreeing with relation (MOST of thetime)
Instrumental Agency DomainInput in productive decisions Meets one or more of the following conditions for ALL of the agricultural activities they participate in 1) Makes related
decision solely,2) Makes the decision jointly and has at least some input into the decisions3) Feels could make decision if wanted to (to at least a MEDIUM extent)
Ownership of land and other assets Owns, either solely or jointly, one or more of the following:1) At least THREE small assets (poultry, nonmechanized equipment, or small consumer durables)2) At least TWO large assets3) Land
Access to and decisions on financial services Meets one or more of the following conditions:1) Belongs to a household that used a source of credit in the past year AND participated in at least ONE sole or joint decisionabout it2) Belongs to a household that did not use credit in the past year but could have if wanted to from at least ONE source3) Has access, solely or jointly, to a financial account
Control over use of income Has input in decisions related to how to use BOTH income and output from ALL of the agricultural activities they participatein (unless no sale was made) AND has input in decisions related to income from ALL non-agricultural activities theyparticipate in (unless no decision was made)
Work balance Works less than 10.5 h per day:Workload = time spent in primary activity + (1/2) time spent in childcare as a secondary activity
Visiting important locations* Meets one or more of the following conditions:1) Visits at least TWO locations at least ONCE PER WEEK of [city, market, family/relative], or Visits least ONE location atleast ONCE PER MONTH of [health facility, public meeting]
Collective Agency Domain2)
Group membership Active member of at least ONE groupMembership in influential groups Active member of at least ONE group that can influence the community to at least a MEDIUM extent
9 The household-level outcomes are regressed on the following variables (Zj):the household's asset quintile, age and education of the woman and man re-spondents, and a set of dummy variables that capture access to extension, ac-cess to community programs, participation in nonfarm activities, participation
(footnote continued)in wage and salary employment, the main activity in the VC, and the main VC ofthe man and woman respondents within the household.
H. Malapit, et al. Journal of Rural Studies xxx (xxxx) xxx–xxx
5

2.4. Qualitative methodology
The survey design was informed by initial qualitative interviews,including probing about empowerment and gender norms, and a seriesof pretests of the survey instruments. After the survey was completed,another set of qualitative interviews was conducted(September–December 2017) to provide insights into some of the keyresults and patterns emerging from the pro-WEAI scores. The secondround of qualitative work drew from the pro-WEAI qualitative proto-cols10 in combination with gender and agricultural VC approaches(Rubin et al., 2009) to address specific concerns related to participationand benefits at different nodes of the coconut and seaweed VCs.11 Thequalitative study sample included a total of 40 respondents. Sixteenrespondents, both men and women, had participated in the quantitativesurveys and reflected a diversity of occupations, locations, and ages.Additional respondents were identified when a sufficient number ofpeople who were quantitative survey respondents could not be found inthe chosen locations. The sample also included an additional 24 inter-viewees including government officials, traders, larger processors, andother key informants. The quantitative survey data were used to iden-tify four interviewees who were categorized as “disempowered,” in-cluding a man and a woman seaweed producer and a man and a womancoconut processor. Interviews were recorded and supplemented bywritten notes. Verbatim transcripts were created in the local languageand coded using English language codes using Dedoose™ software.Excerpts that demonstrated relevance of the key research themes onlocal concepts of empowerment, participation in the different VCs,barriers to entry, patterns of decision-making, and perspectives on op-portunities for the next generation, among others, were translated intoEnglish.
3. Results
3.1. Levels of empowerment
The adapted pro-WEAI shows that most women and men in all fourVCs are disempowered (i.e., inadequate in at least 75 percent of theindicators). Empowerment is lowest in the coconut VC (23% of men,29% of women) and highest in seaweed VC (47% of women and men).Empowerment was lower for women in WOHs compared to those inDHHs, except in the swine VC (Table 2). Gender parity (GPI) was highin all four VCs.
Empowerment also varied within VCs, although the sample size forprocessing and trading nodes is small. In coconut, more women traderswere empowered (38%) compared to women producers and processors(25% and 22%, respectively). More men producers were empowered(28%) compared to men processors and traders (16% and 19%, re-spectively). In seaweed, empowerment scores were similar between VCactivities, yet more producers and processors were empowered com-pared to traders, which seems contradictory to the qualitative inter-views in which producers and processors aspire to be traders for betterincome and higher status in the community. This finding is probablyattributable to the small number of large traders who were interviewed.Similarly, in abaca, empowerment was lowest among men traders. Onthe other hand, in swine, women and men traders were more empow-ered than producers and processors (Appendix Figure B2).
In all four VCs, more women and men respondents had adequateautonomy in their type of work and their working conditions than in
how they spend their income. However, most women and men re-spondents had control over how to use income and outputs from thefocus VC that was their household's main source of income, thoughfewer had control over how to use income and outputs from all of theirhousehold's agricultural activities.
Although it is common in the Philippines for married women tomanage the household income, in the coconut VC, fewer women thanmen had control over output and income from coconut. In other VCs,more women had control over use of income and outputs from theirmain VC than men. One woman explained that her “husband gives hisfull trust in me. All his income is given to me. He trusts me fully becauseI'm good in handling money.” Furthermore, she stated “I can easilymake a decision because I have money.” Nearly all respondents hadinput in decisions about their household's agricultural activities, exceptin the swine VC.
Also, a higher proportion of respondents indicated that it was neveracceptable for an employer or landlord to hit a woman than those whoindicated that it was never acceptable for a husband to hit his wife.More men respondents than women respondents indicated it was it wasnever acceptable for an employer or landlord to hit a woman; andwoman-only households have the lowest proportion indicating that itwas never acceptable for an employer or landlord to hit a woman.
3.2. Contributors to disempowerment
We disaggregate pro-WEAI to examine the proportional contribu-tions of each indicator to disempowerment for those respondentsidentified as disempowered (Fig. 4). Across all four VCs, lack of respectamong household members and attitudes about GBV are large con-tributors to disempowerment for both women and men (Fig. 4). Lack ofownership of land and other assets, access to and decisions on credit,and input in livelihood decisions were the smallest contributors todisempowerment for women and men across all four VCs (Fig. 4). Formore details, Table 2 shows the percentage of respondents achievingadequacy in each of these indicators.
Other large contributors to disempowerment varied by VC andgender. In the abaca and seaweed VCs, lack of work balance was a largecontributor for women but less so for men. In the swine VC, lack ofcontrol over use of income was a large contributor to disempowermentfor both women and men. In the coconut VC, inadequate control overuse of income was a large contributor to disempowerment for women;lack of group membership and membership in influential groups werethe largest contributors for men. In the coconut and abaca VCs, lack ofgroup membership and membership in influential groups were muchlarger contributors to disempowerment for men than women.
3.3. Individual regressions: Correlates of empowerment
Regressions on individuals’ empowerment status are estimatedusing logistic regression (Models 1–2 in Table 3) and on empowermentscores (Models 3–4) using fractional regression. Table 4 examines thecorrelates of the additional VC outcomes related to autonomy in wagework and work conditions, and attitudes about GBV perpetrated by theemployer or landlord, all of which are count data estimated usingPoisson regression. Regressions on input in decisions and control overthe use of outputs and income, both binary variables estimated usinglogistic regression, are found in Table 5.12
Women's and men's empowerment is positively associated witheducation, age, being married, access to extension services, and access
10 For more on pro-WEAI and other adaptations of the WEAI methodologysince its launch in 2012, see Malapit et al. (2019a) and Meinzen-Dick et al.(2019).
11 The qualitative interviews were carried out only among coconut and sea-weed VC actors due to resource constraints. See Appendix F for qualitativethemes and illustrative questions.
12 Regression results in Tables 3–6 have slightly fewer number of observationsdue to missing values in some variables. In Table 4, the sample was restricted tothose individuals who reported and participated in wage work, resulting in asmaller number of observations under autonomy in wage work and in workconditions. Pooled regression results are reported in Malapit et al. (2019b).
H. Malapit, et al. Journal of Rural Studies xxx (xxxx) xxx–xxx
6

to community programs and projects (Table 3), but some correlates ofmen's and women's empowerment differ. Both women and men are lessempowered in the coconut VC, and most empowered in the seaweedVC. No statistical difference exists between men's and women's em-powerment scores and between women in dual-adult households (DHH)and in woman-only households (WOH). Older women have higherempowerment scores, while those engaged mainly in processing havelower empowerment scores compared to those engaged mainly inproduction or trading. The low scores of women processors may arisefrom their engagement in low-value and time-demanding processingactivities in coconut and abaca and the poor work conditions in abat-toirs. Women who are in the richest quintile have higher likelihood ofbeing empowered than those in other asset groups. Men who are la-borers or wage earners are less empowered than those who are not,likely due to preferences for having one's own business, which mayinvolve greater autonomy than wage work.
Community programs and projects are common in the study sites,and at least three-quarters of women and men reported accessing andparticipating in community programs or projects. Access is weakestamong swine VC participants (50% of men and 61% of women parti-cipating), and highest in seaweed VCs (more than 90% of women andmen participating), probably due to the role of community projects inallocating seaweed plots and other resources. A much greater propor-tion of seaweed VC participants report access to other programs, in-cluding on agricultural inputs and agricultural livelihoods trainingprograms compared to other VCs. The main program is the conditionalcash transfer program (Pantawid Pamilyang Pilipino Program, 4 P), towhich the majority of VC participants, except those in swine VC, haveaccess. Greater access to community programs is associated withgreater empowerment among women, but not for men.
We see strong positive association of access to extension serviceswith both women's and men's empowerment, owing to the current weakaccess to extension services, with only about 26–44 percent of womenand men reporting access to extension services, which is lowest in co-conut VCs. Women generally have weaker access to extension in abacaand coconut VCs, but generally more equal access in seaweed and swineVCs. However, interviews with men and women seaweed VC partici-pants reveal limited training in seaweed production or processing.Because farming is inherently risky, early warning systems and weatherforecasts are particularly useful according to interviewees. New prac-tices to cope with extreme weather events, such as submerging seaweeddeeper into the water before the start of typhoon, will help save thefarms, according to some respondents.
Education and extension services are more strongly associated withmen's empowerment compared to women's. One level higher in edu-cation is associated with a 2 percent higher likelihood of men beingempowered and a 13 percent increase their empowerment score; andassociated with a 1 percent higher likelihood of women being em-powered and a 9 percent increase in their empowerment score.Although earlier studies in similar contexts (e.g., Samarakoon andParinduri, 2015 for Indonesia) point to the positive association betweeneducation and women's empowerment, in our study setting, the weaker
Table 2Percent of respondents adequate in each empowerment indicator by VC, gender, and household type.Source: Authors' calculations. Note: DHH: Dual-adult household; WOH: woman-only household. Empowerment (based on pro-WEAI) is defined as adequacy in atleast 75 percent of pro-WEAI indicators (see details and robustness check of different cut-offs in Malapit et al., 2019a). Empowerment score is the proportion of pro-WEAI indicators in which an individual is adequate. Pro-WEAI indicators are designated with an asterisk (*), defined in Table 1.
IndicatorAbaca Coconut Seaweed Swine
DHH WOH DHH WOH DHH WOH DHH WOH
M W M W M W M W
Empowered 34 32 29 23 29 13 47 47 36 29 27 36Empowerment score (average) 0.67 0.68 0.67 0.64 0.64 0.63 0.72 0.73 0.70 0.67 0.66 0.70Pro-WEAI indicatorsIntrinsic agency
Autonomy in income* 45 58 55 53 56 52 23 32 50 49 61 73Attitudes about IPV* 48 37 33 49 43 43 59 56 56 50 37 45Respect among household members* 40 42 34 38 41 10 62 62 14 37 39 35
Instrumental agencyInput in productive decisions* 95 89 94 96 84 91 91 90 97 88 73 86Ownership of land and other assets* 94 94 92 96 96 95 99 99 97 97 99 100Access to and decisions on credit* 94 97 99 92 97 96 92 97 99 97 99 95Control over use of income and outputs* 65 60 67 60 43 53 71 81 84 43 43 44Work balance* 68 43 44 70 49 47 58 38 29 67 55 66
Collective agencyGroup membership* 61 81 74 42 65 64 82 92 86 72 80 79Membership in influential groups* 57 79 69 37 63 60 77 88 83 65 76 76
VC-related indicatorsAutonomy in wage work 72 87 88 83 89 90 78 86 82 73 86 91Autonomy in working conditions 72 88 90 78 88 92 80 85 79 78 89 95Attitudes about use of GBV by employer/landlord 83 77 67 83 78 69 88 82 84 79 74 74Input in decisions about main VC 99 98 99 98 96 98 99 99 100 98 94 99Control over use income and outputs from main VC 89 90 95 90 75 85 95 98 100 82 92 87
Fig. 4. Contributors to disempowerment of women and men by VC.Source: Authors' calculations.
H. Malapit, et al. Journal of Rural Studies xxx (xxxx) xxx–xxx
7
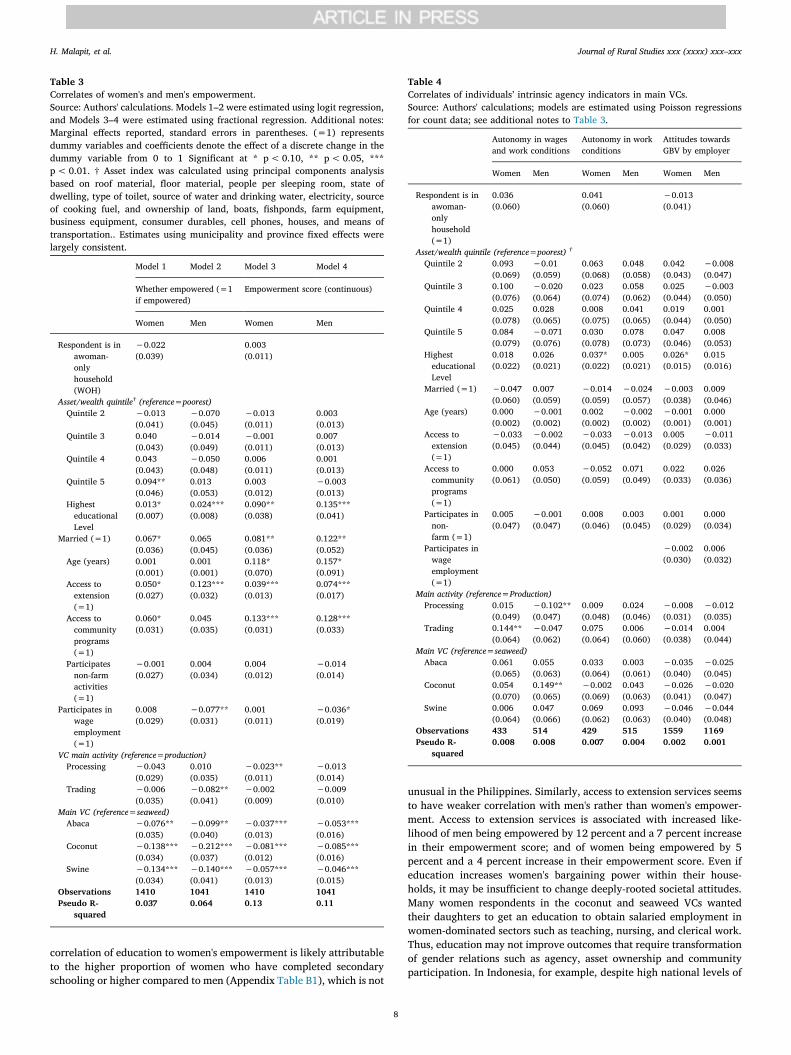
correlation of education to women's empowerment is likely attributableto the higher proportion of women who have completed secondaryschooling or higher compared to men (Appendix Table B1), which is not
unusual in the Philippines. Similarly, access to extension services seemsto have weaker correlation with men's rather than women's empower-ment. Access to extension services is associated with increased like-lihood of men being empowered by 12 percent and a 7 percent increasein their empowerment score; and of women being empowered by 5percent and a 4 percent increase in their empowerment score. Even ifeducation increases women's bargaining power within their house-holds, it may be insufficient to change deeply-rooted societal attitudes.Many women respondents in the coconut and seaweed VCs wantedtheir daughters to get an education to obtain salaried employment inwomen-dominated sectors such as teaching, nursing, and clerical work.Thus, education may not improve outcomes that require transformationof gender relations such as agency, asset ownership and communityparticipation. In Indonesia, for example, despite high national levels of
Table 3Correlates of women's and men's empowerment.Source: Authors' calculations. Models 1–2 were estimated using logit regression,and Models 3–4 were estimated using fractional regression. Additional notes:Marginal effects reported, standard errors in parentheses. (=1) representsdummy variables and coefficients denote the effect of a discrete change in thedummy variable from 0 to 1 Significant at * p<0.10, ** p<0.05, ***p< 0.01. † Asset index was calculated using principal components analysisbased on roof material, floor material, people per sleeping room, state ofdwelling, type of toilet, source of water and drinking water, electricity, sourceof cooking fuel, and ownership of land, boats, fishponds, farm equipment,business equipment, consumer durables, cell phones, houses, and means oftransportation.. Estimates using municipality and province fixed effects werelargely consistent.
Model 1 Model 2 Model 3 Model 4
Whether empowered (=1if empowered)
Empowerment score (continuous)
Women Men Women Men
Respondent is inawoman-onlyhousehold(WOH)
−0.022(0.039)
0.003(0.011)
Asset/wealth quintile† (reference=poorest)Quintile 2 −0.013
(0.041)−0.070(0.045)
−0.013(0.011)
0.003(0.013)
Quintile 3 0.040(0.043)
−0.014(0.049)
−0.001(0.011)
0.007(0.013)
Quintile 4 0.043(0.043)
−0.050(0.048)
0.006(0.011)
0.001(0.013)
Quintile 5 0.094**(0.046)
0.013(0.053)
0.003(0.012)
−0.003(0.013)
HighesteducationalLevel
0.013*(0.007)
0.024***(0.008)
0.090**(0.038)
0.135***(0.041)
Married (=1) 0.067*(0.036)
0.065(0.045)
0.081**(0.036)
0.122**(0.052)
Age (years) 0.001(0.001)
0.001(0.001)
0.118*(0.070)
0.157*(0.091)
Access toextension(=1)
0.050*(0.027)
0.123***(0.032)
0.039***(0.013)
0.074***(0.017)
Access tocommunityprograms(=1)
0.060*(0.031)
0.045(0.035)
0.133***(0.031)
0.128***(0.033)
Participatesnon-farmactivities(=1)
−0.001(0.027)
0.004(0.034)
0.004(0.012)
−0.014(0.014)
Participates inwageemployment(=1)
0.008(0.029)
−0.077**(0.031)
0.001(0.011)
−0.036*(0.019)
VC main activity (reference=production)Processing −0.043
(0.029)0.010(0.035)
−0.023**(0.011)
−0.013(0.014)
Trading −0.006(0.035)
−0.082**(0.041)
−0.002(0.009)
−0.009(0.010)
Main VC (reference=seaweed)Abaca −0.076**
(0.035)−0.099**(0.040)
−0.037***(0.013)
−0.053***(0.016)
Coconut −0.138***(0.034)
−0.212***(0.037)
−0.081***(0.012)
−0.085***(0.016)
Swine −0.134***(0.034)
−0.140***(0.041)
−0.057***(0.013)
−0.046***(0.015)
Observations 1410 1041 1410 1041Pseudo R-
squared0.037 0.064 0.13 0.11
Table 4Correlates of individuals’ intrinsic agency indicators in main VCs.Source: Authors' calculations; models are estimated using Poisson regressionsfor count data; see additional notes to Table 3.
Autonomy in wagesand work conditions
Autonomy in workconditions
Attitudes towardsGBV by employer
Women Men Women Men Women Men
Respondent is inawoman-onlyhousehold(=1)
0.036(0.060)
0.041(0.060)
−0.013(0.041)
Asset/wealth quintile (reference=poorest) †
Quintile 2 0.093(0.069)
−0.01(0.059)
0.063(0.068)
0.048(0.058)
0.042(0.043)
−0.008(0.047)
Quintile 3 0.100(0.076)
−0.020(0.064)
0.023(0.074)
0.058(0.062)
0.025(0.044)
−0.003(0.050)
Quintile 4 0.025(0.078)
0.028(0.065)
0.008(0.075)
0.041(0.065)
0.019(0.044)
0.001(0.050)
Quintile 5 0.084(0.079)
−0.071(0.076)
0.030(0.078)
0.078(0.073)
0.047(0.046)
0.008(0.053)
HighesteducationalLevel
0.018(0.022)
0.026(0.021)
0.037*(0.022)
0.005(0.021)
0.026*(0.015)
0.015(0.016)
Married (=1) −0.047(0.060)
0.007(0.059)
−0.014(0.059)
−0.024(0.057)
−0.003(0.038)
0.009(0.046)
Age (years) 0.000(0.002)
−0.001(0.002)
0.002(0.002)
−0.002(0.002)
−0.001(0.001)
0.000(0.001)
Access toextension(=1)
−0.033(0.045)
−0.002(0.044)
−0.033(0.045)
−0.013(0.042)
0.005(0.029)
−0.011(0.033)
Access tocommunityprograms(=1)
0.000(0.061)
0.053(0.050)
−0.052(0.059)
0.071(0.049)
0.022(0.033)
0.026(0.036)
Participates innon-farm (=1)
0.005(0.047)
−0.001(0.047)
0.008(0.046)
0.003(0.045)
0.001(0.029)
0.000(0.034)
Participates inwageemployment(=1)
−0.002(0.030)
0.006(0.032)
Main activity (reference=Production)Processing 0.015
(0.049)−0.102**(0.047)
0.009(0.048)
0.024(0.046)
−0.008(0.031)
−0.012(0.035)
Trading 0.144**(0.064)
−0.047(0.062)
0.075(0.064)
0.006(0.060)
−0.014(0.038)
0.004(0.044)
Main VC (reference=seaweed)Abaca 0.061
(0.065)0.055(0.063)
0.033(0.064)
0.003(0.061)
−0.035(0.040)
−0.025(0.045)
Coconut 0.054(0.070)
0.149**(0.065)
−0.002(0.069)
0.043(0.063)
−0.026(0.041)
−0.020(0.047)
Swine 0.006(0.064)
0.047(0.066)
0.069(0.062)
0.093(0.063)
−0.046(0.040)
−0.044(0.048)
Observations 433 514 429 515 1559 1169Pseudo R-
squared0.008 0.008 0.007 0.004 0.002 0.001
H. Malapit, et al. Journal of Rural Studies xxx (xxxx) xxx–xxx
8

girls' education and literacy, many areas are still governed by dis-criminatory local gender norms that give husbands the right to limitwomen's ability to work outside the home and restrict inheritancerights; GBV also persists (Samarakoon and Parinduri, 2015).
Factors associated with variations in the empowerment indicatorsdiffer across VCs and nodes along VCs. Men have generally lower au-tonomy in wage work and work conditions (Table 4); but are moreempowered in terms of greater inputs in decisions about the main VCand stronger control over outputs than women (Table 5). There is nodifference between women and men in terms of adequacy related toattitudes about GBV perpetuated by an employer and control over in-come (Table 4). Higher education for women is correlated with higherautonomy in work conditions and lower disempowerment due to atti-tudes about GBV perpetuated by an employer (Table 5).
VC-specific indicators for instrumental agency generally show highlevels of adequate achievements, however, a greater proportion ofwomen are disempowered in control over output and income in thecoconut VC. Men and women in woman-only households are moreempowered in terms of input in decisions about the main VC thanwomen in dual-adult households (Tables 4 and 5). Women participantsin the swine VC have fewer inputs in decisions about swine VC thanwomen in other VCs. Asset/wealth levels are also associated withgreater inputs into decisions about the main VC and control over outputand incomes by women (Table 5).
Men's control over use of output and income is highest in the swine
VC and lowest in the seaweed VC. For women, however, the highestcontrols are in the seaweed VC and the lowest in the coconut VC.Education, age, access to community programs and engagement inprocessing are associated with greater control over use of income bymen, but not by women. Engagement in trading is associated withgreater control over use of income by women, but not by men (Table 5).
3.4. Household level regressions: Correlates of intrahousehold inequality
Table 6 shows that out of 1134 dual adult households, men andwomen are equally empowered in 664 (58.6%), women are more em-powered in 240 (21.2%), and men are more empowered in 230households (20.2%). Multinomial logit regressions allow us to examinethe likelihoods of the man (woman) being more empowered relative tothe excluded category, where they are similarly empowered. Resultsshow that age and education have marginal effects that are small inmagnitude. However, the marginal effects of men's and women's par-ticipation and access to public services and different types of employ-ment often show opposite signs, which suggests offsetting associationsbetween men's and women's access to services and achieving greaterequality. Men's access to extension services increases the likelihood thatthe man is more empowered by 6.5 percent (and lowers the likelihoodthat the woman is more empowered by 9.6 percent), and therefore iscorrelated with greater likelihood of inequality. Women's access toextension services is associated with a 5.4 percent reduced likelihood
Table 5Correlates of individuals’ instrumental agency indicators in main VCs.Source: Authors' calculations; models are estimated using logit regression for binary variables; see additional notes to Table 3.
Input in decisions about main VC Control over use of output from main VC Control over use of income from main VC
Women Men Women Men Women Men
Respondent is in awoman-only household (=1)
0.023***(0.006)
0.025*(0.014)
0.019(0.018)
Asset/wealth quintile (reference=poorest) †
Quintile 2 0.002(0.009)
0.002(0.007)
0.008(0.014)
0.002(0.015)
0.009(0.017)
0.019(0.024)
Quintile 3 −0.003(0.010)
0.007(0.007)
0.025*(0.013)
−0.002(0.016)
0.025(0.017)
0.005(0.026)
Quintile 4 0.015*(0.008)
0.013**(0.006)
0.033***(0.013)
0.02(0.013)
0.041***(0.016)
0.019(0.026)
Quintile 5 0.001(0.011)
0.011(0.016)
0.001(0.017)
0.013(0.020)
0.014(0.028)
Highest educationalLevel
0.002(0.004)
0.003(0.004)
0.006(0.006)
0.008(0.006)
−0.001(0.007)
0.019**(0.010)
Married (=1) 0.011(0.011)
−0.004(0.007)
−0.002(0.015)
−0.020*(0.011)
−0.012(0.017)
−0.043**(0.020)
Age (years) 0.0000.000
0.0000.000
0.0000.000
0.0010.000
0.000(0.001)
0.002**(0.001)
Access to extension(=1)
0.008(0.007)
0.000(0.007)
0.010(0.011)
0.018(0.011)
0.011(0.014)
0.010(0.018)
Access to communityprograms (=1)
0.002(0.008)
0.008(0.008)
−0.003(0.012)
0.018(0.013)
0.007(0.016)
0.080***(0.023)
Participates in non-farm (=1)
−0.007(0.008)
−0.001(0.007)
0.001(0.012)
−0.005(0.012)
0.006(0.014)
0.000(0.019)
Participates in wageemployment (=1)
−0.004(0.008)
−0.011(0.008)
−0.005(0.013)
−0.013(0.011)
−0.004(0.015)
−0.001(0.018)
Main activity (reference=Production)Processing −0.006
(0.008)0.005(0.007)
−0.008(0.013)
0.011(0.011)
0.001(0.015)
0.048***(0.018)
Trading 0.010(0.008)
−0.004(0.011)
0.010(0.015)
−0.029(0.019)
0.047***(0.014)
−0.014(0.025)
Main VC (reference=seaweed)Abaca −0.012
(0.015)0.004(0.009)
−0.085***(0.032)
−0.026(0.023)
−0.133***(0.040)
−0.078**(0.036)
Coconut −0.023(0.018)
−0.002(0.012)
−0.117***(0.036)
−0.078**(0.032)
−0.297***(0.050)
−0.084**(0.039)
Swine −0.046**(0.022)
−0.007(0.013)
−0.095***(0.034)
−0.024(0.024)
−0.153***(0.043)
−0.125***(0.041)
Observations 1561 944 1561 1170 1561 1170Pseudo R-squared 0.077 0.084 0.062 0.077 0.113 0.069
H. Malapit, et al. Journal of Rural Studies xxx (xxxx) xxx–xxx
9
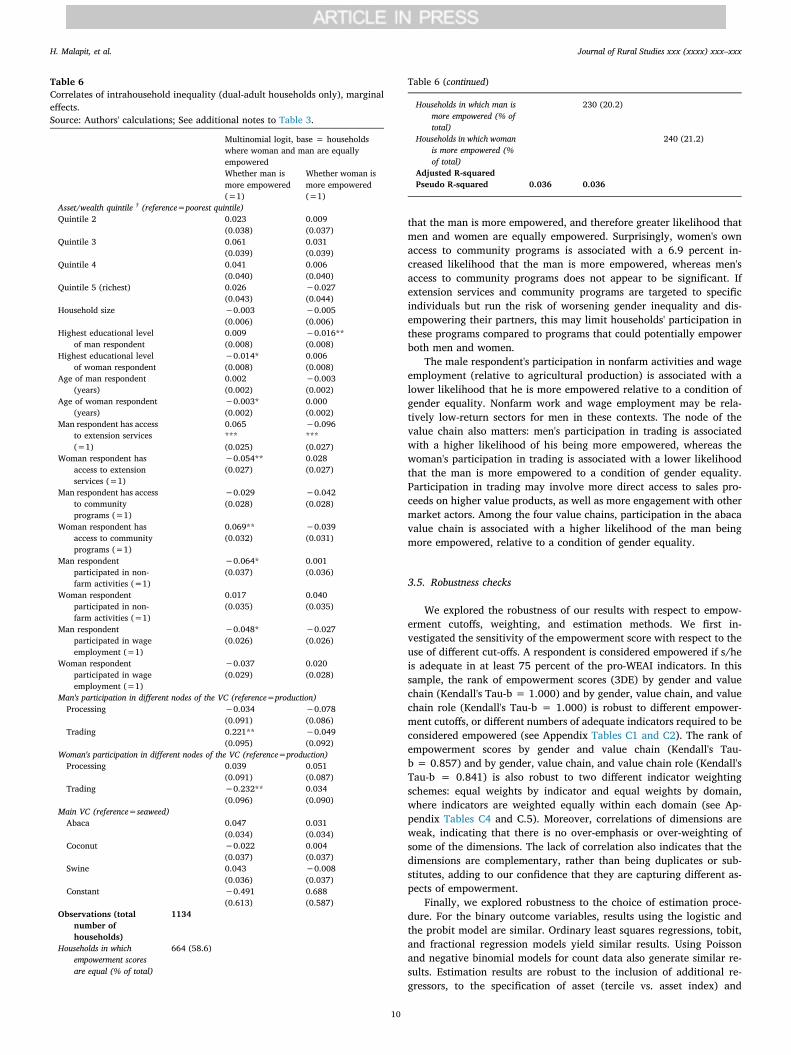
that the man is more empowered, and therefore greater likelihood thatmen and women are equally empowered. Surprisingly, women's ownaccess to community programs is associated with a 6.9 percent in-creased likelihood that the man is more empowered, whereas men'saccess to community programs does not appear to be significant. Ifextension services and community programs are targeted to specificindividuals but run the risk of worsening gender inequality and dis-empowering their partners, this may limit households' participation inthese programs compared to programs that could potentially empowerboth men and women.
The male respondent's participation in nonfarm activities and wageemployment (relative to agricultural production) is associated with alower likelihood that he is more empowered relative to a condition ofgender equality. Nonfarm work and wage employment may be rela-tively low-return sectors for men in these contexts. The node of thevalue chain also matters: men's participation in trading is associatedwith a higher likelihood of his being more empowered, whereas thewoman's participation in trading is associated with a lower likelihoodthat the man is more empowered to a condition of gender equality.Participation in trading may involve more direct access to sales pro-ceeds on higher value products, as well as more engagement with othermarket actors. Among the four value chains, participation in the abacavalue chain is associated with a higher likelihood of the man beingmore empowered, relative to a condition of gender equality.
3.5. Robustness checks
We explored the robustness of our results with respect to empow-erment cutoffs, weighting, and estimation methods. We first in-vestigated the sensitivity of the empowerment score with respect to theuse of different cut-offs. A respondent is considered empowered if s/heis adequate in at least 75 percent of the pro-WEAI indicators. In thissample, the rank of empowerment scores (3DE) by gender and valuechain (Kendall's Tau-b = 1.000) and by gender, value chain, and valuechain role (Kendall's Tau-b = 1.000) is robust to different empower-ment cutoffs, or different numbers of adequate indicators required to beconsidered empowered (see Appendix Tables C1 and C2). The rank ofempowerment scores by gender and value chain (Kendall's Tau-b = 0.857) and by gender, value chain, and value chain role (Kendall'sTau-b = 0.841) is also robust to two different indicator weightingschemes: equal weights by indicator and equal weights by domain,where indicators are weighted equally within each domain (see Ap-pendix Tables C4 and C.5). Moreover, correlations of dimensions areweak, indicating that there is no over-emphasis or over-weighting ofsome of the dimensions. The lack of correlation also indicates that thedimensions are complementary, rather than being duplicates or sub-stitutes, adding to our confidence that they are capturing different as-pects of empowerment.
Finally, we explored robustness to the choice of estimation proce-dure. For the binary outcome variables, results using the logistic andthe probit model are similar. Ordinary least squares regressions, tobit,and fractional regression models yield similar results. Using Poissonand negative binomial models for count data also generate similar re-sults. Estimation results are robust to the inclusion of additional re-gressors, to the specification of asset (tercile vs. asset index) and
Table 6Correlates of intrahousehold inequality (dual-adult households only), marginaleffects.Source: Authors' calculations; See additional notes to Table 3.
Multinomial logit, base = householdswhere woman and man are equallyempoweredWhether man ismore empowered(=1)
Whether woman ismore empowered(=1)
Asset/wealth quintile † (reference=poorest quintile)Quintile 2 0.023
(0.038)0.009(0.037)
Quintile 3 0.061(0.039)
0.031(0.039)
Quintile 4 0.041(0.040)
0.006(0.040)
Quintile 5 (richest) 0.026(0.043)
−0.027(0.044)
Household size −0.003(0.006)
−0.005(0.006)
Highest educational levelof man respondent
0.009(0.008)
−0.016**(0.008)
Highest educational levelof woman respondent
−0.014*(0.008)
0.006(0.008)
Age of man respondent(years)
0.002(0.002)
−0.003(0.002)
Age of woman respondent(years)
−0.003*(0.002)
0.000(0.002)
Man respondent has accessto extension services(=1)
0.065***(0.025)
−0.096***(0.027)
Woman respondent hasaccess to extensionservices (=1)
−0.054**(0.027)
0.028(0.027)
Man respondent has accessto communityprograms (=1)
−0.029(0.028)
−0.042(0.028)
Woman respondent hasaccess to communityprograms (=1)
0.069**(0.032)
−0.039(0.031)
Man respondentparticipated in non-farm activities (=1)
−0.064*(0.037)
0.001(0.036)
Woman respondentparticipated in non-farm activities (=1)
0.017(0.035)
0.040(0.035)
Man respondentparticipated in wageemployment (=1)
−0.048*(0.026)
−0.027(0.026)
Woman respondentparticipated in wageemployment (=1)
−0.037(0.029)
0.020(0.028)
Man's participation in different nodes of the VC (reference=production)Processing −0.034
(0.091)−0.078(0.086)
Trading 0.221**(0.095)
−0.049(0.092)
Woman's participation in different nodes of the VC (reference=production)Processing 0.039
(0.091)0.051(0.087)
Trading −0.232**(0.096)
0.034(0.090)
Main VC (reference=seaweed)Abaca 0.047
(0.034)0.031(0.034)
Coconut −0.022(0.037)
0.004(0.037)
Swine 0.043(0.036)
−0.008(0.037)
Constant −0.491(0.613)
0.688(0.587)
Observations (totalnumber ofhouseholds)
1134
Households in whichempowerment scoresare equal (% of total)
664 (58.6)
Table 6 (continued)
Households in which man ismore empowered (% oftotal)
230 (20.2)
Households in which womanis more empowered (%of total)
240 (21.2)
Adjusted R-squaredPseudo R-squared 0.036 0.036
H. Malapit, et al. Journal of Rural Studies xxx (xxxx) xxx–xxx
10

education variables (categorial vs. continuous variables), and the in-clusion of municipality or province fixed effects. These alternativespecifications yield similar coefficients and did not change the inter-pretation of key variables of interest.
4. Discussion
4.1. How do stereotypes about gender roles influence value chainparticipation and benefits?
Filipino culture is gender-egalitarian in comparison to other Asiannations, confirmed by our quantitative results showing relatively highgender parity and small empowerment gaps. Our qualitative resultshowever suggest that gender stereotypes do influence the division oflabor and time use. For example, while women and men both partici-pate in seaweed production and processing, their activities are closelyassociated with gendered domestic responsibilities, as well as stereo-types about appropriate work for both genders based on perceptionsabout physical capabilities and status. Women are considered moreskilled in tying, and typically tie seaweed strips, divide plants intoseedlings, plant seedlings, and dry seaweed. This work can be scheduledaround domestic work and done near the homestead. Women reportthat they like the work because they can work in groups, talk to co-workers, sit down, and interrupt the work if needed. In contrast, menare described as stronger and “more capable of the harder physicalwork” of diving to attach seaweed lines to stakes. They work offshoreunder a hot sun for the whole workday. Men only tie knots when theyare too old (or too young) to work in a boat. However, both boys andgirls learn to swim and tie knots, so these explanations seem in-adequate. Women and men are also compensated differently for sea-weed work. In general, women are paid “piece work” for tying, whilemen are paid a flat fee for each day. Women earn five to six pesos perline; most tie 40 to 50 lines per day, earning 200 to 250 pesos. Men arepaid a flat rate of 250–300 pesos per day, and typically work shorterdays. The gender stereotypes about appropriate work are buttressed byeconomic factors that favor paying men more.
The coconut VC also exhibits divisions of labor by gender. Men tendthe trees and harvest nuts and tuba (palm wine), while women performpostharvest activities, including drying copra. Some women producersare also micro-entrepreneurs, making and selling handicrafts such asbrooms and jewelry, as well as food and cosmetic products. Fewerwomen than men are positioned at the higher end of the chain inbulking (aggregating) and transporting the copra to larger buyers ordirectly to the processing mills. Although informants say women canperform most tasks in coconut production and processing, the clearpreference for sex-segregated work commonly centers on perceptions ofphysical strength. A woman farmer stated, “I think that all men's workrequires exertion of physical strength. Women do the taking out of driedcoconut meat or slice the meat since that is the easiest job they can do.Women can also open the coconut since it is also easy. Men usually do mostof climbing up the coconut trees. It is very high, women might fall to theground. So, women can collect the nuts after they drop, but the delivery ofthe nuts is left for men since carrying nuts is a heavy work.”
Gender differences in participation, pay, and conditions at differentparts of the VC are often attributed to women's supposedly innatecharacteristics like docility, patience, or physical weakness. Given thatthese stereotypes are often associated with women's being relegated tolower-return activities within the VC, VC analysis should questionbiological explanations of gender differences and investigate why workis not arranged to facilitate women's participation (e.g., by usingtechnology or altering working hours).
4.2. Are some agricultural VCs associated with greater empowerment?
Even in VCs where empowerment is higher, inequities persist.Overall empowerment scores of both women and men, for example, are
highest in the seaweed VC. Our qualitative work found that the seaweedVC provided increased employment and livelihood opportunities. Thesefindings are consistent with Arnold (2008) and recent papers on theimpact of horticulture on employment, women's empowerment, anddevelopment outcomes. Seaweed requires less capital investment andprovides higher returns than other export commodities and otheraquaculture species, so it is potentially a pro-poor, empowering, export-oriented VC (Arnold, 2008).
However, there is variation between sites within the seaweed VC. Innorthern Cebu, labor patterns are relatively equitable and both men andwomen farm seaweed (Arnold, 2008). In other areas of the Visayas,such as Hingotanan (in Bohol), the gendered division of labor in sea-weed is rigid. Although the local government allocates seaweed plotsand some women own seaweed farms, most did not engage in the actualwork of farming. The higher empowerment scores among the women inthe seaweed VC may reflect greater control over where and when theywork; tasks such as preparing string and tying fresh seaweed can occurnear their homes and in groups of family or neighbors. Women workingin seaweed commented that “tying seaweeds allows you to be flexiblewith your working time’.
Some question the seaweed VC's ability to restructure power in-equities where other cash crops have failed (Jain, 2006; Macabuac,2005). Vandergeest et al. (2009) showed that seaweed plot size islinked to preexisting income and social hierarchies that influence accessto plots, land, water, and capital. Nonetheless, entrenched social in-equities are slowly shifting and previously marginalized people can takeadvantage of opportunities to improve their standard of living, mobi-lity, and influence due to increased income from seaweed farming(Arnold, 2008). Income also allows more travel to nearby cities andmarkets, bringing back new ideas and values that influence local powerstructures (Arnold, 2008).
Structural constraints limit the empowerment potential of agri-cultural VCs. For instance, our results show that participation in groupsand associations is high, except in the coconut VC (Table 2). Interviewsrevealed several explanations for the limited participation in associa-tions in the coconut VC. First, association membership may be con-trolled by the political elite within the community. For example, anindividual associated with the opposing political party may not begranted membership in a coconut farmers' association. Also, coconutfarms are almost always part of an integrated livelihood strategy in-volving other types of agriculture, petty trade, and fishing. An in-dividual cannot join both the farmer and fisher associations, so a pro-ducer must choose to identify as one or the other. Members must alsopay monthly dues and attend meetings, requirements that could chal-lenge those with limited income or time. Thus, people's hesitation tojoin formal organizations, especially in the coconut VC, may be rationalgiven the monetary and transaction costs of participation. Distrust incooperatives stems from issues of clientelism, elite capture, and orga-nizational failures in the past, so informal groups and social networksmay be a better way to improve collective power.
Lack of autonomy in income was a large contributor to dis-empowerment in all four VCs; this was more important for men thanwomen. Lack of autonomy in income can reflect dissatisfaction towardsthe VC or aspirations for other livelihoods. In the qualitative interviews,several respondents in the seaweed and coconut VCs aspired to work ata higher node in the VC such as trading, but these jobs require capitaland resources. Many coconut producers aspired to having their ownbusiness, tailoring, planting ginger or other high-value crops (oftenintercropping with coconut palms), or raising pigs. Some women in theseaweed and coconut VCs aspired to put up their own neighborhood(sari-sari) store. These stated aspirations reflect the limits of purelyagricultural VCs in improving welfare. Similarly, most householdsaugment income and cope with risk by diversifying their livelihoodsbeyond agriculture, suggesting that nonagricultural jobs may be morelucrative or stable.
H. Malapit, et al. Journal of Rural Studies xxx (xxxx) xxx–xxx
11

4.3. Are higher VC nodes associated with greater empowerment?
Both qualitative and quantitative results suggest that individualsengaged in higher VC nodes, such as trading, express a stronger sense ofempowerment. Women who market their own products report makingtheir own decisions about how much to sell and where to sell it. Womentraders were said to hire or manage others, rather than perform thework themselves. A woman coconut trader noted, “The women beingadmired in the community can stand on her own decision. I manage mybusiness, not just to earn profit but also [to] help my customers if they haveproblems.” However, the quantitative results suggest that this is true foronly some VCs. Women coconut traders, men abaca processors, andmen and women swine traders were more empowered than producersin those VCs, while coconut and swine processors and seaweed andabaca traders were less empowered than producers in those VCs(Appendix Figure B2). Ahmed et al. (2018) found similar results in VCsin Bangladesh, where producers are generally more empowered thanentrepreneurs and wage earners (Ahmed et al., 2018) However, thismay be related to the resources that producers command, compared toentrepreneurs and wage earners—in Bangladesh, producers may havemore secure access to land and other productive resources, whereaswage work is a more uncertain undertaking.
Many development researchers and practitioners argue that en-trepreneurship is key to empowering poor rural women, but it is not foreveryone. One must consider the type and scale of the enterprise, thelevel of startup and scale-up capital needed, and both men's and wo-men's perceptions around the appropriateness of women for the work interms of mobility, interaction with strangers, and alignment with do-mestic responsibilities. Concerns around the perceived or real risk ofgender-based violence may also limit women's interest in pursuingentrepreneurship.
Inadequate autonomy indicates that women may have few optionson product type, location, and enterprise size. Most traders in oursample are engaged in small-scale retail, which typically involves smallmargins and is not very lucrative. As we sampled processors, traders,and marketers in the same geographic areas as producers, we likelycaptured the lower bound of empowerment for these VC roles.Entrepreneurship often only pays off as micro-entrepreneurs becomesmall or medium enterprises and can hire employees and retain moreprofit; larger enterprises may be located closer to urban areas. In oursample, most women engaged in the VC primarily to augment familyincome while also fulfilling domestic responsibilities; some Filipinoauthors have called this a double burden (Liwag et al., 1998). Workbalance (or lack thereof) is most disempowering among women pro-cessors and traders in abaca, coconut and seaweed VCs (AppendixFigure B2), suggesting that moving up along the nodes of the VC mayincrease women's workload disproportionately relative to the addi-tional market and income access they derive. Most women did not as-pire to move up the VC; for the few who did, lack of capital restrictedthis goal, implying much needed support for both capital, facilitiationand skills development support for women agri-entrepreneurship, be-yond micro-credit.
Our results suggest that efforts to increase women's involvement inhigher nodes of the agricultural VC with potential for high returns maynot automatically be empowering. Most households augment incomeand mitigate risk by diversifying their livelihoods, suggesting that non-agricultural jobs may be more lucrative. Interventions should aim toreduce time burden, especially for women, and explore opportunitiesfor livelihood diversification, especially in work that allows for a morestable income.
5. Conclusions
Women's participation and empowerment in VCs are goals thatconcern many development organizations but limited systematic andrigorous empirical data exists to measure and track empowerment
across VCs and contexts. We use quantitative and qualitative methodsto measure women's and men's empowerment and intrahouseholdparity in four VCs in the Philippines. While the Philippines exhibitsgreater gender equality compared to other neighboring countries andglobally (WEF, 2019), gender norms disempower both women and menand underlie inequities within households and across all four VCs. Re-spect among household members, attitudes about GBV, and autonomyin income—all measures of intrinsic agency—are the top sources ofdisempowerment for both women and men across VCs. Stratifying byVC, we found that both overall empowerment and some of the mostimportant areas of disempowerment vary between households engagedin different VCs, even in the same geographical area. Work balance,control over use of income, and group membership—all measures ofinstrumental agency—were the second most important contributors todisempowerment but varied in magnitude by VC, suggesting that in-terventions intended to empower women should be tailored by VC.
Some of the same gender issues exist across VCs, highlighting theneed to address deeply-rooted, structural gender and social norms thatcut across VCs and locations. One strategy is to increase genderawareness in communities, targeting both women and men.Incorporating gender awareness in schools, starting in primary school,may prove useful. Recent studies of behavior change communicationcombined with transfers show that these strategies can change behaviorand reduce physical violence (Roy et al., 2018). Social networks canalso play a role in promoting collective power and changing behavioragainst GBV and stereotyped gender roles across different VCs.
At the same time, program designers and policymakers must bemindful of unintended consequences of interventions. Our findings thataccess to extension services and community programs may have off-setting effects on men's and women's empowerment suggests that suchprograms that attempt to reach or benefit only one household member,without possibly taking into account intrahousehold dynamics, mayend up disempowering other household members. This may create re-sistance to these types of programs. VC approaches that consider theentire household, and the different roles and responsibilities of men andwomen within that household, may be more effective both in increasingparticipation in the target value chain as well as changing gender normsthat limit the ability to benefit from participation.
This study shows how researchers and practitioners can measure,compare and identify sources of disempowerment of women and men inspecific VCs and find ways to address them that are targeted specificallyto each VC. For future work, we recommend complementing the mea-sures of agency used in this study with indicators of achievements andbenefits from VCs by women and men, disaggregated by their role indifferent types of VCs, the distribution of incomes and profits derivedfrom their participation and by wealth/asset groups. This can provide arich gendered VC analysis that can link resources, agency andachievements together and how they contribute to empowerment anddevelopment, to inform the design and implementation of gender-transformative VC policies and interventions.
CRediT authorship contribution statement
Hazel Malapit: Conceptualization, Methodology, Investigation,Writing - original draft, Writing - review & editing, Supervision, Projectadministration, Funding acquisition. Catherine Ragasa:Conceptualization, Methodology, Formal analysis, Writing - originaldraft, Writing - review & editing. Elena M. Martinez: Software,Validation, Formal analysis, Data curation, Writing - original draft,Writing - review & editing, Visualization. Deborah Rubin:Conceptualization, Methodology, Investigation, Writing - original draft,Writing - review & editing. Greg Seymour: Conceptualization,Methodology, Writing - review & editing. Agnes Quisumbing:Conceptualization, Methodology, Investigation, Writing - original draft,Writing - review & editing, Supervision, Funding acquisition.
H. Malapit, et al. Journal of Rural Studies xxx (xxxx) xxx–xxx
12

Declaration of competing interest
The authors declare that they have no conflicts of interest.
Acknowledgements
This work was undertaken as part of the Gender, Agriculture, andAssets Project Phase Two (GAAP2), the CGIAR Research Program onAgriculture for Nutrition and Health (A4NH), and the CGIAR ResearchProgram on Policies, Institutions, and Markets (PIM). Funding supportfor this study was provided by the Millennium Challenge Corporation(MCC) [Grant number: MCC-16-GRA-0007], Bill & Melinda GatesFoundation (BMGF) [Grant number: OPP1125297], and A4NH. Thiswork would not be possible without the collaboration of the PhilippinesCompact Development Team (CDT), led by Josef Yap, who providedhelpful comments at various stages of this research project. Celia Reyesand Lourdes Turiano from the CDT provided invaluable inputs in thedevelopment and piloting of the survey instrument. We would like tothank our field collaborators, Alan Feranil and his team at theUniversity of San Carlos-Office of Population Studies who collected thequantitative and qualitative data for the Visayas study sites, andPrudenciano Gordoncillo and his team at the University of thePhilippines, Los Baños, who collected the quantitative data in the Bicolstudy sites. We also thank Erniel Barrios for providing sampling gui-dance, John Eustaquio for CAPI support, and Crossley Pinkstaff forproject coordination, CAPI programming, and research assistanceduring the early stages of this study. The opinions expressed here be-long to the authors, and do not necessarily reflect those of A4NH,BMGF, CDT, CGIAR, IFPRI, or MCC.
Appendix A. Supplementary data
Supplementary data to this article can be found online at https://doi.org/10.1016/j.jrurstud.2020.04.003.
References
Ahmed, A., Malapit, H., Pereira, A., Quisumbing, A., Rubin, D., Ghostlaw, J., Haque, MdL., Hossain, N.Z., Tauseef, S., 2018. “Tracking Empowerment along the Value Chain:Testing a Modified WEAI in the Feed the Future Zone of Influence in Bangladesh’”Dhaka, Bangladesh and. International Food Policy Research Institute (IFPRI),Washington, DC.
Akter, S., Rutsaert, P., Luis, J., Htwe, N.M., San, S.S., Raharjo, B., Pustika, A., 2017.Women's empowerment and gender equity in agriculture: a different perspectivefrom Southeast Asia. Food Pol. 69, 270–279. https://doi.org/10.1016/j.foodpol.2017.05.003.
Arndt, C., Benfica, R., Thurlow, J., 2011. Gender implications of biofuels expansion inAfrica: the case of Mozambique. World Dev. https://doi.org/10.1016/j.worlddev.2011.02.012.
Arnold, S., 2008. Seaweed, Power, and Markets: A Political Ecology of the Caluya Islands,Philippines. York University.
Ashby, J., Hartl, M., Lambrou, Y., Larson, G., Lubbock, A., Pehu, E., Ragasa, C., 2009.Investing in Women as Drivers of Agricultural Growth. (Washington, D.C).
Atteraya, M.S., Gnawali, S., Palley, E., 2016. Women's participation in self-help groups asa pathway to women's empowerment: a case of Nepal. Int. J. Soc. Welfare 25,321–330. https://doi.org/10.1111/ijsw.12212.
Bain, C., 2010. Structuring the Flexible and Feminized Labor Market: GlobalGAPStandards for Agricultural Labor in Chile. https://doi.org/10.1163/_afco_asc_2291.Source: Signs.
Barrientos, S., Dolan, C., Tallontire, A., 2003. A gendered value chain approach to codesof conduct in african horticulture. World Dev. 31, 1511–1526. https://doi.org/10.1016/S0305-750X(03)00110-4.
Briones, R.M., 2019. The wage gap between male and female agricultural workers. In:Outside Looking in: Gendered Perspectives in Work and Education. PhilippineInstitute for Development Studies (PIDS), Quezon City, Philippines, pp. 109–136.
Department of Agriculture, 2013. Abaca value chain analysis: region V - Bicol region.(Quezon City).
Dolan, C., Humphrey, J., 2000. Governance and trade in fresh vegetables: the impact ofUK supermarkets on the african horticulture industry. J. Dev. Stud. 37, 147–176.https://doi.org/10.1080/713600072.
Elmhirst, R., Siscawati, M., Basnett, B.S., Ekowati, D., 2017. Gender and generation inengagements with oil palm in East Kalimantan, Indonesia: insights from feministpolitical ecology. J. Peasant Stud. 44, 1135–1157. https://doi.org/10.1080/03066150.2017.1337002.
Forsythe, L., Posthumus, H., Martin, A., 2016. A crop of one's own? Women's experiencesof cassava commercialization in Nigeria and Malawi. J. Gender, Agric. Food Secur 1,110–128.
Getahun, T.D., Villanger, E., 2018. Labour-intensive jobs for women and development:intra-household welfare effects and its transmission channels. J. Dev. Stud. 54,1232–1252. https://doi.org/10.1080/00220388.2017.1327661.
Handschuch, C., Wollni, M., 2016. Traditional food crop marketing in sub-saharan Africa:does gender matter? J. Dev. Stud. 52, 343–359. https://doi.org/10.1080/00220388.2015.1068289.
Jain, S., 2006. The Seaweed Industry: Exploring an Alternative to Poverty. Department ofTrade and Industry, Philippines.
Johnson, N.L., Kovarik, C., Meinzen-Dick, R., Njuki, J., Quisumbing, A., 2016. Gender,assets, and agricultural development: lessons from eight projects. World Dev. 83.https://doi.org/10.1016/j.worlddev.2016.01.009.
Kabeer, N., 1999. Resources, agency, achievements: reflections on the measurement ofwomen's empowerment. Dev. Change 30, 435–464. https://doi.org/10.1111/1467-7660.00125.
Liwag, M.E.C.D., De la Cruz, A.S., Macapagal, M.E., 1998. How we raise our daughtersand sons: childrearing and gender socialization in the Philippines. Philipp. J. Psychol.31, 1–46.
Lyon, S., Mutersbaugh, T., Worthen, H., 2017. The triple burden: the impact of timepoverty on women's participation in coffee producer organizational governance inMexico. Agric. Hum. Val. https://doi.org/10.1007/s10460-016-9716-1.
Macabuac, M., 2005. After the Aquaculture Bust: Impacts of the Globalized Food Chain onPoor Philippine Fishing Households. University of Virginia.
Maertens, M., Colen, L., Swinnen, J.F.M., 2011. Globalisation and poverty in Senegal: aworst case scenario? Eur. Rev. Agric. Econ. 38, 31–54. https://doi.org/10.1093/erae/jbq053.
Maertens, M., Verhofstadt, E., 2013. Horticultural exports, female wage employment andprimary school enrolment: theory and evidence from Senegal. Food Pol. 43, 118–131.https://doi.org/10.1016/J.FOODPOL.2013.07.006.
Malapit, H., Quisumbing, A., Meinzen-Dick, R., Seymour, G., Martinez, E.M., Heckert, J.,Rubin, D., Vaz, A., Yount, K.M., Gender, Agriculture, and Assets Phase 2 (GAAP2)study team, 2019. Development of the project-level women’s empowerment inagriculture index (pro-WEAI). World Dev. 122, 675–692.
Malapit, H., Ragasa, C., Martinez, E.M., Rubin, D., Seymour, G., Quisumbing, A.R., 2019.Empowerment in Agricultural Value Chains: Mixed Methods Evidence from thePhilippines. International Food Policy Research Institute (IFPRI), Washington, DCIFPRI Discussion Paper 1881.
Mayoux, L., Mackie, G., 2009. The Strongest Link: A Practical Guide in MainstreamingGender Analysis in Value Chain Development. International Labour Organization,Geneva.
Meinzen-Dick, R.S., Quisumbing, A.R., Behrman, J.A., Biermayr-Jenzano, P., Wilde, V.,Noordeloos, M., Ragasa, C., Beintema, N.M., 2011. Engendering AgriculturalResearch, Development and Extension. International Food Policy Research Institute,Washington, DC.
Meinzen-Dick, R., Rubin, D., Elias, M., Mulema, A.A., Myers, E., 2019. Women'sEmpowerment in Agriculture: Lessons from Qualitative Research. IFPRI DiscussionPaper Series 01797, Washington, DC.
Minten, B., Randrianarison, L., Swinnen, J.F.M., 2009. Global retail chains and poorfarmers: evidence from Madagascar. World Dev. 37, 1728–1741. https://doi.org/10.1016/J.WORLDDEV.2008.08.024.
PSA, 2019. Gender-based Indicators of Labor and Employment. (Quezon City,Philippines).
PSA, 2019. Trends in Agricultural Wages 2016-2018. Quezon City, Philippines.PSA, 2016. Selected Statistics on Agriculture 2016. Quezon City.PSA, 2012. Census of Agriculture and Fisheries.Quisumbing, A.R., Rubin, D., Manfre, C., Waithanji, E., van den Bold, M., Olney, D.,
Johnson, N., Meinzen-Dick, R., 2015. Gender, assets, and market-oriented agri-culture: learning from high-value crop and livestock projects in Africa and Asia.Agric. Hum. Val. 32, 705–725. https://doi.org/10.1007/s10460-015-9587-x.
Raworth, K., Kidder, T., 2009. Mimicking “Lean” in Global Value Chains: It's the WorkersWho Get Leaned on. Front. Commod. Chain Res. Stanford Univ. Press, Stanford, CAChronic ischaemic mitral regurgitation. Current treatment results and new me-chanism-based surgical approaches☆.
Riisgaard, L., Bolwig, S., Matose, F., Ponte, S., Du Toit, A., Halberg, N., 2008. A strategicframework and toolbox for action reserach with small producers in value chains.Regulation.
Riisgaard, L., Bolwig, S., Ponte, S., du Toit, A., Halberg, N., Matose, F., 2010. Integratingpoverty and environmental concerns into value-chain analysis: a strategic frameworkand practical guide. Dev. Pol. Rev. https://doi.org/10.1111/j.1467-7679.2010.00481.x.
Roy, S., Hidrobo, M., Hoddinott, J., Ahmed, A., 2018. Transfers, behavior change com-munication, and intimate partner violence: post-program evidence from ruralBangladesh. Rev. Econ. Stat. 1–45. https://doi.org/10.1162/rest_a_00791.
Rubin, D., Boonabaana, B., Manfre, C., 2019. Building an inclusive agriculture:strengthening gender equality in agricultural value chains. In: Quisumbing, A.,Meinzen-Dick, R., Njuki, J. (Eds.), Annual Trends and Outlook Report: GenderEquality in Rural Africa: from Commitments to Outcomes. International Food PolicyResearch Institute (IFPRI), Washington D.C, Washington, D.C., pp. 83–96. https://doi.org/10.2499/9780896293649. 2019.
Rubin, D., Manfre, C., Barrett, K.N., 2009. Promoting Gender Equitable Opportunities inAgricultural Value Chains: A Handbook. (Washington, DC).
Said-Allsopp, M., Tallontire, A., 2015. Pathways to empowerment?: dynamics of women'sparticipation in Global Value Chains. J. Clean. Prod. 107, 114–121. https://doi.org/10.1016/J.JCLEPRO.2014.03.089.
H. Malapit, et al. Journal of Rural Studies xxx (xxxx) xxx–xxx
13

Samarakoon, S., Parinduri, R.A., 2015. Does education empower women? Evidence fromIndonesia. World Dev. 66, 428–442. https://doi.org/10.1016/j.worlddev.2014.09.002.
Schumacher, K.P., 2014. Gender Relations in Global Agri-Food Value Chains - A Review.https://doi.org/10.12854/erde-145-10. Erde.
Senders, A., Lentink, A., Van der Schaeghe, M., Terillion, J., Snelders, R., 2012. Gender invalue chains: practical Toolkit to integrate a gender perspective in agricultural valuechain development. Agri-Profocus.
Shackleton, S., Paumgarten, F., Kassa, H., Husselman, M., Zida, M., 2011. Opportunitiesfor enhancing poor women's socioeconomic empowerment in the value chains ofthree African non-timber forest products (NTFPs). Int. For. Rev. https://doi.org/10.1505/146554811797406642.
Valientes, R., 2015. Male-female wage-gap decomposition in agriculture-based
employment in the Philippines. J. Econ. Manag. Agric. Dev. 1, 45–62.Van den Broeck, G., Van Hoyweghen, K., Maertens, M., 2018. Horticultural exports and
food security in Senegal. Glob. Food Sec. 17, 162–171. https://doi.org/10.1016/J.GFS.2017.12.002.
Vandergeest, P., Flaherty, M., Miller, P., 2009. A political ecology of shrimp aquaculturein Thailand1. Rural Sociol 64, 573–596. https://doi.org/10.1111/j.1549-0831.1999.tb00379.x.
WEF, 2019. Global Gender Gap Report 2020. World Economic Forum (WEF), Geneva,Switzerland. https://doi.org/10.1002/9781119085621.wbefs350.
World Bank, 2018. Philippines Economic Update: Investing in the Future (No. April2018). (Washington, D.C., USA).
World Bank, 2016. Philippines Economic Update: Outperforming the Region andManaging the Transition.
H. Malapit, et al. Journal of Rural Studies xxx (xxxx) xxx–xxx
14