Embed Size (px)
DESCRIPTION
A “snapshot” of Grand Rapids’ entrepreneurial community compared to similar benchmark U.S. cities, focused on the four areas of culture, capital, climate and talent.
Citation preview

Study of the Entrepreneurship Climate in West Michigan
Commissioned by the Seidman College of Businessand the Richard M. and Helen DeVos Center for Entrepreneurship & Innovation
1
Entrepreneurial companies are the driving force in the new economy. They play a vital role in the economic development of the region by serving as key contributors to job growth. The social and economic impact of these companies also helps build local communities.
A vibrant entrepreneurial community needs four essential elements: a supportive entrepreneurial culture that encourages and applauds an entrepreneur’s successes, failures and exits, access to various sources of risk capital for all stages of an entrepreneurial company’s growth, a strong inflow of talented individuals that not only provide the work force for growing companies, but are also a major source of new ideas, a supportive business climate that encourages the development of new companies in the region.
Culture: The population in Grand Rapids is less diverse than the national average. It also suffers from the lack of retention of young workers. This has a negative impact on the entrepreneurial climate of the region, but it is tempered by the fact that the State of Michigan has been creating new firms faster than the national average suggesting a return of the entrepreneurs to the state.
Capital: Michigan is attracting more venture capital funding compared to prior years. The access to risk capital is improving faster than the rest of the nation. Michigan continues to lag behind in attracting SBIR and STTR funds, which is a key source of funds for entrepreneurial companies.
Climate: While the cost of doing business in Grand Rapids is still high, it is improving due to the favorable change in the state-wide business tax climate. However, Grand Rapids has fallen behind these cities in recruit-ing new talent, especially from abroad, to supplement the local skilled labor force.
Talent: Compared to the cohort cities, Grand Rapids ranks lower in patent generation, percentage of adults with bachelor’s degrees, and people employed in creative occupations—all indicators of the talent pool from which new businesses get created.
Survey – Perceptions: Recent survey results indicate that perceptions have significantly changed in regards to:• State-wideandlocalpoliticalleadershipsupportforentrepreneurialfirms• Helpprovidedbyeconomicdevelopmentdepartmentsoflocalmunicipalitiesforlocalcompanies• AvailabilityofventurecapitalforentrepreneurialfirmsinWestMichigan• Coverageoflocalmediaofstart-upsandmid-sizecompanies
Grand Rapids has made significant progress in attracting entrepreneurial firms to the area. The availability of capital and the business climate has improved, but, it still needs to do a better job of educating its work-force and retaining young workers. Future policies to attract specialized talent from abroad and attracting more capital will help foster the growth of entrepreneurship in the region.
Authors:
Paul Isely, Ph.D., Chairman and Professor of Economics
Sridhar Sundaram, D.B.A., Chairman and Professor of Finance
Michael Kurley, Entrepreneur at the Center for Entrepreneurship & Innovation
June 2013
Executive Summary
©2013 Grand Va l ley S ta te Un i vers i t y, Se idman Co l lege o f Bus iness
2
June 24, 2013
Dear Members of the Grand Rapids Community:
In 2009, the Seidman College of Business presented the inaugural report, “Empowering Entrepreneurship, a study of the entrepreneurship climate in West Michigan.” The report identified several trends indicating that West Michigan was not creating new companies at rates comparable to like regions and cities. The 2009 report became a catalyst and call to action for West Michigan to become more proactive in entrepreneurial development.
Since that report, West Michigan has made significant progress in developing structures and resources to support entrepreneurship. We have seen the creation of multiple funding sources including StartGarden, the GROW Microloan program, the Michigan Accelerator Fund I, the Huron River Venture Fund, the Business Accelerator Fund,andthemezzaninefundatBlackfordCapital.InMuskegon,thefirstMuskegonAngelsrecentlyformedwith 22 inaugural members.
Grand Valley State University’s Center for Entrepreneurship & Innovation has strengthened both staffing and programs. In 2013-14, the Seidman College of Business will offer its first stand-alone major in Entrepreneurship and a minor for affiliated programs and majors. Other universities and colleges continue to strengthen their entrepreneurship programs including Hope’s Entrepreneurship Initiative a 10 week summer program modeled after a similar program offered at Yale University. Likewise, the West Michigan College and University Group has strengthened their offerings through the Regional Business Plan Competitions and Regional Idea Pitch. For the first time in West Michigan’s history, West Michigan student business plan teams have placed in the top three teams on the statewide Accelerate Michigan Student Business plan competition.
In 2012, Grand Valley State University through its Center for Entrepreneurship & Innovation (CEI) signed a multi-year contract to provide and manage incubator services for the Grand Rapids SmartZone and the Local District Financing Authority (LDFA). Under this program, CEI provides a full array of support, education and mentoring services to new companies under the new name GR Current. This study will establish a baseline for this agreement.
Grand Rapids — and the Greater West Michigan region — has thousands of entrepreneurs and potential entrepre-neurs, some of whom have the potential to create great companies. The resources available to these entrepreneurs aregrowingandbecomingmoreaccessible.Whatweneedisacoordinatedstrategyformobilizingtheresourcesto achieve maximum impact. Leveraging individual strengths of our many resources will allow the Grand Rapids entrepreneurship community to become greater than the sum of its parts. As community leaders, we simply must continue to develop and enhance a culture that encourages and supports entrepreneurs and entrepreneurship!
We have begun — and must continue—to commit to entrepreneurship as a key to our City’s economic future. This report details the foundation being laid for the next generation of great entrepreneurial companies in Grand Rapids, and where that foundation needs special attention.
Sincerely,
John W. Reifel, Interim DeanSeidman College of Business
Pew Grand Rap ids Campus • L . W i l l i am Se idman Center • 50 Front Ave SW • Grand Rap ids , MI • ( ( 616 ) 331-5000
3
Culture, defined as a set of shared values, beliefs, and norms of a group or community, is one of the most significant factors in shaping entrepreneurial success. Most importantly, it is whether the community is accepting and encouraging when an entre-preneur fails.
Business climate refers to the local economic environment for businesses affected by government and lending institutions, attitudes of labor unions toward employers, and current taxation regimen.
Capital is the critical resource of any new and growing business. This includes ready availability of funds for pre-seed investment, seed money for start-ups, and later-stage venture capital.
Talent refers to the quality and quantity of a community’s work force required to staff entrepreneurial companies. To be an entre-preneurial hot spot, a community must have a supply of potential entrepreneurs and the talent needed to support them.
2 Executive Summary
3 Letter from the Dean
5 Introduction to Benchmark Cities
22 Survey Demographics
23 Survey Questions
24 Perception Changes 2009 to 2013
25 Perceptions vs. Actual Data
26 Open-Ended Questions
27 Acknowledgments
6 Retention
7 Diversity
8 Firms
9 Conclusions and Map
10 Cost of Doing Business
11 H-1B Visas
12 Patents
13 Conclusions and Map
14 Venture Capital
15 Access to Capital
16 Federal Research Funding
17 Conclusion and Map
18 Creative Workforce
19 Patents
20 Educational Attainment
21 Conclusion and Map
Table of Contents
4

Grand Rapids
ProsBenchmark Cities
Benchmark cities were selected based on similar size and their ranking along the Kauffman Inc. Index of entrepreneurial activity.
Cons
Louisville
Des Moines
Little Rock
Greensboro
Tulsa
Huntsville
Albany
Michigan
Kentucky
Iowa
Arkansas
North Carolina
Oklahoma
Alabama
New York
Grand Rapids is home to five of the world’s leading office furniture companies
Eighth largest biopharmaceuticals cluster in the U.S
#13 among states for individuals in science and engineering as a percentage of workforce
Intelligent/educated workforce with 23% of their industrial concentration in Business Services and 18% in IT
Thriving insurance and banking industry making large scale investments
The city has access to abundant raw materials
Highly educated workforce
Geographicallycentralizedcustomeraccesspoint
The nation’s second most diverse economy (by Moody’s) allowing it to weather economic swings
Cost of living is 5% below the national average
Located within the “Research Triangle” with Duke University and the University of North Carolina
Young workforce
Cost of living is 10% below the national average
Cost of doing business is 11% below the national average
Population growth of 20 to 30 percent from 2000-2010
NASA — Marshall Space Flight Center
United States Army Aviation and Missile Command
HighconcentrationsoflocalR&Dorganizations(Univ of Albany, Cornell) relative to its population
Lower access to risk capital
Below average per capita income
Old industries remain from earlier decades producing little innovation (the rust belt effect)
Haven’t thoroughly developed unique capabilities or opportunities in a particular sector/s
High office space vacancies
Aging commercial buildings
Below average mean hourly wage
Difficulty in attracting talent
Low per capita income
Stagnant average wage rates
High poverty rates
Slow growth in the number of high earning/high value jobs with salaries of $50k or more
Lacking significant capital investment ($1B range)
Aging infrastructure
Trouble attracting top technical talent
Perception of isolation with relocating to Northern Alabama
Low per capita income
Lack of access to risk capital
Population growth stagnation since the 70s
DownsizingofmajorcorporationslikeXeroxandGE
MSA population: 774kKauffman Index: 34
MSA population: 1284kKauffman Index: 20
MSA population: 570kKauffman Index: 16
MSA population: 700kKauffman Index: 42
MSA population: 715kKauffman Index: 62
MSA population: 937kKauffman Index: 14
MSA population: 418kKauffman Index: 3
MSA population: 871kKauffman Index: 30
5

CU
LTU
RE
Retention
AlbanyNew York
LouisvilleKentucky
Grand Rapids is below average in retain-ing young workers. It is one of two cities that had fewer 25-34 year-olds than the comparable cohort 10 years earlier.
Retention is the number of people that moved into an area minus the number of people that left the area. Drawing new people into an area generates a diverse workforce. Retaining and acquiring young workers increases the number of potential entrepreneurs in a community. This graph compares the group that was between15 and 24 years old in 2000 with the group that is 25 to 34 in 2010. A higher number in 2010 means that there is a net migration of young workers into a community.
Geo: MSA
Source: http://factfinder2.census.gov/faces/tableservices/jsf/pages/productview
xhtml?pid=ACS_11_5YR_B23006&prodType=table
Population of Adults Ages:
Alb
any
New
Yor
k
Gre
ensb
oro
Nor
th C
arol
ina
Hu
nts
vill
eA
lab
ama
Tuls
aO
klah
oma
Lou
isvi
lle
Ken
tuck
y
Gra
nd
Rap
ids
Mic
hig
an
Lit
tle
Roc
kA
rkan
sas
Des
Moi
nes
Iow
a
15-24 in the year 2000 2 5 - 3 5 i n 2 0 1 0
6

CU
LTU
RE
Diversity
GreensboroNorth Carolina
Grand Rapids is below average in racial diversity. However, the minority population is not weighted heavily to one racial or ethnic group.
Des MoinesIowa
Diversity in a community can lead to more entrepreneurial opportunities. Different cultural backgrounds bring different perspectives to solving a problem, which can lead to new entrepreneurial ideas.
Geo: MSA
Source: http://factfinder2.census.gov/faces/tableservices/jsf/pages/productview
xhtml?pid=ACS_11_5YR_B23006&prodType=table
AlbanyNew York
GreensboroNorth Carolina
HuntsvilleAlabama
TulsaOklahoma
LouisvilleKentucky
Grand RapidsMichigan
Little RockArkansas
Des MoinesIowa
Racial Diversity
7
CU
LTU
RE
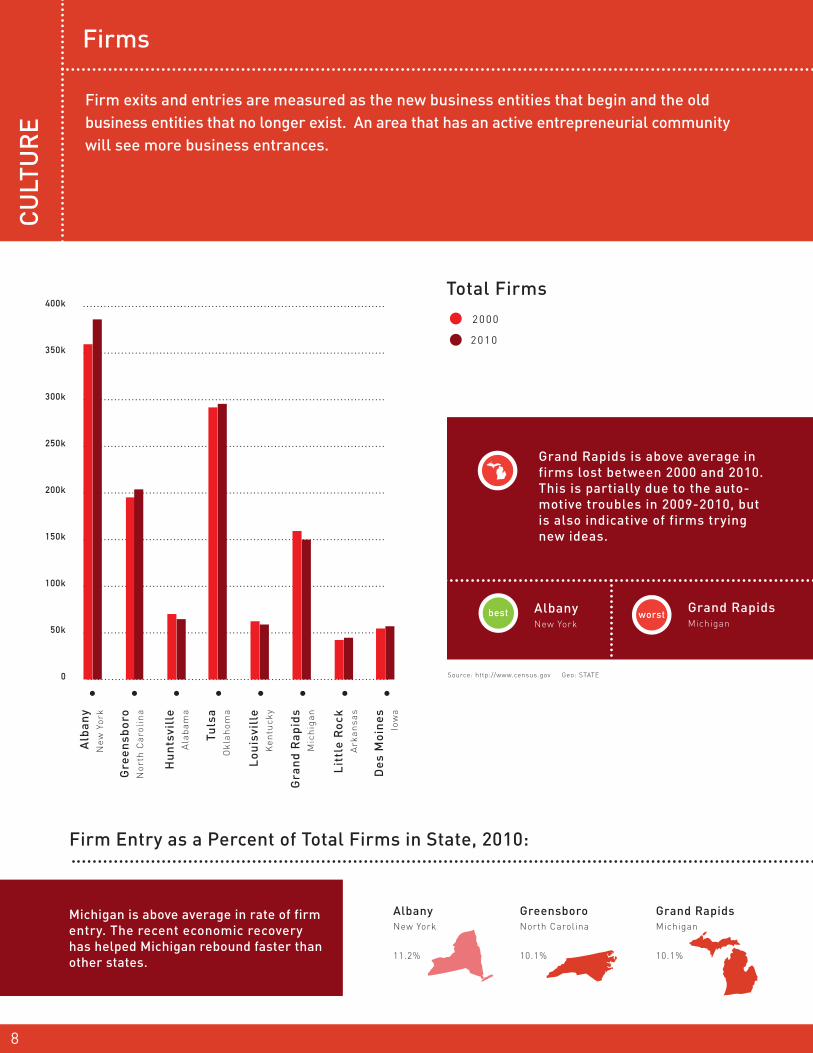
Firms
AlbanyNew York
Grand RapidsMichigan
Grand Rapids is above average in firms lost between 2000 and 2010. This is partially due to the auto-motive troubles in 2009-2010, but is also indicative of firms trying new ideas.
Firm exits and entries are measured as the new business entities that begin and the old business entities that no longer exist. An area that has an active entrepreneurial community will see more business entrances.
Source: http://www.census.gov Geo: STATE
Total Firms
Firm Entry as a Percent of Total Firms in State, 2010:
2000
2 0 1 0
Alb
any
New
Yor
k
AlbanyNew York
11.2%
Gre
ensb
oro
Nor
th C
arol
ina
GreensboroNorth Carolina
10.1%
Hu
nts
vill
eA
lab
ama
Tuls
aO
klah
oma
Lou
isvi
lle
Ken
tuck
y
Gra
nd
Rap
ids
Mic
hig
an
Grand RapidsMichigan
10.1%
Lit
tle
Roc
kA
rkan
sas
Des
Moi
nes
Iow
a
Michigan is above average in rate of firm entry. The recent economic recovery has helped Michigan rebound faster than other states.
8

CU
LTU
RE
In Conclusion...
Michigan is creating new firms at a faster rate than the United States as a whole. However, compared to similar cities, Grand Rapids is less diverse and is having problems keeping young workers. These two stories suggest that there is a mixed story on the entrepreneurial culture in the Grand Rapids area. This is an area Grand Rapids will need to address in the future in order to improve its entrepreneurial climate.
This map indicates the number of new firms created, or entering the state as a percentage of total firms. Michigan ranks in the top 25 states with new firms entering or being created in-state at the rate of 10.1 percent in 2010.
Firm Entry as a Percent of Total Firms in State, 2010:
HuntsvilleAlabama
8.5
TulsaOklahoma
9.3%
LouisvilleKentucky
8.8%
Little RockArkansas
9.3%
Des MoinesIowa
8.2%
high: 13.1%
low: 7.4%
9
BU
SIN
ESS
CLI
MAT
ECost of Doing Business
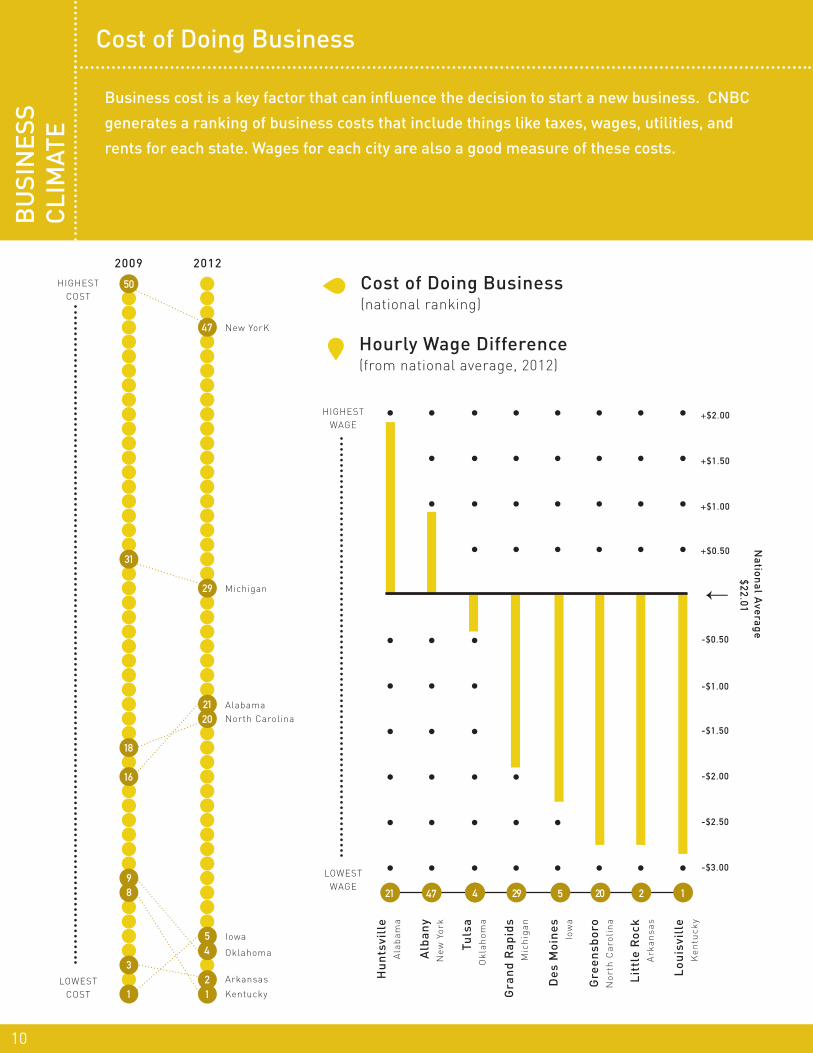
Business cost is a key factor that can influence the decision to start a new business. CNBC
generates a ranking of business costs that include things like taxes, wages, utilities, and
rents for each state. Wages for each city are also a good measure of these costs.
Alb
any
New
Yor
k
New YorK
2009 2012
HIGHESTCOST
LOWESTCOST
HIGHESTWAGE
LOWEST WAGE
Gre
ensb
oro
Nor
th C
arol
ina
North Carolina
Hu
nts
vill
eA
lab
ama
Alabama
Tuls
aO
klah
oma
Oklahoma
Lou
isvi
lle
Ken
tuck
y
Kentucky Gra
nd
Rap
ids
Mic
hig
an
Michigan
Lit
tle
Roc
kA
rkan
sas
Arkansas Des
Moi
nes
Iow
a
Iowa
Cost of Doing Business(national ranking)
Hourly Wage Difference(from national average, 2012)
10

BU
SIN
ESS
CLI
MAT
EH-1B Visas
H-1B visas are required for aliens to enter the U.S. for three years if they work in a special-
ized field and their employers cannot fill the position locally. H-1B visas are a measure of
how willing a community is to import specialized labor into an area, which increases the
availability of talent necessary for high tech start-ups. More individuals with H-1B visas
in a given community indicate specialized labor coming in from abroad.
AlbanyNew York
GreensboroNorth Carolina
HuntsvilleAlabama
TulsaOklahoma
LouisvilleKentucky
% H1-B
Grand RapidsMichigan
Little RockArkansas
Des MoinesIowa
H-1B Visas
Foreign Born Migration from Abroad
LouisvilleKentucky
Grand RapidsMichigan
Grand Rapids is worst com-pared to cohort cities in the ratio of H-1B immigrants to total number of foreign immigrants.
Cost of Doing Business
Hourly Wage Difference
New York
Louisville Kentucky
Kentucky
Huntsville Alabama
Michigan is below average in cost of doing business compared to other states. We im-proved our rank marginally from 2009 to 2012
Grand Rapids is average with cohort cit-ies in measuring wage discrepancy with the national average.
Source: http://www.foreignlaborcert.doleta.gov/performancedata.cfm
Geo: MSA
Source: http://www.bls.gov/oes/tables.html
Geo: MSA
Source: http://www.cnbc.com/id/100016697
http://www.cnbc.com/id/100000992
Geo: State
40% 21% 23% 14%
20% 14% 29%18%
11

Sapicimolupis as in porum esequam, que rendaep erferfe rerciet, quam do-lupta teniminiscit quamus exerio voluptatem is venitat iorection porrum fuga. Ipsam rerferum ium sequam earum rem natecepeles doluptatet volo mo-lutem facesciet faccus, quunt, quo occatis alignitio temque pro doluptatiori re con parum fuga.
Business TaxesB
USI
NES
SC
LIM
ATE
Business taxes can make it harder for an entrepreneur to begin and grow a company. The
Tax Foundation generates an index of business taxes for each state where a higher index
number indicates a more business friendly environment.
State Business Tax Climate Index 2013
National Average5.25
BETTER
WORSE
Alb
any
New
Yor
k
Gre
ensb
oro
Nor
th C
arol
ina
Hu
nts
vill
eA
lab
ama
Tuls
aO
klah
oma
Lou
isvi
lle
Ken
tuck
y
Gra
nd
Rap
ids
Mic
hig
an
Lit
tle
Roc
kA
rkan
sas
Des
Moi
nes
Iow
a
New YorkMichigan
From 2011 to 2013, Michigan’s improvement in tax climate is above average compared to cohort cities. In fact, Michigan’s business tax climate improved more than any other state in that time frame.
Source: http://taxfoundation.org/article/2013-state-business-tax-climate-index
Geo: State
12

Sapicimolupis as in porum esequam, que rendaep erferfe rerciet, quam do-lupta teniminiscit quamus exerio voluptatem is venitat iorection porrum fuga. Ipsam rerferum ium sequam earum rem natecepeles doluptatet volo mo-lutem facesciet faccus, quunt, quo occatis alignitio temque pro doluptatiori re con parum fuga.
In Conclusion...B
USI
NES
SC
LIM
ATE
Grand Rapids has a business climate that is welcoming to new businesses. Contrary to
popular opinion, Michigan (specifically Grand Rapids) is more favorable compared to other
cities regarding business tax climate. The cost of doing business in Grand Rapids is still
relatively high, but is improving. Grand Rapids is still weak in using H-1B’s for attracting
top talent to the area.
State Business Tax Climate Improvement from 2011-2013
better: .49
worse: -.49
This map indicates the improvement in tax climate (based on a 10 point scale) from 2011 to 2013. Michigan improved its rating over this period of time by .49, the most in comparison to all other states.
13
CA
PIT
AL
Venture Capital
Percent Change from 2009 to 20121. 2. 3. 4. 5. 6. 7.
1. Number of VC Firms In Existence2. Number of Investment Professionals3. Total Capital Under Management4. Average Capital Under Management by Firm5. Venture Capital Funds Raised6. Average Venture Capital Fund Size7. Successful Exits
Seven different measures of capital
availability between the U.S. and Michigan
are compared below.
Michigan is improving faster than the
U.S. in 4 of the seven measures.
14

CA
PIT
AL
Access to Capital
Gra
nd
Rap
ids
Are
a
An
n A
rbor
Met
ro D
etro
it
Mid
lan
d/N
orth
ern
Michigan Venture Capital Backed Firms
20092012
Stages of Financing: Michigan vs. U.S.
Venture capital is an important source of funding to entrepreneurs. There are several stages
of funding needed for an entrepreneurial endeavor. Pre-Seed funding is necessary in the
very early stages to develop the idea. Startup capital is necessary to bring the idea to market
and start the business. Growth funding is needed when the business has grown beyond the
start-up phase. The gap between what funding is needed in these areas and what funding is
available shows the magnitude of the lack of funding.
The number of venture capital backed firms increased significantly in both the entire State of Michigan as well the Grand Rapids area, in particular.
Source: MVCA
Geo: State, Nation, and City
15
CA
PIT
AL
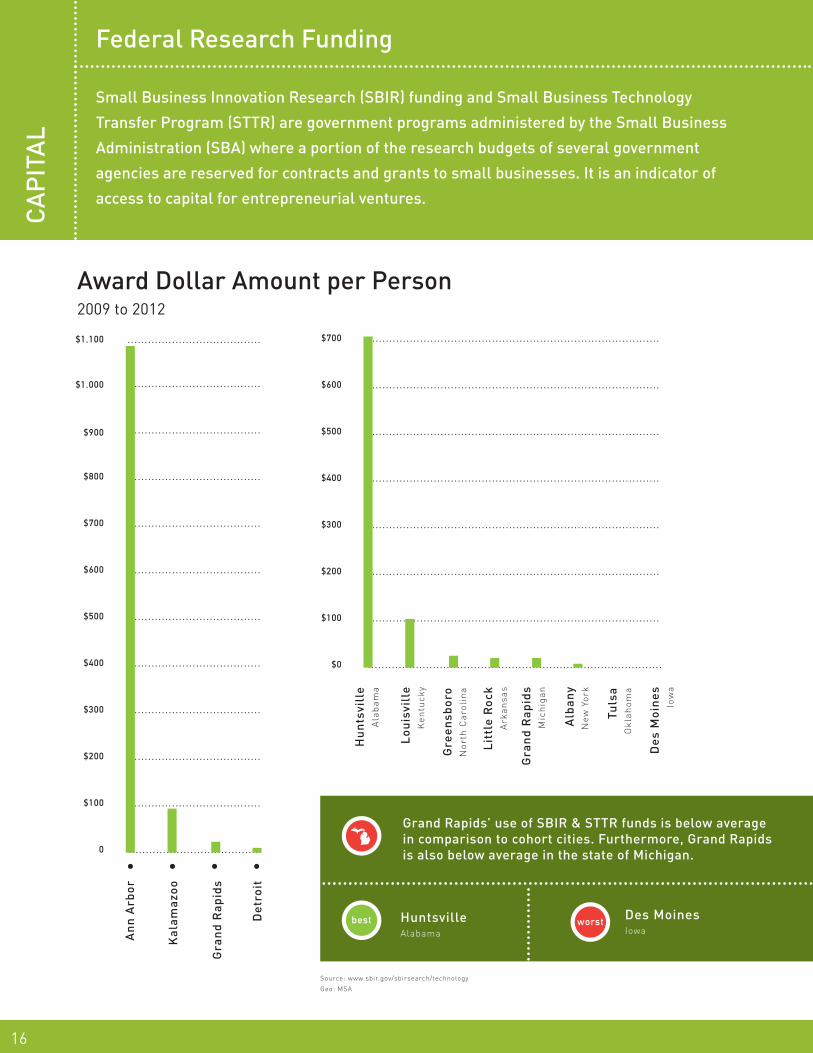
Federal Research Funding
Award Dollar Amount per Person2009 to 2012
Alb
any
New
Yor
k
Gre
ensb
oro
Nor
th C
arol
ina
An
n A
rbor
Kal
amaz
oo
Gra
nd
Rap
ids
Det
roit
Hu
nts
vill
eA
lab
ama
Tuls
aO
klah
oma
Lou
isvi
lle
Ken
tuck
y
Gra
nd
Rap
ids
Mic
hig
an
Lit
tle
Roc
kA
rkan
sas
Des
Moi
nes
Iow
a
Small Business Innovation Research (SBIR) funding and Small Business Technology
Transfer Program (STTR) are government programs administered by the Small Business
Administration (SBA) where a portion of the research budgets of several government
agencies are reserved for contracts and grants to small businesses. It is an indicator of
access to capital for entrepreneurial ventures.
Grand Rapids’ use of SBIR & STTR funds is below average in comparison to cohort cities. Furthermore, Grand Rapids is also below average in the state of Michigan.
Source: www.sbir.gov/sbirsearch/technology
Geo: MSA
HuntsvilleAlabama
Des MoinesIowa
16
CA
PIT
AL
Venture Capital by State
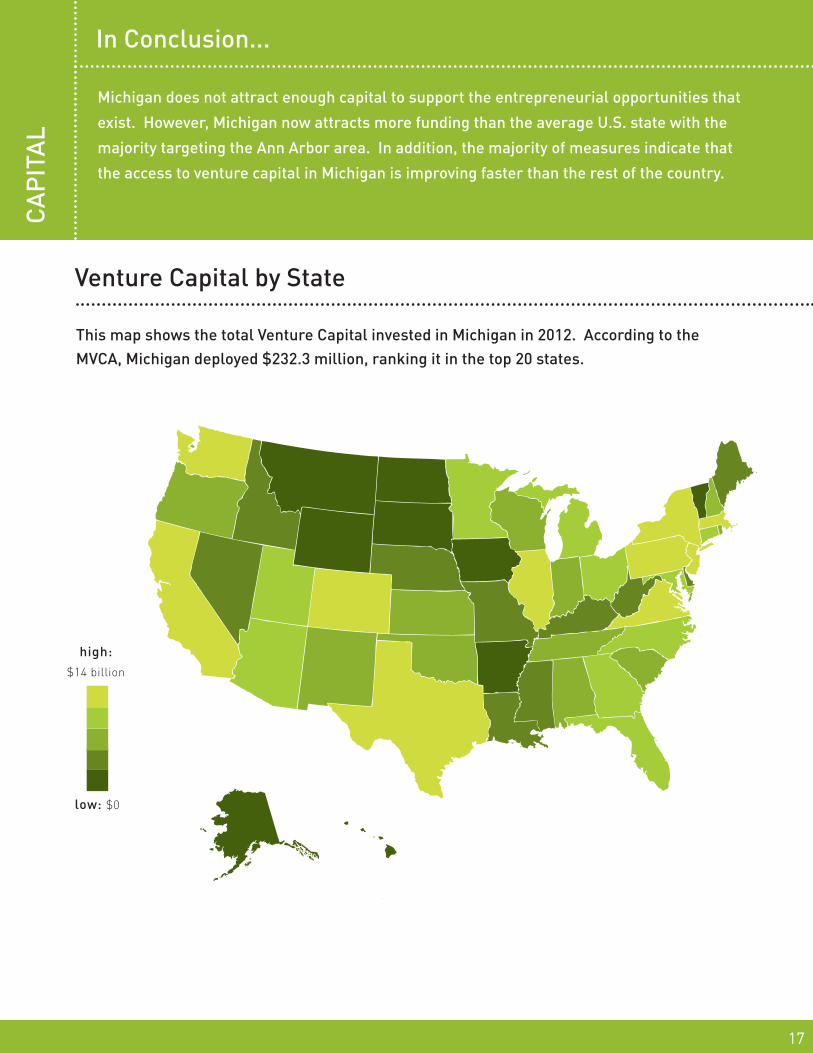
In Conclusion...
Michigan does not attract enough capital to support the entrepreneurial opportunities that
exist. However, Michigan now attracts more funding than the average U.S. state with the
majority targeting the Ann Arbor area. In addition, the majority of measures indicate that
the access to venture capital in Michigan is improving faster than the rest of the country.
This map shows the total Venture Capital invested in Michigan in 2012. According to the MVCA, Michigan deployed $232.3 million, ranking it in the top 20 states.
low: $0
high:$14 billion
17

TALE
NT
&
KN
OW
-HO
WCreative Workforce
A workforce that has more creative workers will be more likely to generate entrepreneurs.
Architects and engineers represent one type of job considered to be creative based on their
job descriptions. Conversely, the higher the proportion of production workers to architects
and engineers, the less likely the community will be to generate new entrepreneurs.
Production Employees2009-2012(in thousands)
Architects & EngineersAverage: 2009-2012(in thousands)
AlbanyNew York
GreensboroNorth Carolina
HuntsvilleAlabama
TulsaOklahoma
LouisvilleKentucky
Grand RapidsMichigan
Little RockArkansas
Des MoinesIowa
HuntsvilleAlabama
Des MoinesIowa
Grand Rapids is below average in the ratio between Architects and Engineers to production workers.
Geo: MSA Source: http://www.bls.gov/oes/
18

TALE
NT
&
KN
OW
-HO
WPatents
Patents granted to inventors in the geographic region are an indicator of talent and know-how
represented by new ideas being generated in the community. Patents are an important ele-
ment of the idea formation stage of the entrepreneurial process and serve as an indicator of
the entrepreneurial climate in the region.
Percent Change in Patents 1990s vs 2000
Patents Per 10,000 People 2010-2012
Alb
any
New
Yor
k
AlbanyNew York
Gre
ensb
oro
Nor
th C
arol
ina
GreensboroNorth Carolina
Hu
nts
vill
eA
lab
ama
Tuls
aO
klah
oma
TulsaOklahoma
Lou
isvi
lle
Ken
tuck
y
Gra
nd
Rap
ids
Mic
hig
an
Lit
tle
Roc
kA
rkan
sas
Des
Moi
nes
Iow
a
Des MoinesIowa
Grand Rapids is below average in patent growth. From the 90s to the 00s, patent growth in Grand Rapids is nearly last compared to cohort cities.
Grand Rapids is above average, ranking second highest in patents per 10,000 people when compared to cohort cities.
Geo: city Source: http://www.uspto.gov
Geo: city Source: http://www.uspto.gov
19
Educational AttainmentTA
LEN
T &
K
NO
W-H
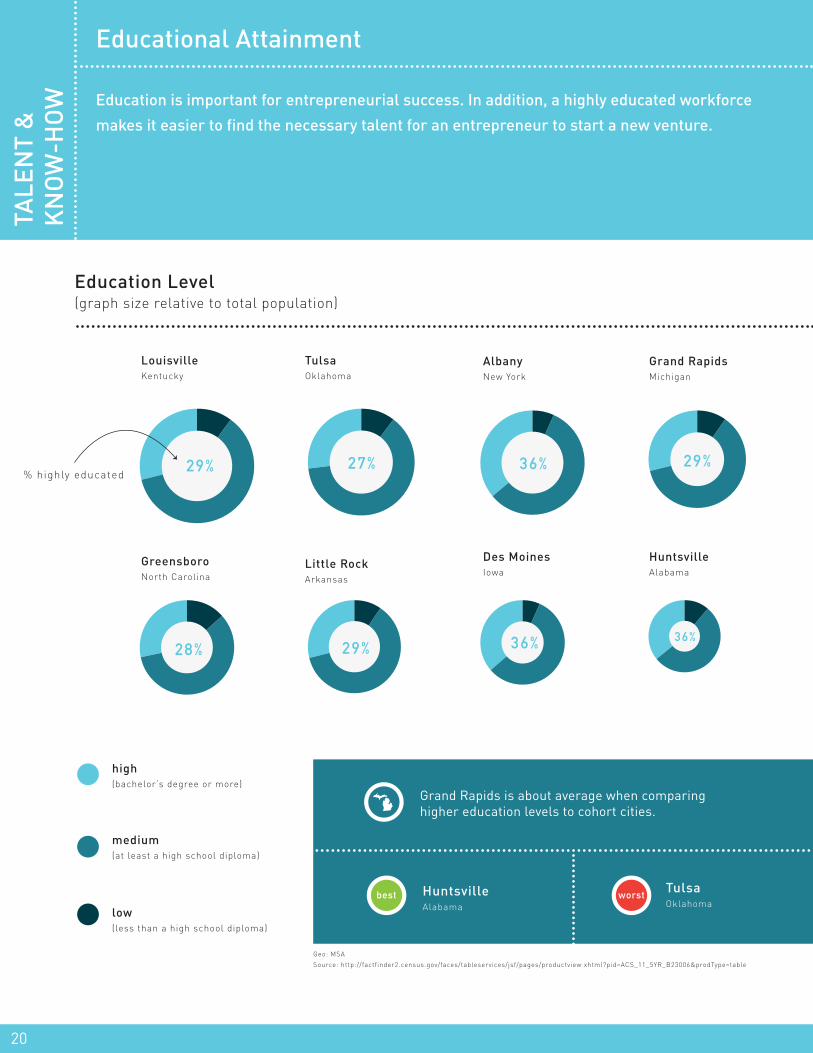
OW Education is important for entrepreneurial success. In addition, a highly educated workforce
makes it easier to find the necessary talent for an entrepreneur to start a new venture.
AlbanyNew York
GreensboroNorth Carolina
HuntsvilleAlabama
TulsaOklahoma
LouisvilleKentucky
Grand RapidsMichigan
Little RockArkansas
Des MoinesIowa
Education Level(graph size relative to total population)
high(bachelor’s degree or more)
medium(at least a high school diploma)
low(less than a high school diploma)
HuntsvilleAlabama
TulsaOklahoma
Grand Rapids is about average when comparing higher education levels to cohort cities.
Geo: MSA
Source: http://factfinder2.census.gov/faces/tableservices/jsf/pages/productview xhtml?pid=ACS_11_5YR_B23006&prodType=table
20
Grand Rapids is not creating new ideas at the same rate as similar cohort cities. Compared
to similar cities, Grand Rapids ranks below average in the growth of patent creation, in the
level of educational attainment, and in the workers employed in creative occupations – all of
which are indicative of new entrepreneurial growth.
In Conclusion...TA
LEN
T &
K
NO
W-H
OW
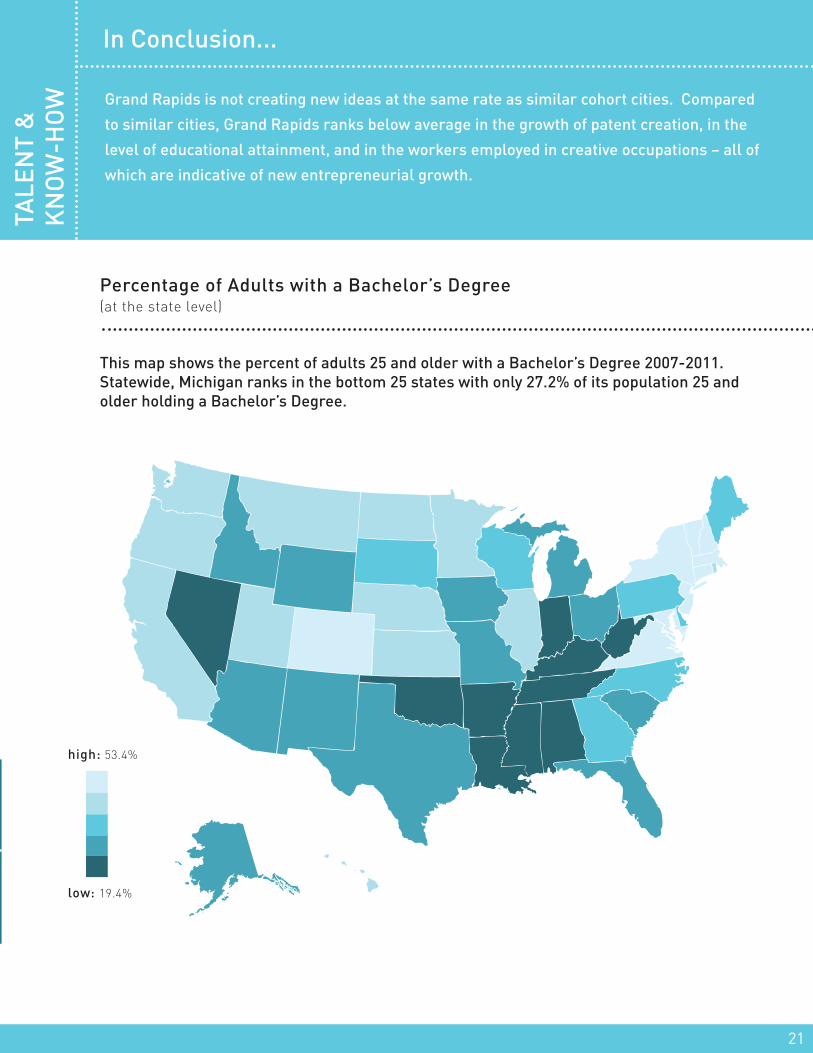
Percentage of Adults with a Bachelor’s Degree(at the state level)
low: 19.4%
high: 53.4%
This map shows the percent of adults 25 and older with a Bachelor’s Degree 2007-2011. Statewide, Michigan ranks in the bottom 25 states with only 27.2% of its population 25 and older holding a Bachelor’s Degree.
21
age
annual family income
current occupation
professional
executive
managerial
administrative
sales
technical
secretarial
other
under 40k
40k-59k
60k-70k
80k-99k
100k-149k
150k-199k
200k or more
under 25
25-34
35-44
45-54
55-64
65-74
over 75
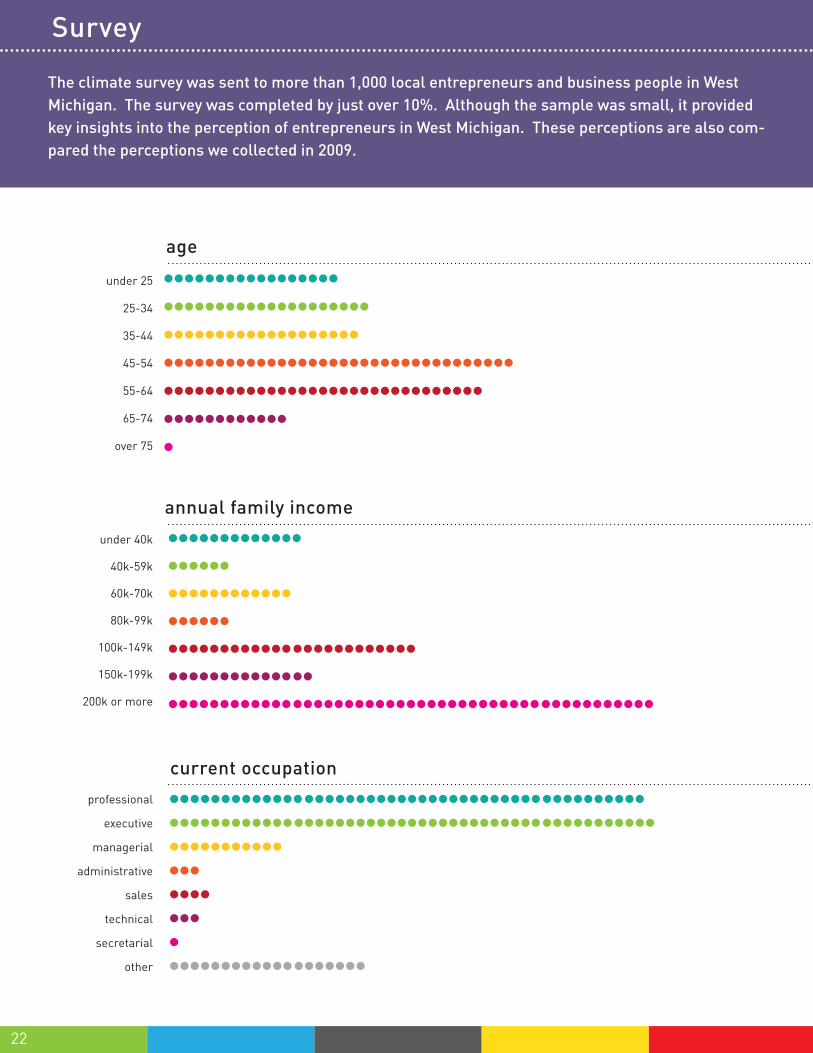
The climate survey was sent to more than 1,000 local entrepreneurs and business people in West Michigan. The survey was completed by just over 10%. Although the sample was small, it provided key insights into the perception of entrepreneurs in West Michigan. These perceptions are also com-pared the perceptions we collected in 2009.
Survey
22
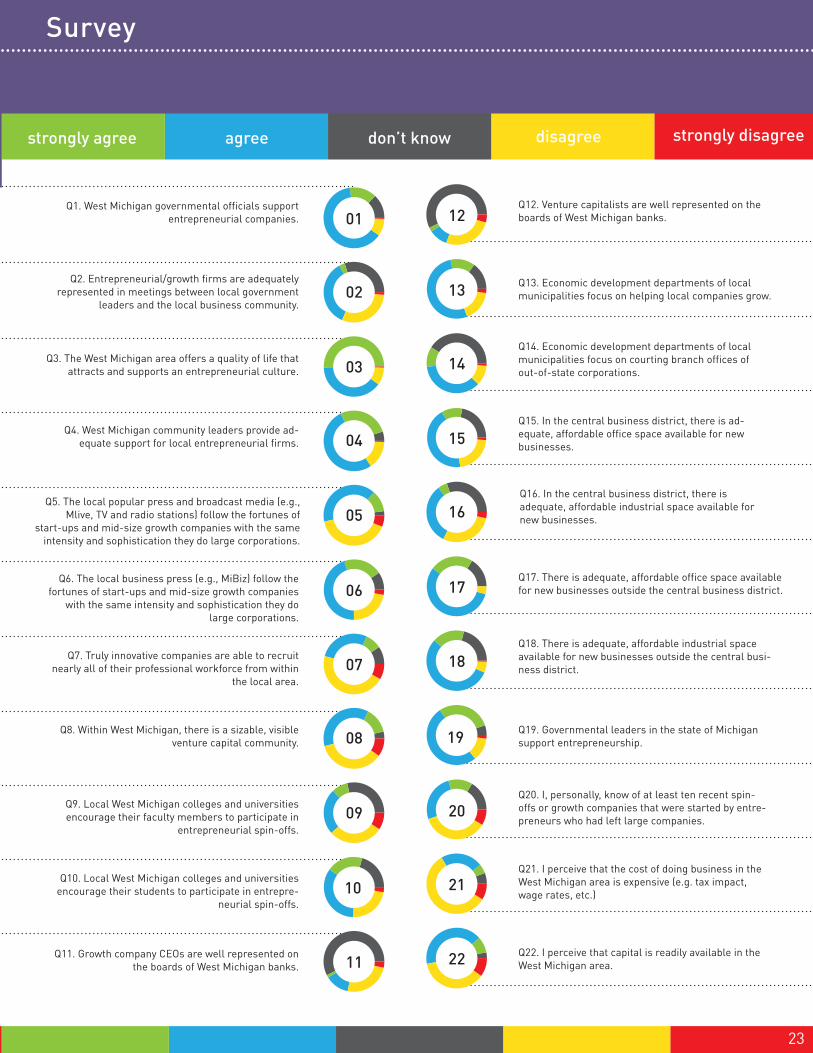
Q1. West Michigan governmental officials support entrepreneurial companies.
Q12. Venture capitalists are well represented on the boards of West Michigan banks.
Q4. West Michigan community leaders provide ad-equate support for local entrepreneurial firms.
Q15. In the central business district, there is ad-equate, affordable office space available for new businesses.
Q7. Truly innovative companies are able to recruit nearly all of their professional workforce from within
the local area.
Q18. There is adequate, affordable industrial space available for new businesses outside the central busi-ness district.
Q2. Entrepreneurial/growth firms are adequately represented in meetings between local government
leaders and the local business community.
Q13. Economic development departments of local municipalities focus on helping local companies grow.
Q5. The local popular press and broadcast media (e.g., Mlive, TV and radio stations) follow the fortunes of
start-upsandmid-sizegrowthcompanieswiththesameintensity and sophistication they do large corporations.
Q16. In the central business district, there is adequate, affordable industrial space available for new businesses.
Q8.WithinWestMichigan,thereisasizable,visibleventure capital community.
Q19. Governmental leaders in the state of Michigan support entrepreneurship.
Q10. Local West Michigan colleges and universities encourage their students to participate in entrepre-
neurial spin-offs.
Q21. I perceive that the cost of doing business in the West Michigan area is expensive (e.g. tax impact, wage rates, etc.)
Q3. The West Michigan area offers a quality of life that attracts and supports an entrepreneurial culture.
Q14. Economic development departments of local municipalities focus on courting branch offices of out-of-state corporations.
Q6.Thelocalbusinesspress(e.g.,MiBiz)followthefortunesofstart-upsandmid-sizegrowthcompanies
with the same intensity and sophistication they do large corporations.
Q17. There is adequate, affordable office space available for new businesses outside the central business district.
Q9. Local West Michigan colleges and universities encourage their faculty members to participate in
entrepreneurial spin-offs.
Q20. I, personally, know of at least ten recent spin-offs or growth companies that were started by entre-preneurs who had left large companies.
Q11. Growth company CEOs are well represented on the boards of West Michigan banks.
Q22. I perceive that capital is readily available in the West Michigan area.
Survey
23

Business Climate:Survey results indicate no change in respect to local colleges and universities encouragement of faculty and students to join in entrepreneurial spin-offs.
Capital:Venture capitalists do not seem represented on local bank boards indicating that the culture of bank management towards entrepre-neurship has not changed in the past four years.
Culture:Lack of knowledge by survey respondents of local spin-offs or growth companies started by entrepreneurs who left large companies has not changed in four years. This may indicate a lack of such companies or lack of media coverage of such firms.
Changes in Perceptions
Empowering Entrepreneurship Survey:Perceptions of the West Michigan Community
Unchanged Perceptions
Comparison between 2009 and 2013 Survey Results
80%
2012
37%
2009
65%44%
50%19%
51%17%
80% of the respondents in 2013 (compared to 37% in 2009) believed that the State of Michigan political leadership support entrepreneur-ship. A similar change in perception was noted for West Michigan governmental leaders and their support for entrepreneurial firms.
Survey indicates that local broadcast media follow start-ups and mid-size companies today more than four years ago. The perception change is reflected in the 51% responses that agreed with this com-pared to only 17% four years ago.
Survey results also report a significant change (65% vs 44%) in perception that economic development departments of local mu-nicipalities focus on helping local companies grow.
Survey respondents report a significant growth in the Venture Capital community in West Michigan compared to four years ago. The per-cent of people agreeing increased to 50% from only 19% in 2009.
24

...the biggest aid(s) to entrepreneurship in the West Michigan area?
...the biggest obstacle(s) to entrepreneurship in the West Michigan area?
...the biggest change(s) to the entrepreneurial ecosystem in the West Michigan area?
...the biggest draw(s) to entrepreneurship in the West Michigan area? What is the single greatest reason for locating/starting a new business in West Michigan?
Open-Ended Questions
What do you see as...
There has been a mindset change in the West Michigan region, one that fosters smart risk tak-
ing and new business creation and which allows individuals to embrace entrepreneurship.
There is a lack of connectivity and co-operation between many entrepreneurs
and start-up support organizations which leads to the Balkanization of efforts of
these groups.
The evolution of Start Garden from the 5x5 nights and incubators that are opening
up. Funding even failed experiments helps many small firms around the area and
encourages more risk taking for regular people with passionate ideas.
“The quality of life is at a high level, while the cost of living is a lower level than
comparable cities.”
There is a lack of early stage capital in amounts that allow for success, especially
for start-ups not in defense, high-tech, or the medical field.
An overall sense of willingness to help. People tend to be generous with time and resources if the idea is right. I think this is happening because many of the resources are advocates for better entrepreneurial
support in West Michigan.
The excitement of the next generation to create new ventures, and having peers and
some support to do so.
The biggest aid that I see is the relatively cheap cost of living and access to a signifi-cant variety of business support services
(CEI, Start Garden, GROW, GRIN, etc.) and the new incubators in the area.
25
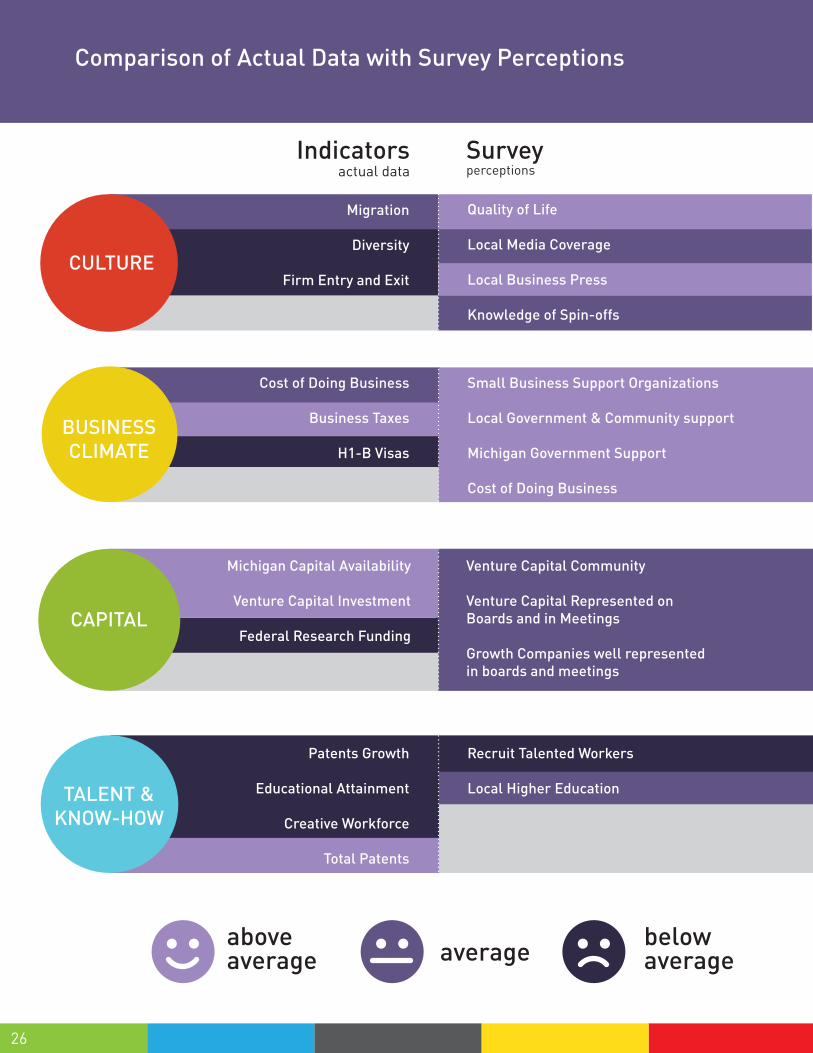
Indicatorsactual data
Surveyperceptions
aboveaverage average below
average
Migration
Diversity
Firm Entry and Exit
Cost of Doing Business
Business Taxes
H1-B Visas
Patents Growth
Educational Attainment
Creative Workforce
Total Patents
Quality of Life
Local Media Coverage
Local Business Press
Knowledge of Spin-offs
Venture Capital Community
Venture Capital Represented on Boards and in Meetings
Growth Companies well represented in boards and meetings
Small Business Support Organizations
Local Government & Community support
Michigan Government Support
Cost of Doing Business
Recruit Talented Workers
Local Higher Education
Comparison of Actual Data with Survey Perceptions
Michigan Capital Availability
Venture Capital Investment
Federal Research Funding
CULTURE
BUSINESSCLIMATE
CAPITAL
TALENT &KNOW-HOW
26

Acknowledgments
belowaverage
This report is the result of the hard work of many people. Thanks to all for successful comple-tion of the project under intense deadline pressure.
Thanks to
Kevin McCurren, Director of the Center of Entrepreneurship & Innovation, GVSU, for putting the team together and providing the necessary guidance throughout the project.
Shorouq Almallah, Operations Manager at the Center for Entrepreneurship & Innovation, GVSU, for leading the aggregated team and providing insight for the creation of the final report.
Dana Lewis, Dean’s Administrative Assistant, for conducting the survey and tabulating the results.
Vonnie Herrera, Director of External Relations & Communications, Seidman College of Business, forhertirelesshelpinediting,organizingandfacilitatingthecompletionofthereport.
Paul Jabbey, Austin Dean and Adam Ingraham, our Graduate assistants, for their tireless work inretrievingandanalyzingthedata.Theirdiligenceandhardworkwereessentialinthecom-pletion of this project.
Dr. Paul Isely, Chair, Economics Department, for his invaluable contributions to the report. Paul was fully responsible for the analysis and interpretation the data and his contributions are evident throughout the report.
Michael Kurley, Entrepreneur at the Center for Entrepreneurship & Innovation, GVSU, for his considerable contributions to the report. Michael was fully responsible for the collection and analysis of the data, and his contributions are apparent throughout the report.
Dr. Sridhar Sundaram, Chair, Finance Department, for his significant contributions to the pro-ject.Hiscontributionsarelargelyincreatingtheentrepreneurshipmodel,analyzingthesurveyand in compiling the final report.
Finally, thanks to Laura Wilusz, Graphic Designer at the Center for Entrepreneurship & Inno-vation, GVSU, for her tremendous dedication to the visual design of the information contained in this report.
Thanks to GR Current for being a sponsor of the Empowering Entrepreneurship Climate Survey. This survey provides a timely update of the entrepreneurship climate for our region.
27
Seidman College of Business
GR Current is the leading business incubator for life sciences and emerging technologies in West Michigan. We provide the space, resources, capital, and connections to help evolve start-ups into stand-alone businesses. Our objective? Economic growth, technological creativity, a new fleet of strong entrepreneurs, and, of course, job creation.
Wedevelopcollaborationsforcommercializationinfrastructureandpossibilitiesfornewproductdevelopment. We provide valuable connections that bring together individuals and businesses to spark creative entrepreneurship.
By helping to bridge the transition from basic discovery to a sustainable business, GR Current drives commercial solutions for high-growth industries such as health and life science, alternative energy, advanced manufacturing, agricultural processing and defense.
GRCurrentworkswiththefollowingareapartnerstoassistourclientsinthecommercializationofinnovative products: The Center for Entrepreneurship & Innovation, The Right Place, Start Garden, The Factory, GR Collective, aimWest and Grand Rapids entrepreneurial community at large.
28