Embed Size (px)
Citation preview

Empowering cash managers to achieve cost savings byimproving predictive accuracy
Francisco Salas-Molinaa,∗, Francisco J. Martinb, Juan A. Rodrıguez-Aguilarc, JoanSerrad, Josep Ll. Arcosc
aHilaturas Ferre, S.A., Les Molines, 2, 03450 Banyeres de Mariola, Alicante, SpainbBigML, Inc, 2851 NW 9th Suite D, Conifer Plaza Building, Corvallis, OR 97330, US
cIIIA-CSIC, Campus UAB, 08913 Cerdanyola, Catalonia, SpaindTelefonica Research, Ernest Lluch i Martın, 5, 08019 Barcelona, Catalonia, Spain
Abstract
Cash management is concerned with optimizing the short-term funding requirements
of a company. To this end, different optimization strategies have been proposed to
minimize costs using daily cash flow forecasts as the main input to the models. However,
the effect of the accuracy of such forecasts on cash management policies has not been
studied. In this article, using two real data sets from the textile industry, we show that
predictive accuracy is highly correlated with cost savings when using daily forecasts in
cash management models. A new method is proposed to help cash managers estimate if
efforts in improving predictive accuracy are proportionally rewarded by cost savings. Our
results imply the need for an analysis of potential cost savings derived from improving
predictive accuracy. From that, the search for better forecasting models is in place to
improve cash management.
Keywords: Decision support, forecasting, cash management, non-linear time series.
1. Introduction
Cash flow management is concerned with the efficient use of a company’s cash as a
critical task in working capital management. Decision making in cash flow management
∗Corresponding authorEmail addresses: [email protected] (Francisco Salas-Molina ), [email protected]
(Francisco J. Martin), [email protected] (Juan A. Rodrıguez-Aguilar), [email protected](Joan Serra), [email protected] (Josep Ll. Arcos)
Preprint submitted to Elsevier November 17, 2016

focuses on keeping the balance between what the company holds in cash and what has
been placed in short-term investments, such as deposit accounts or treasury bills. Dif-
ferent models have been designed to answer to these questions and reviews can be found
in Gregory (1976), Srinivasan and Kim (1986), da Costa Moraes et al. (2015). However,
to the best of our knowledge, little attention has been placed on the utility of cash flow
forecasts with the exception of Stone (1972) and Gormley and Meade (2007). Both works
showed the utility of forecasting in cash management, but none of them researched the
importance of the predictive accuracy of the forecasts used in their respective models.
Therefore, it is unknown whether even small improvements in predictive accuracy may
lead to savings that could perhaps amount to millions of euros in total.
Cash planning deals with forecasting cash balances, short-term investment and short-
term borrowing (Stone, 1973, Fabozzi and Masonson, 1985). The cash management
problem was first addressed from an inventory control point of view by Baumol (1952) in
a deterministic way. Miller and Orr (1966) introduced a simple stochastic approach by
considering a symmetric Bernouilli process in which both the inflow and the outflow were
exactly of the same size and had probability 1/2. Later, while Girgis (1968) considered
continuous net cash flows with both fixed and linear transaction costs, Eppen and Fama
(1969) focused on discrete net cash flows with only variable transaction costs. The use
of forecasts in the corporate cash management problem was first introduced by Stone
(1972) as a way of smoothing cash flows. More recently, Gormley and Meade (2007) used
the model proposed by Penttinen (1991) as a benchmark to demonstrate the utility of
cash flow forecasts in the cash management problem. They proposed a dynamic simple
policy to minimize transaction costs, under a general cost structure, and developed a
time series model to provide forecasts. Surprisingly, even though their model is based
on cash flow forecasts, they ignored the possibility of exploring alternative forecasting
methods. We claim this step as a mandatory one, specially when improving forecasting
accuracy may be correlated with cost savings. This hypothesis was suggested by the
authors but was not verified.
In cash flow forecasting, Stone (1976), Stone and Miller (1981, 1987), Stone and Wood
(1977), Miller and Stone (1985), and Maier et al. (1981) presented different useful linear
models. A measure of quality of any forecasting technique is its predictive accuracy and,
2

under an economic perspective, predictive accuracy must be mapped to estimated cost
savings. This analysis assesses how much companies can save by improving predictive
models and, consequently, the cost of not predicting, i.e., the missed savings minus the
cost of implementing the model. For example, if a reduction of 32% in forecasting error
produced e320.000 in savings per year, it can be stated that, on average, each percentage
point of predictive accuracy is e10.000 worth.
Overall, one can conclude that when using forecasts in cash management models, pre-
dictive accuracy of these forecasts attracted little attention of the research community,
neglecting its significance and implications. Consequently, our discussion seeks to assess
the quality of alternative forecasting methods. In this paper, we present and compare
different forecasting methods including linear and non-linear models. In this sense, we
expect that non-linear models can deal with cash flow time-series in a cost-saving ap-
proach. For simplicity reasons, we restrict our analysis to transaction and holding costs
for cash balances in a single currency. Using two real data sets from companies in the
textile industry in Spain, in this paper: (i) we show empirically that forecasting accuracy
is highly correlated with savings in cash management and, thus, a comparison in terms
of accuracy and savings between different forecasting models is performed; (ii) we argue
that the effect of forecasting accuracy on cash management can be estimated in advance
and, thus, a new methodology for estimating this effect is proposed.
The rest of this paper is organized as follows. We firstly describe our real cash flow
data sets in Section 2. We later enumerate different forecasting models: linear models
such as autoregressive and regression models; and non-linear models, such as radial basis
function, random forests and seasonal indicator models in Section 3. These forecasting
models will be ranked according to its predictive accuracy in the evaluation Section 4. In
Section 5, we empirically verify that a better forecast produces a better policy. Moreover,
we estimate how much savings (if any) can be obtained by the cash policies produced by
an improvement in forecasting accuracy. Finally, Section 6 concludes.
2. Description and data preprocessing
In this section, we describe the two real cash flow data sets used in this paper. Data
sets 1 and 2 gather net daily flow on workdays from two different companies in the textile
3

industry. Both sets of observations are in the domain of real numbers and their values’
distributions present a bell-like shape but excess kurtosis. An additional transformation
is performed to deal with anomalies. More specifically, following the recommendations in
Gormley and Meade (2007) and Hyndman (2016), any observation greater than five times
the standard deviation is considered an outlier and it is replaced by a linear interpolation.
After time-series cleaning, our cash flow data sets empirical distributions are shown in
Figure 1. In order to cover a wider range of realistic industrial company cases, a number
of cash flow data sets are derived from the two real data sets as follows:
Data set 1
Dens
ity
Data set 2
Dens
ity
Figure 1: Histogram for data sets 1 and 2 compared to a normal distribution.
• Real cash flow: data sets 1 and 2.
• Stable cash flow: data set 3 is derived from data set 1 and applies to companies in a
more stable environment with daily cash flows characterized by a low variance. In
this case, observations greater than three times the standard deviation are replaced
by values of exactly three times the standard deviation.
• Unstable cash flow: data set 4 also derives from data set 1 and applies for companies
with high variance in its daily cash flow due to different reasons such as a reduced
number of customers or suppliers as it is the case of small companies. In this case,
observations greater than three times the standard deviation are replaced by values
of exactly two times the original observation.4

• Random shock cash flow: data sets 5 and 6 are derived from the original data sets 1
and 2 respectively, before anomaly detection, and aim to cover the likely occurrence
of unexpected changes in industrial markets. In this case, 5% of the observations
are randomly chosen and replaced by randomly selected values from the previous
set of labeled outliers. This transformation simulates a disturbance that, to some
extent, may break existing patterns and increase deviation from expected cash
flow by introducing a number of outliers in the original data. In addition, it helps
estimate the impact of outliers in accuracy.
A summary of the characteristics of each data set is presented in Table 1.
Table 1: Data set summary.
Data Set Length Case Std.Dev. Kurtosis
1 2717 Real cash flow 92615 4.08
2 1218 Real cash flow 42514 3.55
3 2717 Stable cash flow 87780 2.40
4 2717 Unstable cash flow 126303 18.05
5 2717 Random shock cash flow 151462 6.49
6 1218 Random shock cash flow 100883 20.33
At this point, it is important to note that we are dealing with net cash flow without
component separation. Mixing different cash flows may compromise attainable accuracy
due to the different statistical properties of cash flow components such as major and non-
major cash flows (Stone and Miller, 1987). Major cash flows such as loan payments can
be handled by simple scheduling techniques since most of them are known in both timing
and amount. Non-major cash flows are all other transactions usually related to customers
and vendors. As a result, we expect that higher overall accuracy could be achieved when
cash flow component separation is available, and possibly different forecasting techniques
are used for each component.
For comparison purposes with Gormley and Meade (2007), here we assume that,
apart from daily cash flow data, no other extra features are provided by the company.
However, a set of available explanatory variables can be proposed. According to Miller
and Stone (1985), and Stone and Wood (1977), we may find seasonal patterns in daily5

cash flow data. Thus, we consider basic calendar effects such as the day-of-week, the
day-of-month and month effect by using categorical or dummy variables. In the latter
case, each dummy variable takes a value of one if time t occurs at the corresponding
day of the week/month, and zero otherwise. A further step in the search of explanatory
power is explored by considering past values of the time series. From that, a tentative
set of explanatory variables is listed below:
• Day-of-month (DOM): Day of month categorical variables or dummy variables
(dt1, . . . , dt31).
• Day-of-week (DOW): Day of week categorical variables or dummy variables for
working days (st1, . . . , st5).
• Month: Month dummy variables (mt1, . . . ,mt12).
• Week: Week dummy variables (wt1, . . . , wt53).
• Past values: Previous observations of the daily cash flow time series (yt−1, . . . , yt−p)
where p is the total number of observations considered.
From a combination of these explanatory variables, different predictive models can
be built and compared in terms of forecasting accuracy.
3. Building forecasting models
The accuracy of any forecasting model depends on its ability to capture the specific
characteristics of the data used. According to Stone (1972), real-world cash flows are
neither completely known in advance nor are they completely unpredictable. However, a
wide set of tools and techniques are available to improve forecasting accuracy. We claim
that exploring alternative models to improve forecasting ability is mandatory, specially
if improving forecasting accuracy can lead to cost savings.
In this section, we present a number of forecasting models to be evaluated allowing us
to identify our best-in-class forecaster that will ultimately be used as the main input to
the cash management model. We do not intend to determine the best cash flow forecaster
among all methods presented in forecasting research literature. Instead, our final goal
6

is to verify if a better forecaster, in terms of forecasting accuracy, is able to produce
a better cash policy in terms of cost savings. In this sense, we expect that non-linear
models outperform two of the most usual linear models in cash flow forecasting allowing
cash managers to deploy better cash policies.
Then, we here consider five different forecasting models: autoregressive, regression,
radial basis functions, random forests and seasonal interaction models. Firstly, we follow
the autoregressive approach to daily cash flow forecasting along the lines of Gormley
and Meade (2007). In contrast to such approach, we expect that the use of the set of
explanatory variables mentioned earlier rather than only a number of previous values of
a time series can help obtain a more accurate prediction. Then, we secondly consider a
linear regression model with a set of explanatory variables.
While linear models are often employed in finance due to their simplicity, many non-
linear models have been proposed to explain financial phenomena. Perhaps one of the
most widely known non-linear model in finance is the Black and Scholes (1973) option
pricing model. Moreover, there is a reason for optimism about the use of non-linear
models in time-series prediction and finance as stated in Weigend (1994), Kantz and
Schreiber (2004), Small (2005). Firstly, several limitations of linear models were pointed
out by Miller and Stone (1985) in daily cash flow forecasting such as interactions and
holiday effects. Additionally, statistical hypothesis such as normality and stationarity
are required by linear models to produce reliable results. On the other hand, alternative
approaches to discover the relationship between time-series observations are also avail-
able. In this sense, non-linear models allow to explore beyond the constraints imposed
by linear models through a much wider class of functions.
Although non-linear time series analysis is not as well established as its linear counter-
part (De Gooijer and Hyndman, 2006), works by Terasvirta (2006), Bradley and Jansen
(2004), Clements et al. (2004), Sarantis (2001), Conejo et al. (2005) constitute good
examples of its application to finance and economics. In this paper, we consider two
non-linear models such as radial basis functions and random forest models due to the
lack of attention of the research community. Next, we briefly describe our selection of
forecasters and provide details on the implementation of non-linear models.
7

3.1. Autoregressive model
A widespread linear model in time series data is the autoregressive (AR) process,
where predictions are based on a linear combination of previous observations (Box and
Jenkins, 1976). AR models for cash flow forecasting can be found in Gormley and Meade
(2007), Laukaitis (2008). On the other hand, as mentioned in Section 2, our cash flow
data have a bell-like shape but excess kurtosis. Hence, we follow the recommendations in
Gormley and Meade (2007) and use an extension of the Box-Cox transformation described
in Box and Cox (1964) to approximate our data to a Gaussian distribution by tuning a
parameter λ. Predictions are assessed using the following equation:
y(λ)t = β0 +
p∑i=1
βiy(λ)t−i + ε (1)
where y(λ) is the cash flow forecast at time t, [y(λ)t−1, y
(λ)t−2 · · · , y
(λ)t−p] are the p-previous
observations of a transformed time series, βi is the i -th estimation coefficient, and ε stands
for the prediction error. Superscript (λ) in both forecasts and previous observations
denotes data transformation. This transformation is reversible and, therefore, yt can be
derived from y(λ)t .
3.2. Regression model
An autoregressive model is only based on the previous observations of the time series
and misses possible patterns, if any, hidden in the data. When dealing with daily data,
these patterns refer to calendar variations such as holidays, day of the month or day of
the week. Trying to identify these patterns, here we consider a general regression model
based on different explanatory variables. Regression models have been used for cash
flow forecasting purposes in Stone and Wood (1977), Stone and Miller (1987), Miller and
Stone (1985). In this case, it is important to say that the ability of the modeler in the
search for the best explanatory variables plays a key role. A general regression model is
represented by the following equation:
yt =
n∑i=0
βixti + ε. (2)
In this general model (2) we relate yt, the value of the cash flow at time t to a linear
combination of explanatory variables xt1, xt2, . . . , xtn at the same time t, being βi the8

i -th regression coefficient, and ε the prediction error. From the general model (2), a
number of particular models can be derived for predictions depending on the different
explanatory variables considered. For the implementation of these models we use the lm
function in R.
3.3. Radial basis function model
Financial data are usually originated by complex systems that may include non-linear
processes. In order to capture non-linearity in the data, we also consider Radial Basis
Function (RBF) models as described in Weigend (1994), Broomhead and Lowe (1988).
To use an RBF model, we first partition the input space by applying the k-medoids
algorithm (Park and Jun, 2009) over the training set. Then a scalar Gaussian RBF φ(x)
is used for forecasting:
yt = b0 +
K∑k=1
bkφ(‖xt − ck‖) + ε (3)
where yt is the value of the target variable at time t, K is the total number of clusters,
bk is the coefficient associated to the k -th cluster, ck is the k -th cluster medoid, xt is the
input data point at time t, ‖ ‖ is the Euclidean distance and ε is the prediction error.
Finally, φ(x) is the following Gaussian function:
φ(x, α) = e−x2/αρk (4)
where α is a positive integer parameter and ρk is the mean distance between the elements
inside the k -th cluster. In this case, predictions are produced using our tentative set of
explanatory variables and general matrix functions in R.
Next, we provide an example of predictions obtained using RBF for the last 3 days
of data set 1 based on the previous 21 cash flow observations. Two parameters have to
be chosen to produce forecasts using RBF: the total number of clusters K, defining the
degree of partition of the input space and the parameter α, determining the contribution
of deviate points to the prediction. For the sole purpose of this example, we set K = 5
and α = 10. Then, we proceed as follows:
1. We create the input space (2714− 21)× 21 matrix X by embedding in each row 21
consecutive cash flows. Firstly, we firstly transform cash flows to y(λ)t , as explained
9

in Section 3.1. To avoid high values bias, we later standardize transformed cash
flows by demeaning and dividing by the standard deviation.
2. We create a column vector y of length 2693 with subsequent cash flows.
3. We select each cluster medoids ck from rows in X using the k-medoids algorithm.
4. We compute ρk as the mean Euclidean distance between the elements of the k-th
cluster to its medoid ck.
5. We compute the 2693 × 5 matrix Φ where each row contains distances computed
using the function φ(‖xt − ck‖) for each point in the input space to each cluster.
6. We obtain the column vector b of weights by solving b = (ΦTΦ)−1ΦTy using least
squares.
7. We produce a 3× 21 matrix X with the previous 21 observations prior to each of
the 3 cash flows to be predicted and a 3×6 matrix Φ where the first column is set to
1 and the rest of elements are distances computed using the function φ(‖xt − ck‖)
for each point in X to each cluster medoid.
8. We forecast by means of y = Φb, that has to be re-scaled by multiplying by the
standard deviation and adding the mean and, finally, λ-transformed.
Now, we are in a position to compare these forecasts to real values and to other
forecasts and compute predictive accuracy as we will see below.
3.4. Random forest model
Decision trees are non-linear models that split the input space in subsets based on
the value of a particular feature. On the other hand, an ensemble methodology is able
to construct a predictive model by integrating multiple trees in what is called a decision
forest (Dietterich, 2000). Regression forests are used for the non-linear regression of
dependent variables given independent inputs based on an ensemble of slightly different
trees. Particularly, random forests (RF) are ensembles of randomly trained decision trees
(Ho, 1995, 1998, Criminisi and Shotton, 2013). Recent examples of time series forecasting
using random forests can be found in Kumar and Thenmozhi (2006), Kane et al. (2014),
Mei et al. (2014), Zagorecki (2015).
We make predictions using the R package randomForest by Liaw and Wiener (2002)
which implements Breiman’s random forest algorithm for classification and regression10

(Breiman, 2001). In this paper, we limit ourselves to select three parameters: the number
(a) of randomly trained trees, the number (b) of variables randomly sampled as candidates
at each split, and the node size (c) or the minimum amount of observations in a terminal
node used to control overfitting.
For instance, assume we know there is a strong daily seasonality in our cash flow.
One possible way to assess how strong is this seasonality is to produce predictions using
two explanatory variables: Day-of-month and Day-of-week. Hence, we aim to create a
random forest model and predict the last 100 days of data set 1 based on these two
variables. An example on how to proceed is as follows:
1. Create a 2617 × 2 matrix X containing in each row the Day-of-month and the
Day-of-week of past cash flows.
2. Create a column vector y of length 2617 with the corresponding cash flows.
3. Create a model based on X and y, with a = 100 randomly trained trees, with b = 2
randomly sampled variables and node size c = 50.
4. Produce a 100 × 2 matrix X with the Day-of-month and the Day-of-week of last
100 cash flows of data set 1.
5. Input matrix X to the model to obtain the forecasts.
Now, we are in a position to assess the importance of each explanatory variable or to
test the quality of our predictions.
3.5. Seasonal interaction model
Miller and Stone (1985) proposed a method to daily cash flow forecasting by spreading
an estimated monthly total over the days of this time period. This distribution approach
requires the separation of net cash flow in components, at least, inflows and outflows,
that is a different case that the data set in our study. However, we rely on the Miller and
Stone (1985) model to forecast cash flow yt, ranging in t = 1, 2, . . . , T , based on seasonal
interactions as follows:
yt =
T∑j=1
δjIj,t + ε. (5)
where Ij,t, is a seasonal indicator (SI) that takes value one, when a given seasonal con-
dition holds, zero otherwise. For instance, we can define I1,t = 1, when the day t occurs11

on the first of January and Monday. To account for all possible combinations of work-
ing days and months, we initially consider a full set of 31 × 5 × 12 = 1860 different
seasonal indicators. To speed up computations, we estimate δj by averaging cash flow
grouped by day-of-month, day-of-week and month. When no data is available for esti-
mation purposes, we set δj = 0, and forecast using the estimated mean. Simplicity, lack
of estimation issues and account for interactions are the main advantages of this model.
4. Forecasting models’ comparison
In this section, we aim to evaluate the forecasting accuracy of the presented models
for comparison purposes. Alternative models may produce different predictions with
different accuracy. The comparison will allow us to determine our best-in-class forecaster
to be later used as the input to establish the best cash management policy available. More
precisely, we use time series cross-validation for different prediction horizons (h) from 1
up to 100 days ahead by comparing the mean square error ε(h) for different models:
ε(h) =
∑test(yt+h − yt+h)2∑test(y − yt+h)2
(6)
where h is the prediction horizon in days, yt+h is the prediction at time t+ h, yt+h
is the real observation at the time t+ h, and y is the the arithmetic mean of the real
observations on the training set. Note that the closer ε is to zero, the better the predictive
accuracy. If ε is close to one, the performance is similar to that of the mean as a naive
forecast. Values greater than one show that the forecaster has no predictive ability.
In Hyndman and Athanasopoulos (2013), two different time series cross-validation
approaches were suggested: one with a fixed origin for the training set, and one with a
rolling origin. Algorithm 1 implements these two cross-validation methods.
12

Algorithm 1: Time series cross validation algorithm
1 Input: Cash flow data set of T observations, FixedOrigin, minimum number g of
observations to forecast and prediction horizon h;
2 Output: Forecast accuracy for different prediction horizons;
3 for i = 1, 2, . . . , T − g − h+ 1 do
4 Select the observation at time g + h+ i− 1 for the test set;
5 if FixedOrigin = True then
6 Estimate the model with observations at times 1, 2, . . . , g + i− 1;
7 else
8 Estimate the model with observations at times i, i+ 1, . . . , g + i− 1;
9 end
10 Compute the h-step error on the forecast for time g + h+ i− 1;
11 end
12 Compute ε(h) based on the errors obtained;
If the binary variable FixedOrigin is set to True, the training set is formed by all the
observations that occurred prior to the first observation that forms the test set (Method
1). We can get rid of the oldest observations by setting FixedOrigin to False (Method
2) and considering only the g most recent values (e.g., the last two or three years) by
applying a sliding window of observations. In both methods we assume that the minimum
number of g observations required to produce a reliable forecast is the first 65% of the
data. In our experiments, high values of g produced almost no difference between Method
1 and Method 2. Using Method 2, smaller values of g in steps of 250, equivalent to 1
year of observations, were also tried with worse results. Because of that, here we only
present results for Method 1.
For model selection, we follow an automatic selection method along the lines of
Doornik (2008), Hyndman and Athanasopoulos (2013), Hendry and Doornik (2014).
More precisely, we perform a backwards stepwise regression starting with a model con-
taining all potential predictors and removing one predictor at a time. We select the
model with the minimum average error ε, for prediction horizons ranging in 1, 2, . . . , 100,
computed using Algorithm 1. For statistically significant differences in performance be-
13

tween models, the U Mann-Whitney test for independent samples with a 95% confidence
interval is used (Hollander et al., 2013). In addition, when parameters selection is nec-
essary, an evaluation of the coefficient of determination, R2, over a training set with the
oldest 65% of the observations is used to choose the best value for each of the param-
eters. The final model selection, summarized in Table 2, shows that the day-of-month
and the day-of-week variables present the best forecasting ability. However, the number
of coefficients that are relevant in the case of autoregression and regression using dummy
variables are different for data set 1 and 2.
Table 2: Model selection according to average error ratio (ε) for horizons up to 100 days.
Model Input variables Parameters Data Set 1 Parameters Data Set 2
AR Past values 12 coefficients 15 coefficients
REG DOM, DOW 29 coefficients 10 coefficients
RBF DOM, DOW K = 35, α = 10 K = 10, α = 10
RF DOM, DOW a = 20, b = 11, c = 50 a = 20, b = 11, c = 50
SI DOM-DOW Indicators 155 coefficients 155 coefficients
The relative performance for different prediction horizons using models from Table 2
is plotted in Figures 2 and 3, and results for all data sets using the previously selected
models are shown in Table 3. Autoregressive models performed no better than the mean
as a naive forecaster. A statistically significant difference in average forecasting accuracy
was found in favor of the RF model for data sets 1 and 4, whereas it was almost equal
to the SI model in the case of data set 3. However, the performance of the regression
model was the best in data set 2, suggesting a linear behavior. Interestingly, RBF were
less affected than the rest of models by the introduction of outliers in data sets 5 and
6. The poor performance of the SI model on data sets 2 and 6 may be caused by the
smaller number of the observations than in the rest of data sets. Summarizing, it is clear
that forecasting accuracy of the autoregressive model can be improved by considering
alternative models. Next, we measure the savings produced by a better prediction.
5. Does a better forecast produce a better cash-management policy?
Gormley and Meade (2007) proposed a Dynamic Simple Policy (DSP) to demonstrate14

0 20 40 60 80 100
0.4
0.5
0.6
0.7
0.8
0.9
1.0
Prediction horizon
Mea
n S
quar
e E
rror
(ε)
● ● ●● ● ● ● ● ● ● ● ● ● ●
● ● ●
●
AutoregressiveRegressionRadial Basis FunctionRandom ForestSeasonal Indicator
Figure 2: Mean square error comparison for different predictive models (Data set 1).
0 20 40 60 80 100
0.80
0.85
0.90
0.95
1.00
1.05
1.10
Prediction horizon
Mea
n S
quar
e E
rror
(ε)
● ●
●● ● ●
●●
● ● ●●
● ● ●●
●
●
AutoregressiveRegressionRadial Basis FunctionRandom ForestSeasonal Indicator
Figure 3: Mean square error comparison for different predictive models (Data set 2).
the utility of cash flow forecasts in the management of corporate cash balances. They
proposed the use of an autoregressive model as the main input to their model. However,
gains in forecast accuracy over a naive mean model were scant. Gormley and Meade
expected that savings obtained using a non-naive forecasting model would increase if
there were more systematic variation in the cash flow and, consequently, higher forecast
accuracy. In the previous section, we showed that a better cash flow prediction can
be obtained by using different forecast models. In this section, we verify that a better
15

Table 3: Average predictive error for prediction horizons from 1 to 100 days using Method 1. Standard
deviations are shown in parenthesis and best values are bold. Non-significant different models to the
best in each row with a 95% confidence interval are marked with ?.
Set AR REG RBF RF SI
1 0,997 (0,008) 0,705 (0,007) 0,765 (0,005) 0,678(0,010) 0.690 (0.008)
2 0,997 (0,008) 0,925 (0,008) 0,934 (0,009) 0,952 (0,008) 1,057 (0,015)
3 0,997 (0,009) 0,696 (0,007) 0.786 (0.019) 0,661 (0,023) 0.667?(0.023)
4 0,998 (0,006) 0,766 (0,008) 0.785 (0.004) 0,754 (0,010) 0.785 (0.012)
5 1,000 (0,000) 0,920 (0,004) 0.859 (0.070) 0,914 (0,006) 0.942 (0.004)
6 1,001 (0,002) 1,003 (0,003) 0.984 (0.004) 1.003 (0.004) 1.217 (0.020)
prediction produces a better policy. As a consequence, we find that the savings produced
by a better forecasting model are significantly higher than those obtained by a naive
forecasting model.
Here, we exploit a simple policy equivalent to that of Gormley and Meade using
the best forecasters as detailed in Section 4 and compare to the results obtained by a
constant mean forecast. This control limit framework is limited to cash balance holding
and transaction costs. Other major benefits derived from forecasting accuracy such as
short-term investment improvement and prearranged credit lines cost savings are not
considered in this paper. Better forecasting accuracy allow companies to invest in less
marketable securities but with higher returns if held to maturity. In addition, companies
relying on credit lines can reduce the amount of prearranged credit if better forecasts
are available. A good example of cost-benefit analysis considering short-term investment
and borrowing costs can be found in Stone (1973).
On the other hand, since the forecast accuracy of the autoregressive model almost
equals the mean forecast accuracy (Table 3), the comparison to the mean is equivalent
to the comparison to the autoregressive model. In what follows, we firstly introduce our
empirical settings; secondly, we show empirically that forecasting accuracy leads to cost
savings in the corporate cash management problem using a simple policy; and finally,
we analyze potential cost savings of improving predictive accuracy of daily cash flow
forecasts and a simple policy.
16

5.1. Empirical settings
The corporate cash management problem can be approached from a stochastic point
of view by allowing cash balances to wander between two limits: the lower (D) and
the upper balance limit (V ). When the cash balance reaches any of these limits a cash
transfer is made to return to the corresponding rebalance level (d, v). A model of this
kind using daily forecasts was proposed by Gormley and Meade (2007) as a trade-off
between transaction and holding costs as follows: q is the holding cost per money unit of
positive balances at the end of the day; u is the shortage cost per money unit of negative
balances at the end of the day; γ+0 is the fixed cost of transfer into account; γ−0 is the
fixed cost of transfer from account; γ+1 is the variable cost of transfer into account; and
γ−1 is the variable cost of transfer from account.
Recall from section 2 that we are dealing with a real business problem. Hence, we
focus on current costs charged by banks to industrial companies in Spain. Current bank
practices tend to charge a fixed cost for transfers between e1 and e5 and no variable cost
so that we set γ+1 = 0 and γ−1 = 0. The shortage cost (u) per money unit of a negative
cash balance is around 30% which represents a high penalty for negative cash balances.
Finally, the holding cost (q) per money unit of a positive cash balance is an opportunity
cost of returns not obtained from alternative investments. Since this is not an actual
cost but an opportunity cost based on judgmental criteria, we set a range between 3%
p.a.1 and 20% p.a. based on the concept of weighted average cost of capital. This wide
range allow us to consider not only the cost of debt but also the cost of equity as an
estimate for the holding cost. We firstly try 20 different cost structures considered as
the most likely scenario under current costs in Spain, denoted by (1) in Table 4. We
also consider two additional scenarios, denoted by (2) and (3), to evaluate the effect of
changes in particular costs. The second scenario tests the variation of the shortage cost
(u) and the third one considers the introduction of variable transfer costs (γ1).
In our experiments, parameter selection of the cash management model is performed
under a business perspective. In Gormley and Meade (2007) the policy parameter values
D, d, v, V were chosen to minimize the expected cost over horizon T using a genetic
algorithm (Chelouah and Siarry, 2000). Here, since the focus is placed on the comparison
1Per annum.
17
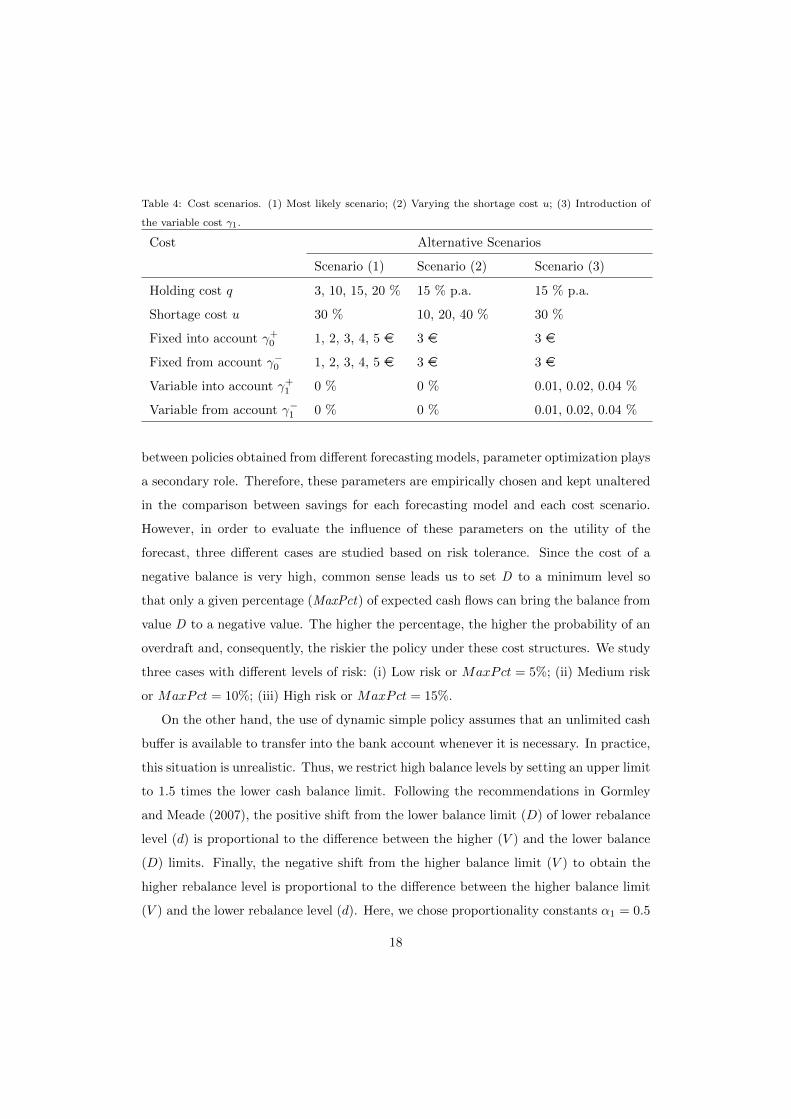
Table 4: Cost scenarios. (1) Most likely scenario; (2) Varying the shortage cost u; (3) Introduction of
the variable cost γ1.
Cost Alternative Scenarios
Scenario (1) Scenario (2) Scenario (3)
Holding cost q 3, 10, 15, 20 % 15 % p.a. 15 % p.a.
Shortage cost u 30 % 10, 20, 40 % 30 %
Fixed into account γ+0 1, 2, 3, 4, 5 e 3 e 3 e
Fixed from account γ−0 1, 2, 3, 4, 5 e 3 e 3 e
Variable into account γ+1 0 % 0 % 0.01, 0.02, 0.04 %
Variable from account γ−1 0 % 0 % 0.01, 0.02, 0.04 %
between policies obtained from different forecasting models, parameter optimization plays
a secondary role. Therefore, these parameters are empirically chosen and kept unaltered
in the comparison between savings for each forecasting model and each cost scenario.
However, in order to evaluate the influence of these parameters on the utility of the
forecast, three different cases are studied based on risk tolerance. Since the cost of a
negative balance is very high, common sense leads us to set D to a minimum level so
that only a given percentage (MaxPct) of expected cash flows can bring the balance from
value D to a negative value. The higher the percentage, the higher the probability of an
overdraft and, consequently, the riskier the policy under these cost structures. We study
three cases with different levels of risk: (i) Low risk or MaxPct = 5%; (ii) Medium risk
or MaxPct = 10%; (iii) High risk or MaxPct = 15%.
On the other hand, the use of dynamic simple policy assumes that an unlimited cash
buffer is available to transfer into the bank account whenever it is necessary. In practice,
this situation is unrealistic. Thus, we restrict high balance levels by setting an upper limit
to 1.5 times the lower cash balance limit. Following the recommendations in Gormley
and Meade (2007), the positive shift from the lower balance limit (D) of lower rebalance
level (d) is proportional to the difference between the higher (V ) and the lower balance
(D) limits. Finally, the negative shift from the higher balance limit (V ) to obtain the
higher rebalance level is proportional to the difference between the higher balance limit
(V ) and the lower rebalance level (d). Here, we chose proportionality constants α1 = 0.5
18

and α2 = 0.5 to produce an even distance between policy parameters. The entire analysis
would remain the same when varying this setting. As a summary, parameters selection
is done according to:
• D = |oth| where oth is the N ·MaxPct-th element of vector ot of ascending ordered
values of cash flow being N the total number of observations.
• V = 1.5D, then V −D =D
2
• d = D + α1(V −D) with α1 = 0.5
• v = V − α2(V − d) with α2 = 0.5.
Predicted cash flows using different forecasters are used to compare the effect on the
total cost over different prediction horizons (h) from 1 up to 100 days ahead. We set g to
the minimum number of observations required to estimate the model that is equivalent
to 65% of the data set. We proceed as detailed in Algorithm 2.
Algorithm 2: Comparison algorithm
1 Input:Cash flow data set of T observations, g, h,MaxPct, and a forecaster;
2 Output:Average cost difference between a forecaster and the mean as a forecast;
3 for i = 1, 2, . . . , T − g − h+ 1 do
4 Estimate the model with observations at times 1, 2, . . . , g + i− 1;
5 Predict for times g + i up to g + h+ i using the forecaster;
6 Predict for times g + i up to g + h+ i using the mean forecaster;
7 for j = 1, 2, . . ., Number of cost structures do
8 Compute cost for the ith forecast when using the j th structure;
9 Compute cost for the ith mean forecast and the j th structure;
10 end
11 end
12 Compute average cost for each cost structure using the forecaster;
13 Compute average cost for each cost structure using the mean forecaster;
14 Compute difference between average cost of the mean and the forecaster;
19

5.2. Impact of predictive accuracy on cost savings
Cost savings are computed as the daily average cost differences between the naive
forecast and the best-in-class forecaster for each of the data sets (Table 5). Recall that
this comparison to the mean is equivalent to the comparison to the autoregressive model.
From these results, we can say that, in general, an increase in forecast accuracy leads to
significant cost savings using a simple policy. A better forecasting model produces higher
savings for either conservative or riskier policies. The effect of forecasting accuracy in
daily costs dramatically rises when the policy bounds are reduced as a consequence of a
riskier policy. In these cases, forecasting accuracy is much more important in reducing
daily cost due to the risk of an overdraft. As expected, cost reductions for the data set
2 are smaller but still significant due to less predictive accuracy.
Table 5: Average daily saving for different levels of risk and the most likely scenario. RF=Random
Forest; REG=Regression; RBF=Radial Basis function; u = shortage cost, γ1 = variable transaction
cost.
Data set Best-in-class Scenario Low Risk Medium Risk High Risk
1 RF Most likely 183 (71%) 1432 (74%) 2039 (55%)
1 RF Varying u 143 (55%) 1115 (72%) 1587 (54%)
1 RF Introducing γ1 184 (63%) 1434 (73%) 2040 (55%)
2 REG Most likely 85 (27%) 363 (34%) 448 (25%)
2 REG Varying u 66 (25%) 282 (33%) 349 (25%)
2 REG Introducing γ1 84 (26%) 362 (33%) 448 (25%)
3 RF Most likely 181 (71%) 1422 (74%) 2025 (55%)
4 RF Most likely 207 (57%) 1437 (74%) 2156 (53%)
5 RBF Most likely 455 (25%) 1953 (49%) 3292 (55%)
6 RBF Most likely -11 (7%) 173 (19%) 174 (13%)
A deeper insight on the different scenarios shows that changes in cost parameters
have a reduced impact on cost savings. A scenario of particular importance nowadays is
that of low holding costs such as 3% p.a. due to current low interest rates. Our results
show that, even in such a scenario, 88%, 75% and 55% savings for the three levels of risk
can be obtained in data set 1 using random forests forecasts. Moreover, changes in the
20
variability of cash flow data, studied here by introducing less (data set 3) or more variance
(data set 4), produced no major changes. However the effect of random shocks in the
cash flow data (data sets 5 and 6), reduced cost savings due to the higher uncertainty of
the cash flow data.
5.3. What if we improve predictive accuracy? Analyzing potential cost savings
Our best-in-class forecasting models, i.e., regression, radial basis functions and ran-
dom forests models, are attempts to reduce uncertainty in predicting daily cash flow.
They represent special cases in which improving predictive accuracy resulted in increas-
ing cost savings over a naive forecast. However, cash managers may be interested in
determining how much savings can be achieved by any extra effort in improving pre-
dictive accuracy. Since enhancing any forecasting model has a cost in terms of both
time and money, it is important to know if this cost is offset by the savings obtained
using a better forecasting. We can estimate savings associated to predictive accuracy by
obtaining a number of synthetic predictions and evaluate the corresponding policy costs.
Daellenbach (1974) and da Costa Moraes and Nagano (2014) synthesized cash flow
data for simulation purposes from normal distributions. Here, from a given cash flow
time series (yt+h), a new time series (yt+h) is synthesized by adding a random normal
term of mean zero and a variable standard deviation (σ) using the following equation:
yt+h = yt+h +N (0, σ). (7)
Increasing the value of σ, a set of time series with a decreasing degree of similarity
to the original time series can be obtained. This is equivalent to generating a set of
synthetic predictions with controlled predictive accuracy that can be evaluated in terms
of mean square error ratio ε(h) for different prediction horizons using equation (6). We
obtain synthetic predictions covering a range from ε = 0 to values greater than 1. Here
ε denotes the average of ε(h) for prediction horizons up to 100 days on a test set formed
by the last 35% of the observations of data sets 1 and 2. Later, savings for each of these
synthetic forecasts are obtained following Algorithm 2 but using the synthetic forecasts
previously generated rather than estimating and predicting.
Results from this simulation for data sets 1 and 2 and three different levels of risk
are shown in Figures 4 and 5. As a reference, the vertical lines locate savings achieved21

●
●
●
●
●
●
●
●
●
●
●
●
●
●
0.0 0.2 0.4 0.6 0.8 1.0 1.2 1.4
−50
050
100
Average error ε
Sav
ings
(%
)
●
●
●
S−HighS−MediumS−LowRF−HighRF−MediumRF−Low
Figure 4: Savings for different predictive errors and levels of risk for data set 1 in the most likely scenario.
S=Synthetic forecasts, RF=Random Forest.
● ●
●
●
●
●
●
●
●
●
0.0 0.2 0.4 0.6 0.8 1.0 1.2
−50
050
100
Average error ε
Sav
ings
(%
)
●
●
●
S−HighS−MediumS−LowREG−HighREG−MediumREG−Low
Figure 5: Savings for different predictive errors and levels of risk for data set 2 in the most likely scenario.
S=Synthetic forecasts, RBF=Radial Basis Function.
by the best-in-class forecaster for each of the examined levels of risk. For example, using
random forests for data Set 1, a value of ε = 0.68 (from Table 4) was obtained which
produced savings of 71, 74 and 55% (from Table 5) for the three levels of risk considered.
As expected, improving prediction accuracy, i.e., reducing ε, leads to an important
increase in cost savings up to 100% in the case of a perfect prediction. Efforts in increasing
predictive accuracy are notably rewarded. However, the behavior is different depending
22

on the level of risk chosen by the company.
1. Low risk: the effect of improving predictive accuracy tends to a stable point where
any further effort yields no additional saving. In spite of the considerable percentage
saved, it seems that improvement potential in predictive accuracy is limited when
the risk is low.
2. Medium risk: the effect of limited cost savings when improving predictive accuracy
is also present but to a lesser extent.
3. High risk: the behavior is almost linear in the considered ε interval.
It is interesting to point out that the relationship is almost linear in most of the
range of the average error ε for each of the three levels of risk. This fact should encour-
age practitioners to work hard to obtain a better prediction because they can expect a
proportional reward in terms of cost savings. However, in the case of our best-in-class
forecasting model using random forests and data set 1, an error ε of 0.68 (from Table 2)
places the savings in the highest value likely to be obtained for the low level of risk. Any
effort in improving predictive accuracy will be useless. This behavior is confirmed by the
fact that a perfect prediction was unable to achieve a 100% difference in cost savings.
Summarizing, we propose a new and more comprehensive methodology (shown in
Figure 6) for the practitioner, i.e., the cash manager, based on the effect of predictive
accuracy on cash management cost using daily cash flow forecasts and a simple policy.
In order to allow different models to capture patterns, cash managers should consider
an additional previous step of feature engineering to obtain a series of extra features.
They can also adopt a wider modeling approach that allow them to compare a set of
forecasters in terms of forecasting accuracy. At this point, cash managers can easily
generate a number of synthetic predictions to cover a wide range of different predictive
accuracy by tuning a parameter. These synthetic predictions, and those obtained using
our best-in-class forecasters from Table 3, are tested in their ability to reduce the cost
of the policies by using a simple policy. This step results in a graphical estimation on
how much cost savings can be achieved by improving predictive accuracy of our selected
forecasters. If estimated savings are greater than the cost of improving the accuracy of
the forecasting models, a new modeling process is worth undertaking.
23

Cash Flow
data set
Modeling
(Section 3)
Multiple accuracy
analysis (Section 4)
Simple Policy
Forecasting
model comparison
(Section 5)
Feature
engineering
Extra features
Accuracy
analysis
(Section 5)
Synthetic
predictions
Savings>Improving
PA cost?
(end)
Set of forecasters
Set of forecasts
Prediction costsSimulated costs
yes
no
Figure 6: Potential cost saving analysis methodology (PA=Predictive Accuracy)
24

6. Conclusions and future work
From the above-described results, we derive two main findings. First, assessing pre-
dictive accuracy is a must in the context of corporate cash management, specially when
employing daily forecasts as an input to a cash flow management model. Indeed, we
empirically find that cost savings are highly sensitive to improvements on prediction ac-
curacy when using a simple policy, and hence major savings may stem from accurate
predictions. Second, from a cost sensitive perspective, cash managers may consider our
methodology to decide whether improving the predictive accuracy at hand is financially
worthy. These two findings, which we further dissect next, are meant to yield benefits
for cash managers.
On the impact of predictive accuracy on cost savings. Gormley and Meade (2007)
hypothesized that the more accurate the cash flow forecasting accuracy, the larger the
cost savings expected. Here, for the first time, we have empirically confirmed such
hypothesis. Furthermore, we have analyzed the impact of predictive accuracy on average
daily cost savings when considering a variety of cost structures (of real-world bank finance
conditions) and cash flow policy parameters. From our analysis we have learned that:
• Predictive accuracy is strongly correlated with cost savings when using daily fore-
casts in cash management models. Thus, cost savings were highly sensitive to im-
provements on prediction accuracy when using a simple policy and two real-world
cash flow data sets.
• The riskier the cash management policy, the higher the average daily cost reduction
in cash.
• The realistic cost structures considered in the most likely scenario have little influ-
ence on cost savings obtained by the forecasting models.
What if predictive accuracy increases? Analyzing potential savings. Cash
managers may wonder if efforts on improving forecasting accuracy are expected to be
proportionally rewarded by cost savings. Along this direction, we proposed a method
for estimating the cost savings potentially delivered by improving predictive accuracy.
Independently of the predictive accuracy of the forecaster available to a cash manager,
25

our results help her estimate the cost savings that she might expect. Moreover, even if
the cash manager does not count on any forecaster, she can estimate the cost savings
that she currently misses. Overall, we learned that different risk levels yield different
estimation results so that:
• When assuming low risk, cost savings are limited and further efforts in enhancing
predictive accuracy are expected to be useless, in terms of both time and money,
when a particular point in predictive accuracy is reached; and
• The higher the risk a cash manager assumes, the higher the expected reward when
improving predictive accuracy.
The analysis of the relationship between predictive accuracy and cost savings leads to
confirm the importance of better forecasting models when predictions are used as the
main input to cash management models. Some additional intuition can be derived in
the sense that this behavior may be caused by a number of reasons: (i) whenever it
is possible to reduce uncertainty about the future, better decisions can be made; (ii)
improving predictive accuracy is closely linked to discover patterns and an appropriate
response to these patterns is necessarily useful; (iii) chances are that cash management
models using forecasts as the main input do not work well with low quality forecasts;
and (iv) overall accuracy could be improved by using different forecasting techniques for
each component when cash flow component separation is available. All of them highlight
again the utility of forecasts in cash management.
To end up, besides the above-mentioned benefits, it is important to note that there
are additional benefits that companies can derive from improving forecasting accuracy
such as short-term investment improvement and credit lines savings. Moreover, since our
analysis can be extended to a multiple currency framework, larger multinational compa-
nies can also benefit the results presented here. Alternative treatments of outliers such as
impulse indicator saturation models represent an interesting future line of work. Finally,
the task of building forecasting models helped us also learn that daily seasonality influ-
enced forecasting. However, future work is in place to search for a more informative set
of features in the corporate cash management problem. In this sense, feature engineering
is meant to play a key role to help improve predictive accuracy and ultimately produce
26
cost savings in cash management.
Acknowledgments
Work partially funded by projects Collectiveware TIN2015-66863-C2-1-R (MINECO/
FEDER) and 2014 SGR 118.
References
Baumol, W. J. (1952). The transactions demand for cash: An inventory theoretic approach. The
Quarterly Journal of Economics, pages 545–556.
Black, F. and Scholes, M. (1973). The pricing of options and corporate liabilities. The journal of political
economy, pages 637–654.
Box, G. E. and Cox, D. R. (1964). An analysis of transformations. Journal of the Royal Statistical
Society. Series B (Methodological), pages 211–252.
Box, G. E. and Jenkins, G. M. (1976). Time series analysis: forecasting and control, revised ed. Holden-
Day.
Bradley, M. D. and Jansen, D. W. (2004). Forecasting with a nonlinear dynamic model of stock returns
and industrial production. International Journal of Forecasting, 20(2):321–342.
Breiman, L. (2001). Random forests. Machine learning, 45(1):5–32.
Broomhead, D. and Lowe, D. (1988). Multivariable functional interpolation and adaptive networks.
Complex Systems, 2:321–355.
Chelouah, R. and Siarry, P. (2000). A continuous genetic algorithm designed for the global optimization
of multimodal functions. Journal of Heuristics, 6(2):191–213.
Clements, M. P., Franses, P. H., and Swanson, N. R. (2004). Forecasting economic and financial time-
series with non-linear models. International Journal of Forecasting, 20(2):169–183.
Conejo, A. J., Contreras, J., Espınola, R., and Plazas, M. A. (2005). Forecasting electricity prices for a
day-ahead pool-based electric energy market. International Journal of Forecasting, 21(3):435–462.
Criminisi, A. and Shotton, J. (2013). Decision forests for computer vision and medical image analysis.
Springer.
da Costa Moraes, M. B. and Nagano, M. S. (2014). Evolutionary models in cash management policies
with multiple assets. Economic Modelling, 39:1–7.
da Costa Moraes, M. B., Nagano, M. S., and Sobreiro, V. A. (2015). Stochastic cash flow management
models: A literature review since the 1980s. Decision Models in Engineering and Management, pages
11–28.
Daellenbach, H. G. (1974). Are cash management optimization models worthwhile? Journal of Financial
and Quantitative Analysis, 9(04):607–626.
De Gooijer, J. G. and Hyndman, R. J. (2006). 25 years of time series forecasting. International journal
of forecasting, 22(3):443–473.
27

Dietterich, T. G. (2000). Ensemble methods in machine learning. In Multiple classifier systems, pages
1–15. Springer.
Doornik, J. A. (2008). Encompassing and automatic model selection. Oxford Bulletin of Economics and
Statistics, 70(s1):915–925.
Eppen, G. D. and Fama, E. F. (1969). Cash balance and simple dynamic portfolio problems with
proportional costs. International Economic Review, 10(2):119–133.
Fabozzi, F. J. and Masonson, L. N. (1985). Corporate Cash Management: Techniques and Analysis.
Irwin Professional Publishing.
Girgis, N. M. (1968). Optimal cash balance levels. Management Science, 15(3):130–140.
Gormley, F. M. and Meade, N. (2007). The utility of cash flow forecasts in the management of corporate
cash balances. European journal of operational research, 182(2):923–935.
Gregory, G. (1976). Cash flow models: a review. Omega, 4(6):643–656.
Hendry, D. F. and Doornik, J. A. (2014). Empirical model discovery and theory evaluation: automatic
selection methods in econometrics. MIT Press.
Ho, T. K. (1995). Random decision forests. In Document Analysis and Recognition, 1995., Proceedings
of the Third International Conference on, volume 1, pages 278–282. IEEE.
Ho, T. K. (1998). The random subspace method for constructing decision forests. Pattern Analysis and
Machine Intelligence, IEEE Transactions on, 20(8):832–844.
Hollander, M., Wolfe, D. A., and Chicken, E. (2013). Nonparametric statistical methods. John Wiley &
Sons.
Hyndman, R. and Athanasopoulos, G. (2013). Forecasting: principles and practice. http://otexts.
org/fpp/. Last accessed: 2015-05-01.
Hyndman, R. J. (2016). forecast: Forecasting functions for time series and linear models. R package
version 7.1.
Kane, M. J., Price, N., Scotch, M., and Rabinowitz, P. (2014). Comparison of arima and random forest
time series models for prediction of avian influenza h5n1 outbreaks. BMC bioinformatics, 15(1):1.
Kantz, H. and Schreiber, T. (2004). Nonlinear time series analysis, volume 7. Cambridge University
Press.
Kumar, M. and Thenmozhi, M. (2006). Forecasting stock index movement: A comparison of support
vector machines and random forest. In Indian Institute of Capital Markets 9th Capital Markets
Conference Paper.
Laukaitis, A. (2008). Functional data analysis for cash flow and transactions intensity continuous-time
prediction using hilbert-valued autoregressive processes. European Journal of Operational Research,
185(3):1607–1614.
Liaw, A. and Wiener, M. (2002). Classification and regression by random forest. R News, 2(3):18–22.
Maier, S. F., Robinson, D. W., and Vander Weide, J. H. (1981). A short-term disbursement forecasting
model. Financial Management, pages 9–20.
Mei, J., He, D., Harley, R., Habetler, T., and Qu, G. (2014). A random forest method for real-time price
forecasting in new york electricity market. In PES General Meeting— Conference & Exposition, 2014
28

IEEE, pages 1–5. IEEE.
Miller, M. H. and Orr, D. (1966). A model of the demand for money by firms. The Quarterly journal
of economics, pages 413–435.
Miller, T. W. and Stone, B. K. (1985). Daily cash forecasting and seasonal resolution: Alternative
models and techniques for using the distribution approach. Journal of Financial and Quantitative
Analysis, 20(03):335–351.
Park, H.-S. and Jun, C.-H. (2009). A simple and fast algorithm for k-medoids clustering. Expert Systems
with Applications, 36(2):3336–3341.
Penttinen, M. J. (1991). Myopic and stationary solutions for stochastic cash balance problems. European
journal of operational research, 52(2):155–166.
Sarantis, N. (2001). Nonlinearities, cyclical behaviour and predictability in stock markets: international
evidence. International Journal of Forecasting, 17(3):459–482.
Small, M. (2005). Applied nonlinear time series analysis: applications in physics, physiology and finance,
volume 52. World Scientific.
Srinivasan, V. and Kim, Y. H. (1986). Deterministic cash flow management: state of the art and research
directions. Omega, 14(2):145–166.
Stone, B. K. (1972). The use of forecasts and smoothing in control-limit models for cash management.
Financial Management, pages 72–84.
Stone, B. K. (1973). Cash planning and credit-line determination with a financial statement simulator:
A case report on short-term financial planning. Journal of Financial and Quantitative Analysis,
8(05):711–729.
Stone, B. K. (1976). The payments-pattern approach to the forecasting and control of accounts receivable.
Financial Management, pages 65–82.
Stone, B. K. and Miller, T. W. (1981). Daily cash forecasting: a structuring framework. Journal of
Cash Management, 1:35–50.
Stone, B. K. and Miller, T. W. (1987). Daily cash forecasting with multiplicative models of cash flow
patterns. Financial Management, pages 45–54.
Stone, B. K. and Wood, R. A. (1977). Daily cash forecasting: a simple method for implementing the
distribution approach. Financial Management, pages 40–50.
Terasvirta, T. (2006). Forecasting economic variables with nonlinear models. Handbook of economic
forecasting, 1:413–457.
Weigend, A. S. (1994). Time series prediction: forecasting the future and understanding the past.
Addison-Wesley.
Zagorecki, A. (2015). Prediction of methane outbreaks in coal mines from multivariate time series using
random forest. In Rough Sets, Fuzzy Sets, Data Mining, and Granular Computing, pages 494–500.
Springer.
29