Embed Size (px)
Citation preview

Employment through Flexibility –Squaring the Circle?
EUROPEAN FOUNDATIONfor the Improvement of Living and Working Conditions
Employment through Flexibility –Squaring the Circle?
The 1990s have seen a strong revival of the debate on work organisation and how to achievethe optimal input from the workforce, in particular, through direct employee participation.Within the European Union, the European Commission, the social partners and governments ofthe Member States began an intensive debate on the need for structural adjustment, whichbecame increasingly urgent as Europe slipped into its worst post-war recession.
The Foundation’s EPOC Project (Employee Direct Participation in Organisational Change) has,over the past few years, examined the various European experiments in direct participation.The earlier research in this project identified an information gap in what we know aboutpractices in European workplaces. What is the extent of direct participation? What form doesit take? Why does management introduce direct participation? What are the economic andsocial effects? To what degree can employees influence the organisation of work or controltheir working environment? What are the sectoral differences?
To answer these and other questions the Foundation undertook a postal survey of Europeanworkplaces during the summer and autumn of 1996, and the results of this survey werepublished in 1997. The survey covered all business sectors and included a range of questionson the effects of direct participation on employment levels and workplace flexibility. It alsocovered different approaches to innovation in the establishments surveyed.
This book is the result of the analysis of the data in the EPOC survey pertaining to the effectsof direct participation on employment levels, and how these relate to aspects of workplaceflexibility such as downsizing, part-time work or the consultation of workers, as well as to thelevel of product and process innovation in European enterprises.
5 4 SX
-21-99-440-EN-C
Price (excluding VAT) in Luxembourg: EUR 22
OFFICE FOR OFFICIAL PUBLICATIONS OFTHE EUROPEAN COMMUNITIES
L- 2985 LUXEMBOURG 9 789282 865620
ISBN 92-828-6562-2
Findings fromthe EPOC Survey
Emp
loym
ent th
rou
gh
Flexibility – Sq
uarin
g th
e Circle? – Fin
din
gs fro
m th
e EPOC
Survey

Findings from the EPOC Survey
The European Foundation for the Improvement of Living and Working Conditions is anautonomous body of the European Union, created to assist the formulation of future policy onsocial and work-related matters. Further information can be found at the Foundation Web site athttp://www.eurofound.ie/
Contributors
Keith Sisson (Editor), IRRU, Warwick Business School; Dieter Fröhlich, ISO-Institut, Cologne;Fred Huijgen, Nijmegen Business School; Hubert Krieger, European Foundation for theImprovement of Living and Working Conditions; Kevin O'Kelly, European Foundation for theImprovement of Living and Working Conditions, and James Wickham, Trinity College, Dublin.

Findings from the EPOC SurveyEmployment through Flexibility
– Squaring the Circle?
EUROPEAN FOUNDATIONfor the Improvement of Living and Working Conditions
Wyattville Road, Loughlinstown, Co. Dublin, Ireland. Tel: +353 1 204 3100 Fax: +353 1 282 6456 E-mail: [email protected]
Prepared by the EPOC Research Group

Cataloguing data can be found at the end of this publication
Luxembourg: Office for Official Publications of the European Communities, 1999
ISBN 92-828-6562-2
© European Foundation for the Improvement of Living and Working Conditions, 1999
For rights of translation or reproduction, applications should be made to the Director, EuropeanFoundation for the Improvement of Living and Working Conditions, Wyattville Road, Loughlinstown,Co. Dublin, Ireland.
Printed in Ireland
The paper used in this publication is chlorine free and comes from managed forests in Northern Europe. For every tree felled, at least one new tree is planted.

In recent years there has been a growing interest in new ways of organising workto make European enterprises more competitive in global markets. As part ofthis new interest in organisational efficiency, direct participation arrangementssuch as total quality management, quality circles, team work and re-engineeringhave gained in popularity. The indications are that this new direct approach toemployee involvement is of benefit not only to the organisation, but also to theworkforce. For the enterprise, there is the more efficient use of human resourcesand greater flexibility in its operations; for workers, the possibility of moremeaningful jobs and a greater input into workplace issues which directly affecttheir working lives. In showing a greater interest in direct participation, unionsand employers in Europe are seeking to develop a social model which is uniqueto Europe, in contrast with the emergence of workplace models in other tradingblocks.
In order to address these developments, the European Foundation for theImprovement of Living and Working Conditions initiated the EPOC Project(Employee direct Participation in Organisational Change). The objective of thisproject was to research the trend towards more direct participation in Europeanenterprises, and to provide information which would feed into the debatebetween the social partners and the European Union institutions on the mostappropriate form of work organisation for Europe.
So far, the Foundation has produced six publications as part of this ongoingresearch project. The first report presented the conceptual framework of theEPOC Project. The second publication was based on an analysis of research
v
Foreword

which looked at the attitudes and understanding of the social partners in EUMember States, and the extent to which the application of direct participationcan influence the humanisation of work, while at the same time increasingprofitability.
The third report reviewed empirical research into direct participation in Europe,the United States and Japan and gives an overview of the existing knowledge onthe topic. It examines the extent of the Japanese ‘Toyota’ model and contrasts itwith the Scandinavian ‘Volvo’ model of work organisation; and it has the mostextensive literature review on this subject yet published in Europe.
Having carried out these research projects the Foundation paused to take stock,and a summary of the results so far was published in a booklet in 1996 whichdrew together all the knowledge EPOC had contributed to the debate. However,many questions were still unanswered and knowledge gaps remained. To fillthese gaps, the Foundation carried out a survey of management in ten MemberStates to establish the extent and nature of direct participation within theirorganisations. The responses to this survey provided a wealth of information andthe first analysis of the survey results was published in 1997.
This first EPOC report on the survey results was a significant contribution tothe policy debate around the European Commission’s Green Paper, Partnershipfor a New Organisation of Work. It provided, for the first time, detailedinformation on the extent of direct participation in its various forms; itseconomic and social impact; the attitudes of European management to it as aprocess for the efficient organisation of work, and the results of involvingworkers and their representatives in the process of change.
As a further step in the Foundation’s contribution to the ongoing debate, a seriesof additional analyses of the results of the survey were undertaken in 1998 underthe headings of: direct participation in the social public services (a review of thishas been published); equal opportunities to take part in direct participationarrangements; the nature and extent of team working; and, in this report, therelationship between employment, organisational flexibility and innovation.
Employment was at the top of the European agenda for the Heads of State andGovernment at their European Council meeting in Luxembourg in November,1997, at which they adopted a strategy for the creation of jobs. This Europeanstrategy is also built into the Amsterdam Treaty, in the Chapter on Employment
vi
Employment through Flexibility – Squaring the Circle?

and Social Policy, through which the Member States are committed tocoordinating their fight against unemployment and promoting policies whichwill help to provide the labour market with a skilled, well-trained and adaptableworkforce which is responsive to economic change.
The dilemma for Europe’s policy makers lies in preserving European socialvalues and commitment to social protection, while at the same time promotinggreater workplace flexibility. The focus in the European Commission’s GreenPaper, Partnership for a New Organisation of Work, is on how to balance thesetwo objectives. This report draws on the results of the EPOC survey to measurethe impact of new forms of work organisation on employment levels and todetermine how this interacts with workplace flexibility and innovation inEuropean enterprises. The results, as outlined in the report, show that theserelationships are not simple; they are very complex and are contingent upon awide range of interdependent factors.
Clive Purkiss Eric VerborghDirector Deputy Director
vii
Foreword

viii

ix
Page
Foreword v
Chapter 1 Introduction 1
Chapter 2 Methodology 13
Chapter 3 Functional flexibility and employment 21
Chapter 4 Functional flexibility, numerical 33flexibility and employment
Chapter 5 Functional flexibility, contract 49flexibility and employment
Chapter 6 Functional flexibility, innovation and employment 67
Chapter 7 The significance of consultation 87
Chapter 8 The results of the multivariate analyses 97
Chapter 9 Conclusions and implications 113
Appendix 1 The EPOC survey 117Appendix 2 Further details of the multivariate analyses 127
Contents


This report draws on the results of the EPOC questionnaire survey of some5,800 managers in ten EU member countries to investigate the nature and extentof a range of flexibility strategies and their relationship with changes in the levelof employment. The main focus is on functional flexibility and, in particular, thepractice of the delegative direct employee participation at its core. The reportexplores both the direct relationship between functional flexibility and changesin the level of employment; and the indirect relationship, taking into account thepractice of other adjustment strategies such as numerical flexibility, contractflexibility and innovation, together with the consultation of individualemployees. It also seeks to establish the significance for these relationships ofkey structural dimensions such as size, sector, ownership, industrial relationsinstitutions (the presence of union members/employee representation/collectiveagreements), as well as any country effect.
The policy context
Europe needs to create more jobs. Europe must become more competitive. TheEuropean labour market must become more flexible. Yet Europe must preserveits social values and its commitment to social protection.
Such themes have been central to European-level policy debate during the1990s, formulated most clearly in the European Commission’s 1994 WhitePaper, Growth, Competitiveness and Employment, and 1997 Green Paper,Partnership for a New Organisation of Work. This discussion assumes that
1
Chapter 1 Introduction

European organisations face growing competitive pressures from anincreasingly globalised marketplace. In this situation, they can adopt one of twostrategies. On the one hand, they can adopt the ‘low road’ of competing on price,cutting wages and conditions, and jettisoning as much as possible of the socialachievements of the entire post-World War II period. Alternatively, they can takethe ‘high road’ of economic development, competing on innovation and qualityand developing the skills and commitment of their labour force. Clearly, posingthe alternatives as starkly as this is an over-simplification. Clearly also, thechoice depends not just on organisations but on the environment in which theyoperate, and in particular the regulatory framework at national and Europeanlevel.
The importance of the regulatory framework is reflected in the debate over the‘strengths’ and ‘weaknesses’ of the European and US social models, which canbe linked to the contrast between the ‘Anglo-American’ and ‘Rhineland’ formsof market economies of the ‘capitalism against capitalism’ debate (Albert,1993). At the risk of gross caricature, the key features of the European modelare seen as an emphasis on employee rights introduced by collective bargainingand/or legal regulation, which leads to security of employment and relativelyhigh levels of pay and conditions generally. There is a downside, however, whichmanifests itself in inflexibility, a lack of competitiveness (leading, for example,to overseas investment by European-owned companies), and high levels ofunemployment. In most respects, the US model is deemed to be the exactopposite, reflecting a short-term orientation, weak employee protection and atendency towards numerical flexibility. Management is supposedly much freerof the restrictions of collective bargaining and legal regulation, leading togreater flexibility, improved competitiveness, and a much lower rate ofunemployment than in Europe. Again, however, there is reckoned to be a trade-off: considerable insecurity, lower levels of pay, and poorer working conditionsfor many employees.
The ‘high road’ option appears most compatible with European institutions andso is the most attractive option politically. First, it appears consistent with theidea of a ‘European social model’ of high standards of social welfare and socialprotection. Second, it involves the direct participation of employees in theorganisation of work. Trade unions in Europe have campaigned for decades –and long before direct participation became associated with ‘human resourcemanagement’ and ‘lean production’ – for greater self-management and theimproved quality of working life that it is believed to bring. Third, it involves the
2
Employment through Flexibility – Squaring the Circle?

acceptance of social partnership: employees have rights to representation in theworkplace, and employee organisations have the right to participate in economicdecision-making. Far from being obstacles to labour market flexibility andcompetitiveness, as some critics argue, these features are reckoned to contributeto social stability (‘social cohesion’) and, in giving employees dignity and a rolein improving the quality of their work, help make them more committed to it andto the organisation for which they work.
A revised European social model which combines direct and indirectparticipation is at the heart of the Commission’s Green Paper, Partnership for aNew Organisation of Work (1997). The significance of direct participation isrecognised in the following words:
It is about the scope for improving employment and competitiveness through abetter organisation of work at the workplace, based on high skill, high trust andhigh quality. It is about the will and ability of management and workers to takeinitiatives, to improve the quality of goods and services, to make innovationsand to develop the production process and consumer relations.
The Green Paper also states very clearly that the principal means of dealing withthe challenges is the building of a partnership for a new organisation of workinvolving the social partners and public authorities.
The Green Paper invites the social partners and public authorities to seek tobuild a partnership for the development of a new framework for themodernisation of work. Such a partnership could make a significantcontribution to achieving the objective of a productive, learning andparticipative organisation of work.
The flexibility debate
The debate on work organisation which helped to shape this policy context sawa strong revival throughout the industrialised world in the 1980s and 1990s,reflecting the increasingly competitive environment and pressures on publicspending. New ideas and practices came to prominence. Human resourcemanagement, total quality management, lean production, flexible organisation,learning organisation and empowerment are just some of the terms that havebecome part of today’s language of industrial relations.
3
Introduction

The issue of flexibility has been central. It is not just that, in an increasinglycompetitive environment, businesses are supposedly seeking to introducegreater flexibility in work organisation and working arrangements in order torespond to the changing external demands and opportunities. There has alsobeen growing support for the view that the flexibility of the workforce is one ofthe keys to success. The ability of employees to adapt, which means acquiringnew skills and competences, is seen as especially vital.
In the scientific as well as the policy debate, two main approaches to workforceflexibility can be distinguished: numerical and functional. There are manydifferent interpretations, but the essence of the two approaches may besummarised as follows:
• Numerical flexibility is the ability of the organisation to adjust the quantityof labour to meet fluctuations in demand. It can involve the number ofemployees – and therefore the ease with which they can be hired and fired,the duration and distribution of working time, the balance between differenttypes of employees (eg full-time and part-time; permanent and temporary),and the use of outsourcing and subcontracting.
• Functional or task flexibility is about the ability to deploy employees to thebest effect. Its common features are job rotation, delegation ofresponsibility and the use of teams, together with an emphasis oncontinuing training to enable employees to acquire new skills andcompetences. The expectation is that it will also involve collaborativeapproaches to work organisation which reject the hierarchy, specialisationand bureaucracy associated with traditional ‘Fordist’ or ‘Taylorist’ workorganisation.
Putting the two approaches side by side like this raises one of the issues whichhas emerged in the flexibility debate: whether or not the two approaches arecompatible. Although the possibility that different approaches might be appliedto different segments of the workforce was implicit in one of the originalformulations of the so-called ‘flexible firm’ model (see, for example, Atkinson,1984; Atkinson and Meager, 1986), the view emerged that functional flexibilityand numerical flexibility were not compatible. It was not just that key elementsof numerical flexibility are of course controversial: downsizing, an increase inpart-time work and temporary contracts, increased subcontracting andoutsourcing are often assumed to involve a deterioration in employees’
4
Employment through Flexibility – Squaring the Circle?

conditions. The insecurity produced by much of the delayering and downsizingof recent years has proved to be counter-productive, it is argued. There is littleor none of the trust that managers are encouraged to seek as the basis for a new‘psychological contract’. Employees, the argument goes, are hardly likely to beflexible, or seek continuous improvement, if the end result is their own or theircolleagues’ redundancy. Remove the insecurity and you remove the majorbarrier to flexibility.
More recent studies, in particular those stimulated by the OECD (1996), haveclaimed that numerical and functional flexibility can and do go together. Asimilar conclusion has been reached by Osterman (1998) following the recentupdating of his 1992 survey of more than 500 organisations in the USA.
Radical changes in the organisation of work seem to be occurring in the midstof substantial internal dislocation and turmoil. That both are happening at thesame time point to what appears to be a paradox: on the one hand some firmsare broadening jobs and devolving higher levels of responsibility to theirworkforce while at the same time they are also reducing their commitment tothe same workforce and increasingly treating them as expendable. This is theopposite of what received wisdom would have led us to expect. Theconventional view has always been that in order to obtain the high levels ofemployee commitment which decentralised and ‘empowered’ work requiresthen the firm would also have to make a reciprocal commitment. Perhaps it isthe case that employee expectations have changed or perhaps the level of fearin the labour market has changed the terms of trade.
Another widespread assumption is that functional and numerical flexibility havevery different implications for the levels of employment. Numerical flexibility,being associated with downsizing and outsourcing, has come to be associatedwith a reduction in employment. Functional flexibility, by contrast, being anessential ingredient of innovation in organisation, is usually assumed to beassociated with an increase in employment.
The employment implications are also not uncontroversial, however. Both theEPOC social partner (Regalia, 1995) and literature (Fröhlich and Pekruhl, 1996)reviews revealed that trade union representatives were concerned that directparticipation would lead to a reduction in the number of employees. The EPOCgeneral survey report (European Foundation for the Improvement of Living andWorking Conditions, 1997) confirmed that many of the workplaces introducingdirect participation (around a third) reduced the number of employees in the
5
Introduction

short term; and the more extensive the practice, the more likely they were to doso. The picture was more complicated in the medium term, however: half thosereporting short term reductions had increased employment over a three yearperiod.
Also complicating the debate is a growing appreciation that the categories offunctional flexibility and numerical flexibility as they generally have come to beunderstood are far too broad for both analytical and policy purposes. The directparticipation which is at the heart of functional flexibility involves the processesof both delegation and consultation and can take many forms, as the generalEPOC report revealed (see, in particular, Chapter 4, European Foundation forthe Improvement of Living and Working Conditions, 1997); there are evendifferent types of the much acclaimed group work. Similarly, questions havebeen raised about the validity of including working time flexibility and someforms of contract flexibility, for example, part-time working, within the generalcategory of numerical flexibility.
There is a growing body of opinion, too, arguing that the emphasis on labourmarket flexibility has been far too narrow: a much broader organisationperspective is needed on flexibility. Thus, the full definition of the flexibleorganisation in the Swedish NUTEK study of 1996 involves four characteristics:organised skills improvement, delegated responsibility, flatter organisationalstructure and an individual compensation system. Although the NUTEK studyoperationalises the ‘flexible organisation’ only in terms of the first two, the basicconcept is clearly multidimensional. From this perspective, then, the focus is onthe overall structure of the organisation, its human resources and its strategyrather than on labour utilisation per se.
Here the flexible organisation is one which is able to respond to changes inenvironment, to innovate and to learn. This notion of the flexible organisation isclose to that of the ‘learning organisation’. It is claimed that this over-archingflexibility is crucial to competitive success in the ‘post-Fordist’ world, wherefragmented and rapidly changing markets are only the most obvious aspect ofan increasingly unstable and unpredictable environment. For example, inVickery and Wurzburg’s (1997) words, ‘In a volatile business climate in whichinvestment, production and sales opportunities abound – and the pressure toexploit these opportunities is intensifying – the capacity of enterprises to staycompetitive depends on their ability to adjust internal capacities quickly’.
6
Employment through Flexibility – Squaring the Circle?
Clearly, the organisational perspective draws attention to a much wider range ofconsiderations than the labour market one. In particular, by implication, the roleof managers in stimulating innovation generally, and not just in workorganisation and working arrangements, is prioritised. Yet the organisationalperspective is at one with the labour market in stressing the importance of thedirect participation associated with functional flexibility. In the flexible,learning organisation responsibility is delegated downwards as individuals andgroups take more decisions for themselves, thus also ensuring that initiativesflow upwards as employees become more responsible for organising their ownwork. This involvement in decision-making entails arrangements created bymanagement which allow employees the space to make their views known andpossibly to make their own decisions about the immediate organisation of work.
Functional flexibility, both perspectives imply, is not only a ‘good’ thing initself, but also a necessary condition for the flexible organisation. The flexibleorganisation, in turn, is the route to competitive success and employmentgrowth. Indeed, the impression often given – which takes us back to the policycontext – is that for European countries, it is the only route to competitivesuccess and employment growth.
The aims and approach of this report
As so often happens on these occasions, a major problem is that the flexibilitydebate has taken place in something of an empirical vacuum. Much of theinformation from which conclusions have been drawn comes from reports ofcase studies of ‘best practice’ . Because they see the flexible organisation asinherently flexible, the authors rarely investigate the form and extent of theoperation of any practice, let alone the relationships between them; it is enoughthat the organisation has group work, for example – it is not seen as necessaryto ask how much ‘empowerment’ the group has. Furthermore, since they moreoften than not start from the assumption that flexibility is inherently beneficial,they tend not to seek to verify its actual consequences in any systematic way.There have been very few such case studies, for example, which show howflexibility is related to changes in employment levels.
Critically, too, there have been relatively few surveys to allow us to establish thenature and extent of what has been happening on any significant scale, let alonecompare and contrast the experience of different countries. Moreover, most ofthe surveys that have been conducted have been country-specific and concerned
7
Introduction

with manufacturing only; very few have included the service sector, eitherprivate or public, where the majority of the workforce is now employed. Thesurvey results are also hardly comparable from one country to another, such hasbeen the extreme diversity in substance and methods as well as depth ofmeasurement and analysis (for further details, see the review in Fröhlich andPekruhl, 1996).
The major exception to these generalisations is the Cranet-E survey (theCranfield Network for European Human Resource Management). This is aregular postal survey of senior personnel managers in the public and privatesectors. The most recent available data are from the 1995 survey and relate tonearly 5,000 organisations with more than 200 employees in 14 Europeancountries.
The results of the Cranet-E survey have been used to explore some of the issuesin the flexibility debate such as working time flexibility and contract flexibility,although not functional flexibility. Briefly summarised, the findings are thatthese forms of flexibility are growing ‘both in terms of range of practices and interms of the number of organisations and people involved’ (Brewster et al.,1996:19). Most significantly for present purposes, however, the authorsconclude that ‘there is no convincing evidence that increased flexibility leads toincreased levels of employment’ (Brewster et al., 1996:33).
It was to help fill the empirical vacuum that the EPOC questionnaire survey wasplanned. As with the Cranet-E survey, flexibility was not the only or, indeed, themain focus of attention. Nonetheless, the main focus was on the directparticipation of employees, which has generally been regarded as being at theheart of functional flexibility; a particular benefit of the EPOC survey’s designwas that it enables a distinction to be drawn between the delegative and theconsultative forms of direct participation (for further details, see Appendix 1).Mindful of the wider debate touched on in the previous section, the EPOCsurvey also included a range of questions about the other initiatives whichmanagement might have been taking, notably in the areas of numericalflexibility, contract flexibility and innovation. Moreover, there were alsoquestions about the relevant context of the workplace and changes in the levelof employment over the past three years.
Other advantages of the EPOC survey are that it was representative of the totalpopulation of workplaces in ten EU member countries, embracing those in the
8
Employment through Flexibility – Squaring the Circle?

public sector as well as private manufacturing and services. Furthermore, it wastargeted at establishment rather than organisation level, which enabled it to askquestions which went beyond the simple incidence of practices to consider theirnature and intensity as well. Fuller details of the EPOC survey will be found inAppendix 1. A copy of the full questionnaire is contained in the general surveyreport published by the European Foundation for the Improvement of Living andWorking Conditions in 1997.
The EPOC survey results therefore offer a unique opportunity to give anempirical basis to the flexibility debate, which is both systematic and cross-national. Most importantly, instead of assuming that ‘flexible’ organisationshave certain key characteristics which are inherently related, the EPOC data canbe used to investigate whether this actually is the case. Similarly, they can beused to explore the relationship between the nature and extent of different formsof flexibilities and changes in the level of employment.
The analysis proceeds in three stages. In the first, which is the subject ofChapter 3, the report explores the relationship between functional flexibility andemployment. It asks: how widespread is the practice of functional flexibility? Isfunctional flexibility associated with an increase in the levels of employment, asmany policy makers assume, or a reduction, as many trade union representativesfear? Which of the dimensions in the context of workplaces influence thisrelationship and the levels of employment? How important, in particular, aresize, sector, ownership, industrial relations arrangements and country?
In the second stage of the analysis, the report introduces two other forms offlexibility into the equation, numerical flexibility (Chapter 4) and contractflexibility (Chapter 5), together with innovation (Chapter 6) and ‘face-to-face’consultation (Chapter 7). In each case, the aim is to establish whether functionalflexibility and the other initiatives are combined, and if so, whether therelationship with changes in the levels of employment is stronger or weaker thanwhen applied on their own.
The approach in this second stage breaks new ground in that it enables us to testsome of the very specific issues arising in the flexibility debate discussed in theprevious section. One set involves functional flexibility, numerical flexibilityand contract flexibility: for example, that there is an inherent contradictionbetween functional flexibility, on the one hand, and numerical flexibility andcontract flexibility, on the other; that whereas functional flexibility is likely to
9
Introduction

be positively associated with changes in employment, the opposite will be trueof numerical flexibility and contract flexibility; that functional flexibility, if it ispractised alongside numerical flexibility and contract flexibility, is likely tomoderate any negative employment effects they might have.
A second set of assumptions to be tested involves functional flexibility andinnovation. The implication of the earlier discussion is that the practicesassociated with these two initiatives are likely to go hand-in-hand. Not only that,it also seems fair to conclude that as well as being positively associated withchanges in the levels of employment individually, the relationship is likely to beeven stronger when the two are combined.
A third set of assumptions involves consultation and reflects the fact that thedelegative forms of direct employee participation, which will be our proxy forfunctional flexibility, have been prioritised over the consultative in both thescientific and policy debate. From this, it might be expected that consultation onits own would be unlikely to be strongly associated with changes in the levels ofemployment one way or the other. Consultation practised in combination withthe other initiatives, however – notably, functional flexibility and innovation –would have a positive effect in that employees would be better informed andhave an opportunity to input their own ideas.
A further reason for adopting this approach is that it enables us to take intoaccount some of the most significant recent case study and quantitative researchfindings on new forms of work organisation (see, for example, Pil andMacDuffee, 1996; Collinson et al., 1997; Hutchinson et al., 1997). Thesefindings emphasise the importance of complementarities of practices in the‘success’ and ‘failure’ of attempts to modernise work organisation. The criticalpoint, in other words, is not so much whether an organisation introducesfunctional flexibility or new technology. Rather it is whether or not theorganisation introduces a ‘bundle’ or ‘cluster’ of mutually supporting andreinforcing practices and initiatives which makes the difference. Indeed,individual practices and initiatives introduced in isolation without such supportare most likely to ‘fail’.
Both the first and second stages of the analysis use relatively straightforwardstatistical techniques to establish the correlation between two variables: forexample, differences in the intensity of functional flexibility and changes in thelevels of employment. In the third and final stage, which is the subject of
10
Employment through Flexibility – Squaring the Circle?

Chapter 8, two forms of multivariate analysis are used. Not only do the resultsof these analyses allow us to assess the relative significance of the individualmeasures of flexibility, innovation, consultation and the five structuraldimensions. Even more importantly, they enable us to assess the significance,across the ten countries, of the ‘bundles’ or ‘clusters’ of measures anddimensions involved in the ‘stable’, the ‘shrinking’ and the ‘growing’workplaces, so far as employment is concerned .
The next chapter gives details of the measures and dimensions involved in thethree stages of the analysis, together with a brief introduction to the statisticaltechniques used in Chapters 3 to 7. Details of the two forms of multivariateanalysis will be found in Chapter 8 and Appendix 2.
References
Albert, M., Capitalism Against Capitalism, London, Whurr Publishers, 1993.
Atkinson, J., ‘Manpower strategies for flexible organisations’, PersonnelManagement, August 1984, pp. 28-31.
Atkinson, J., and N. Meager, ‘New forms of work organisation’, IMS Report No.121, Falmer, Institute of Manpower Studies, University of Sussex, 1986.
Brewster, C. et al., Working time and contract flexibility, Cranfield, CranfieldNetwork for European Human Resource Management, 1996.
Collinson, M., P.K. Edwards, and C. Rees, Involving Employees in Total QualityManagement, London, Department of Trade and Industry, 1997.
European Commission, Green Paper, Partnership for a new organisation ofwork, Bulletin of the European Union, Supplement 4/97, Luxembourg, Officefor Official Publications of the European Communities, 1997.
European Commission, White Paper, Growth, Competitiveness andEmployment, Luxembourg, Office for Official Publications of the EuropeanCommunities, 1994.
European Foundation for the Improvement of Living and Working Conditions,New forms of work organisation. Can Europe realise its potential? Results of a
11
Introduction

survey of direct employee participation in Europe, Luxembourg, Office forOfficial Publications of the European Communities, 1997.
Fröhlich, D., and U. Pekruhl, European Foundation for the Improvement ofLiving and Working Conditions, Direct participation and organisational change– fashionable but misunderstood? An analysis of recent research in Europe,Japan and the USA, Luxembourg, Office for Official Publications of theEuropean Communities, 1996.
Hutchinson, S., N. Kinnie, J. Purcell, C. Rees, H. Scarbrough and M. Terry, ‘Thepeople management implications of leaner ways of working’, Issues in PeopleManagement, No 15, London, Institute of Personnel and Development, 1997.
NUTEK, Towards Flexible Organisations, Stockholm, NUTEK, 1996.
OECD, Technology, Productivity and Job Creation, Paris, OECD, 1996.
Osterman, P., ‘Changing work organisation in America. What has happened andwho has benefited?’, Transfer, 1998.
Pil, F.K., and J.P. MacDuffee, ‘The adoption of high-involvement workpractices’, Industrial Relations, Vol. 35, No. 3, 1996, pp. 423-455.
Regalia, I, European Foundation for the Improvement of Living and WorkingConditions, Humanise work and increase profitability? Direct participation inorganisational change viewed by the social partners in Europe, Luxembourg,Office for Official Publications of the European Communities, 1995.
Vickery, G. and G. Wurzburg, ‘Flexible firms, skills and employment’, P+European Participation Monitor, No. 13, 1997, pp. 41-47.
12
Employment through Flexibility – Squaring the Circle?

This chapter has two tasks. The first is to give details of the measures anddimensions involved in the three stages of the analysis, together with theiracronyms used in the statistics programme. The second is to introduce thestatistical techniques which will be used in the first and second stages of theanalysis in Chapters 3 to 7.
Flexibility, innovation and consultation
Although the main purpose of the EPOC survey was to investigate the natureand extent of direct employee participation, the results nonetheless provided aconsiderable amount of data to analyse the relationship between flexibility andemployment. In some cases, there was a choice of measures. In every case, therewas a measure available which enabled us to take into account not just theincidence of the practice, but also its extent or intensity.
Functional flexibilityIn the general report, the analysis focused on six main types of directparticipation: individual ‘face-to-face’ consultation, individual ‘arms-lengthconsultation, temporary group consultation, permanent group consultation,individual delegation and group delegation. Individual delegation and groupdelegation were selected as the basis of our measure of functional flexibilitybecause they come closest to the concept in the flexibility debate. Following thegeneral survey report, data on the scope or intensity with which they werepractised were used rather than their simple incidence; they give us both a more
13
Chapter 2 Methodology

accurate impression of practice and a more robust basis for arriving at fourvalues.
The measure of functional flexibility used throughout this report, therefore,labelled FUNCFLEX, combines the scope or intensity of two of the forms of directparticipation investigated in the general report: individual delegation and groupdelegation. In total, this means the combined measure embraces eight rights inthe case of individual delegation and 11 in the case of group delegation. To makethe results digestible, the combined list was reduced to four values: 0 = nodelegation; 1 = low intensity, 2 = medium intensity and 3 = high intensity.
Numerical flexibilityThe EPOC survey gave us data for two possible measures of numericalflexibility, which not only made sense in conceptual terms, but were also closelyrelated in our preliminary data analysis. One combines answers to questionsabout whether or not the establishments had been involved in ‘downsizing’ andhad pursued a strategy of ‘back to core business’. The other was offered byanswers to questions about whether or not the establishment practised‘outsourcing’ and ‘subcontracting’.
The measure of numerical flexibility used in the analysis, labelled NUMFLEX,uses answers to the ‘downsizing’/‘back to core business’ combination. Themeasure has three values: 0 = none of this practice; 1 = low intensity (one of thispractice); 2 = high intensity (both of the practices).
To have included data on two measures of numerical flexibility would havemade the task of presenting the results even more complicated than it is. Muchmore importantly, our preliminary analysis showed the ‘downsizing’/‘back tocore business’ combination to be more strongly associated with changes inemployment.
Contract flexibilityAs in the case of numerical flexibility, our measure of contract flexibility,labelled CONTFLEX, had to be created anew. It combines answers to questionsabout whether or not there had been an increase in part-time work andtemporary contracts. The measure also has three values: 0 = none of thispractice; 1 = low intensity (one of this practice); 2 = high intensity (both of thepractices).
14
Employment through Flexibility – Squaring the Circle?

Innovation
The EPOC survey asked whether or not respondents had taken a range ofinitiatives in addition to the direct participation which was the main focus.Factor analysis clearly grouped together four types of initiatives which becamethe basis for our innovation measure: product innovation, the introduction ofnew information technology, a policy of automation and the introduction of newmachinery and equipment. INNOVAT, which is the label adopted for this measure,counts the occurrence of the four items. The intensity of innovation is coded as:0 = none of these initiatives; 1 = one of these initiatives; 2 = two of theseinitiatives; 3 = three of these initiatives; 4 = four of these initiatives.
Consultation
Our measure of consultation, labelled CONSULT, is the intensity of individual‘face-to-face’ consultation. This was based on the range of issues on whichemployees are systematically consulted. There were eight issues in total, which,in the interests of digestion, were reduced to four values: 0 = no delegation; 1 =low intensity; 2 = medium intensity and 3 = high intensity.
The EPOC survey data, it will be recalled from a previous paragraph, gave usfour possible measures of consultation: individual ‘face-to-face’ consultation,individual ‘arms-length’ consultation, temporary group consultation andpermanent group consultation. The reason for choosing individual ‘face-to-face’consultation, apart from not wanting to overburden the presentation of theresults, was that this form proved to be the one most associated statistically withchanges in employment.
The combinations of measures
For the reasons set out in Chapter 1, one of the main aims in the second stage ofthe analysis was to establish whether functional flexibility and the otherinitiatives were combined, and if so, whether the relationship with changes in thelevels of employment was stronger or weaker than when they are applied ontheir own. Rather than adding to the complexity of the presentation byreproducing the further set of acronyms necessary for the statistics programme,the simple combinations will be used in the text, eg FUNCFLEX-NUMFLEX todenote the combination of functional flexibility and numerical flexibility andFUNCFLEX-CONTFLEX to do the same for functional flexibility and contractflexibility and so on.
15
Methodology

The values of the combinations were calculated using a similar formula in eachcase and will be illustrated using FUNCFLEX-NUMFLEX:
0 = there is no functional or numerical flexibility
1 = both types of flexibility are only weakly applied
2 = both types of flexibility are moderately applied
3 = functional flexibility is intensively applied with little/no numericalflexibility
4 = numerical flexibility is intensively applied with little/no functionalflexibility
5 = both types of flexibility are intensively applied.
LimitationsEvery one of the measures, it must be emphasised, can be criticised on somegrounds or another: that it does not fully capture what is involved in a practice;that some of the combinations of answers to questions do not conform to aparticular understanding of the practice, or that better questions should havebeen asked to elicit the data required. This is the first time that such a systematicanalysis has been undertaken, however, and a start had to be made somewhere.Preliminary analysis also suggested that, within the constraints of the surveyquestions, the measures finally chosen made most sense in data as well asconceptual terms.
Employment
The measure of employment change used throughout the analysis comes fromanswers to a question early in the survey about how the number of employees inthe largest occupational group compared to three years ago. In particular, itasked whether there had been an increase, whether the number was about thesame or whether there had been a reduction.
Clearly this measure has particular weaknesses which need to be recognised. Itdoes not provide information on the number of employees affected – the pilotingof the questionnaire suggested that asking for such information would havereduced the overall response rate considerably. Also, it involves the largestoccupational group and does not relate the trends in employment to any specificdevelopment. For example, the number of employees in other groups might havebeen increasing at the same time as those in the largest were reducing, or viceversa. Medium-term changes in the employment performance of organisations
16
Employment through Flexibility – Squaring the Circle?
can be influenced by many factors, internal and external to the workplace, andit is difficult to determine from the survey results the exact links between trendsin employment and any of the approaches being considered. Last, but by nomeans least, in relating to the individual establishment, the results can saynothing about macro-level developments: for example, there may have been anincrease or decrease in employment of suppliers and/or customers as a result ofthe changes taking place in our workplaces.
Even so, this is one of the most robust measures of changes in employmentavailable. Most importantly, given that the response rate to this particularquestion was high at 96 per cent, it gives us information about growth, stabilityand decline in employment from just over 5,500 workplaces in the ten countries.At the very least, it seems fair to assume that it is indicative of the direction ofany trends and of the association between the different approaches to flexibilityand employment.
The five structural dimensions
Integral to understanding better the relationship between flexibility andemployment is an appreciation of the significance of a number of key structuraldimensions. It is not only important to know whether or not there is anassociation between, say, functional flexibility and employment, but alsowhether the association is stronger in large rather than small establishments orin EU rather than non EU-owned ones. Altogether five structural dimensionswere included in the analysis: size of establishment, sector, ownership, industrialrelations context and country. Further details of these dimensions are givenbelow.
Size of establishmentThis was measured in terms of the total number of employees, including full-time and part-time, permanent and temporary, working at or from theestablishment at the time of the survey. Three size categories are used in theanalysis: 0 to 49 employees, 50 to 499 employees, and more than 500employees.
SectorIn the original questionnaire, respondents were given a choice of 15 activitiesplus ‘other’. As in the general report, these have been reduced to five categories
17
Methodology

in the analysis: industry (manufacturing), construction, trade, private servicesand the public sector.
OwnershipThe analysis is based on the four categories appearing in the originalquestionnaire: independent; totally/partly owned by domestic organisation;totally/partly owned by EU company; totally/partly owned by non-EU company.
Industrial relations contextThere were three variables to this dimension: collective agreement coverage(whether or not the establishment was bound by a collective agreement);employee representation (whether or not the largest occupational group hadsome form of representation for the purposes of consultation/negotiation or jointdecision making at the workplace); and union membership (the proportion ofemployees in the largest occupational group in membership of trade unions,reduced to two categories: from none up to 29 per cent, and from 30 per cent to100 per cent).
CountryThe ten countries included in the survey were Denmark, France, Germany,Ireland, Italy, the Netherlands, Portugal, Spain, Sweden and the UK.
A guide to the bivariate analysis
In the general EPOC survey report, the results were presented largely indescriptive form in the interests of speedy and digestible presentation. Typically,for example, the tables simply gave details of the proportion of establishmentsreporting one or other of the forms of direct participation. In the first and secondstages of the analysis here, two or three way cross-tabulations of variables areused to establish the association between, for example, functional flexibility andchanges in the level of employment and functional flexibility and numericalflexibility.
Most tables in Chapters 3 to 7 display one or other of two statistical measures,CC or gamma, together with details of their approximate significance. These arehelpful in gaining an impression of the quality of association between the twovariables. Very generally (and somewhat imprecisely), the level of statisticalsignificance measure tells us to what degree (percentage) the differencesbetween the table cells are systematic or chance results. A systematic
18
Employment through Flexibility – Squaring the Circle?

relationship is a statistically significant relationship. To talk about a significantrelationship, the p-value (p stands for ‘probability’) should be smaller than .05,which means that chance results are lower than 5 per cent. By convention, avalue of < .05 is considered the threshold of acceptability of table data. Highervalues, eg < .08 or .10, indicate too large a risk of dealing with chance results.The lower the values, the higher the probability that the differences are notchance, eg < .0000 would indicate that the probability of a non-chancerelationship between two variables is lower than .00 per cent. In this case it ispossible to speak of a highly significant relationship. The analysis in this reportrestricts itself to values of < .00 (smaller than 1 per cent) to indicate the highestlevel of significance.
A statistically significant relationship does not tell us anything about thestrength of this relationship. Measures of strength are expressed by correlationcoefficients. In this report two such coefficients are used: CC (contingencycoefficient) and gamma.
CC measures the strength of an association between nominal variables such asblue eyes/green eyes or yes/no, which cannot be ordered as ‘from low to high’or ‘small to large’ etc. For example, the types of combinations used in Chapters4, 6 and 8 (for example, functional flexibility and numerical flexibility) arenominal variables: they cannot be ordered in a sequence from ‘low’ to ‘high’ orfrom ‘weak’ to ‘intensive’. The upper limit of CC, when both variables are verystrongly, completely associated, is about 0.86. Thus, CC varies between .00 andabout .86. The closer the value is to .00, the weaker the association. The moreCC approaches .86, the stronger are the two variables related to each other.
Gamma measures the association between two ordinal variables, with valuesranging from ‘low’ to ‘high’, ‘weak’ to ‘strong’ etc. Gamma ranges from -1.00to +1.00. Thus, it can indicate the strength of negative associations like ‘thehigher A, the lower B’, or positive associations: ‘the higher A, the higher B’. Thecloser gamma is to .00, the weaker the association; the closer it comes to +1.00or -1.00, the stronger a positive/negative relationship between two variables.
As gamma is able to indicate positive as well as negative relationships, it is themore meaningful of the two statistical measures of association. But itpresupposes that both variables of a table are ordinal. In cases where one or bothvariables are nominal, CC has to be used. CC might tell us that there is a strongrelationship, but it does not give further details such as the direction of the
19
Methodology

relationship. Thus, such measures only serve as a first, general indication; theyare no substitute for looking closely at the tables themselves.
Concluding remarks
This chapter has given details of the key measures and dimensions which figurein the analysis that follows, together with an introduction to the statisticaltechniques used in Chapters 3 to 7. Every one of the measures, it must beemphasised, has limitations. Also, the relationships that the statistical analysis isgoing to explore are associations: they do not prove a causal relationship. Theanalysis that is made possible does nonetheless enable us, for the very first time,to test systematically many of the assumptions about the links betweenflexibility and employment. If it causes the reader to rethink these assumptions,it will have done its job.
20
Employment through Flexibility – Squaring the Circle?

Our starting point is the relationship between functional flexibility andemployment. Much prevailing thinking assumes a positive relationship betweena changing organisation of work, with strong direct employee participation,enhanced productivity and competitiveness, and stable or increased levels ofemployment. This is also acknowledged by the social partners in Europe. In thesurvey carried out for the EPOC project of 200 leading representatives of centralorganisations of the social partners in all 15 Member States of the EU (Regalia,1995), most respondents saw a positive economic effect of direct participation,depending on its ability to link increased consultation and delegation of rightsand responsibilities of employees to innovation, new information technology,quality of production and services, and economic performances.
The European Commission’s 1997 Green Paper Partnership for a NewOrganisation of Work, stresses that ‘a renewal of the organisation of work is offundamental importance for improved productivity’. Higher productivityachieved through new forms of work organisation is seen to be a majorcondition for an increase of employment in the medium and long term.
However, the employment effects of different forms of direct participation arenot uncontroversial. Concepts like ‘lean production’ and ‘business re-engineering’, even when they involve direct participation, imply the possibilityof a reduction or restructuring of the workforce. Unions like IG-Metall havehighlighted the possible short term rationalisation potential of new forms ofwork organisation. The European Commission’s Green Paper (1997:11) also
21
Chapter 3 Functional Flexibility andEmployment

concedes that ‘improvement in productivity can result in a reduction ofemployment in one part of the production chain’ – a conclusion which thegeneral EPOC survey report confirmed: around a third of workplaces (31 percent) reported a short-term reduction in the number of employees due to theintroduction of direct participation.
As was discussed in the general EPOC survey report (European Foundation forthe Improvement of Living and Working Conditions, 1997: Chapter 7), thequestion on which this result was based has a number of methodologicallimitations. It captures only the negative effects of introducing directparticipation and gives no information on increases or stability of employment.It measures only the immediate effect of direct participation and gives noindication of medium-term trends. It provides no information on the number ofemployees affected, and perhaps most critically, the response rate for thequestion was very low at just under 40 per cent.
Our aim here is to investigate the relationship between our proxy for functionalflexibility – the intensity of delegative participation – and employment, usingthe answers to a question early in the EPOC survey about how the number ofemployees in the largest occupational group compared to three years ago:whether there had been an increase, whether the number was about the same orwhether there had been a reduction. As the previous chapter pointed out,although not without its weaknesses, this is one of the most robust measures ofchanges in employment available. Most importantly, given that the response rateto this particular question was high at 96 per cent, it gives us information aboutgrowth, stability and decline in employment from just over 5,500 workplaces inthe ten countries.
The chapter begins by outlining the extent of the functional flexibility practisedby our establishments. It goes on to consider whether the practice of functionalflexibility was associated with reduction, stability or increase in the employmentof the largest occupational group over the past three years. The third and finalsection seeks to establish which, if any, of the structural dimensions wassignificant for this relationship.
The nature and extent of functional flexibility
To set the scene, 3.1 gives brief details of the extent of delegative participation,which is our proxy for functional flexibility, in the nearly 5,800 workplaces
22
Employment through Flexibility – Squaring the Circle?

responding to the EPOC survey. Around 40 per cent of the workplaces, it willbe seen, reported that they did not practise any. Of the remainder, most (36 percent of the total) said they did very little. Only six per cent could be said to havea high level of functional flexibility in that they delegated a fair number ofresponsibilities to employees.
Table 3.1 The extent of functional flexibility – % of workplaces
none 42low 36medium 17high 6
Total 100
N 5786
Functional flexibility and employment
Table 3.2 gives an overall picture of the medium term employment trends in ourworkplaces. It will be seen that the biggest proportion, accounting for 40 percent, reported that employment had been stable. Slightly more workplaces (33per cent) reported an increase than did a reduction (28 per cent).
Table 3.2 Changes in employment – % of workplaces
reduced 28 same 40increased 33
N 5528
Table 3.3 reproduces the same data depending on the intensity of our measureof functional flexibility (FUNCFLEX). In the case of reductions in employment,workplaces with high levels of FUNCFLEX have reduced their workforce in thelast three years to a lesser extent (20 per cent) than workplaces without anydelegative direct participation (31 per cent). There is also a slighter greaterstability the more intensive the practice. In the case of increases in employment,there appears to be a weak but clear trend: workplaces with high levels ofFUNCFLEX have a slightly higher increase in jobs than workplaces without, orwith low and medium levels.
23
Functional Flexibility and Employment

Table 3.3 Changes in employment by functional flexibility – % of workplaces
change in level of functional flexibility
employment
none low medium high
reduced 31 28 22 20same 39 37 45 43increased 30 34 34 37
Total 100 100 100 100
N 2306 1960 931 330p < .00gamma = .09
Table 3.4 offers another view of the same data. It shows the net employment
effects associated with different levels of FUNCFLEX, which are arrived at simply
by subtracting the percentage of establishments reducing employment from that
increasing it. It will be seen that workplaces with high levels of FUNCFLEX have
the strongest positive effect with +17. Medium and low levels of FUNCFLEX also
have a positive index value of +12 (medium) and +6 (low). Workplaces without
functional flexibility have an index value of -1. Here positive and negative
medium-term employment trends are balanced.
Table 3.4 Functional flexibility and net employment change
stable employment: % of establishments 40reporting no increase/decrease in employment
net employment change: difference in % of establishments +5reporting increase/decrease in employment
- no FUNCFLEX -1- low FUNCFLEX +6- medium FUNCFLEX +12- high FUNCFLEX +17
N 5527p < .00gamma .09
24
Employment through Flexibility – Squaring the Circle?

The relationship between functional flexibility,employment and the key structural dimensions
In the next step of the analysis, the association between functional flexibility(FUNCFLEX) and employment is controlled by the set of structural dimensionsoutlined in the previous chapter.
SizeSize is important for employment changes (Table 3.5). Growth occurs inmedium-sized workplaces (50-499 employees) but losses outweigh gains insmall and in particular in large workplaces. In terms of percentage differences,small workplaces show an employment loss of four per cent, large workplaces aloss of six per cent, but in medium-sized workplaces, gains outnumber losses bynine per cent.
Table 3.5 also shows the net employment effects associated with different levelsof FUNCFLEX in small, medium and larger establishments. The general trend of apositive employment effect of FUNCFLEX is confirmed for small and medium-sized workplaces with less than 500 employees. In the case of larger workplacesthe relationship is not significant, but FUNCFLEX tends to be associated with areduction in employment, most probably reflecting the greater scope forreducing bureaucracy.
SectorThe general picture is reasonably clear and in line with expectations (Table 3.6).The positive net change overall masks two different experiences. In industry andconstruction, employment declined, whereas in the services sector, notablyprivate services, it grew.
As for the relationship between functional flexibility and employment, a sectoranalysis provides an interesting differentiation of the overall trend. FUNCFLEX
has the most positive effect on the overall employment balance in industry andtrade, where the range between the employment index for workplaces with noFUNCFLEX and high FUNCFLEX is largest. A weaker trend in the same directionshows in services and in the public sector, whereas in construction no clearpattern emerged.
OwnershipIn this case (see Table 3.7), caution has to be exercised because of the relativelysmall numbers for EU-owned and non EU-owned establishments. Other things
25
Functional Flexibility and Employment

being equal, however, Table 3.7 suggests that it was among these two groups thatthe most substantial changes took place, with EU-owned establishmentsreducing jobs and non EU-owned ones increasing them.
The general trend of a positive relation between employment and FUNCFLEX isconfirmed for independent and domestically-owned workplaces. The strongesteffect of intensive forms of functional flexibility can be observed in subsidiariesof non EU-owned workplaces, with an employment index of +61 and a rangebetween the employment index of non-FUNCFLEX to high FUNCFLEX workplacesof more than 40 points. A careful interpretation of this finding is, however,necessary as it represents only 16 cases. In general, ownership does not appearto be a strong influence on the relationship between functional flexibility andemployment.
Industrial relations contextIn Table 3.8, the control is by the three industrial relations variables: collectiveagreement coverage, employee representation and degree of unionisation. Ineach case, it will be seen, there is a marked difference between establishmentswith and without these three variables. There was more likely to be a netincrease in employment in establishments without than those with.
Especially interesting, however, are the detailed results from correlating therelationship between functional flexibility and employment. In workplaceswithout collective agreements and employee representatives, and with lowunionisation, the positive effect of high levels of FUNCFLEX occurs in situationswith an overall positive employment trend. Here FUNCFLEX seems to beassociated with an improvement in an already positive employment trend. In thecase of workplaces with collective agreements and employee representatives,and with high unionisation, FUNCFLEX appears to convert an overall negativeemployment trend into a positive one, ie from -6 to +14 in the case of collectiveagreements; -9 to +11 in the case of employee representation, and -19 to +6 inthe case of unionisation.
The suggestion is that it is not so much collective agreements, employeerepresentation and unionisation that are the significant variables. Rather is it thesize, sector and ownership which make the difference. Other things being equal,in other words, collective agreements, employee representation and unionisationare more likely to be found in larger establishments and in EU-owned ones,where the overall employment trend is negative.
26
Employment through Flexibility – Squaring the Circle?

CountryMost significant is the country variable shown in Table 3.9. The general pictureis in line with what might have been expected when the survey was undertakenin 1996, and speaks for itself. The overall trend so far as the relationshipbetween functional flexibility and employment is concerned is confirmed in sixout of ten countries. Denmark, Germany and Ireland show a very strong positiveassociation between the level of FUNCFLEX and employment. The range of theemployment index between workplaces with and without functional flexibilityis between +30 and +50 points. The Netherlands, Sweden and France also havestrong employment increases related to functional flexibility. For Spain, thereare no data in regard of workplaces with high levels of FUNCFLEX, while inPortugal the sample of workplaces with high levels included only 12 cases.
Italy and the UK are the two countries which deviate from the overall trend. Inthe case of the UK the trend is reversed, whereas in the Italian case, workplaceswith low/medium FUNCFLEX have the best employment performance index.
There are also two other interesting results to be drawn from Table 3.9. First, thedata show that even in countries with an overall negative employment trend,such as Germany and Sweden, increased functional flexibility is associated withsignificantly improved employment performance. Second, the positive effectassociated with functional flexibility also holds for countries (notably Irelandand the Netherlands) with an overall positive employment trend. Countriesdoing well in employment terms, it seems, perform even better with theimplementation of intensive functional flexibility.
Summary
Analysis of the relationship between our measure of functional flexibility(delegative direct participation) and employment confirms the findings of thegeneral EPOC survey report. In the medium term, workplaces practisingfunctional flexibility are less likely to reduce employment and more likely toincrease it. Also, the more intensive the practice of functional flexibility, themore positive the employment trend. The tendencies are relatively modest,however, as consideration of other initiatives in subsequent chapters willconfirm. Moreover, if anything, the practice of functional flexibility seems moreassociated with employment retention than employment growth. Critically, too,the number of workplaces practising functional flexibility intensively (six percent) is a very small minority.
27
Functional Flexibility and Employment

Of the key structural dimensions, the positive trend of the relationship isstronger in small and medium-sized workplaces than larger ones, and in industryand trade than in the other sectors. Overall, ownership does not appear to be asignificant influence, although in non EU-owned companies the intensivepractice of functional flexibility is strongly related to employment growth.
More controversially, net employment changes in workplaces with collectiveagreements and employee representation are, overall, less positive than thosewithout. The same is true of workplaces with high levels of union membershipas opposed to those with low levels. Noteworthy, however, is that the intensiveapplication of functional flexibility in workplaces where these three variablesare present converts a negative employment balance into a positive one,suggesting that other influences, such as size and sector, may be of overridingimportance.
Country proved to be the most significant of the dimensions. The details havebeen given in the preceding section and do not bear repeating. It is importantthat the overall trend comes through in most countries (Italy and the UK beingslightly deviant cases): the more intensively our measure of functional flexibilityis applied, the more likely there is to be an improvement in the net change ofemployment.
References
European Commission, Green Paper, Partnership for a new organisation ofwork, Bulletin of the European Union, Supplement 4/97, Luxembourg: Officefor Official Publications of the European Communities, 1997.
European Foundation for the Improvement of Living and Working Conditions,New forms of work organisation. Can Europe realise its potential? Results of asurvey of direct employee participation in Europe. Luxembourg, Office forOfficial Publications of the European Communities, 1997.
Regalia, I., European Foundation for the Improvement of Living and WorkingConditions, Humanise work and increase profitability? Direct participation inorganisational change viewed by the social partners in Europe, Luxembourg,Office for Official Publications of the European Communities, 1995.
28
Employment through Flexibility – Squaring the Circle?

Table 3.5 Functional flexibility and net employment change by size
ten-country -49 50-499 500+average employees employees employees
stable employment: % of 40 49 37 31establishments reporting no increase/decrease in employment
net employment change: difference +5 -4 +9 -6in % of establishments reporting increase/decrease in employment
- no FUNCFLEX -1 -10 +3 -15- low FUNCFLEX +6 -7 +11 +6- medium FUNCFLEX +12 +3 +16 -6- high FUNCFLEX +17 +15 +20 0
N 5527 1271 3953 304p < .00 .00 .00 .61CC .09 .17 .10 .12
Table 3.6 Functional flexibility and net employment change by sector
ten-country industry construction trade private public average services sector
stable employment: % of 40 33 33 43 41 49establishments reporting no increase/decrease in employment
net employment change: +5 -2 -9 +9 +15 +10difference in % of establishments reporting increase/decrease in employment
- no FUNCFLEX -1 -8 -13 0 +17 +8- low FUNCFLEX +6 +2 +4 +9 +13 +8- medium FUNCFLEX +12 +9 -31 +23 +12 +13- high FUNCFLEX +17 +14 -6 +18 +23 +17
N 5527 2047 388 1108 849 1139p < .00 .01 .05 .00 .05 .58CC .09 .10 .20 .23 .13 .06
29
Functional Flexibility and Employment

Table 3.7 Functional flexibility and net employment change by ownership
ten-country totally domestic EU-owned non-EU average independent owned
stable employment: % of 40 41 41 30 24establishments reporting no increase/decrease in employment
net employment change: +5 +9 +1 -14 +14difference in % of establishments reporting increase/decrease in employment
- no FUNCFLEX -1 +3 -7 -19 +17- low FUNCFLEX +6 +12 +4 -16 +13- medium FUNCFLEX +12 +15 +6 -1 -8- high FUNCFLEX +17 +17 +31 -5 +61
N 5527 2631 1628 536 268p < .00 .00 .00 .00 .00CC .09 .10 .12 .23 .27
Table 3.8 Functional flexibility and employment change by industrial relations context
ten-country collective union employee average agreement membership representation
No Yes 0-29% 30-100% No Yes
stable employment: % 40 39 39 41 38 43 38of establishments reporting no increase/decrease in employment
net employment change: +5 +16 +2 +13 -9 +13 +1difference in % of establishments reporting increase/decrease in employment
- no FUNCFLEX -1 +14 -6 +11 -19 +11 -9- low FUNCFLEX +6 +8 +8 +13 -5 +10 +7- medium FUNCFLEX +12 +30 +6 +18 +6 +19 +8- high FUNCFLEX +17 +29 +14 +25 +6 +38 +6
N 5527 1083 4096 3132 1964 1676 3527p < .00 .00 .00 .00 .00 .00 .00CC .09 .17 .11 .10 .14 .15 .11
30
Employment through Flexibility – Squaring the Circle?

Table 3.9 Functional flexibility and net employment change by country
ten-country DK FRA GER IRL ITA NL POR SPA SWE UKaverage
stable employment: % 40 49 39 42 45 34 42 42 37 44 40of establishments reporting no increase/decrease in employment
net employment change: +5 +22 +8 -7 +32 +11 +26 +6 +5 -2 +7difference in % of establishments reporting increase/decrease in employment
- no FUNCFLEX -1 +13 -7 -14 +33 +4 +16 -1 -6 -11 +15- low FUNCFLEX +6 +19 +20 -8 +31 +23 +34 +9 +22 -7 +11- medium FUNCFLEX +12 +37 +17 -2 +23 +12 +22 +28 +22 +4 +21- high FUNCFLEX +17 +46 +20 +18 +88 0 +39 +50 - +11 +4
N 5527 641 548 803 367 476 494 294 452 717 763p < .00 .05 .00 .00 .00 .00 .00 .00 .05 .00 .00CC .09 .15 .22 .16 .21 .20 .20 .27 .18 .19 .18
31
Functional Flexibility and Employment


This chapter begins the second stage of the analysis. The focus is on the
relationship between functional flexibility, numerical flexibility and
employment. One aim is to explore the extent of the compatibility between our
indicators of functional flexibility (the intensity of delegative participation) and
numerical flexibility (‘downsizing’ and ‘back to core business’). There are, it
will be remembered from Chapter 1, very different views about this. European
commentators have tended to see the two as mutually exclusive: key elements of
numerical flexibility, such as downsizing, are seen as undermining the trust and
cooperation needed for functional flexibility. By contrast, colleagues from other
OECD countries (OECD, 1996; Vickery and Wurzburg, 1997) – notably the
USA (Osterman, 1998) – have suggested that many organisations are practising
both at the same time.
The second and third aims are closely related. The second is to test one of the
main prevailing assumptions in the flexibility debate discussed in Chapter 1,
namely that, whereas functional flexibility is usually assumed to be associated
with an increase in employment, the opposite will be true of numerical
flexibility. The third is to establish the relationship with employment if and
when functional flexibility and numerical flexibility are practised together:
whether the effect of numerical flexibility is to negate completely the slightly
positive relationship confirmed in Chapter 3, or whether functional flexibility is
associated with a moderation in the impact of numerical flexibility.
33
Chapter 4 Functional Flexibility, NumericalFlexibility and Employment

The chapter is divided into five main sections. The first deals very briefly withthe extent of the numerical flexibility practised by our establishments. Thesecond looks at the relationship between our measure of functional flexibilityand the indicators of numerical flexibility to establish the extent to which theyare combined or mutually exclusive. The third considers whether the practice ofnumerical flexibility was associated with reduction, stability or increase in theemployment of the largest occupational group over the past three years. Thefourth investigates the relationship between the combinations of functionalflexibility and numerical flexibility and the trends in employment of this group.Finally, the fifth section seeks to establish which, if any, of the structuraldimensions was significant for this relationship.
The nature and extent of numerical flexibility
Our measure of numerical flexibility, labelled NUMFLEX, comprises twoindicators: ‘down sizing’ and a strategy of ‘back to core business’. The intensityof numerical flexibility therefore has three values: 0 = no practice, 1 = lowintensity (one of the two practices), 2 = high intensity (both of the practices).
As will be seen from Table 4.1, the extent of numerical flexibility was noticeablyless than that for delegative participation, which is our proxy for functionalflexibility. Around six in ten (58 per cent) of our establishments practised oneand/or other of the two forms of delegative participation; some six per cent didso to a high degree. Only three in ten (31 per cent) had engaged in downsizingor a ‘back to core business’ approach. The proportion with a lot of numericalflexibility is also extremely small at five per cent, although greater than that forfunctional flexibility, relative to the number with some of the practice.
Table 4.1 The extent of numerical flexibility – % of workplaces
FUNCFLEX NUMFLEX
none 42 69low /medium 52 26high 6 5
Total 100 100
N 5786 5786
34
Employment through Flexibility – Squaring the Circle?

The relationship between functional flexibility andnumerical flexibility
Our focus now shifts to the relationship between functional flexibility andnumerical flexibility. The results of cross-tabulating our measure of functionalflexibility, FUNCFLEX, with our indicator of numerical flexibility, NUMFLEX,appear in Table 4.2 and show that the relationship is weak.
Table 4.3, which shows the proportions with the different combinations ofFUNCFLEX and NUMFLEX, suggests that functional flexibility was much morelikely to be practised on its own than in combination with numerical flexibility.Yet, if there is no evidence of their extensive combination, the two approacheswere far from being mutually exclusive. The workplaces in which they werepractised side by side amounted to a not insubstantial minority. Around four percent reported the intensive practice of functional flexibility alongside theequivalent of numerical flexibility, and a similar number practised both togetherto a medium extent.
Table 4.2 The relationship between functional flexibility and numerical flexibility– % of workplaces
NUMFLEX
FUNCFLEX none low high
none 42 42 38low 37 34 30medium 16 16 25high 5 8 7
Total 100 100 100
N 3995 1519 273p < .00gamma = .05
There was also very little evidence of numerical flexibility being practised as analternative approach to functional flexibility. Further analysis of data behindTables 4.2 and 4.3 showed that the numbers practising numerical flexibilitymore or less on its own were relatively low (12 per cent). Furthermore, inproportionate terms, the incidence of numerical flexibility in establishmentswith functional flexibility was virtually identical to those without; this holdstrue both for those establishments with any level of numerical flexibility, and for
35
Functional Flexibility, Numerical Flexibility and Employment

those practising it to a considerable degree. The results would therefore seem tosupport the ‘randomly applied’ interpretation.
Table 4.3 The combinations of functional flexibility and numerical flexibility – % of workplaces
FUNCFLEX/NUMFLEX
no FUNCFLEX or NUMFLEX 29low FUNCFLEX/low NUMFLEX 45both medium 4high FUNCFLEX 15high NUMFLEX 3both high 4
Total 100
N 5787gamma .05p < .05
Numerical flexibility and employment
Table 4.4 gives details of the relationship between different levels of NUMFLEX
and changes in the employment of the LOG over the past three years. It shows avery strong negative relationship between NUMFLEX and the changes inemployment: the greater the application of NUMFLEX, in other words, the morelikely there was to be a reduction in employment and the less likely an increase.Thus, of those establishments with high levels of NUMFLEX, the number with areduction in employment (63 per cent) was six times that of those with anincrease (11 per cent), whereas of those establishments with no NUMFLEX (the‘none’ category’), more than twice as many increased employment as reduced it(39 per cent against 19 per cent). It will also be seen that employment was muchmore likely to stay the same in the absence of NUMFLEX (42 per cent against 35per cent and 26 per cent for the ‘little’ and ‘high’ categories respectively).
The relationship between NUMFLEX and employment becomes even clearer whenthe focus is put on net employment change (Table 4.5). In the absence ofNUMFLEX, the net employment change was +19; a little application producedfigures of -24; a high application -52.
36
Employment through Flexibility – Squaring the Circle?

Table 4.4 Changes in employment by numerical flexibility – % of workplaces
change in level of numerical flexibility (NUMFLEX)
employmentnone little high
reduced 19 44 63same 42 35 26increased 39 20 11
Total 100 100 100
N 3831 1435 261p < .00gamma = -.47
Table 4.5 Changes in net employment by numerical flexibility
stable employment: % of establishments 40reporting no increase/decrease in employment
net employment change: difference in % +5of establishments reporting increase/decrease in employment
– no NUMFLEX +19– little NUMFLEX -24– high NUMFLEX -52
N 5527p < .00gamma .47
Functional flexibility, numerical flexibility andemployment
The association between NUMFLEX and employment seems clear enough. Thetask is now to establish what happens when functional flexibility is combinedwith numerical flexibility. To enable us to gain some insight into theserelationships, the measure of FUNCFLEX was combined with that of NUMFLEX toproduce a composite measure, which was then matched against changes in theemployment of the largest occupational group over the past three years.
The results are presented in Table 4.6. It will be seen that the relationshipbetween the composite measure FUNCFLEX-NUMFLEX and changes in the level ofemployment is statistically significant, but it is not as strong as that between
37
Functional Flexibility, Numerical Flexibility and Employment

NUMFLEX and employment reported earlier in Table 4.4. The implication is thateither NUMFLEX dilutes the impact of FUNCFLEX or that FUNCFLEX is associatedwith a moderation of the influence of NUMFLEX.
Further support for these conclusions comes from a closer look at Table 4.6.Especially worthy of comment is that when the combination of both FUNCFLEX
and NUMFLEX is ‘high’, the reduction in employment was less than whenNUMFLEX alone is ‘high’ (44 per cent against 63 per cent). Likewise, when thecombination is high, the increase in employment is greater than when NUMFLEX
alone is ‘high’ (18 per cent against 11 per cent).
Table 4.6 Changes in employment by levels of functional flexibility and numericalflexibility – % of workplaces
levels of NUMFLEX and FUNCFLEX
none low both high high bothchange in employment FUNCFLEX/ medium NUMFLEX FUNCFLEX high
low NUMFLEX
reduced 23 32 32 63 13 44same 42 37 44 25 46 37increased 36 31 23 11 42 18
Total 100 100 100 100 100 100
N 1614 2476 241 177 824 198p < .00CC = .22
The data in Table 4.7 on the changes in net employment effects associated withcombining functional flexibility with numerical flexibility illustrate the pointeven more clearly. Especially worthy of comment are the changes associatedwith the high application of NUMFLEX, on the one hand, and those with the highapplication of the combination, on the other. It will be seen that combiningfunctional with numerical flexibility halves the net employment effect from -52to -26.
These are important findings. The problem is that they do not tell us thedirection of causation. It is eminently plausible that combining functionalflexibility with numerical flexibility would have a positive impact onemployment – the greater the flexibility, the greater the ability of theestablishment to minimise employment reductions/maximise employmentincreases. No less plausible, however, is that the causation is the other way
38
Employment through Flexibility – Squaring the Circle?

round: the establishment able to minimise employment reductions/maximiseemployment increases is in a better position to introduce functional flexibility.
Table 4.7 Changes in net employment effects by levels of functional flexibility andnumerical flexibility – % of workplaces
ten-country average
net employment change: difference in % +5of establishments reporting increase/decrease in employment
- no FUNCFLEX or NUMFLEX +13- low FUNCFLEX/low NUMFLEX 0- both medium -9- high NUMFLEX -52- high FUNCFLEX +29- both high -26
N 5530p < .00CC .22
The significance of the key structural dimensions
The next step in our analysis is to explore the relationship between functionalflexibility, numerical flexibility and employment, taking into account the keystructural dimensions described in Chapter 2. The full details are given in Tables4.8 to 4.14 at the end of the chapter.
SizeThe overall pattern which emerged in Chapter 3 is repeated (Table 4.8). It is thelarger workplaces, followed by the smaller ones, which experience netreductions in employment regardless of the application of functional or eithertype of numerical flexibility. Functional flexibility to some extent moderates theimpact of NUMFLEX across the board, with the effect apparently greater in thesmaller workplaces.
SectorIn terms of functional flexibility, conforming to the findings of the generalEPOC survey report, there were signs of greater activity in trade, privateservices and the public sector than in industry or construction (Table 4.9). Highlevels of numerical flexibility were more evenly spread, however. Admittedly,
39
Functional Flexibility, Numerical Flexibility and Employment
the incidence of high levels of numerical flexibility was lowest in the publicsector as might have been expected. Yet, interestingly, its figures for ‘bothmedium’ and ‘both high’ combinations were on a par with other sectors.
As for the relationship with employment, FUNCFLEX seems to have most impactin industry and least in private services (Table 4.10). Construction appears to bethe exception to the rule that FUNCFLEX moderates the impact of NUMFLEX
(although the position of construction is suspect because of the small numbersin some of the categories).
OwnershipChapter 3 suggested that the influence of ownership was rather neutral, althoughworkplaces owned by non-EU companies stood out on account of the positiveassociation of the intensive practice of FUNCFLEX and employment. The first partof that conclusion holds here as well (Table 4.11). The second needs to bequalified somewhat. Here it is the workplaces owned by EU companies whichmerit the attention, although the negative effect of FUNCFLEX may be a rogueresult because of the small numbers.
Industrial relationsOur starting point will again be Chapter 3. There it was found that, althoughoverall the workplaces with collective agreements, employee representation andhigh levels of union membership tended to have poorer employment trends thanthose without, the intensive application of FUNCFLEX accompanied the move toa positive trend. The same conclusion is appropriate here for NUMFLEX (Table4.12): the differential between those with and without these features tends tonarrow the more intensive the application of FUNCFLEX, either more or less onits own or in combination with NUMFLEX.
CountryThe pattern of activity revealed in the findings of the general EPOC surveyreport are repeated. Spain and, albeit to a lesser extent, Portugal and Italy, standout at one extreme, and Sweden at the other (see Table 4.13). The first three,above all Spain, are characterised by relative inactivity. Thus some 51 per centof Spanish establishments reported no functional flexibility or numericalflexibility compared to the 10-country average of 29 per cent. Meanwhile,Sweden not only had the smallest proportion of inactive workplaces (12 percent), but also the largest practising functional flexibility to a high degree (21per cent against the 10-country average of 16.0 per cent) and the largest ‘both
40
Employment through Flexibility – Squaring the Circle?

medium’ and ‘both high’ combinations of functional-numerical flexibility (10per cent compared to 5 per cent, and 7 per cent compared to 4 per cent). Theonly measure on which it did not achieve the highest score was that for highlevels of numerical flexibility, where the UK’s five per cent was roughly twicethe 10-country average.
The country data on the relationship between functional flexibility, numericalflexibility and employment in Table 4.14 have to be treated with extreme cautionbecause of the small numbers in many of the categories. It is perhaps sufficientto note that the application of NUMFLEX has its smallest impact in Denmarkfollowed by Italy and Germany. Interestingly, each of these three countries, itwill be recalled from Chapter 3, had better records than other countries for theassociation between FUNCFLEX and employment. NUMFLEX had its biggestimpact, even at the lowest level of application, in Sweden, followed by Portugaland the UK.
Summary
The proportion of establishments practising numerical flexibility is of the orderof three out of ten compared to six out of ten for functional flexibility. In thecircumstances, it is not perhaps surprising that there is little evidence of theextensive combination of functional and numerical flexibility. Yet functional andnumerical flexibility are far from being mutually exclusive. There is a fairamount of overlap. Around 20 per cent of the total number of establishmentshave both to some degree – which is not inconsiderable taking into account therelatively low incidence overall – while some four per cent combine functionaland numerical flexibility to a medium level, and an equal proportion to a highlevel. There is also little evidence of numerical flexibility being pursued on itsown: more establishments report high levels of the functionalflexibility/numerical flexibility combination than high levels of numericalflexibility.
Not surprisingly, our measure of numerical flexibility, involvingdownsizing/back to core business, has a strong negative relationship with trendsin employment. The more numerical flexibility is applied, the greater thelikelihood of reductions in employment and the less the likelihood of stability orincreases in employment, although the latter are not totally absent.
41
Functional Flexibility, Numerical Flexibility and Employment

Our particular interest is with what happens when functional flexibility andnumerical flexibility are found together. Although the numbers are relativelysmall, it seems that their combination is less likely to be associated with areduction in employment, and more likely to be associated with an increase,than when numerical flexibility is practised on its own. It could be argued thatthis implies that numerical flexibility overrides any positive effect onemployment that functional flexibility might have. Equally plausible, however,is that functional flexibility helps to moderate the negative influence ofnumerical flexibility.
The pattern of association of the key structural dimensions uncovered inChapter 3 is mostly repeated. In the case of country, it is worth noting that Spain,Portugal and Italy are at one extreme of inactivity for both functional flexibilityand numerical flexibility. Sweden stands out at the other: it not only had thelargest proportion with high levels of functional flexibility, but also the largestpractising the functional flexibility/numerical flexibility combination to both amedium and a high degree. This would appear to offer yet further confirmationfor the conclusion that functional flexibility and numerical flexibility are notmutually incompatible, but can and do exist side by side.
References
OECD, Technology, Productivity and Job Creation, Paris, OECD, 1996.
Osterman, P., ‘Changing work organisation in America. What has happened andwho has benefited?’, Transfer, 1998.
Vickery, G. and G., Wurzburg, ‘Flexible firms, skills and employment’, P+European Participation Monitor, No. 13, 1997.
42
Employment through Flexibility – Squaring the Circle?

Table 4.8 Functional flexibility/numerical flexibility and net employment changeby size
Number of employees (% of establishments)
ten-country -49 50-499 500+ average employees employees employees
stable employment: % 40 49) 37 31)of establishments reporting no increase/decrease in employment
net employment change: +5 -4) +9 -11)difference in % of establishments reporting increase/decrease in employment
- no FUNCFLEX or NUMFLEX +13 +5) +15 0)- low FUNCFLEX/low NUMFLEX 0 -10) +5 -3)- both medium -9 -13) -5 (-24)- high NUMFLEX -52 (-57) -51 (-56)- high FUNCFLEX +29 +21) +33 +11)- both high -26 -4) -46 (-11)
N 5530 1272) 3954 303)p < .00 .00) .00 .18)CC .22 .25) .25 .21)
NB Entries in brackets involve small numbers, ie single figures in the case of theestablishments reporting either an increase or decrease in employment.
Table 4.9 Functional flexibility/numerical flexibility by sector – % of workplaces
none low both high high both Total (N)FUNCFLEX/ medium FUNCFLEX NUMFLEX high
low NUMFLEX
ten-country average 29 45 4 15 3 4 100 5788industry 33 46 3 11 4 3 100 2119construction 34 45 5 9 4 4 100 403trade 25 50 5 15 3 3 100 1186private services 29 38 5 18 4 6 100 898public sector 26 45 5 20 1 4 100 1182
p < .00CC= .17
43
Functional Flexibility, Numerical Flexibility and Employment

Table 4.10 Functional flexibility/numerical flexibility and net employment changeby sector
ten-country industry con- trade private publicaverage struction services sector
stable employment: % 40 33 33) 43) 41) 49of establishments reporting no increase/decrease in employment
net employment change: +5 -2 -9) +9) +15) +10difference in % of establishments reporting increase/decrease in employment
- no FUNCFLEX or NUMFLEX +13 +8 +14) -3) +35) +21- low FUNCFLEX/low NUMFLEX 0 -6 -16) +10) +3) +3- both medium -9 -14 (-41) -5) 0) -3- high NUMFLEX -52 -73 (-69) (-26) (-12) -50- high FUNCFLEX +29 +29 (+8) +36) +32) +25- both high -26 -35 (-79) (+2) (-24) -23
N 5530 2047 388) 1107) 849) 1137p < .00 .00 .00) .00) .00) .00CC .22 .25 .32) .29) .28) .24
NB Entries in brackets involve small numbers, ie single figures in the case of theestablishments reporting either an increase or decrease in employment.
44
Employment through Flexibility – Squaring the Circle?

Table 4.11 Functional flexibility/numerical flexibility and net employment change by status/ownership
ten-country independent domestically- EU- Non EU-average owned owned owned
stable employment: % of 40 41 41 30) 24)establishments reporting no increase/decrease in employment
net employment change: +5 +9 +1 -14) +14)difference in % of establishments reporting increase/decrease in employment
- no FUNCFLEX or NUMFLEX +13 +14 +15 -12) +4)- low FUNCFLEX/low NUMFLEX 0 +10 -8 -18) +22)- both medium -9 +3 -11 (-25) (-24)- high NUMFLEX -52 -58 -45 (-61) (-71)- high FUNCFLEX +29 +27 +26 (+15) (+53)- both high -26 -25 -28 (-33) (-36)
N 5530 2630 1267 536) 266)p < .00 .00 .00 .00) .00)CC .22 ..21 .25 .27) .40)
NB Entries in brackets involve small numbers, ie single figures in the case of theestablishments reporting either an increase or decrease in employment.
45
Functional Flexibility, Numerical Flexibility and Employment

Table 4.12 Functional flexibility/numerical flexibility and net employment change by industrial relations context
ten-countrycollective union employee
averageagreement membership representation
No Yes 0-29% 30-100% No Yes
stable employment: % 40 39) 39 41 38) 43) 38of establishments reporting no increase/decrease in employment
net employment change: +5 +16) +2 +13 -9) +13) +1difference in % of establishments reporting increase/decrease in employment
- no FUNCFLEX or NUMFLEX +13 +31) +7 +23 -3) +25) +3- low FUNCFLEX/ 0 +6) -1 +7 -15) +2) 0
low NUMFLEX
- both medium -9 +11) -13 -1 -22) +3) -16- high NUMFLEX -52 (-49) -55 -43 -63) (-41) -56- high FUNCFLEX +29 +40) +26 +33 +26) +31) +29- both high -26 +10) -38 -10 (-51) +15) -39
N 5530 1082) 4097 3131 1965) 1677) 3529p < .00 .00) .00 .00 .00) .00) .00CC .22 .29) .22 .22 .26) .25) .23
NB Entries in brackets involve small numbers, ie single figures in the case of theestablishments reporting either an increase or decrease in employment.
46
Employment through Flexibility – Squaring the Circle?

Table 4.13 Functional flexibility/numerical flexibility by country - % of workplaces
none low both high high both Total NFUNCFLEX/ medium FUNCFLEX NUMFLEX high
low NUMFLEX
ten-country average 29 44 5 16 3 4 100 5786Denmark 33 41 4 18 2 2 100 673France 22 48 4 18 4 4 100 596Germany 23 46 7 16 4 4 100 828Ireland 29 41 3 17 2 9 100 381Italy 41 45 2 9 2 1 100 499Netherlands 23 44 7 17 3 6 100 506Portugal 48 38 0.3 12 3 0 100 299Spain 51 42 0.4 7 0.2 0 100 461Sweden 12 48 10 21 2 7 100 731UK 25 45 3 15 5 6 100 812
p < .00CC= .30
Table 4.14 Functional flexibility/numerical flexibility and net employment change by country
ten-country DK FR GER IR IT NL POR SP SW UKaverage
stable employment: 40 49) 39) 42) 45) 34) 42) 42) 37) 44) 41)% of establishments reporting no increase/decrease in employment
net employment change: +5 +22) +8) -7) +32) +11) +26) +6) +5) -2) +7)difference in % of establishments reporting increase/decrease in employment
- no FUNCFLEX or NUMFLEX +13 +18) +17) -2) +41) +16) (+24) +24) -6) +35) +30)- little FUNCFLEX/
little NUMFLEX 0 +16) +3) -10) +27) +11) +26) -24) +16) -19) -7)- both medium -9 (+39) (-12) -13) (+8) (+13) (+20) -) -) -13) -26)- high NUMFLEX -52 (-40) (-48) (-73) (-28) -) (+14) -) -) (-41) -31)- high FUNCFLEX +29 (+43) (+41) +20) (+46) +11) (+45) -) -) +32) +33)- both high -26 (-7) (-60) (-35) -) -) (-20) (+33) (+17) (-25) (-7)
N 5530 638) 547) 802) 370) 477) 495) 294) 453) 716) 761)p < .00 .00) .00) .00) .00) .00) .00) .00) .11) .00) .00)CC .22 .22) .35) .27) .34) .28) .31) .43) .17) .33) .31)
NB Entries in brackets involve small numbers, ie single figures in the case of theestablishments reporting either an increase or decrease in employment.
47
Functional Flexibility, Numerical Flexibility and Employment


The European Commission’s Employment Report 1996 reminds us of thegrowing importance, overall, of the two practices which go into our measure ofcontract flexibility, ie increases in part-time working and temporary contracts.In 1995, the proportion of employees across the EU who were part-time was16.0 per cent, compared to 12.5 per cent in 1985; the proportion of part-timemen had increased from 3.4 per cent to 5.2 per cent and the proportion of part-time women from 27.3 per cent to 31.3 per cent. The figures for the proportionof employees on temporary or fixed term contracts was 11.5 per cent; 10.7 percent and 12.5 per cent of male and female employees respectively were soemployed (adapted and reported in Leat, 1998:67-9).
The same report also gives a strong impression of the relationship between thesetwo forms of contract flexibility and employment trends. The majority of thejobs created in the first half of the 1990s were part-time rather than full-time. In1995, for example, 71 per cent and 85 per cent of the new jobs filled by men andwomen respectively were part-time. In the same year, around half of those in theprime working age group (25 to 49) moving into employment did so on the basisof a temporary contract (reported in Leat, 1998:68-9).
The aims and structure of this chapter are similar to the previous one. The firstsection gives brief details of the extent of the contract flexibility practised by ourestablishments. The second investigates the extent to which our measures offunctional flexibility and contract flexibility are combined. The third askswhether our measure of contract flexibility was associated with reduction,
49
Chapter 5 Functional Flexibility, ContractFlexibility and Employment

stability or increase in the employment of the largest occupational group overthe past three years. The fourth investigates the relationship between thecombinations of functional flexibility and contract flexibility and the trends inemployment of this group. Finally, the fifth section seeks to establish which, ifany, of the structural dimensions was significant for this relationship.
The nature and extent of contract flexibility
Our measure of contract flexibility, labelled CONTFLEX, comprises twoindicators: increases in part-time working and temporary working. The intensityof contract flexibility therefore has three values: 0 = no practice, 1 = lowintensity (one of the two practices), 2 = high intensity (both of the practices).
As will be seen from Table 5.1, the extent of contract flexibility, like numericalflexibility discussed in the previous chapter, was noticeably less than that fordelegative participation, which is our proxy for functional flexibility. Around sixin ten (58 per cent) of our establishments practised one and/or other of the twoforms of delegative participation; some six per cent did so to a high degree.Around one third reported increases in contract flexibility. The proportion witha high level of contract flexibility is also small (seven per cent), althoughslightly greater than for functional flexibility (six per cent).
Table 5.1 The extent of contract flexibility – % of workplaces
FUNCFLEX CONTFLEX
none 42 66low/medium 52 27high
6 7Total 100 100N 5786 4349
The relationship between functional flexibility andcontract flexibility
The results of cross-tabulating our indicator of contract flexibility, CONTFLEX
with our measure of functional flexibility, FUNCFLEX, appear in Table 5.2, and thecombinations in Table 5.3. They show a similar pattern to that between NUMFLEX
and FUNCFLEX in the previous chapter. There is a weak relationship betweenCONTFLEX and FUNCFLEX which would seem to support the ‘randomly applied’
50
Employment through Flexibility – Squaring the Circle?

interpretation. Functional flexibility was roughly twice as likely to be practisedon its own as in combination with contract flexibility, yet if there is no evidenceof their extensive combination, the two approaches were far from beingmutually exclusive. The proportion of workplaces in which they were practisedside by side is not insignificant at around 20 per cent. Around three per centreported high levels of functional flexibility alongside the equivalent of contractflexibility and five per cent practised both together to a medium extent.
Table 5.2 The relationship between functional flexibility and contract flexibility – % of workplaces
CONTFLEX
FUNCFLEX none low high
none 44 43 30low 34 33 47medium 16 19 15high 6 6 9
Total 100 100 100
N 2916 1174 304p <.01gamma = .07
Table 5.3 The combinations of functional flexibility and contract flexibility – % of workplaces
FUNCFLEX/CONTFLEX
no FUNCFLEX or CONTFLEX 29low FUNCFLEX/low CONTFLEX 43both medium 5high FUNCFLEX 15high CONTFLEX 5both high 3
Total 100
N 4394p < .00gamma .07
As in the case of numerical flexibility, there was also very little evidence ofcontract flexibility being practised as an alternative approach to functionalflexibility. The numbers practising high levels of contract flexibility more or lesson its own were relatively low (5 per cent). Further analysis, which is not
51
Functional Flexibility, Contract Flexibility and Employment
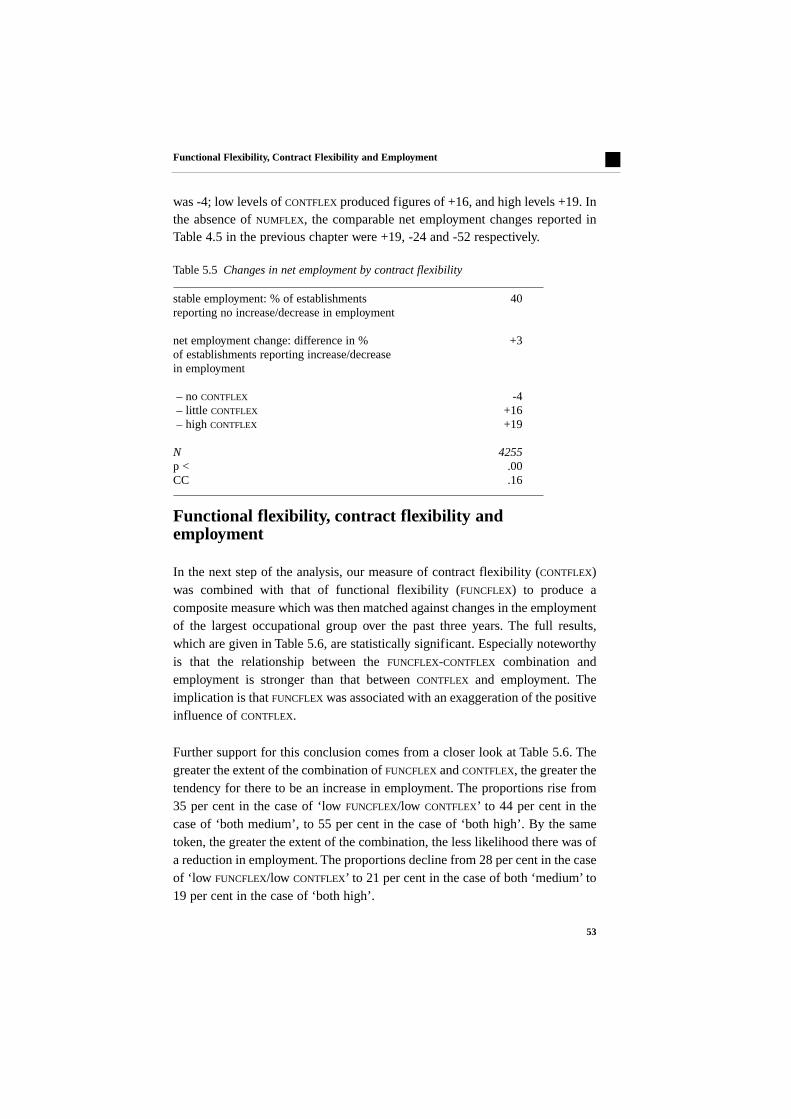
reported in Table 5.3, also revealed that in proportionate terms, the incidence ofthe indicators of contract flexibility was less in establishments withoutfunctional flexibility than in those with; this holds true both for thoseestablishments with any level of contract flexibility and for those practising it toa considerable degree.
Contract flexibility and employment
Table 5.4 gives full details of the relationship between different levels ofCONTFLEX, measuring increases in part-time/temporary working, and changes inthe employment of the largest occupational group over the past three years. Therelationship is significant, though less so than in the case of NUMFLEX in Chapter 4. The relationship is also very different. CONTFLEX is associated withemployment growth rather than reduction. In other words, the more CONTFLEX
was applied, the more likelihood there was of an increase in employment and theless likelihood of a reduction. Thus, in proportionate terms, 26 per cent ofestablishments without any CONTFLEX increased employment against 31 per centwho reduced it; whereas 43 per cent with high levels of CONTFLEX increasedemployment against 23 per cent who reduced it. It will also be seen thatemployment was more likely to stay the same in the absence of CONTFLEX (43per cent against 32 per cent for ‘a little’ and 34 per cent for ‘much’).
Table 5.4 Changes in employment by contract flexibility – % of workplaces
change in employmentlevel of contract flexibility (CONTFLEX)
none little much
reduced 31 26 23same 43 32 34increased 26 42 43
Total 100 100 100
N 2820 1145 290p < .00gamma = .20
The contrast between CONTFLEX and NUMFLEX becomes even clearer when thefocus is put on net employment change. It will be seen from Table 5.5 thatwhereas CONTFLEX was similar to NUMFLEX in terms of the stability ofemployment (40 per cent for both) and the overall net employment change (+5against +3), there are substantial differences in the levels of application of thetwo sets of practices. In the absence of CONTFLEX, the net employment change
52
Employment through Flexibility – Squaring the Circle?

was -4; low levels of CONTFLEX produced figures of +16, and high levels +19. Inthe absence of NUMFLEX, the comparable net employment changes reported inTable 4.5 in the previous chapter were +19, -24 and -52 respectively.
Table 5.5 Changes in net employment by contract flexibility
stable employment: % of establishments 40reporting no increase/decrease in employment
net employment change: difference in % +3of establishments reporting increase/decrease in employment
– no CONTFLEX -4– little CONTFLEX +16– high CONTFLEX +19
N 4255p < .00CC .16
Functional flexibility, contract flexibility andemployment
In the next step of the analysis, our measure of contract flexibility (CONTFLEX)was combined with that of functional flexibility (FUNCFLEX) to produce acomposite measure which was then matched against changes in the employmentof the largest occupational group over the past three years. The full results,which are given in Table 5.6, are statistically significant. Especially noteworthyis that the relationship between the FUNCFLEX-CONTFLEX combination andemployment is stronger than that between CONTFLEX and employment. Theimplication is that FUNCFLEX was associated with an exaggeration of the positiveinfluence of CONTFLEX.
Further support for this conclusion comes from a closer look at Table 5.6. Thegreater the extent of the combination of FUNCFLEX and CONTFLEX, the greater thetendency for there to be an increase in employment. The proportions rise from35 per cent in the case of ‘low FUNCFLEX/low CONTFLEX’ to 44 per cent in thecase of ‘both medium’, to 55 per cent in the case of ‘both high’. By the sametoken, the greater the extent of the combination, the less likelihood there was ofa reduction in employment. The proportions decline from 28 per cent in the caseof ‘low FUNCFLEX/low CONTFLEX’ to 21 per cent in the case of both ‘medium’ to19 per cent in the case of ‘both high’.
53
Functional Flexibility, Contract Flexibility and Employment
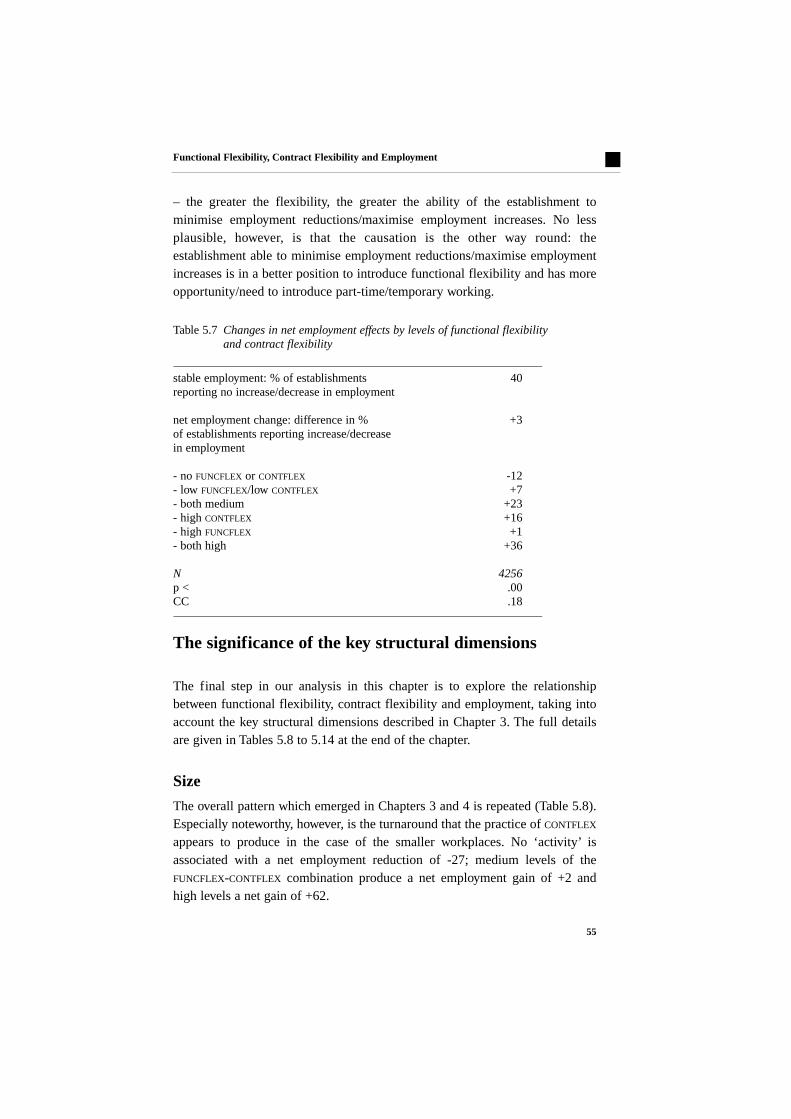
It will be also be seen from Table 5.6 that there was more likely to be an increasein employment where both CONTFLEX and FUNCFLEX were applied to aconsiderable extent than where one was used more or less on its own: 55 percent of establishments with high levels of both increased their employment,whereas 41 per cent and 25 per cent did so in the case of high levels of theindividual applications of CONTFLEX and FUNCFLEX respectively. Again, it is alsothe case that there was less likely to be a reduction in employment where bothwere applied to a considerable extent than where one was used: 19 per cent ofestablishments with ‘both high’ reduced their employment, whereas 25 per centof those with ‘high’ FUNCFLEX or CONTFLEX did so.
Table 5.6 Changes in employment by levels of functional flexibility and contractflexibility – % of workplaces
levels of CONTFLEX and FUNCFLEX
none low both high high both change in employment FUNCFLEX/ medium CONTFLEX FUNCFLEX high
low CONTFLEX
reduced 35 28 21 25 24 19same 41 37 35 34 51 26increased 24 35 44 41 25 55
Total 100 100 100 100 100 100
N 1214 1829 220 220 635 138p < .00CC = .18
The data in Table 5.7 on the changes in net employment effects associated withthe combination illustrate the point even more clearly. Especially worthy ofcomment are the changes associated with the high application of NUMFLEX andCONTFLEX, on the one hand, and those with the high application of thecombination, on the other. Combining functional with contract flexibility morethan doubles the net employment effect of high levels of contract flexibilityfrom +16 to +36, while the increase in the case of high levels of functionalflexibility goes from +1 to +36.
Again, these are important findings. The problem, as in the case of numericalflexibility discussed in the previous chapter, is that they do not tell us thedirection of causation. It is eminently plausible that combining functionalflexibility with contract flexibility would have a positive impact on employment
54
Employment through Flexibility – Squaring the Circle?

– the greater the flexibility, the greater the ability of the establishment tominimise employment reductions/maximise employment increases. No lessplausible, however, is that the causation is the other way round: theestablishment able to minimise employment reductions/maximise employmentincreases is in a better position to introduce functional flexibility and has moreopportunity/need to introduce part-time/temporary working.
Table 5.7 Changes in net employment effects by levels of functional flexibility and contract flexibility
stable employment: % of establishments 40reporting no increase/decrease in employment
net employment change: difference in % +3of establishments reporting increase/decrease in employment
- no FUNCFLEX or CONTFLEX -12- low FUNCFLEX/low CONTFLEX +7- both medium +23- high CONTFLEX +16- high FUNCFLEX +1- both high +36
N 4256p < .00CC .18
The significance of the key structural dimensions
The final step in our analysis in this chapter is to explore the relationshipbetween functional flexibility, contract flexibility and employment, taking intoaccount the key structural dimensions described in Chapter 3. The full detailsare given in Tables 5.8 to 5.14 at the end of the chapter.
Size
The overall pattern which emerged in Chapters 3 and 4 is repeated (Table 5.8).Especially noteworthy, however, is the turnaround that the practice of CONTFLEX
appears to produce in the case of the smaller workplaces. No ‘activity’ isassociated with a net employment reduction of -27; medium levels of theFUNCFLEX-CONTFLEX combination produce a net employment gain of +2 andhigh levels a net gain of +62.
55
Functional Flexibility, Contract Flexibility and Employment

SectorHere the pattern is similar to that found in Chapters 3 and 4. As Table 5.9 shows,there were again signs of greater activity overall in trade and services (privateand public) than industry or construction. In this case, however, trade andservices (private and public) did not just stand out on account the proportions ofestablishments with high levels of the combined measure. They were also moreto the fore among establishments which practised contract flexibility by itself.Construction also stands out on account of the relatively low level of contractflexibility, whether it is practised on its own or in combination with functionalflexibility.
Moving on to the relationship with employment, the biggest contrast is betweenindustry, on the one hand, and trade, private services and the public sector, onthe other (Table 5.10). Industry is the only sector in which high levels of contractflexibility practised with little or no functional flexibility is associated with anincrease in net loss of employment. Yet the association between the FUNCFLEX-CONTFLEX combination and employment is apparently greater in industry thanthe other sectors; medium and high levels of the combinations are the only twocategories showing positive signs. The position of trade is also worthy ofcomment. In this case there is a suggestion that the relatively moderate, ratherthan intensive, application of contract flexibility is associated with the biggestnet gains.
OwnershipThe influence of ownership appears to be particularly neutral in the case ofcontract flexibility. The overriding impression from Table 5.11 is that CONTFLEX
is positively associated with employment in whichever type of workplace it isfound. Deficits in the case of ‘inactive’ independent and domestically-ownedworkplaces are turned round and in the case of EU-owned ones reduced, whilein the case of non EU-owned ones, stability becomes growth.
Industrial relations contextChapter 3 found that although overall the workplaces with collectiveagreements, employee representation and high levels of union membershiptended to have poorer employment trends than those without, high levels ofFUNCFLEX accompanied the move to a positive trend. The same overallconclusion holds even more so for CONTFLEX (Table 5.12): deficits of -18 and-24 for workplaces with collective agreements and employee representation but‘no activity’, are turned into gains of +39 and +29 where there are high levels
56
Employment through Flexibility – Squaring the Circle?

of the FUNCFLEX-CONTFLEX combination. Yet CONTFLEX, it seems, is not
associated with the positive trend to the same extent in workplaces with high
levels of union membership. Indeed, unionised workplaces are the only ones
where high levels of contract flexibility are associated with a net employment
loss of (-24).
Country
As the results in Table 5.13 show, Spain, Portugal and Italy are again at the
extreme of the inactivity continuum, with figures of 88 per cent, 89 per cent and
88 per cent respectively for no or low levels of activity compared to the 10-
country average of 69 per cent. It is the position of some of the other countries
which is intriguing, however. France, for example, has an above average
proportion of workplaces with high levels of functional flexibility (19 per cent)
and contract flexibility (11 per cent), but is slightly below average for the
FUNCFLEX-CONTFLEX combination. Denmark, Germany and Sweden have above
average figures for the stand-alone practice of functional flexibility. By contrast,
in these countries, the proportion of establishments with high levels of contract
flexibility, either on its own (3 per cent, 5 per cent and 3 per cent respectively)
or in combination with high levels of functional flexibility (2 per cent, 3 per cent
and 6 per cent respectively), is relatively low. In these cases, it is tempting to
suggest, functional flexibility and contract flexibility may tend to be seen more
as alternatives than in other countries. The countries achieving the highest
scores for the combinations were Ireland (15 per cent) followed by the
Netherlands (9 per cent).
As the previous chapter pointed out, the country data on employment have to be
treated with extreme caution because of the small numbers in many of the
categories. Focusing on the first two rows of the bottom half of Table 5.14
suggests that in nine of the ten countries, the application of a little FUNCFLEX and
CONTFLEX is associated with an increase in net employment gains or a decrease
in the net employment loss. The one exception is the UK, where this application
is accompanied by a move from a net employment gain of +10 to a net
employment loss of -4. The largest increases/decreases are to be found in Spain,
followed by France and Portugal. Not surprisingly in view of the remarks above,
the countries with little or no contract flexibility, such as Denmark, Germany
and Sweden, show smaller differences.
57
Functional Flexibility, Contract Flexibility and Employment

Summary
Contract flexibility, like the numerical flexibility discussed in Chapter 4, is lessin evidence than functional flexibility. Around one third of establishmentsreported increases in our measure of contract flexibility, ie increases in the useof part-time working or temporary working, compared to 58 per cent forfunctional flexibility. The proportion with a high level of contract flexibility isalso small (seven per cent), although on a par with that for functional flexibility(six per cent).
Contract flexibility and functional flexibility, like numerical flexibility andfunctional flexibility, are far from being mutually exclusive. Around 18 per centof the total number of establishments have both to some degree. Furthermoresome eight per cent of establishments combine functional and contractflexibility to a medium or high extent. The proportion of establishmentspractising contract flexibility on its own was also small.
Although the figures for incidence are very similar, the practice of contractflexibility has a very different relationship with employment from the numericalflexibility considered in Chapter 4. Whereas numerical flexibility wasaccompanied by significant reductions in employment in most cases, theopposite is true of contract flexibility. The more contract flexibility was applied,the less the likelihood of reductions in employment and the greater thelikelihood of stability or increases in employment. Contract flexibility alsointerrelates with functional flexibility in a particular way. When functionalflexibility and contract flexibility are combined, their association with positiveemployment outcomes is enhanced. Far from being antithetical, it seems,functional flexibility and contract flexibility are mutually reinforcing.
The pattern of association of the key structural dimensions uncovered inChapter 3 and confirmed in Chapter 4 is mostly repeated. In the case of sector,however, it is worth emphasising that the incidence of contract flexibilityappears to be especially low in construction. In the case of country, Portuguese,Spanish and Italian establishments are again characterised by relative inactivity,although less so than in the case of numerical flexibility. German and Danishestablishments seem to practise less contract flexibility than functionalflexibility, as does Sweden, albeit to a lesser extent. France and Ireland are at theother extreme: France has the largest proportion of establishments with high
58
Employment through Flexibility – Squaring the Circle?

levels of contract flexibility, while Ireland has the largest with high levels of thecombination of functional flexibility and contract flexibility.
References
European Commission, Employment Report 1996, Luxembourg, Office forOfficial Publications of the European Communities, 1997.
Leat, M., Human Resource Issues of the European Union, London, FinancialTimes Pitman, 1998.
59
Functional Flexibility, Contract Flexibility and Employment

Table 5.8 Functional flexibility/contract flexibility and net employment change by size
Number of employees (% of establishments)
ten-country -49 50-499 500+ average employees employees
stable employment: % of 40) 49 37 31)establishments reporting no increase/decrease in employment
net employment change: +3) -7 +7 -8)difference in % of establishments reporting increase/decrease in employment
- no FUNCFLEX or CONTFLEX -12) -27 -7 -28)- low FUNCFLEX/low CONTFLEX +7) -6 +11 -2)- both medium +24) +2 +32 (-9)- high CONTFLEX +16) +38 +13 (+5)- high FUNCFLEX -1) +1 +1 -3)- both high (+37) +62 +36 (0)
N 4256) 862 3018 229)p < .00) .00 .00 .00)CC .18) .31 .16 .18)
NB Entries in brackets involve small numbers, ie single figures in the case of theestablishments reporting either an increase or decrease in employment.
Table 5.9 Functional flexibility and contract flexibility by sector – % of workplaces
none low both high high both total NFUNCFLEX/ medium FUNCFLEX CONTFLEX high
low CONTFLEX
ten-country average 29 43 5 15 5 3 100 4395industry 33 48 3 11 6 2 100 1710construction 40 40 3 15 1 2 100 309trade 28 41 8 13 9 100 870private services 25 38 6 20 7 4 100 672public sector 22 39 6 20 6 6 100 828
p < 00CC = .22
60
Employment through Flexibility – Squaring the Circle?

Table 5.10 Functional flexibility/contract flexibility and net employment change by sector
ten-country industry con- trade private publicaverage struction services sector
stable employment: % 40 33 30) 42) 45) 50of establishments reporting no increase/decrease in employment
net employment change: +3 -5 -12) +13) +10) +8difference in % of establishments reporting increase/decrease in employment
- no FUNCFLEX -12 -20 -30) -1) +5) -3or CONTFLEX
- low FUNCFLEX/ +7 +4 +9) +7) +12) +9low CONTFLEX
- both medium +24 +13 (-22) +48) +12) +19- high CONTFLEX +16 -22 (-) +47) +10) +26- high FUNCFLEX -1 -4 -26) +13) +7) -1- both high +37 +32 (-) (+40) (+33) +44
N 4256 1612 291) 805) 638) 762p < .00 .00 .26) .32) .13) .26CC .18 .18 .05) .00) .30) .00
NB Entries in brackets involve small numbers, ie single figures in the case of theestablishments reporting either an increase or decrease in employment.
61
Functional Flexibility, Contract Flexibility and Employment

Table 5.11 Functional flexibility/contract flexibility and net employment change by status/ownership
ten-country independent domestically- EU- Non EU-average owned owned owned
stable employment: % of 40 42 41 30) 23)establishments reporting no increase/decrease in employment
net employment change: +3 +7 -1 -9) +9)difference in % of establishments reporting increase/decrease in employment
- no FUNCFLEX or CONTFLEX -12 -5 -23 -28) 0)- low FUNCFLEX/low CONTFLEX +7 +12 +6 -5) +23)- both medium +24 +5 +14 (+13) (-)- high CONTFLEX +16 +7 +17 (+30) (+18)- high FUNCFLEX -1 +6 -4 (-22) (-9)- both high +37 +51 +32 (+37) (+50)
N 4256 2055 1346 425) 230)p < .00 .00 .00 .00) .01)CC .18 .16 .23 .32) .33)
NB Entries in brackets involve small numbers, ie single figures in the case of theestablishments reporting either an increase or decrease in employment.
62
Employment through Flexibility – Squaring the Circle?
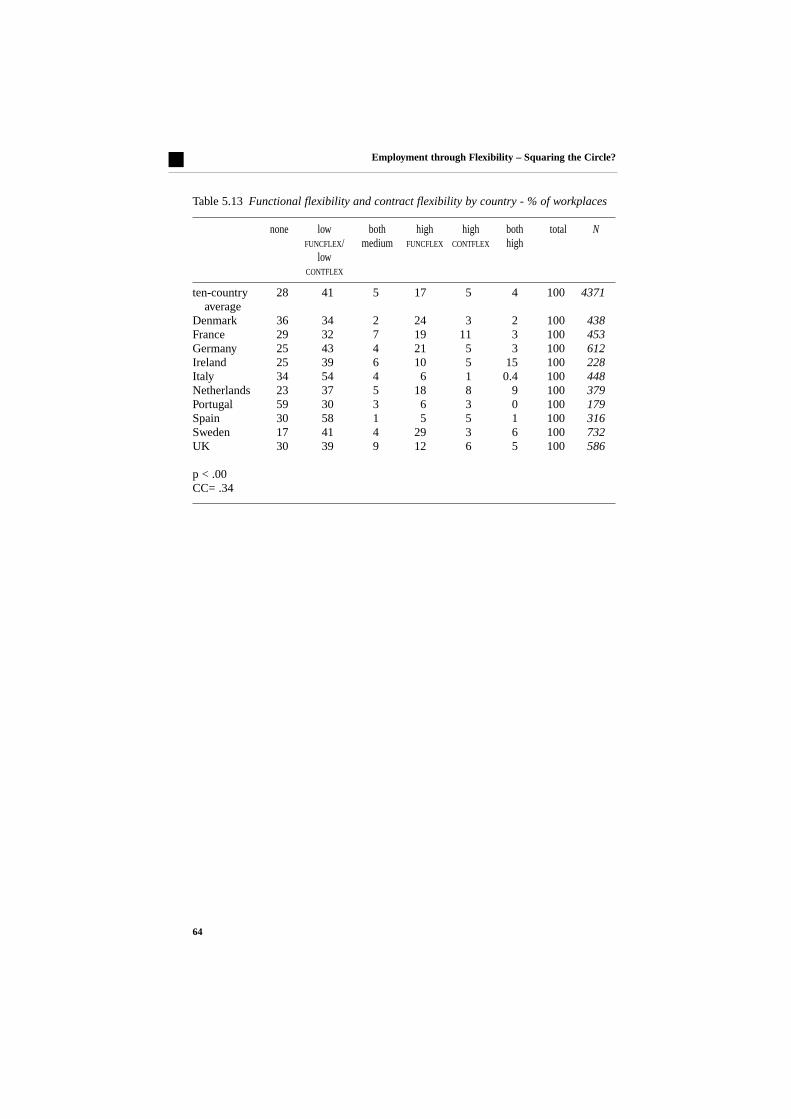
Table 5.12 Functional flexibility/contract flexibility and net employment change by industrial relations context
ten-country collective union employeeaverage agreement membership representation
No Yes 0-29% 30-100% No Yes
stable employment: % of 40 40 38 41 36 44 37establishments reporting no increase/decrease in employment
net employment change: +3 +18 -1 +48 -12 +54 -1difference in % of establishments reporting increase/decrease in employment
- no FUNCFLEX or CONTFLEX -12 +10 -18 -1 -32 +3 -24- low FUNCFLEX/ +7 +15 +5 +3 -2 +9 +7
low CONTFLEX
- both medium +24 +40 +19 +33 +14 +19 +22- high CONTFLEX +16 +29 +14 +32 -24 +9 +16- high FUNCFLEX -1 +21 -6 +9 -10 +17 -9- both high +37 +38 +39 +48 +12 +54 +29
N 4256 833 3294 2421 1663 1305 2850p < .00 .05 .00 .00 .00 .00 .00CC .18 .16 .20 .23 .18 .23 .20
63
Functional Flexibility, Contract Flexibility and Employment

Table 5.13 Functional flexibility and contract flexibility by country - % of workplaces
none low both high high both total NFUNCFLEX/ medium FUNCFLEX CONTFLEX high
low CONTFLEX
ten-country 28 41 5 17 5 4 100 4371average
Denmark 36 34 2 24 3 2 100 438France 29 32 7 19 11 3 100 453Germany 25 43 4 21 5 3 100 612Ireland 25 39 6 10 5 15 100 228Italy 34 54 4 6 1 0.4 100 448Netherlands 23 37 5 18 8 9 100 379Portugal 59 30 3 6 3 0 100 179Spain 30 58 1 5 5 1 100 316Sweden 17 41 4 29 3 6 100 732UK 30 39 9 12 6 5 100 586
p < .00CC= .34
64
Employment through Flexibility – Squaring the Circle?

Table 5.14 Functional flexibility/contract flexibility and net employment change by country
ten-country DK FR GER IR IT NL POR SP SW UKaverage
stable employment: % 40 50) 38) 43) 43) 31) 45) 50) 35) 44) 41)of establishments reporting no increase/decrease in employment
net employment change: +3 +18) +6) -12) +32) +12) +18) +4) +2) +3) +7)difference in % of establishments reporting increase/decrease in employment
- no FUNCFLEX -12 -1) -30) -21) +32) +1) -6) -15) -38) -21) +10)or CONTFLEX
- little FUNCFLEX/ +7 +15) +12) -12) +34) +19) +28) +27) +21) -4) -4)little CONTFLEX
- both medium +24 (+78) (+58) (-19) (+36) (+15) (+30) (+50) (+100) 0) +20)- high CONTFLEX +16 (+67) +32) (-14) (+50) (+25) (+24) (+20) (-11) (-4) (+31)- high FUNCFLEX -1 +36) +4) -9) (+36) (+4) +11) (+60) (-19) +11 +8)- both high +37 (+57) (+43) (+50) (+17) (+100) (+39) nocase (+50) (+3) (+15)
N 4256 432) 439) 602) 219) 425) 373) 177) 316) 732) 557)p < .00 .00) .00) .00) .00) .46) .00) .00) .00) .00) .08)CC .18 .30) .39) .25) .31) .15) .33) .41) .39) .23) .17)
NB Entries in brackets involve small numbers, ie single figures in the case of theestablishments reporting either an increase or decrease in employment.
65
Functional Flexibility, Contract Flexibility and Employment

Innovation, and its links with participation, have become increasingly central tothe flexibility debate. To quote only from the policy literature, EuropeanCommission documents from the White Paper, Growth Competitiveness andEmployment (1994), to the Green Paper, Partnership for a New Organisation ofWork (1997), firmly link participation and innovation. Even a more‘technologically’ oriented document like the Green Paper on Innovation(1995:11), states that ‘the motivation and participation of employees is criticalfor its [innovation’s] success’. The participative firm, in other words, is theinnovative firm.
The argument for participation thus shifts from employees’ rights and thequality of working life as ends in themselves to a more instrumental argumentabout the factors that contribute to competitiveness. If the link betweenparticipation and innovation is true, then the result is a politically desirablewin/win situation: participation is both an example of social partnership, and acrucial component of the European high road of development – a road thatcombines economic growth, social cohesion, and crucially for our concerns, amore democratic (or at least more humane) working environment.
This chapter uses the EPOC survey data to provide some empirical evaluationof these claims. Of necessity, it presents a rather more complex picture than theprogrammatic policy documents. While they leave terms like ‘participation’ or‘partnership’ undefined, the EPOC study as a whole examines one aspect ofparticipation, namely ‘direct participation’, the involvement of employees
67
Chapter 6 Functional Flexibility, Innovationand Employment

themselves in the immediate organisation of their own work. Within that generalframework, this particular report focuses on delegative direct participation or‘functional flexibility’. EPOC distinguishes all such forms of directparticipation from indirect participation, ie the involvement of employeerepresentatives, such as trades union delegates or works councillors, in theorganisation of work at enterprise level. Accordingly, this chapter examines therelationship between functional flexibility and innovation, and treats theindustrial relations issues (the role of trades unions and other forms ofrepresentation) as one dimension of the context within which innovation anddirect participation do or do not occur.
The first EPOC survey report has already approached some of these issues.Chapter 6 in that report showed that direct participation is indeed linked withmanagement initiatives in other areas (ranging from strategic and organisationalchanges through to technical innovation). ‘Active’ workplaces, wheremanagement is taking a range of initiatives including direct participation,amount to less than a fifth of the sample. They are particularly common inDenmark, Germany, the Netherlands and the UK. The same chapter reportedthat whereas such general management initiatives are strongly linked to thepresence of competition, this competition effect is weaker on direct participationper se. Finally, multinational companies are particularly likely not just to usedirect participation but also to be more ‘active’ in general. This chapter nowcontinues this analysis and disentangles innovation from other managementinitiatives.
This chapter follows the structure of the previous ones. The first section givesdetails of the extent of the innovation practised by our establishments. Thesecond investigates the extent to which our measures of functional flexibilityand innovation are combined. The third asks whether our measure of innovationwas associated with reduction, stability or increase in the employment of thelargest occupational group over the past three years. The fourth investigates therelationship between the combinations of functional flexibility and innovationand the trends in employment of this group. Finally, the fifth section seeks toestablish which, if any, of the structural dimensions was significant for thisrelationship.
The nature and extent of innovation
The measure of innovation used in the analysis, it will be recalled fromChapter 2, is based on four items. Three are initiatives taken ‘by the
68
Employment through Flexibility – Squaring the Circle?

management of this workplace in the last three years’: the introduction of newinformation technology, of automation and of product innovation. The fourth iswhether the largest occupational group ‘has been directly affected in the lastthree years by major changes in work organisation involving newplant/machinery/automation’. These are combined in a simple additive index ofinnovation (INNOVAT).
At first glance innovation does not appear to be very widespread in the sampleworkplaces (Table 6.1). Fully 30 per cent of the workplaces report no innovationwhatsoever (‘none’), and only 3 per cent report all four items occurring(‘intense’). However, this should be compared with the fact that fully 42 per centof all workplaces report no functional flexibility. In other words, at the lower endof the intensity scale, enterprises find it easier to make technical changes thanorganisational changes.
Table 6.1 The extent of innovation – % of workplaces
none 30 very little 34little 23 medium 10 intense 3
Total 100
N 5786
The relationship between functional flexibility andinnovation
Functional flexibility is the extent to which employees are able to carry outdifferent tasks. To the extent that these tasks vary in difficulty, this obviouslyinvolves questions of competence and skill. Furthermore, such skills are goingto be more important as it becomes more difficult to specify in advance theprecise tasks to be carried out. Functional flexibility involves questions ofcommitment and trust, since employees need to make decisions on their own,and possibly even to make decisions which may be beyond the competence oftheir superiors to understand. It is for these reasons that the EPOC study linksfunctional flexibility and direct participation.
Our main measure of functional flexibility is FUNCFLEX. This measures theintensity of delegative direct participation. Since delegative direct participation
69
Functional Flexibility, Innovation and Employment

is where either individuals or groups are delegated authority to make decisionsabout their immediate work, this approximates to the concept of functionalflexibility found in the literature and, crucially, to the form of directparticipation most plausibly linked to innovation.
Once again, such combined measures show that enterprises with extremes ofparticipation are infrequent. Recall the finding of the general report thatalthough direct participation is widespread within European firms, it usuallytakes much more restricted forms than in the widely reported case studies. Amere six per cent of firms are reported as having ‘high’ intensity of delegativedirect participation, whereas 42 per cent have none at all.
However, the fact that extremes of innovation and of participation are bothinfrequent does not of itself challenge the ‘high road’ argument. If innovationrequires delegative direct participation, then we would expect that those fewcases of intense innovation are disproportionately likely to have a high intensityof direct participation. However, this is not the case. There is very littlerelationship between the intensity of delegative direct participation and the levelof innovation (Table 6.2). It is certainly true the cases cluster in the top left handcorner of the table, but this is simply because most workplaces score low onboth measures. Of those that do have ‘intense’ innovation, however, only sevenper cent have high participation – exactly the same proportion as those with verylow innovation. In other words, rather than direct participation and innovationgoing together, they seem to have little relationship to each other.
Table 6.2 The relationship between functional flexibility and innovation – % of workplaces
INNOVAT
FUNCFLEX none very low low medium intense
none 47 43 37 35 50low 34 35 38 42 27medium 15 16 20 15 16high 3 7 7 8 7
Total 100 100 100 100 100
N 1705 1951 1347 595 187p < .00gamma = .01
70
Employment through Flexibility – Squaring the Circle?

As in the case of previous chapters, these results can be used to show thedifferent combinations of innovation and participation. In the present case, Table6.3 shows that while 14 per cent of workplaces have neither innovation nordirect delegative participation, only 2 per cent are ‘high’ on both variables.Equally, there are significant minorities which are high on innovation and not onparticipation or vice versa.
Table 6.3 The combinations of functional flexibility and innovation – % of workplaces
FUNCFLEX/INNOVAT
no FUNCFLEX or INNOVAT 14low FUNCFLEX/low INNOVAT 53both medium 10high INNOVAT 6high FUNCFLEX 15both high 2
Total 100
N 5786p < .00 .00gamma = .01 .01
Innovation and employment
Table 6.4 shows that innovative workplaces are likely to increase employment.Where there is no innovation, only 26 per cent of all workplaces show anincrease in employment of the largest occupational group; where innovation isintense, the proportion rises to 52 per cent. Yet the relationship betweeninnovation and employment is not a simple linear one, for the level of innovationmakes no difference to the extent to which workplaces are likely to reduceemployment. Where there is no innovation 31 per cent of workplaces reduceemployment, and where innovation is intense the proportion is almost exactlythe same (30 per cent). As Table 6.4 shows, the effect of rising levels ofinnovation is simply to make workplaces less likely to have ‘constant’employment and more likely to have ‘increased’ employment, but it makes verylittle difference to their likelihood of losing employment. Nonetheless, theEPOC survey does confirm an ‘optimistic’ approach to innovation andemployment: job numbers are more likely to grow where workplaces introduce(technological) innovation.
71
Functional Flexibility, Innovation and Employment

Table 6.4 Changes in employment by level of innovation - % of workplaces
level of innovation
change in employment none very little little medium intense
same 43 41 37 38 18reduced 31 26 28 23 30increased 26 32 35 39 52
Total 100 100 100 100 100
N 1592 1871 1302 582 182p < .00gamma = .11
Functional flexibility, innovation and employment
Chapter 3 has already shown that functional flexibility has a weak but positiverelationship with employment: there is a linear relationship between theintensity of delegative direct participation and the number of workplacesreporting employment growth. What then is the combined effect of innovationand functional flexibility? Are they mutually reinforcing or do they, at least tosome extent, cancel each other out? Given the very weak relationship betweeninnovation and functional flexibility noted above, the latter is the most likelyoutcome. Table 6.5 shows the basic information.
Table 6.5 Changes in employment by levels of functional flexibility and innovation – % of workplaces
levels of FUNCFLEX and INNOVAT
none low both high high both change in employment FUNCFLEX/ medium FUNCFLEX INNOVAT high
low INNOVAT
reduced 31 30 23 20 28 27same 46 37 40 47 33 19increased 23 33 38 34 40 54
Total 100 100 100 100 100 100
N 743 2938 595 826 337 89p < .00CC = .14
72
Employment through Flexibility – Squaring the Circle?

Relating our combination of functional flexibility and innovation withemployment changes shows a clear relationship. The employment effect ofinnovation and functional flexibility combined is rather similar to that ofinnovation by itself: with increasing intensity the proportion of workplacesreporting no change in employment falls, while the proportion reporting anincrease rises. While this trend is consistent, there is no clear concomitant fallin the proportion of workplaces reporting reduced employment. High innovationand high functional flexibility independently produce an increase inemployment: where there is neither innovation nor functional flexibility, only 23per cent of workplaces gain employment. By contrast, where there is highinnovation the proportion rises to 40 per cent and to 34 per cent for functionalflexibility. In these terms innovation has a greater impact on employment thanfunctional flexibility. More importantly, their combined effect is clearlypositive: where there is both high innovation and high functional flexibility(‘high both’) the proportion of workplaces with employment growth rises tofully 54 per cent.
Table 6.6 Functional flexibility, innovation and net employment change
stable employment: % of workplaces 40reporting no increase/decrease in employment
net employment change: difference in +5% of workplaces reporting increase/decrease in employment
no FUNCFLEX or INNOVAT -8low FUNCFLEX/low INNOVAT +2both medium +14high INNOVAT +12high FUNCFLEX +14both high +27
N 5528p < .00CC .14
The employment impact of innovation and functional flexibility can also be seenby calculating for each category the percentage difference between workplacesreporting an employment gain and those reporting reduced employment (Table6.6). Where there is neither functional flexibility nor innovation (‘nothing’) thisis clearly negative at -8 per cent, but for all other categories the percentagedifference is positive, rising from 2 per cent for ‘both low’ through to 27 per cent
73
Functional Flexibility, Innovation and Employment

for ‘both high’. Given the small absolute numbers in the ‘high both’ category, itis important to notice the clear linear growth in the percentage difference from-8 per cent of ‘nothing’ through +2 per cent for ‘both low’ to +14 per cent for‘both medium’. This strengthens confidence in the figure for ‘high both’. Thecombined effect of functional flexibility and innovation is clearly therefore toincrease employment.
This part of the analysis therefore ends with an optimistic result. Earlier it wasshown that there was little overall relationship between innovation andfunctional flexibility. Nonetheless, we now see that where the two managementstrategies are combined, they do have a strong and positive effect onemployment.
The significance of the key structural dimensions
The structural dimensions (size, sector, ownership, industrial relations contextand country) influence the impact of innovation and functional flexibility onemployment. Each is discussed in turn.
SizeSize has an effect on innovation by itself and combined with direct participation.Not only is innovation more likely in large workplaces (Table 6.7), but the fewcases where INNOVAT is combined with FUNCFLEX are also more likely to be largeworkplaces.
The consequences of functional flexibility and innovation for employment arealso affected by the size of the workplace within which they occur. In smallworkplaces, job losses outweigh job gains where there is little or no innovationor little or no functional flexibility. Where there is innovation or functionalflexibility, and particularly where both are combined (‘high both’) there are jobgains.
In medium-sized workplaces job gains occur in all categories except where thereis no activity in either innovation or functional flexibility. Job losses here areconcentrated in the ‘inactive’ workplaces. In the medium-sized workplaces, asinnovation and functional flexibility increase in intensity, there is a clear growthin employment gains relative to employment losses: from -4 per cent in the‘nothing’ category, through +6 per cent in ‘both low’, and +20 per cent in ‘bothmedium’, to +36 per cent in the ‘high both’ category. As the previous section has
74
Employment through Flexibility – Squaring the Circle?

shown, this particular linear increase in employment gains relative toemployment losses exists in the sample as a whole; we shall see that it emergesin most sub-divisions of the sample. Furthermore, where numbers in the ‘highboth’ category are too small for meaningful analysis, this growth occurs fromthe inactive through to the ‘both medium’ categories.
In large workplaces job losses outweigh job gains. As we would expect, this isso in completely or nearly inactive workplaces (‘nothing’ or ‘low’ on bothdimensions). There is some suggestion in the data that innovation either aloneor in combination with functional flexibility does not have a positive effect onemployment in large workplaces, but the numbers in the individual categoriesare too small to draw any clear conclusions.
SectorTable 6.8 shows that innovation varies by sector, with innovation being morewidespread in industry than in services or trade. In industry six per cent of allworkplaces report ‘intense’ levels of innovation and only 20 per cent noinnovation. At the other extreme, over half of the workplaces in the constructionsector report no innovation at all, and none ‘intense’ levels.
Given the impact of sector on innovation per se, it is hardly surprising that sectoralso affects the combination of innovation and direct participation. Innovationby itself, and in combination with direct participation, is particularly likely inindustry. While there is no table to refer to here, 12 per cent of workplaces have‘high’ innovation and in a further 3 per cent of cases this is combined with highdelegative direct participation. In no other sector does this proportion exceed 2 per cent. By contrast, delegative direct participation by itself is rarest inindustry (7 per cent) and most likely in the non-profit sector (22 per cent). Thepattern for consultative direct participation and innovation is similar, though lesspronounced. The literature on direct participation and innovation is sometimescriticised for drawing its exemplars of best practice from manufacturingindustry. Our data suggests that this criticism is misplaced. To the extent thatinnovation and participation are combined, this rather infrequent event is mostlikely to occur in manufacturing industry.
Overall, there are employment gains in services, and to a lesser extent in thepublic sector and in trade (Table 6.9). By contrast, workplaces in industry andin particular in construction were more likely to report job losses than job gains.When this general trend is combined with the innovation and functional
75
Functional Flexibility, Innovation and Employment

flexibility typology, the specific nature of industry becomes clear. In industry,when both innovation and functional flexibility occur together, their intensity isdirectly related to employment growth: workplaces with no activity have a -24per cent percentage difference in employment; this becomes -3 per cent wherethere is ‘low’ activity on both dimensions, +8 per cent for ‘medium’ and fully+25 per cent for ‘high’. While innovation by itself has a slight negative impacton employment, workplaces with functional flexibility show a 17 per cent gain.Finally, workplaces with both high functional flexibility and high innovationshowed a 25 per cent percentage difference between those reporting job lossesand those reporting job gains. In the other sectors, small cell numbers makedetailed analysis less plausible. A similar linear relationship betweenemployment and combined innovation and functional flexibility appears to existin trade and the public sector, but not in services.
OwnershipThe status of the workplace also has some effect, although the key difference iswhether or not the workplace is owned from within the EU. Non-EU workplacesare more likely to be innovative, and more likely to combine this with eitherform of direct participation. Again, it must be stressed that we are dealing witha very small proportion of the total number of cases.
The extremes of employment growth and decline are concentrated in the foreignowned sector in each country (Table 6.10). Thus while EU-owned workplacesshow the most substantial decline (-14 per cent), workplaces owned fromoutside the Union are more likely to be expanding. This difference between thedifferent ownership groups does not, however, undermine the basic relationshipbetween innovation, functional flexibility and employment growth. In everycategory increased intensity in the combination of innovation and functionalflexibility remain associated with increasing employment.
Industrial relations contextThe least significant structural variables are those concerned with industrialrelations. The various aspects of industrial relations (presence of a collectiveagreement, high proportion of the workforce unionised, the existence ofemployee representatives) seem to have very little impact on the distribution.Where there are relationships, these are not consistent. Thus a high level ofinnovation (not associated with functional flexibility) is more likely in lessunionised firms. This is probably explained by size and sector effects, given thatunions are more likely in large firms and in manufacturing industry, and as we
76
Employment through Flexibility – Squaring the Circle?

have seen, this is where (technical) innovation is most prevalent. By contrast,there is a slight negative relationship between the coverage of collectiveagreements and the extent of stand-alone innovation.
As for trends in employment, the findings are similar to those of previouschapters (Table 6.11). Employment growth is stronger where such ‘indirectparticipation’ is weaker. For example, overall of those workplaces with acollective agreement, the percentage difference (growth-loss) was two per cent,as opposed to fully 16 per cent where there was no such agreement. This greateremployment growth for workplaces with weaker indirect participation applied toall categories. Finally, once again there was a linear relationship between thecombination of functional flexibility and innovation with employment growth.
Country
There are substantial national differences. Table 6.12 shows the proportions ofworkplaces in each country which have ‘medium’ or ‘intense’ levels ofinnovation. At one extreme, over a fifth of Danish and Italian workplaces havehigh levels of innovation, whereas at the other extreme this applies to less thana tenth of workplaces in France and Sweden, a lower level of innovation thanPortugal.
One possible explanation for these striking variations is a sector effect, duepossibly to differential non-response rates. Given that industry has aboveaverage innovation, any over-representation of industry within each nationalsample will distort the result. This is part (but only part) of the explanation forItaly. Overall, 34 per cent of workplaces are in industry, but in Italy this is 62 percent. In other countries the proportion of workplaces in industry ranges fromSpain, at 42 per cent, to the Netherlands, at 20 per cent. Examining innovationby sector and controlling for country shows whether there are clear countrypatterns of innovation. Thus, in Italy, innovation is high in services and trade aswell as in industry. Italy’s high level of innovation is probably exaggerated byour study, but is nonetheless a real feature of Italian workplaces.
Sampling issues do not explain the high innovation score for Denmark.Innovation in Danish industry is high (41 per cent), but it is also high in services(19 per cent) and the public sector (13 per cent). Even though innovation in thetrade sector is low (3 per cent), the Danish score is not reducible to one sectorand certainly cannot be explained by any over-representation of industry.
77
Functional Flexibility, Innovation and Employment

In France, innovation scores are low in all sectors. Equally, in Germanyinnovation is just above the 10-country average in all sectors: there is no sign ofthe high levels of innovation one might have expected from industry. In Spainindustry is overrepresented but levels of innovation are low everywhere. In theNetherlands, innovation is very high in industry and trade, but average inservices.
Finally, a low country level of innovation could be explained by an over-representation of the public sector in the sample, given that the public sector hasthe lowest level of innovation apart from construction. Thus, in Sweden the lowlevel of innovation is partly explained by an overrepresentation of the publicsector in the sample (30 per cent of cases as against 22 per cent for allcountries). Yet this does not completely explain Sweden’s low level ofinnovation, for Swedish industry itself also has a below-average level ofinnovation (19 per cent as against a ten-country average of 22 per cent).
The pattern of employment growth in the different countries is broadly in linewith more conventional measures: particularly high growth (ie high percentagedifference between growing workplaces and declining workplaces) was reportedin Denmark, Ireland and the Netherlands (Table 6.13). At the other extreme, inGermany, Portugal and Sweden more workplaces lost jobs than gained them.The only anomaly here is Portugal.
Of all the structural dimensions, country analysis above all produces many cellswith few or no cases. Examining only the cells with ten or more cases, it is clearthat virtually all countries show the relationship between innovation, functionalflexibility and employment already described above. With two exceptions, in allcountries employment growth becomes more likely as functional flexibility andinnovation are increased from ‘nothing’ through ‘both low’ to ‘both medium’(the absolute numbers for intense innovation and functional flexibility, whetherby themselves or in combination, are virtually always too small for analysis).The UK, the Netherlands and to some extent Denmark, do not fit this pattern.In Denmark the relationship is the ‘normal’ association of increasing functionalflexibility and innovation with employment growth, but two of the three relevantvalues are calculated from cells with less than ten cases, while high innovationby itself has a negative effect on job growth. In the Netherlands ‘both low’ islinked to more employment growth than ‘both medium’, while in the UK‘nothing’ and ‘both low’ produce almost the same employment effect.
78
Employment through Flexibility – Squaring the Circle?

Finally, it is worth examining the extremes of employment change. Three smallcountries – Denmark, Ireland and the Netherlands – have achieved noticeablyhigher employment growth than the rest. At the country level of aggregation,there does seem to be some relationship with innovation. Of the three countries,Denmark and the Netherlands are second and third respectively in theinnovation ranking (Table 6.12), although Ireland’s first in employment growth(Table 6.13) is associated with seventh position in innovation.
Ranking the countries by intensity of functional flexibility (proportion ofworkplaces scoring ‘high’ on FUNCFLEX) also places Ireland and the Netherlandsrelatively high (second and fourth place respectively), but Denmark is seventh(no table). At the other extreme, two of the three countries with net employmentloss, Germany and Sweden, are in the top half of the distribution for functionalflexibility but in the bottom half of the innovation ranking. At the country level,innovation rather than functional flexibility would therefore appear to be moreimportant in creating employment growth.
Conclusion
This chapter has shown that one of the key premises of a European ‘high road’of economic growth – that the direct participation which is our proxy forfunctional flexibility goes hand in hand with innovation – does not happen veryoften. Nearly one in three workplaces reported no innovation, while only threeper cent admitted to four items: only two per cent achieved high scores for bothfunctional flexibility and innovation. The relationship between functionalflexibility and innovation, it seems, is contingent rather than inherent. Policiesthat seek to stimulate participation are no substitute for policies to stimulateinnovation.
It is possible to locate situations in which these best practice cases are morelikely to occur: in industry rather than services, in large rather than smallworkplaces, and in particular countries. However, the country analysis hasshown that at this level too there is no relationship between the extent to whichworkplaces are innovative and the extent to which such workplaces in turn alsopractise functional flexibility. Some countries have low levels of innovation, buthigh levels of functional flexibility. Rather than seeing the two as necessarilyconnected and as an inherent part of an innovative economy, it is reasonable tosuggest that organisations (and indeed countries) choose particular forms. Thedirect participation which is our proxy for functional flexibility is neither anecessary nor a sufficient condition for innovation.
79
Functional Flexibility, Innovation and Employment
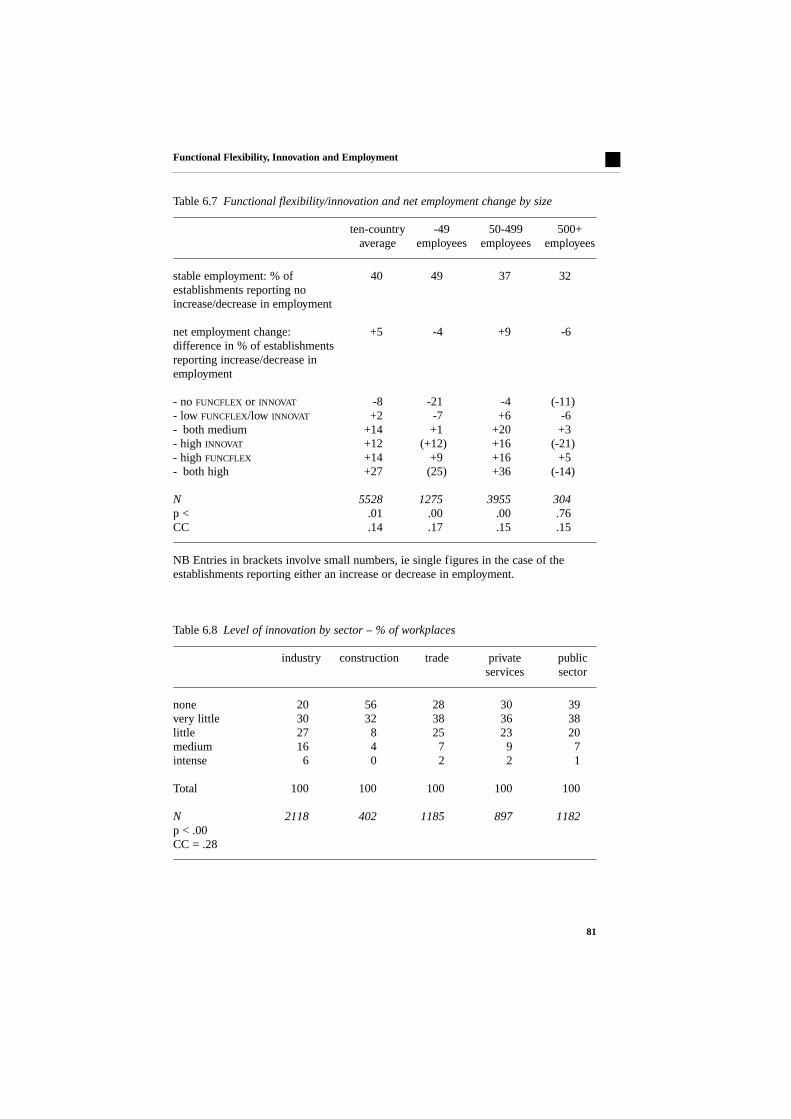
Although there is no clear relationship between functional flexibility andinnovation, this chapter has produced evidence to support a second premise ofthe ‘high road’ approach – that the combination of functional flexibility andinnovation is associated with employment growth. Significantly, too, thisconclusion seems to apply not just to the few extreme cases where intensefunctional flexibility is combined with intense innovation. It is also the case that,as workplaces move from ‘none’ to ‘low’ to ‘medium’ intensity of combinedfunctional flexibility and innovation, so employment growth becomes morelikely. Furthermore, when functional flexibility is combined with innovation,there is nearly always a more positive impact on employment than when theyoccur by themselves. The detailed controlling for structural dimensions, ifanything, sharpens these conclusions.
References
European Commission, White Paper on Growth, Competitiveness andEmployment, Luxembourg, Office for Official Publications of the EuropeanCommunities, 1994.
European Commission, Green Paper on Innovation, Luxembourg, Office forOfficial Publications of the European Communities, 1995.
European Commission, Green Paper on Partnership for a new organisation ofwork, Bulletin of the European Union, Supplement 4/97, Luxembourg, Officefor Official Publications of the European Communities, 1997.
80
Employment through Flexibility – Squaring the Circle?

Table 6.7 Functional flexibility/innovation and net employment change by size
ten-country -49 50-499 500+average employees employees employees
stable employment: % of 40 49) 37 32)establishments reporting no increase/decrease in employment
net employment change: +5 -4) +9 -6)difference in % of establishments reporting increase/decrease in employment
- no FUNCFLEX or INNOVAT -8 -21) -4 (-11)- low FUNCFLEX/low INNOVAT +2 -7) +6 -6)- both medium +14 +1) +20 +3)- high INNOVAT +12 (+12) +16 (-21)- high FUNCFLEX +14 +9) +16 +5)- both high +27 (25) +36 (-14)
N 5528 1275) 3955 304)p < .01 .00) .00 .76)CC .14 .17) .15 .15)
NB Entries in brackets involve small numbers, ie single figures in the case of theestablishments reporting either an increase or decrease in employment.
Table 6.8 Level of innovation by sector – % of workplaces
industry construction trade private public services sector
none 20 56 28 30 39very little 30 32 38 36 38little 27 8 25 23 20medium 16 4 7 9 7intense 6 0 2 2 1
Total 100 100 100 100 100
N 2118 402 1185 897 1182p < .00CC = .28
81
Functional Flexibility, Innovation and Employment

Table 6.9 Functional flexibility/innovation and net employment change by sector
ten-country industry construction trade private public average services sector
stable employment: % 40 33 33) 43) 41) 49)of establishments reporting no increase/decrease in employment
net employment change: +5 -2 -9) +9) +15) +10)difference in % of establishments reporting increase/decrease in employment
- no FUNCFLEX or INNOVAT -8 -24 -25) -9) +15) +4)- low FUNCFLEX/low INNOVAT +2 -3 -6) +1) +14) +8)- both medium +14 +8 (+55) +26) +5) +27)- high INNOVAT +12 -1 (-50) (+65) (+35) (+24)- high FUNCFLEX +14 +17 -33) (+25) +18) +12)- both high +27 +25 (+67) -) (+75) (-33)
N 5528 2046 387) 1108) 848) 1134)p < .01 .00 .00) .00) .00) .01)CC .14 .16 .27) .29) .20) .15)
NB Entries in brackets involve small numbers, ie single figures in the case of theestablishments reporting either an increase or decrease in employment.
82
Employment through Flexibility – Squaring the Circle?

Table 6.10 Functional flexibility/innovation and net employment change by ownership
ten-country totally domestic EU-owned non-EU average independent owned
stable employment: % of 40 41 41 30) 24)establishments reporting no increase/decrease in mployment
net employment change: +5 +6 +1 -14) +14)difference in % of establishments reporting increase/decrease in employment
- no FUNCFLEX or INNOVAT -8 +2 -17 -32) (-6)- low FUNCFLEX/low INNOVAT +2 +9 +1 -25) +1)- both medium +14 +24 +8 +16) (-17)- high INNOVAT +12 +4 +3 +12) (+64)- high FUNCFLEX +14 +13 +11 +3) (+18)- both high +27 +14 +31 (+11) (+53)
N 5528 2630 1628 537) 268)p < .01 .00 .00 .00) .00)CC .14 .14 .14 .26) .47)
NB Entries in brackets involve small numbers, ie single figures in the case of theestablishments reporting either an increase or decrease in employment.
83
Functional Flexibility, Innovation and Employment

Table 6.11 Functional flexibility/innovation and employment change by industrialrelations context
ten-country collective union employee average agreement membership representation
No Yes 0-29% 30-100% No Yes
stable employment: % of 40 39) 39 41 38) 43) 38establishments reporting no increase/decrease in employment
net employment change: +5 +16) +2 +13 -9) +13) +1difference in % of establishments reporting increase/decrease in employment
- no FUNCFLEX -8 +14) -13 +1 -26) +7) -19or INNOVAT
- low FUNCFLEX/ +2 +36) +1 +11 -14) +9) -1low INNOVAT
- both medium +14 +37) +12 +18 +9) +17) +13- high INNOVAT +12 +32) +1 +25 -3) +26) +7- high FUNCFLEX +14 +47) +10 +19 +11) +26) +8- both high +27 (+31) +14 +42 (+6) (+71) +7
N 5528 1082) 4099 3129 1965) 1678) 3527p < .01 .00) .00 .00 .00) .00) .00CC .14 .21) .15 .15 .18) .20) .15
NB Entries in brackets involve small numbers, ie single figures in the case of theestablishments reporting either an increase or decrease in employment.
84
Employment through Flexibility – Squaring the Circle?

Table 6.12 Innovation by country – % of workplaces
high innovation (‘medium’ or ‘intense’)
ten-country average 14Denmark 21France 6Germany 14Ireland 10Italy 21Netherlands 15Portugal 10Spain 14Sweden 9UK 13
Table 6.13 Functional flexibility/innovation and net employment change by country
ten-country DK FRA GER IRL ITA NL POR SPA SWE UKaverage
stable employment: % 40 49) 39) 42) 45) 34) 42) 42) 37) 44) 40)of establishments reporting no increase/decrease in employment
net employment change: +5 +22) +8) -7) +32) +11) +26) -6) 5) -2) +7)difference in % of establishments reporting increase/decrease in employment
- no FUNCFLEX -8 (+11) -7) -16) (+6) -10) +5) (-19) -9) -38) +1)or INNOVAT
- low FUNCFLEX/ +2 +25) +6) -10) +36) +8) +32) +11) +4) -10) -1)low INNOVAT
- both medium +14 (+42) +22) +2) +56) (+40) +17) (-20) +20) +14) +5)- high INNOVAT +12 -16) (-33) (-19) (+55) +27) (+17) (-14) (0) (+65) (+46)- high FUNCFLEX +14 (+31) +20) +3) (+25) (0) +29) (+54) (+38) +6) +17)- both high +27 (+86) (0) (0) (+57) (+20) (+76) (+50) (+27) (+47)
N 5528 637) 549) 802) 370) 478) 495) 295) 452) 715) 762)p < .01 .00) .00) .17) .00) .00) .00) .00) .19) .00) .00)CC .14 .30) .25) .13) .301) .25) .24) .29) .16) .28) .21)
NB Entries in brackets involve small numbers, ie single figures in the case of theestablishments reporting either an increase or decrease in employment.
85
Functional Flexibility, Innovation and Employment


Previous chapters have been concerned with our main task, which is to explorethe relationship between a range of flexibility strategies and changes in thelevels of employment. Before proceeding to the multivariate analysis, it seemedsensible to take the opportunity to consider the significance of the other maintype of direct participation covered in the EPOC survey, ie consultation. Thereason is that, although the scientific literature has tended not to giveconsultation – in particular, ‘face-to-face’ and ‘arms-length’ consultation withindividual employees – the same attention as delegation (see Chapter 2 ofFröhlich and Pekruhl, 1996), the majority of respondents (around two-thirds) inthe EPOC survey reckoned the former to be a more important form of directparticipation than the latter. Even many of the managers practising both theconsultative and delegative forms of direct participation did so.
As in the case of delegative participation, there are two sets of possibilities to beconsidered. One is that there is a direct relationship between consultation andchanges in employment. The management that practises consultationextensively, for example, might be expected to gain a particular benefit from theideas and suggestions of employees, which feed through into growth generally.The other possibility is that there is an indirect relationship betweenconsultation and changes in employment. Most commentators agree that thebetter employees are informed and consulted, the more successful managementdecision-making is likely to be. Indeed, this was one of the major findings of theinterim report in respect of the effects of direct participation on a range ofindicators of performance. In the case of the indirect relationship between
87
Chapter 7 The Significance of Consultation
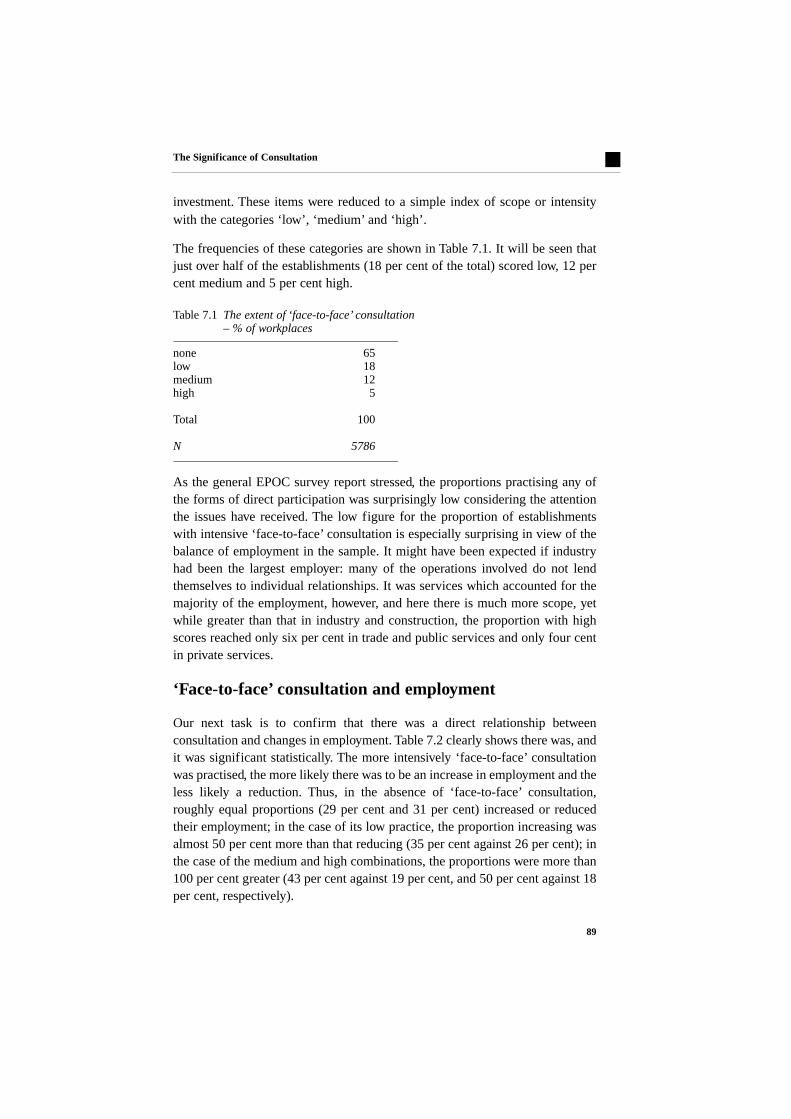
consultation and changes in employment, therefore, it might be expected that theextensive practice of consultation would interrelate in a positive way with thedifferent forms of flexibility and innovation.
Four forms of consultative participation were covered in the EPOC survey. Twowere individual – ‘face-to-face’ and ‘arms-length’; and two were collective –‘temporary’ groups such as task forces, and ‘permanent’ groups such as qualitycircles. Our focus throughout this chapter is on only one of these, ie ‘face-to-face’ consultation. As well as wanting to keep the results digestible, the mainreason for the focus is that preliminary analysis suggested that the directrelationship between this form and changes in employment was by far thestrongest, followed by the permanent group and ‘arms-length’ forms; only therelationship between temporary group consultation and employment was notsignificant.
The chapter is divided into three main sections. The first deals very briefly withthe extent of ‘face-to-face’ consultation practised by our establishments. Thesecond looks at the direct relationship between this measure of consultation andchanges in employment. The third looks at the indirect relationship between thismeasure of consultation and changes in employment; the aim is to establishwhether the extensive practice of consultation enhanced the effects of thefunctional flexibility, numerical flexibility and innovation discussed in previouschapters. In the interests of keeping the results digestible, and because of theupcoming multivariate analysis in the following chapter, there will be notreatment of the structural dimensions.
The nature and extent of ‘face-to-face’ consultation
It will be recalled from the general EPOC survey report that some 35 per centof establishments in the total sample engaged in some form of ‘face-to-face’consultation, ie arrangements involving discussions between individualemployee and immediate manager, such as regular performance reviews, regulartraining and development reviews and ‘360 degree’ appraisal. A measure ofscope or intensity was derived on the basis of responses to a question aboutwhich of eight issues managers consulted with employees on, and how oftenthey did so (‘regularly’, ‘sometimes’ and ‘never’). The issues were: workorganisation; working time; health and safety; training and development; qualityof product or service; customer relations; changes in technology, and changes in
88
Employment through Flexibility – Squaring the Circle?

investment. These items were reduced to a simple index of scope or intensitywith the categories ‘low’, ‘medium’ and ‘high’.
The frequencies of these categories are shown in Table 7.1. It will be seen thatjust over half of the establishments (18 per cent of the total) scored low, 12 percent medium and 5 per cent high.
Table 7.1 The extent of ‘face-to-face’ consultation – % of workplaces
none 65low 18medium 12 high 5
Total 100
N 5786
As the general EPOC survey report stressed, the proportions practising any ofthe forms of direct participation was surprisingly low considering the attentionthe issues have received. The low figure for the proportion of establishmentswith intensive ‘face-to-face’ consultation is especially surprising in view of thebalance of employment in the sample. It might have been expected if industryhad been the largest employer: many of the operations involved do not lendthemselves to individual relationships. It was services which accounted for themajority of the employment, however, and here there is much more scope, yetwhile greater than that in industry and construction, the proportion with highscores reached only six per cent in trade and public services and only four centin private services.
‘Face-to-face’ consultation and employment
Our next task is to confirm that there was a direct relationship betweenconsultation and changes in employment. Table 7.2 clearly shows there was, andit was significant statistically. The more intensively ‘face-to-face’ consultationwas practised, the more likely there was to be an increase in employment and theless likely a reduction. Thus, in the absence of ‘face-to-face’ consultation,roughly equal proportions (29 per cent and 31 per cent) increased or reducedtheir employment; in the case of its low practice, the proportion increasing wasalmost 50 per cent more than that reducing (35 per cent against 26 per cent); inthe case of the medium and high combinations, the proportions were more than100 per cent greater (43 per cent against 19 per cent, and 50 per cent against 18per cent, respectively).
89
The Significance of Consultation

Table 7.2 Changes in employment by ‘face-to-face’ consultation – % of workplaces
change in level of ‘face-to-face’
employment consultation (CONSULT)
none low medium high
reduced 31 26 19 18same 41 40 38 32increased 29 35 43 50
Total 100 100 100 100
N 3612 975 643 297p < .00gamma = .20
The importance of these findings becomes clearer when the statisticalrelationship between CONSULT and changes in employment is put alongside theequivalent for the ‘flexibilities’ and innovation discussed in previous chapters(see Table 7.3). The relationship between ‘face-to-face’ consultation andchanges in employment is stronger than that between functional flexibility(FUNCFLEX) and employment. It is also on a par with that between innovation(INNOVAT) and employment. It is only exceeded in the case of numericalflexibility (NUMFLEX) and contract flexibility (CONTFLEX).
Table 7.3 A comparison of the tests of significance of changes in employment by ‘face-to-face’ consultation, the ‘flexibilities’ and innovation
changes in changes in changes in changes in changes in employment by employment employment by employment employment
CONSULT by FUNCFLEX NUMFLEX by CONTFLEX by INNOVAT
N 5527 5527 5527 4255 5529p < .00 .00 .00 .00 .00gamma .20 .09 -.47 .20 .12
The relationship between ‘face-to-face’ consultation, the‘flexibilities’ and employment
‘Face-to-face’ consultation and the ‘flexibilities’So much for the direct relationship between ‘face-to-face’ consultation andemployment. Our focus shifts to the indirect role of ‘face-to-face’ consultation.In a first step, our measure of ‘face-to-face’ consultation was cross-tabulatedwith those of functional flexibility, numerical flexibility, contract flexibility and
90
Employment through Flexibility – Squaring the Circle?

innovation to establish the nature of the relationship. In three of the cases(CONSULT-FUNCFLEX, CONSULT-CONTFLEX and CONSULT-INNOVAT), the combinedrelationship was significant, as Table 7.4 clearly shows. Especially noteworthyis that the relationship between ‘face-to-face’ consultation and functionalflexibility was the strongest of any so far considered. ‘Face-to-face’ consultationand functional flexibility, it seems, tend to go together much more than any othertwo sets of practices. The one relationship which is not significant is thatbetween ‘face-to-face’ consultation and numerical flexibility (NUMFLEX). Onemight have thought that there would more consultative activity in thoseestablishments with a strategy of ‘downsizing’/’back to core business’, but thisdoes not appear to be the case.
Details of the frequencies of our four combinations will also be found in Table7.4. It will be seen that CONSULT-FUNCFLEX had the highest number in themedium and high categories (15 per cent). FUNCFLEX was also less likely to bepractised on its own than other flexibilities. The proportion with ‘high’FUNCFLEX (five per cent) was half that of the other flexibilities.
Table 7.4 The relationship between ‘face-to-face’ consultation, the‘flexibilities’ andinnovation – % of establishments
CONSULT- CONSULT- CONSULT- CONSULT-FUNCFLEX NUMFLEX CONTFLEX INNOVAT
- no CONSULT or flexibility/ 32 45 47 21innovation
- low CONSULT/low flexibility/ 36 34 32 51low innovation
- both medium 11 4 4 7- high flexibility or innovation 5 11 10 12- high CONSULT 11 4 5 9- both high 4 3 3 1
N 5785 5785 4394 5783p < .00 .01 .00 .00gamma .35 .07 .25 .11
Significant though the relationship is between consultation and the flexibilities,there is another, far more fundamental, message which comes from Table 7.4. Itis that, overall, sizeable proportions (one in ten in the case of NUMFLEX,CONTFLEX and INNOVAT) were making extensive changes in the respective areaand yet admitted to little or no ‘face-to-face’ consultation. Indeed, it was morelikely that functional flexibility, numerical flexibility and innovation were
91
The Significance of Consultation

practised intensively on their own than in combination with consultation. In thecase of innovation, for example, the proportions were 12 per cent against 1 percent; in the case of NUMFLEX, 11 per cent against 3 per cent, and in the case ofCONTFLEX, 10 per cent against 3 per cent. Notwithstanding the strongrelationship between the intensities of ‘face-to-face’ consultation and functionalflexibility, even more establishments practised the latter on its own that incombination with ‘face-to-face’ consultation (5 per cent against 4 per cent).
Especially surprising are the cases of innovation and numerical flexibility.CONSULT-INNOVAT had the smallest proportion in the ‘both high’ category (onlyone per cent), hardly suggesting extensive consultation over what are majorchanges. In the case of numerical flexibility, as already suggested, one mighthave thought that there would be a substantial amount of ‘face-to-face’consultation in those establishments with a strategy of ‘downsizing’/‘back tocore business’. In the event, as the proportion for CONSULT-NUMFLEX (three percent) suggests, this was not so.
Face-to-face’ consultation, the ‘flexibilities’ and employmentIn the next step of the analysis, our four measures combining the intensity of‘face-to-face’ consultation with the equivalent measures of functional flexibility,numerical flexibility, contract flexibility and innovation were cross-tabulatedwith changes in the employment of the largest occupational group over the pastthree years. Details of the tests of significance and the net employment effectswill be found in Table 7.5.
It will be seen that each of the combinations has a statistically significantrelationship with changes in employment. The prospects for employment growthand minimisation of employment reduction, it seems, are enhanced, the moreintensive the ‘face-to-face’ consultation accompanying functional flexibility,contract flexibility and innovation. In the circumstances, it is not unfair toconclude that the intensity of ‘face-to-face’ consultation has an indirect as wellas a direct effect.
As for the net changes in employment over the past three years, the overallpicture is remarkably similar for each of the flexibilities (see Table 7.5). Asubstantial majority, four out of ten in each case, were characterised byemployment stability. Also, three of the combinations registered the same netemployment change of +5 percentage points; the exception, CONSULT-CONTFLEX,was +3 percentage points.
92
Employment through Flexibility – Squaring the Circle?

Table 7.5 The relationships between ‘face-to-face’ consultation, the ‘flexibilities’ andnet employment change
CONSULT- CONSULT- CONSULT- CONSULT-FUNCFLEX NUMFLEX CONTFLEX INNOVAT
stable employment: % of 40 40 40 40establishments reporting no increase/decrease in employment
net employment change: difference +5 +5 +3 +5in % of establishments reporting increase/decrease in employment
- no CONSULT or flexibility/ -4 -14 -9 -10innovation
- low CONSULT/low flexibility/ +1 -9 -8 -2low innovation
- both medium +27 +6 +25 +22- high flexibility or innovation +3 -57 +6 +11- high CONSULT +29 +42 +21 +27- both high +28 -9 +50 +45
N 5528 5528 4257 5528p < .00 .00 .00 .00CC .16 .28 .20 .17
The interest is in the breakdown. In each case, it will be seen, doing ‘nothing’was associated with a reduction in employment. In three cases, FUNCFLEX,CONTFLEX and INNOVAT, the greater the combination of ‘face-to-face’consultation and the ‘flexibility’ or innovation, the more likelihood there was tobe an increase in employment: for example, ‘low’, ‘medium’ and ‘high’combinations of CONSULT-FUNCFLEX produced net employment increases of +1,+27 and +29 percentage points respectively.
In each case, too, high levels of CONSULT were much more likely to be associatedwith a net increase in employment than any of the individual flexibilities orinnovation. Especially noteworthy is the comparison between CONSULT andFUNCFLEX. The intensive practice of each of the two forms of direct participationon its own produced a net increase of 29 and 3 percentage points respectively.
In the case of NUMFLEX, the combination of consultation and numericalflexibility tends to moderate the employment reduction of the latter. Theintensive practice of both CONSULT and NUMFLEX results in a difference of 48
93
The Significance of Consultation

percentage points compared to the intensive practice of NUMFLEX on its own(-9 percentage points as against -57). Significantly, the ‘moderation’ effect ofCONSULT is much greater than that of FUNCFLEX which was discussed inChapter 4.
Summary and conclusions
Consultation is no more intensively practised than the functional flexibility,numerical flexibility, contract flexibility and innovation discussed in previouschapters. Indeed, as many as two thirds of our respondents had no arrangementsfor ‘face-to-face’ consultation at all. Especially surprising is that notinsignificant proportions (one in ten in the case of numerical flexibility, contractflexibility and innovation) were making extensive changes in the respective areaand yet admitted to little or no ‘face-to-face’ consultation.
There are also much more positive findings which are potentially far-reachingin their implications. The first concerns the indirect relationship between ‘face-to-face’ consultation and changes in employment. The more intensive the ‘face-to-face’ consultation accompanying functional flexibility, contract flexibilityand innovation, the more positive the employment outcome. These findings addfurther weight to those of previous chapters: it is the combinations or ‘bundles’of initiatives which are most likely to be associated with positive employmenttrends.
The second, which involves the direct relationship between ‘face-to-face’consultation and changes in employment, provides considerable food forthought. The evidence presented here is that this relationship is stronger thanthat for the intensity of delegative participation, which is our proxy forfunctional flexibility, and almost as strong as our measure of innovation. Boththe policy and scientific debate has tended to prioritise the delegative forms ofdirect participation; group work in particular has been seen as the ‘dominatingconcept’ and the ‘core element of new forms of work organisation’ (Fröhlich andPekruhl, 1996:79). By contrast, the individual consultative forms especiallyhave tended to be dismissed as being of little consequence. Indeed, the EPOCliterature review (see Chapter 2 of Fröhlich and Pekruhl, 1996) found that theyhad received scarcely any scientific attention whatsoever. In the circumstances,the findings presented here (coupled with those in the general EPOC surveyreport suggesting that managers regarded the consultative forms of directparticipation as more important than the delegative) point to the need for a
94
Employment through Flexibility – Squaring the Circle?

fundamental reappraisal of the relative importance of the main forms of directparticipation.
It will be recalled that there were two reasons for not including any treatment ofthe structural dimensions in the case of CONSULT: the sheer volume of tables thatwould have been required to present the data; and the upcoming multivariateanalysis, which makes it possible to consider CONSULT, together with the twoforms of flexibility; innovation and the structural dimensions, much moresystematically. It is to the multivariate analysis that the study now turns.
References
Fröhlich, D., and U. Pekruhl, European Foundation for the Improvement ofLiving and Working Conditions, Direct participation and organisational change– fashionable but misunderstood? An analysis of recent research in Europe,Japan and the USA, Luxembourg, Office for Official Publications of theEuropean Communities, 1996.
95
The Significance of Consultation

Preceding chapters have analysed stability and change of employment on a table
basis, asking how individual and combined approaches to flexibility and
innovation, together with key structural dimensions, are associated with
employment growth, stability or decrease. According to this analysis, numerical
flexibility is strongly associated with employment reduction, whereas functional
flexibility, contract flexibility, innovation and ‘face to face’ consultation lead to
employment increases. Employment increases, further, concentrate in medium-
sized establishments, in the private services, in non-EU companies and in
countries like Ireland, Italy and the Netherlands. Employment reductions are
more likely to be found in large establishments, the construction industry and
the trade sector; EU-owned companies, and workplaces with a highly unionised
workforce.
Such bivariate table results are easy to grasp, but they are open to criticism. For
example, the positive employment effects of an innovation strategy might not be
due to innovation in general, but might be confined to particular establishments
(say to subsidiaries of non EU-owned companies) whereas workplaces in
domestic ownership might use innovations to reduce employment. The
relationship between contract flexibility and employment increases might hold
for some sectors and size categories only, or the negative relationship between
industrial relations indicators and employment growth might not be a general
trend, but could be confined to industry and/or large workplaces, which are in
decline and where employees tend to be more highly organised.
97
Chapter 8 The Results of the MultivariateAnalyses

In other words, what appears to be a straightforward relationship between aparticular approach and an establishment’s employment changes might beinfluenced by other factors. If such factors are taken into account, the‘straightforward’ relationship might disappear (it would be a ‘spuriousrelationship’) or it might even increase in strength, indicating that the factorswere mutually re-enforcing. Such control of additional influences on astraightforward relationship can hardly be carried out on a table basis: thenumber of tables would be impossible to digest and the number of cases in somecells would be too small for serious analysis.
This is where multivariate analysis has its great value. Two kinds of multivariateanalysis will be used in this, the third stage of the analysis: multinomial logisticregression (MLR) and a linear probability model (LPM). Both methods have theadvantage that they are able to filter out ‘other’ influences and present theunique contribution a variable has on employment changes. As these twomethods have their own limitations, they are applied side by side to control oneanother. If there are strong unequivocal factors influencing employmentchanges, they should lead to very similar results in both cases. Thus, theapplication of both methods of analysis serves as a safety precaution and acontrol strategy.
Both methods suffer from the handicap of their high level of abstraction, whichmakes the results difficult to grasp and to interpret. To solve this difficulty, thepresentation that follows tries to restrict itself to the absolute minimum of‘technical’ information and statistical figures for the benefit of verbalising theresults. The interested reader is referred to the annex for a more detailedexplanation of the method and for full documentation of the results.
Explaining employment changes by means ofmultinomial logistic regression
Multinomial logistic regression (MLR) attempts to explain changes inemployment in terms of the unique effects of independent or explanatoryvariables. It does so by estimating the likelihood that an establishment belongsto the group of establishments with employment decreases rather thanemployment stability or that it belongs to the group with increases rather thanstability. Stability of employment, in other words, serves as the referencecategory.
98
Employment through Flexibility – Squaring the Circle?

Table 8.1 has the results, and the most important information is in columns 4and 5. The effects of an independent variable on employment reductions orincreases are indicated like this:
+ weak positive effect++ strong positive effect+++ very strong positive effect- weak negative effect-- strong negative effect--- very strong negative effect
(For full statistical details see Table A2.2 in Appendix 2.)
Table 8.1: Significant effects of all independent variables on employment decreases andemployment increases, using a multinomial logistic regression model
1 2 3 4 5
no. variable variable description effect on effect on name employment employment
reduction increase
1 FUNCFLEX intensity of delegative participation/ - -internal functional flexibility
2 NUMFLEX intensity of external numerical flexibility: + + + - - -downsizing, back to core business
3 CONTFLEX intensity of internal numerical flexibility/ + + +contract flexibility
4 INNOVAT intensity of innovation strategy + +
5 CONSULT intensity of individual ‘face-to-face’ consultation + +
6 SIZE3 size of establishment + + + +
7 SECTOR2 – dummy construction sector + + +
8 C1 – dummy Denmark - - - + + +
9 C3 – dummy Germany + + +
10 C4 – dummy Ireland + + +
11 C5 – dummy Italy + + + + + +
12 C8 – dummy Spain + + +
13 C9 – dummy Sweden + + +
14 UNION3 degree of unionisation of the + + - establishment’s workforce
99
The Results of the Multivariate Analyses

The reader will note that two sets of variables are missing from Table 8.1: somestructural dimensions did not appear as they had no significant effects onemployment changes (see Table A2.1 in Appendix 2). The combinations ofstrategies are also absent. The reason is that they were produced from theseparate strategies FUNCFLEX, NUMFLEX, CONTFLEX, INNOVAT and CONSULT, andpresent us with the statistical problem of multi-collinearity: the combinationsand the variables they originate from naturally correlate very strongly, whichforbids their inclusion in a multivariate approach of this kind.
Managerial strategies and employment
Table 8.1 confirms the ‘rule of thumb’ that strong bivariate effects tend to persistin multivariate analysis as well, even when the influence of third factors isexcluded or controlled:
Functional flexibility, FUNCFLEX (ie the intensity of direct delegativeparticipation), exerts a rather strong negative influence1 on employmentreductions, which means that when functional flexibility is applied, the chanceof employment reductions are diminished. By the same token, however,functional flexibility has no influence on employment growth.
Numerical flexibility, NUMFLEX (ie the intensity of a strategy of‘downsizing/back to core business’), as in the bivariate analysis, has a singular,unique negative influence on employment: the positive influence onemployment reductions is extremely strong, meaning that an intensive use ofsuch a strategy leads to a shrinking workforce. At the same time, such a strategyhas a strong negative effect on employment growth: when managers operate thisstrategy, the chance for employment growth is greatly reduced.
Contract flexibility, CONTFLEX (ie the increase in part-time work and temporarycontracts) had mainly positive employment effects according to the bivariateanalysis. This result shows as well in the MLR: the unique influence of a policyof contract flexibility is very strong, leading to employment growth. It evenseems to be that this unique effect is stronger than the ‘contaminated’ effectshown in the bivariate analysis. In addition, there are no significant effects of apolicy of contract flexibility in regard to employment reductions.
100
Employment through Flexibility – Squaring the Circle?
1 The qualified interpretations of the strength of effects, beyond the number of simple plus orminus signs, rest on the exact strength of figures in Table A2.2.

Innovation, INNOVAT, shows the same, albeit less pronounced, pattern. Innovationhas no detrimental effects on employment, and employment increases are morelikely.
‘Face-to-face’ consultation, CONSULT, was associated with employment growthin the bivariate analysis. This result is confirmed, albeit moderately, in the MLRanalysis as well. There remain no effects that point to employment reductions.
The key structural dimensionsEstablishment size shows interesting influences on employment changes: withincreasing size, there are equally strong effects of both employment reductionand employment increase. This means two things: first, the larger the workplace,the less the chance of a stable workforce; but, second, employment changes donot go just in one direction – in a large proportion of workplaces the dynamismis expressed as job losses, whereas in an equally large group it results inemployment growth. Graphically, one might imagine a U-curve with stability ofemployment at the lowest point of the U and the two highest points representingsubstantial employment reductions and growth, respectively.
Of the five sectors, only construction has a unique and very strong effect onemployment, which is negative. There was a very strong probability, in otherwords, that establishments in construction were the ones reducing theirworkforce. In bivariate analysis, industry had a similar negative effect, but theexclusion of other intervening factors levels this out.
There appear to be five cases where there are very strong country effects. Whenthe establishments are Danish, the prospects for employment reduction are verystrongly negative, whereas those for employment growth are very stronglypositive. Irish and Swedish establishments display similar positive effects. Inboth cases, however, the influences relate only to employment growth, which isvery likely in both countries. Here, and in the case of the other countries, it hasto be remembered that these effects are independent of the sectoral compositionand the type of flexibility, innovation and consultation being applied.
The German case tells us a simple story. Other things being equal, the fact thatan establishment is German increases the likelihood of employment reductionsand very strongly so. The same applies, even more strongly, to Spanishestablishments. Whereas the multivariate results confirm most of the findings ofthe bivariate analysis, the Spanish case is different: the straightforward
101
The Results of the Multivariate Analyses

relationship between the countries and employment change suggests a splitpicture for Spain. Spanish workplaces outstrip the ten-country average both inemployment growth and reductions. Yet, after controlling for other influences,Spanish workplaces appear as job losers only.
Italy is an interesting case in that the multivariate analysis suggests a U-shapedsituation. Employment stability is well below average: most Italianestablishments are either high job reducers or high job creators.
Finally, it will be recalled that the bivariate analysis showed a negative influenceof all three industrial relations indicators on employment growth (collectiveagreement coverage, employee representation and a high degree ofunionisation). The MLR analysis suggests that two of these variables, collectiveagreement coverage and employee representation, were unimportant inemployment changes after other factors are taken into account.
The influence of the degree of unionisation remains, however, after theexclusion of other factors. A high degree of unionisation strongly increases thechance of employment reductions and reduces the chances of employmentgrowth slightly. As industrial relations variables are very country specific, theserelationships were checked on a trivariate basis (tables not included). Thisanalysis showed that the degree of unionisation varied considerably between thecountries, with Danish and Swedish workforces being most highly unionisedand French and Dutch workforces being at the other extreme. Even so,regardless of the national levels of unionisation, employment growth dwindledand employment reductions grew with a high degree (relatively, in regard tocountry) of unionisation in all countries.
Looking at the high figures for (positive) effects of the countries included inTable 8.1, one might get the impression that employment reductions andincreases are overwhelmingly explained by country effects. A systematicanalysis of this issue shows that this is not the case, however: the most importantvariable to contribute to the explanatory power of the model is NUMFLEX (ienumerical flexibility), which contributes 6.3 per cent of the overall Log-Likelihood Improvement of 12.4 per cent. The countries follow with 2.2 percent, closely followed by CONTFLEX (contract flexibility) with 2.1 per cent. Thecontribution of the other variables is very marginal. (For details see Table A2.3in Appendix 2.)
102
Employment through Flexibility – Squaring the Circle?

Summary of MLR results
Of the approaches to flexibility and innovation, only numerical flexibility exertsa negative influence on employment, and this is very strong. Each of the otherapproaches has a positive influence, be it that their application reduces thechance of employment reductions (as in the case of functional flexibility) or thatit increases the chance of employment growth (as in the case of contractflexibility, innovation and ‘face-to-face’ consultation). The structuraldimensions have only minor effects: large establishments are polarised as ‘jobreducers’ and ‘job creators’, while only the construction sector contributes toemployment reductions. Other establishment traits, such as ownership, have nosizeable impact of their own on employment changes. The country influencefollows largely known patterns: Denmark, Ireland and Sweden are positive,Germany and Spain are negative, and Italy is polarised. The Dutch workplaces,which do so well in the bivariate analysis, level out after controlling for otherfactors. The degree of unionisation exerts a negative effect.
Explaining employment changes by means of a linearprobability model
Like the preceding MLR analysis, the linear probability model (LPM) will beused to explain changes in employment by the influence of the sameindependent variables. Compared to logistic analysis, LPM allows for relativelyeasy interpretation of results: it compares the contribution of the independentvariables to explained variance, together with the strength of relationshipsbetween employment changes and independent variables, controlled anduncontrolled for other influences. Particularly attractive is that the results ofLPM can be used as input for a correspondence analysis (CA), displaying thecontrolled results in graphical form like a map. (More detailed information onLPM and CA will be found in Appendix 2.)
For our purposes, the concept of explained variance is very informative.Somewhat imprecisely, the ‘explained variance’ indicates to what degree a set ofindependent variables explains the variation of a dependent variable, and howmuch a single independent variable contributes to that. The explained variancevaries between .00 per cent and 100 per cent. A value of ‘0’ per cent indicatesno explanatory power at all, whereas one of 100 per cent means that thevariation of the dependent variable is completely explained by the independentvariable(s) in the analysis.
103
The Results of the Multivariate Analyses

In Table 8.2, employment is treated as three nominal variables. EMPLOY –(minus) indicates whether there are employment reductions or not; EMPLOY 0(zero) indicates whether there is employment stability or not; EMPLOY +indicates whether there is employment increase or not. Table 8.2 shows that thetotal explained variance for employment decrease, stability and increase israther low (16.52 per cent, 5.42 per cent and 12.31 per cent respectively). In thisrespect, therefore, the results of the LPM analysis are similar to those of itsMLR counterpart, where the comparable figure, the Log-Likelihood (reduction)was only 12.4 per cent. In other words, this means that the independent variablesin our analyses explain variations in employment only to a weak or moderateextent.
Table 8.2 Percent of variance explained for employment
variable description EMPLOY - EMPLOY 0 EMPLOY +reduction stable increase
TOTAL total explained variance 16.52 5.42 12.31NUMFLEX external numerical flexibility 8.38 .45 3.85CONTFLEX internal numerical (contract) flexibility .22 .68 1.61FUNCFLEX functional flexibility, delegative participation .54 .25 .08CONSULT individual ‘face-to-face’ consultation .52 .17 1.17INNOVAT innovation .19 .37 .98COLLECT establishment bound by collective agreement .03 .08 .19UNION3 degree of unionisation 2.03 .05 1.18ER employee representation .15 .03 .13SIZE3 size of establishment .18 .50 .77SECTOR economic sector .33 .47 .44V044 status/ownership of establishment .83 .59 .21V046 profit/non-profit organisation .13 .76 .70COUNTRY countries 3.38 .53 1.56
Looking at employment reductions, the familiar result appears: numericalflexibility exerts the greatest single influence, accounting for half of theexplained variance (8.38 per cent). The nationality of establishments (COUNTRY)exerts the next highest effect (3.38 per cent), followed by the degree ofunionisation (2.03 per cent). Evidently, too, the status/ownership ofestablishments makes a slight contribution to decreases, as does functionalflexibility and ‘face-to-face’ consultation. From the bivariate analysis, it will berecalled, EU-owned subsidiaries were associated with employment decreases;whereas, in the case of functional flexibility and ‘face-to-face’ consultation itwas the absence or low intensity of the practice which contributed to job losses.
104
Employment through Flexibility – Squaring the Circle?

Employment increases show a more varied picture. Again, it is the absence orlow intensity of numerical flexibility that contributes most to varianceexplanation (3.85 per cent), followed by contract flexibility, country, a lowdegree of unionisation, ‘face-to-face’ consultation and innovation.
The LPR permits another data check: the strength of relationships betweenemployment and our independent variables, both including possible additionalinfluences by other independent variables and excluding or controlling for theseother influences. In this case, ‘employment’ is used as one variable with thevalues ‘reduced’, ‘stable’ and ‘increased’. The measure of association isCramer’s V (CV), which varies between .00 (no association) and 1.00 (completeassociation). The last three columns of Table 8.3 show the figures uncontrolledfor strength of association, the strength controlled for all other independentvariables and the difference between the two measures indicating how much thedirect relationships were blurred by influences other than the obvious one.
Table 8.3 Bivariate relations between employment change and independent variables,uncontrolled and controlled – Cramer’s V
variable description uncontrolled controlled difference:CV CV uncontrolled
minus controlled
NUMFLEX external numerical flexibility .22 .21 - .01CONTFLEX internal numerical (contract) flexibility .10 .09 - .01FUNCFLEX functional flexibility, delegative participation .07 .05 - .02CONSULT individual ‘face-to-face’ consultation .10 .08 - .02INNOVAT innovation .08 .07 - .01COLLECT establishment bound by collective agreement .07 .03 - .04UNION3 degree of unionisation .09 .11 + .02ER employee representation .07 .03 - .04SIZE3 size of establishment .09 .07 - .02SECTOR economic sector .10 .06 - .04V044 status/ownership of establishment .10 .07 - .03V046 profit/non-profit organisation .08 .07 - .01COUNTRY countries .13 .14 + .01
Looking at the column ‘uncontrolled CV’ reveals, yet again, the familiaroverriding impact of numerical flexibility on employment (CV=.22), followedby the country influence (.13). Excluding other influences (column ‘controlledCV’) reduces the strength of association slightly in most cases. In three cases(collective agreement coverage, the existence of employee representation andsector) the reduction is considerable (.04 is sizeable), which means that these
105
The Results of the Multivariate Analyses

three variables have a rather low own impact on employment. This leaves twoindependent variables which are even more strongly related to employmentwhen other influences are excluded: nationality and the degree of unionisation.Here the controlled strength is higher than the direct association (.14 and .11respectively).
To assess the outcome of the linear probability model, the results of both Tables8.2 and 8.3 have to be interpreted together. Just looking at Table 8.2, the totaland the specific amounts of explained variance are rather low; likewise thestrength of associations – uncontrolled and controlled – between variables inTable 8.3. But as we used multivariate analysis first of all as an approach tocontrol bivariate relationships between variables for the influence of thirdfactors, our main interest is in recurrent patterns of unique influences andassociations. Such patterns are particularly informative in comparison to theother type of multivariate analysis (MLR). If the same patterns recur betweenTables 8.2 and 8.3 as well as in MLR, one is on rather safe ground in regard todata analysis and interpretation.
The main factors influencing employment changes in both Tables 8.2 and 8.3 arenumerical flexibility, the country factor and the degree of unionisation. Table 8.3has the additional information on how the strength of association changes whencontrolling for third factors. For example, in the first multivariate analysis(MLR) the two industrial relations variables (collective agreements andemployee representations) influencing employment changes on a bivariate levelbecame statistically insignificant when controlling for other influences. Thelinear probability model shows in Table 8.3 how such a reduction in theimportance of variables works: both these industrial relations variables areweakly associated with employment changes (CV=.07) on a bivariate basis, andwhen they are controlled for third factors, both associations drop down to aninsignificant CV=.03. It is this example in particular which demonstratesparallel results, and thus the worth of both multivariate approaches for datacontrol.
The ‘growing’ versus the ‘shrinking’ workplace
Correspondence analysis (CA) will now be used to summarise this detailedinformation by seeking to identify the characteristics of the ‘growing’ and‘shrinking’ workplaces in terms of employment. CA presents the data from ourLPM in the form of a graphical display of scatter plots mapping the position of
106
Employment through Flexibility – Squaring the Circle?

groups of workplaces. To interpret the ‘map’, four yardsticks will be helpful (cf.Plot 8.1):
1. The focal point (the origin of the plot) is the intersection of the three linesin the plot. This point represents the marginal distribution of ouremployment variable (V126) and can be interpreted as the position of the‘average’ European workplace. (Theoretically, this is the zero position ofboth dimensions 1 and 2.)
2. The distance of the values of the dependent variables from the focal point isimportant. The closer a value is located to the focal point, the less it deviatesfrom the average; the further away the value, the more it deviates from theaverage and points out to a distinctive difference.
3. The direction of the values is defined by three additional reference points.The first point is ‘E+’, indicating the ‘average’ ‘growing’ workplace. Thesecond, ‘E-’, indicates the ‘average’ ‘shrinking’ firm, and the third, ‘E0’,stands for the workplace with stable employment. The more the valuescluster around one of these reference points, the easier they are to beidentified as belonging to ‘growing’, ‘shrinking’ or ‘stable’ workplaces.
4. The direction of the values is defined by three additional reference points.For convenience, the plots are divided into three sectors mapping out thecombinations of establishment traits that account for employment growth,decrease or stability. The further these traits are from the sectorial bordersand the closer to the (imaginary) line from the focal point through the E-reference points, the more unequivocal their contribution to either growth,shrinkage or stability. This might also be expressed the other way around:traits close to the sectorial borders, say close to the line that divides the E+and the E0 sector, might be interpreted as ‘borderline cases’ which can becharacterised as overrepresenting growing and stable workplaces, butunderrepresenting shrinking workplaces. Clear examples are Denmark andIreland.
Plot 8.1 holds the complete information of the correspondence analysis and istherefore difficult to interpret. To make the results easier to digest, Plot 8.1 isbroken down into Plots 8.2-8.5, which appear at the end of the chapter. In allfour plots, as can easily be seen, the focal point, the E-positions and the sectors
107
The Results of the Multivariate Analyses

are alike. They only differ in regard to the independent variables displayed. (Inall plots, the independent variables are controlled for third influences).
Plot 8.2 holds the data on numerical flexibility, contract flexibility andfunctional flexibility. It displays graphically what is already known from thebivariate and MLR analysis: the employment reduction sector is marked bymedium and high external numerical flexibility. Not only are the two valueslocated in the E- sector, they are also very distant from our focal point,indicating a very strong influence on employment decreases. When this type offlexibility is absent (NUMFLEX0), these workplaces are to be found in theemployment growth sector, albeit close to the stability sector. Intensive contractflexibility (ie the use of part-time and temporary work) is located in the growthsector, and where it is not applied, in the stability sector. Functional flexibility(delegative participation) is more borderline, lying close to the growth andstability sectors and at the same time not far from our focal point, the averageestablishment. The absence of a policy of functional flexibility (FUNCFLEX0)does not appear in the plot, indicating that it does not significantly contribute toemployment changes.
Of the industrial relations variables (Plot 8.3), employee representation andcollective agreement coverage (COLLECT1) do not appear either, and for the samereason. Workplaces without collective agreements appear in the employmentgrowth sector, but their close vicinity to the focal point indicates that theircontribution to employment growth is not very strong. The degree ofunionisation shows a clear pattern: establishments with a non-unionised or aweakly unionised workforce are located in the growth sector, in close vicinity tothe sector of employment stability. Organisations with a moderately and stronglyorganised workforce clearly contribute to employment decrease, although theinfluence is not overly strong as exemplified by the rather close proximity to thefocal point.
The main message of Plot 8.4 is the very strong influence of intensiveinnovation on employment growth, exemplified by the ‘outlier’ INNOVAT4.Intensive ‘face-to-face’ consultation contributes to employment growth as well,but its impact is only moderate.
Finally, Plot 8.5 maps the position of the other structural dimensions: sector,size, status/ownership, and country. The most important contributions toemployment reductions come from establishments which are subsidiaries of
108
Employment through Flexibility – Squaring the Circle?

EU-firms (V044-3); which are large (size3-3), Portuguese and German.Stability of employment is to be found mainly in non-profit organisations(V046-2), in the trade sector and in Danish workplaces, although the Danishcase borders close to the employment growth sector.
The same applies to Irish workplaces, but they are located in the growth sector,close to employment stability. The only outstanding contribution to employmentgrowth comes from establishments which are subsidiaries of non-EUcompanies. The influence of other structural dimensions remains weak.
One way of summarising the data is to think in terms of the characteristicsassociated with, respectively, the ‘shrinking’, the ‘stable’ and the ‘growing’workplace. Again, Plot 8.1, which integrates the information from Plots 8.2 to8.5, enables an overview assessment. At the risk of repeating ourselves, itsuggests that the following, in descending order, are the most importantinfluences:
The ‘shrinking’ workplace can be characterised by:
1. intensive numerical flexibility;
2. ownership by an EU-based multinational company;
3. a very large workforce;
4. being Portuguese and German; and
5. a highly unionised workforce.
The ‘stable’ workplace is somewhat ‘bleak’ in regard to its traits. It is:
1. Danish;
2. operates in the non-profit sector;
3. belongs to the trade sector; and
4. practices functional flexibility (ie delegative participation).
The ‘growing’ workplace could be described somewhat like this:
1. highly innovative;
2. a subsidiary of a non-EU based company;
3. Irish or Dutch;
4. does not practise numerical flexibility;
5. practises contract flexibility to a moderate extent;
6. is not unionised; and
7. practises ‘face-to-face’ consultation.
109
The Results of the Multivariate Analyses

It is at this point that there is a need to remind ourselves that the analysis, evenin its multivariate form, cannot completely unravel cause and effect. It may be,for example, that it is the growth in employment of these workplaces whichmakes the other initiatives possible; for example, the workplace in whichemployment is growing might have more scope (and need) to offer differentforms of contract flexibility.
Interestingly, in this regard, the combination of the dimensions highlighted bythe multivariate analysis hints at the significance of the business life-cycle.Many non EU-owned workplaces are more likely to be in the start-up or growthstages of activity. They are also more likely to have been influenced by and haveimplemented some of the practices of HRM, such as consultation; theiremployees may have seen little need, in these circumstances, to join tradeunions. Many EU-owned workplaces, by contrast, are more likely to be in thestages of business maturity or decline. They are also less likely to have beeninfluenced by and see less scope for introducing some of the practices of HRMsuch as ‘face-to- face’ consultation with individual employees. Their employeesare also more likely to be long-established members of trade unions.
Comparison and conclusion
Each of the two methods of multivariate analysis used here has its advantagesand disadvantages. MLR is said to be statistically more accurate, but allowsseveral options in constructing models and carrying out the analysis. LPM ismore generous in its basic assumptions, but has the advantage of producingresults that are easier to interpret. Although both approaches differmethodologically, the common overlap of results nonetheless exceeds thedifferences by a considerable margin. This is the most important point. Thismakes us reasonably confident that the main findings presented here aboutflexibility and employment are not just stylised facts but are close to the reality.The adoption of other models and variable coding might have altered the results,but certainly not decisively.
The key results are as follows:
1. The bivariate relationships between the various forms of flexibility,innovation, consultation and employment changes are confirmed after theexclusion of other influences. They confirm that:
110
Employment through Flexibility – Squaring the Circle?

• intensive numerical flexibility is very detrimental to employment growth;
• functional flexibility involving the delegation of rights and responsibilities
to employees is not strongly related to employment changes – at best it
reduces trends towards employment reduction;
• innovation, contract flexibility and ‘face-to-face’ consultation with
individual employees go with positive employment effects.
2. Both methods show that two of the three industrial relations variablesnegatively related to employment in the bivariate analysis – collectiveagreement coverage and employee representation – lose their impact aftercontrolling other influences. The negative association between the thirdvariable (a high degree of unionisation) and employment growthnonetheless remains.
3. Both methods confirm the relative unimportance of two of the keystructural dimensions, sector and size, although the overlap of results wasnot as complete as in the cases above. More diversity is revealed in the casesof the ownership and nationality of the establishments.
111
The Results of the Multivariate Analyses


A number of the findings of this report are especially worth repeating in thelight of the discussion of the flexibility debate in Chapter 1. The first is thatfunctional flexibility and numerical flexibility do not appear to be mutuallyincompatible. Admittedly, very few workplaces combine functional flexibilityand numerical flexibility intensively, but most practise both to some extent. Newforms of work organisation, it seems, can and do take place side by side with theemployment reductions that tend to be associated with our measure of numericalflexibility made up of ‘downsizing’ and a ‘back to core business’ approach.European workplaces are no different in this regard from their OECD and UScounterparts.
Another finding worth mentioning again is that, in terms of employment growth– our measure of functional flexibility – the intensity of direct delegativeparticipation of employees does not appear to have the significance it has beengiven. Not only is functional flexibility likely to be associated with a reductionin the level of employment in the short term; apparently, it has only a moderatelypositive relationship with employment in the medium term compared to otherinitiatives. Indeed, its importance seems to lie more in promoting employmentretention than creation. It has only a significant positive effect in combinationwith contract flexibility, innovation and consultation. Far from being the onlypath to employment growth, it seems, functional flexibility is not even the mainone.
The third finding of note relates to the initiatives that are shown to be positivelyassociated with employment growth. That innovation is so associated is hardly
113
Chapter 9 Conclusions and Implications

surprising: it would have been a staggering finding if it had not been. It alsoconfirms the critical importance that the organisational perspective onflexibility places on the role of managers in stimulating innovation in general.The labour market perspective, it can be argued, is far too narrow: policiesseeking to promote labour market flexibility are no substitute for those aimed atstimulating innovation.
Less expected is that contract flexibility should appear to make such a positivecontribution. In the light of the findings of the European Comission’sEmployment in Europe 1996, however, it is perhaps not so surprising: much ofthe growth in employment generally has been in part-time and temporary work.
Especially intriguing, as Chapter 7 has argued, is the relatively strong showingof individual ‘face-to-face’ consultation. Both the policy and scientific debatehas tended to prioritise the delegative forms of direct participation at theexpense of the consultative. Yet the findings presented here not only suggest that‘face-to-face’ consultation enhances the effect of functional flexibility, but alsothat it has the stronger positive direct impact on employment growth. Areappraisal of the relative significance of consultation as opposed to delegationcertainly seems to be called for in the light of these findings. Although theimplications of semi-autonomous group work may look very far-ranging whencompared to traditional ‘Taylorist’ work organisation, it may be that theintensive practice of individual consultation is a better indicator of amanagement that is open to new ideas and willing to learn – one therefore thatis more likely to be sensitive to the opportunities for change and adaptationleading to positive employment outcomes.
The fourth finding worthy of comment is consistent with the results of recentresearch emphasising the importance of ‘bundles’ or ‘clusters’ of activities inmaking for the ‘success’ of new forms of work organisation. It is that thecombinations of flexibility measures, innovation and consultation are especiallyimportant for employment growth. Put functional flexibility and contractflexibility together, for example; or contract flexibility and consultation; orcontract flexibility and innovation; or innovation and consultation, and theprospects for employment growth are enhanced.
The fifth finding needing emphasis is one of two arising from the multivariateanalyses. It is that some of the variables in the dimensions shown to have anegative relationship with changes in the levels of employment in the bivariate
114
Employment through Flexibility – Squaring the Circle?

analysis – in particular collective bargaining coverage and employeerepresentation – turn out to be neutral when put into their proper structuralcontext of size and sector etc. It is these other dimensions, in other words, whichmake the difference.
The second finding from the multivariate analyses, and the sixth overall, relatesto the ‘clusters’ of measures and dimensions associated with workplaces whichare ‘successful’ in terms of employment trends. Growth, the multivariateanalyses suggest, is more likely to be associated with highly innovativeworkplaces which consult with their employees rather than delegateresponsibilities, have a moderate amount of contract flexibility and practisenumerical flexibility to only a limited extent. Such workplaces are likely to benon EU-owned rather than EU-owned and their employees are marginally lesslikely to be in membership of trade unions. Employment reductions areassociated, above all, with ‘downsizing’ and a ‘back to core business’ approach.
Our final comments are reserved for the implications that are in danger of beinglost sight of in focusing on any of the individual associations identified in thisreport. The discussion of the choice between ‘high road’ and ‘low road’ workorganisation, it seems, is premature if not largely theoretical. The fundamentaldifference uncovered by the findings presented here is not between workplacespursuing one or other of these approaches but between those which are ‘active’and those which are ‘passive’. This is a point already highlighted in the generalEPOC survey report, where it was found that the critical difference was not somuch between workplaces with and without direct participation; rather was itbetween workplaces which were ‘active’ and ‘passive’ in taking a range ofinitiatives (eg strategic alliances; product innovation; pursuing a ‘back to corebusiness’ approach; outsourcing; relying on the introduction of new informationtechnologies and the automation of processes; downsizing and delayering ofmanagement structures; working time flexibility and working time reductions).The workplaces which were practising direct participation were more likely tobe taking other initiatives and vice versa.
The same conclusion is true, it seems, of employment. It is the ‘active’, and notthe ‘passive’, workplaces which increase employment. In the case of functionalflexibility, contract flexibility, innovation and the consultation of individualemployees, and their combinations, the net employment change (ie thedifference in the proportion of workplaces reporting an increase/decrease inemployment) was likely to be least positive in the ‘passive’ workplace. Only in
115
Conclusions and Implications

the case of numerical flexibility (ie downsizing/back to core business), notsurprisingly, was ‘inactivity’ favourable from the point of view of employment.
Discussion of ‘active’ and ‘passive’ workplaces also takes us back to what wasperhaps the key finding of the general EPOC survey report. Bearing in mind theconsiderable media and policy attention the various forms of flexibility,innovation and consultation have received, the levels reported by the EPOCsurvey are remarkably low. The respondents, it cannot be emphasised toostrongly, are also senior workplace managers, who are extremely unlikely to beguilty of underestimating what is going on. The numbers of workplacesreporting no activity for downsizing/back to core business; outsourcing andsubcontracting; working time flexibility, and contract flexibility were 69 percent, 78 per cent, 63 per cent and 66 per cent respectively; the figures fordelegative participation and consultative participation were 42 per cent and 65per cent respectively. No fewer than 30 per cent also reported no innovation intheir products or technology.
At the other extreme, the proportions of workplaces reporting intense activity inany of these areas can only be described as minuscule. In no case does theproportion rise above double figures; the highest is seven per cent for contractflexibility. Typically only five per cent, or one in 20, of workplaces reportintense activity. In short, it is not just delegative participation that is rarelypractised intensively. The same is true of numerical flexibility, contractflexibility and innovation. Even consultation, which has been shown to haveunexpectedly strong effects, is rarely practised intensively. There is, it seems, ayawning gap between the rhetoric of the flexibility debate and the reality of whatis happening. To paraphrase the final paragraphs of the general EPOC surveyreport, it is not so much the promotion of the ‘high’ road’ of work organisationwhich is the biggest challenge facing European policy makers, but encouragingthe practice of some of the most basic forms of ‘activity’.
116
Employment through Flexibility – Squaring the Circle?

The EPOC survey, which was commissioned by the European Foundation forthe Improvement of Living and Working Conditions, is the most comprehensivereview of its kind. A standard questionnaire, translated with the help ofindustrial relations ‘experts’, was posted to a representative sample ofworkplaces in ten EU member countries: Denmark, France, Germany, Ireland,Italy, the Netherlands, Portugal, Spain, Sweden and the UK. Altogether, some5,800 managers, from manufacturing and services, and the public and theprivate sector, responded. The size threshold was 20 or 50 employees dependingon country. The respondent was either the general manager or the person he orshe felt was most appropriate. The main subject of the questions was the largestoccupational group.
In keeping with the conceptual framework developed in its early days (forfurther details, see Geary and Sisson, 1994), the focus of the EPOC survey wason the two main forms of direct participation, which for the purposes ofempirical enquiry can be defined as follows:
consultative participation – management encourages employees to maketheir views known on work-related matters, but retains the right to takeaction or not; and
delegative participation – management gives employees increaseddiscretion and responsibility to organise and do their jobs without referenceback.
117
Appendix 1 The EPOC Survey

The essence of direct participation can be better understood by contrasting itwith the other main forms of involvement and participation listed in FigureA1.1.
Figure A1.1 Types of involvement and participation
information disclosure
financial participation
- profit sharing
- share ownership
direct participation
- consultative
- delegative
indirect or representative participation
- joint consultation
- co-determination
- collective bargaining
- worker directors
In contrast with information disclosure and financial participation, ie profit-sharing and share ownership, the key distinguishing features of directparticipation are consultation and delegation. Profit-sharing and shareownership may be an integral feature of a participative approach, but they do notnecessarily involve consultation or delegation. In contrast with indirect orrepresentative participation, the word direct is key; whereas indirectparticipation takes place through the intermediary of employee representativebodies, such as works councils or trade unions, direct participation involvesemployees themselves.
Both consultative and delegative participation can involve individual employeesor groups of employees. The two forms of consultative participation can befurther subdivided. Individual consultation can be ‘face-to-face’ or ‘arms-length’; group consultation can involve temporary or permanent groups. Thisgives us six main forms of direct participation regardless of the particular labelapplied. The six forms are set out in Figure A1.2, together with examples ofrelevant practices from EPOC’s research review (Fröhlich and Pekruhl, 1996)and round-table discussions. It is around these types that the EPOC survey’squestions were structured.
118
Employment through Flexibility – Squaring the Circle?

Figure A1.2 The main forms of direct participation
❑ Individual consultation:
‘face-to-face’: arrangements involving discussions between individualemployee and immediate manager, such as performance reviews, regulartraining and development reviews and ‘360 degree’ appraisal;
‘arms-length’: arrangements which allow individual employees to expresstheir views through a ‘third party’, such as a ‘speak-up’ scheme with‘counsellor’ or ‘ombudsman’, or through attitude surveys and suggestionschemes.
❑ Group consultation:
‘temporary’ groups: groups of employees who come together for a specificpurpose and for a limited period of time, eg ‘project groups’ or ‘task forces’;
‘permanent’ groups: groups of employees that discuss various work relatedtopics on an ongoing basis, such as quality circles.
❑ Individual delegation:
individual employees are granted extended rights and responsibilities tocarry out their work without constant reference back to managers –sometimes known as ‘job enrichment’.
❑ Group delegation:
rights and responsibilities are granted to groups of employees to carry outtheir common tasks without constant reference back to managers – mostoften known as ‘group work’.
RespondentsThe EPOC survey was planned to be representative of workplaces in as manycountries as the budget would reasonably allow taking into account a range ofdifferent populations and geographical positions. The ten countries finallychosen were: Denmark, France, Germany, Ireland, Italy, the Netherlands,Portugal, Spain, Sweden and the UK. The choice of the workplace as the leveland the general manager as the immediate target is explained by the overall aimof the survey, which was to gather as much data as possible about what washappening in practice. A survey directed at higher levels in the organisation wasunlikely to have produced such information, and there was some concern thatsmall workplaces in particular might not have a personnel manager. In anyevent, the general manager was invited to complete the questionnairehim/herself or to pass it on to the manager most capable of doing so.
119
Appendix 1: The EPOC Survey

In targeting managers only, and not employees or their representatives as well,the EPOC survey is open to the criticism that its results are one-sided. Much asthe EPOC Research Group would like to have included employeerepresentatives, in particular, in the survey, the costs of doing so proved to beprohibitive. In many workplaces it would have been necessary to get a responsefrom more than one employee representative and in some countries there wouldalso have been enormous complexity in identifying the most appropriaterespondent(s).
The omission of employee respondents is perhaps not as much a weakness as itmight at first appear, however. The main objective of the EPOC survey was toestablish the nature and extent of direct participation. The experience of theEuropean Foundation’s survey on Workplace Involvement in TechnologicalInnovation in the European Community (Fröhlich, Gill and Krieger, 1993),which involved responses from almost 4,000 employee representatives as wellas from an identical number of managers, showed a high consensus on factualissues between both groups of workplace respondents. Also, a unique feature ofthe EPOC survey was that it did not simply ask about the incidence of directparticipation, which managers might have been tempted to exaggerate.Questions designed to estimate the coverage, scope and intensity of theprocesses involved helped to ensure a balanced picture.
Organisation of the surveyThe questionnaire, which is reproduced in full in the general report (EuropeanFoundation for the Improvement of Living and Working Conditions, 1997), wasinitially drawn up in English by members of the research group, with the helpof a team from the Industrial Relations Research Unit at the University ofWarwick, and was translated by them and trusted experts into the otherlanguages. Tenders to administer it were invited in the Official Journal of theEuropean Union in September 1995. In December 1995, INTOMART,representing GfK Europe, and based in Hilversum (the Netherlands), wascommissioned to do the job. With INTOMART’s help, the questionnaire waspre-tested in the ten countries in the winter of 1995 and the spring of 1996.
Details of the main survey The gross sample of workplaces, drawn up by the national GfK members,differed for the ten countries according to population size, the number ofemployees in industry and services, and the number of workplaces with 20 ormore employees (for the smaller and medium-sized countries) and 50 or moreemployees (for the larger ones). For the larger countries (France, Germany, Italy,Spain, the UK) the gross sample was 5,000 workplaces; for the medium
120
Employment through Flexibility – Squaring the Circle?
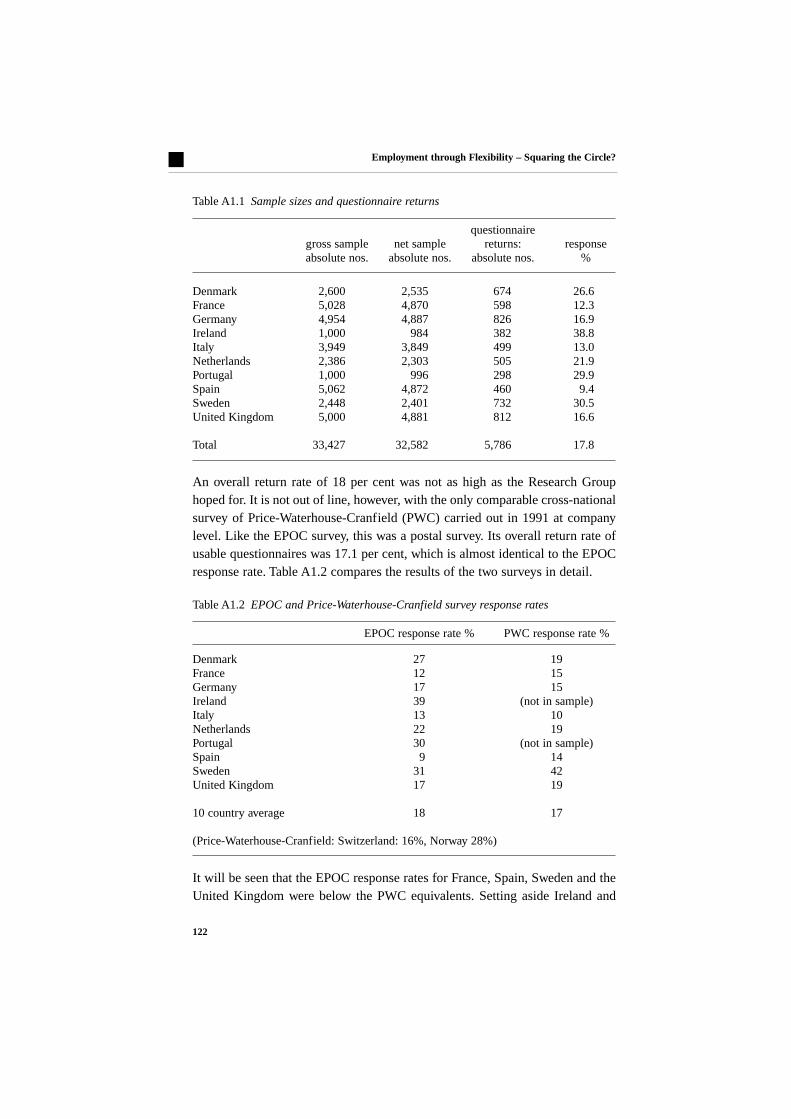
countries (Denmark, the Netherlands and Sweden) 2,500, and for the smallercountries (Ireland and Portugal) 1,000.
The mailing was carried out in two full waves, including the questionnaire andthe accompanying letter, followed by one additional reminder letter. The firstquestionnaires were mailed in the beginning of June 1996. Because of thevarying times of summer holidays, an additional mailing was carried out incertain countries with a lower response rate in October 1996, focusing onparticular sectors. The additional mailing used the original representativesample.
Each of the national GfK member institutions drew up the final gross samplesfor their respective countries. Table A1.1 holds the final gross sample figures,the net samples (gross sample minus ‘return to sender’), the number of returnedquestionnaires and the response rate per country. The response rate in column 4is based on columns 2 and 3.
From the gross sample of 33,427 questionnaires, 845 (2.5 per cent) werereturned to sender by the different postal services either because the address waswrong or unknown, or the addressee had moved to an unknown address, orbecause the company had ceased to exist altogether. By 15 November 1996,5,786 questionnaires had been returned and it was on the basis of these that thedata analysis took place.
In data analysis, the remaining sample distortions regarding sector and size ofthe workplace were weighted for each sector/size cell to reflect the originalresearch universe. The sample distortions between countries were corrected bya weighting factor that accounted for the number of employees represented inthe data set for each country and the overall size of the workforce in thatcountry.
Assessment of the response
The number of explicit refusals was very low: only about 400 potentialrespondents indicated that they were not willing to cooperate. On the basis ofremarks made by respondents either on the telephone or in the questionnaire,direct participation was regarded as a subject of some importance. In addition,a large number of respondents (47 per cent) responded positively to the questionasking if they would like to receive a summary of the results.
121
Appendix 1: The EPOC Survey

Table A1.1 Sample sizes and questionnaire returns
questionnaire gross sample net sample returns: responseabsolute nos. absolute nos. absolute nos. %
Denmark 2,600 2,535 674 26.6France 5,028 4,870 598 12.3Germany 4,954 4,887 826 16.9Ireland 1,000 984 382 38.8Italy 3,949 3,849 499 13.0Netherlands 2,386 2,303 505 21.9Portugal 1,000 996 298 29.9Spain 5,062 4,872 460 9.4Sweden 2,448 2,401 732 30.5United Kingdom 5,000 4,881 812 16.6
Total 33,427 32,582 5,786 17.8
An overall return rate of 18 per cent was not as high as the Research Grouphoped for. It is not out of line, however, with the only comparable cross-nationalsurvey of Price-Waterhouse-Cranfield (PWC) carried out in 1991 at companylevel. Like the EPOC survey, this was a postal survey. Its overall return rate ofusable questionnaires was 17.1 per cent, which is almost identical to the EPOCresponse rate. Table A1.2 compares the results of the two surveys in detail.
Table A1.2 EPOC and Price-Waterhouse-Cranfield survey response rates
EPOC response rate % PWC response rate %
Denmark 27 19France 12 15Germany 17 15Ireland 39 (not in sample)Italy 13 10Netherlands 22 19Portugal 30 (not in sample)Spain 9 14Sweden 31 42United Kingdom 17 19
10 country average 18 17
(Price-Waterhouse-Cranfield: Switzerland: 16%, Norway 28%)
It will be seen that the EPOC response rates for France, Spain, Sweden and theUnited Kingdom were below the PWC equivalents. Setting aside Ireland and
122
Employment through Flexibility – Squaring the Circle?

Portugal, which were not included in the PWC study, the return rates of theremaining countries were higher in the EPOC survey.
Additional information from similar national surveys is also instructive:
• a German national postal survey on the same topic in the production sectorhad an identical response rate to that of the EPOC survey: 18 per cent (cf.ISI, 1996).
• an earlier Dutch national postal survey on a similar topic (Muffels, Heinenand van Mil, 1982) had a return rate of 28 per cent which is higher than thatof the EPOC survey (22 per cent).
• the EPOC survey’s response rate for Portugal (30 per cent) is very high. Asimilar postal survey carried out by Kovacs, Cerdeira and Moniz (1992) hada return rate of 12 per cent.
• high return rates seem to be the norm in Sweden. The EPOC rate for thiscountry (31 per cent) is below that of the PWC survey (42 per cent), but itapproaches the figure (34 per cent) of a recent national postal survey onflexible organisations (NUTEK 1996).
Thus, the return rates for Germany, the Netherlands and Sweden were not out ofline with what appears to be the norm for these countries. Taking the PWC studyin addition, the rates for France, the United Kingdom and Spain in particularseem to be somewhat below expectations.
Comparable though it may be, an 18 per cent overall return rate raises thequestion of how far the estimated parameters of interest suffer from aprobability bias. In other words, are the workplaces with direct participationunderrepresented or overrepresented in the EPOC results? Are the datanegatively or positively biased? This issue was investigated recently in a projectundertaken by NUTEK, dealing with the spread and functioning of ‘flexibleorganisations’ in Sweden in preparation for the G7-summit in France in earlysummer 1996. The representative survey had a response rate of 34 per cent,which is very close to that of the EPOC survey for Sweden. To evaluate therepresentativity of the data, telephone follow-ups were made to try to establishthe degree of flexibility in non-respondent organisations. The verdict was that,‘the non-response sample seems to have a larger proportion of workplacesdefined as a flexible work organisation’ as compared to the respondents
123
Appendix 1: The EPOC Survey

(NUTEK, 1996, p.195, cf. also p.198). In other words, the survey resultsunderestimated the extent of flexible organisations in Sweden.
It does not necessarily follow that the same is true of the EPOC results. It simplysuggests that underrepresentation is a possibility, as is overrepresentation. Thereis no reason to believe that the EPOC results are biased one way or the other.
The concept of the largest occupational group
The EPOC survey targeted the largest occupational group (the ‘largest numberof non-managerial employees at this workplace’, in the precise words of thequestionnaire). This was done for two reasons: to reduce the complexity ofanswers required of respondents, and to ensure that answers were characteristicof as many employees as possible. Inevitably, however, focusing on the largestoccupational group or LOG raises questions about the relationship between theseemployees and the workforce as a whole. Especially important when the issueof employment is involved is whether or not it is possible to generalise from theexperience of the LOG to the total workforce.
The detailed analysis of the ratio between the LOG and the total number ofemployees in Table A1.3 shows that, on average, the number of employees in theformer is about 62 per cent (mean) of the latter and the frequent ratio (mode) istwo-thirds (67 per cent). Overall, in 70 per cent of cases, the LOG stood for 50per cent or more of the establishment’s workforce, and in 30 per cent itrepresented 76 to 100 per cent of it. Only in five per cent of cases did the LOG
account for 25 per cent or less of the total number of employees. In short, itseems not unreasonable to generalise from the experience of the LOG to the totalnumber of employees.
Table A1.3 Ratio of number of employees in largest occupational group to total number of employees
mean 62 %mode 67 %0 – 25 % 5 %26 – 50 % 25 %51 – 75 % 40 %76 – 100 % 30 %
Total 100 %
124
Employment through Flexibility – Squaring the Circle?

References
European Foundation for the Improvement of Living and Working Conditions,New forms of work organisation. Can Europe realise its potential? Results of asurvey of direct employee participation in Europe, Luxembourg, Office forOfficial Publications of the European Communities, 1997.
Fröhlich, D., C. Gill, and H. Krieger, European Foundation for the Improvementof Living and Working Conditions, Workplace involvement in technologicalinnovation in the European Community, Volume I: Roads to Participation,Luxembourg, Office for Official Publications of the European Communities,1993.
Fröhlich, D., and U. Pekruhl, European Foundation for the Improvement ofLiving and Working Conditions, Direct participation and organisational change– fashionable but misunderstood? An analysis of recent research in Europe,Japan and the USA, Luxembourg, Office for Official Publications of theEuropean Communities, 1996.
Geary, J. and K. Sisson, European Foundation for the Improvement of Livingand Working Conditions, Conceptualising direct participation in organisationalchange – the EPOC Project, Luxembourg, Office for Official Publications ofthe European Communities, 1994.
Lay, G., C. Dreher, and S. Kinkel, Neue Produktionskonzepte leisten einenBeitrag zur Sicherung des Standorts Deutschland. Mitteilungen aus derProduktionsinnovationserhebung, Karlsruhe, Fraunhofer Institut Systemtechnikund Innovationsforschung, Karlsruhe, Juli 1966.
Muffels, R., T. Heinen, and G. van Mil, Werkoverleg en werkstructurering en desubsidieregeling arbeidsplaatsverbetering: En onderzoek bij bedrijven metmeer dan 100 personeelsleden, Tilburg, IVA, 1982.
Kovacs, I., C. Cerdeira, and A. Brandao Moniz, Technological and WorkOrganisational Change in Portuguese Industry, Lisbon, G.G.I, G.G.T.p.e.CesoI&D, Programme PEDIP, 1992.
NUTEK, Towards Flexible Organisations, Stockholm, NUTEK, 1996.
125
Appendix 1: The EPOC Survey

The Price Waterhouse Cranfield Project on International Strategic HumanResource Management, (Report), Cranfield, Cranfield School of Management,1991.
Regalia, I., European Foundation for the Improvement of Living and WorkingConditions, Humanise work and increase profitability? Direct participation inorganisational change viewed by the social partners in Europe, Luxembourg,Office for Official Publications of the European Communities, 1995.
126
Employment through Flexibility – Squaring the Circle?

Multinomial logistic regressionGiven the high number of independent variables and the fact that some of themare ordinal scaled, the suitable statistical model is a regression model for acategorial dependent variable.1 Therefore some assumptions about theprobability distribution of the dependent variable are necessary. The twodistribution functions are well known in the literature (see references): thenormal distribution and the logistic distribution. Models based on the normaldistribution, so called ‘probit regression models’, are computationally arduousif the dependent variable can take more than two possible values. Usually, theestimated parameters of the probit model do not differ much from those of thelogistic model. This and the fact that the parameters of the logistic model areeasier to interpret are the reasons that the logistic regression model is used hereto estimate the relationship between the various measures of flexibility,innovation and employment.
The dependent variable is EMPLOY. EMPLOY=3 (EMPLOY=1) indicates that therespondent reported an increase (a decrease) in the number of employees withinthe largest occupational group; EMPLOY=2 indicates that no change of thenumber of employees was observed by the respondent.
The logistic regression model estimates the effects of independent variables onodds ratios, eg the ratio of the probability that a case belongs to the first rather
127
Appendix 2 Further Details of the Multivariate Analysis
1 According to Long (1997) categorial variables have only few, discrete categories. The measurement level of categorial variables can be nominal or ordinal.

than to the second category of the dependent variable. A logistic regressionmodel based on the assumption that the dependent variable EMPLOY is ordinalscaled (a cumulative logistic regression model) would estimate the effects on theodds that a case belongs to a higher rather than to a lower category of thedependent variable. At first sight, the construction of the employment variablesuggests that it should be regarded as an ordinal rather than a nominal scaledvariable. Theoretical arguments can be raised against this interpretation of theemployment variable. There are at least some independent variables which haveto be included in the analysis as dummies, some of which are expected to exhibitnon-linear effects on the employment variable, eg, the influence of trade unionson the employment variable is supposed to decrease both probabilities – theprobability that a case belongs to category 1 rather than 2 and the probabilitythat a case belongs to category 3 rather than 2. (A strong position of trade unionswould serve the interest of the ‘insiders’, aggravating dismissals of employees.At the same time it would reduce the chance that the firm hires new workers.)It is not possible to account for the possibility of such bi-directional effects in amodel with an ordinal scaled dependent variable, as the latter is based on theassumption that the direction of the effect of an independent variable does notdepend upon the value of the dependent variable and is either invariably positiveor invariably negative. As the independent variables are either ordinal scaled ordummy variables, it is not possible to account for such asymmetric effects bysuitable transformations of the independent variables in a sensible way. Hence,the statistical model fitted to the data is a multinomial logistic regression model,estimating effects of independent variables on the dependent variable with threeunordered categories.
The logistic regression model estimates the effects of independent variables onodds ratios, eg: the ratio of the probability that a case belongs to the first ratherthan the second category or that a case belongs to the third rather than thesecond category of EMPLOY. It follows that a certain category of the dependentvariable has to be chosen as the category of reference. Although technically itdoes not matter which category is taken as the category of reference, it seemsreasonable to choose EMPLOY=2 (no changes).
The estimated parameters show the impact of a certain independent variable onthe odds that a case belongs to the first (or to the third) category of EMPLOY.Referring to Table A2.1, the odds that a case belongs to the first categoryEMPLOY=1 rather than to the reference category decreases by the factor 0.56 ifthe case belongs to the first country C1 (C1 is a dummy variable for Denmark).
128
Employment through Flexibility – Squaring the Circle?

At the same time, the odds that an establishment in Denmark belongs to the thirdrather than to the reference category increases by the factor 1.8. Since theassociated probability (also shown in Table A2.1) is lower than 0.05 in bothcases, both parameter estimates are significant at the 5% level.
Some test statistics following Table A2.1 show how well the estimated modelfits the data. Given these estimated parameter values for all the independentvariables, it is possible to calculate the probabilities that a case belongs to thefirst, second, or third category of EMPLOY. If we assign to every case thatcategory of EMPLOY for which the estimated probability is highest, we cancompare the predicted with the actual outcome in the table of the predictedversus the observed cases. For example, of the 940 cases which belong to thefirst category, only 456 are predicted correctly; 356 (128) cases are predicted tobelong to the second (third) category. In the best case only the diagonal elementsof the table should depict values different from zero. The larger the deviationfrom this ideal table (ie: the higher the off-diagonal figures are), the weaker themodel-fit. The fit of the model in question is not too good: Only 1814 out of the3490 cases appear on the diagonal of the table and are predicted correctly.
The improvement of the Log-Likelihood compares the predictive success of areference model with the predictive success of the estimated model. Thereference model predicts the category of EMPLOY for every case according to themarginal distribution of the variable EMPLOY, with the probabilities 0.269, 0.413and 0.318 for EMPLOY=1, EMPLOY=2 and EMPLOY=3, respectively. The Log-Likelihood improvement can take values in the range of 0.00 to 1.00, highervalues indicating a better model-fit. The theoretically possible value 1.00 mustbe seen as unrealistic because it will never materialise in real analyses. Animprovement of 0.2 or better can be regarded a good fit.
129
Appendix 2: Further Details of the Multivariate Analyses
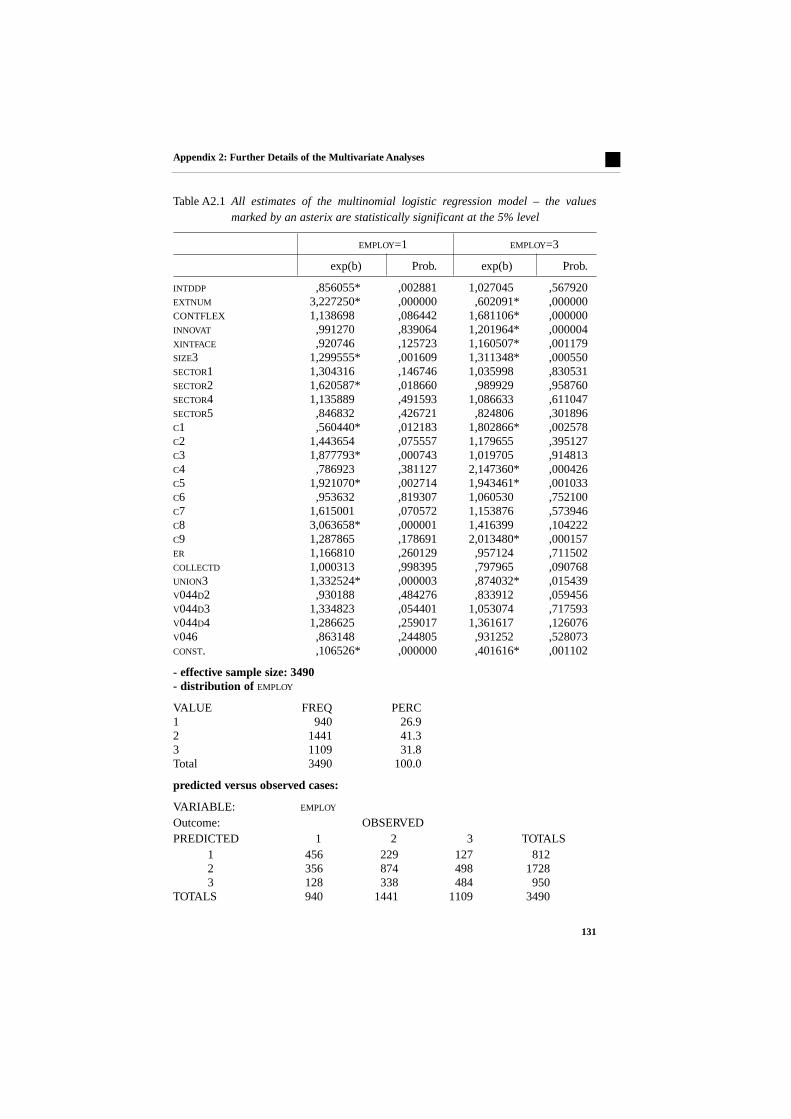
The MLR results in detail
The dependent variable is EMPLOY with the following values:
EMPLOY=1 employment reduction, decrease
EMPLOY=2 stability of employment
EMPLOY=3 employment increases, growth
The independent variables are:
FUNCFLEX - intensity of delegative participation/functional flexibility
(value range 0-4)
NUMFLEX - intensity of external numerical flexibility (value range 0-2)
CONTFLEX - intensity of internal numerical (contract) flexibility
(value range 0-2)
INNOVAT - intensity of innovation (value range 0-4)
CONSULT - intensity of systematic ‘face-to-face’ consultation
(value range 0-4)
Additional independent variables (structural and context variables):
SIZE3: - size of establishment (value range 0-4)
SECTOR - economic sector (dummified as SECTOR1, SECTOR2, SECTOR4,
SECTOR5; SECTOR=4, ie the trade sector, serves as the category
of reference)
COUNTRY - the ten countries (dummified as C1 to C9, COUNTRY=10, ie the
UK, serves as the category of reference)
COLLECT - establishment is bound by collective agreement
(dummified as COLLECT)
UNION3 - degree of unionisation (value range 0-4)
ER - establishments with employee representatives (dummy)
VO44 - status of ownership, dummified as
VO44D2 = owned by domestic company
VO44D3 = owned by EU-based company
VO44D4 = owned by non EU-based company
VO44 = 1 (totally independent) serves as the category of
reference
VO46 - establishment belongs to the profit-sector (dummy)
130
Employment through Flexibility – Squaring the Circle?

Table A2.1 All estimates of the multinomial logistic regression model – the valuesmarked by an asterix are statistically significant at the 5% level
EMPLOY=1 EMPLOY=3
exp(b) Prob. exp(b) Prob.
INTDDP ,856055* ,002881 1,027045 ,567920EXTNUM 3,227250* ,000000 ,602091* ,000000CONTFLEX 1,138698 ,086442 1,681106* ,000000INNOVAT ,991270 ,839064 1,201964* ,000004XINTFACE ,920746 ,125723 1,160507* ,001179SIZE3 1,299555* ,001609 1,311348* ,000550SECTOR1 1,304316 ,146746 1,035998 ,830531SECTOR2 1,620587* ,018660 ,989929 ,958760SECTOR4 1,135889 ,491593 1,086633 ,611047SECTOR5 ,846832 ,426721 ,824806 ,301896C1 ,560440* ,012183 1,802866* ,002578C2 1,443654 ,075557 1,179655 ,395127C3 1,877793* ,000743 1,019705 ,914813C4 ,786923 ,381127 2,147360* ,000426C5 1,921070* ,002714 1,943461* ,001033C6 ,953632 ,819307 1,060530 ,752100C7 1,615001 ,070572 1,153876 ,573946C8 3,063658* ,000001 1,416399 ,104222C9 1,287865 ,178691 2,013480* ,000157ER 1,166810 ,260129 ,957124 ,711502COLLECTD 1,000313 ,998395 ,797965 ,090768UNION3 1,332524* ,000003 ,874032* ,015439V044D2 ,930188 ,484276 ,833912 ,059456V044D3 1,334823 ,054401 1,053074 ,717593V044D4 1,286625 ,259017 1,361617 ,126076V046 ,863148 ,244805 ,931252 ,528073CONST. ,106526* ,000000 ,401616* ,001102
- effective sample size: 3490- distribution of EMPLOY
VALUE FREQ PERC1 940 26.9 2 1441 41.3 3 1109 31.8 Total 3490 100.0
predicted versus observed cases:
VARIABLE: EMPLOY
Outcome: OBSERVEDPREDICTED 1 2 3 TOTALS
1 456 229 127 8122 356 874 498 17283 128 338 484 950
TOTALS 940 1441 1109 3490
131
Appendix 2: Further Details of the Multivariate Analyses

log-likelihood improvement:-2 Log-Likelihood / Estimated Model 6761.321-2 Log-Likelihood / Constants only 7745.217
Improvement:Chisq DF F-Prob. Reduction.953.722 52.000 .000 .124
Table A2.2 Summary overview of nine multinomial logistic regression models to assessthe Log-Likelihood (LL) improvement of each independent variable(statistically significant variables only)
Variable: LL-improvement LL-improvement differencewithout variable of the total model
FUNCFLEX 0.122 0.124 -0.002NUMFLEX 0.063 0.124 -0.061CONTFLEX 0.103 0.124 -0.021INNOVAT 0.120 0.124 -0.004CONSULT 0.121 0.124 -0.003SIZE3 0.122 0.124 -0.002COUNTRIES 0.102 0.124 -0.022SECTOR1 0.121 0.124 -0.003UNION3 0.118 0.124 -0.006
Note on table A2.2: In each model one of the nine independent variables wasomitted to assess the change of value of Log-Likelihood reduction due to thisindependent variable. The variable omitted in each analysis is listed in the firstcolumn under ‘variable’.
The linear probability method
Underlying LPM is a linear regression model in which interval and nominalvariables can be entered as independent and as dependent variable. In our case,the dependent variable Y (EMPLOY) is of nominal level, and the model is amultivariate linear regression model. Y is conceived as a set of dummy variableswith one dummy variable Yj for each category. Yj is 1, if therespondent/workplace belongs to category j, and zero if it does not.
On the predictor side of the model, nominal variables are used. The nominalpredictors are dummified in the same way as Y. It is assumed that in theregression equation each error term is normally distributed with an expectationof zero and a variance that is the same for all error terms (assumptions ofnormality and homoscedasticity).
132
Employment through Flexibility – Squaring the Circle?

The variables in the model are the same as in the MLR analysis described above.The computer programme used is called RENOVA (Regression Analysis withNominal Variables), developed by Lammers and Pelzer (1992).
A part of the output of the RENOVA program – the explained variance and the(comparison of) uncontrolled and controlled bivariate relations is presented inChapter 8 (Tables 8.2 and 8.3). Another part of the output of this type ofregression analysis consists of so called ‘controlled’ contingency tables. In thesecontrolled tables the column-percentages are cleared from influences of all theother attributes. These controlled contingency tables are the input for thecorrespondence analysis, described below. A detailed description of the linearregression model and RENOVA is given by Lammers and Pelzer (1992).
Correspondence analysis
Like MLR, correspondence analysis is a statistical technique for analysis ofnomial data. However, a disadvantage of MLR and other loglinear regressiontechniques is that the parameters in the output are difficult to interpret, makingit less attractive to many researchers and other users of empirical data.Correspondence is a suitable alternative. The results of correspondence analysisare visualised in a graphical display which, even in case of complex contingencytables, permits rapid interpretation and understanding. The graphical displaymakes possible that we see at a single glance the way the data are related to eachother, and we more easily see regularities such as patterns and profiles in thedata. A further advantage of CA compared to other visualisation techniques isthat the only output are pictures that contain all the information in the data.There is no loss of information between the data and the graph. CA neithermodels nor summarises the data, ‘it expresses the data in a different formatwhich communicates the information in a different way’ (Greenacre, 1993, p. 4-5).
Normally, CA is based on bivariate contingency tables: in our case, for example,employment (change) by country, by sector, by functional flexibility, etc. Whatthese contingency table(s) – and hence the CA based on it – would not reveal, iswhether and to what degree the relations between employment (change) and theother variable(s) in the table are influenced by other workplace and/or possiblerelevant contextual factors. After all, we want to know what the relation isbetween eg ‘size of the workplace’ and employment (change), cleared from theinfluences of other variables. There are several ways by which these controlling
133
Appendix 2: Further Details of the Multivariate Analyses

procedures can be realised. We chose a method based on linear regressionanalysis described in the former section.
Having constructed all the controlled contingency tables of employment changeby each of the other variables in the model, we used these tables in the CA.Instead of performing a standard CA on each of the controlled tables apart, weapplied a specific version of CA called ‘composite’ CA (Israel, 1987).Composite CA is especially suited for situations like the one we had, where therelation of a single variable with a number of other variables is studied.
References
Multinomial logistic regression:
Agresti, A., Categorial Data Analysis, New York, John Wiley & Sons, 1990.
Hosmer, D.W., and S. Lemeshow, Applied Logistic Regression, New York, JohnWiley & Sons, 1989.
Long, S., Regression models for categorial and limited dependent variables.London, Sage, 1997.
Linear probability method:
Greenacre, M.J., Correspondence analysis in practice. London and San Diego,Academic Press, 1993.
Israel, A., Eigenvalue techniques for qualitative data, Leiden, DSWO Press.1987.
Lammers, J., and B. Pelzer., ‘Linear models and nominal variables’,Kwanititatieve Methoden, Vol. 39, P. 5-17, 1992.
134
Employment through Flexibility – Squaring the Circle?

European Foundation for the Improvement of Living and Working Conditions
Findings from the EPOC Survey – (Employment through Flexibility – Squaringthe Circle?)
Luxembourg: Office for Official Publications of the European Communities
1999 –138pp. – 16 x 23.5 cm
ISBN 92-828-6562-2
Price (excluding VAT) in Luxembourg: EUR 22


EF/98/57/EN

Employment through Flexibility ÐSquaring the Circle?
EUROPEAN FOUNDATIONfor the Improvement of Living and Working Conditions
Employment through Flexibility ÐSquaring the Circle?
The 1990s have seen a strong revival of the debate on work organisation and how to achievethe optimal input from the workforce, in particular, through direct employee participation.Within the European Union, the European Commission, the social partners and governments ofthe Member States began an intensive debate on the need for structural adjustment, whichbecame increasingly urgent as Europe slipped into its worst post-war recession.
The FoundationÕs EPOC Project (Employee Direct Participation in Organisational Change) has,over the past few years, examined the various European experiments in direct participation.The earlier research in this project identified an information gap in what we know aboutpractices in European workplaces. What is the extent of direct participation? What form doesit take? Why does management introduce direct participation? What are the economic andsocial effects? To what degree can employees influence the organisation of work or controltheir working environment? What are the sectoral differences?
To answer these and other questions the Foundation undertook a postal survey of Europeanworkplaces during the summer and autumn of 1996, and the results of this survey werepublished in 1997. The survey covered all business sectors and included a range of questionson the effects of direct participation on employment levels and workplace flexibility. It alsocovered different approaches to innovation in the establishments surveyed.
This book is the result of the analysis of the data in the EPOC survey pertaining to the effectsof direct participation on employment levels, and how these relate to aspects of workplaceflexibility such as downsizing, part-time work or the consultation of workers, as well as to thelevel of product and process innovation in European enterprises.
5 4 S
X-21-99-440-E
N-C
Price (excluding VAT) in Luxembourg: EUR 22
OFFICE FOR OFFICIAL PUBLICATIONS OFTHE EUROPEAN COMMUNITIES
L- 2985 LUXEMBOURG 9 789282 865620
ISBN 92-828-6562-2
Findings fromthe EPOC Survey
Em
ployment through F
lexibility Ð S
quaring the Circle? Ð
F
indings from the E
PO
C S
urvey