Embed Size (px)
Citation preview
!
!
Choosing Employment !!!The key to economic participation for people with intellectual disability
!!!
Part 1 - Survey of people with intellectual disability and families
!!! !!!!!!!!!!!Version 1.0 !30 June 2014
�1

!Inclusion Australia (NCID) has over 5,000 members representing all 8 states and territories. In addition to having people with intellectual disability on our Board, Inclusion Australia receives policy advice from Our Voice. Our Voice is a committee of NCID's Board, the membership of which is exclusively people with intellectual disability representing all states and territories. !Inclusion Australia is the recognised national peak body with the single focus on intellectual disability, ie, our actions and priorities centre on issues that affect the lives of people with intellectual disability and their families. !Inclusion Australia’s mission is to work to make the Australian community one in which people with intellectual disability are involved and accepted as equal participating members. We do this by: !
listening to people with intellectual disability and their families
promoting and upholding the UN Convention on the Rights of Persons with Disabilities
developing and promoting creative policies and practices
speaking to politicians, public servants, business and community leaders about the lives of people with intellectual disability and their right to have equality of opportunity !
Inclusion Australia is a social profit organisation. Inclusion Australia (NCID) was created in 1971 by parents and friends in an endeavour to improve the quality of life of people with intellectual disability and to fill the need for national unity and information.
!!!!!!!!!!Inclusion Australia PO Box 771 Mawson ACT 2607 !T: 61 2 6296 4400 !e: [email protected] !w: inclusionaustralia.org.au !!!!!!Kevin Stone Mark Pattison President Executive Director
�2

Statement of Principles !All people have inherent dignity and worth and equal and inalienable rights.
All people are valued members of the Australian Community.
People with intellectual disability as equal participating members of the Australian Community have the same rights:
to respect for their individual autonomy and independence
to make their own choices
to participate in decisions which affect their lives
to pursue any grievance which affects their lives
to diversity of choice for housing, education, work, recreation and leisure
to equity and justice
to be empowered to take their full place in the Australian Community
to dignity and privacy in all aspects of their lives !Inclusion Australia will: !✓ work to make the Australian Community one in which people with intellectual disability have
full and equal enjoyment of all human rights and fundamental freedoms and are involved and accepted as equal participating members.
✓ promote and protect the human rights of all persons with intellectual disability, including those who require more intensive support.
Consultation Statement !Inclusion Australia consults people with intellectual disability and family members through our State and Territory Agency Members. In particular we:
➡ conduct an annual survey of members and stakeholders
➡ hold two meetings a year, rotating through all States and Territories
➡ present at the Having a Say Conference each year, attended by over a 1,000 delegates the majority of whom have a disability
➡ hold forums on specific issues
➡ sponsor actions and representations on issues of importance to people with disability
! !!‘This publication has been prepared by the National Council on Intellectual Disability Inc. for the Australian Government, represented by the Department of Social Services. The views expressed in this publication are those of the National Council on Intellectual Disability Inc. and do not necessarily represent the views of the Australian Government.’ !!!!!!!!!
�3

!!Table of Contents!
!!!!!!!!!!!
Introduction 5
Employment Survey 2014 5
Survey Distribution 5
Survey Results 6
Discussion of Survey Results 7
Survey Results 10
Demographics 10
Employment Participation 13
Career Goals 15
Employment Assistance 17
Employment Service Information 19
Who encourages people with intellectual disability to find work? 25
Where do people with intellectual disability and their families find information about employment service providers? 26
What help did you receive to move from school to work? 26
�4

Introduction!In 2014 Inclusion Australia (NCID) undertook a number of activities to promote people with intellectual disability ‘choosing employment’. Employment increases the incomes of people with disability, increases their superannuation, fulfils their citizenship responsibilities through the payment of tax and enables their participation in the social life of their communities.
The importance of employment for people with intellectual disability cannot be underestimated, and it also has the benefit of reducing their reliance on the Disability Support Pension (DSP) which enables revenue to be re-directed to the NDIS and other social programs of the Commonwealth Government.
We have combined our reports to the Department of Social Services (DSS) into 3 parts:
Part 1. Survey of the employment experiences of people with disability and their families
Part 2. Three (3) national forums of families and people with intellectual disability
Part 3. Six (6) NSW forums exploring the experiences of people with intellectual disability and families of the NSW Transition to Work (TTW) program
Employment Survey 2014!A national survey was prepared and distributed by NCID from February to May 2014. A copy of the survey is available from www.inclusionaustralia.org.au.
People with intellectual disability or their family members were invited to complete this survey online or at selected forums.
The purpose of the survey was to seek a better understanding of the labour force status of individuals and how individuals and their families make decisions about employment and employment services.
Survey Distribution!The survey was conducted on a random basis. It was offered online for participants to complete.
The survey was also distributed to NCID state agency members to provide to individuals and families at appropriate meetings and forums. For example, the survey was made available to participants at the ‘Having a Say’ conference in Victoria held in February 2014.
This is the first time this survey has been conducted.
As a random survey it represents an insight into the employment participation and employment choices of those individuals and families who chose to respond to the survey. The high response rate of people in employment indicates a high level of dissatisfaction with the current employment support program.
The results are therefore limited to a ‘picture’ of those who responded and reflects a representative experience of all people with intellectual disability and their families, particularly those in employment.
!
�5
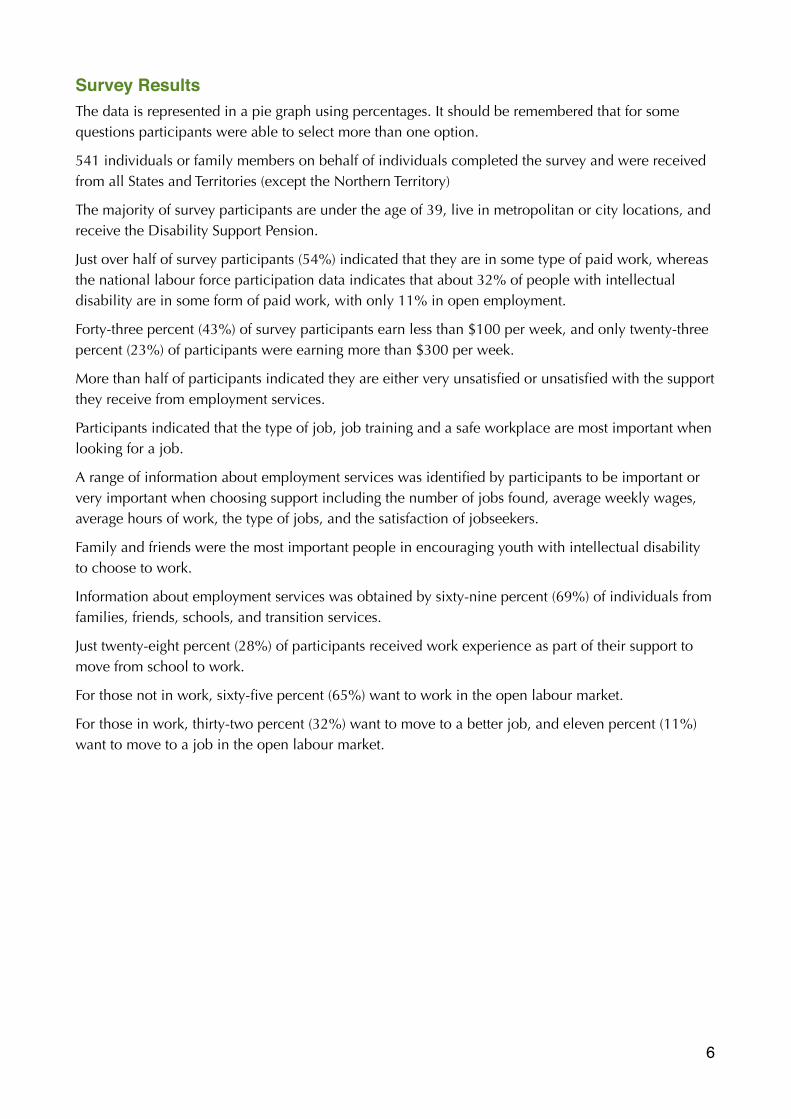
Survey Results!The data is represented in a pie graph using percentages. It should be remembered that for some questions participants were able to select more than one option.
541 individuals or family members on behalf of individuals completed the survey and were received from all States and Territories (except the Northern Territory)
The majority of survey participants are under the age of 39, live in metropolitan or city locations, and receive the Disability Support Pension.
Just over half of survey participants (54%) indicated that they are in some type of paid work, whereas the national labour force participation data indicates that about 32% of people with intellectual disability are in some form of paid work, with only 11% in open employment.
Forty-three percent (43%) of survey participants earn less than $100 per week, and only twenty-three percent (23%) of participants were earning more than $300 per week.
More than half of participants indicated they are either very unsatisfied or unsatisfied with the support they receive from employment services.
Participants indicated that the type of job, job training and a safe workplace are most important when looking for a job.
A range of information about employment services was identified by participants to be important or very important when choosing support including the number of jobs found, average weekly wages, average hours of work, the type of jobs, and the satisfaction of jobseekers.
Family and friends were the most important people in encouraging youth with intellectual disability to choose to work.
Information about employment services was obtained by sixty-nine percent (69%) of individuals from families, friends, schools, and transition services.
Just twenty-eight percent (28%) of participants received work experience as part of their support to move from school to work.
For those not in work, sixty-five percent (65%) want to work in the open labour market.
For those in work, thirty-two percent (32%) want to move to a better job, and eleven percent (11%) want to move to a job in the open labour market.
�6
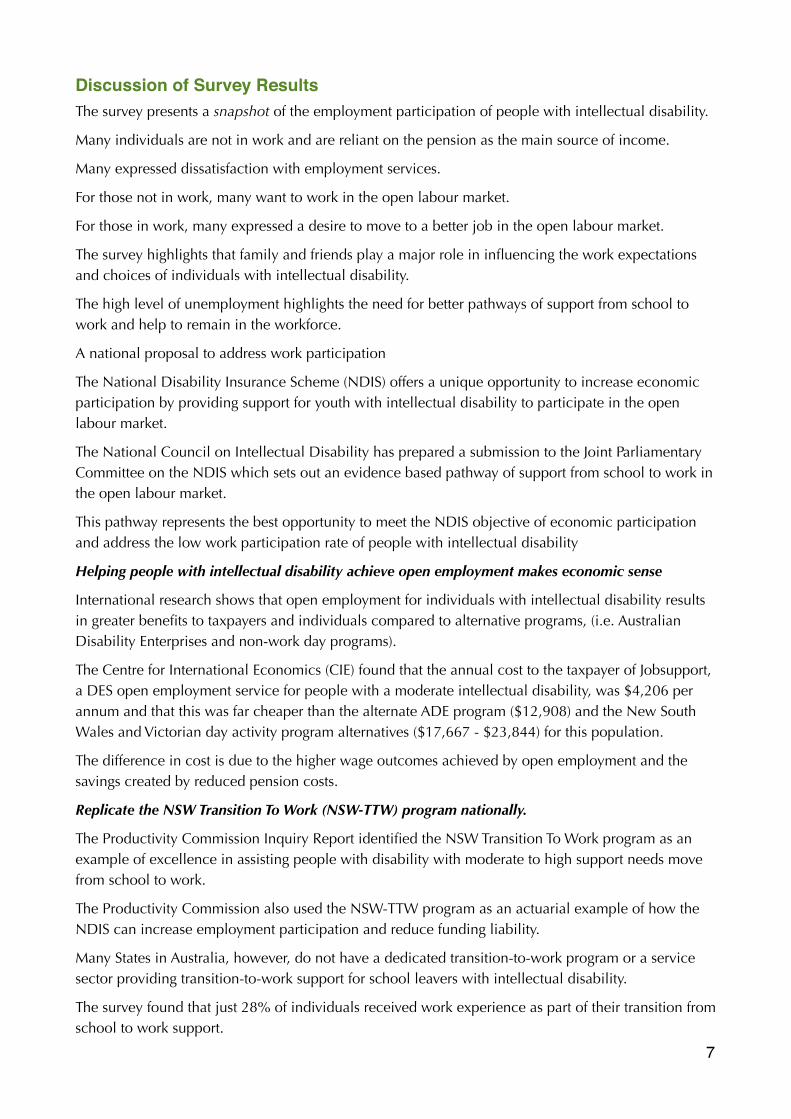
Discussion of Survey Results!The survey presents a snapshot of the employment participation of people with intellectual disability.
Many individuals are not in work and are reliant on the pension as the main source of income.
Many expressed dissatisfaction with employment services.
For those not in work, many want to work in the open labour market.
For those in work, many expressed a desire to move to a better job in the open labour market.
The survey highlights that family and friends play a major role in influencing the work expectations and choices of individuals with intellectual disability.
The high level of unemployment highlights the need for better pathways of support from school to work and help to remain in the workforce.
A national proposal to address work participation
The National Disability Insurance Scheme (NDIS) offers a unique opportunity to increase economic participation by providing support for youth with intellectual disability to participate in the open labour market.
The National Council on Intellectual Disability has prepared a submission to the Joint Parliamentary Committee on the NDIS which sets out an evidence based pathway of support from school to work in the open labour market.
This pathway represents the best opportunity to meet the NDIS objective of economic participation and address the low work participation rate of people with intellectual disability
Helping people with intellectual disability achieve open employment makes economic sense
International research shows that open employment for individuals with intellectual disability results in greater benefits to taxpayers and individuals compared to alternative programs, (i.e. Australian Disability Enterprises and non-work day programs).
The Centre for International Economics (CIE) found that the annual cost to the taxpayer of Jobsupport, a DES open employment service for people with a moderate intellectual disability, was $4,206 per annum and that this was far cheaper than the alternate ADE program ($12,908) and the New South Wales and Victorian day activity program alternatives ($17,667 - $23,844) for this population.
The difference in cost is due to the higher wage outcomes achieved by open employment and the savings created by reduced pension costs.
Replicate the NSW Transition To Work (NSW-TTW) program nationally.
The Productivity Commission Inquiry Report identified the NSW Transition To Work program as an example of excellence in assisting people with disability with moderate to high support needs move from school to work.
The Productivity Commission also used the NSW-TTW program as an actuarial example of how the NDIS can increase employment participation and reduce funding liability.
Many States in Australia, however, do not have a dedicated transition-to-work program or a service sector providing transition-to-work support for school leavers with intellectual disability.
The survey found that just 28% of individuals received work experience as part of their transition from school to work support.
�7

A replication of the NSW-TTW on a national scale will enable the NDIS to offer transition-to-work support to youth with intellectual disability who need this assistance to achieve open employment participation, and as an important means of reducing NDIS expenditure on alternative programs.
Although NSW is the national leader in TTW services, the quality of providers is highly variable. It will be important that transition to work support in the NDIS is restricted to services with a proven track record in achieving open employment outcomes for high support individuals to reduce financial waste.
Address low expectations of work participation by ensuring skilled TTW and DES open employment services.
A major barrier to work participation for people with intellectual disability are low expectations.
Our experience has shown that low expectations is best overcome when competent services are available to demonstrate what is possible to people with intellectual disability and their families, and offer transition to work as a risk free opportunity to test the feasibility of open employment.
It would be inappropriate to build expectations of work participation under the NDIS without ensuring access to competent transition-to-work and open employment services with the capacity to assist individuals with significant intellectual disability.
The Commonwealth Disability Employment Services evaluation of the moderate intellectual disability loading (MIDL) recommended the establishment of specialist DES contracts for people with moderate intellectual disability. The evaluation found only one DES provider had the skills to achieve high levels of employment outcome rates.
The NSW-TTW evaluation identified that effective transition-to-work providers also operate effective DES open employment contracts. Evidence of high rates of open employment outcomes for people with significant intellectual disability are being demonstrated by providers that offer a combination of transition -to-work support and open employment support.
Adopt the NSW Funding Approach to support best practice transition to work outcomes.
Best practice employment outcomes have been achieved when funding is adequate, able to flexibly change to suit changing participant need, and supported by a skilled workforce.
The NSW-TTW is a two year program for school leavers who typically receive 18 hours of support per week for 48 weeks of the year, at an annual funding of $20,400 per year. Participants are able to choose their provider and may move to a different provider if they are not satisfied with the support they are receiving. Participants also have great flexibility in being able to move between the transition to work program and the community participation (day activity) program.
The NSW funding approach should be adopted by the NDIS to support best practice transition to work support.
Remove disincentives in the DES open employment program
It is important that the DES open employment program is able to respond to the support needs of people with high support needs.
The current lack of funding indexation, and time lag between incurring service cost and receiving service funding discourages the placement of higher support individuals. The timing of service payments creates a disincentive for providers to work with higher support participants.
�8

There is a need to address the current ban on concurrent registration between transition-to-work and DES open employment programs. This prevents people with significant intellectual disability from maintaining ongoing transition support, while the open employment program finds a paid job in the open labour market. Without this ‘cross-over’ people with intellectual disability are forced to exit a program and sit at home waiting for a service to find a job.
There is also the need to address the lack of neutrality in the DES ongoing support performance rating which disadvantages services that place individuals in employment with ongoing support needs. Providers are given a greater reward for working with participants who do not need long term ongoing support in the open labour market.
Maintain consequences for poor provider performance
The Commonwealth introduced consequences for poor providers performance in the DES program. It is important for the NDIS to adopt such an approach so funding is targeted to providers that demonstrate high levels of employment outcomes for jobseekers with intellectual disability.
It is also important for the NDIS to introduce training and technical assistance to providers offering transition to work and open employment support to NDIS participants. This offers providers the opportunity for staff and management to gain skill from evidence based practice and demonstration.
Publish service outcome data for both TTW and DES services.
People with disabilities need to be able to make an informed choice based on which service is most likely to achieve an employment outcome. It is important that choices are informed by published results rather than by which service has the slickest marketing.
Both DES and NSW TTW programs already publish outcome data. It is important that the NDIS incorporate and publish outcome data for employment support.
Publishing individual service outcome data by type of disability (and level of disability where possible, e.g. MIDL data) allows:
• Informed consumer choice.
• Improves outcomes because more people select higher outcome services.
• Puts pressure on poorly performing services to improve
• Allows good performance to be identified. Training can then be based on what works.
�9
Survey Results!!
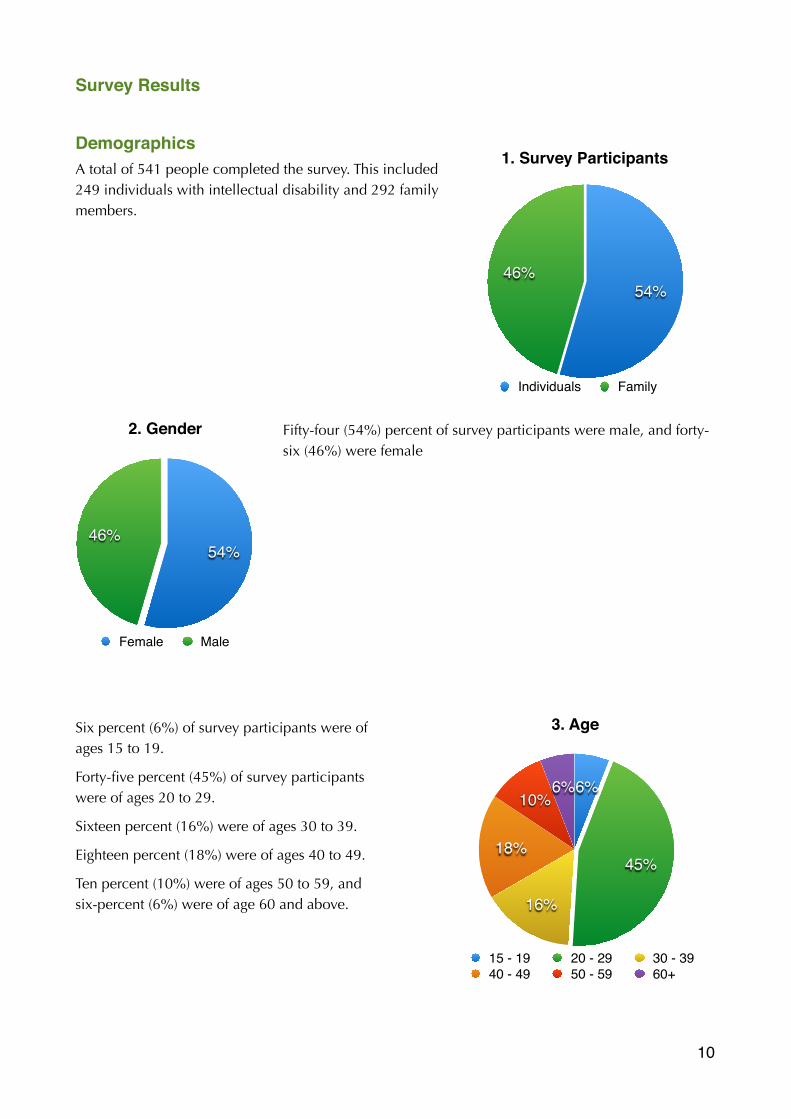
Demographics!A total of 541 people completed the survey. This included 249 individuals with intellectual disability and 292 family members.
Fifty-four (54%) percent of survey participants were male, and forty-six (46%) were female
!!
Six percent (6%) of survey participants were of ages 15 to 19.
Forty-five percent (45%) of survey participants were of ages 20 to 29.
Sixteen percent (16%) were of ages 30 to 39.
Eighteen percent (18%) were of ages 40 to 49.
Ten percent (10%) were of ages 50 to 59, and six-percent (6%) were of age 60 and above.
!!!
�10
1. Survey Participants
46%54%
Individuals Family
2. Gender
46%54%
Female Male
3. Age
6%10%
18%
16%
45%
6%
15 - 19 20 - 29 30 - 3940 - 49 50 - 59 60+

!Thirty-five percent (35%) live in New South Wales or the Australian Capital Territory.
Twenty-nine percent (29%) of participants live in Victoria.
Eleven percent (11%) live in Queensland.
Ten percent (10%) live in South Australia.
Eight percent (8%) live in Western Australia.
Seven percent (7%) live in Tasmania.
No surveys were received from the Northern Territory.
Most participants (70%) live in city or metropolitan areas.
Twenty-four percent (24%) live in regional towns or rural areas, and six percent (6%) live in regional cities.
�11
4. Postcode
7%8%
10%
11%
29%
35%
2000+ 3000+ 4000+5000+ 6000+ 7000+
5. City, Regional City, Regional Town/Rural
24%
6%
70%
CityRegional cityRegional town/rural

Ten percent (10%) of survey participants are indigenous Australians.
Ten percent (10%) of participants were from a non-English speaking background.
!Eighty-six percent (86%) of survey participants receive the Disability Support Pension.
Two percent are in receipt of NewStart.
Twelve percent (12%) do not receive any government income support.
!
�12
8. Income support
2%
86%
12%
No DSP Newstart
6. Indigenous
90%
10%
Yes No
7. Cultural background
90%
10%
Yes No

Employment Participation!!
46% indicated that they were in a paid job. 54% indicated that they were not in a paid job.
!!
Participants were able to select more than one survey option about what they did during the day.
• 37% indicated that they were in paid work.
• 13% participated in day programs.
• 17% were doing voluntary work.
• 17% stayed at home.
• 12% were undertaking further education.
• 3% participated in transition to work programs.
�13
9. In Paid Work
54%46%
yes no
10. What do participants do during the day?
17%
17%
12%3% 13%
37%
Paid Work Day ServiceTransition to work Further educationVoluntary work Stay at home
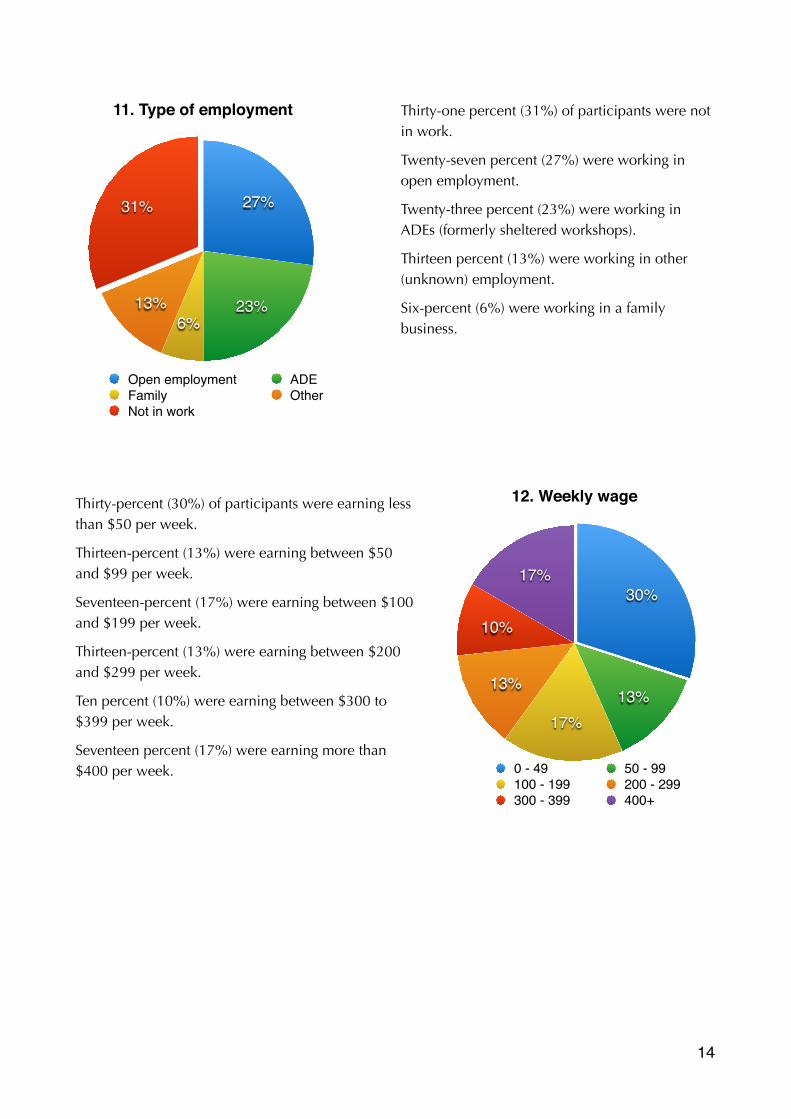
Thirty-one percent (31%) of participants were not in work.
Twenty-seven percent (27%) were working in open employment.
Twenty-three percent (23%) were working in ADEs (formerly sheltered workshops).
Thirteen percent (13%) were working in other (unknown) employment.
Six-percent (6%) were working in a family business.
Thirty-percent (30%) of participants were earning less than $50 per week.
Thirteen-percent (13%) were earning between $50 and $99 per week.
Seventeen-percent (17%) were earning between $100 and $199 per week.
Thirteen-percent (13%) were earning between $200 and $299 per week.
Ten percent (10%) were earning between $300 to $399 per week.
Seventeen percent (17%) were earning more than $400 per week.
!
!�14
11. Type of employment
31%
13%6%
23%
27%
Open employment ADEFamily OtherNot in work
12. Weekly wage
17%
10%
13%
17%13%
30%
0 - 49 50 - 99100 - 199 200 - 299300 - 399 400+

Career Goals!!
!Sixty-five percent (65%) of participants not in employment, wanted to work in open employment was their career goal.
Twenty-one percent (21%) of participants wanted to work in their own business was their career goal.
Six percent (6%) of participants wanted to work in an Australian Disability Enterprise (formerly sheltered workshop) as their career goal.
!
!!
Thirty-two percent (32%) of participants currently in work want to move to a better job.
Twenty-five percent (25%) of participants want an increase in their wages.
Fourteen percent (14%) of participants want greater number of hours of work.
Eleven percent (11%) of participants want to move to open employment.
!!
�15
13. If not in paid work, what is your work goal?
3%21%
6%6% 65%
To work in open employmentTo work in ADETo retireTo work in own businessTo work in family business
14. If in work, what are your career goals?
11%
11%
14%
25%
32%
7%
RetireBetter jobIncreased payIncreased hoursMove to open employmentNo change
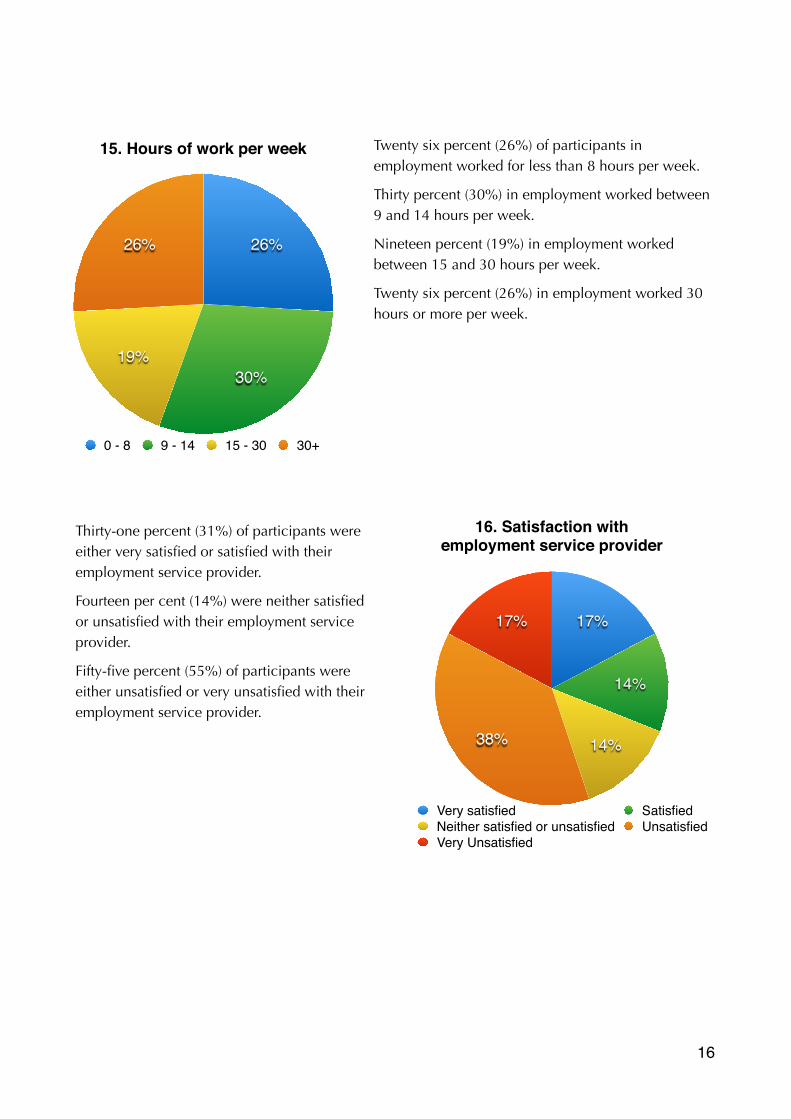
Twenty six percent (26%) of participants in employment worked for less than 8 hours per week.
Thirty percent (30%) in employment worked between 9 and 14 hours per week.
Nineteen percent (19%) in employment worked between 15 and 30 hours per week.
Twenty six percent (26%) in employment worked 30 hours or more per week.
!Thirty-one percent (31%) of participants were either very satisfied or satisfied with their employment service provider.
Fourteen per cent (14%) were neither satisfied or unsatisfied with their employment service provider.
Fifty-five percent (55%) of participants were either unsatisfied or very unsatisfied with their employment service provider.
!
�16
15. Hours of work per week
26%
19%30%
26%
0 - 8 9 - 14 15 - 30 30+
16. Satisfaction with employment service provider
17%
38% 14%
14%
17%
Very satisfied SatisfiedNeither satisfied or unsatisfied UnsatisfiedVery Unsatisfied

Employment Assistance!What help do participants consider to be important when looking for a job?
Eighty percent (80%) of participants identified help to find a job as very important.
!!!!!!!
Sixty-two (62%) of participants identified long term support as very important
!!!!!!!!
!!
Fifty-nine percent (59%) of participants identified travel to and from work support to be important or very important.
!
!
�17
17a. Help to find a job
2%6%6%6%
80%
Very importantModerately importantImportantLittle importanceunimportant
17b. Long term support
7%16%
16% 62%
Very importantModerately importantImportantLittle importance Unimportant
17c. Travel to & from work
5%10%
27%
27%
32%
Very importantModerately importantImportantLittle importanceUnimportant

Seventy-six percent (76%) of participants identified job training as very important.
!!!!!!
!!
Eighty-four percent (84%) of participants identified a safe work place to be very important.
!!!!!!!!!!
Seventy-eight percent (78%) of participants identified having friends at work as important or very important.
!!
�18
17d. Job training
4%17%
2%
76%
Very importantModerately importantImportantLittle importanceUnimportant
17e. A safe work place
4%9%2%
84%
Very importantModerately importantImportantLittle importanceUnimportant
17f. Having friends at work
2%20%
23%55%
Very importantModerately importantImportantLittle importanceUnimportant

�19
17g. Keeping the pension
11%7%
7%
20%
55%
Very importantModerately importantImportantLittle importanceUnimportant
17h. Links to other services
2%20%
41%
12%
24%
Very importantModerately importantImportantLittle importanceUnimportant
17i. The type of job
5%
26%
2% 67%
Very importantModerately importantImportantLittle importanceUnimportant
Seventy-two percent (72%) of participants identified keeping the pension to be important or very important.
!!!!!!!!!!Sixty-five percent (65%) of participants identified links to other services as important or very important.
!!!!!!!!!!!Ninety-three percent (93%) of participants identified the type of job to as very important or important when looking for a job.

Employment Service Information!!Seventy-four percent (74%) of participants consider the number of people who get jobs at an employment service
!
Seventy-seven percent (77%) of participants consider that the average hours of work of jobs achieved by employment service providers is important or very important information.
!
!
�20
18b. Average hours of work?
3%6%
21%
15%56%
Very importantModerately importantImportantLittle importanceUnimportant
18a. How many people get jobs?
6%9%
20%
11%
54%
Very importantModerately importantImportantLittle importanceUnimportant

Eighty-five percent (85%) of participants consider that the average wages of jobs achieved by employment service providers is important or very important information.
!!!!
!!!Eighty-nine percent (89%) of participants consider it important or very important to know how many people with intellectual disability are supported by an employment service provider.
!!!!!!!!
!!!!!!!!!!
�21
18d. How many people with intellectual
disability?
2%25%
9% 64%
Very importantModerately importantImportantLittle importanceUnimportant
18c. Average wages?
27%
15%58%
Very importantModerately importantImportantLittle importanceUnimportant
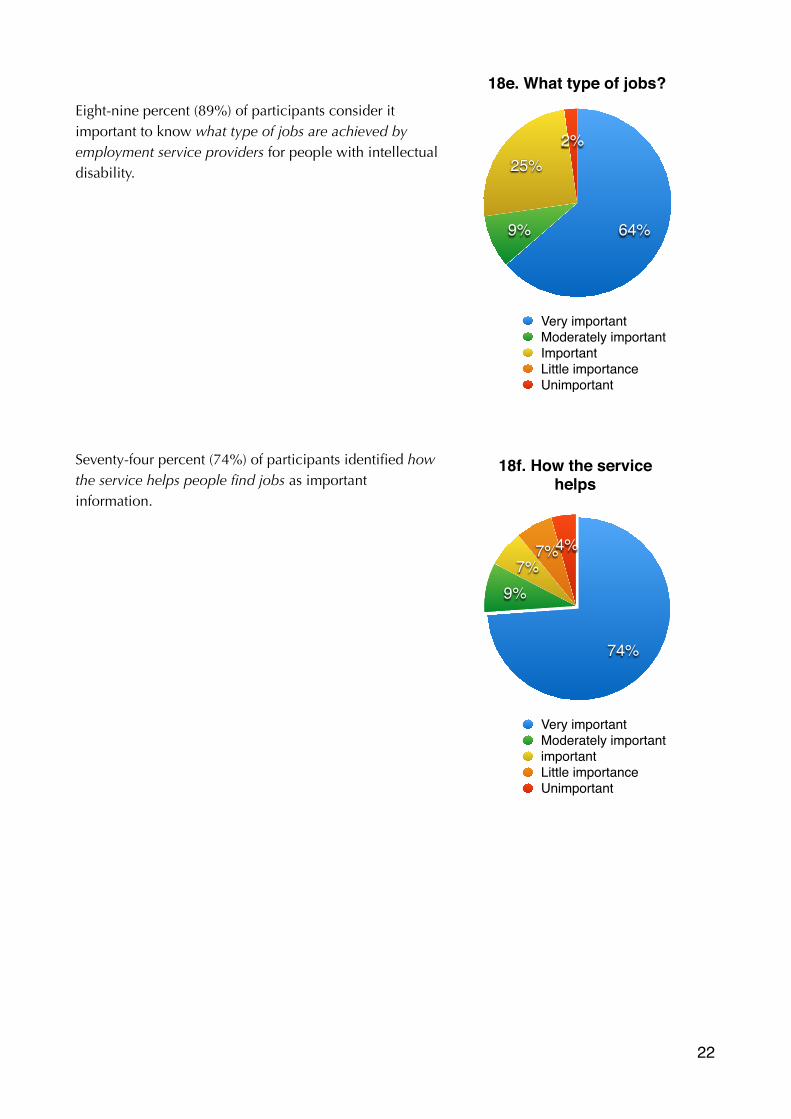
!Eight-nine percent (89%) of participants consider it important to know what type of jobs are achieved by employment service providers for people with intellectual disability.
!!!!!!!!!Seventy-four percent (74%) of participants identified how the service helps people find jobs as important information.
!
!
�22
18e. What type of jobs?
2%25%
9% 64%
Very importantModerately importantImportantLittle importanceUnimportant
18f. How the service helps
4%7%7%
9%
74%
Very importantModerately importantimportantLittle importanceUnimportant

Eighty-five percent (85%) of participants identified how long it took a service to find a job as important information.
!
!Ninety-one participants (91%) identified the satisfaction of past clients of an employment service provider as important information.
!!!!!!!
�23
18g. Time to get a job
5%
29%
10%
56%
Very importantModerately importantimportantLittle importanceUnimportant
18h. Are other people happy with the service?
2%27%
7% 64%
Very importantModerately importantimportantLittle importanceUnimportant

Seventy-nine percent (79%) of participants identify general information and about an employment service (e.g. location) to be important or very important.
!!!!!
!!!
�24
18i. General information, eg, location of service?
2%
29%
19%
50%
Very importantModerately importantimportantLittle importanceUnimportant
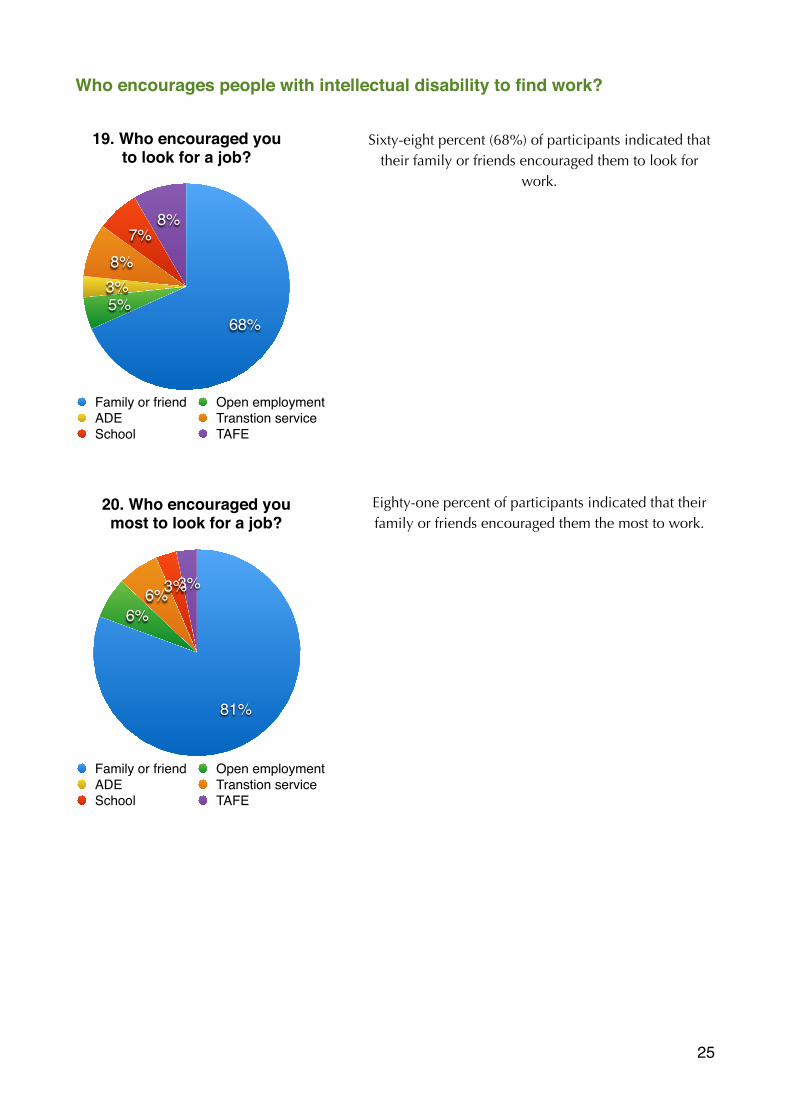
Who encourages people with intellectual disability to find work?!!
Sixty-eight percent (68%) of participants indicated that their family or friends encouraged them to look for
work.
Eighty-one percent of participants indicated that their family or friends encouraged them the most to work.
!
�25
19. Who encouraged you to look for a job?
8%7%
8%3%5%
68%
Family or friend Open employmentADE Transtion serviceSchool TAFE
20. Who encouraged you most to look for a job?
3%3%6%6%
81%
Family or friend Open employmentADE Transtion serviceSchool TAFE

Where do people with intellectual disability and their families find information about employment service providers?!Thirty-one percent (31%) of participants found information about employment service providers from their family or friends.
Twenty-two percent (22%) of participants found information from school or TAFE.
Eighteen percent (18%) of participants found information from the internet.
Sixteen percent (16%) of participants found information from transition services.
Eleven percent (11%) of participants found information from Centrelink.
!
What help did you receive to move from school to work?!Twenty-eight percent (28%) received work experience as part of school to work support.
Twenty-three percent (23%) received vocational training (e.g. TAFE).
Sixteen-percent (16%) received information / brochures.
Fourteen percent (14%) received a transition to work plan.
Fourteen percent (14%) received no transition to work support.
�26
21. Where did you find information about
employment service providers?
18%
22%
16% 2%11%
31%
Family or friend CentrelinkADE Transtion serviceSchool/TAFE Internet
22. What help did you receive to move from
school to work?
5%14%
14%
16% 23%
28%
Work experience Vocational trainingInformation/brochures Transition planNo help Family