Embed Size (px)
Citation preview

Employment in China After It ReaEmployment in China After It Rea
ched Lewis Turning Pointched Lewis Turning Point
CAI FangCAI FangInstitute of Population and Labor EconomicsInstitute of Population and Labor Economics
Chinese Academy of Social SciencesChinese Academy of Social Sciences
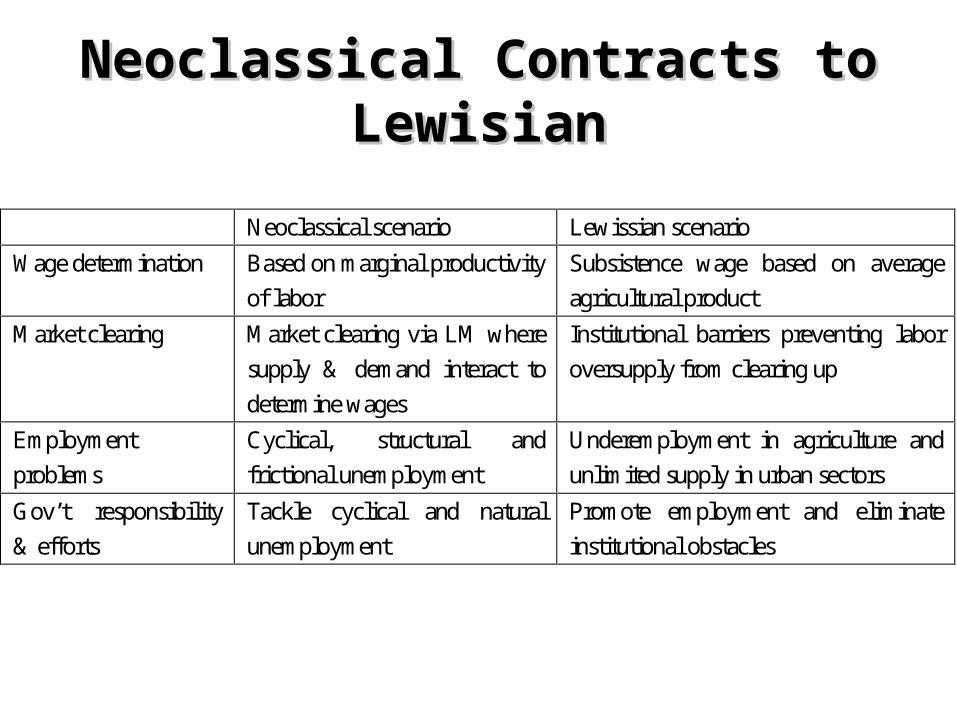
Neoclassical Contracts to LewisianNeoclassical Contracts to Lewisian
Neoclassical scenario Lewissian scenario
Wage determination
Based on marginal productivity
of labor
Subsistence wage based on average
agricultural product
Market clearing Market clearing via LM where
supply & demand interact to
determine wages
Institutional barriers preventing labor
oversupply from clearing up
Employment
problems
Cyclical, structural and
frictional unemployment
Underemployment in agriculture and
unlimited supply in urban sectors
Gov’t responsibility
& efforts
Tackle cyclical and natural
unemployment
Promote employment and eliminate
institutional obstacles
This Presentation Intends toThis Presentation Intends to
• How demographic transition reshaped LM and employment in China
• Employment problems mixed by factors of both neoclassical and dual economy characteristics
• 3 groups with special vulnerability exposed to cyclical & natural unemp’t with focus on migrant workers

Demographic Transition and Demographic Transition and
Labor Market OutcomesLabor Market Outcomes

China Demographic TransitionChina Demographic Transition

Demography-resulted Labor ShortageDemography-resulted Labor Shortage
- 20
- 15
- 10
- 5
0
5
10
15
20
2002
2003
2004
2005
2006
2007
2008
2009
2010
2011
2012
2013
2014
2015
2016
2017
2018
2019
2020
2021
2022
Incr
ease
of
WAP
(mil
.)
Urban Rural

Labor Force Is AgingLabor Force Is Aging
0
100
200
300
400
500
600
700
800
900
1000
2005 2010 2015 2020
Work
ing
popu
lati
on (
mill
.)
20-34 35-49 50-64

Labor Demand Continues IncreasingLabor Demand Continues Increasing
0
50
100
150
200
250
300
350
400
450
500
Urba
n em
ploy
ment
(mi
l.)
2002
2003
2004
2005
2006
2007
2008
2009
2010
Urban mi grant workers Urban resi dent workers

Scenarios of Labor DemandScenarios of Labor Demand
3. 74. 2
4. 75. 2
6. 16. 8
7. 68. 3
0
1
2
3
4
5
6
7
8
9
8% 9% 10% 11%Annual growth scenar i os
Empl
oyme
nt g
rowt
h ra
tes
(%) Secondary Terti ary

Wages Increases in All SectorsWages Increases in All Sectors
0
5
10
15
20
25
30
35
4019
98
1999
2000
2001
2002
2003
2004
2005
2006
2007
2008
Year
Ag
ricu
ltura
l wa
ge
s(y
ua
n/d
ay)
0
200
400
600
800
1000
1200
1400
1600
1800
No
n-a
gri
cultu
ral w
ag
es
(yu
an
/mo
nth
)
Grai n Pi g f arm CotonManuf . Const ruct i on Mi grants

Challenges Are Brand NewChallenges Are Brand New
for Chinese Governmentsfor Chinese Governments

From Dual to Neoclassical ScenarioFrom Dual to Neoclassical Scenario

Workers’ Expectation Increasing, tooWorkers’ Expectation Increasing, too
0
200
400
600
800
1000
1999 2000 2001 2002 2003 2004 2005 2006 2007 2008 2009
Num
ber o
f Lab
or D
ispu
tes
Cas
es(t
hous
and)
Cases Accepted Cases Mediated
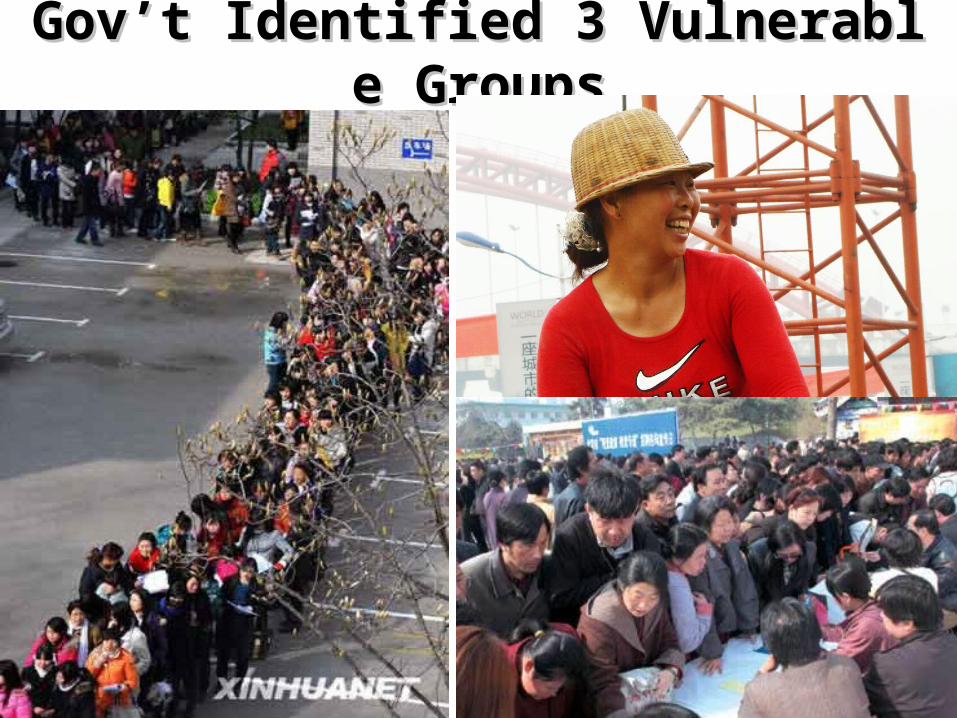
Gov’t Identified 3 Vulnerable GroupsGov’t Identified 3 Vulnerable Groups

Incomplete UrbanizationIncomplete Urbanization
10
20
30
40
5019
90
1991
1992
1993
1994
1995
1996
1997
1998
1999
2000
2001
2002
2003
2004
2005
2006
2007
Popu
lati
on s
hare
(%) Non- agr share Urban share

Agricultural Labor Is AgingAgricultural Labor Is Aging
40 over50%
31- 4031%
26- 309%
21- 251%16- 20
9%
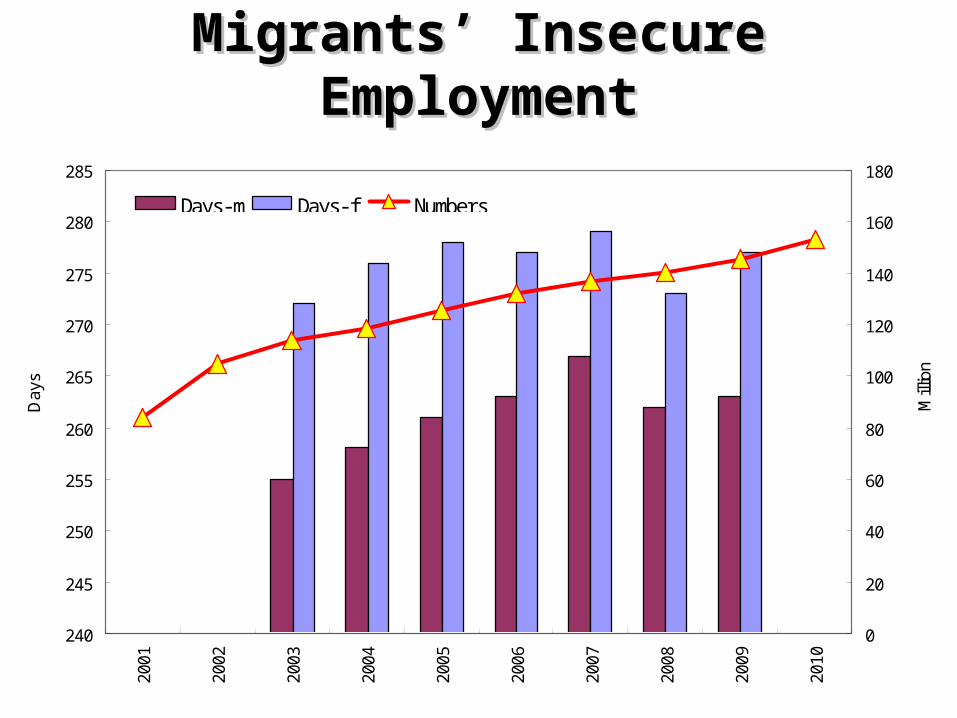
Migrants’ Insecure EmploymentMigrants’ Insecure Employment
240
245
250
255
260
265
270
275
280
285
2001
2002
2003
2004
2005
2006
2007
2008
2009
2010
Day
s
0
20
40
60
80
100
120
140
160
180
Mill
ion
Days-m Days- f Numbers

Low Coverage of Social SecurityLow Coverage of Social Security
40. 9
52. 747. 9
34. 9
57. 0
3. 7
13. 1
24. 1
2. 0
9. 8
0
10
20
30
40
50
60
Cove
rage
rat
es (
%)
Urban workers Mi grant workers
Policy Agenda for New EraPolicy Agenda for New Era
• Integrating labor market (hukou reform)
• Labor market institutions (collective barg
aining)
• Broader social protection mechanism
• Employment-centered macroeconomic po
licy

Thank you for attentionThank you for attention