Embed Size (px)
Citation preview

1 1
Employment Equity Act Section 6
2 2
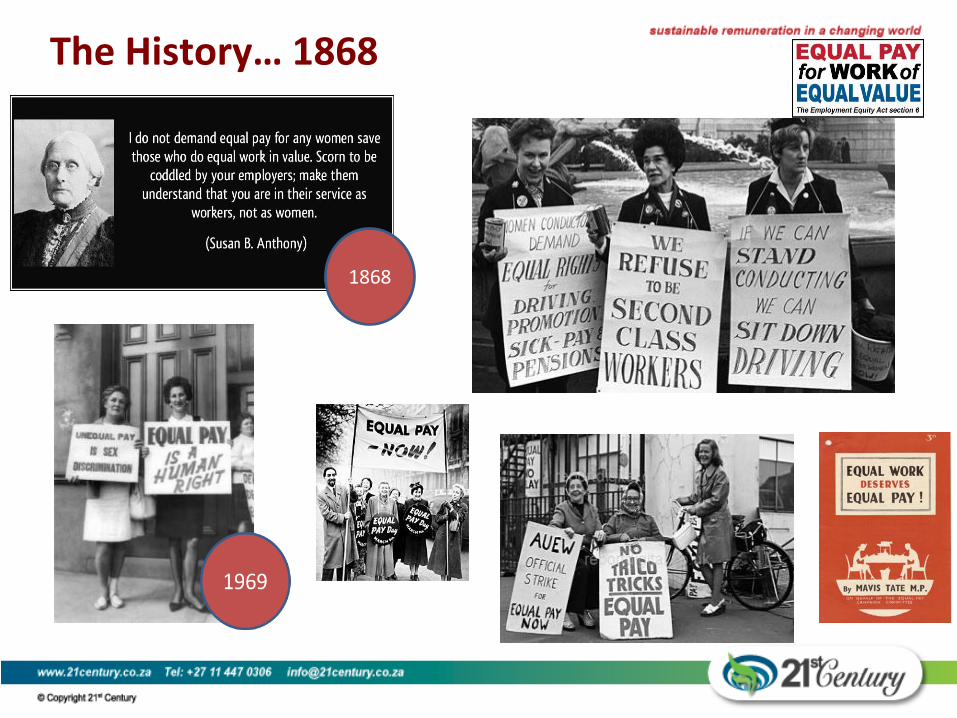
The History… 1868
1868

3 3
The current scenario...

4 4
Some interesting facts
According to the 2015 World Economic Forum global gender gap report, it is
likely to take 118 years on average for women to receive equal pay to men.
http://www.iol.co.za/business/news/negotiation-skills-essential-for-closing-pay-gap-2035012
In South Africa, this gap in
earnings is estimated to be
between 15 and 17%. The
implication is that a woman
would need to work two
months longer than her
male counterpart to earn as
much in the same role.

5 5
Reminder: Equal Pay for Work of Equal Value
Employment Equity Amendment Act 47 of 2013
(Effective 1 August 2014)
Section 6
Employment Equity Regulations 1 August 2014
(Effective from date of publication)
Criteria for assessment
Factors of differentiation
Code of Good Practice 1 June 2015
Guidelines on implementing:
• criteria for assessment,
• differentiators,
• comparing male and female dominated jobs,
process for evaluating equal pay/remuneration for work of equal value
Overview of the Legislation

6 6
unfair discrimination
Section 6(1): constituent elements
No person may unfairly discriminate directly or
Indirectly against an employee in any employment
policy or practice on one or more grounds
Including race, gender amongst others or
on any other arbitrary or unlisted
ground e.g depression or human dignity or
physical appearance e.g blonde hair
Reminder - Arbitrary and Listed grounds

7 7
Path to Follow
Plan
Corrective Actions and Timing
Audit
Pay differences Conditions of Employment Skills
Justifiable Differences
Remuneration Policy Performance Management
Foundation
Job Evaluation Terms and Conditions of
Employment HR Procedures

8 8
The ILO Convention, which is echoed in the Code, focuses on
gender based discrimination in terms of job evaluation.
The Convention requires that measures should be taken in order to
promote objective appraisal of jobs on the basis of the work to
be performed.
Responsibility for finance, people, material;
Skills and qualifications (includes prior learning and experience);
Effort (physical, mental, emotional);
Conditions under which work is performed (physical environment, psychological conditions, geographic location);
Any other factor indicating value of the work
Job Evaluation : Legal Requirements

9 9
Job Profiles
Typical Content Legal Requirement
Purpose Statement
Qualifications Skills and qualifications (includes prior
learning and experience);
Competencies
Outputs Responsibility for finance, people, material;
Budget
Biographical Issues
Conditions under which work is performed
(physical environment, psychological
conditions, geographic location);
Effort (physical, mental, emotional);
Any other factor indicating value of the
work

10 10
Policy
Grading system
Patterson
Peromnes
Hay
Methodology
Extraordinary conditions
Grade Jobs
Grading Committees
Consistency across the organisation
Removal of bias perceptions
Job Evaluation

11 11
Path to Follow
Plan
Corrective Actions and Timing
Audit
Pay differences Conditions of Employment Skills
Justifiable Differences
Remuneration Policy Performance Management
Foundation
Job Evaluation Terms and Conditions of
Employment HR Procedures

12 12
Attach benefits:
Conditional benefits
Night shift allowances
Acting Allowances
Transport
Overtime
Commission
Job Requirements
Car Allowance
Petrol allowance
Terms and Conditions of Employment
Is the benefit
• a requirement of the job?
• Defensible
• Applicable to all in the role

13 13
HR Processes / Procedures
recruitment procedures, advertising and selection criteria
appointments and the appointment process
job assignments
the working environment and facilities
training and development
promotion
transfer
Demotion
Incapacity
disciplinary measures
But it is not just Remuneration and benefits…
Monitoring mechanisms
• HR sign off
• Committee sign off
• EE Committee

14 14
Path to Follow
Plan
Corrective Actions and Timing
Audit
Pay differences Conditions of Employment Skills
Justifiable Differences
Remuneration Policy Performance Management
Foundation
Job Evaluation Terms and Conditions of
Employment HR Procedures

15 15
Justifiable Differences
NOT unfair discrimination if the differentiation in pay/remuneration is not based on a
listed or arbitrary ground.
Must be fair and rational and based on any one or more of the following grounds:
Seniority or length of service;
Qualifications
Ability,
Competence or potential above the minimum acceptable levels required for the
performance of the job
Performance,
Quantity or quality of work, provided that employees are equally subject to the
employer’s performance evaluation system, and that the performance evaluation
system is consistently applied;
Demotion as a result of organisational restructuring or for any other legitimate
reason without a reduction in pay/remuneration and fixing the employee’s salary
at this level until the pay/remuneration of employees in the same job category
reaches this level;
Employed temporarily in a position for purposes of gaining experience or training
and as a result receives different pay/remuneration or enjoys different terms and
conditions of employment;
Shortage of relevant skill in a particular job classification; and

16 16
Justifiable Differences Remuneration Policy
Remuneration in your
Organisation
Purpose
• Attraction
• Retention
Scarce Skills
• Audit
• Market
Philosophy
• Prior learning
• Performance
• Recognition
Scope
• Equal
• Varying Benefits
Guiding Principles
• Fair & Equitable
• Reinforce Teamwork
Guaranteed Vs Variable Pay
Benefits

17 17
Justifiable Differences
Guaranteed Pay
Job Complexity Measurement
Job evaluation tools
Company’s market position – percentile
Pay scales
Pay progression Principles
Underpinning philosophy
Skill
Effort
Conditions
Individual Performance
Team Performance
Bands per Job Function
Bargaining councils / Unions
Remuneration Considerations

18 18
Justifiable Differences
Variable Pay
Short Term
Long Term
Underpinning philosophy
Self funding vs Budget
Retention or Attraction
Rules
Measurement Criteria
Timing
Eligibility
Levels in the organisation
Job Function
Remuneration Considerations

19 19
Justifiable Differences
Benefits
Guiding Principles
For the majority
Legislative adherence
Fixed vs variable benefits
Flexilibity
Structure
Total Package
Add on
Level Dependent
Remuneration Considerations

20 20
Path to Follow
Plan
Corrective Actions and Timing
Audit
Pay differences Conditions of Employment Skills
Justifiable Differences
Remuneration Policy Performance Management
Foundation
Job Evaluation Terms and Conditions of
Employment HR Procedures

21 21

22 22
PERFORMANCE MANAGEMENT THE MEDIA IS STILL PREACHING ABOUT PERFORMANCE
MANAGEMENT

23 23
CEB Research 2016
Based on 10 000 respondents in 18 countries (CEB, 2016),
the business case for throwing out ratings fails to hold for
most

24 24
Initial Euphoria Does Not Last
Typical Satisfaction with Performance Management and Pay Over Time When
Removing Ratings
Illustrative Satisfaction with Performance Management Over Time
n = 9,686.
Source: CEB 2016 Pay for Performance Employee Survey.
Initial Euphoria: “There was an initial huge boost in morale. Employees felt good that we were removing the part of the performance management process they thought they hated most.”
Director of HR
Technology Industry
Reality Sets In: “Our performance and pay systems began to look like a black box. Without the visible symbol of a rating, employees didn’t understand the processes or the philosophies behind them.”
HR VP
Health Care Industry
1 4 2 3
Performance Review Cyc le Af ter Removing
Rat ings
Em
plo
yee P
erc
eptio
ns
Positive
24
ceb g lo b a l . c o m © 2016 CEB. All rights reserved. CLC5952516SYN
Negative

25 25
Lack of Ratings Impact on Employee
Engagementa
Average Employee Engagement Score
Reality: Managers Struggle to
Engage Employees
Expectation 1: Increased Employee Engagement
6
%
Ratings No Ratings n = 9,686. Source: CEB 2016 Pay for Performance Employee Survey. a Employee engagement scores comprise two batteries that represent employees’ involvement in their work and intent to stay at their organization.
Note: The reduction in employee engagement is statistically significant p < 0.001.
Advice for Organizations
Without Ratings
■ Communicate new performance
management philosophy and
processes to employees so they
understand what to expect and
how it is intended to benefit
them.
■ Identify new and different
ways to recognize high
performance outside the
traditional performance
management process
to improve employee
engagement.
“Employees felt that having
performance reviews without the
rating was like g o i n g out to a nice dinner but without steak. You got the sides but
not the main meal.”
HR Leader
Telecommunications
25
ceb g lo b a l . c o m © 2016 CEB. All rights reserved. CLC5952516SYN

26 26
Manager Time Spent on Performance Management
Activitiesa Average Hours (and Proportional Time Spent) on
Performance Management per Year, per Direct Report
The Bottom Line
In the absence of ratings, managers spend less time on performance
management activities. But they do not shift that extra time toward
ongoing, informal performance conversations.
Formal Performance Management Activities Informal Performance Conversations
n = 9,686.
Source: CEB 2016 Pay for Performance Employee Survey. a Formal performance management activities include goal setting, performance evaluation and calibration, documenting employee performance, and preparing for performance conversations. To calculate time spent on informal conversations per year, manager conversation sessions were estimated to last one hour.
Note: The reduction in time spent on performance management activities is statistically significant p < 0.001.
0%
50
25
7 Hours
(16%)
43 Hours
Ratings No Ratings
6 Hours
(20%)
30 Hours
36 Hours
(84%) 24 Hours
( 8 0 % )
Advice for
Organizations Without
Ratings
■ Set expectations for the
timing and frequency of
performance conversations
to encourage managers and
employees to have regular
discussions.
■ Allow employees to own
performance
conversations so that they
can customize discussions
and share accountability
with managers.
Reality: Managers Spend Less Time on Informal
Conversations Without Ratings
Expectation 2: Increased Performance Management Time
Spend
10 ceb g lo b a l . c o m © 2016 CEB. All rights reserved. CLC5952516SYN

27 27
14%
Lack of Ratings Reduces Employee Perceptions of
Manager Conversation Qualitya
Average Quality of Manager Conversation Score
1 How They Per formed in the Past Performance on assignments, contributions to organizational success,
impact on customers or partners
How to Improve Future Per formance Developmental
action steps, future performance objectives, work
priorities, clarity of expectations
2
n = 10,531.
Source: CEB 2014 Enterprise Contribution Workforce Survey. a This calculation was completed using the Quality of Manager Conversation Score, which represents how effective managers are at helping employees understand their performance in the past and how they can improve performance and development in the future.
Note: The reduction in manager conversation quality is statistically significant p < 0.001.
Expectation 3: Improved Manager Conversations Quality
Reality: Manager Conversation
Quality Decreases Without Ratings
Ratings No Ratings
Qual i ty of Manager Conversat ion Score Def ined
Advice for Organizations
Without Ratings
■ Measure the quality,
not just occurrence, of
manager
conversations through
existing employee
surveys
or other feedback
mechanisms to
focus managers on
conversation
quality.
■ Train managers to
send clear
messages
about performance and
development without
ratings by providing
concrete evidence of
how the employee
is performing
and progressing.
27
cebglobal.com © 2016 CEB.
All rights
reserved. CLC5952516S
YN

28 28
Reality: Employee Perceptions of Pay Differentiation
Decrease Without Ratings Perceptions of Pay Differentiation Decrease Without
Ratings
Average Perceptions of Pay Differentiationa
“When we removed ratings,
employees seemed to
stop believing we were
differentiating pay at all. The
rating seemed to symbolize to
employees that ‘pay for
performance’ was occurring in
practice.”
VP of TR
Health Care Industry
n = 9,686.
Source: CEB 2016 Pay for Performance Employee Survey. a Perceptions of pay differentiation represents a drop in the number of employees who believe their organization differentiates pay.
Note: The reduction in pay perceptions is statistically significant p < 0.001.
Advice for Organizations
Without Ratings
■ Guide managers to make pay
decisions by using simple
criteria such as performance
against role, goal achievement,
and role criticality to identify
employees who should
receive the highest awards.
■ Connect a summary of the
employee’s contributions to
their pay decision, and provide
organizational context to show
employees how pay decisions
were made fairly.
8%
Expectation 4: Increased Accuracy of Pay
Decisions
Ratings
28 ceb g lo b a l . c o m © 2016 CEB. All rights reserved. CLC5952516SYN
No Ratings
The Bottom Line
While many organizations report that pay differentiation
increased when they removed ratings, employees believe there is
less differentiation because managers struggle to explain how pay
decisions are made and linked to individual contributions.

29 29
Greater Negative Impact for High Performers
Without Ratings The Negative Impact of a Lack of Ratings Is
More Pronounced for High Performersa
n = 9,686; 10,531.
Source: CEB 2016 Pay for Performance Employee Survey; CEB 2014 Enterprise Contribution Workforce Survey.
a High-performing employees were in the top quartile on an index that measured performance against individual tasks and collective contributions.
“High performers are the ones who like ratings the most. The rating is a form of recognit ion for the
work they are doing , and we are afraid that whatever we replace that label with won’t have the same
effect.”
Senior HR Director
Pharmaceuticals
Industry
1 Manager Time Spend: High performers
are less satisfied with manager time spent
on performance management.
2 Manager Conversation Quality: High
performers are less satisfied with
manager conversations.
3 Reward Differentiation: High performers
are less likely to feel that they are rewarded
appropriately for their contributions.
n = 5,004.
Source: CEB 2016 Pay for Performance Employee Survey. b This calculation was completed using the Quality of Manager Conversation Score, which represents how effective managers are at helping employees understand their performance in the past and how they can improve performance and development in the future.
12%
Impact of Lack of Ratings on Employee
Satisfaction with Manager Conversations
by Performance Level
Average Quality of Manager
Conversation Scoreb
With Ratings Without Ratings
28%
High Low
Employee Per formance
29
cebglobal.com © 2016 CEB.
All rights
reserved. CLC5952516S
YN

30 30
Conclusion:
Many organizations have received
positive feedback after eliminating
performance ratings. However,
the initial positive reaction tends
to fade and the key performance
outcomes that organizations
expected to increase actually suffer.
Although a handful of managers are
more effective without ratings, most
organizations will find it too difficult
to get their managers to the level
needed to make the change worth
the significant investment.
Rather than focusing on the
ratings debate, organizations
should improve their performance
management and reward
practices.
Business Case Fails to
Hold for Most
Success Without
Ratings Requires
Significant Investment
Focus on Other Changes
Besides Removing Ratings
30
ceb g lo b a l . c o m © 2016 CEB. All rights reserved. CLC5952516SYN

31 31
Alternatives…
“Democracy is the worst form of government,”
Winston Churchill reminded us in 1947, “except
for all those other forms that have been tried from
time to time.”
The same is true for performance evaluations:
They’re far from perfect, but they’re also far better
than the alternatives.
32 32
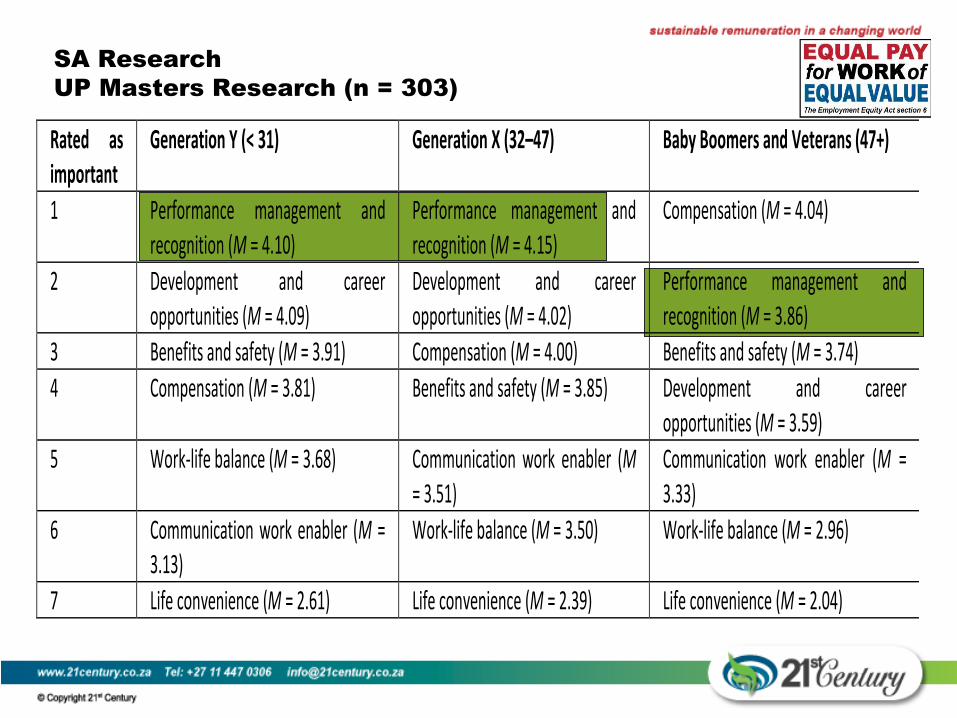
Rated as important
Generation Y (< 31) Generation X (32–47) Baby Boomers and Veterans (47+)
1 Performance management and recognition (M = 4.10)
Performance management and recognition (M = 4.15)
Compensation (M = 4.04)
2 Development and career opportunities (M = 4.09)
Development and career opportunities (M = 4.02)
Performance management and recognition (M = 3.86)
3 Benefits and safety (M = 3.91) Compensation (M = 4.00) Benefits and safety (M = 3.74)
4 Compensation (M = 3.81) Benefits and safety (M = 3.85) Development and career opportunities (M = 3.59)
5 Work-life balance (M = 3.68) Communication work enabler (M = 3.51)
Communication work enabler (M = 3.33)
6 Communication work enabler (M = 3.13)
Work-life balance (M = 3.50) Work-life balance (M = 2.96)
7 Life convenience (M = 2.61) Life convenience (M = 2.39) Life convenience (M = 2.04)
SA Research
UP Masters Research (n = 303)

33 33
Different Types of Performance
Management Systems
Performance Management
Systems
Traditional
360°
Outcomes Based
Balanced Scorecard

34 34
Traditional
Several factors standard for everyone which are
rated on a rating scale e.g. 1 to 10
Volume of work
Quality and accountability
Relationship with other staff members
Relationship with company
Knowledge and skills
Reliability and punctuality
Attitude to the job
Achieving the objectives

35 35
360° Feedback
1. What is your relationship to the individual you are rating?
Self…………………... “I am evaluating myself”
Manager……………. “I am evaluating the employee as his/her manager”
Colleague………….. “I am evaluating a colleague within my department”
Direct Report….. …..“I am evaluating my manager”
Internal customer… “I am evaluating a colleague/team member outside
my department”
Other…………………“I am evaluating a person who does not fit in the
above group e.g. external customer”

36 36
Balanced Scorecard - Examples
Financial Customer
Operating Income Growth
Same Store Sales Growth
Inventory Turns
Expense / Sales Growth Ratio
Net Profit
Shareholder returns
Frequency of Purchase
Units Per Transaction
Transaction Size
Customer Feedback
Length of time
Internal Processes Learning & Growth
Category market Share
Category Margin
Sales
Quality / Returns
Out of Stock
Management processes and procedures
IT processes
Employee climate Survey
Turnover
Strategic Skill Coverage
Systems vs. Plan
New products and services
Innovation

37 37
Balanced Scorecard - Learning And Growth Perspective
Objectives Measures Targets Responsibility
Create new climate, new ethos and changed attitudes –
based on the core values of integrity, exceptional service through attention to detail, innovative spirit, competitive and embracing a global mindset
Staff attitude survey
New initiatives from staff (# suggested and implemented)
Employee turnover
Understand and minimise reasons for loss of key staff
Organisational structures in place and management & staff appointed (complete by DATE)
Staff attitude survey - DATE
Budget responsibility – DATE
Progress on Black Employment Equity (BEE) initiative
Implement effective HR Performance Measurement system
Policies implemented & system operating
HR performance measurement system introduced by DATE
All staff appraised by DATES (Quarterly performance reviews with annual appraisal)
Establish separate defined HR function
New Dept operating Fully functional – DATE
HR policy audit and plan by DATE
HR policy published and available on Intranet by DATE

38 38
Output Based Role Of Goals
1. Individual performance goals link what individuals do every day
to the larger goals and values of the organisation
2. Goals help connect individuals, teams and the organisation with
their customers
3. Goals can be used as a communication tool
4. Goals can assist individuals in the self management process
5. Goals help create the future

39 39
If a teenager sees his job as “watering the garden” (an activity), he will probably
focus solely on the act of watering. On the other hand, if he is responsible for
producing “a healthy garden” (an output), he’ll be more alert for cues from the
garden about what it needs. He will do what’s necessary for the garden’s health,
whether it be weeding, fertilising, watering, irrigating, or eliminating insects.
If a manager sees her job as “training people” (an activity), she may be satisfied to
send them to classes. If, on the other hand, her responsibility is to produce
“managerial candidates” (an output), she’ll be concerned that her people actually
acquire the knowledge and skills that will make them good candidates. This approach
may require developing new training materials, providing developmental
opportunities on the job, finding self-study materials, sending people to classes,
testing competencies, coaching or any number of methods that may produce the final
output: managerial candidates.
Output Based
Outputs Not Activities…

40 40
OUTPUTS Quality Measures or Weighting Customer
Requirements Indicators
Outputs for the Year
Performance Plan

41 41
Recommendations
1. Keep things simple and not bureaucratic
2. Involve staff especially line managers whose “buy-in” is critical
3. Gain support from those at top of the organisation
4. Communicate and consult with staff thoroughly and manage expectations
5. Train those involved in decision making and those conduct the appraisal
6. Align performance management with other aspects of HR as well as
business strategy
7. Regularly monitor, evaluate make changes as necessary
8. Ensure that you comply with section 6 of the Employment Equity Act

42 42
Standard / Typical
4-6 ratings
Meeting or exceeding an expectation
Rating Scales
Rating
5 Outstanding
4 Exceeds Expectations
3 Meets Expectations
2 Needs Improvement
1 Unacceptable

43 43
Goal Status Scale
Rating Scales cont.
Rating
Goal Achieved (3): All milestones and success measures have
been achieved
Active Goal (1): The goal is still in progress, some milestones
may have been achieved
Goal Not Met (0): Timeframe for Goal has been met; however,
some or all milestones and success
measures have not been met
Goal Deferred (-): For timing or business reasons, this goal has
been deferred

44 44
Development Item Status Scale
May appeal to managers as it is a “score”
Employees may find it more robust?
Allows for more differentiation between employees
Could look at this and then work out an average
Link an average back to a rating of 1-5
Rating Scales cont.
Rating
100% Complete
75% to 99% Complete
50% to 74% Complete
Less than 50% Completed
Not Started

45 45
Observation Frequency
For soft skills
Rating Scales cont.
Rating
Consistently
Observed
This competency/skill is observed on a
constant basis; everyone in contact with this
person would observe excellence in this area
Observed This competency/skill is observed, please
continue to focus on it so that it is observed constantly without exception
Observed
Sometimes
The competency/skill is observed on an
infrequent basis, there is a clear development
opportunity here
Seldom Observed Needs Immediate Improvement

46 46
We translate our ratings directly into compensation. Notably,
this process involves a formula, so managers have no
discretion in compensation decisions. It’s fair: If you excel,
your bonus multiplier rises according to a predetermined
equation, not someone’s opinion.
This focuses managers on what they can accurately assess
and allows the company to manage pay using compensation
expertise. It’s also a huge time-saver. When other companies
eliminate performance evaluations, they still spend many
hours agonizing over compensation decisions. For us, time
invested in performance reviews is time saved on
compensation.

47 47
Conditions Necessary To Link Pay To
Performance
Performance dimensions must be readily measured
All critical performance dimensions must be captured by the
system and standards set for each
Performance must be important to the employee and
employer/manager
Performance must be under employee’s direct control
Monetary incentives must be compatible with other outcomes
important to the employee
Monetary level and merit differences must be meaningful to
employee
System must be affordable
Relationship between manager and employee must be one of
mutual respect, trust, openness, effective communication

48 48
Path to Follow
Plan
Corrective Actions and Timing
Audit
Pay differences Conditions of Employment Skills
Justifiable Differences
Remuneration Policy Performance Management
Foundation
Job Evaluation Terms and Conditions of
Employment HR Procedures

49 49
What is the Status Quo
50 50
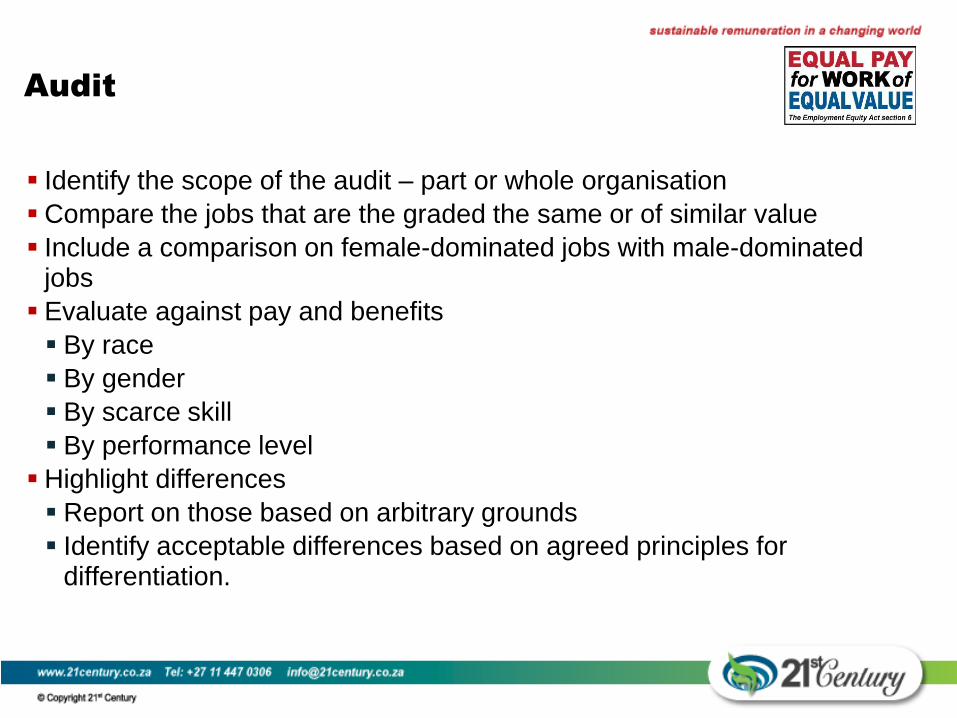
Audit
Identify the scope of the audit – part or whole organisation
Compare the jobs that are the graded the same or of similar value
Include a comparison on female-dominated jobs with male-dominated jobs
Evaluate against pay and benefits
By race
By gender
By scarce skill
By performance level
Highlight differences
Report on those based on arbitrary grounds
Identify acceptable differences based on agreed principles for differentiation.

51 51
Path to Follow
Plan
Corrective Actions and Timing
Audit
Pay differences Conditions of Employment Skills
Justifiable Differences
Remuneration Policy Performance Management
Foundation
Job Evaluation Terms and Conditions of
Employment HR Procedures

52 52
The Legislation
“Where employers find that there is differentiation between
employees and that such differentiation cannot be justified in terms of
the reasons provided in Regulation 7,
the employer should determine how to address the inequalities
without reducing the remuneration of the other employees
to bring about equal pay; and
review and monitor the above process annually”
The Plan

53 53
The Plan
Factors to consider
Highlight differences by job / by grade / by level / by function
Quantify the differences
Look for “quick fixes”
Small pay increases
Higher paid employees on the incorrect grades
Implement changes
Formulate a plan for correction
Higher than average increases over a period of time
Interim increases
Review annually
Institute monitoring measures for:
New appointments
Promotions
54 54
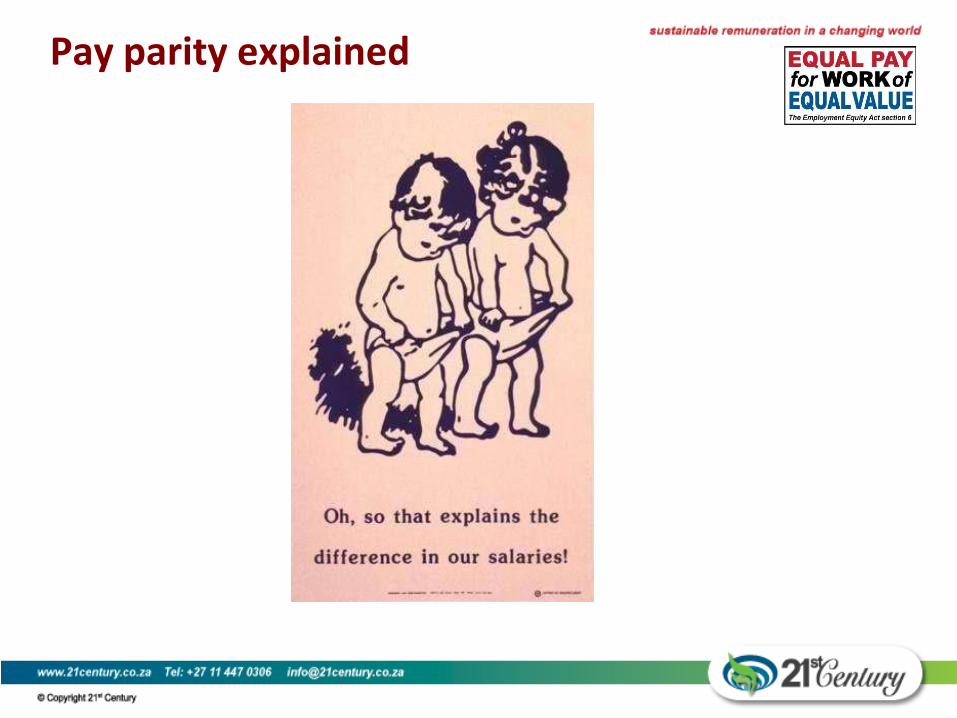
Pay parity explained

55 55

56 56
Thank you
Ngiyabonga
Dankie
Ngiyathokoza
Ke a leboga
Siyabonga
Inkomu
Ndo livhuwa
Enkosi