Embed Size (px)
Citation preview
Report No. 462(55/10/4)
Employment and Unemployment situation in cities and towns in India
1999-2000
NSS 55th ROUND (July 1999 – June 2000)
National Sample Survey Organisation Ministry of Statistics & Programme Implementation
Government of India
August 2001

NSS Report No. 462: Employment and Unemployment situation in cities and towns in India, 1999-2000
Preface The National Sample Survey Organisation (NSSO) has been carrying out all-India household surveys on employment and unemployment with a large sample usually once in five years. The sixth such survey was conducted in the 55th round (July 1999 – June 2000). The previous five quinquennial surveys were conducted during the 27th (October 1972 - September 1973), the 32nd (July 1977 - June 1978), the 38th (January- December 1983), the 43rd (July 1987 - June 1988) and the 50 th (July 1993-June 1994) rounds.
The report contains the results based on four selected tables of the tabulation plan of the NSS 55th round (July,1999 – June,2000) generated separately for cities with a population of one million and above and for two other size classes of towns viz. those with population between fifty thousand and one million and those with population less than fifty thousand. It contains five Chapters and an Appendix. Chapter 1 is introductory and Chapter 2 deals with the concepts and definitions of important terms used in the survey and which are relevant to this report. Chapter 3 describes the sample design and estimation procedure followed in the survey. Chapters 4 and 5 deal respectively with the summary findings of the survey relating to the employed and unemployed in cities and towns. The schedule of enquiry for the survey is broadly similar to that adopted in previous quinquennial rounds. The Field Operations Division (FOD) of the Organisation conducted the fieldwork for the survey. The collected data were processed and tabulated by the Data Processing Division (DPD) of the NSSO. The Survey Design & Research Division (SDRD) of the NSSO developed the survey design and prepared the report. I am grateful to the Chairman and members of the Governing Council and Heads of various Divisions of the NSSO and their colleagues for the contribution made in preparing the report. Comments/suggestions from the readers will be most welcome. New Delhi N.S. Sastry August, 2001 Director General & Chief Executive Officer
National Sample Survey Organisation

NSS Report No.462: Employment and Unemployment situation in cities and towns of India, 1999-2000
Contents
Page No.
Highlights i Chapter 1 Introduction 1 Chapter 2 Concepts and Definition 4 Chapter 3 Sample Design and Estimation Procedure 11
Chapter 4 Employment 19 Chapter 5 Unemployment 27 Appendix Detailed Tables A-1 Appendix List of detailed Tables
table title page no. no.
103 Per thousand distribution of usually 'working' (principal and subsidiary status taken together) persons of age-group 15 years & above by the broad industry division for each size class of town.
A–1
104 Per thousand distribution of persons of age 15 years and above by
broad usual activity status taking also into consideration the subsidiary economic status of persons categorised 'not working' in the principal status for each size class of town
A–7
105 Per thousand distribution of person-days of persons of age 15
years and above by broad current daily activity status for each size class of town
A–31
106 Per thousand distribution of persons of age 15 years and above by
broad current weekly activity status for each size class of town A–55

NSS Report No.462: Employment and Unemployment situation in cities and towns of India, 1999-2000 i
Highlights
This report is based on the sixth quinquennial survey on employment and unemployment conducted during the period July, 1999 to June, 2000. The report is based on the urban sample which covered 67,258 households and enumerated 3,09,234 sample persons, spread over 4125 urban blocks. The data have been tabulated for 25 cities with a population of one million and more and for two size-classes of other towns. Three basic approaches viz., usual status, current weekly status and current daily status, have been used for the measurement of employment and unemployment.Some of the key findings are given below. • The proportion of usually employed adult (age 15 years and above) males in class-I cities (with a population
of one million or more) and in towns with a population less than 50,000 were quite close: 75 and 77 per cent respectively. For adult females, the percentages were appreciably different: 18% for class 1 cities and 24% for towns with a population of less than 50,000.
• Between 1993-94 and 1999-2000 the estimated proportions of usually employed adult males and females
fell slightly in towns with a population of less than 50,000. • Among males, the proportion of usually employed in class I cities was two percentage points lower in 1999-
2000 than that in 1993-94. Among females, the proportion remained stable over the period. • The proportion of regular wage and salaried workers was the highest in many cities with a million or more
persons. • Between 1993-94 and 1999-2000, in class-I cities as a whole the unemployment rates in terms of usual
status remained stable among males but had declined for females.

NSS Report No.462: Employment and Unemployment situation in cities and towns of India, 1999-2000 1
Chapter 1
Introduction 1. The report in perspective 1.1 An all-India survey on the situation of employment and unemployment in India during the period July,1999-June,2000 was carried out as part of the 55th round of the National Sample Survey Organisation (NSSO). In this survey, a nation-wide enquiry was conducted to provide estimates on various characteristics pertaining to employment and unemployment in India and some characteristics associated with them at the national and state levels. In this survey, information on various facets of employment and unemployment in India were collected through a schedule of enquiry (schedule 10). A sub-set of sample households within the survey period were revisited after a gap of three months and an abridged form of schedule 10, viz. schedule 10.1, comprising the main items of enquiry of schedule 10 was canvassed for these households. Based on the data collected during the entire period, estimates pertaining to employment-unemployment in cities and towns of India along with certain features associated with them have been presented in this report. Tables have been generated for each of the twenty-five class I cities (stated in detail later in chapter 4) whose population figures were one million or above. These togethe r constituted size class I. There were two other size classes of towns viz. those with population of (a) 50,000 to one million (size class 2) and (b) less than 50,000 (size class 3). 2. Background 2.1 One of the important surveys conducted by the NSSO is the quinquennial survey on employment-unemployment. The first such survey was done during September 1972-October 1973 corresponding to the 27th round of NSSO. The present survey is the sixth in the series. 2.2 To assess the volume and structure of employment and unemployment, starting with the 9th round (May-September,1955), NSSO conducted a number of surveys on employment and unemployment. To give a firm conceptual framework for conducting such surveys, the Planning Commission, in the year 1970, set up an “Expert Committee on unemployment estimates”, (popularly known as the Dantwala Committee), which reviewed these surveys and the indicators generated from such surveys. Based on concepts and definitions recommended by this committee, the first quinquennial survey on employment and unemployment was conducted in the 27th round of NSS. Since then, four quinquennial comprehensive surveys on employment and unemployment situation in India have been carried out by the NSSO, in which concepts and procedures were based primarily on the recommendations of the Dantwala Committee. These four surveys were conducted during the 32nd round (July,1977-June,1978), 38th round (January,1983-December,1983), 43rd round (July,1987-June,1988) and 50th round (July,1993-June,1994), respectively. 3. Scope 3.1 Items of enquiry: As in the past, in the present survey too, NSSO collected data on some characteristics, based on which, estimates of employment and unemployment, measured in terms of 3 basic approaches viz. usual status, current weekly status and current daily status can be obtained. The reference period for these approaches differ - it being 365 days preceding the date of survey for

NSS Report No.462: Employment and Unemployment situation in cities and towns of India, 1999-2000 2
"usual status”, 7 days preceding the date of survey for “current weekly status” and each day of the 7 days preceding the date of survey for “current daily status”. 3.2 It is proposed to bring out several reports on the detailed information on various items of inquiry separately, at a later date. The first report viz. Report No.455 presented the key results on employment and unemployment in India 1999-2000. The second report, Report No. 458 dealt in some details with the employment-unemployment estimates measured in terms of the three basic approaches of usual status, current weekly status and current daily status and their patterns along with their correlates. It also covered some aspects of underemployment. The report also gave the results generated at all-India level and some important results for different states/union territories. The third report, viz. Report No.460, dealt with non-agricultural workers by various attributes such as their activity status, broad industry of work, enterprise type, location of workplace etc. with special emphasis on workers in the informal sector, i.e. those working in proprietary or partnership type of enterprises. The present report, fourth in the series, discusses some features of employment and unemployment in cities and towns of India. 3.3 Geographical Coverage: The survey covered the whole of the Indian Union excepting (i) Ladakh & Kargil districts of Jammu and Kashmir, (ii) 768 interior villages of Nagaland situated beyond 5 kms. of the bus route and (iii) 172 villages of Andaman & Nicobar Islands which remain inaccessible throughout the year. A few other areas of Jammu & Kashmir were also excluded from the survey coverage owing to unfavourable field conditions. 4. The survey in brief 4.1. Method of data collection: The survey used the interview method of data collection from a sample of randomly selected households. The sample design on the basis of which such selection was made is stated in brief in the following sub-section. 4.2 Period of survey and work programme: The fieldwork of 55th round of NSSO started from 1st July, 1999 and continued till 30th June, 2000. As usual, the survey period of this round was divided into four sub-rounds, each with a duration of three months, the 1st sub-round period ranging from July to September,1999, the 2nd sub-round period from October to December 1999 and so on. Equal number of sample FSU’s was allotted for survey in each of these four sub-rounds. 5. Sample design 5.1 An outline of the sampling design: The sampling design adopted for the survey was essentially a stratified multi-stage one for both rural and urban areas. The first stage units (FSUs) were villages (panchayat wards for Kerala) for rural areas and NSS Urban Frame Survey (UFS) blocks for urban areas. The ultimate stage units (USUs) were households. The procedure for selection of fsus /usus are given in detail in chapter 3 of this report. Large FSUs were subdivided into hamlet–groups (rural)/sub-blocks (urban). Details of the formation of hamlet–group/sub-blocks and procedure of selection of households are also given in chapter 3. 5.2 Sampling Frame for FSUs: The list of villages (panchayat wards for Kerala) as per 1991 Census and latest lists of UFS blocks of NSSO were respectively used for selection of rural and urban sample FSUs. For selection of sample villages from the State of Jammu & Kashmir, the list of villages as per 1981 Census was used as the sampling frame. Moreover, all the uninhabited villages of the country as per 1991 Census, interior villages of Nagaland situated beyond 5 kms. of a bus

NSS Report No.462: Employment and Unemployment situation in cities and towns of India, 1999-2000 3
route and inaccessible villages of Andaman & Nicobar Islands were left out of the survey coverage of the NSS 55th round. 5.3 Sample Size – first stage units: A total number of 10,384 FSUs (6,208 villages and 4,176 urban blocks) was selected for survey in the central sample at the all- India level in the 55th round for canvassing schedule 10. Sample size for the whole round for each State/UT x Sector (i.e. rural/urban) was allocated equally among the 4 sub-rounds. Sample FSUs for each sub-round were selected afresh in the form of 2 independent sub-samples. Thus, there were 8 such sub-samples. In addition, 3894 FSUs – 1298 in each of the sub-rounds 2, 3 and 4, corresponding to sub-samples 1, 3 and 5 - were re-visited for canvassing schedule 10.1. 5.4. Sample size – second stage units: For schedule 10, in each of the eight sub-samples, from each selected village in rural areas and from each selected urban block in urban areas, a sample of 12 households were surveyed. Apart from this, in the 3 re-visited sub-samples, viz. sub-samples 1, 3 and 5, the abridged schedule 10, viz. schedule 10.1, was canvassed during the re-visit to the same set of households. In addition, in these re-visited sub-samples, from among the newly formed households found during the re-visit of a FSU, at most 1 household was surveyed from each of the two segments and only schedule 10 was canvassed in those households. In the central sample, the actual number of persons surveyed was 5,09,779 in the rural sector and 3,09,234 in the urban sector. 6. Contents of the Report 6.1 As stated earlier, this report deals with various estimates with regard to employment and unemployment in cities and towns as obtained from tables generated on data collected on relevant items for the entire round. Consequently, all discussions in this report are limited to only such items/concepts, based on which estimates have been generated. A detailed explanation of these are given in the next chapter entitled ‘Concepts and Definitions’. 6.2 This report contains five chapters, including the present introductory chapter, and appendix tables. Chapter 2 states in detail the concepts and definitions of only those terms used in the survey in connection with the various items covered in this report. Chapter 3 gives a fairly detailed description of the sample design and estimation procedure used for the survey. Chapters 4 and 5 discuss the estimates for employeds and unemployeds respectively in cities and towns. The detailed tables based on which this report is brought out are presented in the Append ix. 6.3 Tables in Appendix : Appendix of the report contains four tables. Of these, one provides distribution of usual status workers by their industry of work. The other three tables present distributions of persons/person-days of persons aged 15 years and above by their employment status according to usual, weekly and daily status approaches. 6.4 All the estimates presented in this report are based on Central sample data only. Further, the cell- level figures in any of the detailed tables, when added up, may not exactly equal the figure shown against the “total” column (or line) due to (i) rounding off and/or (ii) presence of non-response cases. It may be noted that the estimates of aggregates given in the detailed tables help only to combine ratios. To arrive at the absolute number in any category, the survey estimates of ratios are to be applied to the projected populations as on 01.01.2000, the mid-point of the 55th round survey period (July 1999 to June 2000).
NSS Report No.462: Employment and Unemployment situation in cities and towns of India, 1999-2000 4
Chapter 2
Concepts and Definitions 2.0 The concepts and definitions of some important terms used in the survey and which are relevant to this report viz., those used to generate the tables and various estimates on employment-unemployment are explained in the following paragraphs. 2.1 Household: A group of persons who normally lived together and took food from a common kitchen constituted a household. The adverb “normally” means that temporary visitors were excluded but temporary stay-aways were included. Thus a child residing in a hostel for studies was excluded from the household of his/her parents, but a resident employee or a resident domestic servant or paying guest (but not just a tenant in the house) was included in the employer’s/host’s household. “Living together” was given more importance than “sharing food from a common kitchen” in drawing the boundaries of a household in case the two criteria were in conflict. However, in the special case of a person taking food with his family but sleeping elsewhere (say, in a shop or a different house) due to space shortage, the household formed by such a person’s family members was taken to include the person also. Each inmate of a hotel, mess, boarding- lodging house, hostel, etc., was considered to be a single-member household except that a family living in a hotel (say) was considered one household only. The same principle was applicable for the residential staff of such establishments. 2.2 Economic activity: Any activity resulting in production of goods and services that add value to national product was considered as an economic activity. Such activities included produc tion of all goods and services for market (market activities), i.e. production for pay or profit, and, the production of primary commodities for own consumption and own account production of fixed assets, among the non-market activities. 2.2.1The entire spectrum of human activity falls into two categories–economic and non-economic activities. The economic activities have two parts - market activities and non-market activities. Market activities are those that involve remuneration to those who perform it i.e., activity performed for pay or profit. These are essentially production of goods and services for the market including those of government services, etc. Non-market activities are the production for own consumption of primary products including own account processing of primary products and own account production of fixed assets. 2.2.2 The full spectrum of economic activities as defined in the UN system of National Accounts (1968) was not covered in the definition adopted for the NSS 55th round survey of Employment and Unemployment. The former included activities like own account processing of primary products among other things. In the NSS surveys, activities relating to the production of primary goods for own consumption, was restricted to the agriculture sector only and did not include the activities in mining and quarrying sector. The coverage of economic activities was, however, the same as in the 50th round. The term ' economic activity', therefore, included:

NSS Report No.462: Employment and Unemployment situation in cities and towns of India, 1999-2000 5
(i) all the market activities performed for pay or profit which result in production of goods
and services for exchange. (ii) of the non-market activities,
(a) all the activities relating to the agricultural sector (industry Divisions 01 to 05 of NIC 1998) which result in production (including gathering of uncultivated crops, forestry, collection of firewood, hunting, fishing etc.) of agricultural produce for own consumption
and
(b) the activities relating to the own-account production of fixed assets. Own account production of fixed assets include construction of own houses, roads, wells etc., and of machinery, tools etc., for household enterprise and also construction of any private or community facilities free of charge. A person may be engaged in own account construction either in the capacity of a labourer or a supervisor.
As per the practice followed in earlier rounds, certain activities like prostitution, begging, smuggling etc., which though fetched earnings, were not considered as economic activities. 2.3 Activity status: It is the activity situation in which a person was found during a reference period with regard to the person's participat ion in economic and non-economic activities. According to this, a person could be in one or a combination of the following three broad activity statuses during a reference period:
(i) working or being engaged in economic activity (work) as defined above, (ii) being not engaged in economic activity (work) but either making tangible efforts to seek
'work' or being available for 'work' if the 'work' is available and (iii) being not engaged in any economic activity (work) and also not available for 'work'.
Broad activity statuses mentioned in (i) and (ii) above are associated with 'being in labour force' and the last with 'not being in the labour force'. Within the labour force, broad activity status (i) and (ii) were associated with 'employment' and ‘unemployment’, respectively. 2.3.1 Categories of activity status: Identification of each individual into a unique situation could pose a problem when more than one of the three broad activity statuses listed above were concurrently obtained for a person. In such an eventuality, the identification uniquely under any one of the three broad activity statuses was done by adopting either the major time or priority criterion. The former was used for classification of persons according to the 'usual activity status' approach and the latter for classification of persons according to the ‘current activity status’ approach. Each of the three broad activity statuses was further sub-divided into several detailed activity categories. If a person categorised as engaged in economic activity by adopting one of the two criteria mentioned above was found to be pursuing more than one economic activity during the reference period, the appropriate detailed activity status code related to that activity in which relatively more time had been spent. A similar procedure was adopted for assigning
NSS Report No.462: Employment and Unemployment situation in cities and towns of India, 1999-2000 6
detailed activity code for persons categorised as engaged in non-economic activity and pursuing more than one non-economic activity. The detailed activity categories under each of the three broad activity statuses used in the survey (along with the codes assigned to them as indicated in brackets) are stated below: (i) situation of working or being engaged in economic activities (employed):
(a) worked in household enterprise (self-employed) as own account worker (11); (b) worked in household enterprise (self-employed) as employer (12); (c) worked as helper in household enterprises (unpaid family worker) (21); (d) worked as regular salaried/wage employee (31); (e) worked as casual wage labour (i) in public works (41), (ii) in other types of work (51); (f) had work in household enterprise but did not work due to: (i) sickness (61), (ii) other
reasons (62); and (g) had regular salaried/wage employment but did not work due to: (i) sickness (71), (ii)
other reasons (72); (ii) situation of being not engaged in work but seeking or available for work (unemployed):
(a) sought work (81) and (b) did not seek but was available for work (82)
(iii) situation of being not available for work (not in labour force):
(a) attended educational institutions (91); (b) attended domestic duties only (92); (c) attended domestic duties and was also engaged in free collection of goods (vegetables,
roots, firewood, cattle- feed, etc.) sewing, tailoring, weaving, etc. for household use (93); (d) rentiers, pensioners, remittance recipients, etc. (94); (e) not able to work due to disability (95); (f) beggars, prostitutes (96); (g) others (97) and (h) did not work due to sickness (for casual workers only) (98).
2.4 Workers (or employed) : Persons who were engaged in any economic activity or who, despite their attachment to economic activity, abstained from work for reason of illness, injury or other physical disability, bad weather, festivals, social or religious functions or other contingencies necessitating temporary absence from work, constituted workers. Unpaid helpers who assisted in the operation of an economic activity in the household farm or non-farm activities were also considered as workers. All the workers were assigned one of the detailed activity statuses under the broad activity category 'working’ or ‘being engaged in economic activity' (or employed). 2.5 Seeking or available for work (or unemployed) : Persons, who owing to lack of work, had not worked but either sought work through employment excha nges, intermediaries, friends or relatives or by making applications to prospective employers or expressed their willingness or availability for work under the prevailing conditions of work and remuneration, were considered as those who were ‘seeking or available for work’ (or unemployed).

NSS Report No.462: Employment and Unemployment situation in cities and towns of India, 1999-2000 7
2.6 Labour force: Persons, who, were either 'working' (or employed) or 'seeking or available for work' (or unemployed) constituted the labour force. Persons who were neither 'working' nor 'seeking or available for work' for various reasons during the reference period were considered as 'out of labour force'. The persons under this latter category are students, those engaged in domestic duties, rentiers, pensioners, recipients of remittances, those living on alms, infirm or disabled persons, too young or too old persons, prostitutes, smugglers, etc. and casual labourers not working due to sickness. 2.7 Self-employed : Persons who operated their own farm or non- farm enterprises or were engaged independently in a profession or trade on own-account or with one or a few partners were deemed to be self-employed in household enterprises. The essential feature of the self-employed is that they have autonomy (i.e., how, where and when to produce) and economic independence (i.e., ma rket, scale of operation and money) for carrying out their operation. The fee or remuneration received by them comprised two parts - share of their labour and profit of the enterprise. In other words, their remuneration was determined wholly or mainly by sales or profits of the goods or services which were produced. 2.7.1 Categories of self-employed persons: Self-employed persons were categorised as follows: (i) own-account workers: those self-employed persons who operated their enterprises on
their own account or with one or a few partners and who, during the reference period, by and large, ran their enterprise without hiring any labour. They could, however, have had unpaid helpers to assist them in the activity of the enterprise;
(ii) employers: those self-employed persons who worked on their own account or with one
or a few partners and, who, by and large, ran their enterprise by hiring labour; and (iii) helpers in household enterprise: those self-employed persons (mostly family members)
who were engaged in their household enterprises, working full or part time and did not receive any regular salary or wages in return for the work performed. They did not run the household enterprise on their own but assisted the related person living in the same household in running the household enterprise.
2.8 Regular salaried/wage employee: These were persons who worked in others’ farm or non-farm enterprises (both household and non-household) and, in return, received salary or wages on a regular basis (i.e. not on the basis of daily or periodic renewal of work contract). This category included not only persons getting time wage but also persons receiving piece wage or salary and paid apprentices, both full time and part-time. 2.9 Casual wage labour: A person who was casually engaged in others’ farm or non-farm enterprises (both household and non-household) and, in return, received wages according to the terms of the daily or periodic work contract, was a casual wage labour.
2.10 Different approaches followed to determine activity status: The persons surveyed were classified into various activity categories on the basis of the activities pursued by them during

NSS Report No.462: Employment and Unemployment situation in cities and towns of India, 1999-2000 8
certain specified reference periods. There were three reference periods for this survey. These are: (i) one year (ii) one week and (iii) each day of the reference week. Based on these three periods, three different measures of activity status are arrived at. These are termed respectively as usual status, current weekly status and the current daily status. The procedure adopted to arrive at these three measures is given below.
2.10.1 Usual activity status: The usual activity status relates to the activity status of a person during the reference period of 365 days preceding the date of survey. The activity status on which a person spent relatively longer time (i.e. major time criterion) during the 365 days preceding the date of survey is considered as the principal usual activity status of the person. To decide the principal usua l activity of a person, he/she was first categorised as belonging to the labour force or not during the reference period on the basis of major time criterion. Persons thus adjudged as not belonging to the labour force were assigned the broad activity status 'neither working nor available for work'. For persons belonging to the labour force, the broad activity status of either 'working' or ‘not working but seeking and/or available for work’ was ascertained based on the same criterion viz. relatively longer time spent in accordance with either of the two broad statuses within the labour force during the 365 days preceding the date of survey. Within the broad activity status so determined, the detailed activity status of a person pursuing more than one such activity was determined once again on the basis of the relatively longer time spent on such activities. In terms of activity codes (stated earlier in para 1.3.1), codes 11-51 were applicable for persons classified as workers, while code 81 was assigned to people either seeking or available for work (unemployed persons) and codes 91-97 for those who were out of labour force. 2.10.2 Subsidiary economic activity status: A person whose principal usual status was determined on the basis of the major time criterion could have pursued some economic activity for a relatively shorter time (minor time) during the reference period of 365 days preceding the date of survey. The status in which such economic activity was pursued was the subsidiary economic activity status of that person. Thus, activity status codes 11-51 only were applicable for persons reporting some subsidiary economic activity. It may be noted that engagement in work in subsidiary capacity could arise out of the following two situations, viz.
(i) a person could be engaged for a relatively longer period during the last 365 days in one economic/non-economic activity and for a relatively shorter period in another economic activity, and
(ii) a person could be pursuing one economic activity/ non-economic activity almost
throughout the year in the principal usual activity status and simultaneously pursue another economic activity for a relatively shorter period in a subsidiary capacity.
2.10.3 Number of subsidiary economic activities pursued during last 365 days: For persons reporting some subsidiary activity, the number of subsidiary activities pursued by him/her during last 365 days was ascertained and recorded. However, details of a maximum of two such subsidiary economic activities were recorded. The activities having different work status was considered as different activities. Activities within the same work status but with different industry and/or occupation were also considered as different activities. If the person was

NSS Report No.462: Employment and Unemployment situation in cities and towns of India, 1999-2000 9
engaged in two or more subsidiary economic activities, the details of the subsidiary economic activity pursued for the maximum time period among all the subsidiary economic activities, or in other words, the major subsidiary economic activity was deemed as ‘subsidiary status number I’ and the next major one as ‘subsidiary status number II’ were recorded. 2.10.4 Current weekly activity status: The current weekly activity status of a person is the activity status obtaining for a person during a reference period of 7 days preceding the date of survey. It is decided on the basis of a certain priority cum major time criterion. 2.10.4.1 According to the priority criterion, the status of 'working' gets priority over the status of 'not working but seeking or available for work' which, in turn, gets priority over the status of 'neither working nor available for work'. A person was considered working (or employed) if he/she, while pursuing any economic activity, had worked for at least one hour on at least one day during the 7 days preceding the date of survey. A person was considered 'seeking or available for work (or unemployed)' if, during the reference week, no economic activity was pursued by the person but he/she made efforts to get work or had been available for work any time dur ing the reference week though not actively seeking work in the belief that no work was available. A person who had neither worked nor was available for work any time during the reference week was considered as engaged in non-economic activities (or not in labour force). 2.10.4.2 After deciding the broad current weekly activity status of a person on the basis of 'priority' criterion, the detailed current activity status was then decided on the basis of 'major time' criterion if that person pursued multiple economic activities. The current weekly activity status of a person could be any one of the detailed activity status (ref. para 1.3.1) and could have codes 11 to 98. Of these codes, 11 to 72 pertained to workers, 81 to 82 for unemployed and 91 to 98 for persons out of labour force. It may be noted that these are the same as the usual status codes (stated in para 1.10.1 before) except that codes 61, 62, 71, 72, 82 and 98 are not applicable for usual status and code 81 for usual status is used to indicate both the situations of seeking and being available for work. 2.10.5 Current daily activity status The activity pattern of the population, particularly in the unorganised sector, is such that during a week, and sometimes, even during a day, a person could pursue more than one activity. Moreover, many people could even undertake both economic and non-economic activities on the same day of a reference week. The current daily activity status for a person was determined on the basis of his/her activity status on each day of the reference week using a priority-cum-major time criterion (day to day labour time disposition). Time disposition was recorded for every member of a sample household. This involved recording of different activities pursued by the members along with the time intensity in quantitative terms for each day of the reference week. The different activities were identified and recorded in terms of 'activity status' and 'industry' codes for persons in urban areas and 'activity status', 'industry' and 'operation' codes for persons in rural areas. The terms ‘industry’ and ‘operation’ are explained later. The following points were considered for assigning the time intensity and determining the current daily status of a person:
i) Each day of the reference week was looked upon as comprising either two ‘half days’ or a ‘full’ day for assigning the activity status.

NSS Report No.462: Employment and Unemployment situation in cities and towns of India, 1999-2000 10
ii) A person was considered ‘working’ (employed) for the entire day if he/she had worked for 4 hours or more during the day.
iii) If a person was engaged in more than one of the economic activities for 4 hours or more on a day, he/she was assigned two out of the various economic activities on which he/she devoted relatively longer time on the reference day (for each of those two activities, the intensity was 0.5).
iv) If the person had worked for 1 hour or more but less than 4 hours he/she was considered ‘working’ (employed) for half-day and ‘seeking or available for work’ (unemployed) or ‘neither seeking nor available for work’ (not in labour force) for the other half of the day depending on whether he was seeking/available for work or not.
v) If a person was not engaged in any ‘work’ even for 1 hour on a day but was seeking/available for work even for 4 hours or more, he was considered ‘unemployed’ for the entire day. But if he was ‘seeking/available for work’ for more than 1 hour and less than 4 hours only, he was considered ‘unemployed’ for half day and ‘not in labour force’ for the other half of the day.
vi) A person who neither had any ‘work’ to do nor was available for ‘work’ even for half a day was considered ‘not in labour force’ for the entire day and was assigned one or two of the detailed non-economic activity statuses depending upon the activities pursued during the reference day.
The description (and codes used) of current daily activity statuses are the same as those of current weekly activity status. 2.11 Industry: The description of the industry was relevant to the type of economic activity pursued by the person. NIC-1998 was followed for classifying industries. In case two or more industries corresponding to the status code were reported by a person, the principal industry was taken as the one in which relatively more time was spent during the reference period by the person. It may be noted that under Division 95 of NIC 1998, on “Private households with employed persons”, six additional codes have been introduced for recording 5 digit entries for industry codes in the survey viz., housemaid /servant (95001), cook (95002), gardener (95003), gatekeeper/chowkidar/watchman (95004), governess/baby-sitter (95005) and for ‘others’ (95009).

NSS Report No.462: Employment and Unemployment situation in cities and towns of India, 1999-2000 11
Chapter 3
Sample Design and Estimation Procedure
3.1 Sample Design 3.1.1. A stratified multi-stage sampling design for rural as well as urban areas was adopted for selection of the sample units for the survey. The first stage units (FSU) were the census villages (panchayat wards for Kerala) for rural areas and the NSSO Urban Frame Survey (UFS) blocks for urban areas. The ultimate stage units (USU) were the households for both rural and urban areas. 3.1.2 Selection of the first-stage units: The various steps involved before making the selection of the FSUs are discussed at length in the following few paragraphs before taking up the issue of selection of USUs within a FSU. 3.1.2.1 Sampling frame for the first stage units (FSU’s): For rural areas, the list of census villages as per 1991 population census (list of census villages as per 1981 Census for the State of Jammu & Kashmir) constituted the sampling frame for selection of sample FSUs for most of the states. For the rural areas of Kerala, however, the list of panchayat wards was used as the sampling frame for selection of panchayat wards. For Nagaland, the list of villages located within 5 kms. of a bus route constituted the sampling frame, whereas, the list of accessible villages constituted the sampling frame for Andaman & Nicobar Islands. All the uninhabited villages of the country as per 1991 Census were left out of the survey coverage of the NSS 55th round. For the urban areas, the latest lists of UFS blocks constituted the sampling frame for selection of sample FSUs. 3.1.2.2 Stratification of the first stage units in rural areas: From the list of villages of each State/ Union Territory (U.T.), initially, two special strata were formed by considering villages (a) with very small population and (b) with very high population. These are formally stated below:
Stratum 1: all FSU’s with population between 1 to 100, Stratum 2: FSU’s with population more than 15,000.
The above two strata were spread across a given state and were not confined to any particular administrative division within the state. Each of the above two strata was formed if at least 50 such FSU’s were there in the respective frames. Otherwise, these type of villages were included in the general strata as described below:
After formation of strata 1 and 2 (wherever applicable), the remaining villages of the
State/ U.T. were considered for formation of general strata. While forming general strata, efforts were made to treat each district with population less than 2 millions as a separate stratum. If limitation of sample size did not allow forming so many strata, smaller districts within a particular NSS region were merged to form a stratum. Each district with rural population of 2 millions or more as per 1991 Census (1.8 millions or more as per 1981 Census in case of Jammu & Kashmir) was as usual split into a number of strata.
NSS Report No.462: Employment and Unemployment situation in cities and towns of India, 1999-2000 12
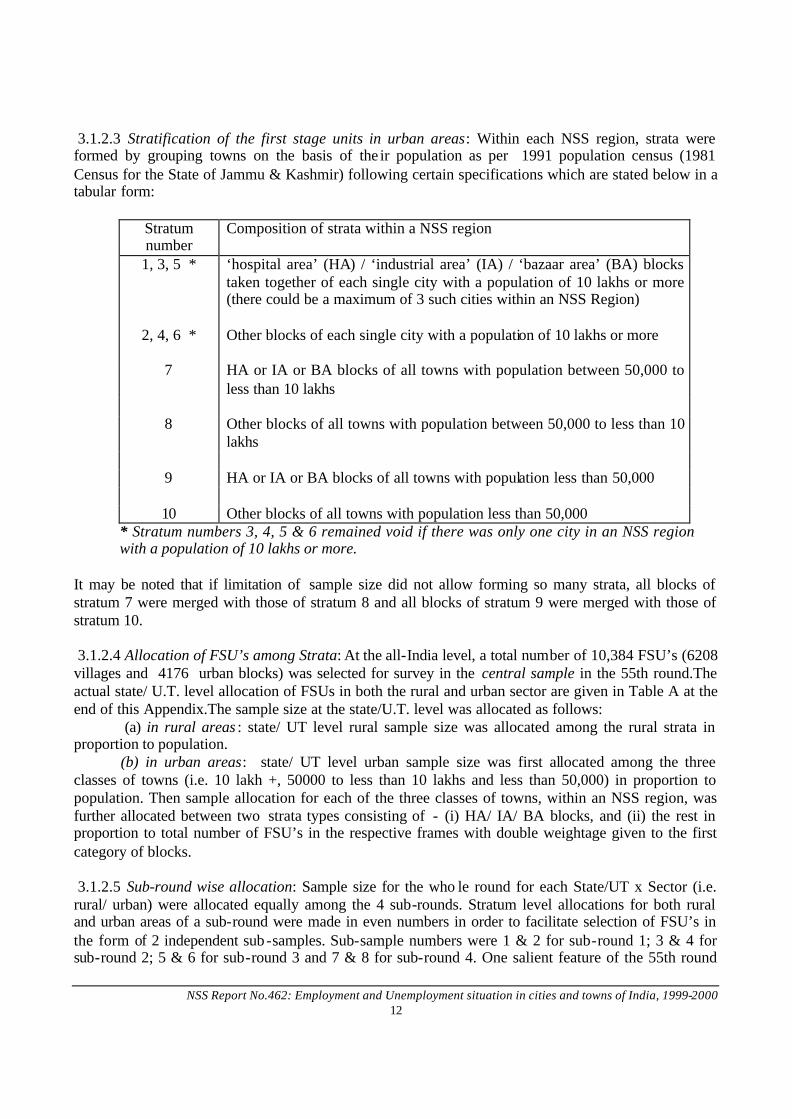
3.1.2.3 Stratification of the first stage units in urban areas: Within each NSS region, strata were formed by grouping towns on the basis of the ir population as per 1991 population census (1981 Census for the State of Jammu & Kashmir) following certain specifications which are stated below in a tabular form:
Stratum number
Composition of strata within a NSS region
1, 3, 5 * ‘hospital area’ (HA) / ‘industrial area’ (IA) / ‘bazaar area’ (BA) blocks taken together of each single city with a population of 10 lakhs or more (there could be a maximum of 3 such cities within an NSS Region)
2, 4, 6 * Other blocks of each single city with a population of 10 lakhs or more
7 HA or IA or BA blocks of all towns with population between 50,000 to
less than 10 lakhs
8 Other blocks of all towns with population between 50,000 to less than 10 lakhs
9 HA or IA or BA blocks of all towns with population less than 50,000
10 Other blocks of all towns with population less than 50,000 * Stratum numbers 3, 4, 5 & 6 remained void if there was only one city in an NSS region with a population of 10 lakhs or more.
It may be noted that if limitation of sample size did not allow forming so many strata, all blocks of stratum 7 were merged with those of stratum 8 and all blocks of stratum 9 were merged with those of stratum 10. 3.1.2.4 Allocation of FSU’s among Strata: At the all-India level, a total number of 10,384 FSU’s (6208 villages and 4176 urban blocks) was selected for survey in the central sample in the 55th round.The actual state/ U.T. level allocation of FSUs in both the rural and urban sector are given in Table A at the end of this Appendix.The sample size at the state/U.T. level was allocated as follows:
(a) in rural areas : state/ UT level rural sample size was allocated among the rural strata in proportion to population.
(b) in urban areas: state/ UT level urban sample size was first allocated among the three classes of towns (i.e. 10 lakh +, 50000 to less than 10 lakhs and less than 50,000) in proportion to population. Then sample allocation for each of the three classes of towns, within an NSS region, was further allocated between two strata types consisting of - (i) HA/ IA/ BA blocks, and (ii) the rest in proportion to total number of FSU’s in the respective frames with double weightage given to the first category of blocks. 3.1.2.5 Sub-round wise allocation: Sample size for the who le round for each State/UT x Sector (i.e. rural/ urban) were allocated equally among the 4 sub-rounds. Stratum level allocations for both rural and urban areas of a sub-round were made in even numbers in order to facilitate selection of FSU’s in the form of 2 independent sub -samples. Sub-sample numbers were 1 & 2 for sub-round 1; 3 & 4 for sub-round 2; 5 & 6 for sub-round 3 and 7 & 8 for sub-round 4. One salient feature of the 55th round
NSS Report No.462: Employment and Unemployment situation in cities and towns of India, 1999-2000 13
was the rotation sampling scheme which was adopted for the first time in the NSS for the purpose of collection of employment-unemployment data from central sample only. Under this scheme, 1 sub-sample of the sampled first stage units (FSU’s) of each sub-round was revisited in the subsequent sub-round. From each such FSU, sample households visited in the previous sub-round for collecting data on employment-unemployment were revisited in the subsequent sub-round for collecting employment-unemployment details.
3.1.2.6 Selection of first -stage units: For each sub-round, sample first-stage units from each stratum were selected afresh in the form of 2 independent sub-samples by following circular systematic sampling with :
(a) probability proportional to population for all rural strata other than stratum 1, and
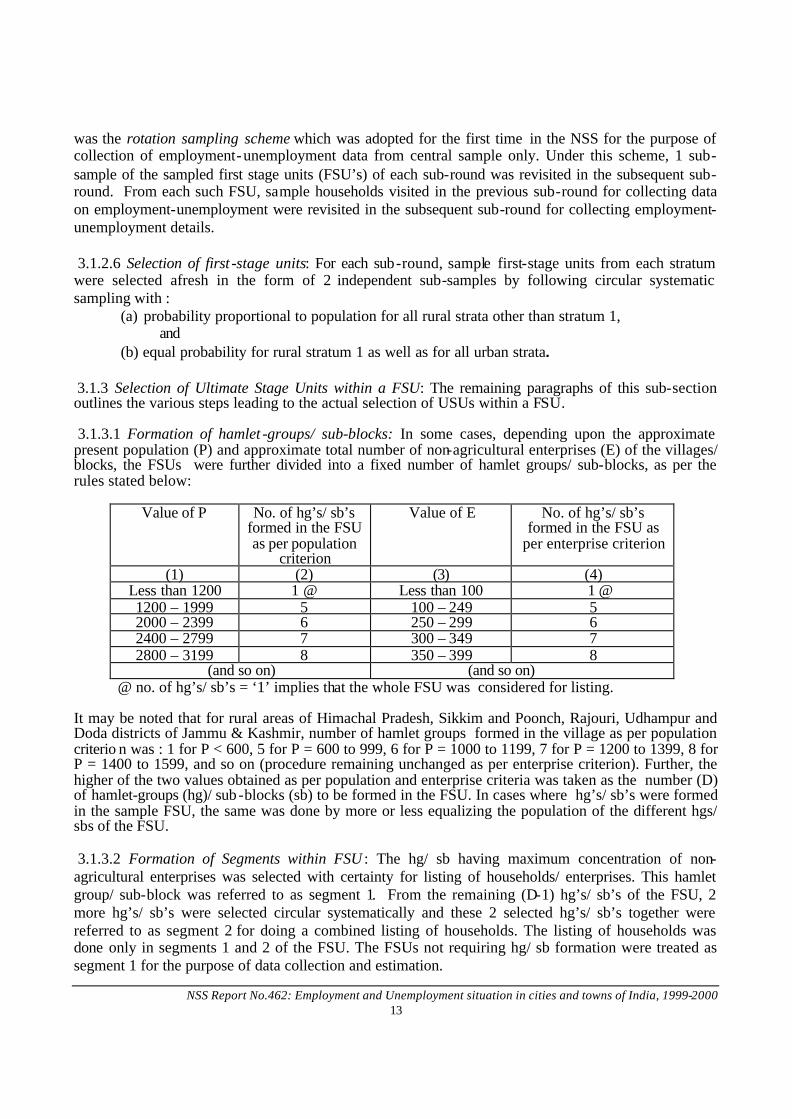
(b) equal probability for rural stratum 1 as well as for all urban strata. 3.1.3 Selection of Ultimate Stage Units within a FSU: The remaining paragraphs of this sub-section outlines the various steps leading to the actual selection of USUs within a FSU. 3.1.3.1 Formation of hamlet -groups/ sub-blocks: In some cases, depending upon the approximate present population (P) and approximate total number of non-agricultural enterprises (E) of the villages/ blocks, the FSUs were further divided into a fixed number of hamlet groups/ sub-blocks, as per the rules stated below:
Value of P No. of hg’s/ sb’s formed in the FSU as per population
criterion
Value of E No. of hg’s/ sb’s formed in the FSU as
per enterprise criterion
(1) (2) (3) (4) Less than 1200 1 @ Less than 100 1 @ 1200 – 1999 5 100 – 249 5 2000 – 2399 6 250 – 299 6 2400 – 2799 7 300 – 349 7 2800 – 3199 8 350 – 399 8
(and so on) (and so on) @ no. of hg’s/ sb’s = ‘1’ implies that the whole FSU was considered for listing.
It may be noted that for rural areas of Himachal Pradesh, Sikkim and Poonch, Rajouri, Udhampur and Doda districts of Jammu & Kashmir, number of hamlet groups formed in the village as per population criterio n was : 1 for P < 600, 5 for P = 600 to 999, 6 for P = 1000 to 1199, 7 for P = 1200 to 1399, 8 for P = 1400 to 1599, and so on (procedure remaining unchanged as per enterprise criterion). Further, the higher of the two values obtained as per population and enterprise criteria was taken as the number (D) of hamlet-groups (hg)/ sub-blocks (sb) to be formed in the FSU. In cases where hg’s/ sb’s were formed in the sample FSU, the same was done by more or less equalizing the population of the different hgs/ sbs of the FSU. 3.1.3.2 Formation of Segments within FSU : The hg/ sb having maximum concentration of non-agricultural enterprises was selected with certainty for listing of households/ enterprises. This hamlet group/ sub-block was referred to as segment 1. From the remaining (D-1) hg’s/ sb’s of the FSU, 2 more hg’s/ sb’s were selected circular systematically and these 2 selected hg’s/ sb’s together were referred to as segment 2 for doing a combined listing of households. The listing of households was done only in segments 1 and 2 of the FSU. The FSUs not requiring hg/ sb formation were treated as segment 1 for the purpose of data collection and estimation.

NSS Report No.462: Employment and Unemployment situation in cities and towns of India, 1999-2000 14
3.1.3.3 Sampling frame of households: All households of segments 1 and 2 of the FSU were listed independently and this list of households of the segments 1 and 2 constituted the sampling frame for the purpose of selection of sample households from the corresponding segments.
3.1.3.4 Stratification of households: All the households listed in a segment (both rural & urban) were stratified into two second stage strata, viz. ‘affluent households’ which formed second stage stratum 1, and the rest which formed second stage stratum 2. In the rural sector, a household was classified as ‘affluent’ if the household owned certain items like motor car/ jeep, colour TV, telephone, etc. or owned land / livestock in excess of certain limits. In the urban sector, the households with MPCE (monthly per capita consumer expenditure) greater than certain limit for a given town/city were treated as ‘affluent’ households and were included in the frame of second stage stratum 1, and rest of the urban households were included in the frame of second stage stratum 2. 3.1.3.5 Selection of households: Sample households were selected from the respective frames by circular systematic sampling with equal probability. For the purpose of systematic sampling, households in the frame of second stage stratum 2 were arranged by means of livelihood x land possessed classes for rural samples and by means of livelihood x MPCE classes for urban samples. The number of households selected for survey on employment–unemployment from different segments x second stage stratum (within a FSU) are specified below:
segment Household allotment *
second stage stratum 1 2 total
(1) (2) (3) (4) FSU with hg/ sb formation:
1 1 3 4
2 1 7 8 FSU with no hg/ sb formation:
1 2 10 12
* The fsus of sub-sample 1, sub-sample 3 and sub-sample 5 were re-visited during sub-round 2, sub-round 3 and sub-round 4 respectively. In the fsus of these re-visit sub-samples, all the households where schedule 10 was previously canvassed (i.e. during the previous sub -round) were re-visited for canvassing schedule 10.1.However, in case such a household could not be surveyed during re-visit, it was substituted and schedule 10 was canvassed in the substituted household. Further, schedule 10 was also canvassed for those households which were 'casualty' during visit 1 but could be surveyed during the re-visit. From among the newly formed households found during the re-visit of a fsu (which constituted the second stage stratum 9), at most 1 household was surveyed from each of the 2 segments and schedule 10 only was canvassed for those households.

NSS Report No.462: Employment and Unemployment situation in cities and towns of India, 1999-2000 15
3.2 Estimation Procedure 3.2.1 This estimation procedure adopted in the 55th round for schedule 10 provides (a) estimates on quarterly/ sub -round basis, and (b) the estimate of error from the sub-sample replicates. Tabulated estimate for a quarter/ sub -round was obtained by combining the estimates of the corresponding sub-sample replicates. The estimation procedure adopted in the 55th round for schedule 10 is described below. 3.2.2 Notation: The notations used for estimation procedure are given below:
a = subscript for the a-th stratum r = subscript for the r-th sub-sample replicate ( r = 1,2,…,8) q = subscript for the q-th sub-round / quarter (q=1,2,3 & 4) f = subscript for the f- th sampled village/ block as First Stage Unit ( FSU ) s = subscript for the s-th segment of sampled village/ block ( s= 1 & 2) c = subscript for the c-th second stage stratum of households in the sampled village/ block (c=
1,2); for new households during revisit, c= 9. j = subscript for the j-th sampled household p = subscript for pooled estimate z= size used for selection of an FSU from the sampling frame Z = total of sizes in the sampling frame for the stratum n = number of sampled FSU surveyed within a stratum and a sub-sample replicate (including
zero cases and uninhabited cases but excluding casualty cases) and used for tabulation L = number of sub-sample replicates surveyed and used for tabulation D = number of hamlet-groups/ sub-blocks formed in rural/ urban sampled FSU H = total number of households listed in the appropriate frame h = number of sampled households surveyed and used for tabulation from the frame y, x= value of characteristic y, x obtained in the sample
∃, ∃Y X = estimated value of characteristic y, x obtained from the sample. 3.2.3 Estimates of aggregates: If ∃Y be the estimate of aggregate of any characteristic y for a given stratum (a), and for a particular sub-round (q) and sub-sample replicate (r), the formula used for estimating a characteristic of household from a given 2nd stage stratum (c) is as specified below: For rural areas:
∑ ∑∑= ==
=n h
yBzn
ZY
f
fsc
j
fscj
s
fscf
c
1 1
2
1
1ˆ
where fsc
fscfsc
hH
B = , for segment 1 (s=1) andfsc
fscffsc
hHD
B ×−
=2
1 , for segment 2 (s=2).
For urban areas:

NSS Report No.462: Employment and Unemployment situation in cities and towns of India, 1999-2000 16
∑ ∑∑= ==
=n h
yBnZ
Yf
fsc
j
fscj
s
fscc
1 1
2
1
ˆ
where ,fsc
fscfsc
hH
B = , for segment 1 (s=1) andfsc
fscffsc
hHD
B ×−
=2
1, for segment 2 (s=2).
These formulae are provided for the general case of FSU’s having 2 segments 1 & 2. For the FSU’s requiring no hg/ sb formation, the formula is identical to that given for segment 1 while the contribution from segment 2 is taken as zero. Finally, the estimate of a characteristic y for a stratum (a), for a particular sub-round (q) and a sub-sample replicate (r) (which actually represented aqrY ) was obtained as ∑=
c
cYY ˆˆ .
The combined estimate for a particular stratum and a particular sub-round was computed as the average of sub-sample replicate estimates and is given below:
∑=
=L
r
aqraq YL
Y1
ˆ1ˆ
If qrY be the State/ UT/ Region level aggregate from the r-th sub-sample replicate and q-th sub-round, and qpY , the combined estimate of the aggregate based on the whole sample, for a given sub-round/ quarter q, then:
∑=a
aqrqr YY ˆˆ based on sub-sample replicate group r,
and
∑=
=L
r
qrqp YL
Y1
ˆ1ˆ based on all sub-sample replicates.
3.2.4 Estimates of ratios: If X & Y be the State/ UT/ Region level aggregate estimate corresponding to variables x and y, then the estimate of ratio, in general, is given by
r
rr
XY
R ˆˆ
ˆ = based on sub-sample group r,
and
p
pp
XY
R ˆˆ
ˆ = based on the whole sample.
Estimates for the sub-round (/quarter) qrR and qpR was obtained by replacing rY and pY by qrY and qpY ,
respectively and rX and pX by qrX and qpX , respectively.

NSS Report No.462: Employment and Unemployment situation in cities and towns of India, 1999-2000 17
3.2.5 Treatment for casualty: I) If Hfsc >0 but hrfsc=0 for a particular 2nd stage stratum of households in a FSU with no hamlet-group/ sub-block formation (ie. Df =1), it was a case of casualty and the value of n was reduced by 1. II) If Df > 1 and Hfs′c >0 but hfs′c=0 for s=1 (say, s′) and if it was not a case for the entire FSU, here n was not reduced by 1 and in this case [(Df-1)/2] x Hfsc was replaced by {Hfs′c + [(Df-1)/2] x Hfsc} in the formula for s=2. III) If Df > 1 and Hfs′c >0 but hfs′c=0 for s=2 (say, s′) and if it was not a case for the entire FSU, here n
was not reduced by 1 and in this case, Hfsc was replaced by {Hfsc + [(Df-1)/2] x Hfs′c} in the formula for s=1. IV) If Hfsc >0 but hfsc=0 for a particular second stage stratum of households in both the segments (s=1 & 2) in an FSU, it was a case of casualty and the value of n was reduced by 1.
NSS Report No.462: Employment and Unemployment situation in cities and towns of India, 1999-2000 18
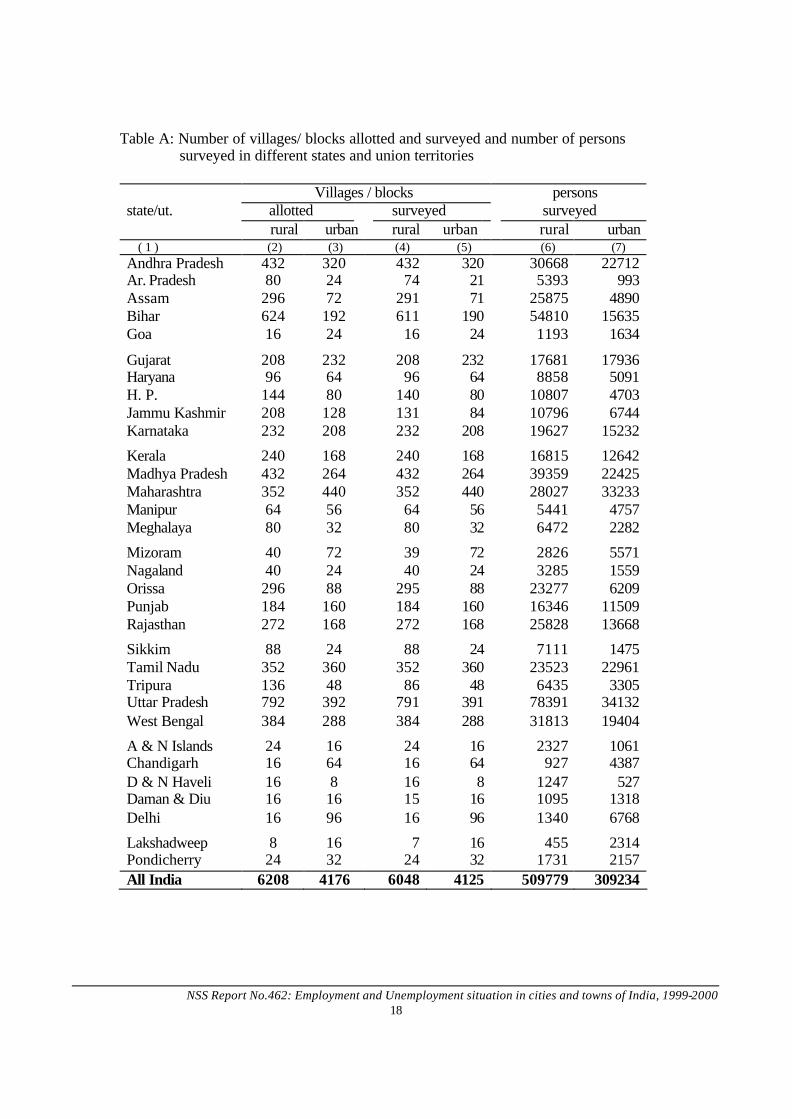
Table A: Number of villages/ blocks allotted and surveyed and number of persons surveyed in different states and union territories
Villages / blocks persons state/ut. allotted surveyed surveyed rural urban rural urban rural urban ( 1 ) (2) (3) (4) (5) (6) (7) Andhra Pradesh 432 320 432 320 30668 22712 Ar. Pradesh 80 24 74 21 5393 993 Assam 296 72 291 71 25875 4890 Bihar 624 192 611 190 54810 15635 Goa 16 24 16 24 1193 1634 Gujarat 208 232 208 232 17681 17936 Haryana 96 64 96 64 8858 5091 H. P. 144 80 140 80 10807 4703 Jammu Kashmir 208 128 131 84 10796 6744 Karnataka 232 208 232 208 19627 15232 Kerala 240 168 240 168 16815 12642 Madhya Pradesh 432 264 432 264 39359 22425 Maharashtra 352 440 352 440 28027 33233 Manipur 64 56 64 56 5441 4757 Meghalaya 80 32 80 32 6472 2282 Mizoram 40 72 39 72 2826 5571 Nagaland 40 24 40 24 3285 1559 Orissa 296 88 295 88 23277 6209 Punjab 184 160 184 160 16346 11509 Rajasthan 272 168 272 168 25828 13668 Sikkim 88 24 88 24 7111 1475 Tamil Nadu 352 360 352 360 23523 22961 Tripura 136 48 86 48 6435 3305 Uttar Pradesh 792 392 791 391 78391 34132 West Bengal 384 288 384 288 31813 19404 A & N Islands 24 16 24 16 2327 1061 Chandigarh 16 64 16 64 927 4387 D & N Haveli 16 8 16 8 1247 527 Daman & Diu 16 16 15 16 1095 1318 Delhi 16 96 16 96 1340 6768 Lakshadweep 8 16 7 16 455 2314 Pondicherry 24 32 24 32 1731 2157 All India 6208 4176 6048 4125 509779 309234
NSS Report No.462: Employment and Unemployment situation in cities and towns of India, 1999-2000
19
Chapter 4
Employment
4.0 In order to get a comprehensive picture of the different dimensions of the situation of economic activity in the country, the NSSO generates three different estimates of ‘employed’ (or work-force) from the data collected through its quinquennial employment-unemployment surveys. They relate to:
i) the number of persons usually employed in the principal status and all workers taking into account the employed according to both the principal and subsidiary statuses
ii) the number of persons employed on an average in a week iii) the number of persons/person-days employed per day during the reference period of 7 days
preceding the date of survey.
4.1 Usually employed 4.1.1 Of the three estimates mentioned above, the first gives the magnitude of the usually ‘employed’ or the ‘usual status work-force’. The two categories ‘usually employed’ or ‘working’ according the principal status (ps workers) and ‘usually employed’ or ‘working’ only in a subsidiary status (ss workers) together constitute the total usually employed (or all workers). The relevant data (i.e. worker population ratios) for persons aged 15 years and above are presented in Table 4.1 for the twenty five class I cities (with a population of one million or more) along with size classes 2 and 3 towns with a population of 50,000 to less than one million, and less than 50,000 respectively, and urban India as a whole. The comparable ratios derived from the 50th round (1993-94) survey results are also presented in the table. It may be noted that the classification of towns followed in the 50th round was as follows: those with population (a) less than 50,000 as size class I (b) 50,000 to less than 2,00,000 as size class II, (c) 2,00,000 to 10,00,000 as size class III and (d) 10,00,000 and above as size class IV (class 1 cities). Further, for the sake of comparison with size class 2 of towns (towns with population 50,000 to less than one million) of the 55th round, size classes II & III of towns (towns with population 50,000 to less than 2,00,000 and with 2,00,000 to less than 10,00,000 respectively) of the 50th round were clubbed. It may also be noted that size class 3 of towns (towns with population less than 50,000) of the 55th round is comparable to size class I of towns of the 50th round. 4.1.2 Worker population ratios (WPR) during 1999-2000: The proportion of usually employed persons of age 15 years and above was 75 per cent among males and 20 per cent among females in urban India. The proportions were slightly more in size class 3 towns – 77 per cent among males and 24 per cent among females. Among all class 1 cities taken together, 75 per cent of males and 18 per cent of females were usually employed during 1999-2000. During 1999-2000, the city of Ludhiana had shown the highest proportion (84 per cent) of employed males followed by Agra (81 per cent). Patna reported the lowest proportion (67 per cent) of employed males. For females, Madurai reported the highest proportion of employed (29 per cent) followed by Chennai (26 per cent), while the proportion of employed females was the lowest (6 per cent) in Surat.
4.1.3 Change between 1993-94 and 1999-2000: In urban India as a whole, for both males and females, the proportion of usually employed fell by about 2 percentage points between 1993-94 and 1999-2000.

NSS Report No.462: Employment and Unemployment situation in cities and towns of India, 1999-2000
20
Over the period, the WPR for females of age 15 years and above fell from 28% to 24% for size class 3 towns (i.e. with population less than 50,000) and from 20% to 18% for size class 2 towns (i.e. with population 50,000 to less than 10,00,000). While for all class I cities taken together a fall of two percentage points was noticed in the WPRs of males, for females, the level of employment was almost stable. Kanpur showed a rather steep increase in the proportion of employed males, whereas a sharp decline in the level of employment was observed in Vadodara. The level of employment was stable in Indore and Surat. Among females, a sharp increase in employment over the said period was observed in Vadodara and Bangalore, whereas in Surat, there was a steep fall in the level of employment. The level was found stable in Ahmedabad, Calcutta and Hyderabad. Table 4.1: Number of usually employed persons aged 15 years & above according to principal and
subsidiary status taken together per 1000 persons for each city / size class of towns city/ size class male female of town 55th 50th 55th 50th
Class 1 cities Agra 806 n. a. 106 n. a. Ahmedabad 777 764 204 196 Bangalore 747 763 232 162 Bhopal 722 685 151 176 Calcutta 780 803 187 183 Chennai 764 773 260 227 Delhi 743 796 147 132 Howrah 760 n. a. 67 n. a. Hyderabad 682 750 155 164 Indore 761 753 199 235 Jaipur 701 720 108 128 Kanpur 699 558 154 131 Lucknow 772 759 149 82 Ludhiana 841 883 139 104 Madurai 734 n. a. 291 n. a. Mumbai 753 773 174 221 Nagpur 697 727 154 212 Patna 667 n. a. 89 n. a. Pune 726 699 220 261 Surat 765 773 55 231 Thane 740 n. a. 244 n. a. Thane(Kalyan) 715 742 167 165 Vadodara 736 879 246 116 Varanasi 758 n. a. 200 n. a. Visakhapatnam 738 n. a. 163 n. a. all class 1 cities 745 767 176 181 size class 2 746 761 179 203 size class 3 766 781 244 281 Urban India 752 768 197 223

NSS Report No.462: Employment and Unemployment situation in cities and towns of India, 1999-2000
21
4.2 Distribution of the usually employed by status of employment
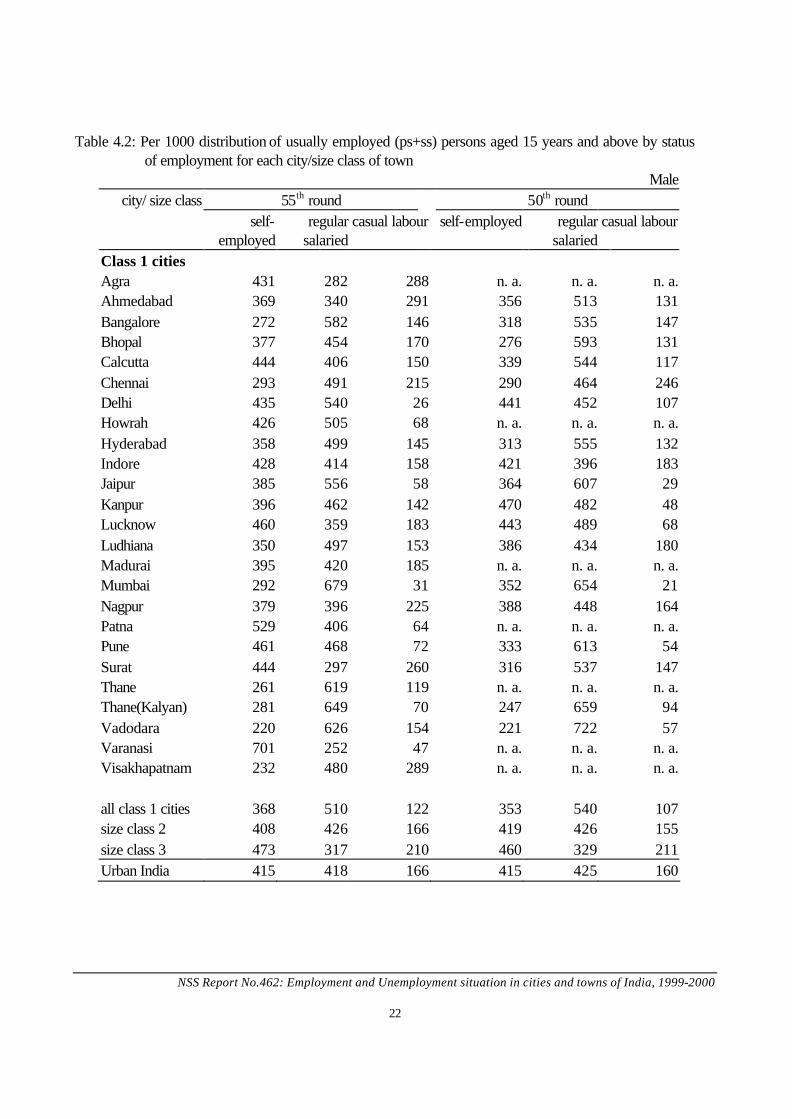
4.2.1 Employed persons are categorised into three broad groups according to the status of employment. The groups are: (i) self-employed, (ii) regular employees and (iii) casual labour. Table 4.2 shows per thousand distribution of the usually employed (all workers) of age 15 years and above by the three statuses of employment for each of the twentyfive class I cities, along with all size-classes of towns, and urban India as a whole. The table also gives the corresponding distribution obtained from the 50th round (1993-94) survey.
4.2.2 The table shows that during 1999-2000, among males, the proportion of regular wage/salary earners was relatively higher in many cities except in Agra, Varanasi, Ahmedabad and Lucknow, where it was less than 40 per cent. In Mumbai, the proportion was the highest (68 per cent) followed by Thane (65 per cent), Vadodara (63 per cent). The proportion of self- employed among the usually employed was the highest (70 per cent) in Varanasi followed by Patna (53 per cent) and Pune and Lucknow (46 per cent each). The proportion of casual labour was the highest (29 per cent) in each of the cities of Ahmedabad, Agra and Vishakapatnam, followed by Surat (26 per cent). In the case of females, Varanasi recorded the highest proportion (73 per cent) of self- employeds followed by Lucknow (69 per cent), Ahmedabad (63 per cent). Both Surat and Ludhiana were way behind all other cities in this respect. The proportion of regular employees was the highest in Ludhiana (86 per cent) followed by Mumbai (69 per cent) and the lowest (13 per cent) in Lucknow. The proportion of female casual labour was the highest in Surat (53 per cent) followed by Vadodara (49 per cent), Hyderabad (39 per cent), Nagpur (29 per cent).
4.2.3 Change between 1993-94 and 1999-2000: In urban India as a whole, between 1993-94 and 1999-2000, the proportion of all three groups of employed persons remained almost the same for males. However, for females, during the same period, there was an increase of about 4 percentage points for regular salaried employees and a corresponding fall for casual labourers. During this period, for class-I cities as a whole, for males, there was an increase of about 2 percentage points for each of the groups of self-employed and casual labourers and a fall of 3 percentage points for regular salaried. For females, there was an increase of 7 percentage points for self-employed along with a decrease of 5 percentage points for regular salaried and 2 percentage points for casual labourers.
4.2.4 Change between 1993-94 to 1999-2000 for class-I cities: Over the period 1993-94 to 1999-2000, the proportion of self-employed among males had increased by 10 or more percentage points in Pune, Surat, Bhopal and Calcutta. The proportion of casual labour among usually employed increased by 10 or more percentage points in the cities of Ahmedabad, Lucknow, Surat, Kanpur and Vadodara. The proportion of regular employees fell by more than 10 percentage points in the cities of Surat, Ahemadabad, Bhopal, Pune, Calcutta and Lucknow. For females, over the same period, the proportion of regular employees fell by more than 10 percentage points in the cities of Lucknow, Indore, Thane, Bhopal, Kanpur and Pune. The proportion of casual labour fell by more than 10 percentage points in Ahmedabad, Delhi and Chennai. The proportion of self-employeds increased by more than 10 percentage points in Lucknow, Bhopal, Thane, Ahmedabad, Pune, Kanpur and Chennai.
NSS Report No.462: Employment and Unemployment situation in cities and towns of India, 1999-2000
22
Table 4.2: Per 1000 distribution of usually employed (ps+ss) persons aged 15 years and above by status
of employment for each city/size class of town Male
city/ size class 55th round 50th round self-
employed regular
salaried casual labour self-employed regular
salaried casual labour
Class 1 cities Agra 431 282 288 n. a. n. a. n. a. Ahmedabad 369 340 291 356 513 131 Bangalore 272 582 146 318 535 147 Bhopal 377 454 170 276 593 131 Calcutta 444 406 150 339 544 117 Chennai 293 491 215 290 464 246 Delhi 435 540 26 441 452 107 Howrah 426 505 68 n. a. n. a. n. a. Hyderabad 358 499 145 313 555 132 Indore 428 414 158 421 396 183 Jaipur 385 556 58 364 607 29 Kanpur 396 462 142 470 482 48 Lucknow 460 359 183 443 489 68 Ludhiana 350 497 153 386 434 180 Madurai 395 420 185 n. a. n. a. n. a. Mumbai 292 679 31 352 654 21 Nagpur 379 396 225 388 448 164 Patna 529 406 64 n. a. n. a. n. a. Pune 461 468 72 333 613 54 Surat 444 297 260 316 537 147 Thane 261 619 119 n. a. n. a. n. a. Thane(Kalyan) 281 649 70 247 659 94 Vadodara 220 626 154 221 722 57 Varanasi 701 252 47 n. a. n. a. n. a. Visakhapatnam 232 480 289 n. a. n. a. n. a. all class 1 cities 368 510 122 353 540 107 size class 2 408 426 166 419 426 155 size class 3 473 317 210 460 329 211 Urban India 415 418 166 415 425 160

NSS Report No.462: Employment and Unemployment situation in cities and towns of India, 1999-2000
23
Table 4.2: Per 1000 distribution of usually employed (ps+ss) persons aged 15 years and above by status
of employment for each city/size class of town Female
city/ size class 55th round 50th round self-
employed regular
salaried casual labour self-
employed regular
salaried casual labour
Class 1 cities Agra 462 509 28 n. a. n. a. n. a. Ahmedabad 627 225 147 439 270 291 Bangalore 250 586 168 296 623 81 Bhopal 470 278 258 205 509 286 Calcutta 299 545 150 284 623 93 Chennai 273 619 112 133 637 230 Delhi 313 646 41 242 576 182 Howrah 358 507 134 n. a. n. a. n. a. Hyderabad 219 394 387 212 479 309 Indore 332 523 146 498 260 242 Jaipur 380 546 74 469 531 - Kanpur 513 468 26 366 580 54 Lucknow 685 134 181 402 402 196 Ludhiana 65 863 72 519 375 106 Madurai 402 419 182 n. a. n. a. n. a. Mumbai 259 690 52 276 692 32 Nagpur 383 318 292 385 362 253 Patna 315 584 101 n. a. n. a. n. a. Pune 441 491 68 277 600 123 Surat 55 418 527 429 333 138 Thane 500 463 33 n. a. n. a. n. a. Thane(Kalyan) 419 449 138 164 697 139 Vadodara 276 232 492 241 404 345 Varanasi 730 215 55 n. a. n. a. n. a. Visakhapatnam 558 362 86 n. a. n. a. n. a. all class 1 cities 352 523 125 282 569 149 size class 2 447 335 218 463 301 236 size class 3 525 213 262 502 160 338 Urban India 452 335 213 446 293 261

NSS Report No.462: Employment and Unemployment situation in cities and towns of India, 1999-2000
24
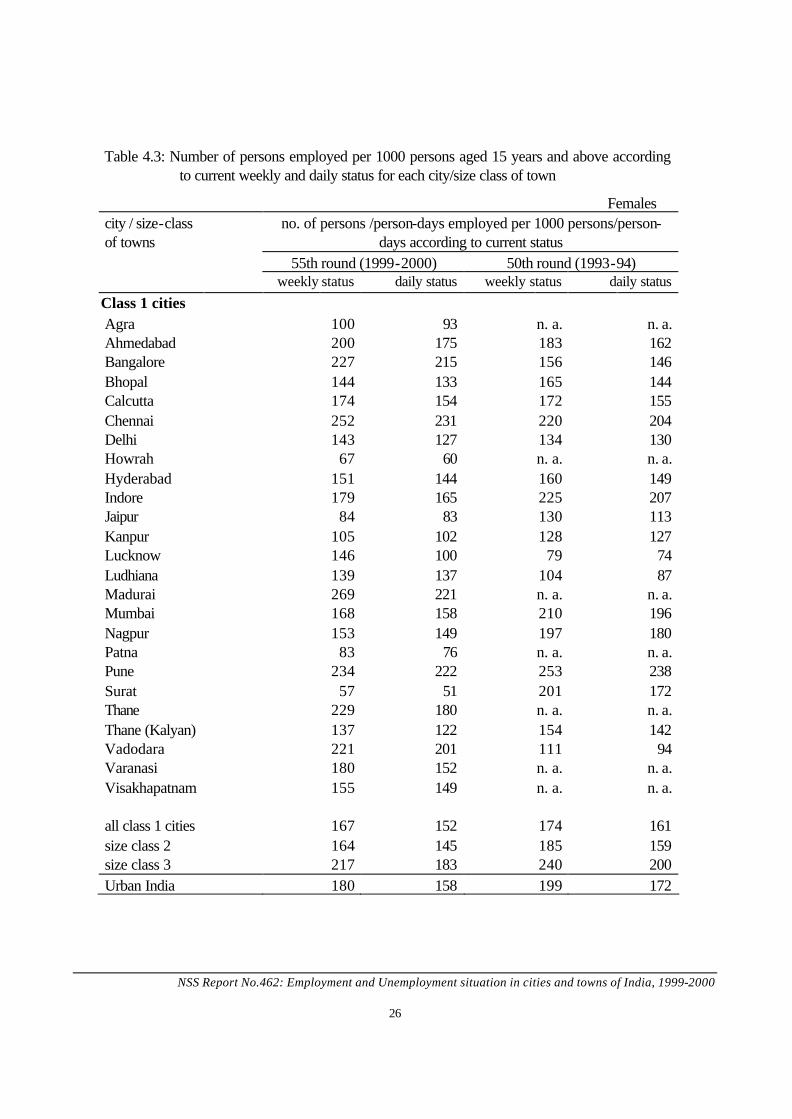
4.3 Estimates of employed according to current status 4.3.1 The ‘usual status’ approach adopted for classification of the population, obviously, does not take into consideration the changes in the activity pattern caused by seasonal fluctuations. But the estimates obtained by adopting the current weekly status (CWS) and current daily status (CDS) approaches are expected to reflect the overall effect caused by the intermittent changes in the activity pattern during the year as they take into account the changes which take place even during a week/day. The estimates of the employed based on current weekly status give the average weekly picture and those based on current daily status give the average daily picture of employment. The difference in the two rates broadly indicates the underemployment of those who had some employment in the week. Table 4.3 gives the relevant estimates of employed persons of age 15 years and above according to current weekly and current daily statuses for each city/size class of towns separately for males and females. The relevant results based on 50th round survey are also presented in the table. 4.3.2 During 1999-2000, the underemployment was highest in the city of Thane followed by Chennai, Madurai and Bhopal in the case of males, and in the case of females, it was highest for the city of Thane followed by Madurai and Lucknow. Over the period 1993-94 to 1999-2000, the underemployment of males who had some employment in the week remained almost stable for all class-I cities taken as a whole, as well as for urban India taken as a whole. However, it increased sharply in the city of Bhopal. In the case of females too, during the said period, the underemployment remained almost stable among the class I cities taken as a whole as well as in urban India taken as a whole. However, over this period, it showed a sharp rise in Lucknow.

NSS Report No.462: Employment and Unemployment situation in cities and towns of India, 1999-2000
25
Table 4.3: Number of persons employed per 1000 persons aged 15 years and above according to current weekly and daily status for each city/size class of town
Males city / size-class of towns
no. of persons /person-days employed per 1000 persons/person-days according to current status
55th round (1999-2000) 50th round (1993-94) weekly status daily status weekly status daily status
Class 1 cities Agra 772 734 n. a. n. a. Ahmedabad 766 736 758 740 Bangalore 742 713 757 735 Bhopal 708 668 675 658 Calcutta 765 742 787 762 Chennai 752 710 758 720 Delhi 753 736 795 797 Howrah 760 751 n. a. n. a. Hyderabad 679 671 746 737 Indore 749 725 758 748 Jaipur 698 698 705 703 Kanpur 695 692 556 555 Lucknow 765 746 753 740 Ludhiana 837 835 880 874 Madurai 717 676 n. a. n. a. Mumbai 744 734 768 763 Nagpur 689 674 718 694 Patna 664 663 n. a. n. a. Pune 716 701 688 686 Surat 764 748 758 746 Thane 733 685 n. a. n. a. Thane(Kalyan) 704 699 736 732 Vadodara 722 715 871 864 Varanasi 748 741 n. a. n. a. Visakhapatnam 739 718 n. a. n. a. all class 1 cities 739 721 760 748 size class 2 732 705 745 723 size class 3 746 710 759 731 Urban India 737 711 753 731
NSS Report No.462: Employment and Unemployment situation in cities and towns of India, 1999-2000
26
Table 4.3: Number of persons employed per 1000 persons aged 15 years and above according to current weekly and daily status for each city/size class of town
Females city / size-class of towns
no. of persons /person-days employed per 1000 persons/person-days according to current status
55th round (1999-2000) 50th round (1993-94) weekly status daily status weekly status daily status
Class 1 cities Agra 100 93 n. a. n. a. Ahmedabad 200 175 183 162 Bangalore 227 215 156 146 Bhopal 144 133 165 144 Calcutta 174 154 172 155 Chennai 252 231 220 204 Delhi 143 127 134 130 Howrah 67 60 n. a. n. a. Hyderabad 151 144 160 149 Indore 179 165 225 207 Jaipur 84 83 130 113 Kanpur 105 102 128 127 Lucknow 146 100 79 74 Ludhiana 139 137 104 87 Madurai 269 221 n. a. n. a. Mumbai 168 158 210 196 Nagpur 153 149 197 180 Patna 83 76 n. a. n. a. Pune 234 222 253 238 Surat 57 51 201 172 Thane 229 180 n. a. n. a. Thane (Kalyan) 137 122 154 142 Vadodara 221 201 111 94 Varanasi 180 152 n. a. n. a. Visakhapatnam 155 149 n. a. n. a. all class 1 cities 167 152 174 161 size class 2 164 145 185 159 size class 3 217 183 240 200 Urban India 180 158 199 172

NSS Report No.462: Employment and Unemployment situation in cities and towns of India, 1999-2000
27
Chapter 5
Unemployment
5.0 As in the case of ‘employed’, for the ‘unemployed’ also, three kinds of estimates are obtained following the three different approaches. These are:
i) number of persons usually unemployed based on ‘usual status’ approach; ii) number of persons unemployed on an average in a week based on the ‘weekly status’ approach and iii) number of person-days unemployed on an average on a day based on ‘daily status’ approach.
5.0.1 Of these, the first estimate indicates the proportion of persons unemployed for a relatively longer period during a reference period of 365 days and approximates to an indicator of chronic unemployment. Some of the unemployed identified through this criterion might be working in a subsidiary capacity. One can, therefore, get another estimate of the unemployed excluding those employed in a subsidiary capacity during the reference period. The former is called as the usually unemployed in the principal status (p.s.) and the latter, the usually unemployed excluding the subsidiary status workers (u.s. adjusted) which would conceptually be lower than the former. 5.0.2 The second estimate, based on the weekly status, gives the average weekly picture during the survey year and includes both the chronic unemployment and also the intermittent unemployment caused by seasonal fluctuations of labour market of those categorised as usually employed. 5.0.3 The third estimate, based on the daily status concept, gives the average volume of unemployment on a day during the survey year. It is the most inclusive rate of ‘unemployment’ as it captures the unemployed days of the chronically unemployed, the unemployed days of the usually employed who become intermittently unemployed during the reference week and the unemployed days of those classified as employed according to the priority criterion of current weekly status. 5.1 Unemployment rates 5.1.1 Unemployment rate is defined as the number of persons unemployed per thousand persons in the labour force (employed and unemployed taken together). This, in effect, gives the unutilised portion of the labour force. Thus, it is a more refined indicator of the unemployment situation in a population than the proportion unemployed, which is merely the number of the employed per thousand persons in the population as a whole. Thus, for the purpose of discussions on the subject of unemployment, unemployment rates are presented here. Table 5.1 shows the unemployment rates of persons aged 15 years and above for usual (adjusted), current weekly and current daily status for each city/size-class of town separately for males and females. The corresponding results based on the 50th round survey are also presented in the table.

NSS Report No.462: Employment and Unemployment situation in cities and towns of India, 1999-2000
28
Table 5.1: Unemployment rates of persons aged 15 years and above according to usual, current weekly and current daily statuses for each city/size class of town
males Unemployment rates according to status city / size-class 55th round (1999 - 2000) 50th round (1993 - 1994)
of towns
usual (adjusted)
current weekly daily
usual (adjusted)
current weekly daily
Class I cities Agra 19 42 72 n. a. n. a. n. a. Ahmedabad 10 22 26 44 44 55 Bangalore 29 29 42 38 44 58 Bhopal 39 61 96 46 38 55 Calcutta 36 52 70 50 62 85 Chennai 45 58 92 53 55 94 Delhi 24 25 32 9 15 16 Howrah 97 97 97 n. a. n. a. n. a. Hydrabad 64 65 71 20 25 37 Indore 65 79 85 44 44 45 Jaipur 33 36 36 3 10 10 Kanpur 89 94 97 54 56 56 Lucknow 42 41 42 32 38 51 Ludhiana 9 11 11 7 9 11 Madurai 15 22 42 n. a. n. a. n. a. Mumbai 68 77 85 53 57 60 Nagpur 50 64 78 57 61 73 Patna 75 71 73 n. a. n. a. n. a. Pune 25 41 45 48 55 55 Surat 13 13 21 52 62 74 Thane 50 57 69 n. a. n. a. n. a. Thane(Kalyan) 75 87 91 26 30 28 Vadodara 45 54 55 18 28 28 Varanasi 69 64 68 n. a. n. a. n. a. Visakhapatnam 56 54 76 n. a. n. a. n. a. all class 1 cities 47 54 65 38 43 52 size class 2 46 57 72 44 57 72 size class 3 40 56 80 37 52 72 Urban India 44 56 73 40 52 68

NSS Report No.462: Employment and Unemployment situation in cities and towns of India, 1999-2000
29
Table 5.1: Unemployment rates of persons aged 15 years and above according to usual, current weekly and current daily statuses for each city/size class of town
females Unemployment rates according to status city / size-class 55th round (1999 - 2000) 50th round (1993 - 1994) of towns
usual (adjusted)
current weekly daily
usual (adjusted)
current weekly daily
Class I cities Agra 0 0 11 n. a. n. a. n. a. Ahmedabad 10 10 11 137 149 138 Bangalore 80 81 85 134 148 156 Bhopal 44 77 83 74 78 138 Calcutta 70 89 110 149 157 180 Chennai 41 31 45 117 124 157 Delhi 33 40 45 64 63 65 Howrah 143 143 145 n. a. n. a. n. a. Hydrabad 38 44 65 6 6 57 Indore 0 6 6 37 38 28 Jaipur 18 23 24 8 8 9 Kanpur 6 9 10 30 30 31 Lucknow 80 82 115 - - - Ludhiana 14 14 14 37 - - Madurai 107 103 116 n. a. n. a. n. a. Mumbai 117 124 136 71 83 93 Nagpur 25 25 39 58 109 122 Patna 174 270 290 n. a. n. a. n. a. Pune 31 29 30 61 63 67 Surat 0 17 19 29 24 44 Thane 144 112 139 n. a. n. a. n. a. Thane(Kalyan) 87 105 129 179 172 112 Vadodara 47 75 95 25 26 31 Varanasi 15 16 19 n. a. n. a. n. a. Visakhapatnam 150 197 209 n. a. n. a. n. a. all class 1 cities 64 72 85 86 89 100 size class 2 63 89 105 69 93 117 size class 3 47 61 90 47 73 99 Urban India 57 72 92 63 87 109

NSS Report No.462: Employment and Unemployment situation in cities and towns of India, 1999-2000
30
5.1.2 For males: During 1993-94, the chronic unemployment rate among males was the highest in Howrah (10 per cent), followed by Kanpur (9 per cent each), Patna and Thane (8 per cent each). Over the period 1993-94 to 1999-2000, the usual (adjusted) unemployment rate for males increased by about 1 percentage point in class-I cities as a whole. In the cities of Kanpur, Thane and Hyderabad, the increase was by more than 2 percentage points. Over this period, current daily status and weekly status rates remained stable in towns with population between 50,000 and 10,00,000 and in urban India as a whole. However, these rates rose by about 1 percentage point over the period when only class-I cities were considered – the rise being sharpest in Thane (by about 6 percentage points). 5.1.3 For females: During 1999-2000, the usual status unemployment rate was the highest in Patna (17 per cent), followed by Vishakhapatnam (15 per cent), Thane and Howrah (14 per cent each) and Mumbai (12 per cent). Over the period 1993-94 to 1999-2000, it fell by about 2 percentage points in the class-I cities as a whole but remained stable among towns with population less than 50 thousand. In the cities of Ahemadabad, Thane, Calcutta and Chennai, the fall was by more than 5 percentage points. During the said period, the weekly and daily unemployment rates among females had declined by about 2 percentage points in urban India as a whole as well as in class-I cities – the decline being the sharpest in Ahmedabad (by about 13 percentage points).
APPENDIX
Codes used in the Appendix Tables Industry codes (in Table 103): Codes used are as per National Industrial Classification, 1998. The detailed structure of the codes along with their description are available in the booklet entitled “National Industrial Classification (All Economic Activities)”, brought out by CSO in November, 1998.

NSS Report No.462: Employment and Unemployment situation in cities and towns of India, 1999-2000 Appendix
A-1
Table (103) : Per thousand distribution of usually 'working' (principal and subsidiary status taken together) persons of age -group 15 years & above by the broad industry division for each size class of town
urban male broad industry division number of persons** class 1 cities/ agri- mining manufac- elec- cons- trade, trans- services total size class of town cul- & quar- turing tric- truc- hotel & port 65-93 95 99
estimated (00) sample of
ture rying ity & tion restaurant all ages age (01- water ages 15 & 15 & 05) (10-14) (15-37) (40,41) (45) (50-55) (60-64) above above
(1) (2) (3) (4) (5) (6) (7) (8) (9) (10) (11) (12) (13) (14) (15) Agra 3 0 467 19 34 291 55 131 0 0 1000 3548 3494 391Ahmedabad 13 5 323 1 75 342 104 132 4 0 1000 9195 9188 1046Bangalore 12 0 298 6 128 237 93 228 0 0 1000 9582 9491 766Bhopal 27 0 129 0 164 291 182 204 4 0 1000 2721 2678 307Calcutta 3 1 238 5 50 304 156 212 30 0 1000 10312 10245 1288 Chennai 10 0 251 4 103 243 145 202 40 0 1000 12761 12637 1430Delhi 6 0 253 3 43 333 73 253 33 4 1000 21023 20840 1445Howrah 0 0 405 16 13 315 84 163 5 0 1000 2492 2492 307Hyderabad 5 1 125 8 131 322 142 258 8 0 1000 7111 7022 1499Indore 80 3 237 6 68 251 106 250 0 0 1000 2817 2813 329 Jaipur 7 0 206 6 62 208 58 432 20 0 1000 3676 3664 516Kanpur 2 0 319 1 27 329 146 164 13 0 1000 10157 9938 599Lucknow 32 0 123 5 54 350 138 288 9 0 1000 6874 6750 481Ludhiana 1 0 486 2 58 230 108 101 14 0 1000 4145 4119 669Madurai 15 0 229 0 65 307 177 208 0 0 1000 2710 2622 322
** refer to persons those are usually 'working' (principal and subsidiary status taken together)
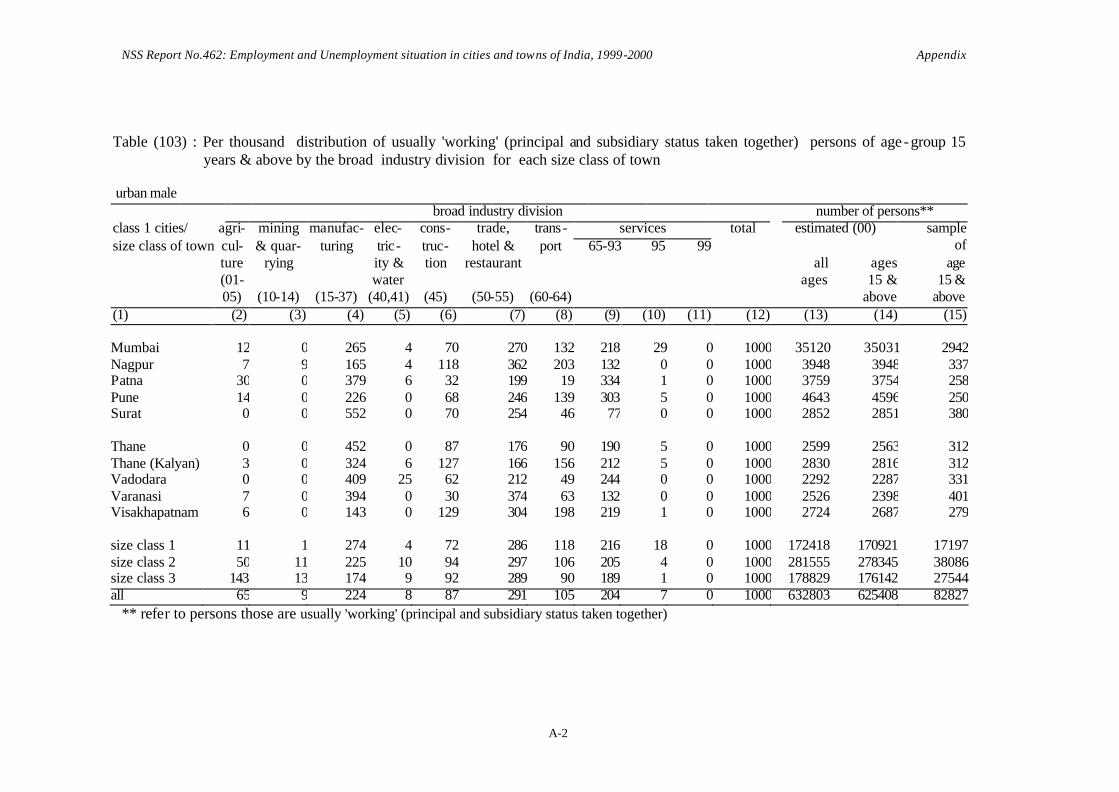
NSS Report No.462: Employment and Unemployment situation in cities and towns of India, 1999-2000 Appendix
A-2
Table (103) : Per thousand distribution of usually 'working' (principal and subsidiary status taken together) persons of age -group 15
years & above by the broad industry division for each size class of town
urban male broad industry division number of persons** class 1 cities/ agri- mining manufac- elec- cons- trade, trans- services total size class of town cul- & quar- turing tric- truc- hotel & port 65-93 95 99
estimated (00) sample of
ture rying ity & tion restaurant all ages age (01- water ages 15 & 15 & 05) (10-14) (15-37) (40,41) (45) (50-55) (60-64) above above
(1) (2) (3) (4) (5) (6) (7) (8) (9) (10) (11) (12) (13) (14) (15) Mumbai 12 0 265 4 70 270 132 218 29 0 1000 35120 35031 2942Nagpur 7 9 165 4 118 362 203 132 0 0 1000 3948 3948 337Patna 30 0 379 6 32 199 19 334 1 0 1000 3759 3754 258Pune 14 0 226 0 68 246 139 303 5 0 1000 4643 4596 250Surat 0 0 552 0 70 254 46 77 0 0 1000 2852 2851 380 Thane 0 0 452 0 87 176 90 190 5 0 1000 2599 2563 312Thane (Kalyan) 3 0 324 6 127 166 156 212 5 0 1000 2830 2816 312Vadodara 0 0 409 25 62 212 49 244 0 0 1000 2292 2287 331Varanasi 7 0 394 0 30 374 63 132 0 0 1000 2526 2398 401Visakhapatnam 6 0 143 0 129 304 198 219 1 0 1000 2724 2687 279 size class 1 11 1 274 4 72 286 118 216 18 0 1000 172418 170921 17197size class 2 50 11 225 10 94 297 106 205 4 0 1000 281555 278345 38086size class 3 143 13 174 9 92 289 90 189 1 0 1000 178829 176142 27544all 65 9 224 8 87 291 105 204 7 0 1000 632803 625408 82827
** refer to persons those are usually 'working' (principal and subsidiary status taken together)
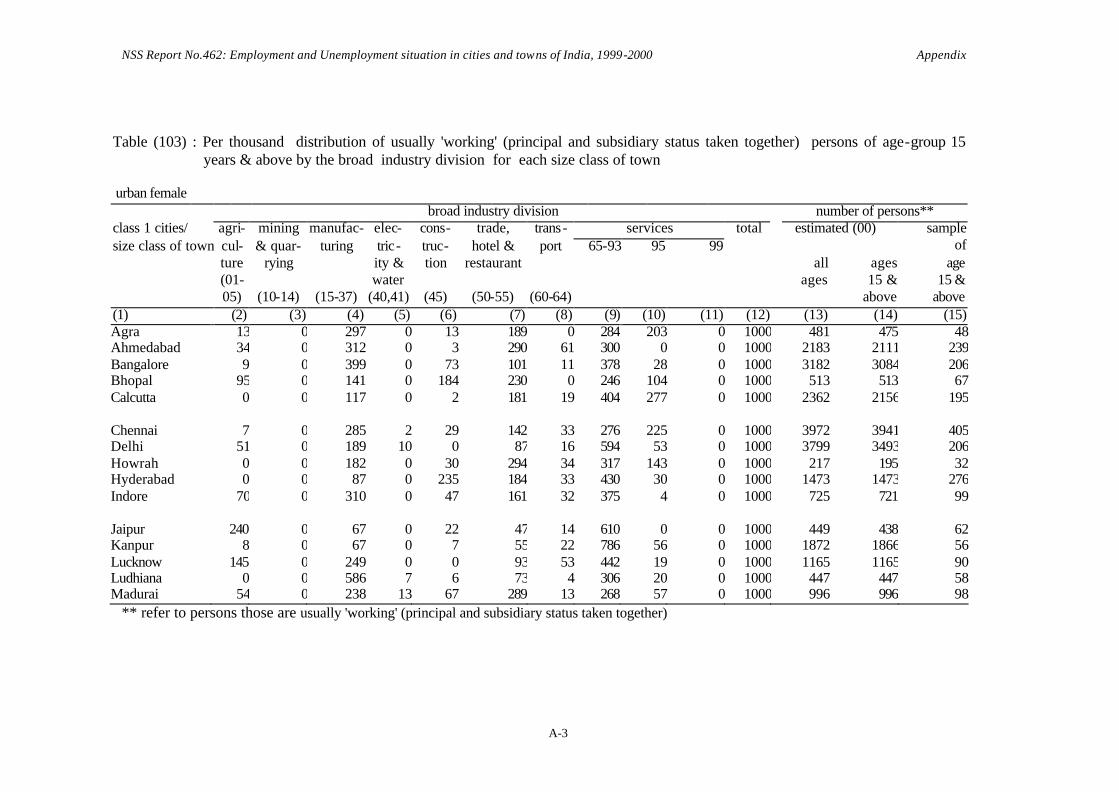
NSS Report No.462: Employment and Unemployment situation in cities and towns of India, 1999-2000 Appendix
A-3
Table (103) : Per thousand distribution of usually 'working' (principal and subsidiary status taken together) persons of age-group 15
years & above by the broad industry division for each size class of town
urban female broad industry division number of persons** class 1 cities/ agri- mining manufac- elec- cons- trade, trans- services total size class of town cul- & quar- turing tric- truc- hotel & port 65-93 95 99
estimated (00) sample of
ture rying ity & tion restaurant all ages age (01- water ages 15 & 15 & 05) (10-14) (15-37) (40,41) (45) (50-55) (60-64) above above
(1) (2) (3) (4) (5) (6) (7) (8) (9) (10) (11) (12) (13) (14) (15) Agra 13 0 297 0 13 189 0 284 203 0 1000 481 475 48Ahmedabad 34 0 312 0 3 290 61 300 0 0 1000 2183 2111 239Bangalore 9 0 399 0 73 101 11 378 28 0 1000 3182 3084 206Bhopal 95 0 141 0 184 230 0 246 104 0 1000 513 513 67Calcutta 0 0 117 0 2 181 19 404 277 0 1000 2362 2156 195 Chennai 7 0 285 2 29 142 33 276 225 0 1000 3972 3941 405Delhi 51 0 189 10 0 87 16 594 53 0 1000 3799 3493 206Howrah 0 0 182 0 30 294 34 317 143 0 1000 217 195 32Hyderabad 0 0 87 0 235 184 33 430 30 0 1000 1473 1473 276Indore 70 0 310 0 47 161 32 375 4 0 1000 725 721 99 Jaipur 240 0 67 0 22 47 14 610 0 0 1000 449 438 62Kanpur 8 0 67 0 7 55 22 786 56 0 1000 1872 1866 56Lucknow 145 0 249 0 0 93 53 442 19 0 1000 1165 1165 90Ludhiana 0 0 586 7 6 73 4 306 20 0 1000 447 447 58Madurai 54 0 238 13 67 289 13 268 57 0 1000 996 996 98
** refer to persons those are usually 'working' (principal and subsidiary status taken together)
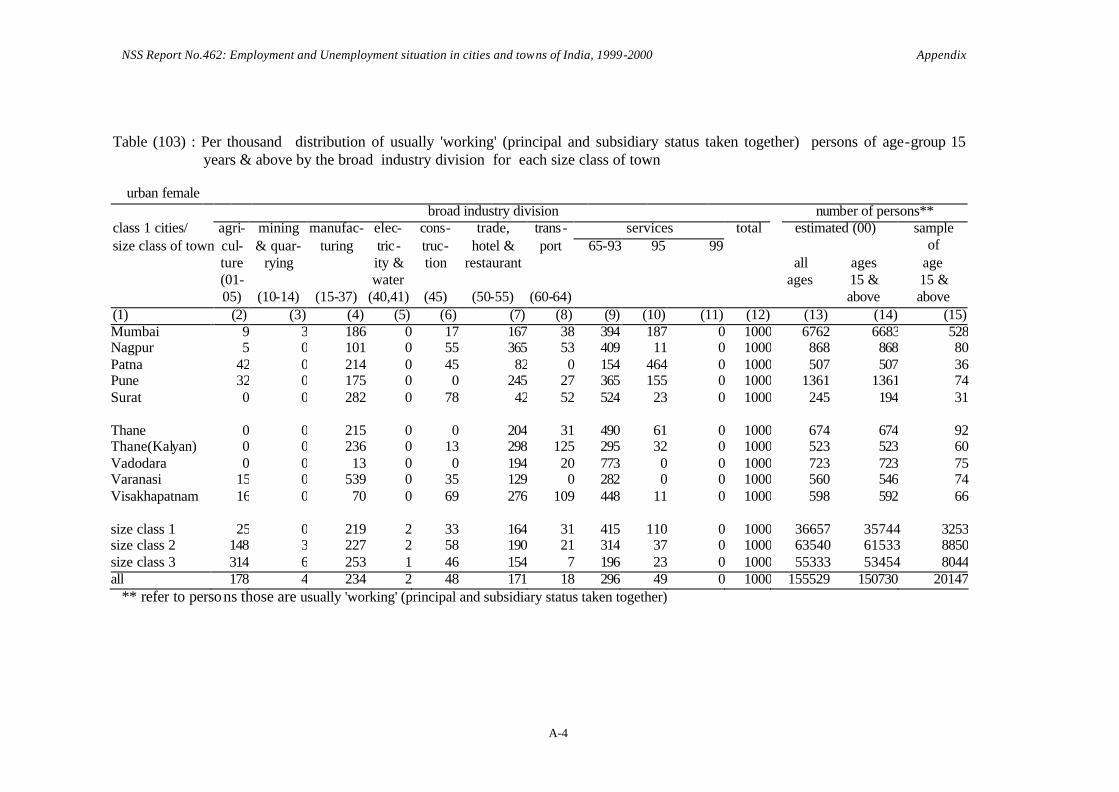
NSS Report No.462: Employment and Unemployment situation in cities and towns of India, 1999-2000 Appendix
A-4
Table (103) : Per thousand distribution of usually 'working' (principal and subsidiary status taken together) persons of age-group 15
years & above by the broad industry division for each size class of town
urban female broad industry division number of persons** class 1 cities/ agri- mining manufac- elec- cons- trade, trans- services total size class of town cul- & quar- turing tric- truc- hotel & port 65-93 95 99
estimated (00) sample of
ture rying ity & tion restaurant all ages age (01- water ages 15 & 15 & 05) (10-14) (15-37) (40,41) (45) (50-55) (60-64) above above
(1) (2) (3) (4) (5) (6) (7) (8) (9) (10) (11) (12) (13) (14) (15) Mumbai 9 3 186 0 17 167 38 394 187 0 1000 6762 6683 528Nagpur 5 0 101 0 55 365 53 409 11 0 1000 868 868 80Patna 42 0 214 0 45 82 0 154 464 0 1000 507 507 36Pune 32 0 175 0 0 245 27 365 155 0 1000 1361 1361 74Surat 0 0 282 0 78 42 52 524 23 0 1000 245 194 31 Thane 0 0 215 0 0 204 31 490 61 0 1000 674 674 92Thane(Kalyan) 0 0 236 0 13 298 125 295 32 0 1000 523 523 60Vadodara 0 0 13 0 0 194 20 773 0 0 1000 723 723 75Varanasi 15 0 539 0 35 129 0 282 0 0 1000 560 546 74Visakhapatnam 16 0 70 0 69 276 109 448 11 0 1000 598 592 66 size class 1 25 0 219 2 33 164 31 415 110 0 1000 36657 35744 3253size class 2 148 3 227 2 58 190 21 314 37 0 1000 63540 61533 8850size class 3 314 6 253 1 46 154 7 196 23 0 1000 55333 53454 8044all 178 4 234 2 48 171 18 296 49 0 1000 155529 150730 20147
** refer to persons those are usually 'working' (principal and subsidiary status taken together)

NSS Report No.462: Employment and Unemployment situation in cities and towns of India, 1999-2000 Appendix
A-5
Table (103) : Per thousand distribution of usually 'working' (principal and subsidiary status taken together) persons of age-group 15
years & above by the broad industry division for each size class of town
urban persons broad industry division number of persons** class 1 cities/ agri- mining manufac- elec- cons- trade, trans- services total size class of town cul- & quar- turing tric- truc- hotel & port 65-93 95 99
estimated (00) sample of
ture rying ity & tion restaurant all ages age (01- water ages 15 & 15 & 05) (10-14) (15-37) (40,41) (45) (50-55) (60-64) above above
(1) (2) (3) (4) (5) (6) (7) (8) (9) (10) (11) (12) (13) (14) (15) Agra 4 0 447 17 31 279 49 149 24 0 1000 4029 3968 439Ahmedabad 17 4 321 0 62 333 96 163 3 0 1000 11378 11299 1285Bangalore 11 0 323 4 114 203 73 265 7 0 1000 12764 12574 972Bhopal 38 0 131 0 168 281 152 211 20 0 1000 3234 3191 374Calcutta 3 1 217 4 41 283 132 245 73 0 1000 12674 12401 1483 Chennai 9 0 259 4 85 219 119 220 84 0 1000 16733 16578 1835Delhi 12 0 244 4 37 297 64 302 36 3 1000 24822 24332 1651Howrah 0 0 389 15 14 314 80 174 15 0 1000 2709 2687 339Hyderabad 4 1 118 7 149 298 123 288 12 0 1000 8584 8495 1775Indore 78 2 252 5 63 232 91 276 1 0 1000 3542 3533 428 Jaipur 32 0 191 5 58 191 53 451 18 0 1000 4125 4102 578Kanpur 3 0 279 1 24 286 126 262 19 0 1000 12030 11804 655Lucknow 49 0 141 4 46 313 126 311 11 0 1000 8038 7914 571Ludhiana 1 0 495 2 53 215 98 121 14 0 1000 4592 4566 727Madurai 26 0 231 4 65 302 132 224 16 0 1000 3706 3618 420
** refer to persons those are usually 'working' (principal and subsidiary status taken together)
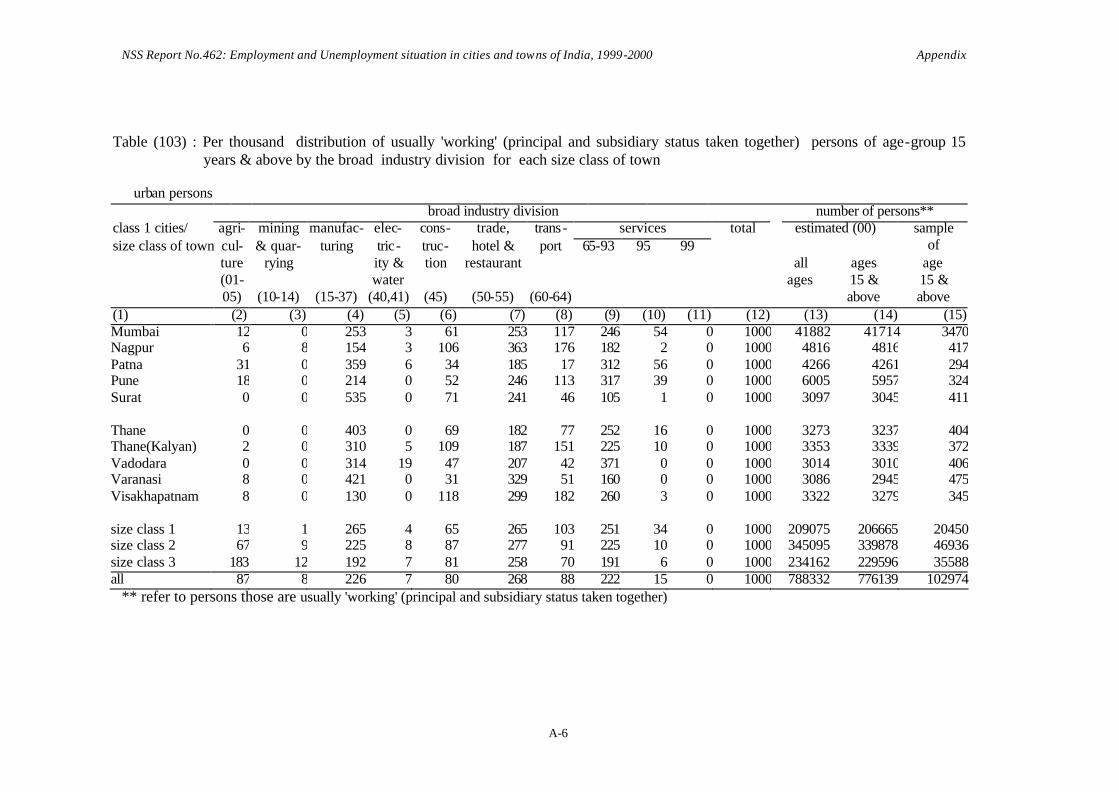
NSS Report No.462: Employment and Unemployment situation in cities and towns of India, 1999-2000 Appendix
A-6
Table (103) : Per thousand distribution of usually 'working' (principal and subsidiary status taken together) persons of age-group 15
years & above by the broad industry division for each size class of town
urban persons broad industry division number of persons** class 1 cities/ agri- mining manufac- elec- cons- trade, trans- services total size class of town cul- & quar- turing tric- truc- hotel & port 65-93 95 99
estimated (00) sample of
ture rying ity & tion restaurant all ages age (01- water ages 15 & 15 & 05) (10-14) (15-37) (40,41) (45) (50-55) (60-64) above above
(1) (2) (3) (4) (5) (6) (7) (8) (9) (10) (11) (12) (13) (14) (15) Mumbai 12 0 253 3 61 253 117 246 54 0 1000 41882 41714 3470Nagpur 6 8 154 3 106 363 176 182 2 0 1000 4816 4816 417Patna 31 0 359 6 34 185 17 312 56 0 1000 4266 4261 294Pune 18 0 214 0 52 246 113 317 39 0 1000 6005 5957 324Surat 0 0 535 0 71 241 46 105 1 0 1000 3097 3045 411 Thane 0 0 403 0 69 182 77 252 16 0 1000 3273 3237 404Thane(Kalyan) 2 0 310 5 109 187 151 225 10 0 1000 3353 3339 372Vadodara 0 0 314 19 47 207 42 371 0 0 1000 3014 3010 406Varanasi 8 0 421 0 31 329 51 160 0 0 1000 3086 2945 475Visakhapatnam 8 0 130 0 118 299 182 260 3 0 1000 3322 3279 345 size class 1 13 1 265 4 65 265 103 251 34 0 1000 209075 206665 20450size class 2 67 9 225 8 87 277 91 225 10 0 1000 345095 339878 46936size class 3 183 12 192 7 81 258 70 191 6 0 1000 234162 229596 35588all 87 8 226 7 80 268 88 222 15 0 1000 788332 776139 102974
** refer to persons those are usually 'working' (principal and subsidiary status taken together)

NSS Report No.462: Employment and Unemployment situation in cities and towns of India, 1999-2000 Appendix
A-7
Table (104): Per thousand distribution of persons of age 15 years and above by broad usual activity status taking also into consideration the subsidiary economic status of persons categorised 'not working' in the principal status for each size class of town
age 15 yrs. and above urban male
working unem- not in total number of persons class 1 city self- regular casual total ployed labour estimated (00) sample employed emplo- labour force all ages (of age
yees ages 15 & above 15 & above) (1) (2) (3) (4) (5) (6) (7) (8) (9) (10) (11) Agra 347 227 232 806 16 178 1000 7631 4332 487Ahmedabad 287 264 226 777 8 214 1000 16917 11819 1301Bangalore 203 435 109 747 22 231 1000 16504 12697 1015Bhopal 272 328 123 722 29 249 1000 5845 3707 426Calcutta 346 317 117 780 29 192 1000 16324 13140 1650Chennai 224 375 164 764 36 200 1000 22846 16544 1852Delhi 323 401 19 743 18 239 1000 39603 28054 1982Howrah 324 384 52 760 82 158 1000 4264 3278 416Hyderabad 244 340 99 682 47 271 1000 15291 10293 2216Indore 326 315 120 761 53 186 1000 5242 3695 440Jaipur 270 390 41 701 24 274 1000 7045 5224 710Kanpur 277 323 99 699 68 233 1000 21832 14214 744Lucknow 355 277 141 772 34 194 1000 13310 8738 661Ludhiana 294 418 129 841 8 151 1000 6776 4897 805Madurai 290 308 136 734 11 256 1000 5326 3575 410Mumbai 220 511 23 753 55 192 1000 62345 46528 3946Nagpur 264 276 157 697 37 266 1000 7464 5667 485Patna 353 271 43 667 54 279 1000 9023 5627 455Pune 335 340 52 726 19 254 1000 9048 6327 358Surat 340 227 199 765 10 225 1000 5271 3727 500Thane 193 458 88 740 39 221 1000 4561 3465 432Thane(Kalyan) 201 464 50 715 58 227 1000 5446 3941 439Vadodara 162 461 113 736 35 229 1000 4169 3107 454Varanasi 531 191 36 758 56 186 1000 4954 3165 522Visakhapatnam 171 354 213 738 44 218 1000 5243 3641 392

NSS Report No.462: Employment and Unemployment situation in cities and towns of India, 1999-2000 Appendix
A-8
Table (104): Per thousand distribution of persons of age 15 years and above by broad usual activity status taking also into consideration the subsidiary economic status of persons categorised 'not working' in the principal status for each size class of town
age 15 yrs. and above urban female
working unem- not in total number of persons class 1 city self- regular casual total ployed labour estimated (00) sample employed emplo- labour force all ages (of age
yees ages 15 & above 15 & above) (1) (2) (3) (4) (5) (6) (7) (8) (9) (10) (11) Agra 49 54 3 106 0 894 1000 7182 4482 483Ahmedabad 128 46 30 204 2 794 1000 14353 10338 1191Bangalore 58 136 39 232 20 749 1000 17611 13298 990Bhopal 71 42 39 151 7 842 1000 5573 3386 399Calcutta 56 102 28 187 14 800 1000 15563 11556 1308Chennai 71 161 29 260 11 729 1000 20569 15172 1675Delhi 46 95 6 147 5 848 1000 33732 23761 1633Howrah 24 34 9 67 11 923 1000 3719 2922 405Hyderabad 34 61 60 155 6 840 1000 13863 9515 2037Indore 66 104 29 199 0 801 1000 5447 3628 423Jaipur 41 59 8 108 2 890 1000 5782 4037 590Kanpur 79 72 4 154 1 844 1000 20507 12084 647Lucknow 102 20 27 149 13 838 1000 12810 7790 583Ludhiana 9 120 10 139 2 858 1000 4646 3206 583Madurai 117 122 53 291 35 674 1000 4438 3422 407Mumbai 45 120 9 174 23 803 1000 53366 38367 3197Nagpur 59 49 45 154 4 842 1000 7818 5653 484Patna 28 52 9 89 19 891 1000 8180 5673 365Pune 97 108 15 220 7 773 1000 8641 6202 345Surat 3 23 29 55 0 945 1000 4911 3510 483Thane 122 113 8 244 41 715 1000 4023 2766 359Thane(Kalyan) 70 75 23 167 16 817 1000 4552 3121 359Vadodara 68 57 121 246 12 742 1000 3615 2939 438Varanasi 146 43 11 200 3 796 1000 4349 2729 429Visakhapatnam 91 59 14 163 29 807 1000 4837 3625 392
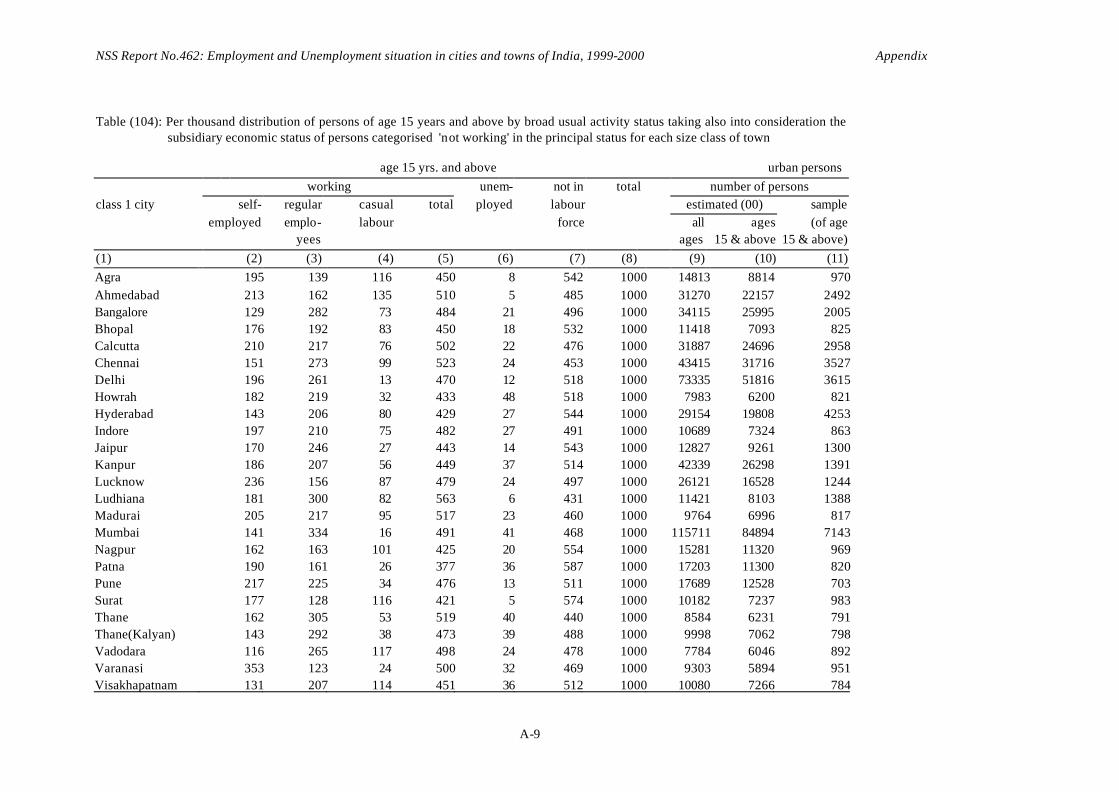
NSS Report No.462: Employment and Unemployment situation in cities and towns of India, 1999-2000 Appendix
A-9
Table (104): Per thousand distribution of persons of age 15 years and above by broad usual activity status taking also into consideration the
subsidiary economic status of persons categorised 'not working' in the principal status for each size class of town
age 15 yrs. and above urban persons working unem- not in total number of persons
class 1 city self- regular casual total ployed labour estimated (00) sample employed emplo- labour force all ages (of age
yees ages 15 & above 15 & above) (1) (2) (3) (4) (5) (6) (7) (8) (9) (10) (11) Agra 195 139 116 450 8 542 1000 14813 8814 970Ahmedabad 213 162 135 510 5 485 1000 31270 22157 2492Bangalore 129 282 73 484 21 496 1000 34115 25995 2005Bhopal 176 192 83 450 18 532 1000 11418 7093 825Calcutta 210 217 76 502 22 476 1000 31887 24696 2958Chennai 151 273 99 523 24 453 1000 43415 31716 3527Delhi 196 261 13 470 12 518 1000 73335 51816 3615Howrah 182 219 32 433 48 518 1000 7983 6200 821Hyderabad 143 206 80 429 27 544 1000 29154 19808 4253Indore 197 210 75 482 27 491 1000 10689 7324 863Jaipur 170 246 27 443 14 543 1000 12827 9261 1300Kanpur 186 207 56 449 37 514 1000 42339 26298 1391Lucknow 236 156 87 479 24 497 1000 26121 16528 1244Ludhiana 181 300 82 563 6 431 1000 11421 8103 1388Madurai 205 217 95 517 23 460 1000 9764 6996 817Mumbai 141 334 16 491 41 468 1000 115711 84894 7143Nagpur 162 163 101 425 20 554 1000 15281 11320 969Patna 190 161 26 377 36 587 1000 17203 11300 820Pune 217 225 34 476 13 511 1000 17689 12528 703Surat 177 128 116 421 5 574 1000 10182 7237 983Thane 162 305 53 519 40 440 1000 8584 6231 791Thane(Kalyan) 143 292 38 473 39 488 1000 9998 7062 798Vadodara 116 265 117 498 24 478 1000 7784 6046 892Varanasi 353 123 24 500 32 469 1000 9303 5894 951Visakhapatnam 131 207 114 451 36 512 1000 10080 7266 784

NSS Report No.462: Employment and Unemployment situation in cities and towns of India, 1999-2000 Appendix
A-10
Table (104): Per thousand distribution of persons of age 15 years and above by broad usual activity status taking also into consideration the subsidiary economic status of persons categorised 'not working' in the principal status for each size class of town
age 15 yrs. and above urban male working unem- not in total no. of person days
state/all-India size class self-emp. regular casual total ployed labour estimated (00) sample of town employees labour force all ages (of age ages 15 &
above 15 &
above) (1) (2) (3) (4) (5) (6) (7) (8) (9) (10) (11) (12) Andhra Pradesh size class 1 225 344 128 697 46 257 1000 20534 13935 2608
size class 2 270 331 158 759 26 215 1000 67331 44753 3603size class 3 317 241 207 765 30 204 1000 22128 14720 1726all 271 316 162 748 31 221 1000 109993 73408 7937
Arunachal Pradesh size class 1 0 0 0 0 0 0 0 0 0 0size class 2 0 0 0 0 0 0 0 0 0 0size class 3 148 407 130 684 11 304 1000 347 202 330all 148 407 130 684 11 304 1000 347 202 330
Assam size class 1 0 0 0 0 0 0 0 0 0 0size class 2 282 356 73 711 47 242 1000 5904 4370 857size class 3 414 244 82 740 72 188 1000 7634 5240 1003all 354 295 78 727 61 212 1000 13538 9610 1860
Bihar size class 1 353 271 43 667 54 279 1000 9023 5627 455size class 2 347 221 99 667 62 271 1000 34490 21016 2879size class 3 438 195 141 774 47 179 1000 21270 12761 2004all 377 220 105 702 56 243 1000 64784 39403 5338
Goa size class 1 0 0 0 0 0 0 0 0 0 0size class 2 179 325 153 657 173 170 1000 1588 1267 225size class 3 121 363 147 632 47 321 1000 1707 1281 414all 150 345 150 644 110 246 1000 3295 2548 639

NSS Report No.462: Employment and Unemployment situation in cities and towns of India, 1999-2000 Appendix
A-11
Table (104): Per thousand distribution of persons of age 15 years and above by broad usual activity status taking also into consideration the subsidiary economic status of persons categorised 'not working' in the principal status for each size class of town
age 15 yrs. and above urban male working unem- not in total no. of person days
State/all-India size class self-emp. regular casual total ployed labour estimated (00) sample of town employees labour force all ages age (of age 15 &
above 15 &
above) (1) (2) (3) (4) (5) (6) (7) (8) (9) (10) (11) (12) Gujarat size class 1 277 289 202 768 13 219 1000 26356 18652 2255
size class 2 309 293 180 782 17 200 1000 27362 18514 2468size class 3 382 248 149 780 18 202 1000 20637 13843 1788all 317 280 180 776 16 208 1000 74356 51010 6511
Haryana size class 1 0 0 0 0 0 0 0 0 0 0size class 2 297 377 68 742 16 241 1000 20212 14266 1355size class 3 374 201 152 727 33 240 1000 8285 5072 453all 318 331 90 738 21 241 1000 28497 19338 1808
Himachal Pradesh size class 1 0 0 0 0 0 0 0 0 0 0size class 2 138 446 54 638 107 255 1000 612 436 784size class 3 262 356 90 708 27 265 1000 1980 1424 1074all 233 377 82 691 46 262 1000 2591 1860 1858
Jammu & Kashmir size class 1 0 0 0 0 0 0 0 0 0 0size class 2 329 297 55 680 40 280 1000 4419 2999 1473size class 3 382 281 109 773 23 204 1000 3234 2072 982all 351 290 77 718 33 249 1000 7653 5071 2455
Karnataka size class 1 203 435 109 747 22 231 1000 16504 12697 1015size class 2 307 293 150 750 16 234 1000 27724 19452 2688size class 3 341 254 187 783 34 183 1000 23410 15640 1845all 291 318 151 760 23 217 1000 67638 47789 5548

NSS Report No.462: Employment and Unemployment situation in cities and towns of India, 1999-2000 Appendix
A-12
Table (104): Per thousand distribution of persons of age 15 years and above by broad usual activity status taking also into consideration the subsidiary economic status of persons categorised 'not working' in the principal status for each size class of town
age 15 yrs. and above urban male
working unem- not in total no. of person days state/all-India size class self-emp. regular casual total ployed labour estimated (00) sample of town employees labour force all ages age (of age 15 &
above 15 &
above) (1) (2) (3) (4) (5) (6) (7) (8) (9) (10) (11) (12) Kerala size class 1 0 0 0 0 0 0 0 0 0 0
size class 2 262 253 235 749 40 211 1000 15510 11707 2008size class 3 298 173 280 750 48 202 1000 18417 13527 2420all 281 210 259 750 44 206 1000 33927 25234 4428
Madhya Pradesh size class 1 299 321 121 742 41 217 1000 11088 7402 866size class 2 330 297 110 737 30 233 1000 36471 23658 3766size class 3 358 251 154 763 32 206 1000 42585 27133 3062all 339 279 132 750 32 218 1000 90144 58193 7694
Maharastra size class 1 232 468 42 743 50 208 1000 88864 65928 5660size class 2 243 366 149 757 40 203 1000 66321 44664 4702size class 3 328 273 171 771 36 192 1000 26823 17488 1968all 249 406 97 752 44 204 1000 182008 128080 12330
Manipur size class 1 0 0 0 0 0 0 0 0 0 0size class 2 248 268 56 571 91 337 1000 987 696 777size class 3 440 200 92 732 10 258 1000 1166 762 880all 348 232 75 655 49 296 1000 2153 1458 1657
Meghalaya size class 1 0 0 0 0 0 0 0 0 0 0size class 2 170 335 70 575 44 381 1000 503 355 370size class 3 155 355 153 663 8 330 1000 925 540 340all 161 347 120 628 22 350 1000 1428 895 710

NSS Report No.462: Employment and Unemployment situation in cities and towns of India, 1999-2000 Appendix
A-13
Table (104): Per thousand distribution of persons of age 15 years and above by broad usual activity status taking also into consideration the subsidiary economic status of persons categorised 'not working' in the principal status for each size class of town
age 15 yrs. and above urban male
working unem- not in total no. of person days state/all-India size class self-emp. regular casual total ployed labour estimated (00) sample of town employees labour force all ages age (of age 15 &
above 15 &
above) (1) (2) (3) (4) (5) (6) (7) (8) (9) (10) (11) (12) Mizoram size class 1 0 0 0 0 0 0 0 0 0 0
size class 2 196 349 132 678 12 310 1000 514 334 814size class 3 397 214 117 727 36 236 1000 521 359 1051all 300 279 124 704 25 272 1000 1035 693 1865
Nagaland size class 1 0 0 0 0 0 0 0 0 0 0size class 2 82 443 23 547 74 378 1000 693 486 349size class 3 199 453 37 690 32 278 1000 376 218 184all 118 446 27 592 61 347 1000 1069 704 533
Orissa size class 1 0 0 0 0 0 0 0 0 0 0size class 2 277 303 129 709 52 239 1000 16002 10643 1238size class 3 314 260 130 704 56 241 1000 13592 9136 1042all 294 283 129 706 54 240 1000 29594 19779 2280
Punjab size class 1 294 418 129 841 8 151 1000 6776 4897 805size class 2 385 332 58 775 25 200 1000 20383 14273 2387size class 3 407 214 154 776 29 195 1000 10013 6428 1159all 373 319 96 788 23 189 1000 37172 25598 4351
Rajasthan size class 1 270 390 41 701 24 274 1000 7045 5224 710size class 2 323 307 119 749 20 231 1000 26769 17260 2532size class 3 394 252 95 741 18 241 1000 19516 12109 1568all 340 300 99 739 20 241 1000 53330 34594 4810

NSS Report No.462: Employment and Unemployment situation in cities and towns of India, 1999-2000 Appendix
A-14
Table (104): Per thousand distribution of persons of age 15 years and above by broad usual activity status taking also into consideration the subsidiary economic status of persons categorised 'not working' in the principal status for each size class of town
age 15 yrs. and above urban male
working unem- not in total no. of person days state/all-India size class self-emp. regular casual total ployed labour estimated (00) sample of town employees labour force all ages age (of age 15 &
above 15 &
above) (1) (2) (3) (4) (5) (6) (7) (8) (9) (10) (11) (12) Sikkim size class 1 0 0 0 0 0 0 0 0 0 0
size class 2 0 0 0 0 0 0 0 0 0 0size class 3 295 374 61 731 51 219 1000 214 151 610all 295 374 61 731 51 219 1000 214 151 610
Tamil Nadu size class 1 236 363 159 758 32 210 1000 28172 20119 2262size class 2 272 381 130 783 24 193 1000 43671 31995 3738size class 3 256 301 217 774 28 198 1000 33749 23926 2546all 258 351 165 774 27 199 1000 105592 76040 8546
Tripura size class 1 0 0 0 0 0 0 0 0 0 0size class 2 269 332 73 673 64 262 1000 796 635 442size class 3 207 359 136 702 20 278 1000 1283 852 805all 233 348 109 690 39 271 1000 2079 1487 1247
Uttar Pradesh size class 1 336 282 123 742 49 209 1000 47728 30450 2414size class 2 386 286 82 754 33 213 1000 71676 48064 5292size class 3 511 179 112 802 19 179 1000 54536 30646 3568all 407 255 102 764 34 202 1000 173941 109160 11274
West Bengal size class 1 341 330 104 776 39 185 1000 20588 16418 2066size class 2 308 296 121 725 72 203 1000 43587 32387 4002size class 3 340 270 158 768 46 186 1000 16433 11913 1633all 323 300 124 747 58 195 1000 80607 60718 7701

NSS Report No.462: Employment and Unemployment situation in cities and towns of India, 1999-2000 Appendix
A-15
Table (104): Per thousand distribution of persons of age 15 years and above by broad usual activity status taking als o into consideration the subsidiary economic status of persons categorised 'not working' in the principal status for each size class of town
age 15 yrs. and above urban male
working unem- not in total no. of person days state/all-India size class self-emp. regular casual total ployed labour estimated (00) sample of town employees labour force all ages age (of age 15 &
above 15 &
above) (1) (2) (3) (4) (5) (6) (7) (8) (9) (10) (11) (12) Andaman & size class 1 0 0 0 0 0 0 0 0 0 0Nicobar Is. size class 2 224 403 231 858 27 114 1000 405 297 400
size class 3 0 0 0 0 0 0 0 0 0 0all 224 403 231 858 27 114 1000 405 297 400
Chandigarh size class 1 0 0 0 0 0 0 0 0 0 0size class 2 262 443 36 741 30 229 1000 2954 2096 1492size class 3 366 471 81 918 2 80 1000 474 344 167all 277 447 42 766 26 208 1000 3428 2440 1659
Dadra & N. Haveli size class 1 0 0 0 0 0 0 0 0 0 0size class 2 0 0 0 0 0 0 0 0 0 0size class 3 272 467 108 847 11 143 1000 93 72 208all 272 467 108 847 11 143 1000 93 72 208
Daman & Diu size class 1 0 0 0 0 0 0 0 0 0 0size class 2 0 0 0 0 0 0 0 0 0 0size class 3 430 336 35 801 11 188 1000 267 183 467all 430 336 35 801 11 188 1000 267 183 467
Delhi size class 1 323 401 19 743 18 239 1000 39603 28054 1982size class 2 246 429 87 762 72 166 1000 7524 5006 425size class 3 288 393 49 730 0 270 1000 1857 1337 226all 310 405 30 745 25 230 1000 48984 34398 2633

NSS Report No.462: Employment and Unemployment situation in cities and towns of India, 1999-2000 Appendix
A-16
Table (104): Per thousand distribution of persons of age 15 years and above by broad usual activity status taking also into consideration the subsidiary economic status of persons categorised 'not working' in the principal status for each size class of town
age 15 yrs. and above urban male
working unem- not in total no. of person days state/all-India size class self-emp. regular casual total ployed labour estimated (00) sample of town employees labour force all ages age (of age 15 &
above 15 &
above) (1) (2) (3) (4) (5) (6) (7) (8) (9) (10) (11) (12) Lakshadweep size class 1 0 0 0 0 0 0 0 0 0 0
size class 2 0 0 0 0 0 0 0 0 0 0size class 3 259 317 161 737 49 214 1000 134 78 698all 259 317 161 737 49 214 1000 134 78 698
Pondicherry size class 1 0 0 0 0 0 0 0 0 0 0size class 2 222 329 214 766 22 212 1000 1782 1303 566size class 3 210 230 264 705 42 253 1000 462 350 207all 220 308 225 753 26 221 1000 2243 1653 773
all -India size class 1 274 380 91 745 37 218 1000 322280 229404 23098size class 2 304 318 124 746 36 218 1000 546189 372933 51632size class 3 363 243 161 766 32 201 1000 354070 229805 36428all 312 314 125 752 35 213 1000 1222540 832142 111158

NSS Report No.462: Employment and Unemployment situation in cities and towns of India, 1999-2000 Appendix
A-17
Table (104): Per thousand distribution of persons of age 15 years and above by broad usual activity status taking also into consideration the subsidiary economic
status of persons categorised 'not working' in the principal status for each size class of town
age 15 yrs. and above urban female working unem- not in total no. of person days
state/all-India size class self-emp. regular casual total ployed labour estimated (00) sample of town employees labour force all ages age (of age 15 &
above 15 &
above) (1) (2) (3) (4) (5) (6) (7) (8) (9) (10) (11) (12) Andhra Pradesh size class 1 49 60 48 157 12 831 1000 18699 13140 2429
size class 2 96 67 78 242 9 749 1000 64995 43927 3586size class 3 154 92 107 352 9 638 1000 21647 14854 1712all 100 71 79 249 10 741 1000 105342 71921 7727
Arunachal Pradesh size class 1 0 0 0 0 0 0 0 0 0 0size class 2 0 0 0 0 0 0 0 0 0 0size class 3 57 91 10 159 16 826 1000 276 172 291all 57 91 10 159 16 826 1000 276 172 291
Assam size class 1 0 0 0 0 0 0 0 0 0 0size class 2 32 98 38 167 17 816 1000 5459 4013 750size class 3 45 58 11 114 54 831 1000 6227 4351 842all 39 77 24 140 37 824 1000 11687 8363 1592
Bihar size class 1 28 52 9 89 19 891 1000 8180 5673 365size class 2 71 31 24 125 10 865 1000 29803 18208 2539size class 3 55 15 41 111 8 882 1000 18516 11406 1650all 59 29 27 115 11 875 1000 56499 35286 4554
Goa size class 1 0 0 0 0 0 0 0 0 0 0size class 2 57 36 16 109 79 812 1000 1532 1174 208size class 3 59 80 34 172 60 767 1000 1542 1154 394all 58 57 25 140 70 790 1000 3073 2328 602

NSS Report No.462: Employment and Unemployment situation in cities and towns of India, 1999-2000 Appendix
A-18
Table (104): Per thousand distribution of persons of age 15 years and above by broad usual activity status taking also into consideration the subsidiary economic status of persons categorised 'not working' in the principal status for each size class of town
age 15 yrs. and above urban female working unem- not in total no. of person days
state/all-India size class self-emp. regular casual total ployed labour estimated (00) sample of town employees labour force all ages age (of age 15 &
above 15 &
above) (1) (2) (3) (4) (5) (6) (7) (8) (9) (10) (11) (12)
Gujarat size class 1 91 43 46 180 3 816 1000 22879 16787 2112
size class 2 47 52 66 166 6 829 1000 26575 19251 2480size class 3 90 52 55 198 2 800 1000 18444 13337 1689all 74 49 56 179 4 817 1000 67899 49375 6281
Haryana size class 1 0 0 0 0 0 0 0 0 0 0size class 2 65 45 15 125 4 871 1000 17851 11662 1217size class 3 120 61 33 214 6 780 1000 7329 4701 422all 81 50 20 151 4 845 1000 25180 16363 1639
Himachal Pradesh size class 1 0 0 0 0 0 0 0 0 0 0size class 2 20 80 13 113 5 881 1000 502 363 632size class 3 121 75 10 207 19 774 1000 1910 1318 1000all 100 76 11 186 16 797 1000 2411 1682 1632
Jammu & Kashmir size class 1 0 0 0 0 0 0 0 0 0 0size class 2 28 37 9 74 11 915 1000 3914 2812 1330size class 3 48 38 26 111 5 883 1000 2969 1938 859all 36 37 16 89 9 902 1000 6883 4750 2189
Karnataka size class 1 58 136 39 232 20 749 1000 17611 13298 990size class 2 85 75 55 215 5 780 1000 25294 18246 2494size class 3 154 39 85 278 12 710 1000 21793 15286 1836all 100 80 60 240 11 748 1000 64698 46830 5320

NSS Report No.462: Employment and Unemployment situation in cities and towns of India, 1999-2000 Appendix
A-19
Table (104): Per thousand distribution of persons of age 15 years and above by broad usual activity status taking also into consideration the subsidiary economic status of persons categorised 'not working' in the principal status for each size class of town
age 15 yrs. and above urban female working unem- not in total no. of person days
state/all-India size class self-emp. regular casual total ployed labour estimated (00) sample of town employees labour force all ages age (of age 15 &
above 15 &
above) (1) (2) (3) (4) (5) (6) (7) (8) (9) (10) (11) (12)
Kerala size class 1 0 0 0 0 0 0 0 0 0 0
size class 2 110 98 32 240 84 676 1000 16554 12583 2186size class 3 156 74 57 286 53 661 1000 20492 15685 2803all 136 84 46 266 67 668 1000 37046 28268 4989
Madhya Pradesh size class 1 68 74 34 176 3 821 1000 11020 7014 822size class 2 90 32 47 169 3 827 1000 33483 22539 3578size class 3 122 26 89 237 2 760 1000 37568 24361 2779all 101 35 64 201 3 796 1000 82071 53915 7179
Maharastra size class 1 58 109 14 180 20 800 1000 78400 56109 4744size class 2 74 58 48 181 6 813 1000 58330 39462 4380size class 3 119 39 116 274 8 718 1000 25825 17138 1907all 73 81 41 195 13 792 1000 162556 112709 11031
Manipur size class 1 0 0 0 0 0 0 0 0 0 0size class 2 192 96 10 299 27 674 1000 962 718 792size class 3 258 24 15 297 12 691 1000 1126 764 908all 226 59 13 298 19 683 1000 2089 1482 1700
Meghalaya size class 1 0 0 0 0 0 0 0 0 0 0size class 2 53 190 33 275 20 705 1000 463 324 400size class 3 94 159 34 287 21 691 1000 929 620 378all 80 170 34 283 21 696 1000 1392 944 778

NSS Report No.462: Employment and Unemployment situation in cities and towns of India, 1999-2000 Appendix
A-20
Table (104): Per thousand distribution of persons of age 15 years and above by broad usual activity status taking also into consideration the subsidiary economic status of persons categorised 'not working' in the principal status for each size class of town
age 15 yrs. and above urban female working unem- not in total no. of person days
state/all-India size class self-emp. regular casual total ployed labour estimated (00) sample of town employees labour force all ages age (of age 15 &
above 15 &
above) (1) (2) (3) (4) (5) (6) (7) (8) (9) (10) (11) (12)
Mizoram size class 1 0 0 0 0 0 0 0 0 0 0
size class 2 159 105 64 328 15 657 1000 515 338 853size class 3 311 79 55 445 4 551 1000 563 378 1053all 240 91 59 390 9 601 1000 1078 717 1906
Nagaland size class 1 0 0 0 0 0 0 0 0 0 0size class 2 103 189 14 306 39 655 1000 599 377 285size class 3 97 213 0 310 10 680 1000 296 182 156all 101 197 10 307 30 663 1000 895 559 441
Orissa size class 1 0 0 0 0 0 0 0 0 0 0size class 2 86 39 41 166 8 825 1000 15004 10007 1103size class 3 107 52 102 260 16 724 1000 12189 8543 976all 95 45 69 210 12 779 1000 27192 18550 2079
Punjab size class 1 9 120 10 139 2 858 1000 4646 3206 583size class 2 63 75 13 152 5 843 1000 18417 13190 2180size class 3 157 57 13 227 2 771 1000 8795 6090 1019all 81 77 13 170 4 826 1000 31858 22486 3782
Rajasthan size class 1 41 59 8 108 2 890 1000 5782 4037 590size class 2 132 47 23 201 8 791 1000 23641 15223 2245size class 3 165 35 44 243 0 757 1000 17384 10762 1431all 132 44 28 204 4 792 1000 46806 30021 4266

NSS Report No.462: Employment and Unemployment situation in cities and towns of India, 1999-2000 Appendix
A-21
Table (104): Per thousand distribution of persons of age 15 years and above by broad usual activity status taking also into consideration the subsidiary economic status of persons categorised 'not working' in the principal status for each size class of town
age 15 yrs. and above urban female working unem- not in total no. of person days
state/all-India size class self-emp. regular casual total ployed labour estimated (00) sample of town employees labour force all ages age (of age 15 &
above 15 &
above) (1) (2) (3) (4) (5) (6) (7) (8) (9) (10) (11) (12)
Sikkim size class 1 0 0 0 0 0 0 0 0 0 0
size class 2 0 0 0 0 0 0 0 0 0 0size class 3 34 170 46 250 38 712 1000 177 117 445all 34 170 46 250 38 712 1000 177 117 445
Tamil Nadu size class 1 79 153 33 266 15 719 1000 25007 18594 2082size class 2 119 103 41 262 17 721 1000 41824 30796 3631size class 3 134 108 95 337 13 650 1000 34004 24842 2714all 114 117 57 288 15 697 1000 100836 74232 84274
Tripura size class 1 0 0 0 0 0 0 0 0 0 0size class 2 2 115 13 131 13 856 1000 782 578 414size class 3 23 47 15 86 7 908 1000 1100 736 752all 14 77 15 105 10 885 1000 1882 1314 1166
Uttar Pradesh size class 1 87 51 11 150 4 846 1000 44848 27085 2142size class 2 66 43 10 119 8 873 1000 62823 39868 4633size class 3 146 22 14 183 2 816 1000 46885 27629 3258all 96 39 12 146 5 849 1000 154555 94581 10033
West Bengal size class 1 49 89 24 162 13 824 1000 19282 14477 1713size class 2 50 47 23 120 20 860 1000 40308 29231 3584size class 3 129 51 29 208 11 781 1000 15760 10864 1500all 66 59 24 149 16 835 1000 75349 54572 6797

NSS Report No.462: Employment and Unemployment situation in cities and towns of India, 1999-2000 Appendix
A-22
Table (104): Per thousand distribution of persons of age 15 years and above by broad usual activity status taking also into consideration the subsidiary economic status of persons categorised 'not working' in the principal status for each size class of town
age 15 yrs. and above urban female working unem- not in total no. of person days
state/all-India size class self-emp. regular casual total ployed labour estimated (00) sample of town employees labour force all ages age (of age 15 &
above 15 &
above) (1) (2) (3) (4) (5) (6) (7) (8) (9) (10) (11) (12)
Andaman & size class 1 0 0 0 0 0 0 0 0 0 0Nicobar Is. size class 2 115 108 74 297 62 641 1000 393 272 365
size class 3 0 0 0 0 0 0 0 0 0 0all 115 108 74 297 62 641 1000 393 272 365
Chandigarh size class 1 0 0 0 0 0 0 0 0 0 0size class 2 32 156 10 198 26 776 1000 2759 2019 1361size class 3 78 32 0 110 0 890 1000 353 211 120all 37 144 9 189 23 787 1000 3112 2231 1481
Dadra & N. Haveli size class 1 0 0 0 0 0 0 0 0 0 0size class 2 0 0 0 0 0 0 0 0 0 0size class 3 82 42 41 165 0 835 1000 80 55 159all 82 42 41 165 0 835 1000 80 55 159
Daman & Diu size class 1 0 0 0 0 0 0 0 0 0 0size class 2 0 0 0 0 0 0 0 0 0 0size class 3 139 72 21 233 22 745 1000 244 184 478all 139 72 21 233 22 745 1000 244 184 478
Delhi size class 1 46 95 6 147 5 848 1000 33732 23761 1633size class 2 43 66 3 111 11 877 1000 7341 4526 381size class 3 55 45 48 147 0 853 1000 1289 902 156all 46 89 7 141 6 852 1000 42362 29189 2170

NSS Report No.462: Employment and Unemployment situation in cities and towns of India, 1999-2000 Appendix
A-23
Table (104): Per thousand distribution of persons of age 15 years and above by broad usual activity status taking also into consideration the subsidiary economic status of persons categorised 'not working' in the principal status for each size class of town
age 15 yrs. and above urban female working unem- not in total no. of person days
state/all-India size class self-emp. regular casual total ployed labour estimated (00) sample of town employees labour force all ages age (of age 15 &
above 15 &
above) (1) (2) (3) (4) (5) (6) (7) (8) (9) (10) (11) (12)
Lakshadweep size class 1 0 0 0 0 0 0 0 0 0 0
size class 2 0 0 0 0 0 0 0 0 0 0size class 3 193 71 7 271 62 667 1000 129 85 754all 193 71 7 271 62 667 1000 129 85 754
Pondicherry size class 1 0 0 0 0 0 0 0 0 0 0size class 2 70 104 79 253 11 736 1000 2010 1430 605size class 3 56 53 33 142 35 824 1000 471 365 220all 67 93 70 230 16 754 1000 2480 1795 825
all -India size class 1 62 92 22 176 12 812 1000 290085 203180 20205size class 2 80 60 39 179 12 808 1000 502132 343138 48212size class 3 128 52 64 244 12 744 1000 326313 219029 34661
all 89 66 42 197 12 791 1000 1118531 765347 103078
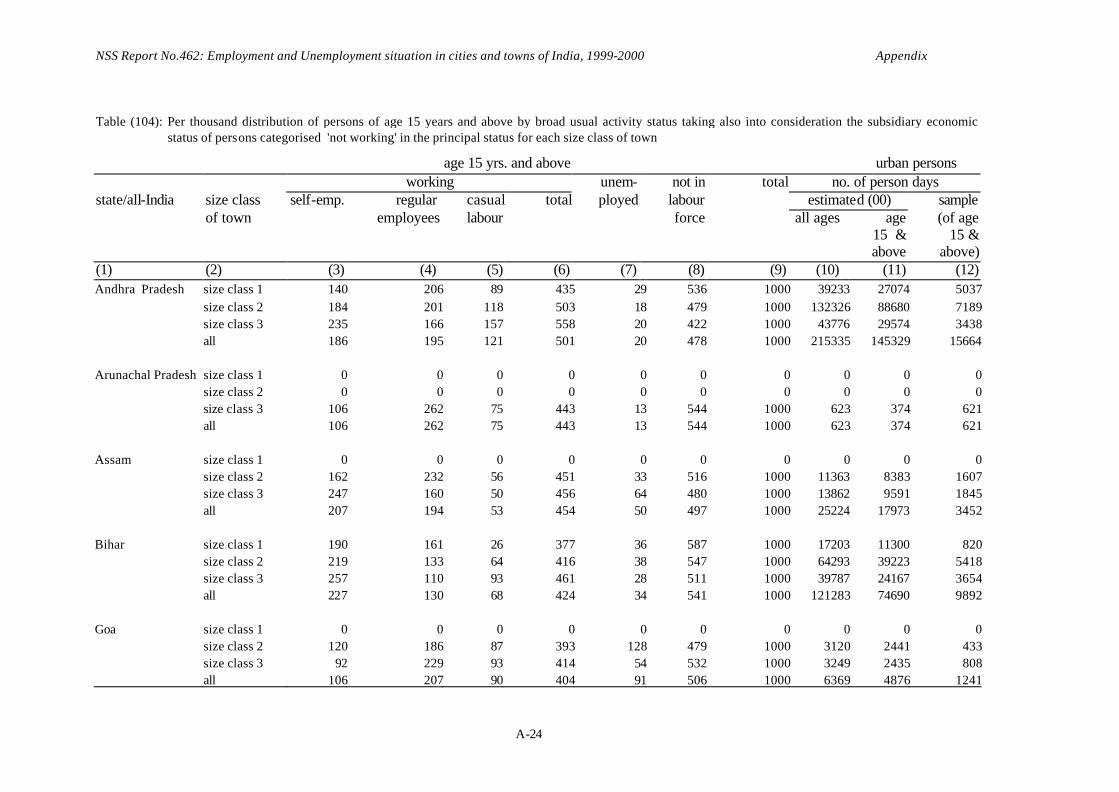
NSS Report No.462: Employment and Unemployment situation in cities and towns of India, 1999-2000 Appendix
A-24
Table (104): Per thousand distribution of persons of age 15 years and above by broad usual activity status taking also into consideration the subsidiary economic
status of persons categorised 'not working' in the principal status for each size class of town
age 15 yrs. and above urban persons working unem- not in total no. of person days
state/all-India size class self-emp. regular casual total ployed labour estimated (00) sample of town employees labour force all ages age (of age 15 &
above 15 &
above) (1) (2) (3) (4) (5) (6) (7) (8) (9) (10) (11) (12) Andhra Pradesh size class 1 140 206 89 435 29 536 1000 39233 27074 5037
size class 2 184 201 118 503 18 479 1000 132326 88680 7189size class 3 235 166 157 558 20 422 1000 43776 29574 3438all 186 195 121 501 20 478 1000 215335 145329 15664
Arunachal Pradesh size class 1 0 0 0 0 0 0 0 0 0 0size class 2 0 0 0 0 0 0 0 0 0 0size class 3 106 262 75 443 13 544 1000 623 374 621all 106 262 75 443 13 544 1000 623 374 621
Assam size class 1 0 0 0 0 0 0 0 0 0 0size class 2 162 232 56 451 33 516 1000 11363 8383 1607size class 3 247 160 50 456 64 480 1000 13862 9591 1845all 207 194 53 454 50 497 1000 25224 17973 3452
Bihar size class 1 190 161 26 377 36 587 1000 17203 11300 820size class 2 219 133 64 416 38 547 1000 64293 39223 5418size class 3 257 110 93 461 28 511 1000 39787 24167 3654all 227 130 68 424 34 541 1000 121283 74690 9892
Goa size class 1 0 0 0 0 0 0 0 0 0 0size class 2 120 186 87 393 128 479 1000 3120 2441 433size class 3 92 229 93 414 54 532 1000 3249 2435 808all 106 207 90 404 91 506 1000 6369 4876 1241

NSS Report No.462: Employment and Unemployment situation in cities and towns of India, 1999-2000 Appendix
A-25
Table (104): Per thousand distribution of persons of age 15 years and above by broad usual activity status taking also into consideration the subsidiary economic status of persons categorised 'not working' in the principal status for each size class of town
age 15 yrs. and above urban persons working unem- not in total no. of person days
state/all-India size class self-emp. regular casual total ployed labour estimated (00) sample of town employees labour force all ages age (of age 15 &
above 15 &
above) (1) (2) (3) (4) (5) (6) (7) (8) (9) (10) (11) (12)
Gujarat size class 1 189 173 128 490 8 502 1000 49236 35440 4367
size class 2 176 170 122 468 11 521 1000 53938 37766 4948size class 3 239 152 103 494 10 496 1000 39082 27180 3477all 197 166 119 483 10 507 1000 142255 100385 12792
Haryana size class 1 0 0 0 0 0 0 0 0 0 0size class 2 193 227 44 465 11 525 1000 38064 25928 2572size class 3 252 134 95 480 20 500 1000 15613 9773 875all 209 202 58 469 13 518 1000 53677 35701 3447
Himachal Pradesh size class 1 0 0 0 0 0 0 0 0 0 0size class 2 84 280 35 399 61 540 1000 1113 799 1416size class 3 194 221 52 467 23 510 1000 3889 2742 2074all 169 234 48 452 32 516 1000 5003 3541 3490
Jammu & Kashmir size class 1 0 0 0 0 0 0 0 0 0 0size class 2 183 171 33 387 26 587 1000 8333 5811 2803size class 3 221 164 69 453 14 532 1000 6203 4010 1841all 199 168 47 414 21 565 1000 14536 9821 4644
Karnataka size class 1 129 282 73 484 21 496 1000 34115 25995 2005size class 2 200 187 104 491 11 499 1000 53018 37698 5182size class 3 249 148 137 533 23 444 1000 45203 30925 3681all 196 200 106 503 17 480 1000 132336 94619 10868

NSS Report No.462: Employment and Unemployment situation in cities and towns of India, 1999-2000 Appendix
A-26
Table (104): Per thousand distribution of persons of age 15 years and above by broad usual activity status taking also into consideration the subsidiary economic status of persons categorised 'not working' in the principal status for each size class of town
age 15 yrs. and above urban persons working unem- not in total no. of person days
state/all-India size class self-emp. regular casual total ployed labour estimated (00) sample of town employees labour force all ages age (of age 15 &
above 15 &
above) (1) (2) (3) (4) (5) (6) (7) (8) (9) (10) (11) (12)
Kerala size class 1 0 0 0 0 0 0 0 0 0 0
size class 2 183 172 130 485 63 452 1000 32064 24290 4194size class 3 222 120 160 501 50 448 1000 38909 29213 5223all 204 144 146 494 56 450 1000 70973 53502 9417
Madhya Pradesh size class 1 187 201 79 466 23 511 1000 22107 14417 1688size class 2 213 168 79 460 17 523 1000 69954 46197 7344size class 3 246 145 123 514 18 468 1000 80153 51494 5841all 225 161 99 486 18 496 1000 172214 112107 14873
Maharastra size class 1 152 303 29 484 36 480 1000 167264 122037 10404size class 2 164 222 101 487 24 489 1000 124651 84126 9082size class 3 224 157 144 525 23 452 1000 52649 34625 3875all 166 254 71 491 30 479 1000 344564 240789 23361
Manipur size class 1 0 0 0 0 0 0 0 0 0 0size class 2 219 181 33 433 59 508 1000 1949 1414 1569size class 3 349 112 53 514 11 475 1000 2293 1526 1788all 287 145 43 475 34 491 1000 4242 2940 3357
Meghalaya size class 1 0 0 0 0 0 0 0 0 0 0size class 2 114 266 52 432 33 535 1000 966 678 770size class 3 122 250 90 462 15 523 1000 1854 1160 718all 119 256 76 451 22 528 1000 2820 1838 1488

NSS Report No.462: Employment and Unemployment situation in cities and towns of India, 1999-2000 Appendix
A-27
Table (104): Per thousand distribution of persons of age 15 years and above by broad usual activity status taking also into consideration the subsidiary economic status of persons categorised 'not working' in the principal status for each size class of town
age 15 yrs. and above urban persons working unem- not in total no. of person days
state/all-India size class self-emp. regular casual total ployed labour estimated (00) sample of town employees labour force all ages age (of age 15 &
above 15 &
above) (1) (2) (3) (4) (5) (6) (7) (8) (9) (10) (11) (12)
Mizoram size class 1 0 0 0 0 0 0 0 0 0 0
size class 2 178 226 98 502 13 485 1000 1030 673 1667size class 3 353 144 85 582 20 398 1000 1083 737 2104all 269 184 91 544 17 439 1000 2113 1409 3771
Nagaland size class 1 0 0 0 0 0 0 0 0 0 0size class 2 91 332 19 442 59 499 1000 1291 863 634size class 3 153 344 20 517 22 461 1000 673 399 340all 111 336 19 466 47 487 1000 1964 1262 974
Orissa size class 1 0 0 0 0 0 0 0 0 0 0size class 2 184 175 87 446 31 523 1000 31006 20649 2341size class 3 214 160 116 489 36 474 1000 25781 17679 2018all 198 168 100 466 33 501 1000 56786 38329 4359
Punjab size class 1 181 300 82 563 6 431 1000 11421 8103 1388size class 2 230 209 37 476 15 509 1000 38800 27463 4567size class 3 285 138 85 509 16 475 1000 18809 12518 2178all 236 206 57 499 14 487 1000 69030 48084 8133
Rajasthan size class 1 170 246 27 443 14 543 1000 12827 9261 1300size class 2 234 185 74 492 14 493 1000 50410 32483 4777size class 3 286 150 71 507 9 484 1000 36900 22871 2999all 243 181 66 490 13 497 1000 100136 64615 9076
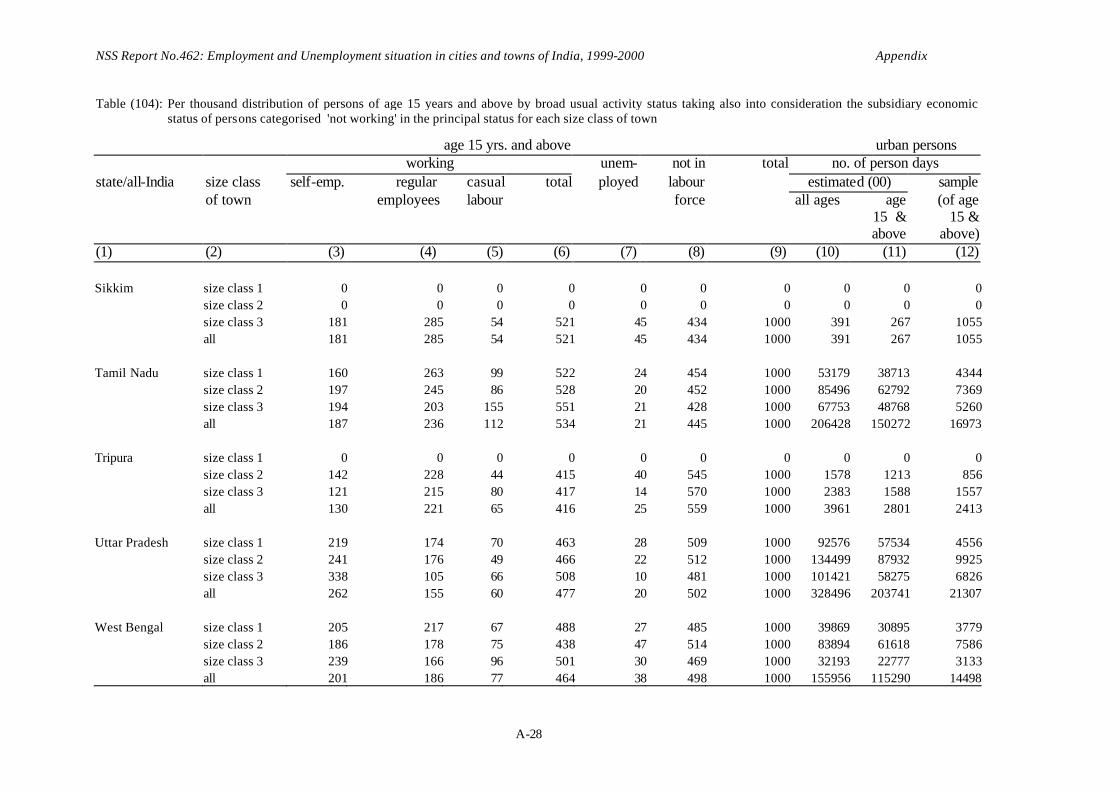
NSS Report No.462: Employment and Unemployment situation in cities and towns of India, 1999-2000 Appendix
A-28
Table (104): Per thousand distribution of persons of age 15 years and above by broad usual activity status taking also into consideration the subsidiary economic status of persons categorised 'not working' in the principal status for each size class of town
age 15 yrs. and above urban persons working unem- not in total no. of person days
state/all-India size class self-emp. regular casual total ployed labour estimated (00) sample of town employees labour force all ages age (of age 15 &
above 15 &
above) (1) (2) (3) (4) (5) (6) (7) (8) (9) (10) (11) (12)
Sikkim size class 1 0 0 0 0 0 0 0 0 0 0
size class 2 0 0 0 0 0 0 0 0 0 0size class 3 181 285 54 521 45 434 1000 391 267 1055all 181 285 54 521 45 434 1000 391 267 1055
Tamil Nadu size class 1 160 263 99 522 24 454 1000 53179 38713 4344size class 2 197 245 86 528 20 452 1000 85496 62792 7369size class 3 194 203 155 551 21 428 1000 67753 48768 5260all 187 236 112 534 21 445 1000 206428 150272 16973
Tripura size class 1 0 0 0 0 0 0 0 0 0 0size class 2 142 228 44 415 40 545 1000 1578 1213 856size class 3 121 215 80 417 14 570 1000 2383 1588 1557all 130 221 65 416 25 559 1000 3961 2801 2413
Uttar Pradesh size class 1 219 174 70 463 28 509 1000 92576 57534 4556size class 2 241 176 49 466 22 512 1000 134499 87932 9925size class 3 338 105 66 508 10 481 1000 101421 58275 6826all 262 155 60 477 20 502 1000 328496 203741 21307
West Bengal size class 1 205 217 67 488 27 485 1000 39869 30895 3779size class 2 186 178 75 438 47 514 1000 83894 61618 7586size class 3 239 166 96 501 30 469 1000 32193 22777 3133all 201 186 77 464 38 498 1000 155956 115290 14498
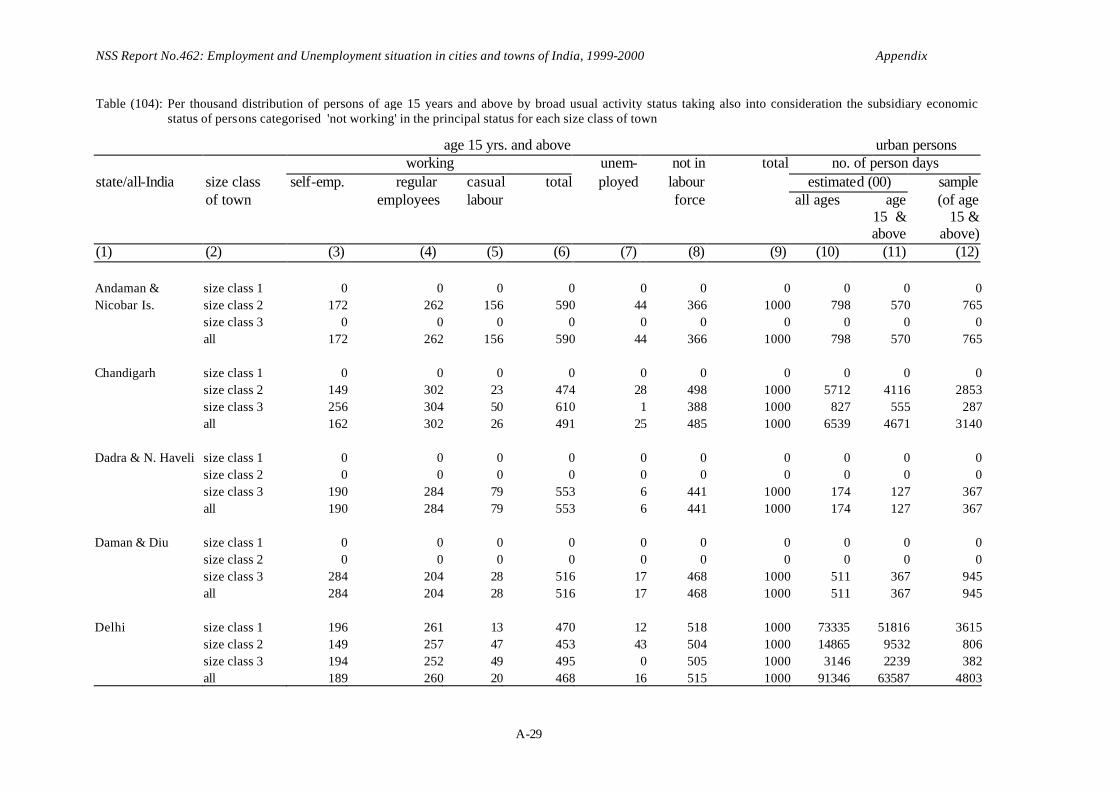
NSS Report No.462: Employment and Unemployment situation in cities and towns of India, 1999-2000 Appendix
A-29
Table (104): Per thousand distribution of persons of age 15 years and above by broad usual activity status taking also into consideration the subsidiary economic status of persons categorised 'not working' in the principal status for each size class of town
age 15 yrs. and above urban persons working unem- not in total no. of person days
state/all-India size class self-emp. regular casual total ployed labour estimated (00) sample of town employees labour force all ages age (of age 15 &
above 15 &
above) (1) (2) (3) (4) (5) (6) (7) (8) (9) (10) (11) (12)
Andaman & size class 1 0 0 0 0 0 0 0 0 0 0Nicobar Is. size class 2 172 262 156 590 44 366 1000 798 570 765
size class 3 0 0 0 0 0 0 0 0 0 0all 172 262 156 590 44 366 1000 798 570 765
Chandigarh size class 1 0 0 0 0 0 0 0 0 0 0size class 2 149 302 23 474 28 498 1000 5712 4116 2853size class 3 256 304 50 610 1 388 1000 827 555 287all 162 302 26 491 25 485 1000 6539 4671 3140
Dadra & N. Haveli size class 1 0 0 0 0 0 0 0 0 0 0size class 2 0 0 0 0 0 0 0 0 0 0size class 3 190 284 79 553 6 441 1000 174 127 367all 190 284 79 553 6 441 1000 174 127 367
Daman & Diu size class 1 0 0 0 0 0 0 0 0 0 0size class 2 0 0 0 0 0 0 0 0 0 0size class 3 284 204 28 516 17 468 1000 511 367 945all 284 204 28 516 17 468 1000 511 367 945
Delhi size class 1 196 261 13 470 12 518 1000 73335 51816 3615size class 2 149 257 47 453 43 504 1000 14865 9532 806size class 3 194 252 49 495 0 505 1000 3146 2239 382all 189 260 20 468 16 515 1000 91346 63587 4803

NSS Report No.462: Employment and Unemployment situation in cities and towns of India, 1999-2000 Appendix
A-30
Table (104): Per thousand distribution of persons of age 15 years and above by broad usual activity status taking also into consideration the subsidiary economic status of persons categorised 'not working' in the principal status for each size class of town
age 15 yrs. and above urban persons working unem- not in total no. of person days
state/all-India size class self-emp. regular casual total ployed labour estimated (00) sample of town employees labour force all ages age (of age 15 &
above 15 &
above) (1) (2) (3) (4) (5) (6) (7) (8) (9) (10) (11) (12)
Lakshadweep size class 1 0 0 0 0 0 0 0 0 0 0
size class 2 0 0 0 0 0 0 0 0 0 0size class 3 225 189 81 494 56 450 1000 262 163 1452all 225 189 81 494 56 450 1000 262 163 1452
Pondicherry size class 1 0 0 0 0 0 0 0 0 0 0size class 2 143 211 144 497 16 486 1000 3792 2732 1171size class 3 132 140 146 417 38 545 1000 932 715 427all 140 196 144 481 21 499 1000 4724 3447 1598
all -India size class 1 175 245 59 478 25 497 1000 612366 432584 43303size class 2 197 194 83 475 25 501 1000 1048322 716071 99844size class 3 248 150 114 512 22 466 1000 680383 448834 71089all 205 196 85 486 24 490 1000 2341070 1597489 214236

NSS Report No.462: Employment and Unemployment situation in cities and towns of India, 1999-2000 Appendix
A-31
Table (105) : Per thousand distribution of person-days of persons of age 15 years and above by broad current daily activity status for each size class
of town
age 15 yrs. and above urban male
working unem- not in total no. of person days class 1 city self- regular casual total ployed labour estimated (00) sample employed employees labour force all ages age 15 (of age15 & above & above)
(1) (2) (3) (4) (5) (6) (7) (8) (9) (10) (11) Agra 319 226 189 734 57 209 1000 53420 30326 3409Ahmedabad 283 255 197 736 20 243 1000 118418 82732 9107Bangalore 192 429 92 713 31 256 1000 115528 88882 7105Bhopal 276 318 75 668 71 261 1000 40917 25948 2982Calcutta 328 311 104 742 56 201 1000 114265 91980 11550Chennai 217 380 113 710 72 218 1000 159919 115809 12964Delhi 315 404 17 736 24 240 1000 277221 196381 13874Howrah 317 383 51 751 81 169 1000 29848 22948 2912Hydrabad 240 338 93 671 51 278 1000 107035 72053 15512Indore 307 311 107 725 67 208 1000 36696 25868 3080Jaipur 270 388 40 698 26 276 1000 49317 36568 4970Kanpur 272 323 97 692 74 234 1000 152827 99498 5208Lucknow 347 264 134 746 33 221 1000 93171 61166 4627Ludhiana 294 415 127 835 9 155 1000 47429 34282 5635Madurai 280 295 101 676 30 294 1000 37283 25022 2870Mumbai 215 499 19 734 68 199 1000 436417 325695 27622Nagpur 267 281 126 674 57 269 1000 52247 39671 3395Patna 347 271 44 663 52 286 1000 63161 39390 3185Pune 335 327 39 701 33 266 1000 63336 44286 2506Surat 341 225 181 748 16 236 1000 36895 26087 3500Thane 178 445 62 685 51 264 1000 31925 24255 3024Thane (Kalyan) 200 457 41 699 70 231 1000 38122 27589 3073Vadodara 171 440 104 715 42 243 1000 29182 21748 3178Varanasi 513 196 33 741 54 205 1000 34679 22156 3654Visakhapatnam 172 348 197 718 59 223 1000 36701 25489 2744

NSS Report No.462: Employment and Unemployment situation in cities and towns of India, 1999-2000 Appendix
A-32
Table (105) : Per thousand distribution of person-days of persons of age 15 years and above by broad current daily activity status for each size
class of town
age 15 yrs. and above urban female
working unem- not in total no. of person days class 1 city self- regular casual total ployed labour estimated (00) sample employed employees labour force all ages age 15 (of age15 & above & above) (1) (2) (3) (4) (5) (6) (7) (8) (9) (10) (11) Agra 42 49 2 93 1 907 1000 50271 31371 3381Ahmedabad 103 46 25 175 2 824 1000 100472 72366 8337Bangalore 50 134 32 215 20 765 1000 123274 93085 6930Bhopal 64 42 26 133 12 856 1000 39011 23703 2793Calcutta 46 88 20 154 19 827 1000 108941 80889 9156Chennai 56 152 23 231 11 758 1000 143983 106205 11725Delhi 30 94 3 127 6 867 1000 236125 166330 11431Howrah 19 31 9 60 10 931 1000 26032 20451 2835Hydrabad 32 59 53 144 10 845 1000 97040 66604 14259Indore 47 96 21 165 1 834 1000 38127 25397 2961Jaipur 17 59 7 83 2 915 1000 40472 28256 4130Kanpur 27 72 4 102 1 897 1000 143548 84590 4529Lucknow 59 22 20 100 13 887 1000 89673 54528 4081Ludhiana 7 120 10 137 2 861 1000 32520 22442 4081Madurai 80 114 26 221 29 751 1000 31067 23953 2849Mumbai 37 114 7 158 25 816 1000 373562 268566 22379Nagpur 57 50 42 149 6 846 1000 54723 39571 3388Patna 21 52 3 76 31 893 1000 57261 39708 2555Pune 101 106 15 222 7 770 1000 60489 43414 2415Surat 4 21 27 51 1 948 1000 34376 24572 3381Thane 60 111 8 180 29 792 1000 28160 19362 2513Thane (Kalyan) 39 73 9 122 18 860 1000 31865 21849 2513Vadodara 34 47 119 201 21 778 1000 25308 20572 3066Varanasi 96 47 9 152 3 845 1000 30441 19103 3003Visakhapatnam 80 58 11 149 39 813 1000 33856 25374 2744

NSS Report No.462: Employment and Unemployment situation in cities and towns of India, 1999-2000 Appendix
A-33
Table (105) : Per thousand distribution of person-days of persons of age 15 years and above by broad current daily activity status for each size
class of town
age 15 yrs. and above urban persons
working unem- not in total no. of person days class 1 city self- regular casual total ployed labour estimated (00) sample employed employees labour force all ages age 15 (of age15 & above & above) (1) (2) (3) (4) (5) (6) (7) (8) (9) (10) (11) Agra 178 136 94 408 28 564 1000 103691 61697 6790Ahmedabad 199 158 117 474 12 514 1000 218889 155097 17444Bangalore 119 278 62 459 25 516 1000 238803 181967 14035Bhopal 175 186 52 413 43 545 1000 79928 49651 5775Calcutta 196 206 64 467 39 494 1000 223206 172869 20706Chennai 140 271 70 481 43 476 1000 303903 222013 24689Delhi 185 262 11 457 15 528 1000 513346 362711 25305Howrah 177 217 31 425 47 528 1000 55880 43399 5747Hydrabad 140 204 74 418 32 550 1000 204075 138657 29771Indore 179 205 64 448 34 518 1000 74823 51265 6041Jaipur 160 245 26 430 15 555 1000 89789 64824 9100Kanpur 159 208 54 421 41 539 1000 296375 184088 9737Lucknow 211 150 80 441 24 535 1000 182844 115694 8708Ludhiana 180 298 81 559 6 434 1000 79949 56724 9716Madurai 182 207 64 453 29 517 1000 68351 48975 5719Mumbai 135 325 14 474 48 478 1000 809978 594261 50001Nagpur 162 166 84 412 32 557 1000 106969 79243 6783Patna 184 161 23 368 41 590 1000 120421 79098 5740Pune 219 218 27 464 20 515 1000 123826 87699 4921Surat 177 126 106 410 9 581 1000 71272 50659 6881Thane 125 297 38 461 41 498 1000 60085 43618 5537Thane (Kalyan) 129 287 27 444 47 509 1000 69988 49437 5586Vadodara 105 249 111 465 32 503 1000 54489 42320 6244Varanasi 320 127 22 468 31 501 1000 65121 41259 6657Visakhapatnam 126 203 104 434 49 517 1000 70557 50863 5488
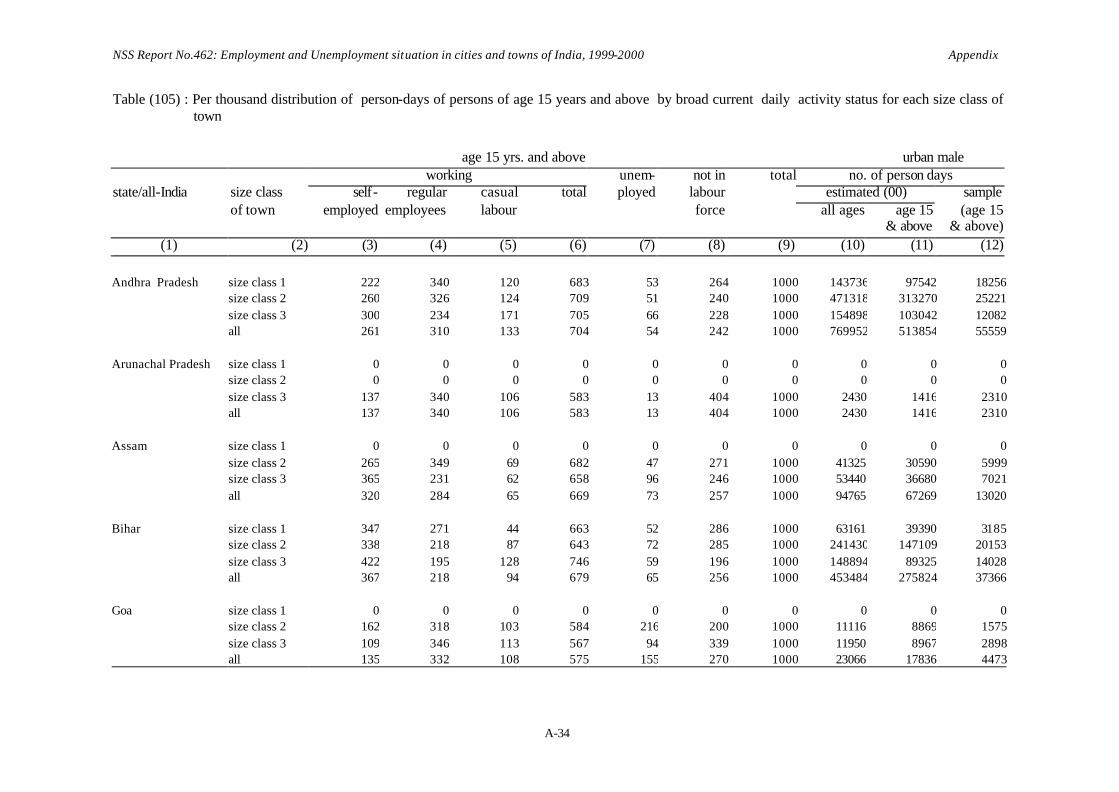
NSS Report No.462: Employment and Unemployment situation in cities and towns of India, 1999-2000 Appendix
A-34
Table (105) : Per thousand distribution of person-days of persons of age 15 years and above by broad current daily activity status for each size class of town
age 15 yrs. and above urban male
working unem- not in total no. of person days state/all-India size class self- regular casual total ployed labour estimated (00) sample of town employed employees labour force all ages age 15 (age 15 & above & above)
(1) (2) (3) (4) (5) (6) (7) (8) (9) (10) (11) (12) Andhra Pradesh size class 1 222 340 120 683 53 264 1000 143736 97542 18256
size class 2 260 326 124 709 51 240 1000 471318 313270 25221 size class 3 300 234 171 705 66 228 1000 154898 103042 12082 all 261 310 133 704 54 242 1000 769952 513854 55559
Arunachal Pradesh size class 1 0 0 0 0 0 0 0 0 0 0 size class 2 0 0 0 0 0 0 0 0 0 0 size class 3 137 340 106 583 13 404 1000 2430 1416 2310 all 137 340 106 583 13 404 1000 2430 1416 2310 Assam size class 1 0 0 0 0 0 0 0 0 0 0 size class 2 265 349 69 682 47 271 1000 41325 30590 5999 size class 3 365 231 62 658 96 246 1000 53440 36680 7021 all 320 284 65 669 73 257 1000 94765 67269 13020 Bihar size class 1 347 271 44 663 52 286 1000 63161 39390 3185 size class 2 338 218 87 643 72 285 1000 241430 147109 20153 size class 3 422 195 128 746 59 196 1000 148894 89325 14028 all 367 218 94 679 65 256 1000 453484 275824 37366 Goa size class 1 0 0 0 0 0 0 0 0 0 0 size class 2 162 318 103 584 216 200 1000 11116 8869 1575
size class 3 109 346 113 567 94 339 1000 11950 8967 2898 all 135 332 108 575 155 270 1000 23066 17836 4473

NSS Report No.462: Employment and Unemployment situation in cities and towns of India, 1999-2000 Appendix
A-35
Table (105) : Per thousand distribution of person-days of persons of age 15 years and above by broad current daily activity status for each size class of town
age 15 yrs. and above urban male
working unem- not in total no. of person days state/all-India size class self- regular casual total ployed labour estimated (00) sample of town employed employees labour force all ages age 15 (age 15 & above & above)
(1) (2) (3) (4) (5) (6) (7) (8) (9) (10) (11) (12) Gujarat size class 1 276 280 179 735 23 242 1000 184495 130566 15785
size class 2 298 287 149 735 31 234 1000 191536 129600 17276 size class 3 358 242 125 725 37 238 1000 144459 96902 12516 all 306 272 153 732 30 238 1000 520491 357068 45577
Haryana size class 1 0 0 0 0 0 0 0 0 0 0 size class 2 287 377 60 724 24 252 1000 141488 99860 9485 size class 3 357 196 119 672 60 268 1000 57992 35504 3171 all 305 330 76 710 33 256 1000 199479 135364 12656
Himachal Pradesh size class 1 0 0 0 0 0 0 0 0 0 0 size class 2 138 447 53 638 108 254 1000 4281 3051 5488 size class 3 258 357 84 700 35 265 1000 13858 9965 7518 all 230 378 77 685 52 263 1000 18138 13017 13006
Jammu & Kashmir size class 1 0 0 0 0 0 0 0 0 0 0 size class 2 320 298 46 664 47 289 1000 30932 20993 10311 size class 3 364 275 98 737 37 226 1000 22637 14505 6874 all 338 289 67 694 43 263 1000 53569 35498 17185
Karnataka size class 1 192 429 92 713 31 256 1000 115528 88882 7105 size class 2 297 287 123 707 33 259 1000 194068 136165 18816 size class 3 334 253 156 743 56 202 1000 163871 109477 12915 all 281 314 126 720 40 240 1000 473468 334524 38836

NSS Report No.462: Employment and Unemployment situation in cities and towns of India, 1999-2000 Appendix
A-36
Table (105) : Per thousand distribution of person-days of persons of age 15 years and above by broad current daily activity status for each size class of town
age 15 yrs. and above urban male
working unem- not in total no. of person days state/all-India size class self- regular casual total ployed labour estimated (00) sample of town employed employees labour force all ages age 15 (age 15 & above & above)
(1) (2) (3) (4) (5) (6) (7) (8) (9) (10) (11) (12) Kerala size class 1 0 0 0 0 0 0 0 0 0 0
size class 2 214 247 155 616 105 279 1000 108570 81948 14056 size class 3 263 166 180 610 119 272 1000 128919 94690 16940 all 240 204 168 612 113 275 1000 237489 176638 30996
Madhya Pradesh size class 1 292 315 91 697 69 234 1000 77613 51816 6062 size class 2 325 289 86 701 45 254 1000 255297 165604 26362 size class 3 329 248 122 699 59 241 1000 298095 189928 21434 all 323 273 104 700 55 246 1000 631005 407348 53858
Maharastra size class 1 228 458 34 721 63 217 1000 622047 461496 39620 size class 2 235 365 117 718 52 231 1000 464247 312649 32914 size class 3 315 271 131 717 68 215 1000 187764 122413 13776 all 242 400 76 719 60 221 1000 1274058 896558 86310
Manipur size class 1 0 0 0 0 0 0 0 0 0 0 size class 2 234 258 55 547 83 371 1000 6908 4872 5439 size class 3 404 201 79 683 8 309 1000 8165 5337 6160 all 323 228 67 618 44 338 1000 15073 10209 11599
Meghalaya size class 1 0 0 0 0 0 0 0 0 0 0 size class 2 170 335 70 575 44 381 1000 3518 2483 2590 size class 3 150 344 150 643 8 349 1000 6478 3780 2380 all 158 340 119 616 22 361 1000 9996 6263 4970

NSS Report No.462: Employment and Unemployment situation in cities and towns of India, 1999-2000 Appendix
A-37
Table (105) : Per thousand distribution of person-days of persons of age 15 years and above by broad current daily activity status for each size class of town
age 15 yrs. and above urban male
working unem- not in total no. of person days state/all-India size class self- regular casual total ployed labour estimated (00) sample of town employed employees labour force all ages age 15 (age 15 & above & above)
(1) (2) (3) (4) (5) (6) (7) (8) (9) (10) (11) (12) Mizoram size class 1 0 0 0 0 0 0 0 0 0 0
size class 2 178 340 112 631 11 358 1000 3601 2340 5698 size class 3 344 208 126 677 40 282 1000 3646 2510 7357 all 264 272 119 655 26 319 1000 7246 4851 13055
Nagaland size class 1 0 0 0 0 0 0 0 0 0 0 size class 2 84 441 17 542 79 379 1000 4848 3402 2443 size class 3 196 448 37 682 32 286 1000 2635 1523 1288 all 119 443 23 586 64 350 1000 7483 4925 3731
Orissa size class 1 0 0 0 0 0 0 0 0 0 0 size class 2 260 294 108 662 66 272 1000 112013 74499 8666 size class 3 298 253 109 660 76 263 1000 95145 63953 7294 all 277 275 108 661 71 268 1000 207158 138452 15960
Punjab size class 1 294 415 127 835 9 155 1000 47429 34282 5635 size class 2 379 327 46 752 42 206 1000 142681 99912 16709 size class 3 382 213 132 727 52 222 1000 70093 44993 8113 all 363 315 83 762 38 200 1000 260203 179187 30457
Rajasthan size class 1 270 388 40 698 26 276 1000 49317 36568 4970 size class 2 322 301 105 728 30 242 1000 187383 120823 17724 size class 3 371 252 86 708 46 246 1000 136612 84763 10976 all 331 297 88 716 35 248 1000 373312 242155 33670

NSS Report No.462: Employment and Unemployment situation in cities and towns of India, 1999-2000 Appendix
A-38
Table (105) : Per thousand distribution of person-days of persons of age 15 years and above by broad current daily activity status for each size class of town
age 15 yrs. and above urban male
working unem- not in total no. of person days state/all-India size class self- regular casual total ployed labour estimated (00) sample of town employed employees labour force all ages age 15 (age 15 & above & above)
(1) (2) (3) (4) (5) (6) (7) (8) (9) (10) (11) (12) Sikkim size class 1 0 0 0 0 0 0 0 0 0 0
size class 2 0 0 0 0 0 0 0 0 0 0 size class 3 297 370 55 722 48 229 1000 1501 1055 4270 all 297 370 55 722 48 229 1000 1501 1055 4270
Tamil Nadu size class 1 228 365 111 704 65 231 1000 197203 140831 15834 size class 2 261 376 87 723 59 218 1000 305700 223968 26166 size class 3 250 302 150 701 83 216 1000 236243 167483 17822 all 249 350 113 711 68 221 1000 739146 532282 59822
Tripura size class 1 0 0 0 0 0 0 0 0 0 0 size class 2 252 324 68 643 61 296 1000 5569 4445 3094 size class 3 205 355 135 696 26 278 1000 8981 5965 5635 all 225 342 107 673 41 286 1000 14551 10410 8729
Uttar Pradesh size class 1 325 279 114 718 58 224 1000 334098 213146 16898 size class 2 368 281 68 716 50 234 1000 501735 336451 37044 size class 3 490 178 87 755 40 205 1000 381754 214523 24976 all 390 251 86 728 49 223 1000 1217587 764121 78918
West Bengal size class 1 326 325 93 744 61 195 1000 144113 114927 14462 size class 2 295 294 101 690 95 215 1000 305106 226709 28014 size class 3 334 274 123 731 64 206 1000 115031 83392 11431 all 311 299 103 713 80 208 1000 564249 425028 53907

NSS Report No.462: Employment and Unemployment situation in cities and towns of India, 1999-2000 Appendix
A-39
Table (105) : Per thousand distribution of person-days of persons of age 15 years and above by broad current daily activity status for each size class of town
age 15 yrs. and above urban male
working unem- not in total no. of person days state/all-India size class self- regular casual total ployed labour estimated (00) sample of town employed employees labour force all ages age 15 (age 15 & above & above)
(1) (2) (3) (4) (5) (6) (7) (8) (9) (10) (11) (12) Andaman & Nicobar size class 1 0 0 0 0 0 0 0 0 0 0 Is. size class 2 211 411 219 841 46 114 1000 2835 2081 2800
size class 3 0 0 0 0 0 0 0 0 0 0 all 211 411 219 841 46 114 1000 2835 2081 2800
Chandigarh size class 1 0 0 0 0 0 0 0 0 0 0 size class 2 255 443 29 727 40 232 1000 20678 14674 10444 size class 3 365 483 80 929 4 67 1000 3316 2406 1169 all 271 449 36 756 35 209 1000 23994 17080 11613
Dadra & N. Haveli size class 1 0 0 0 0 0 0 0 0 0 0 size class 2 0 0 0 0 0 0 0 0 0 0 size class 3 264 470 83 818 18 164 1000 653 504 1456 all 264 470 83 818 18 164 1000 653 504 1456
Daman & Diu size class 1 0 0 0 0 0 0 0 0 0 0 size class 2 0 0 0 0 0 0 0 0 0 0 size class 3 436 305 29 770 12 218 1000 1866 1280 3269 all 436 305 29 770 12 218 1000 1866 1280 3269
Delhi size class 1 315 404 17 736 24 240 1000 277221 196381 13874 size class 2 250 423 71 744 82 174 1000 52668 35042 2975 size class 3 270 393 41 704 11 284 1000 13000 9359 1582 all 304 406 26 736 32 232 1000 342890 240783 18431

NSS Report No.462: Employment and Unemployment situation in cities and towns of India, 1999-2000 Appendix
A-40
Table (105) : Per thousand distribution of person-days of persons of age 15 years and above by broad current daily activity status for each size class of town
age 15 yrs. and above urban male
working unem- not in total no. of person days state/all-India size class self- regular casual total ployed labour estimated (00) sample of town employed employees labour force all ages age 15 (age 15 & above & above)
(1) (2) (3) (4) (5) (6) (7) (8) (9) (10) (11) (12) Lakshadweep size class 1 0 0 0 0 0 0 0 0 0 0
size class 2 0 0 0 0 0 0 0 0 0 0 size class 3 219 317 120 656 99 246 1000 936 548 4886 all 219 317 120 656 99 246 1000 936 548 4886
Pondicherry size class 1 0 0 0 0 0 0 0 0 0 0
size class 2 212 331 140 682 84 234 1000 12473 9120 3962 size class 3 203 227 169 599 157 245 1000 3231 2449 1449 all 210 309 146 664 99 236 1000 15704 11569 5411
all -India size class 1 267 375 78 721 50 230 1000 2255961 1605829 161686 size class 2 293 314 99 705 55 240 1000 3823325 2610531 361424 size class 3 344 240 126 710 62 228 1000 2478492 1608636 254996 all 300 310 100 711 56 234 1000 8557777 5824996 778106
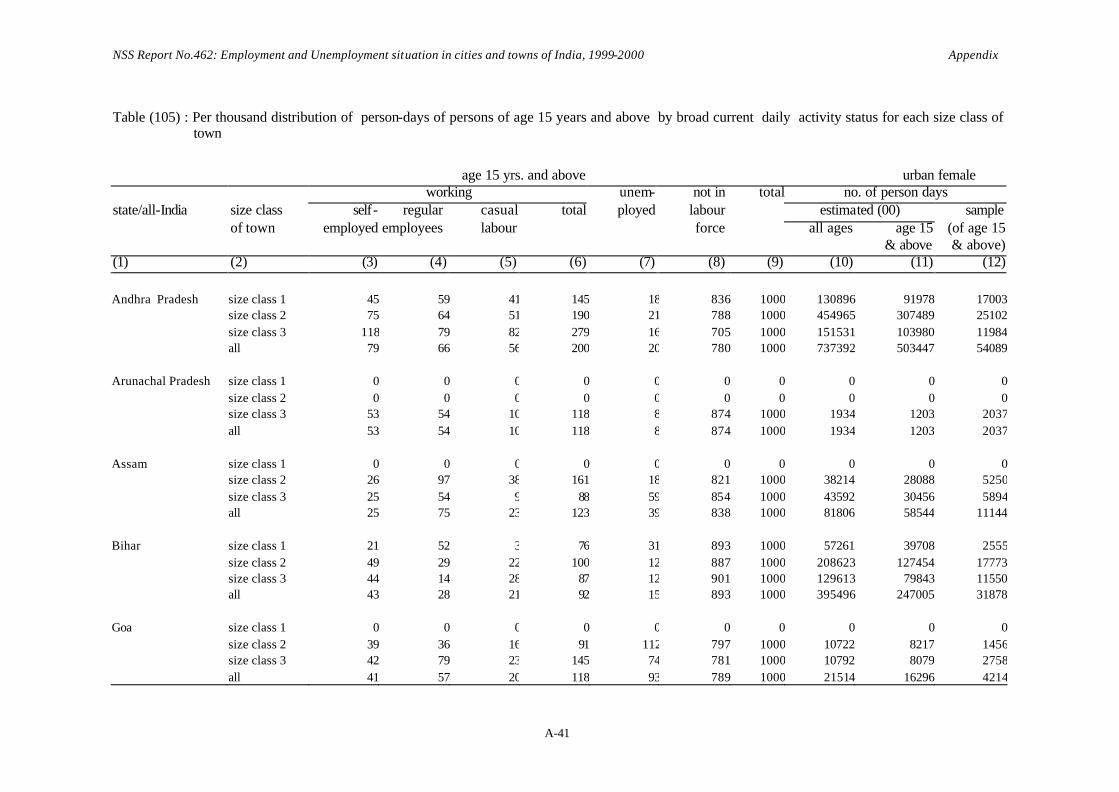
NSS Report No.462: Employment and Unemployment situation in cities and towns of India, 1999-2000 Appendix
A-41
Table (105) : Per thousand distribution of person-days of persons of age 15 years and above by broad current daily activity status for each size class of
town
age 15 yrs. and above urban female
working unem- not in total no. of person days state/all-India size class self- regular casual total ployed labour estimated (00) sample of town employed employees labour force all ages age 15 (of age 15 & above & above) (1) (2) (3) (4) (5) (6) (7) (8) (9) (10) (11) (12) Andhra Pradesh size class 1 45 59 41 145 18 836 1000 130896 91978 17003
size class 2 75 64 51 190 21 788 1000 454965 307489 25102size class 3 118 79 82 279 16 705 1000 151531 103980 11984all 79 66 56 200 20 780 1000 737392 503447 54089
Arunachal Pradesh size class 1 0 0 0 0 0 0 0 0 0 0size class 2 0 0 0 0 0 0 0 0 0 0size class 3 53 54 10 118 8 874 1000 1934 1203 2037all 53 54 10 118 8 874 1000 1934 1203 2037
Assam size class 1 0 0 0 0 0 0 0 0 0 0size class 2 26 97 38 161 18 821 1000 38214 28088 5250size class 3 25 54 9 88 59 854 1000 43592 30456 5894all 25 75 23 123 39 838 1000 81806 58544 11144
Bihar size class 1 21 52 3 76 31 893 1000 57261 39708 2555size class 2 49 29 22 100 12 887 1000 208623 127454 17773size class 3 44 14 28 87 12 901 1000 129613 79843 11550all 43 28 21 92 15 893 1000 395496 247005 31878
Goa size class 1 0 0 0 0 0 0 0 0 0 0size class 2 39 36 16 91 112 797 1000 10722 8217 1456size class 3 42 79 23 145 74 781 1000 10792 8079 2758all 41 57 20 118 93 789 1000 21514 16296 4214
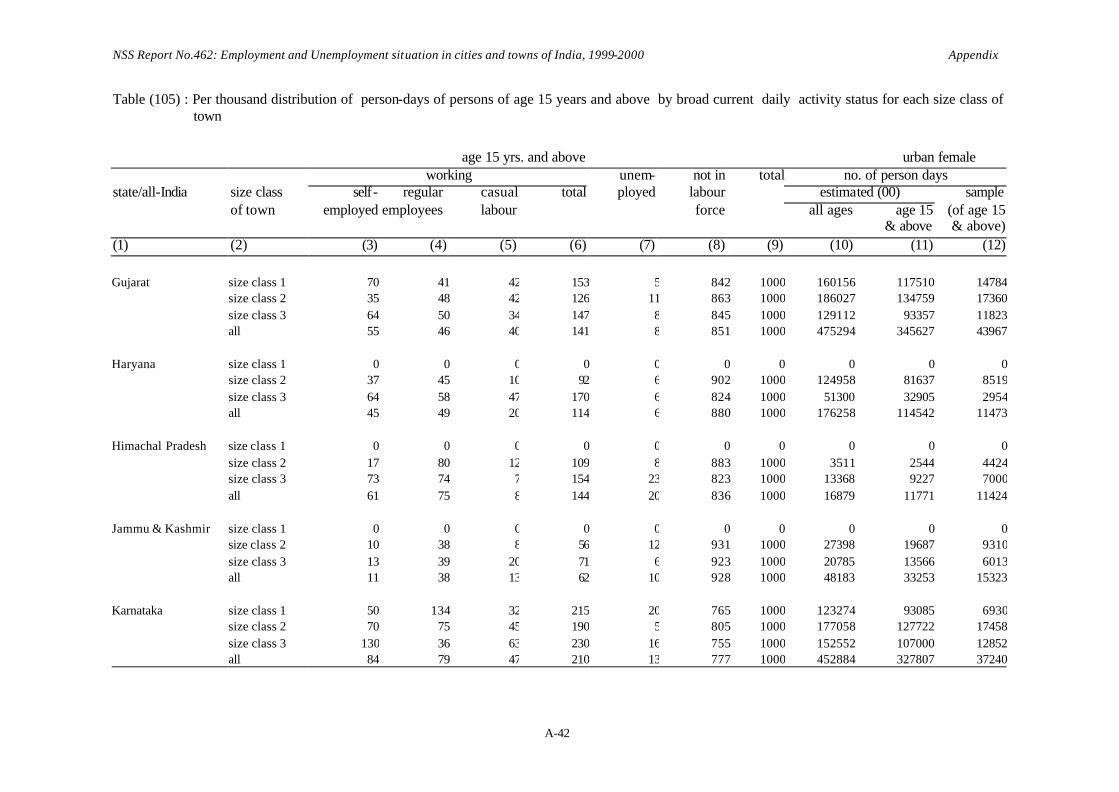
NSS Report No.462: Employment and Unemployment situation in cities and towns of India, 1999-2000 Appendix
A-42
Table (105) : Per thousand distribution of person-days of persons of age 15 years and above by broad current daily activity status for each size class of town
age 15 yrs. and above urban female
working unem- not in total no. of person days state/all-India size class self- regular casual total ployed labour estimated (00) sample of town employed employees labour force all ages age 15 (of age 15 & above & above) (1) (2) (3) (4) (5) (6) (7) (8) (9) (10) (11) (12) Gujarat size class 1 70 41 42 153 5 842 1000 160156 117510 14784
size class 2 35 48 42 126 11 863 1000 186027 134759 17360size class 3 64 50 34 147 8 845 1000 129112 93357 11823all 55 46 40 141 8 851 1000 475294 345627 43967
Haryana size class 1 0 0 0 0 0 0 0 0 0 0size class 2 37 45 10 92 6 902 1000 124958 81637 8519size class 3 64 58 47 170 6 824 1000 51300 32905 2954all 45 49 20 114 6 880 1000 176258 114542 11473
Himachal Pradesh size class 1 0 0 0 0 0 0 0 0 0 0size class 2 17 80 12 109 8 883 1000 3511 2544 4424size class 3 73 74 7 154 23 823 1000 13368 9227 7000all 61 75 8 144 20 836 1000 16879 11771 11424
Jammu & Kashmir size class 1 0 0 0 0 0 0 0 0 0 0size class 2 10 38 8 56 12 931 1000 27398 19687 9310size class 3 13 39 20 71 6 923 1000 20785 13566 6013all 11 38 13 62 10 928 1000 48183 33253 15323
Karnataka size class 1 50 134 32 215 20 765 1000 123274 93085 6930size class 2 70 75 45 190 5 805 1000 177058 127722 17458size class 3 130 36 63 230 16 755 1000 152552 107000 12852all 84 79 47 210 13 777 1000 452884 327807 37240

NSS Report No.462: Employment and Unemployment situation in cities and towns of India, 1999-2000 Appendix
A-43
Table (105) : Per thousand distribution of person-days of persons of age 15 years and above by broad current daily activity status for each size class of town
age 15 yrs. and above urban female
working unem- not in total no. of person days state/all-India size class self- regular casual total ployed labour estimated (00) sample of town employed employees labour force all ages age 15 (of age 15 & above & above) (1) (2) (3) (4) (5) (6) (7) (8) (9) (10) (11) (12) Kerala size class 1 0 0 0 0 0 0 0 0 0 0
size class 2 56 96 23 174 87 739 1000 115881 88080 15302size class 3 85 70 35 190 60 750 1000 143443 109798 19621all 72 81 30 183 72 745 1000 259324 197879 34923
Madhya Pradesh size class 1 56 70 24 150 6 844 1000 77138 49101 5754
size class 2 80 32 36 148 6 847 1000 234378 157774 25046size class 3 102 25 57 183 14 803 1000 262978 170528 19453all 86 34 44 164 9 827 1000 574494 377403 50253
Maharastra size class 1 47 104 12 163 21 816 1000 548799 392762 33208size class 2 58 58 33 150 11 839 1000 408312 276235 30660size class 3 105 38 59 202 24 774 1000 180778 119964 13349all 60 78 26 165 18 818 1000 1137889 788961 77217
Manipur size class 1 0 0 0 0 0 0 0 0 0 0size class 2 136 93 9 238 25 737 1000 6734 5029 5544size class 3 175 24 17 216 12 771 1000 7885 5345 6356all 156 58 13 227 18 755 1000 14620 10374 11900
Meghalaya size class 1 0 0 0 0 0 0 0 0 0 0size class 2 56 190 33 278 20 702 1000 3244 2265 2800size class 3 89 157 32 278 21 701 1000 6500 4340 2646all 78 168 32 278 21 701 1000 9744 6605 5446
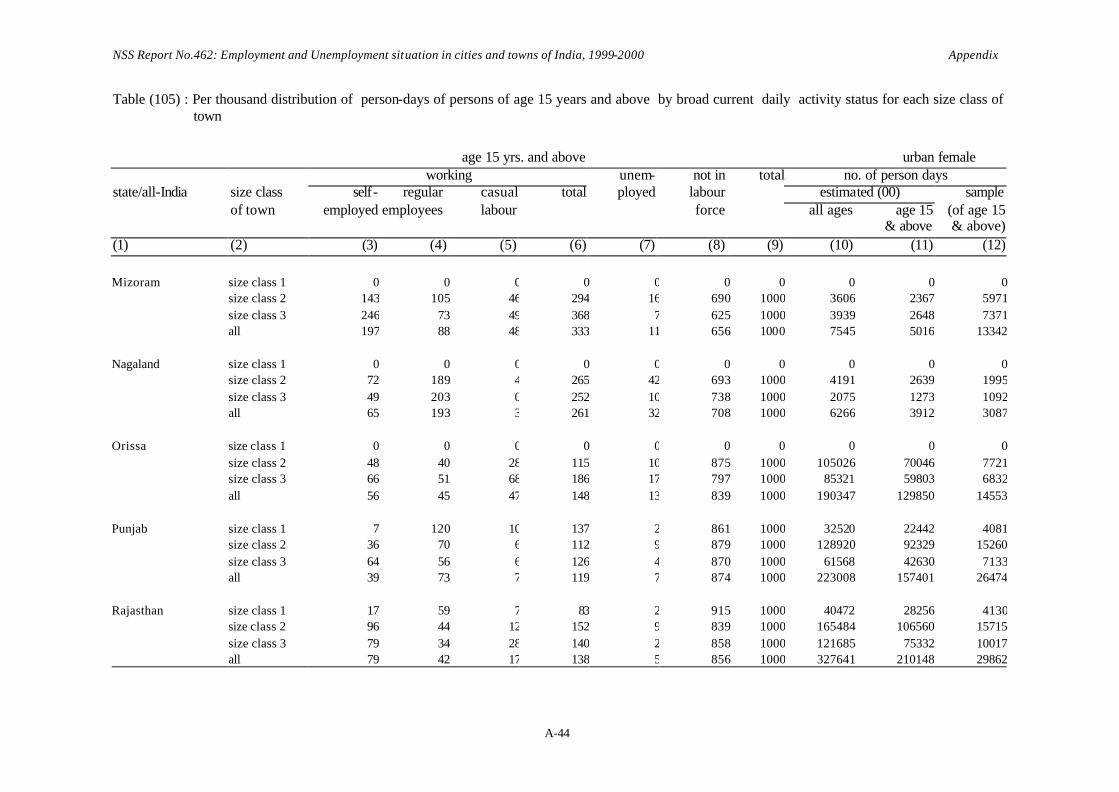
NSS Report No.462: Employment and Unemployment situation in cities and towns of India, 1999-2000 Appendix
A-44
Table (105) : Per thousand distribution of person-days of persons of age 15 years and above by broad current daily activity status for each size class of town
age 15 yrs. and above urban female
working unem- not in total no. of person days state/all-India size class self- regular casual total ployed labour estimated (00) sample of town employed employees labour force all ages age 15 (of age 15 & above & above) (1) (2) (3) (4) (5) (6) (7) (8) (9) (10) (11) (12) Mizoram size class 1 0 0 0 0 0 0 0 0 0 0
size class 2 143 105 46 294 16 690 1000 3606 2367 5971size class 3 246 73 49 368 7 625 1000 3939 2648 7371all 197 88 48 333 11 656 1000 7545 5016 13342
Nagaland size class 1 0 0 0 0 0 0 0 0 0 0size class 2 72 189 4 265 42 693 1000 4191 2639 1995size class 3 49 203 0 252 10 738 1000 2075 1273 1092all 65 193 3 261 32 708 1000 6266 3912 3087
Orissa size class 1 0 0 0 0 0 0 0 0 0 0size class 2 48 40 28 115 10 875 1000 105026 70046 7721size class 3 66 51 68 186 17 797 1000 85321 59803 6832all 56 45 47 148 13 839 1000 190347 129850 14553
Punjab size class 1 7 120 10 137 2 861 1000 32520 22442 4081size class 2 36 70 6 112 9 879 1000 128920 92329 15260size class 3 64 56 6 126 4 870 1000 61568 42630 7133all 39 73 7 119 7 874 1000 223008 157401 26474
Rajasthan size class 1 17 59 7 83 2 915 1000 40472 28256 4130size class 2 96 44 12 152 9 839 1000 165484 106560 15715size class 3 79 34 28 140 2 858 1000 121685 75332 10017all 79 42 17 138 5 856 1000 327641 210148 29862
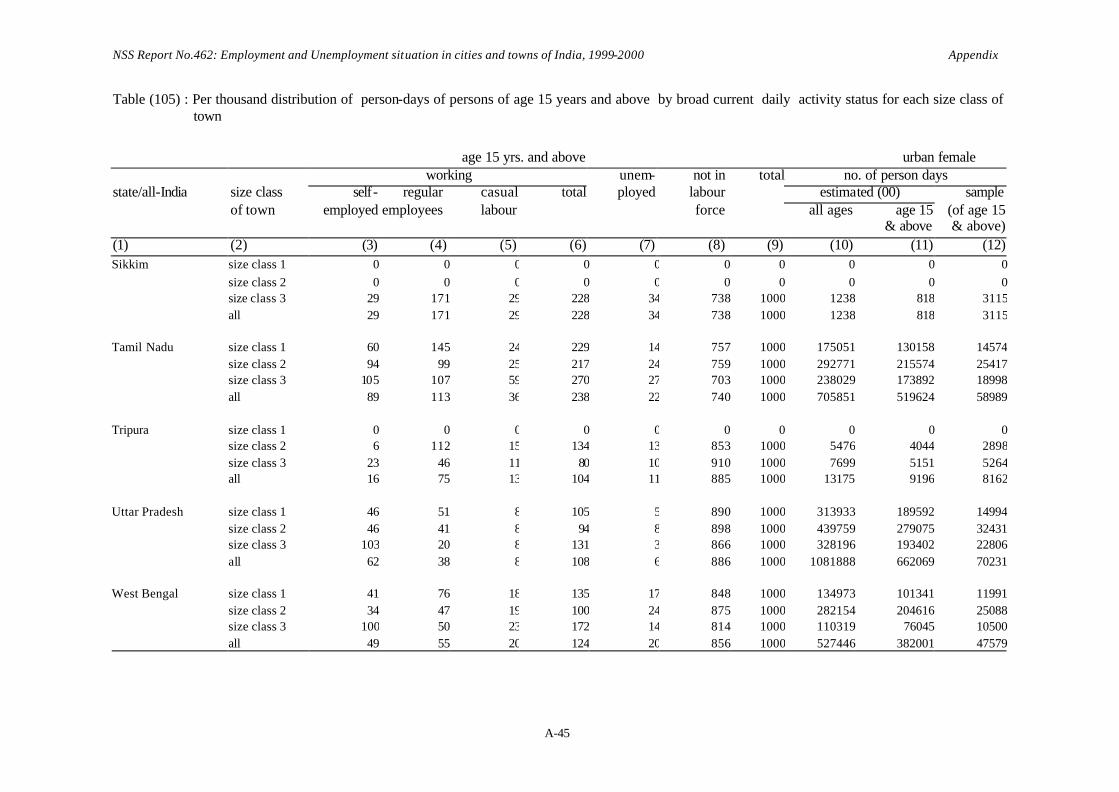
NSS Report No.462: Employment and Unemployment situation in cities and towns of India, 1999-2000 Appendix
A-45
Table (105) : Per thousand distribution of person-days of persons of age 15 years and above by broad current daily activity status for each size class of town
age 15 yrs. and above urban female
working unem- not in total no. of person days state/all-India size class self- regular casual total ployed labour estimated (00) sample of town employed employees labour force all ages age 15 (of age 15 & above & above) (1) (2) (3) (4) (5) (6) (7) (8) (9) (10) (11) (12) Sikkim size class 1 0 0 0 0 0 0 0 0 0 0
size class 2 0 0 0 0 0 0 0 0 0 0size class 3 29 171 29 228 34 738 1000 1238 818 3115all 29 171 29 228 34 738 1000 1238 818 3115
Tamil Nadu size class 1 60 145 24 229 14 757 1000 175051 130158 14574
size class 2 94 99 25 217 24 759 1000 292771 215574 25417size class 3 105 107 59 270 27 703 1000 238029 173892 18998all 89 113 36 238 22 740 1000 705851 519624 58989
Tripura size class 1 0 0 0 0 0 0 0 0 0 0size class 2 6 112 15 134 13 853 1000 5476 4044 2898size class 3 23 46 11 80 10 910 1000 7699 5151 5264all 16 75 13 104 11 885 1000 13175 9196 8162
Uttar Pradesh size class 1 46 51 8 105 5 890 1000 313933 189592 14994size class 2 46 41 8 94 8 898 1000 439759 279075 32431size class 3 103 20 8 131 3 866 1000 328196 193402 22806all 62 38 8 108 6 886 1000 1081888 662069 70231
West Bengal size class 1 41 76 18 135 17 848 1000 134973 101341 11991size class 2 34 47 19 100 24 875 1000 282154 204616 25088size class 3 100 50 23 172 14 814 1000 110319 76045 10500all 49 55 20 124 20 856 1000 527446 382001 47579

NSS Report No.462: Employment and Unemployment situation in cities and towns of India, 1999-2000 Appendix
A-46
Table (105) : Per thousand distribution of person-days of persons of age 15 years and above by broad current daily activity status for each size class of town
age 15 yrs. and above urban female
working unem- not in total no. of person days state/all-India size class self- regular casual total ployed labour estimated (00) sample of town employed employees labour force all ages age 15 (of age 15 & above & above) (1) (2) (3) (4) (5) (6) (7) (8) (9) (10) (11) (12) Andaman & Nicobar size class 1 0 0 0 0 0 0 0 0 0 0Is. size class 2 74 101 57 232 74 694 1000 2749 1906 2555
size class 3 0 0 0 0 0 0 0 0 0 0all 74 101 57 232 74 694 1000 2749 1906 2555
Chandigarh size class 1 0 0 0 0 0 0 0 0 0 0size class 2 24 144 6 174 46 779 1000 19310 14136 9527size class 3 15 32 0 47 59 894 1000 2471 1480 840all 23 134 5 162 47 790 1000 21781 15616 10367
Dadra & N. Haveli size class 1 0 0 0 0 0 0 0 0 0 0size class 2 0 0 0 0 0 0 0 0 0 0size class 3 62 42 35 140 0 860 1000 563 382 1113all 62 42 35 140 0 860 1000 563 382 1113
Daman & Diu size class 1 0 0 0 0 0 0 0 0 0 0size class 2 0 0 0 0 0 0 0 0 0 0size class 3 119 66 17 203 20 778 1000 1711 1290 3346all 119 66 17 203 20 778 1000 1711 1290 3346
Delhi size class 1 30 94 3 127 6 867 1000 236125 166330 11431
size class 2 50 60 2 113 10 877 1000 51388 31682 2667size class 3 29 47 30 106 0 894 1000 9021 6312 1092
all 33 87 4 124 6 869 1000 296534 204324 15190
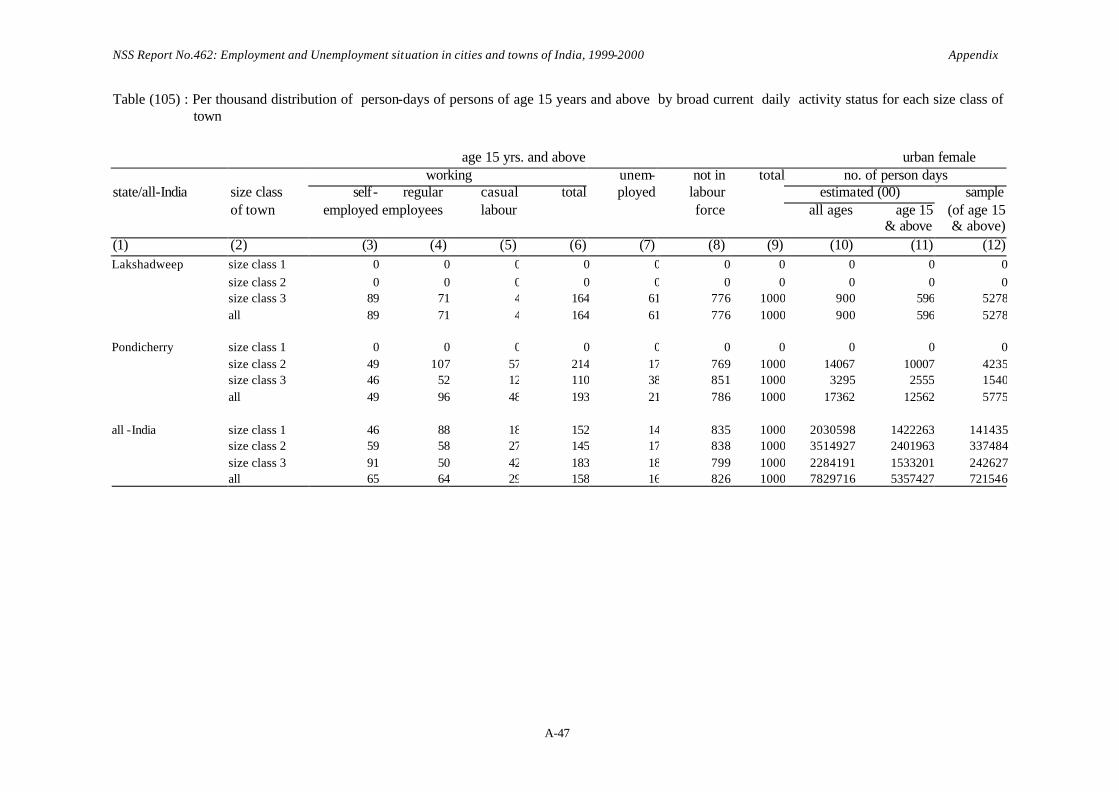
NSS Report No.462: Employment and Unemployment situation in cities and towns of India, 1999-2000 Appendix
A-47
Table (105) : Per thousand distribution of person-days of persons of age 15 years and above by broad current daily activity status for each size class of town
age 15 yrs. and above urban female
working unem- not in total no. of person days state/all-India size class self- regular casual total ployed labour estimated (00) sample of town employed employees labour force all ages age 15 (of age 15 & above & above) (1) (2) (3) (4) (5) (6) (7) (8) (9) (10) (11) (12) Lakshadweep size class 1 0 0 0 0 0 0 0 0 0 0
size class 2 0 0 0 0 0 0 0 0 0 0size class 3 89 71 4 164 61 776 1000 900 596 5278all 89 71 4 164 61 776 1000 900 596 5278
Pondicherry size class 1 0 0 0 0 0 0 0 0 0 0
size class 2 49 107 57 214 17 769 1000 14067 10007 4235size class 3 46 52 12 110 38 851 1000 3295 2555 1540all 49 96 48 193 21 786 1000 17362 12562 5775
all -India size class 1 46 88 18 152 14 835 1000 2030598 1422263 141435size class 2 59 58 27 145 17 838 1000 3514927 2401963 337484size class 3 91 50 42 183 18 799 1000 2284191 1533201 242627all 65 64 29 158 16 826 1000 7829716 5357427 721546
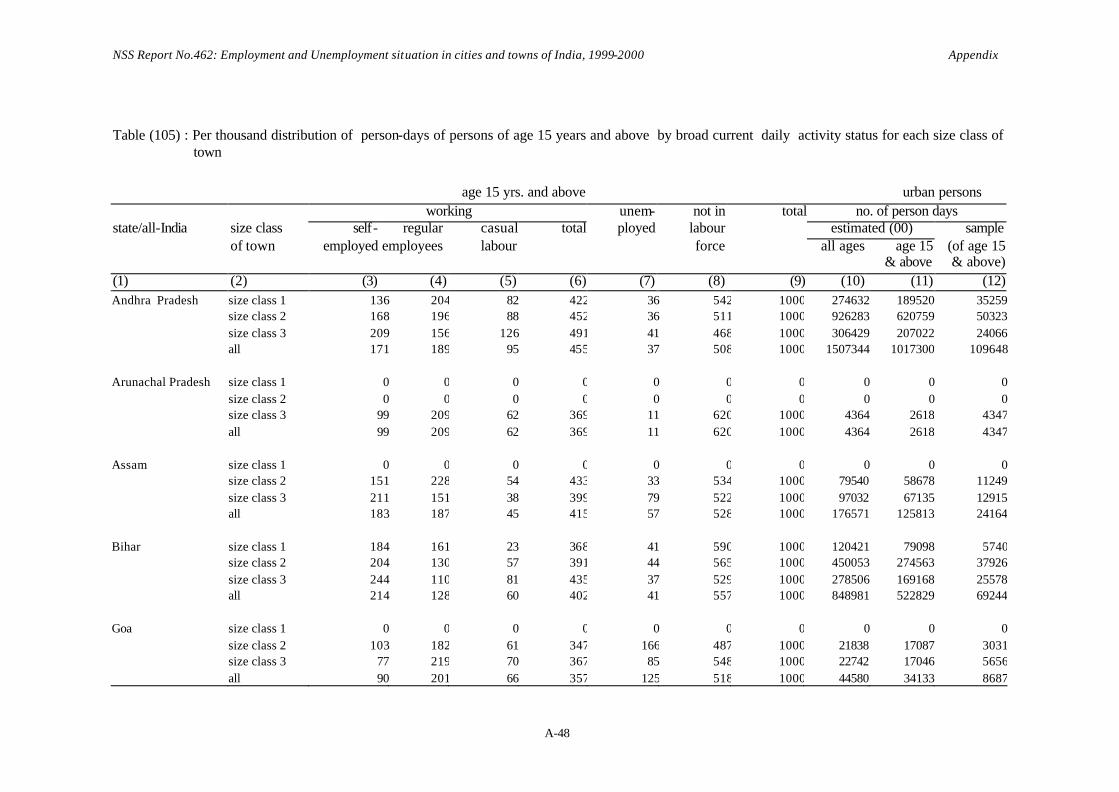
NSS Report No.462: Employment and Unemployment situation in cities and towns of India, 1999-2000 Appendix
A-48
Table (105) : Per thousand distribution of person-days of persons of age 15 years and above by broad current daily activity status for each size class of
town
age 15 yrs. and above urban persons
working unem- not in total no. of person days state/all-India size class self- regular casual total ployed labour estimated (00) sample of town employed employees labour force all ages age 15 (of age 15 & above & above) (1) (2) (3) (4) (5) (6) (7) (8) (9) (10) (11) (12) Andhra Pradesh size class 1 136 204 82 422 36 542 1000 274632 189520 35259
size class 2 168 196 88 452 36 511 1000 926283 620759 50323size class 3 209 156 126 491 41 468 1000 306429 207022 24066all 171 189 95 455 37 508 1000 1507344 1017300 109648
Arunachal Pradesh size class 1 0 0 0 0 0 0 0 0 0 0size class 2 0 0 0 0 0 0 0 0 0 0size class 3 99 209 62 369 11 620 1000 4364 2618 4347all 99 209 62 369 11 620 1000 4364 2618 4347
Assam size class 1 0 0 0 0 0 0 0 0 0 0size class 2 151 228 54 433 33 534 1000 79540 58678 11249size class 3 211 151 38 399 79 522 1000 97032 67135 12915all 183 187 45 415 57 528 1000 176571 125813 24164
Bihar size class 1 184 161 23 368 41 590 1000 120421 79098 5740size class 2 204 130 57 391 44 565 1000 450053 274563 37926size class 3 244 110 81 435 37 529 1000 278506 169168 25578all 214 128 60 402 41 557 1000 848981 522829 69244
Goa size class 1 0 0 0 0 0 0 0 0 0 0size class 2 103 182 61 347 166 487 1000 21838 17087 3031size class 3 77 219 70 367 85 548 1000 22742 17046 5656all 90 201 66 357 125 518 1000 44580 34133 8687
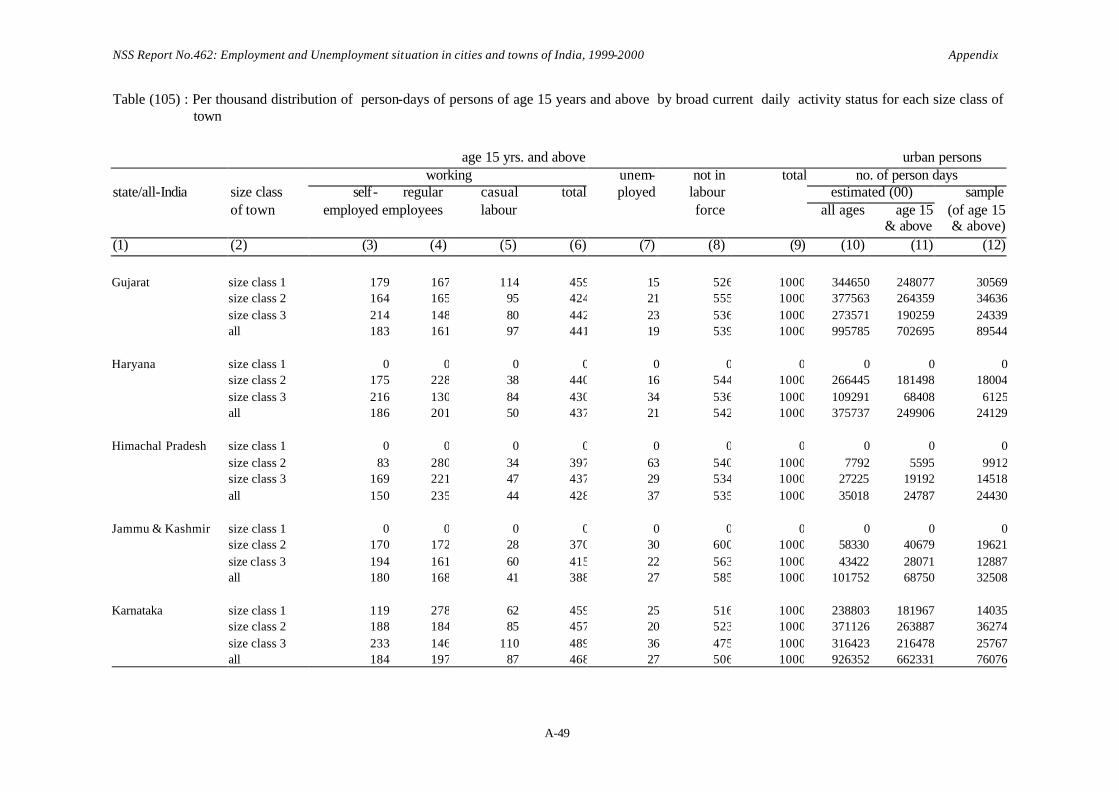
NSS Report No.462: Employment and Unemployment situation in cities and towns of India, 1999-2000 Appendix
A-49
Table (105) : Per thousand distribution of person-days of persons of age 15 years and above by broad current daily activity status for each size class of town
age 15 yrs. and above urban persons
working unem- not in total no. of person days state/all-India size class self- regular casual total ployed labour estimated (00) sample of town employed employees labour force all ages age 15 (of age 15 & above & above) (1) (2) (3) (4) (5) (6) (7) (8) (9) (10) (11) (12) Gujarat size class 1 179 167 114 459 15 526 1000 344650 248077 30569
size class 2 164 165 95 424 21 555 1000 377563 264359 34636size class 3 214 148 80 442 23 536 1000 273571 190259 24339all 183 161 97 441 19 539 1000 995785 702695 89544
Haryana size class 1 0 0 0 0 0 0 0 0 0 0size class 2 175 228 38 440 16 544 1000 266445 181498 18004size class 3 216 130 84 430 34 536 1000 109291 68408 6125all 186 201 50 437 21 542 1000 375737 249906 24129
Himachal Pradesh size class 1 0 0 0 0 0 0 0 0 0 0size class 2 83 280 34 397 63 540 1000 7792 5595 9912size class 3 169 221 47 437 29 534 1000 27225 19192 14518all 150 235 44 428 37 535 1000 35018 24787 24430
Jammu & Kashmir size class 1 0 0 0 0 0 0 0 0 0 0size class 2 170 172 28 370 30 600 1000 58330 40679 19621size class 3 194 161 60 415 22 563 1000 43422 28071 12887all 180 168 41 388 27 585 1000 101752 68750 32508
Karnataka size class 1 119 278 62 459 25 516 1000 238803 181967 14035size class 2 188 184 85 457 20 523 1000 371126 263887 36274size class 3 233 146 110 489 36 475 1000 316423 216478 25767all 184 197 87 468 27 506 1000 926352 662331 76076

NSS Report No.462: Employment and Unemployment situation in cities and towns of India, 1999-2000 Appendix
A-50
Table (105) : Per thousand distribution of person-days of persons of age 15 years and above by broad current daily activity status for each size class of town
age 15 yrs. and above urban persons
working unem- not in total no. of person days state/all-India size class self- regular casual total ployed labour estimated (00) sample of town employed employees labour force all ages age 15 (of age 15 & above & above) (1) (2) (3) (4) (5) (6) (7) (8) (9) (10) (11) (12) Kerala size class 1 0 0 0 0 0 0 0 0 0 0 size class 2 132 169 86 387 96 517 1000 224451 170028 29358
size class 3 167 114 102 384 87 528 1000 272363 204488 36561all 151 139 95 385 91 523 1000 496814 374516 65919
Madhya Pradesh size class 1 177 196 58 431 38 531 1000 154751 100917 11816size class 2 206 164 62 431 26 543 1000 489675 323379 51408size class 3 222 142 91 455 38 507 1000 561073 360456 40887all 209 158 75 442 33 525 1000 1205499 784752 104111
Maharastra size class 1 145 296 24 464 44 492 1000 1170846 854259 72828size class 2 152 221 78 451 32 516 1000 872559 588884 63574size class 3 211 156 95 462 46 492 1000 368542 242377 27125all 157 250 53 460 40 500 1000 2411947 1685520 163527
Manipur size class 1 0 0 0 0 0 0 0 0 0 0size class 2 184 174 32 390 53 557 1000 13642 9901 10983size class 3 289 112 48 449 10 540 1000 16051 10682 12516all 239 142 40 421 31 548 1000 29693 20583 23499
Meghalaya size class 1 0 0 0 0 0 0 0 0 0 0size class 2 115 266 52 433 33 534 1000 6762 4748 5390size class 3 117 244 87 448 15 537 1000 12978 8120 5026all 117 252 74 443 22 536 1000 19740 12868 10416
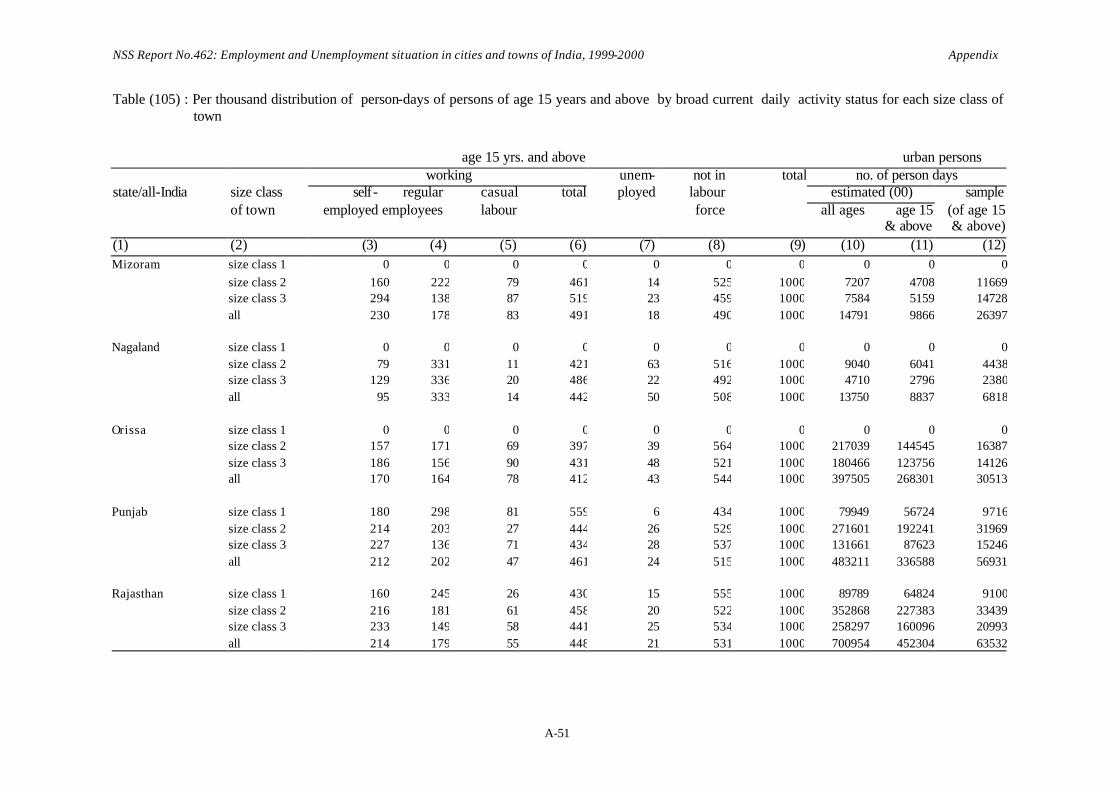
NSS Report No.462: Employment and Unemployment situation in cities and towns of India, 1999-2000 Appendix
A-51
Table (105) : Per thousand distribution of person-days of persons of age 15 years and above by broad current daily activity status for each size class of town
age 15 yrs. and above urban persons
working unem- not in total no. of person days state/all-India size class self- regular casual total ployed labour estimated (00) sample of town employed employees labour force all ages age 15 (of age 15 & above & above) (1) (2) (3) (4) (5) (6) (7) (8) (9) (10) (11) (12) Mizoram size class 1 0 0 0 0 0 0 0 0 0 0
size class 2 160 222 79 461 14 525 1000 7207 4708 11669size class 3 294 138 87 519 23 459 1000 7584 5159 14728all 230 178 83 491 18 490 1000 14791 9866 26397
Nagaland size class 1 0 0 0 0 0 0 0 0 0 0
size class 2 79 331 11 421 63 516 1000 9040 6041 4438size class 3 129 336 20 486 22 492 1000 4710 2796 2380all 95 333 14 442 50 508 1000 13750 8837 6818
Orissa size class 1 0 0 0 0 0 0 0 0 0 0size class 2 157 171 69 397 39 564 1000 217039 144545 16387size class 3 186 156 90 431 48 521 1000 180466 123756 14126all 170 164 78 412 43 544 1000 397505 268301 30513
Punjab size class 1 180 298 81 559 6 434 1000 79949 56724 9716size class 2 214 203 27 444 26 529 1000 271601 192241 31969size class 3 227 136 71 434 28 537 1000 131661 87623 15246all 212 202 47 461 24 515 1000 483211 336588 56931
Rajasthan size class 1 160 245 26 430 15 555 1000 89789 64824 9100size class 2 216 181 61 458 20 522 1000 352868 227383 33439size class 3 233 149 58 441 25 534 1000 258297 160096 20993all 214 179 55 448 21 531 1000 700954 452304 63532

NSS Report No.462: Employment and Unemployment situation in cities and towns of India, 1999-2000 Appendix
A-52
Table (105) : Per thousand distribution of person-days of persons of age 15 years and above by broad current daily activity status for each size class of town
age 15 yrs. and above urban persons
working unem- not in total no. of person days state/all-India size class self- regular casual total ployed labour estimated (00) sample of town employed employees labour force all ages age 15 (of age 15 & above & above) (1) (2) (3) (4) (5) (6) (7) (8) (9) (10) (11) (12) Sikkim size class 1 0 0 0 0 0 0 0 0 0 0
size class 2 0 0 0 0 0 0 0 0 0 0size class 3 180 283 44 507 42 451 1000 2739 1872 7385all 180 283 44 507 42 451 1000 2739 1872 7385
Tamil Nadu size class 1 147 259 69 476 41 484 1000 372253 270989 30408
size class 2 179 240 56 475 42 483 1000 598471 439543 51583size class 3 176 202 104 482 54 464 1000 474272 341375 36820all 170 233 75 477 46 477 1000 1444997 1051906 118811
Tripura size class 1 0 0 0 0 0 0 0 0 0 0size class 2 135 223 43 401 38 561 1000 11045 8489 5992size class 3 121 212 78 411 18 571 1000 16680 11117 10899all 127 217 63 406 27 567 1000 27726 19606 16891
Uttar Pradesh size class 1 193 172 64 430 33 538 1000 648031 402739 31892size class 2 222 172 40 434 31 535 1000 941494 615527 69475size class 3 307 103 49 459 22 519 1000 709950 407925 47782all 238 152 50 440 29 531 1000 2299475 1426190 149149
West Bengal size class 1 192 209 58 458 41 501 1000 279086 216268 26453size class 2 171 177 62 411 61 528 1000 587260 431325 53102size class 3 222 167 75 464 40 496 1000 225350 159436 21931all 187 183 64 434 52 514 1000 1091696 807029 101486
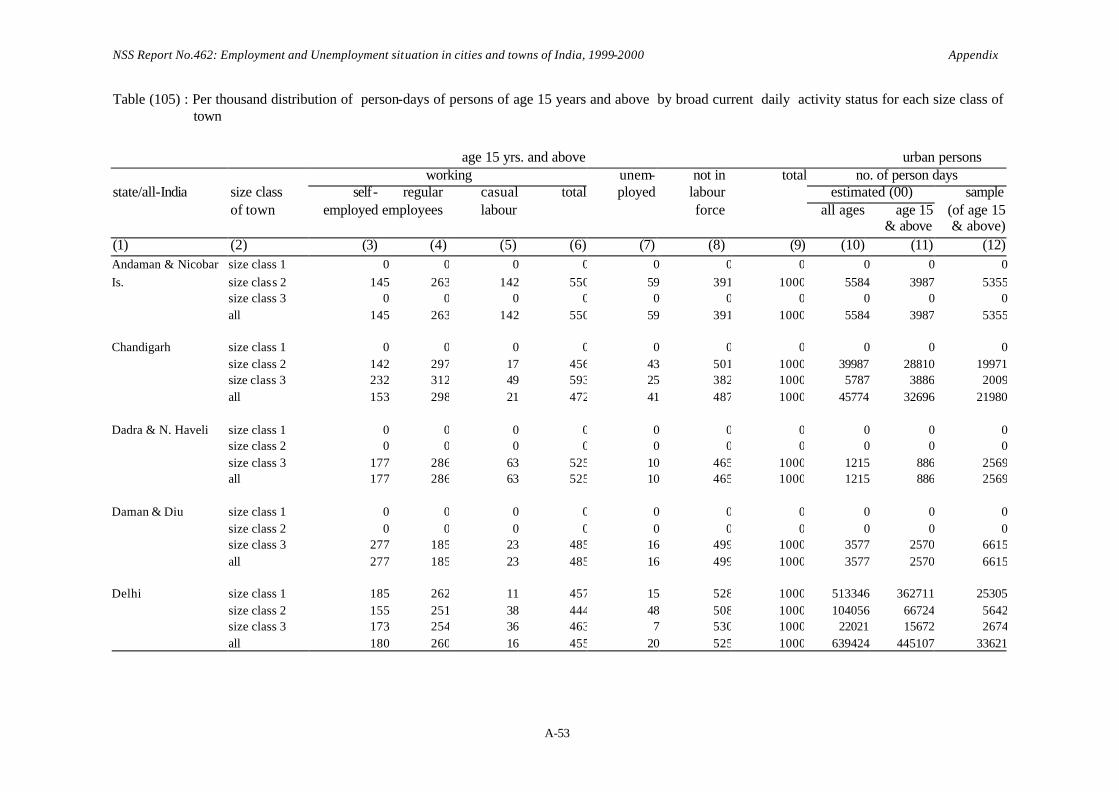
NSS Report No.462: Employment and Unemployment situation in cities and towns of India, 1999-2000 Appendix
A-53
Table (105) : Per thousand distribution of person-days of persons of age 15 years and above by broad current daily activity status for each size class of town
age 15 yrs. and above urban persons
working unem- not in total no. of person days state/all-India size class self- regular casual total ployed labour estimated (00) sample of town employed employees labour force all ages age 15 (of age 15 & above & above) (1) (2) (3) (4) (5) (6) (7) (8) (9) (10) (11) (12) Andaman & Nicobar size class 1 0 0 0 0 0 0 0 0 0 0Is. size class 2 145 263 142 550 59 391 1000 5584 3987 5355
size class 3 0 0 0 0 0 0 0 0 0 0all 145 263 142 550 59 391 1000 5584 3987 5355
Chandigarh size class 1 0 0 0 0 0 0 0 0 0 0
size class 2 142 297 17 456 43 501 1000 39987 28810 19971size class 3 232 312 49 593 25 382 1000 5787 3886 2009all 153 298 21 472 41 487 1000 45774 32696 21980
Dadra & N. Haveli size class 1 0 0 0 0 0 0 0 0 0 0size class 2 0 0 0 0 0 0 0 0 0 0size class 3 177 286 63 525 10 465 1000 1215 886 2569all 177 286 63 525 10 465 1000 1215 886 2569
Daman & Diu size class 1 0 0 0 0 0 0 0 0 0 0size class 2 0 0 0 0 0 0 0 0 0 0size class 3 277 185 23 485 16 499 1000 3577 2570 6615all 277 185 23 485 16 499 1000 3577 2570 6615
Delhi size class 1 185 262 11 457 15 528 1000 513346 362711 25305
size class 2 155 251 38 444 48 508 1000 104056 66724 5642size class 3 173 254 36 463 7 530 1000 22021 15672 2674all 180 260 16 455 20 525 1000 639424 445107 33621
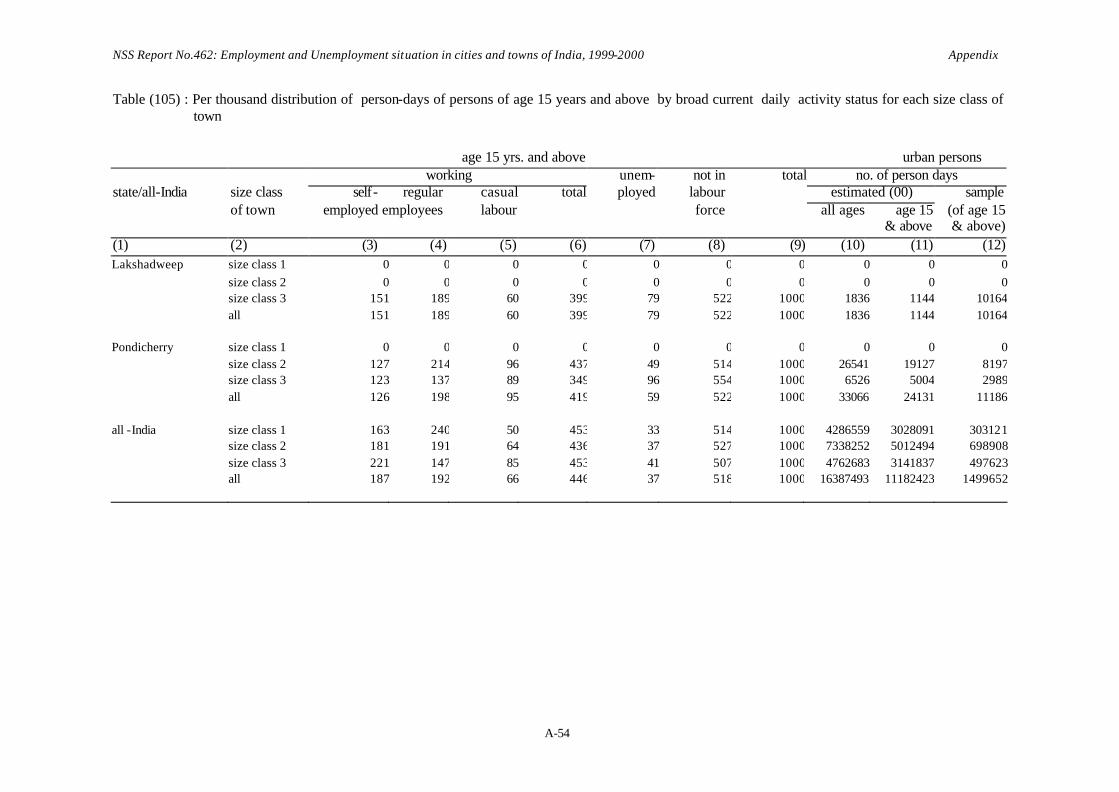
NSS Report No.462: Employment and Unemployment situation in cities and towns of India, 1999-2000 Appendix
A-54
Table (105) : Per thousand distribution of person-days of persons of age 15 years and above by broad current daily activity status for each size class of town
age 15 yrs. and above urban persons
working unem- not in total no. of person days state/all-India size class self- regular casual total ployed labour estimated (00) sample of town employed employees labour force all ages age 15 (of age 15 & above & above) (1) (2) (3) (4) (5) (6) (7) (8) (9) (10) (11) (12) Lakshadweep size class 1 0 0 0 0 0 0 0 0 0 0
size class 2 0 0 0 0 0 0 0 0 0 0size class 3 151 189 60 399 79 522 1000 1836 1144 10164
all 151 189 60 399 79 522 1000 1836 1144 10164 Pondicherry size class 1 0 0 0 0 0 0 0 0 0 0
size class 2 127 214 96 437 49 514 1000 26541 19127 8197size class 3 123 137 89 349 96 554 1000 6526 5004 2989all 126 198 95 419 59 522 1000 33066 24131 11186
all -India size class 1 163 240 50 453 33 514 1000 4286559 3028091 303121
size class 2 181 191 64 436 37 527 1000 7338252 5012494 698908size class 3 221 147 85 453 41 507 1000 4762683 3141837 497623
all 187 192 66 446 37 518 1000 16387493 11182423 1499652
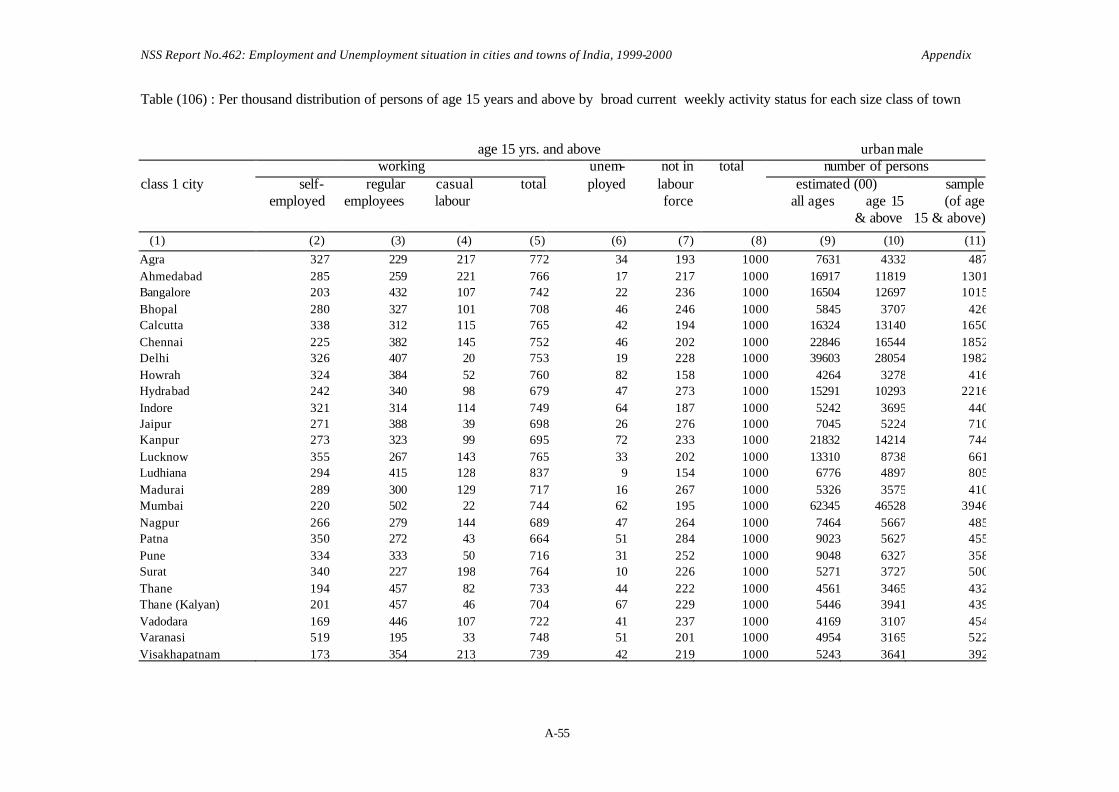
NSS Report No.462: Employment and Unemployment situation in cities and towns of India, 1999-2000 Appendix
A-55
Table (106) : Per thousand distribution of persons of age 15 years and above by broad current weekly activity status for each size class of town age 15 yrs. and above urban male
working unem- not in total number of persons class 1 city self- regular casual total ployed labour estimated (00) sample employed employees labour force all ages age 15 (of age & above 15 & above) (1) (2) (3) (4) (5) (6) (7) (8) (9) (10) (11) Agra 327 229 217 772 34 193 1000 7631 4332 487Ahmedabad 285 259 221 766 17 217 1000 16917 11819 1301Bangalore 203 432 107 742 22 236 1000 16504 12697 1015Bhopal 280 327 101 708 46 246 1000 5845 3707 426Calcutta 338 312 115 765 42 194 1000 16324 13140 1650Chennai 225 382 145 752 46 202 1000 22846 16544 1852Delhi 326 407 20 753 19 228 1000 39603 28054 1982Howrah 324 384 52 760 82 158 1000 4264 3278 416Hydrabad 242 340 98 679 47 273 1000 15291 10293 2216Indore 321 314 114 749 64 187 1000 5242 3695 440Jaipur 271 388 39 698 26 276 1000 7045 5224 710Kanpur 273 323 99 695 72 233 1000 21832 14214 744Lucknow 355 267 143 765 33 202 1000 13310 8738 661Ludhiana 294 415 128 837 9 154 1000 6776 4897 805Madurai 289 300 129 717 16 267 1000 5326 3575 410Mumbai 220 502 22 744 62 195 1000 62345 46528 3946Nagpur 266 279 144 689 47 264 1000 7464 5667 485Patna 350 272 43 664 51 284 1000 9023 5627 455Pune 334 333 50 716 31 252 1000 9048 6327 358Surat 340 227 198 764 10 226 1000 5271 3727 500Thane 194 457 82 733 44 222 1000 4561 3465 432Thane (Kalyan) 201 457 46 704 67 229 1000 5446 3941 439Vadodara 169 446 107 722 41 237 1000 4169 3107 454Varanasi 519 195 33 748 51 201 1000 4954 3165 522Visakhapatnam 173 354 213 739 42 219 1000 5243 3641 392

NSS Report No.462: Employment and Unemployment situation in cities and towns of India, 1999-2000 Appendix
A-56
Table (106) : Per thousand distribution of persons of age 15 years and above by broad current weekly activity status for each size class of town age 15 yrs. and above urban female
working unem- not in total no. of persons class 1 city self- regular casual total ployed labour estimated (00) sample employed employees labour force all ages age 15 (of age & above 15 & above) (1) (2) (3) (4) (5) (6) (7) (8) (9) (10) (11) Agra 43 54 3 100 0 900 1000 7182 4482 483Ahmedabad 124 46 30 200 2 798 1000 14353 10338 1191Bangalore 56 134 37 227 20 753 1000 17611 13298 990Bhopal 69 45 30 144 12 845 1000 5573 3386 399Calcutta 55 93 26 174 17 809 1000 15563 11556 1308Chennai 65 159 28 252 8 740 1000 20569 15172 1675Delhi 40 98 6 143 6 851 1000 33732 23761 1633Howrah 24 34 9 67 11 923 1000 3719 2922 405Hydrabad 33 60 59 151 7 842 1000 13863 9515 2037Indore 52 98 29 179 1 821 1000 5447 3628 423Jaipur 18 59 7 84 2 914 1000 5782 4037 590Kanpur 29 72 4 105 1 894 1000 20507 12084 647Lucknow 99 22 25 146 13 842 1000 12810 7790 583Ludhiana 9 120 10 139 2 858 1000 4646 3206 583Madurai 110 123 37 269 31 699 1000 4438 3422 407Mumbai 42 118 8 168 24 807 1000 53366 38367 3197Nagpur 57 50 45 153 4 843 1000 7818 5653 484Patna 26 52 5 83 31 885 1000 8180 5673 365Pune 108 110 15 234 7 759 1000 8641 6202 345Surat 7 22 29 57 1 941 1000 4911 3510 483Thane 108 113 8 229 29 742 1000 4023 2766 359Thane(Kalyan) 52 75 10 137 16 848 1000 4552 3121 359Vadodara 53 48 120 221 18 761 1000 3615 2939 438Varanasi 122 49 9 180 3 817 1000 4349 2729 429Visakhapatnam 82 59 14 155 38 807 1000 4837 3625 392

NSS Report No.462: Employment and Unemployment situation in cities and towns of India, 1999-2000 Appendix
A-57
Table (106) : Per thousand distribution of persons of age 15 years and above by broad current weekly activity status for each size class of town age 15 yrs. and above urban persons
working unem- not in total no. of persons class 1 city self- regular casual total ployed labour estimated (00) sample employed employees labour force all ages age 15 (of age & above 15 & above) (1) (2) (3) (4) (5) (6) (7) (8) (9) (10) (11) Agra 182 140 108 431 17 552 1000 14813 8814 970Ahmedabad 210 160 132 502 10 488 1000 31270 22157 2492Bangalore 128 280 71 479 21 500 1000 34115 25995 2005Bhopal 179 192 67 439 29 532 1000 11418 7093 825Calcutta 205 210 73 488 30 481 1000 31887 24696 2958Chennai 149 275 89 513 28 459 1000 43415 31716 3527Delhi 195 265 14 474 13 513 1000 73335 51816 3615Howrah 182 219 32 433 48 518 1000 7983 6200 821Hydrabad 141 205 79 426 28 547 1000 29154 19808 4253Indore 188 207 72 466 33 501 1000 10689 7324 863Jaipur 161 245 25 430 15 554 1000 12827 9261 1300Kanpur 161 207 55 424 39 537 1000 42339 26298 1391Lucknow 234 152 87 473 24 503 1000 26121 16528 1244Ludhiana 181 298 82 561 6 433 1000 11421 8103 1388Madurai 201 213 84 498 24 478 1000 9764 6996 817Mumbai 139 328 16 484 45 471 1000 115711 84894 7143Nagpur 162 165 95 421 25 554 1000 15281 11320 969Patna 187 162 24 373 41 586 1000 17203 11300 820Pune 222 223 33 477 19 503 1000 17689 12528 703Surat 178 127 116 421 6 573 1000 10182 7237 983Thane 156 305 49 510 37 453 1000 8584 6231 791Thane(Kalyan) 135 288 30 453 44 503 1000 9998 7062 798Vadodara 113 253 113 479 30 492 1000 7784 6046 892Varanasi 335 128 22 485 29 486 1000 9303 5894 951Visakhapatnam 128 206 114 448 40 512 1000 10080 7266 784

NSS Report No.462: Employment and Unemployment situation in cities and towns of India, 1999-2000 Appendix
A-58
Table (106) : Per thousand distribution of persons of age 15 years and above by broad current weekly activity status for each size class of town
age 15 yrs. and above urban male
working unem- not in total no. of persons state/all-India size class self-emp- regular casual total ployed labour estimated (00) sample of town loyed employees labour force all ages age 15 (of age 15 & above & above) (1) (2) (3) (4) (5) (6) (7) (8) (9) (10) (11) (12) Andhra Pradesh size class 1 224 343 128 695 46 259 1000 20534 13935 2608
size class 2 267 331 147 744 33 223 1000 67331 44753 3603size class 3 309 239 197 746 42 212 1000 22128 14720 1726all 267 315 153 735 37 228 1000 109993 73408 7937
Arunachal Pradesh size class 1 0 0 0 0 0 0 0 0 0 0size class 2 0 0 0 0 0 0 0 0 0 0size class 3 137 346 113 595 13 392 1000 347 202 330all 137 346 113 595 13 392 1000 347 202 330
Assam size class 1 0 0 0 0 0 0 0 0 0 0size class 2 284 356 73 713 49 238 1000 5904 4370 857size class 3 418 243 70 731 82 187 1000 7634 5240 1003all 357 294 71 723 67 210 1000 13538 9610 1860
Bihar size class 1 350 272 43 664 51 284 1000 9023 5627 455size class 2 346 218 94 658 65 278 1000 34490 21016 2879size class 3 434 197 136 767 50 183 1000 21270 12761 2004all 375 219 100 694 58 248 1000 64784 39403 5338
Goa size class 1 0 0 0 0 0 0 0 0 0 0size class 2 166 324 115 605 206 188 1000 1588 1267 225size class 3 111 347 146 603 74 323 1000 1707 1281 414all 138 335 130 604 140 256 1000 3295 2548 639

NSS Report No.462: Employment and Unemployment situation in cities and towns of India, 1999-2000 Appendix
A-59
Table (106) : Per thousand distribution of persons of age 15 years and above by broad current weekly activity status for each size class of town
age 15 yrs. and above urban male
working unem- not in total no. of persons state/all-India size class self-emp- regular casual total ployed labour estimated (00) sample of town loyed employees labour force all ages age 15 (of age 15 & above & above) (1) (2) (3) (4) (5) (6) (7) (8) (9) (10) (11) (12) Gujarat size class 1 277 284 197 758 20 222 1000 26356 18652 2255
size class 2 306 292 179 776 22 201 1000 27362 18514 2468size class 3 376 249 144 768 22 210 1000 20637 13843 1788all 314 277 176 768 21 211 1000 74356 51010 6511
Haryana size class 1 0 0 0 0 0 0 0 0 0 0
size class 2 291 387 67 745 20 235 1000 20212 14266 1355size class 3 360 201 136 698 52 250 1000 8285 5072 453all 309 338 85 732 29 239 1000 28497 19338 1808
Himachal Pradesh size class 1 0 0 0 0 0 0 0 0 0 0size class 2 138 448 54 639 107 254 1000 612 436 784size class 3 259 357 87 704 32 264 1000 1980 1424 1074all 231 378 80 689 49 262 1000 2591 1860 1858
Jammu & Kashmir size class 1 0 0 0 0 0 0 0 0 0 0size class 2 325 298 49 672 41 287 1000 4419 2999 1473size class 3 366 276 104 747 31 222 1000 3234 2072 982all 342 289 71 702 37 261 1000 7653 5071 2455
Karnataka size class 1 203 432 107 742 22 236 1000 16504 12697 1015size class 2 303 289 141 733 25 242 1000 27724 19452 2688size class 3 338 252 181 770 40 189 1000 23410 15640 1845all 288 315 145 747 29 223 1000 67638 47789 5548

NSS Report No.462: Employment and Unemployment situation in cities and towns of India, 1999-2000 Appendix
A-60
Table (106) : Per thousand distribution of persons of age 15 years and above by broad current weekly activity status for each size class of town
age 15 yrs. and above urban male
working unem- not in total no. of persons state/all-India size class self-emp- regular casual total ployed labour estimated (00) sample of town loyed employees labour force all ages age 15 (of age 15 & above & above) (1) (2) (3) (4) (5) (6) (7) (8) (9) (10) (11) (12) Kerala size class 1 0 0 0 0 0 0 0 0 0 0
size class 2 230 249 207 686 72 242 1000 15510 11707 2008size class 3 279 170 244 693 77 230 1000 18417 13527 2420all 256 207 227 690 75 236 1000 33927 25234 4428
Madhya Pradesh size class 1 301 320 107 728 55 217 1000 11088 7402 866
size class 2 330 292 99 721 41 238 1000 36471 23658 3766size class 3 339 252 140 731 49 220 1000 42585 27133 3062all 330 277 119 727 46 227 1000 90144 58193 7694
Maharastra size class 1 232 462 40 734 57 210 1000 88864 65928 5660size class 2 241 364 140 746 45 210 1000 66321 44664 4702size class 3 320 274 161 755 49 196 1000 26823 17488 1968all 247 402 91 741 52 208 1000 182008 128080 12330
Manipur size class 1 0 0 0 0 0 0 0 0 0 0size class 2 247 268 55 569 88 343 1000 987 696 777size class 3 422 205 90 718 8 274 1000 1166 762 880all 338 235 74 647 46 307 1000 2153 1458 1657
Meghalaya size class 1 0 0 0 0 0 0 0 0 0 0size class 2 170 335 70 575 44 381 1000 503 355 370size class 3 154 356 153 663 8 330 1000 925 540 340all 160 347 120 628 22 350 1000 1428 895 710
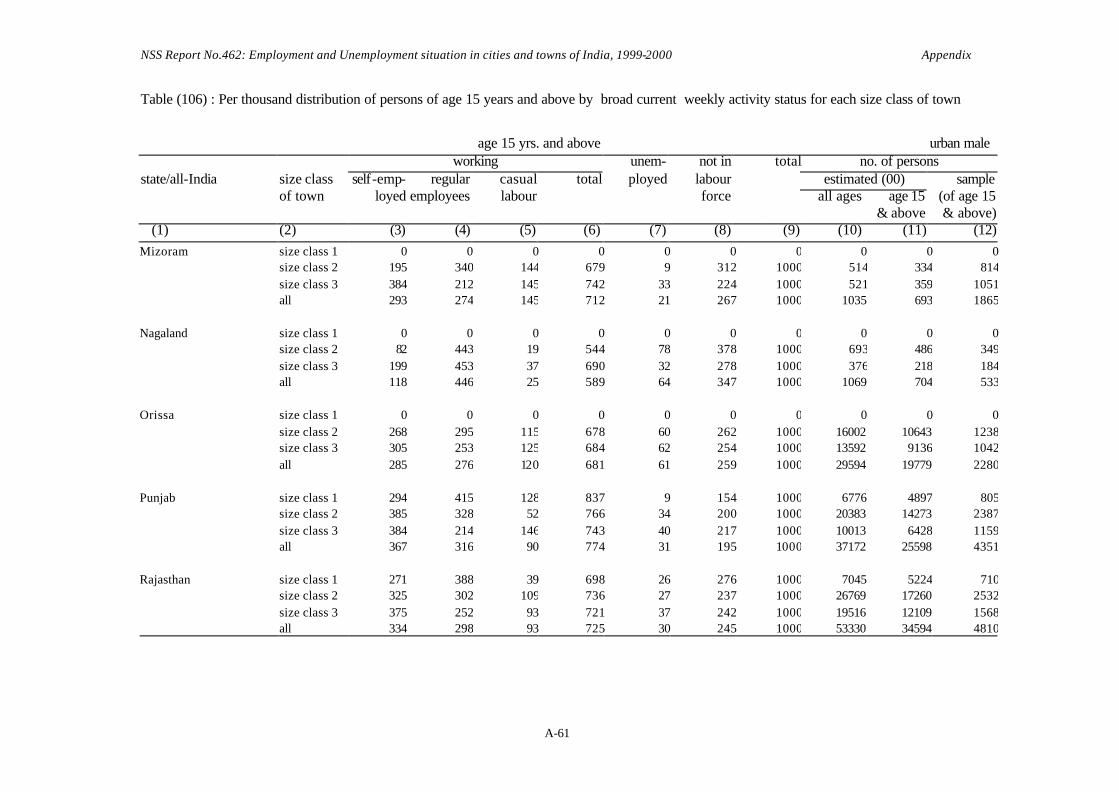
NSS Report No.462: Employment and Unemployment situation in cities and towns of India, 1999-2000 Appendix
A-61
Table (106) : Per thousand distribution of persons of age 15 years and above by broad current weekly activity status for each size class of town
age 15 yrs. and above urban male
working unem- not in total no. of persons state/all-India size class self-emp- regular casual total ployed labour estimated (00) sample of town loyed employees labour force all ages age 15 (of age 15 & above & above) (1) (2) (3) (4) (5) (6) (7) (8) (9) (10) (11) (12) Mizoram size class 1 0 0 0 0 0 0 0 0 0 0 size class 2 195 340 144 679 9 312 1000 514 334 814
size class 3 384 212 145 742 33 224 1000 521 359 1051all 293 274 145 712 21 267 1000 1035 693 1865
Nagaland size class 1 0 0 0 0 0 0 0 0 0 0size class 2 82 443 19 544 78 378 1000 693 486 349size class 3 199 453 37 690 32 278 1000 376 218 184all 118 446 25 589 64 347 1000 1069 704 533
Orissa size class 1 0 0 0 0 0 0 0 0 0 0size class 2 268 295 115 678 60 262 1000 16002 10643 1238size class 3 305 253 125 684 62 254 1000 13592 9136 1042all 285 276 120 681 61 259 1000 29594 19779 2280
Punjab size class 1 294 415 128 837 9 154 1000 6776 4897 805size class 2 385 328 52 766 34 200 1000 20383 14273 2387size class 3 384 214 146 743 40 217 1000 10013 6428 1159all 367 316 90 774 31 195 1000 37172 25598 4351
Rajasthan size class 1 271 388 39 698 26 276 1000 7045 5224 710size class 2 325 302 109 736 27 237 1000 26769 17260 2532size class 3 375 252 93 721 37 242 1000 19516 12109 1568all 334 298 93 725 30 245 1000 53330 34594 4810

NSS Report No.462: Employment and Unemployment situation in cities and towns of India, 1999-2000 Appendix
A-62
Table (106) : Per thousand distribution of persons of age 15 years and above by broad current weekly activity status for each size class of town
age 15 yrs. and above urban male
working unem- not in total no. of persons state/all-India size class self-emp- regular casual total ployed labour estimated (00) sample of town loyed employees labour force all ages age 15 (of age 15 & above & above) (1) (2) (3) (4) (5) (6) (7) (8) (9) (10) (11) (12) Sikkim size class 1 0 0 0 0 0 0 0 0 0 0
size class 2 0 0 0 0 0 0 0 0 0 0size class 3 308 369 56 734 46 219 1000 214 151 610all 308 369 56 734 46 219 1000 214 151 610
Tamil Nadu size class 1 236 367 142 746 40 214 1000 28172 20119 2262
size class 2 267 380 118 765 35 200 1000 43671 31995 3738size class 3 255 304 201 760 38 202 1000 33749 23926 2546all 255 353 151 759 37 204 1000 105592 76040 8546
Tripura size class 1 0 0 0 0 0 0 0 0 0 0size class 2 258 326 72 657 64 279 1000 796 635 442size class 3 206 357 138 701 24 275 1000 1283 852 805all 228 344 110 682 41 277 1000 2079 1487 1247
Uttar Pradesh size class 1 330 280 121 732 53 215 1000 47728 30450 2414size class 2 377 282 76 735 43 222 1000 71676 48064 5292size class 3 501 179 101 780 30 189 1000 54536 30646 3568all 399 252 96 747 42 211 1000 173941 109160 11274
West Bengal size class 1 335 326 103 764 50 186 1000 20588 16418 2066size class 2 304 296 118 718 77 205 1000 43587 32387 4002size class 3 345 273 137 756 56 189 1000 16433 11913 1633all 321 300 117 738 66 197 1000 80607 60718 7701

NSS Report No.462: Employment and Unemployment situation in cities and towns of India, 1999-2000 Appendix
A-63
Table (106) : Per thousand distribution of persons of age 15 years and above by broad current weekly activity status for each size class of town
age 15 yrs. and above urban male
working unem- not in total no. of persons state/all-India size class self-emp- regular casual total ployed labour estimated (00) sample of town loyed employees labour force all ages age 15 (of age 15 & above & above) (1) (2) (3) (4) (5) (6) (7) (8) (9) (10) (11) (12) Andaman & Nicobar Is. size class 1 0 0 0 0 0 0 0 0 0 0
size class 2 215 412 227 854 35 111 1000 405 297 400size class 3 0 0 0 0 0 0 0 0 0 0all 215 412 227 854 35 111 1000 405 297 400
Chandigarh size class 1 0 0 0 0 0 0 0 0 0 0
size class 2 259 443 30 733 37 231 1000 2954 2096 1492size class 3 366 484 81 931 2 67 1000 474 344 167all 274 449 38 761 32 208 1000 3428 2440 1659
Dadra & N. Haveli size class 1 0 0 0 0 0 0 0 0 0 0size class 2 0 0 0 0 0 0 0 0 0 0size class 3 268 471 98 837 18 145 1000 93 72 208all 268 471 98 837 18 145 1000 93 72 208
Daman & Diu size class 1 0 0 0 0 0 0 0 0 0 0size class 2 0 0 0 0 0 0 0 0 0 0size class 3 445 319 35 799 11 190 1000 267 183 467all 445 319 35 799 11 190 1000 267 183 467
Delh i size class 1 326 407 20 753 19 228 1000 39603 28054 1982
size class 2 250 426 81 757 79 164 1000 7524 5006 425size class 3 282 393 44 719 6 276 1000 1857 1337 226all 313 409 30 752 27 220 1000 48984 34398 2633
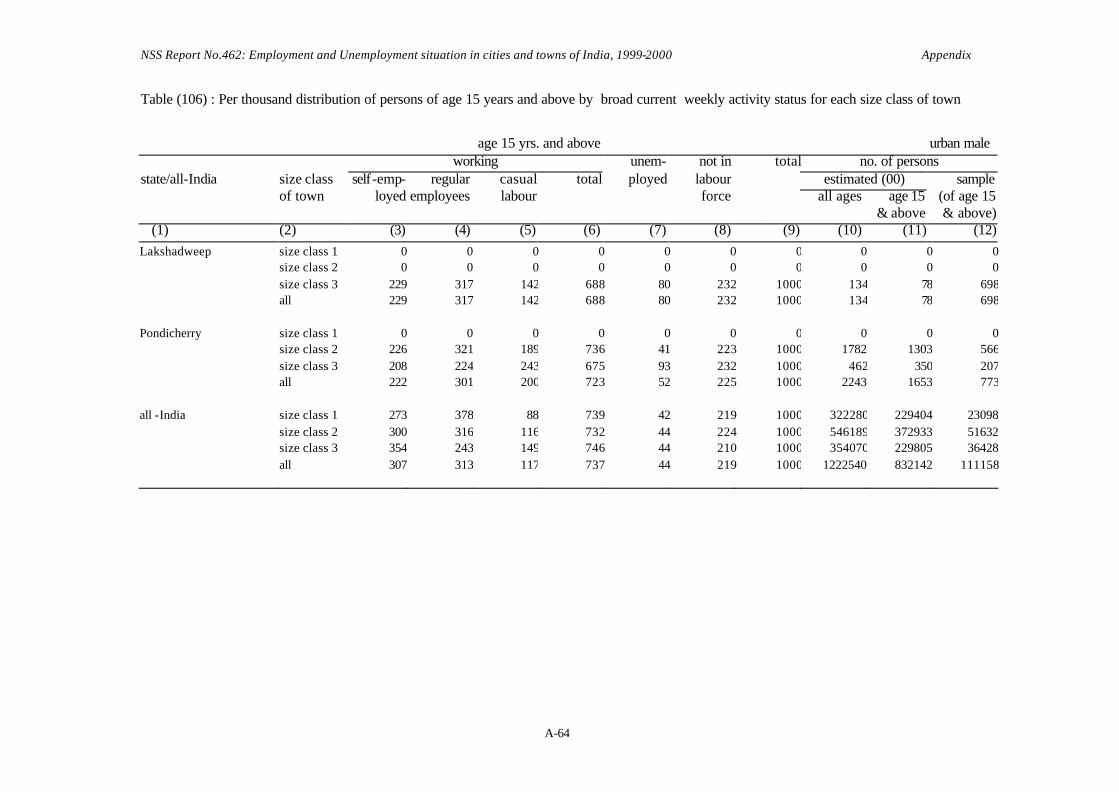
NSS Report No.462: Employment and Unemployment situation in cities and towns of India, 1999-2000 Appendix
A-64
Table (106) : Per thousand distribution of persons of age 15 years and above by broad current weekly activity status for each size class of town
age 15 yrs. and above urban male
working unem- not in total no. of persons state/all-India size class self-emp- regular casual total ployed labour estimated (00) sample of town loyed employees labour force all ages age 15 (of age 15 & above & above) (1) (2) (3) (4) (5) (6) (7) (8) (9) (10) (11) (12) Lakshadweep size class 1 0 0 0 0 0 0 0 0 0 0
size class 2 0 0 0 0 0 0 0 0 0 0size class 3 229 317 142 688 80 232 1000 134 78 698
all 229 317 142 688 80 232 1000 134 78 698 Pondicherry size class 1 0 0 0 0 0 0 0 0 0 0
size class 2 226 321 189 736 41 223 1000 1782 1303 566size class 3 208 224 243 675 93 232 1000 462 350 207all 222 301 200 723 52 225 1000 2243 1653 773
all -India size class 1 273 378 88 739 42 219 1000 322280 229404 23098size class 2 300 316 116 732 44 224 1000 546189 372933 51632size class 3 354 243 149 746 44 210 1000 354070 229805 36428all 307 313 117 737 44 219 1000 1222540 832142 111158
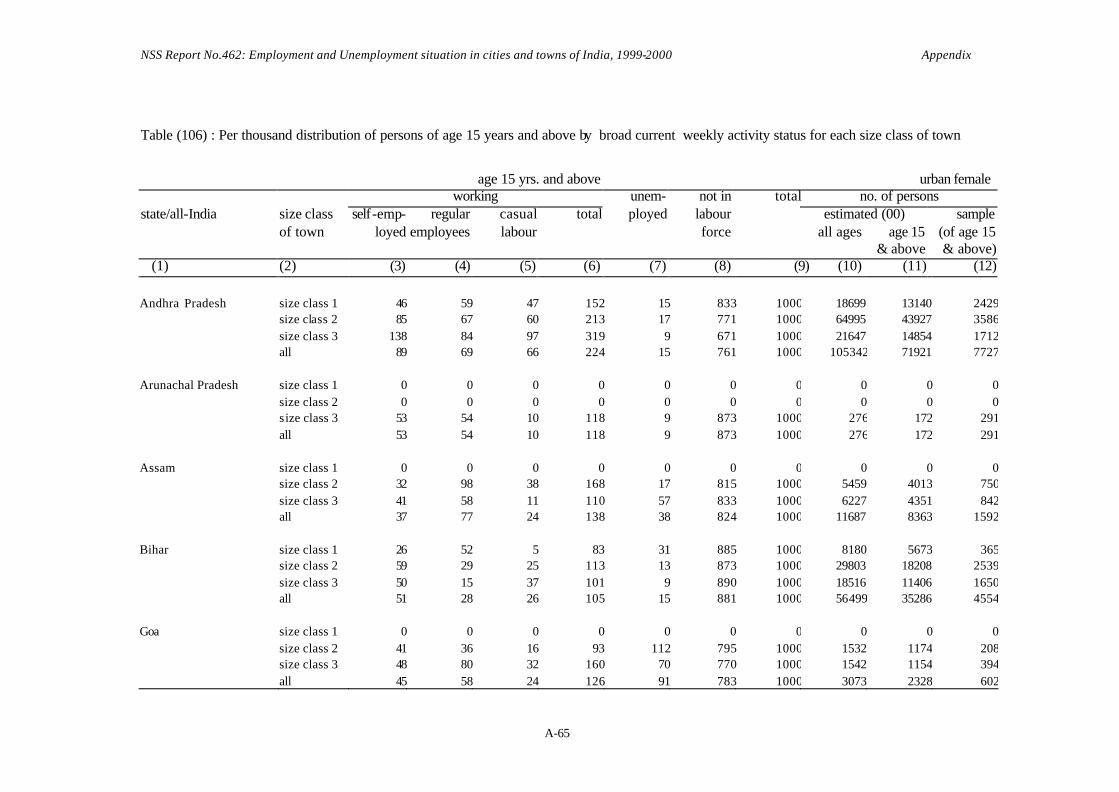
NSS Report No.462: Employment and Unemployment situation in cities and towns of India, 1999-2000 Appendix
A-65
Table (106) : Per thousand distribution of persons of age 15 years and above by broad current weekly activity status for each size class of town
age 15 yrs. and above urban female
working unem- not in total no. of persons state/all-India size class self-emp- regular casual total ployed labour estimated (00) sample of town loyed employees labour force all ages age 15 (of age 15 & above & above) (1) (2) (3) (4) (5) (6) (7) (8) (9) (10) (11) (12) Andhra Pradesh size class 1 46 59 47 152 15 833 1000 18699 13140 2429
size class 2 85 67 60 213 17 771 1000 64995 43927 3586size class 3 138 84 97 319 9 671 1000 21647 14854 1712all 89 69 66 224 15 761 1000 105342 71921 7727
Arunachal Pradesh size class 1 0 0 0 0 0 0 0 0 0 0size class 2 0 0 0 0 0 0 0 0 0 0size class 3 53 54 10 118 9 873 1000 276 172 291all 53 54 10 118 9 873 1000 276 172 291
Assam size class 1 0 0 0 0 0 0 0 0 0 0size class 2 32 98 38 168 17 815 1000 5459 4013 750size class 3 41 58 11 110 57 833 1000 6227 4351 842all 37 77 24 138 38 824 1000 11687 8363 1592
Bihar size class 1 26 52 5 83 31 885 1000 8180 5673 365size class 2 59 29 25 113 13 873 1000 29803 18208 2539size class 3 50 15 37 101 9 890 1000 18516 11406 1650all 51 28 26 105 15 881 1000 56499 35286 4554
Goa size class 1 0 0 0 0 0 0 0 0 0 0size class 2 41 36 16 93 112 795 1000 1532 1174 208size class 3 48 80 32 160 70 770 1000 1542 1154 394all 45 58 24 126 91 783 1000 3073 2328 602

NSS Report No.462: Employment and Unemployment situation in cities and towns of India, 1999-2000 Appendix
A-66
Table (106) : Per thousand distribution of persons of age 15 years and above by broad current weekly activity status for each size class of town
age 15 yrs. and above urban female
working unem- not in total no. of persons state/all-India size class self-emp- regular casual total ployed labour estimated (00) sample of town loyed employees labour force all ages age 15 (of age 15 & above & above) (1) (2) (3) (4) (5) (6) (7) (8) (9) (10) (11) (12) Gujarat size class 1 87 41 46 174 4 822 1000 22879 16787 2112
size class 2 44 51 58 152 9 838 1000 26575 19251 2480size class 3 81 52 45 178 4 818 1000 18444 13337 1689all 68 48 50 167 6 827 1000 67899 49375 6281
Haryana size class 1 0 0 0 0 0 0 0 0 0 0size class 2 56 64 11 131 6 862 1000 17851 11662 1217size class 3 92 63 54 210 6 785 1000 7329 4701 422all 67 64 24 154 6 840 1000 25180 16363 1639
Himachal Pradesh size class 1 0 0 0 0 0 0 0 0 0 0size class 2 20 80 13 113 9 878 1000 502 363 632size class 3 100 75 8 183 21 796 1000 1910 1318 1000all 83 76 9 168 18 814 1000 2411 1682 1632
Jammu & Kashmir size class 1 0 0 0 0 0 0 0 0 0 0size class 2 19 39 10 67 13 920 1000 3914 2812 1330size class 3 22 38 22 83 5 912 1000 2969 1938 859all 20 38 15 73 9 917 1000 6883 4750 2189
Karnataka size class 1 56 134 37 227 20 753 1000 17611 13298 990size class 2 80 76 51 207 5 788 1000 25294 18246 2494size class 3 148 39 76 263 13 724 1000 21793 15286 1836all 96 80 55 231 12 757 1000 64698 46830 5320

NSS Report No.462: Employment and Unemployment situation in cities and towns of India, 1999-2000 Appendix
A-67
Table (106) : Per thousand distribution of persons of age 15 years and above by broad current weekly activity status for each size class of town
age 15 yrs. and above urban female
working unem- not in total no. of persons state/all-India size class self-emp- regular casual total ployed labour estimated (00) sample of town loyed employees labour force all ages age 15 (of age 15 & above & above) (1) (2) (3) (4) (5) (6) (7) (8) (9) (10) (11) (12) Kerala size class 1 0 0 0 0 0 0 0 0 0 0
size class 2 72 97 30 198 85 717 1000 16554 12583 2186size class 3 119 73 46 238 54 708 1000 20492 15685 2803all 98 83 39 220 68 712 1000 37046 28268 4989
Madhya Pradesh size class 1 60 73 30 162 6 832 1000 11020 7014 822
size class 2 85 32 43 160 6 834 1000 33483 22539 3578size class 3 111 26 68 205 9 786 1000 37568 24361 2779all 94 35 52 181 7 812 1000 82071 53915 7179
Maharastra size class 1 55 108 13 175 20 805 1000 78400 56109 4744size class 2 66 59 41 166 9 824 1000 58330 39462 4380size class 3 115 40 85 240 15 744 1000 25825 17138 1907all 68 80 34 182 16 802 1000 162556 112709 11031
Manipur size class 1 0 0 0 0 0 0 0 0 0 0size class 2 170 98 10 278 28 693 1000 962 718 792size class 3 231 26 20 277 12 711 1000 1126 764 908all 201 61 15 278 20 703 1000 2089 1482 1700
Meghalaya size class 1 0 0 0 0 0 0 0 0 0 0size class 2 56 190 33 278 20 702 1000 463 324 400size class 3 94 160 34 288 21 691 1000 929 620 378all 81 170 33 284 21 695 1000 1392 944 778
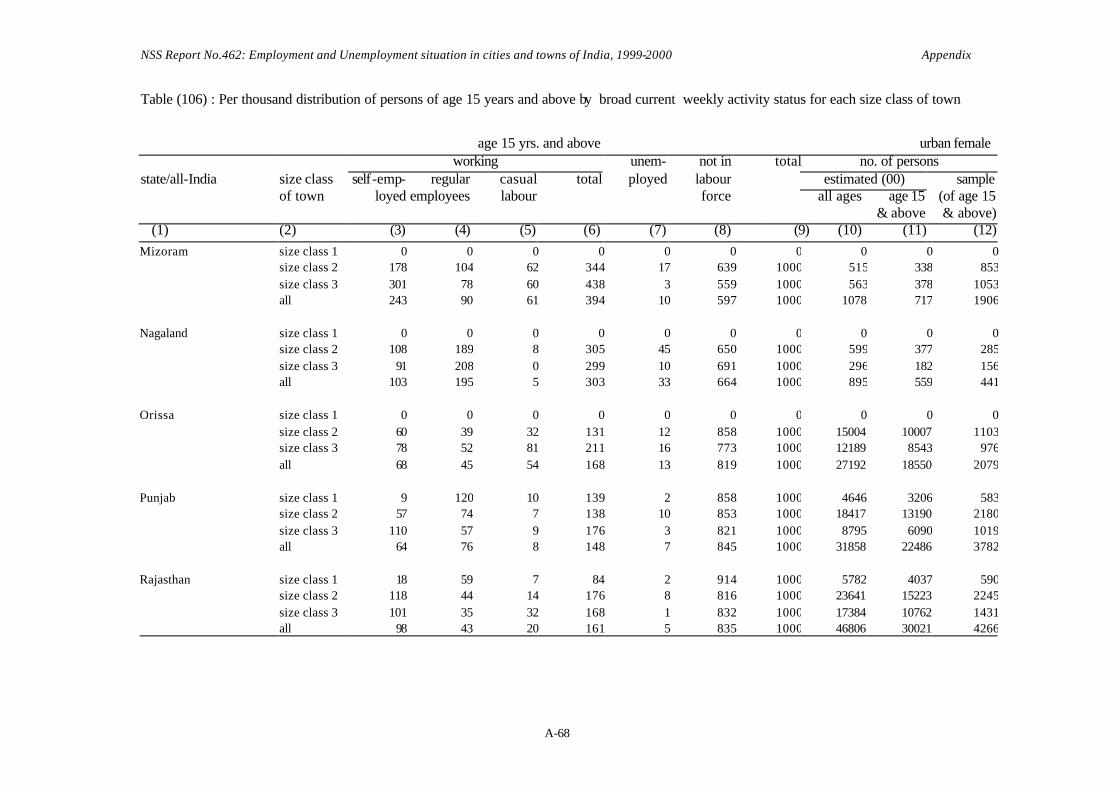
NSS Report No.462: Employment and Unemployment situation in cities and towns of India, 1999-2000 Appendix
A-68
Table (106) : Per thousand distribution of persons of age 15 years and above by broad current weekly activity status for each size class of town
age 15 yrs. and above urban female
working unem- not in total no. of persons state/all-India size class self-emp- regular casual total ployed labour estimated (00) sample of town loyed employees labour force all ages age 15 (of age 15 & above & above) (1) (2) (3) (4) (5) (6) (7) (8) (9) (10) (11) (12) Mizoram size class 1 0 0 0 0 0 0 0 0 0 0
size class 2 178 104 62 344 17 639 1000 515 338 853size class 3 301 78 60 438 3 559 1000 563 378 1053all 243 90 61 394 10 597 1000 1078 717 1906
Nagaland size class 1 0 0 0 0 0 0 0 0 0 0
size class 2 108 189 8 305 45 650 1000 599 377 285size class 3 91 208 0 299 10 691 1000 296 182 156all 103 195 5 303 33 664 1000 895 559 441
Orissa size class 1 0 0 0 0 0 0 0 0 0 0size class 2 60 39 32 131 12 858 1000 15004 10007 1103size class 3 78 52 81 211 16 773 1000 12189 8543 976all 68 45 54 168 13 819 1000 27192 18550 2079
Punjab size class 1 9 120 10 139 2 858 1000 4646 3206 583size class 2 57 74 7 138 10 853 1000 18417 13190 2180size class 3 110 57 9 176 3 821 1000 8795 6090 1019all 64 76 8 148 7 845 1000 31858 22486 3782
Rajasthan size class 1 18 59 7 84 2 914 1000 5782 4037 590size class 2 118 44 14 176 8 816 1000 23641 15223 2245size class 3 101 35 32 168 1 832 1000 17384 10762 1431all 98 43 20 161 5 835 1000 46806 30021 4266

NSS Report No.462: Employment and Unemployment situation in cities and towns of India, 1999-2000 Appendix
A-69
Table (106) : Per thousand distribution of persons of age 15 years and above by broad current weekly activity status for each size class of town
age 15 yrs. and above urban female
working unem- not in total no. of persons state/all-India size class self-emp- regular casual total ployed labour estimated (00) sample of town loyed employees labour force all ages age 15 (of age 15 & above & above) (1) (2) (3) (4) (5) (6) (7) (8) (9) (10) (11) (12) Sikkim size class 1 0 0 0 0 0 0 0 0 0 0
size class 2 0 0 0 0 0 0 0 0 0 0size class 3 34 170 36 240 43 717 1000 177 117 445all 34 170 36 240 43 717 1000 177 117 445
Tamil Nadu size class 1 73 152 30 256 12 732 1000 25007 18594 2082
size class 2 109 101 34 244 19 737 1000 41824 30796 3631size class 3 120 109 82 310 18 672 1000 34004 24842 2714all 104 116 49 269 17 714 1000 100836 74232 8427
Tripura size class 1 0 0 0 0 0 0 0 0 0 0size class 2 6 115 15 136 13 851 1000 782 578 414size class 3 23 48 14 84 9 907 1000 1100 736 752all 16 77 14 107 11 882 1000 1882 1314 1166
Uttar Pradesh size class 1 61 52 10 123 5 872 1000 44848 27085 2142size class 2 59 42 10 110 9 881 1000 62823 39868 4633size class 3 136 21 13 170 2 828 1000 46885 27629 3258all 82 39 11 131 6 863 1000 154555 94581 10033
West Bengal size class 1 48 81 23 152 16 832 1000 19282 14477 1713size class 2 48 48 21 116 23 860 1000 40308 29231 3584size class 3 127 51 26 204 14 781 1000 15760 10864 1500all 64 57 23 143 20 837 1000 75349 54572 6797

NSS Report No.462: Employment and Unemployment situation in cities and towns of India, 1999-2000 Appendix
A-70
Table (106) : Per thousand distribution of persons of age 15 years and above by broad current weekly activity status for each size class of town
age 15 yrs. and above urban female
working unem- not in total no. of persons state/all-India size class self-emp- regular casual total ployed labour estimated (00) sample of town loyed employees labour force all ages age 15 (of age 15 & above & above) (1) (2) (3) (4) (5) (6) (7) (8) (9) (10) (11) (12) Andaman & Nicobar Is. size class 1 0 0 0 0 0 0 0 0 0 0
size class 2 108 101 59 269 71 661 1000 393 272 365size class 3 0 0 0 0 0 0 0 0 0 0all 108 101 59 269 71 661 1000 393 272 365
Chandigarh size class 1 0 0 0 0 0 0 0 0 0 0
size class 2 31 145 9 185 46 769 1000 2759 2019 1361size class 3 31 32 0 63 111 826 1000 353 211 120all 31 134 8 174 52 774 1000 3112 2231 1481
Dadra & N. Haveli size class 1 0 0 0 0 0 0 0 0 0 0size class 2 0 0 0 0 0 0 0 0 0 0size class 3 64 42 39 145 0 855 1000 80 55 159all 64 42 39 145 0 855 1000 80 55 159
Daman & Diu size class 1 0 0 0 0 0 0 0 0 0 0size class 2 0 0 0 0 0 0 0 0 0 0size class 3 134 72 21 228 20 753 1000 244 184 478all 134 72 21 228 20 753 1000 244 184 478
Delhi size class 1 40 98 6 143 6 851 1000 33732 23761 1633
size class 2 50 66 3 119 10 871 1000 7341 4526 381size class 3 55 47 30 131 0 869 1000 1289 902 156all 42 91 6 139 7 854 1000 42362 29189 2170

NSS Report No.462: Employment and Unemployment situation in cities and towns of India, 1999-2000 Appendix
A-71
Table (106) : Per thousand distribution of persons of age 15 years and above by broad current weekly activity status for each size class of town
age 15 yrs. and above urban female
working unem- not in total no. of persons state/all-India size class self-emp- regular casual total ployed labour estimated (00) sample of town loyed employees labour force all ages age 15 (of age 15 & above & above) (1) (2) (3) (4) (5) (6) (7) (8) (9) (10) (11) (12) Lakshadweep size class 1 0 0 0 0 0 0 0 0 0 0
size class 2 0 0 0 0 0 0 0 0 0 0size class 3 103 71 5 179 58 763 1000 129 85 754
all 103 71 5 179 58 763 1000 129 85 754
Pondicherry size class 1 0 0 0 0 0 0 0 0 0 0size class 2 62 104 72 238 11 752 1000 2010 1430 605size class 3 55 53 14 121 40 839 1000 471 365 220all 60 93 60 214 17 769 1000 2480 1795 825
all -India size class 1 55 91 21 167 13 820 1000 290085 203180 20205size class 2 71 60 33 164 16 820 1000 502132 343138 48212size class 3 111 52 54 217 14 769 1000 326313 219029 34661all 78 66 36 180 14 806 1000 1118531 765347 103078

NSS Report No.462: Employment and Unemployment situation in cities and towns of India, 1999-2000 Appendix
A-72
Table (106) : Per thousand distribution of persons of age 15 years and above by broad current weekly activity status for each size class of town
age 15 yrs. and above urban persons
working unem- not in total no. of persons state/all-India size class self-emp- regular casual total ployed labour estimated (00) sample of town loyed employees labour force all ages age 15 (of age 15 & above & above) (1) (2) (3) (4) (5) (6) (7) (8) (9) (10) (11) (12) Andhra Pradesh size class 1 138 205 89 432 31 537 1000 39233 27074 5037 size class 2 177 200 104 481 25 494 1000 132326 88680 7189
size class 3 223 161 147 531 26 443 1000 43776 29574 3438all 179 193 110 482 26 492 1000 215335 145329 15664
Arunachal Pradesh size class 1 0 0 0 0 0 0 0 0 0 0size class 2 0 0 0 0 0 0 0 0 0 0size class 3 99 212 66 376 11 613 1000 623 374 621all 99 212 66 376 11 613 1000 623 374 621
Assam size class 1 0 0 0 0 0 0 0 0 0 0size class 2 164 232 56 452 34 514 1000 11363 8383 1607size class 3 247 159 43 449 71 480 1000 13862 9591 1845all 208 193 49 451 53 496 1000 25224 17973 3452
Bihar size class 1 187 162 24 373 41 586 1000 17203 11300 820size class 2 213 130 62 405 41 554 1000 64293 39223 5418size class 3 253 111 89 452 31 517 1000 39787 24167 3654all 222 129 65 415 38 547 1000 121283 74690 9892
Goa size class 1 0 0 0 0 0 0 0 0 0 0size class 2 106 185 67 359 161 480 1000 3120 2441 433size class 3 81 220 92 393 72 535 1000 3249 2435 808all 94 203 79 376 116 508 1000 6369 4876 1241

NSS Report No.462: Employment and Unemployment situation in cities and towns of India, 1999-2000 Appendix
A-73
Table (106) : Per thousand distribution of persons of age 15 years and above by broad current weekly activity status for each size class of town
age 15 yrs. and above urban persons
working unem- not in total no. of persons state/all-India size class self-emp- regular casual total ployed labour estimated (00) sample of town loyed employees labour force all ages age 15 (of age 15 & above & above) (1) (2) (3) (4) (5) (6) (7) (8) (9) (10) (11) (12) Gujarat size class 1 187 169 125 481 13 506 1000 49236 35440 4367
size class 2 172 169 117 458 15 526 1000 53938 37766 4948size class 3 231 152 95 479 13 508 1000 39082 27180 3477all 193 165 114 472 14 514 1000 142255 100385 12792
Haryana size class 1 0 0 0 0 0 0 0 0 0 0
size class 2 185 242 42 469 14 517 1000 38064 25928 2572size class 3 231 135 97 463 30 507 1000 15613 9773 875all 198 212 57 467 18 514 1000 53677 35701 3447
Himachal Pradesh size class 1 0 0 0 0 0 0 0 0 0 0size class 2 84 281 35 400 63 537 1000 1113 799 1416size class 3 183 221 49 453 27 520 1000 3889 2742 2074all 161 235 46 441 35 524 1000 5003 3541 3490
Jammu & Kashmir size class 1 0 0 0 0 0 0 0 0 0 0size class 2 177 173 30 379 27 594 1000 8333 5811 2803size class 3 200 161 65 426 18 556 1000 6203 4010 1841all 186 168 44 398 24 578 1000 14536 9821 4644
Karnataka size class 1 128 280 71 479 21 500 1000 34115 25995 2005size class 2 195 186 97 478 15 506 1000 53018 37698 5182size class 3 244 146 129 519 27 454 1000 45203 30925 3681all 193 199 100 492 21 488 1000 132336 94619 10868

NSS Report No.462: Employment and Unemployment situation in cities and towns of India, 1999-2000 Appendix
A-74
Table (106) : Per thousand distribution of persons of age 15 years and above by broad current weekly activity status for each size class of town
age 15 yrs. and above urban persons
working unem- not in total no. of persons state/all-India size class self-emp- regular casual total ployed labour estimated (00) sample of town loyed employees labour force all ages age 15 (of age 15 & above & above) (1) (2) (3) (4) (5) (6) (7) (8) (9) (10) (11) (12) Kerala size class 1 0 0 0 0 0 0 0 0 0 0
size class 2 148 170 115 433 79 488 1000 32064 24290 4194size class 3 193 118 138 449 65 487 1000 38909 29213 5223all 173 142 128 442 71 487 1000 70973 53502 9417
Madhya Pradesh size class 1 183 200 69 453 31 516 1000 22107 14417 1688
size class 2 211 165 72 448 24 529 1000 69954 46197 7344size class 3 231 145 106 482 30 488 1000 80153 51494 5841all 216 161 87 464 28 508 1000 172214 112107 14873
Maharastra size class 1 151 299 27 477 40 483 1000 167264 122037 10404size class 2 159 221 94 474 28 498 1000 124651 84126 9082size class 3 218 158 123 500 33 467 1000 52649 34625 3875all 163 251 64 479 35 486 1000 344564 240789 23361
Manipur size class 1 0 0 0 0 0 0 0 0 0 0size class 2 208 182 32 422 58 521 1000 1949 1414 1569size class 3 326 116 55 497 10 493 1000 2293 1526 1788all 269 147 44 461 33 506 1000 4242 2940 3357
Meghalaya size class 1 0 0 0 0 0 0 0 0 0 0size class 2 115 266 52 433 33 534 1000 966 678 770size class 3 122 251 89 462 15 523 1000 1854 1160 718all 120 256 76 452 22 527 1000 2820 1838 1488

NSS Report No.462: Employment and Unemployment situation in cities and towns of India, 1999-2000 Appendix
A-75
Table (106) : Per thousand distribution of persons of age 15 years and above by broad current weekly activity status for each size class of town
age 15 yrs. and above urban persons
working unem- not in total no. of persons state/all-India size class self-emp- regular casual total ployed labour estimated (00) sample of town loyed employees labour force all ages age 15 (of age 15 & above & above) (1) (2) (3) (4) (5) (6) (7) (8) (9) (10) (11) (12) Mizoram size class 1 0 0 0 0 0 0 0 0 0 0
size class 2 187 221 102 510 13 477 1000 1030 673 1667size class 3 341 143 102 586 18 396 1000 1083 737 2104all 268 180 102 550 15 434 1000 2113 1409 3771
Nagaland size class 1 0 0 0 0 0 0 0 0 0 0
size class 2 94 332 14 440 63 497 1000 1291 863 634size class 3 150 342 20 512 22 466 1000 673 399 340all 111 335 16 462 50 487 1000 1964 1262 974
Orissa size class 1 0 0 0 0 0 0 0 0 0 0size class 2 167 171 75 413 36 551 1000 31006 20649 2341size class 3 195 156 104 455 40 505 1000 25781 17679 2018all 180 164 88 432 38 530 1000 56786 38329 4359
Punjab size class 1 181 298 82 561 6 433 1000 11421 8103 1388size class 2 228 206 31 464 22 513 1000 38800 27463 4567size class 3 250 138 79 467 22 511 1000 18809 12518 2178all 226 204 52 481 20 499 1000 69030 48084 8133
Rajasthan size class 1 161 245 25 430 15 554 1000 12827 9261 1300size class 2 228 181 65 474 18 508 1000 50410 32483 4777size class 3 246 150 64 460 20 520 1000 36900 22871 2999all 225 179 59 463 18 519 1000 100136 64615 9076

NSS Report No.462: Employment and Unemployment situation in cities and towns of India, 1999-2000 Appendix
A-76
Table (106) : Per thousand distribution of persons of age 15 years and above by broad current weekly activity status for each size class of town
age 15 yrs. and above urban persons
working unem- not in total no. of persons state/all-India size class self-emp- regular casual total ployed labour estimated (00) sample of town loyed employees labour force all ages age 15 (of age 15 & above & above) (1) (2) (3) (4) (5) (6) (7) (8) (9) (10) (11) (12) Sikkim size class 1 0 0 0 0 0 0 0 0 0 0
size class 2 0 0 0 0 0 0 0 0 0 0size class 3 188 283 48 519 45 437 1000 391 267 1055all 188 283 48 519 45 437 1000 391 267 1055
Tamil Nadu size class 1 158 264 88 510 27 463 1000 53179 38713 4344
size class 2 190 243 77 509 27 463 1000 85496 62792 7369size class 3 186 205 140 531 28 441 1000 67753 48768 5260all 180 236 100 517 27 456 1000 206428 150272 16973
Tripura size class 1 0 0 0 0 0 0 0 0 0 0size class 2 138 225 45 409 40 551 1000 1578 1213 856size class 3 121 214 80 415 17 568 1000 2383 1588 1557all 129 219 65 412 27 561 1000 3961 2801 2413
Uttar Pradesh size class 1 203 173 69 445 30 524 1000 92576 57534 4556size class 2 233 173 46 452 28 521 1000 134499 87932 9925size class 3 328 104 59 491 17 492 1000 101421 58275 6826all 251 153 56 461 25 514 1000 328496 203741 21307
West Bengal size class 1 201 211 65 477 34 489 1000 39869 30895 3779size class 2 182 178 72 433 52 516 1000 83894 61618 7586size class 3 241 167 84 493 36 471 1000 32193 22777 3133all 199 185 73 456 44 500 1000 155956 115290 14498

NSS Report No.462: Employment and Unemployment situation in cities and towns of India, 1999-2000 Appendix
A-77
Table (106) : Per thousand distribution of persons of age 15 years and above by broad current weekly activity status for each size class of town
age 15 yrs. and above urban persons
working unem- not in total no. of persons state/all-India size class self-emp- regular casual total ployed labour estimated (00) sample of town loyed employees labour force all ages age 15 (of age 15 & above & above) (1) (2) (3) (4) (5) (6) (7) (8) (9) (10) (11) (12) Andaman & Nicobar Is. size class 1 0 0 0 0 0 0 0 0 0 0
size class 2 164 264 147 574 52 374 1000 798 570 765size class 3 0 0 0 0 0 0 0 0 0 0all 164 264 147 574 52 374 1000 798 570 765
Chandigarh size class 1 0 0 0 0 0 0 0 0 0 0
size class 2 147 297 20 464 41 495 1000 5712 4116 2853size class 3 238 312 50 600 44 356 1000 827 555 287all 158 299 23 480 42 478 1000 6539 4671 3140
Dadra & N. Haveli size class 1 0 0 0 0 0 0 0 0 0 0size class 2 0 0 0 0 0 0 0 0 0 0size class 3 180 286 73 539 10 451 1000 174 127 367all 180 286 73 539 10 451 1000 174 127 367
Daman & Diu size class 1 0 0 0 0 0 0 0 0 0 0size class 2 0 0 0 0 0 0 0 0 0 0size class 3 289 195 28 512 15 472 1000 511 367 945
all 289 195 28 512 15 472 1000 511 367 945
Delhi size class 1 195 265 14 474 13 513 1000 73335 51816 3615size class 2 155 255 44 454 46 500 1000 14865 9532 806size class 3 191 253 38 482 4 514 1000 3146 2239 382
all 189 263 19 471 18 511 1000 91346 63587 4803

NSS Report No.462: Employment and Unemployment situation in cities and towns of India, 1999-2000 Appendix
A-78
Table (106) : Per thousand distribution of persons of age 15 years and above by broad current weekly activity status for each size class of town
age 15 yrs. and above urban persons
working unem- not in total no. of persons state/all-India size class self-emp- regular casual total ployed labour estimated (00) sample of town loyed employees labour force all ages age 15 (of age 15 & above & above) (1) (2) (3) (4) (5) (6) (7) (8) (9) (10) (11) (12) Lakshadweep size class 1 0 0 0 0 0 0 0 0 0 0
size class 2 0 0 0 0 0 0 0 0 0 0size class 3 163 189 71 422 69 509 1000 262 163 1452
all 163 189 71 422 69 509 1000 262 163 1452
Pondicherry size class 1 0 0 0 0 0 0 0 0 0 0size class 2 140 207 128 475 25 500 1000 3792 2732 1171size class 3 130 137 126 392 66 542 1000 932 715 427all 138 193 127 458 34 508 1000 4724 3447 1598
all -India size class 1 171 243 56 470 28 502 1000 612366 432584 43303size class 2 190 194 76 460 30 510 1000 1048322 716071 99844size class 3 235 149 102 487 30 483 1000 680383 448834 71089all 198 195 78 470 30 500 1000 2341070 1597489 214236