Embed Size (px)
Citation preview

P L O Y i v l E j T r
P A Y R O L L S
d e t a i l e d r e p o r t FEBRUARY 1947
UNITED STATES DEPARTMENT OF LABOR 8UREAU OF LABOR STATISTICS
EMPLOYMENT STATIS TIC S DIVISION
Digitized for FRASER http://fraser.stlouisfed.org/ Federal Reserve Bank of St. Louis

With this release, the Bureau of Labor Statistics presents another of a series of periodic revisions of estimates of the number, of employees in nonagricultural establishments. The chief purpose of these revisions is to adjust the levels ef employment estimates to 1945 benchmark- data made available by unemployment compensation agencies and the Bureau of Old Age and Survivois Insurance. The present revision also includes a new type of construction estimate which is mere consistent with the estimating procedure employed in ether industries. In addition, federal force account construction employment has been transferred from the construction segment to government*
Bach of the industry divisions is affected by the present revision.In trade, construction, government, and finance, service and miscellaneous the estimates have been revised back to January 1939. In mining* transportation and public utilities no revisions were necessary prior to 1944* Manufacturing,which had previously been adjusted to 1944 levels, are now revised back to January 1945. In revising manufacturing, adjustments have been made in each of the 30 major industry groups comprising the industry division, 'However, nc revisions have as yet been made in the individual manufacturing industries. Estimates for the industries, currently based on the 1939 Census of Manufactures, are now in the process of revision*As the .estimates of employment in the industries comprising a jnajor group are corrected, tljey will be released.
ITature and Extent of R^visicns - In all but one of the industry divisions the revisions have resulted in raising the levels of employment;The Magnitude of the revisions in trade, raining, and finance, service, and miscellaneous was very substantial. Only minor upward adjustments were necessary in manufacturing, government, and transportation and public utilities* Only in construction has the estimate of employment been lowered. Construction employment, which was formerly derived from the Bureau’s estimates of the dollar volume of construction, is lower by approximately 3 percent in 1946*This results partly from the exclusion of Federal force account employment, as noted above, and- from the shift to estimating employment on the basis of establishment reports to State unemployment compensation agencies.
How Bnployment Estimates are Made - Estimates of changes in the level of employment are based on reports from a sample of establishments, inasmuch as full coverage is deemed to be prohibitively costly and time- consuming. In using a sample, it is essential that a sound basis be established from which estimates may be carried forward. This basis or "■benchmark” is either a complete count or an estimate with a satisfactory degree of accuracy* When a new benchmark becomes available, estimates prepared since the last benchmark are reviewed to determine if any adjustment of level is required*This is the basic principle of employment estimating used by the 3LS* It yields a satisfactory compromise between a slow but highly accurate complete count, on the one hand, and a rapid but less accurate sample count on the other.
Briefly, BLS computes employment estimates as follows: first, a benchmark or level of employment is determined; seconi, a sample of establishments is selected; and third, changes in.employment indicated by this reporting
Revised.Estimates of Ncnagricultural Employees
Digitized for FRASER http://fraser.stlouisfed.org/ Federal Reserve Bank of St. Louis

sample are applied to the 'benchmark tc determine what the monthly estimates of employment are between benchmark periods. For example, if the latest cemplete data on employment for an industry is 40,200 in September 1945 and if the industry has a reporting sample cf 13 establishments, employing 23,200 workers in September and 23,800 in October, the October estimate is obtained as follows:
104;g0Q, x 23,800 ,23,200 41,240Why Revisions are Necessary - Because the existence of new firms
is not readily aacertainable, they are not introduced into the BLS sample until after they have been in operation for some time. This characteristic causes a rather consistent understatement which becomes larger from year tc y ar. It is important, therefore, that estimates not be allowed to go uncorrected for too long a period. Unf6rtunately, insufficient funds ,and thepressure of special assignments during the war period have delayed the adjustment of many of the nonmanufacturing industry divisions-for several years. For this reason, the present revision corrects for the downward bias that has accumulated in the ncnmanufacturing series since 1941;Revisions in some industry divisions have been carried back tc 1939 in order tc incorporate greater refinements in methodology and new source materials have become available. For example, improved data on the small-firm .component of the trade and service industries, supplied by the Bureau of Old Age and Survivors Insurance, ma.de possible refinements in these series back to 1939.
Sources of Benchmark Bata - In preparing estimates for employment prior to 193§, the Bureau of Labor Statistics used the various industrial censuses, taken by the Bureau of the Census, as a source of benchmark data.Since that time, data obtained from unemployment compensation agencies and the Bureau of Old Age and Survivors Insurance are th<= main bases for benchmarks. There are some notable exceptions. Benchmarks for State end local government, for example, are based on data compiled by the Bureau of the Onsus while data on Federal Government employment is made available’by the U. S. Civil Service Commission. For railroads, the source is the Interstate Commerce Commission' and for. water'transportation, the U. S. Maritime Commission.
Projection of Estimates - In general data showing month-to month changes in employment r^flpct th=> fluctuations shown by establishments reporting to the-BIS* However, the usual estirtiating method is inadequate in finance and service, where a preponderance of small establishments enter and leave the business population at a high rate. A special sampling procedure has been introduced, involving the scientific selection of a sample- .of cities and a representative list of blocks in these cities. .Bata obtained from the establishments in these blocks yield substantially better estimates of month to. month changes in employment in th* s°rvic<= and finance industries. For railroads, complete tabulations of reports are available..
Presentation of Estimates - Summery table 16 of the Detailed Employment Report foy; February 1947. presents revised estimates of employees by. industry division from 1939 through 1946. A more detailed technical statement of the methodology used in adjusting each series will be available shortly.
Digitized for FRASER http://fraser.stlouisfed.org/ Federal Reserve Bank of St. Louis

April 15, 1947 U, 3* Department of Labor Schloss - 351Bureau of Labor Statistics
Employment and Occupational Outlook Branch Division of Employment Statistics
EMPLOYMENT AND PAY ROLLSDetailed ReportFebruary 1947
TAB IE CONTENTS PAGE1 Estimated number of production workers in manufacturing industries...* 22 Indexes of product ion -v/orker employment and pay rails in manu
facturing industries ....................... 83 Estimated number of employees in selected nonmaimfacturing industries. 144 Percentage changes in employment and pay rolls in selected nonmanu-
faoturing industries. . . . . . ....... .................145 Indexes of employment and pay rolls in selected nonmanufacturing
industries ........... ............... ...... . 156 Estimated number ®f employees in nonagricultural establishments * by
industry division*.o».................. ....................c....... 167 Estimated number of employees in manufacturing industries, by major
industry group...... ............. .... ......... .......... . 178 Estimated number of employees in nonagricultural establishments, by
State.? January 1 9 4 7 . . . . . . . . . .......... . 189 Employment and pay rolls in regular Foderal services and Government
Corporations, in seleoted m o n t h s ....... •••••••.•«.•••...» 2010 Personnel and pay of the military branch of the Federal Government,
in selected per iods •••••»»».»•»..«...... ............ .......... 2111 Total omploymont and pay rolls in United States Navy Yards and Private
Shipyards within Continental U* S®, by shipbuilding region*.••... *..* 2212 Estimated employment and pay rolls on construction within Continental
United S t a t e s 23
SUPPLEMENT13 Estimated number of production workers and indexes of production- .
worker employment and pay rolls in manufacturing industries* 1945and ,1946a....... ..... ,. . o ....... ............... *.......... 24
14 Estimated number of employees and indexes of employment and pay rollsin selected nonmanufacturing industries, 1945 and 1946*.............. 30
15 Revised estimates of manufacturing production workers and indexes ofproduotion-worker employment and pay rolls, by major industry group, January 1945 - December 1 9 4 6 » « . « . 31
16 Revised estimates of employees in nonagricultural establishments, byindustry division, January 1939 - December 1 9 4 6 . . . . . . . ..43i*
TECHNIGAL NOTEExplanation of Nonagricultural Adjustment............ ...........
LS 47-3086
Digitized for FRASER http://fraser.stlouisfed.org/ Federal Reserve Bank of St. Louis

Table 1. - Estimated Number of Prod"ction Workers in Manufacturing Industries l/(In thousands)
2*
Industry Group [ Feb. — And Industry j 1947
Jan.1947
Dec . 1946
Feb.1946
» ‘ALL MANUFACTURING l/ Il2,601 12,513 12,514 10,147DURABLE GOODS 1/ e,r,o-3. 6,426 6,393 4,522NONDURABLE GOODS l/ j
Durable Goods !; 6,098[i
6,087 6,121 5,625
IRON AND STEEL AND TFEIR PRODUCTS I/' i Blast furnaces, steel works, and
i 1,5621 1,552 1,521 877rolling wills. 483.3 479,7 467.0 169;9Gray-iron and semi-steel castings 87.1 8S.2 84.4 71.6Malleable-iron castings I 25.4 25.1 24.2 17.7Steel castings 4J.8 50,5 51.5 26.3Cast-iron pipe and fittings 20.1 19.8 19,2 14.6Tin cans and other tinware .. 41,3 41.6 4U5 28.9Wire drawn, from purchased rods 30.1 * 30.5' 29.9 15.4Wirework 39.7 41.9 40.5 28.8Cutlery and edge toolsTools (except edge tools;-.machine |
27.8! ’ !
27.8i
27.7 21.6tools, files, and saws) 26.7’ 26.7 26.8 21.5
Hardware 50.9- 50.1. : -49.6 38.3Plumbers* supplies Stoves) oil.burners ,*. and. heating equipment not elsewhere
30.7. ‘ ’30.11
;/29.S 22.0
classified Steam and hct-water heating
63.4 62.7 60.8 44.0apparatus and steam fittings Stamped- and enameled' ware and
52,5 52.6 51.0 34.6galvani zing.Fabricated structural and
85.8 84.9 84.5 58.8ornamental metalwork
Metal doors, sash, frames, molding,68.0 57.5 57.1 32.2
and trim 10.1 10.2 10.1 6.8Bolts, ftuts-, Washers, and rivets 21.7 21.6 21.2 14.8Forgings, iron and steel Wrought pipe,, .welded and heavy-
• 27*3 26.9' 23.7 22.9rivetedScrew .machine products and wood
’13.8 ' 13;6 • '13i2 7.1screws 29.5 29.4 29.3 •25.9Steel barrels,, kegs, and drums 6.0 6.2 6.1 2.7Firearms 14.4 14.3 14.0 10.9
ELECTRICAL MACHINERY, l/ 601. 598 ■597 353Electrical equipment 317.9 315.5 ' -314V8 168.1Radios and phonographs 92.8 92.8 93.5 64.9Communication equipment 92.2 92.4 92.6 66.4
Digitized for FRASER http://fraser.stlouisfed.org/ Federal Reserve Bank of St. Louis

Table 1*-Estimated Number of Production Workers in Manufacturing Industries l/ ContQ(In thousands)
3.
Industry Group and Industry
Feb.1947
Jan.1947. / . ......
I Dec. | 1946
Feb.1946
MACHINERY, EXCEPT ELECTRICAL l/ 1,178 1,171 | 1,161 861Machinery and machine-shop products 383.5 381.0 ! 379.6 295.0Engines and turbines 45.5 45.4 ! 45.6 24,8Tractors 55.0 . 54.8 j 54.5 25,2Agricultural machinery, excluding tractors 46,4 45.6 i 44.8 29.7Machine tools 59.0 59.8 I 60.6 58.4Machine-tool accessories 50.1 51,3 I 51.5 45.5Textile machinery 36.9 36.3 | 35.3 26.6Pumps and pumping equipment 59-4 58.8 i 58*9 47.5Typewriters 23.0 22.7 I 22»3 15.3Cash registers, adding and calculating machines 38.7 37.6
f1 37.3 30.1
Washing machines, wringers and driers, domestic 13.3 12.7 I 12.5 9,6Seining machines, domestic and industrial 11.1 10.9 10.7 8.4
Refrigerators and refrigeration equipment 67.1 68.2 65.2 43.9
TRANSPORTATION EQUIPMENT, EXCEPT AUTOMOBILES l/ 474 473 473 484Locomotives 26.9 26.6 27.1 4.2Cars, eieotric- and steam- railroad 53.0 50.6 50.8 41.6
Aircraft and parts, excluding aircraft engines 142.7 144.7 144.7 117.5
Aircraft-engines 28.9 29.8 29.0 21.2Shipbuilding and boatbuilding 141.2 142.1 142.8 227.6Motorcycles, bicycles, and parts 12.5 12.2 I 12.1 8.7
AUTOMOBILES l/ 791 755 774 430NONFERROUS METALS AND THEIR PRODUCTS l/ 433 428 426 294Smelting and refining, primary, of nonferrous metals, 41.4 40.2 40.2 32.7Alloying and ro/lling and drawing of nonferrous metals except aluminum 63.8 63.0 62.8 41.7Clocks and watches 28.5 28.3 : 28.2 24.7Jewelry (precious metals) and jewelers1 findings 17.8 17.9 17; 9 16.5Silverware and plated ware 15.4 15.2 15.2 12.7Lighting equipment 33.0 32.3 31.6 17.8Aluminum manufactures 50.9 511,2 j 51.3 26.1
.Sheet metal work, not elsewhere classified 26.8 i26.7 j 26.9 19.4
Digitized for FRASER http://fraser.stlouisfed.org/ Federal Reserve Bank of St. Louis

Table 1.- Estimated Number of Production Workers in Manufacturing Industries l/Cont*(In thousands)
Industry Group and Industry
Feb.1947
Jan.1947
Dec.1946
Feb.1946
LUMBER AND TIMBER BASIC PRODUCTS l/ 598 592 592 487Sawmills and logging camps 229.9 228.5 231.4 202.2Planing and plywood mills 76.7 76.9 76.5 65.9
FURNITURE AND FINISHED LUMBERPRODUCTS 1/ 442 432 425 370Mattresses and bedsprings 23.6 23.5 23.1 18.4Furniture 176.8 173.4 171.5 151.9Wooden boxes, other than cigar 26.6 26.4 25.9 . 24.1Caskets and other morticians* goods 14.9 14.9 14.7 13.0Wood preserving 13.6 13.1 12.7 11.7Wood, turned and shaped 25.7 24.5 24.1 21.9
STONE, CLAY, AND GLASS PRODUCTS \/ 424 425 424 366Glass and glassware ~ 101,7 104.1 103.8 99.3Glass products made frompurchased glass 13.4 13.2 12.9 11.8Cement 28.9 28.9 29.1 22.4Brick, tile,and terra cotta 63.2 63.2 62.2 52.9Pottery and related products S0.4 49.6 49.4 42.9Gypsum 6.1 6.1 6.2 4.9Wallboard, plaster (except gypsum),and mineral wool 11.1 11.1 11.1 10.0Lime 9.0 8,9 8.9 8.0Marble, granite, slate, and otherproducts 17.4 16.9 17.3 14.8
Abrasives 20.1 20.2 20.1 16.9Asbestos products 21.5 21.7 21.7 14.5
Nondurable Goods TEXTILE-MILL PRODUCTS AND OTHER FIBERMANUFACTURES 1/Cotton manufactures, except small
1,247 1,242 1,242 1,150wares 471.5 470.1 468.8 437.3Cotton small wares 14.4 14.6 14.5 13.9Silk and rayon goodsWoolen and worsted manufactures,
95.4 95.7 95.6 89.2except dyeing and finishing 162.1 1 163.0 164.4 153.9Hosiery 120.0 119.0 118.5 109,8Knitted cloth 10*4 10.5 10.9 11.1Knitted outerwear and knitted gloves 30.1 30.4 31.7 29.6Knitted underwear‘Dyeing and finishing textiles,.
37.2 36.6 » .
36.0 34.5including woolen and worsted 66,4 66.0 65.0 62.5Carpets and rugs, wool 27.2 26.7 26.4 21.6Hats, fur-felt 11.9 12.0 11.9 10.6Jute goods, except felts 3.9 3.8 •3.7 3.7Cordage and twine 15.0 15.0 15.4 i 14.2
Digitized for FRASER http://fraser.stlouisfed.org/ Federal Reserve Bank of St. Louis

Table 1.^Estimated Number of Production Workers in Manufacturing Industries l/Cfmt'c(In -thousands)
5.
Industry Group and Industry
Feb.1947
Jan.1947
Dec. 1946
Feb. ’ 1.946
APPAREL *AND OTHER FINISHED TEXTILE PRODUCTS 1/Men's clothing,* not elsewhere classified
1,119 1,090 1,079 976206*7 205.6 205. 5 186.5Shirts, collars, and nightwear 59.6 57.7 57.8 51.7Underwear and neckwear, men's 12.5 12.5 12.9 11.6Work shirts 14,3 14.0 13.8 13,6Womens clothing, not elsewhere
classified 221,4 213.7 211.2 213.7Corsets "and allied garments 17.0 17.0 16»9; 15.7Millinery 20*3 19.1 17.8 20.8Handkerchiefs 2,6 2.5 2.5 2.5Curtains, draperies, and bedspreads 12.0 12.3 12.8 12,4Housefurnishings, other than curtains, etc.. 10.5 10.4 10.7 10.3Textile bags 14.6 14.5 14.6 14.5
LEATHER AND LEATHER PRODUCTS 3/ 370 368 362 351Leather 43,7 43.2 • 42.9 44 ,.7Boot and shoe cut stock and findings 17.6 17.8 18,1 17.4Boots and shoes 201. tf 199.6 194.8 187.0Leather gloves and mittens 9.9 10.1- 10.6 11.7.Trunks and suitcases 13.9 14.0 14*7'. 13.6
FOOD 1/ 1,061 1,098 1,139 1,061Slaughtering-and meat packing 140.9 154.4 150.7 :151i2Butter 22.4 22.1 23.5 21.7Condensed and evaporated milk 13.4 13.1 - 12.9 12.8Ice cream 16.4 16.1 16.4 15.5:Flour« 30.7 30.5 SO .7 ,31.3Feeds, prepared 21.6 21.9 21.2 23,5'Cereal preparations 9.8 10.2 ! io*a 11*0Baking 243.9 249.0 252.7 253,2Sugar refining, cane 13.2 14.6 14.9 12.3.Sugar* beet 5.1 j 9,2 16.1 4*9Confectionery 56.8 : 56,9 58.6 61.4Beverages, nonalcoholic. 22.4 1 22,5 - 23.1 22.4Malt liquors 52.4 | 52,7 53.7 55.5Canning and preserving 81.7 | 94.6 115.8 89.6TOBACCO MANUFACTURES l/ 89 j 90 92 81Cigarettes 33,4 ’ 34,1 34.5 31.9Cigars 42.1 41,8 42.9 36.4Tobacco (chewing and smoking) and snuff 7.2 . 7.5 7.8 7.8
Digitized for FRASER http://fraser.stlouisfed.org/ Federal Reserve Bank of St. Louis

Table 1.-Estimated Number of Production Workers in Manufacturing Industries l/Cont*(In thousands)
6»
Industry Group ] and Industry
. Feb * 1947
Jan.1947
Dec. 1946
Feb.1946
PAPER AND ALLIED PRODUCTS 1/ 387 386 387 352Paper and pulp 172.7 172.0 171.8 159.8Paper goods, other 47.6 47.5 47.9 45.5Envelopes 11.0 10.9 11,0 10.0Paper bags 15.8 16.0 15.8 14.0Paper boxes 90© 9 91,3 92,6 83.1
PRINTING, PUBLISHING, AND ALLIEDINDUSTRIES y 420 417 420 . 381Newspapers and periodicals 137.2 135.2 136 • 7 124.9Printing, book and job 166.0 166.2 166.3 152.7Lithographing 30.5 •30.3 30,5 27.5Bookbinding 33«9 33.7 34.1 30.1
CHEMICALS AND ALLIED PRODUCTS l/ 568 564 555 536Paints, varnishes, and colors Drugs, medicines, and
36.8 36.3 36.4 '« 33.8insecticides 54.2 54.5 53.8 50.8Perfumes and cosmetics 10.6 10.9 : 11.5 12.1Soap 15.1 14.5/ = 14.3 • 13.9Rayon and allied products Chemicals, not elsewhere
59.1 58.9 58.6 59.7classified 124.2 124.3 122,9 114.9Explosives and safety fuses 13.7 13,4 : 12.9 15.4Compressed and liquefied gases 5.9 5.8 i 5«7 : 5.2Ammunition, small-arms 6.6 6,6 6,6 8.4Fireworks 2.7 3.0 3.5 2.4Cottonseed oil 16.5 17.3 13.9 15.4Fertilizers 27.9 : .25.6 . 23,1 28.5
PRODUCTS OF PETROLEUM AND COAL l/ 155 154 155 142Petroleum refining 98.5 98.3 99,4 96.4Coke and by-products 26.1 25.6 25,0 19.7Paying materials 1.6 1.6 1.6 1.5Roofing materials 12.3 12,4 ; 12 p 5 10.8
RUBBER PRODUCTS l/ 240 240 ! 242 211Rubber tires ana inner tubes 108.9 110.1 111.7 101.4Rubber boot.s and shoes 20.3 19.9 19,7 .'16.9Rubber goods, other 76.4 76.6 1 77,0 1 66.7MISCELLANEOUS. INDUSTRIES l/ Instruments (professional and scientific), and fire control
442 438 448 384
equipment 20.1 20.1 20o4 22.3Photographic apparatus OptioaJ instruments and 25.3
125.3 25,4 22.5
ophthalmic, goods 21.6 21.8 21,9 . 20.7Pianos, organs, and parts 10,6 10.4 9,5 7.5Games, toys, and dolls 22.1 21.5 24,2 18.4Buttons 9.7 1 16.1 lO'.s 10.2Fire extinguishers 2.3 2*1 2,2 2.3
Digitized for FRASER http://fraser.stlouisfed.org/ Federal Reserve Bank of St. Louis

Table 1.-Estimated Number of Production Workers in .Manufacturing Industries., l/ C-ont’c.
l/ February 1947 estimates are based on reports from 32,§00 cooperating establishments covering 7,473,000.production workers• Estimates for the major industry groups ,‘halre been adjusted-to* levels indicated by final 1945 data made available by the Euroaiti df Sliaploymdnt-Security of the Federal Security Agency and supersede dat a shown 'i)S mimeographed releases dated prior to April 1947 and Zlonthly Labor Reviews dated prior to May 1947. Comparable series from January1945 are presented in Table 15, page 31* Sstimatos for individual, industries have boon adjusted, to levels indicated by the 1939 Census of Manufactures, but nq,t tt> F.e‘deral Security, Agency ‘data, -For this reason, together with the fact that this. Bureau has not prepared estimates for certain industries','the sum of the. individual 'industry estisatos will* not agree v/ith the totals shown for the major industry groups.
Digitized for FRASER http://fraser.stlouisfed.org/ Federal Reserve Bank of St. Louis

8Table 2. - Indexes of Production-Worker Employment and Pay Rolls
in Manufacturing Industries 1j(1939 Average • 100)
Industry Group and Industry
Employment Indexes Pay-Roll Indexest s f ;~1947
[ifan. 11947
tie c. 1946
j Feb .' • 1946
Feb 1 1947
j Jan. I Dec. \ 1947[ 1946
1 Feb. | 1946
ALL MANUFACTURING l/ 153.8j152.7 152.8!'.. —123.9 310.71307.3!306.2 1214.3
DURABLE GOODS 1f 180.11178.0 177.0 125.2 344*5 339.81337.31204.2NONDURABLE GOODS l/ 133.11132.9; 133.6 122.8 277.7 275.5|275.8(224.1
Durable Goods IRON AW STEEL AND THEIR PRODUCTS 1/ 157*5 156.5 153.4 88.4 287.8 287.91276.,2 132.. 6:Blast furnaces, steel works, and rolling mills 124.4 123.5 120.2 43.7 209.3 208.91193,9 47.6Gray-iron and semi-steel castings 149.1 147.4 144.5 122.6 317.1 317.11307.8 230.0Malleable-iron castings 141.1 139.2 134.1 98,3 307.5 302.81283.8 187.3Steel castings 165.4 167.7 171.3 87.4 293.0 302.81315.4 148.9Cast-iron pipe and fittings 121.8 120.0 116.2 88.5 282.1 286.7|259.9 174.1'Tin cans and other tinware 130.1 131.0 130.5 91.0 238.7 242.8j244.5 149.2Wire drawn from purchased rods 136,8 139.8 135.9 70.0 239.6 247.71239.6 100.2
Wirework 130.6 137.7 133*4 94.6 254.9 273.8i261.7 165.3Cutlery and edge tools 180.3 180.5 179.8 140.2 405.7 405.11404.7 288.2Tools (except edge tools, machine tools, files, and saws ) 174.6 174.1 175.0 140.6 355.6
::361.3i360.8 262.3
Hardware 142.9 140.4 139.0 107.5 297.5 289.01286.2 195.. 7Plumbers* supplies 124.7 122,2 120.8 89,4 229.6 237.6j226,7 148.5Stoves, oil burners, and heating equipment not elsewhere classified 137.4 135.9 131.7 95.4 273.8 277.11264.8 159.4
Steam and hot-water heating apparatus and ste&m fittings 173.2 173.5 168.3 114.1 331.8 331.2! 312.7 204.4Stamped and enameled ware and galvanizing 154.5 152.9 152.2
1105.9 317.6 318,3j 320.9 192.3
Fabricated structural and ornamental metalwork 163.4 162.0 16Q.8 90.6 293.8 287. 9| 293,.0 134.4
Metal doors, sash, frames, molding, and trim 130.9j 131.2 130.2 88.4 249.6 255t.2! 257.4 136.8Bolts, nuts, washers, and rivets 151.5! 150.7 148.3 103.4 287.2 277.41 272.9 179 *£Forgings, iron and steel 177.8; 175.0 173.9 149.3 348.9 341.0! 33?,2 242,1Wrought pipe, welded and h&avy-riveted 165*2: 16.1.9 158.0 85.,. 0 293..6 292.9! 285,,8 135.3Screw-machine products and wood screws 174.51 173.9 173.0 153..0 354.8 355,0! 351,3 268.9St^el barrels, kegs, and drums 99.5! 102.9 100.1 44.5 236., 3 232.41 231.9 84.8Firearit* 288.81 285.2 280.6 217.9 588.6 56$. 8j 568.0 399.9
ELECTRICAL MACHINERY l/ 232.Oi 230.6 230.6 136.1 422.5 424-61 430.2 214.2Electrical equipment 175.9; 174.6 174.1 93.0)314,4 316.5! 317,0 139.3Radios and phonographs 2 13.3;213.3 215.0 149.1; 417..7 423.2; 447.7 271.8?»oncnuriio«».t.ior. aqui 287.01 287,6 •28 ,4 -2ocu?Uaaa 530.. 3j -337.6
Digitized for FRASER http://fraser.stlouisfed.org/ Federal Reserve Bank of St. Louis

Table 2. - Indexes of Production-WorVr>r Employment and Pay Rollsin Manufacturing Industries \J - Continued
9<
T'Industry Group and Industry
Employment Indexes
MACHINERY, EXCEPT ELECTRICAL l/ Machinery and machine-shop products Engines and turbines TractorsAgricultural machinery, excluding tractors
Machine tools Machine-tool accessories Textile machinery Pumps and pumping equipment TypewritersCash registers, adding and calculating machines
Washing machines, wringers and driers, domestic Sewing machines, domestic and industrial Refrigerators and refrigeration equipment
TRANSPORTATION EQUIPMENT,EXCEPT AUTOMOBILES l/ LocomotivesCars, electric- and steam railroad Aircraft and parts, excluding aircraft engines
Aircfaft engines Shipbuilding and boatbuilding Motorcycles, bicycles, and parts
AUTOMOBILES l/NONFERROUS METALS AND THEIR PRODUCTS l/Smelting and refining, primary, of nonferrous metals Alloying and rolling and drawing of nonferrous metals except aluminum Clocks and watches Jewelry (precious metals) and jewelers1 findings Silverware and plated ware Lighting equipment Aluminum manufactures Sheet-metal work, not elsewhere classified
[ Feb. : Jen. • Dec, ! Feb. j 1947 j 1947 : 1946 : 1946
Pay-Roll IndexesFeb. • Jan. j Dec. ! Feb. 1947 ! 1947 ! 1946 j 1946
S223.0! 221.Gj219.6(163.0 j408,3:405.4:399.91264.018 .6' 188.2 243.8| 243.5 175.95 175.2i I
i ! 187.6 ;244.5 j174.2
! 145.8 |133.2 j 80i5
349*3493.1273.6
166.8! 164.1 161.1!163.2 199.2;204.0 168.4!165.6 245.1!242d 142.0!139.8
|161.01165.3!204.8|161«4|243.11137.2
!l06.8 1159.5 !l80.7 !121»5 !195.9 ! 94.5
309.5 278.9332.5346.6 485.3282.6
196.81=191.2 !189,3 jl53.0 |388.5;177.7* j169.6 jl66«8 !128.7 !316.8J142.1 138.6 |l36.2 |l06.7 '287,6!• 190.8 194.1 ! 185.6 1124.7
1j325*01 ’
298.4!416.3j
298,2410.9
298.2418.8
305.164.3
iI<559.3827.2:
|216.1 206.4 207.2 169.5 440.41ii359.6 325.0 203.9
364.8 334.7 205.2!
1364.8! ! 326,2! ! 206.2j
296,2 1 239.0 328.7 1
1 . i 673.8! 513.1!
\ 375.5|j179.4 175.1 ;173.6 j125.2 327.6!1*196.5ii
187.7|192.3!106.8 337.3!!! 188.9I 186.9:185.8!128.2 361«o|
149.9i 145,5j145.4;118.2 282.4!j!164.4 j140.7
162.2 | 139.3!
161.7:139.1:
107.4121.6
307.6:306.2!
i123.6126.5161.2216.0
124.3:125.2!157.9!217.6!
123.9!125.5!154.4;217.7!:
114.0104.586.9110.9
233.4|271.4!298.8!376.8!
142.7l 142.3! 143.7 ;:LOB-.71278.5!
571.2:509.4 876.0!123,6408.8683*3533.7399.1
277.5520.7369.1530.4
354.8
269.7
236.8271.9 285.7383.6280.6
346.7j 201.0 328.9! 147.6
356.5 226,9
271. i 204.2
301.9 191.8 306.3 233.6250.Ej 204.8 275. i 208.5 272.5 136.1 384*d 181.6281.§ 185.5
Digitized for FRASER http://fraser.stlouisfed.org/ Federal Reserve Bank of St. Louis

Table 2. - Indexes of I C yffteTfliuand Pay Rollsin Mannfacyturing Industries 1/- Continued
1°«
Employment Indexes. Pay-Roll IndexesIndustry Group and Industry
Feb.1947
JVui*. 1947
pec. 1946. 1946 •
Feb,1947
Jan«1947
: Dec, . 1946
; Feb. ! 1946
LUMBER AND TIMBER BASIC PRODUCTS 1/ •142.2■140.8 140.8 116.0 310.4 292.2 290,6j205.6Santeiilis and logging camps 79.8 79.3 80.3 70.2 175*6 163.4 163,6j123.0Planing and plywood mills 105.6 105.9 105,3 90.8 218,3 216.2 215.4|160,9
FURNITURE A*TD FINISHED LUMBERPRODUCTS 1/ 134.6 131,8 129.6 112,7. 292,3 282, 279,1 208Mattresses and bedsprings 128.8 128.2 125.9 00 c2 258.0 259. 259^0 173,1Furniture- 111.1 108.9 107.8 950’4 243.0 234, 230.7 176.7Wooden boxes, other than cigar 104,8 104.2 102.2 95.2 238.4 234.8 236.1 199,1Caskets and other morticians’goods 119.6 119,6 118.3 04.3 228.9 227.8 225.6 179,2Wood preserving 121*1 116.6 113,1 03.7 295.4 277.5 275.1 212.5Woodi turned and shaped 117.1 111.5 109.6 99.5 !250.0 236,7 237,0 187.7
STOKE, CLAY, AND- GLASS PRODUCTS l/ 144.5 144.9 144*4 24«7 278.4 280.0. 281*6 210.0Glass end glassware 145,7 149.1 148,6 42.3 270.7 282. § 283.1 236.5Glass products made from purchased glass 133.6 132.0 129.3 17.8 279.2 268.7 264.4 205.2Cement 121.2 121.5 12212 94,0 201,1 197,9 209.3 141.6Brick, tile, and terra cotta 111.3 111.3 109.-3 93.2 226.6 226,6 225.2 158.3Pottery and related products 152.2 149,9 149,1 29.6 278*8 270.0 274.4 209.5Gypsum 122.8 123.5 124.8 99.5 238.9 243.8 245.1 172.3Wal'lboard, plaster (except gypsum), and mineral wool 136.6 136.5 137.1: 122.9 .313.3 292.0 301.6 1228.5Lime 95.3 94.2 93,6! 84.8 218.2 210.0 219.7; 167.7Marble, granite, slate, and other products 94,0 91*3 93.6; 79.8 158.1 152.9 158co|122.0Abrasives 259.9 261.8 260.01218.9 450,2 482.6 459>9i 319,3Asbestos products 135.4 136,8 136.4! 91.1 307.7 305.5 300.0: 181.5
Nondurable GoodsTEXTILE-MILL PRODUCTS A'D OTHER FIBER MANUFACTURES l/ 109.1 108.6 108.6! 100,6 262.0 254.3 253.7! 202,5Cotton manufactures, except small wares 119.1 118.7 118.4;110,4 309.1 304.4 301.2! 230.0Cotton small wares 109,4 110.0 109.ci104.6 237.3 239.3 231,9; 200.0Silk and rayon goods 79.6 79.9 79,8i 74.4 206.9 201,3 197.9! 158,3Woolen and worsted manufactures, except dyeing and finishing 108,6 109.2 110,2|103,1 275.0 251.8 253.0!226.9Hosiery 75.5 74,8 74.5 1 69,0 157,9 156,1 158.2|125,3Knitted cloth 94.9 95.7 99,6 |101,2 204.2 198,5 207.1!202.3Knitted outerwear and knitted gloves 107.0. 108.0 112.7|105,4 237.8 338.3 250.4; 211.0Knitted underwear 96.5 94.9 93.41 89.4 223.7 215.5 216,1; 174.4Dyeing and finishing textiles including woolen and worsted 9.9.3 98.7 97.2 • 93*4 217.2 215,3 210,4! 177.8Carpets and rugs, wool 106.3 104.4 103,1;■ 84.5 214.5 210,6 214.3; 146,4Hats, fur-felt 82 .0 82.5 81.7! 73.2 175.3 180.5 191,0! 153.4Jute goods, except felts 107.8 105.2 102.3!103.3 255.9 240.1 236.4!209.8Cordage and twine 123,7 124,0 127.2 j:117.0 273.6 271.8 °78.4!208,1
Digitized for FRASER http://fraser.stlouisfed.org/ Federal Reserve Bank of St. Louis

11-Table 2, - Indexes of Production-Worker Employment and Pay Rolls
in Manufacturing Industrios l / - Continued
Industry Group and Industry
Employment Indexes ...Pay-HoTl. indexesFeb.1947
Jan.1947
Dec.1946
Feb.1946
Feb.1947
Jan.1947
Deo,1946
Feb.1946
APPAREL iiUD OTHER FINISHEDTEXTILE PRODUCTS V 141.7 138.1 136.6 123.7 315.5 302,4 292,7 236.1Men's clothing, not elsewhereclassified 94.5 94,0 94.0 85.3 210.4 209,0 210.7 158,1Shirts, collars, and nightwear 84.6 81,9 82.0 73.4 198.8 193.1 190,1 147.7Underwear and neokwear, men’s 77.6 77.5 79.6 71.6 195.0 193.7 200,8 158.7Work shirts 106.3 104,2 102.2 100*9 254.3 246.7 254.1 197.7Women’s clothing, not elsewhereclassified 81.5 78,7. 77.7 78.7 183.0 171,9 159,1 153.3
Corsets and allied garments 90.7 90,4 90.0 83.4 192.6 186,0 185.9 156.1Millinery 83.6 78,4 73,3 85.7 165.8 140.0 116,7 152,6Kandkerohiefs 53.2 51,5 51.5 51.2 123.8 lid. 3 124,7 105.1Curtains, draperies', andbedspreads 70.8 73.0 75.9 73,3 149.7 154.6 164,9 142.8Housefurnishings, other thancurtains, otc. 96.8 98.3 100.9 96,5 192.8 197,1 207,4 174.7Textile bags 121.6 120.9 123,5 120.7 241.7 245.9 242,7 207.3
LEATHER AND U2ATEER PRODUCTS l/ 106.5 106-.0 104 0 -j: 101,1 222,9 220.6 218,3 195.9Leather 92.4 91,5 90.7 94,5 185,5 179.3 174,5 165.3Boot and shoe out stook andfindings 93.6 9±.S 95.8 92,6 175,6 178.4 178,4 165.0
Boots and shoes 92.2 91.5 89,3 85,8 198,6 197.5 194,7 174.1Leather gloves and mittens 98.9 101.0 106.0 117,1 183,5 191,9 201,9 211,8Tranks and suitcases 166,7 168,5 176., 7 163.0 327.6 321.0 353,1 280,6
FOOD 1/ 124.2 128.4 133.3 124,1 243,0 256,4 263,3 214.7Slaughtering and meat packing 123-5 128.1 125.0 125.5 237,8 268,0 236,9 199.4Butter 124,7 123.1 130.6 120,7 237,3 233,7 246,6 200.9Condensed and evaporated milk 137.9'134.6 132.5 132,3 278,2 269.8 256,2 225.8Ice cream ‘104.4 !S102.3 104,4 98,5 182,8 181.6 185,5 152.3Flour ‘124,0 123.2 123,9 126.5 262.2 268,2 267,8 241.6Feeds, prepared 140*4 142.1 137,6 152.6 278,2 284,3 266.9 272.7Cereal preparations 131.9 137.0 145,0 147.3 253,9 260.5 271,9 248.6Becking 105.7 107.9 109,6 109.7 194,5 201.1 209,0 181.-2Sugar refining, cane z/ 93.0 103,2 105,2 86.8 161,2 167.3 200 i 2 121.4Sugar, beet 49.1 88.0 154,8 46,7 96,9 158.6 341,8 7<*.0Confectionery 114.1 114.3 117,9 103,4 230,1 226.3 240,5 183.2Beverages, nonalcoholic 105.2 105,8 108.5 105 ..5 16.3,0 164.8 169.1 144.9Malt liquors 145.2 145,9 148.8 153.9 233.6 235.7 251.5 237.8Canning and preserving 60.8 70.3 86.2 66,6 157.9 158.2 201.1 136.6
TOBACCO MANUFACTURES l/ 95,4 96,1 ' 98.3 87,3 201.0 209.4 222.0 165.2Cigarettes 121.9 124,2 125.9 116.1 233.6 241,5 254.7 194.3Cigars 82.8 -82.1 84.3 71,5 186,2 195,2 206.7 148.9Tobacco (chewing and smoking)and snuff 78.4 82.1 85 . 'i 84.6 144,0 155,8 166.8 133.4
Digitized for FRASER http://fraser.stlouisfed.org/ Federal Reserve Bank of St. Louis

12. Table 2. - Indexes of Prr^ettCB,l“3fifoivic&r Etnploy!iiffl.rt and Pay Rollsin Marcofewrfcuring Industries i f - Conttnwed
.Employment Indexes Pp.y-Roll IndexesIndustry Group and Industry
Feb.;. Jan. 1947 I 1947
Dec. ; 1946 j
j Feb. I 1946
Feb.1947
Jan.1947
Dec.! Feb. 1946! 194C
PAPER AND ALLIED PRODUCTS l/ Paper and pulp
145*9.!145.6 145.7 :[132,5 287*4 284.3 284.5 1228.3125.6 1125.2 125.0 1116.3 260.5 245.6 244.9 |203.6
Paper goods, other 126.5 1126.2 127.4 1120.8 247.0 246.4 249.0 ;204.SEnvelopes 126.4 !125,9 126.7 ii115.1 237.3 234.9 235.4 185.4Paper bags 142.6 =144.7 }42.4 :1126.2 283.9 292*2 283,5 i221.3Paper boxes 131.4 1132.0 133.9 ;[120.1 256.8 257.9 262.11204.0
PRINTING, PUBLISHING, AND ALLIED INDUSTRIES l/ 128.11X27.2 127.9 !116.2 221.7 219,6 223.91177. 4Newspapers and .periodicals 115.6!114*0 il5.2 i105.3 191.0 185.2 18S.71148.9Printing, book and job 131.41131.5 131.6 1120.9 234.2 235.2 239.4‘193,9Lithographing 117.4j116,4 117.3 i\107.3 199.7 201*8 203.41161.8Bookbinding 131.6jl30.9 132.3 ;; n<5.s 275.8 278.0 283p6j221.r
CHEMICALS AND ALLIED PRODUCTS y 197.0i195.6 192.5 i!185*8 372.5 362.9 357.0!310.7Paints, varnishes, and cqlors 130.Sj129.0 129.2 I1120.1 222.0 216.4 214.7|185,2Drugs, medicines', and insecticides 197.8)198.7 196.4 185.5 364*8 354.9 351*3[297.2Perfumes-and cosmetics .102.5 1104.7 110,8 116.8 184*5 186.6 203.2:184*9Soap 111.2 ll07.1 105,5 102*2 208.5 199.2 195,7•137,2Rayon and allied products 122.3 j122.0 121.3 123.6 236,@ 219.7 216.3:197.3Chemicals, not. elsewhere classified 178.6I.178.S 176.7 165.1 323.5 321.0 313*4■272«fExplosives and safety fuses 188.31184.9 177.4 211.7 307.9 320<>3 299.2;324.7Compressed and. liquefied gases 149.4[l46.2 .144.0 131.3 250.9 240.6 243.2 •: 20.9.5Ammunition, small-nrms 155.4:;.155.9 155. P 197.5 334.1 332.3 326.7:384,<\Fireworks 231.0 |£5P.9.296.7 203.3 623.7 661.1 7P8.6:495.4Cottonseed- oil. 108.31.114.1 .124.4 101.4 280.7 295,0 326.81215.3Fertilizers 148.8 1136.6 122.8 151.7 360.6 327.6 304 91 335.9
PRODUCTS OF PETROLEUM AND C04L 3./ 146.01.145.3 146.1 134*2 256.8 253.9 250.9!227.1Petroleum refining 135.21135.0 136.4 132.3 228.8 227.5 230.21,21.7*4Coke and by-products 120.2 ill7.9 115.3 90.7 2*9.o;221.0 196.7!162.1Paving materials 66.3 1 67.1 67.6 60.3 110.6:114.6 129.61115*4Roofing -materials 152.9,1154.4 155.8 134.4 314.0 313.5 309.81241,®RUBBER PRODUCTS .l/ 198.2 [198.8 200.1 174.5 386.6 386.3 392.2 i'287.7Rubber tires and inner tubes 201.2. ;203.5 206.3 187.3 357. T 361.2 368.9|271.9Rubber froots and shoes 136.8 [13309 132.7 113.9 280.6 276.0 272.61211.5Rubber goods,.other 147.6 1140.0 148.7 128.8 305.2 303.4 308.61233*8
MISCELLANEOUS INDUSTRIES l/ 130.8 jl7S *2 163*2 15S.8 35 9* ft 356.6 363.3j280.6Instruments (professional and scientific), and fire control equipment 181.8 ll82*Q 184*3 201.3 326.4: 329.5 334.6!321*7Photographic apparatus ,146.4=146.5 146.8 130.1 249.5]254.1 253*1!204*5Optical instruments, and ophthalmic goods ,186.2 1187.9 188.5 1T8.0 334*3|344*8 346*3|S0®.8Pianos, orgnns, and parts 139.81137.1 1240T . 3$«5 299*6;294*8 242*2!159*8Games, .toys, And dojis 118.4 ;115*1,129.9 98.6 249.61239.2 285,8! 190Buttons 88.7! SI.7 95.5 92.7 200*1!203.0 215*7!185*6Fire extinguishers 227.31214.7 219.6 227.2 409.7!425.9 438.8-466.9
Digitized for FRASER http://fraser.stlouisfed.org/ Federal Reserve Bank of St. Louis

13.Table 2. - Indaxes of pro:1 uctior.-worker Employment ard Pay Rolls .in. Unoufacturin^ Industries l/ - Continued
l/ Those indsxes aro based on reports from 32,900 cooperating establishments covering 7,473,000 full- and part-tine production workers who worked or received pay during-any part of one pay period ending nearest tho loth of February 1947. Indexes for the major industry groups have been adjusted to levels indicated by final 1945 data wade available by the Bureau of Employment .Security of the Federal Security Agency and supersodo data shown in mimeographed releases dated prior to April 1947 and Monthly Labor Reviews dated prior to i!ay 1947. Comparable series from January 1945 are presented in Table 15, page 31.
z j Revisions have been made as follows in tho indoxes for earlier months:Sugar refining, cane - November 1946 pay roll to 150.4.
Digitized for FRASER http://fraser.stlouisfed.org/ Federal Reserve Bank of St. Louis

Table 3. - Estimated Number of i®cpioy&©& in Selected (In ifooueands)
14.
industry Group and Industry Feb. 1947 jJan. 1947 Dec. 19461 Feb. 1946"
Mining 2/ Anthracite .08.7 ! 69.1 68.7 67i2Bituminous coal 335 336 326 . 341Metal 77.3 76.9 76*0 59.5Iron 26.4 26.6 26.6 17.9Copper 24.2 23.9 23.3 17.9Lead and zinc 16.6 16.5 16*1 14.7Gold and silver 7.9 7.7 7.6 7.1Miscellaneous 2.2 2.2 2.4 1.9
Telephone 594 588 586 483Telegraph 3/ . 38.3 39.4- 40.4 46.9Electric light and power 252 250 252 231Street railways and busses 254 253 252 243Hotels (year-round) 380 378 384 383Power laundries 4/ V y £/Cleaning and dyeing y y y 4/Class I steam railroads 5{ 1,325 1, 3*i ; 1,353 1,367l/ Sco footnote l/> table 5, page 15.2/ Data? are for production workers only.0/ Excludos raos senders, and 'Approximately 6,000 caployoes of goneral and divisional
headquarters and of cablo companios.■%/ The change in definition fron "wage earner" to "production worker" in the power
laundries and cleaning ar.d dyeing industries results in the omission of driver- sale3men. This causes a significant difference in the data. ITew series are being prepared.
5/ Source: Interstate Commerce Corjr'icsion.
Table 4. - Percentage Changes in Employment and Pay Rolls in Selected Nonmanufabturing Industries, February 1947
Industry GroupEmployment j
Percentage change fromPay Roll
Percentage change from-and Industry Jan.
1947Feb.1946
Jan. 1947
Feb.1946
Wholesale trades - 0.3 + 6.1 + 0.5 +15.6Food products - .6 *f .4 + .3 +11.2Groceries and food specialties - .5 + .2 - 1.5 + 7.3Dry goods and apparel 0 ! + 5.2 + 4.1 +15.4Machinery, equipment and supplies + .7 + 8.7 - .2 +17.1Farm products -11.4 +41.8 - 9.4 +48.1Petroleum and petroleum products (incl. bulk tank stations) + .3 +10.3 + 2.7 +17.6
Automotive - .6 +12.1 - .1 +16.5Security brokerage* - 1.8 - 4.3 - .7 -14.3Insurance + 1.5 +10.9 - 1.6 +11.9
* Formerly entitled "Brokerage".
Digitized for FRASER http://fraser.stlouisfed.org/ Federal Reserve Bank of St. Louis

Table 5. - Indexes of Employment and Pay Rolls in Seleoted Nonmanufacturing Industries l/
(1939 Average » 100)
15.
Industry Group and Industry
Employment Indexes . Pay-Roll IndexesFeb.1947
Jan o 1947
Dec.1946
Feb.1946
Feb.1947
Jan.1947
Dec.1946
Feb.1946
Mining:Anthrac ite 82.9 83.4 83.0 81.1 184.7 202.0 212.3 178.3Bituminous coal 90.4 90.8 88.1 92.0 248.7 265,4 258.3 222.8Metal: C7.6. 87.2 86 .2 67.5 162.0 156.8 159.3 92.8
Iron 131.5 131,4 132.4 69.3 240,3 229,4 239.7 71.0Copper 101*5 100.4 97.8 74.9 198.0 193,6 192.2 121.3Lead and zinc 106.9 106.4 103.4 94.5 226.2 221,7 220.1 182.2Gold, and silver 31.7 31.3 30.7 28.6 51.0 48.3 49.8 38.5Miscellaneous 54.4 5-4.3 59.6 49.0 84.5 84,7 93.3 75.8
Quarrying and nonmetallic 97.1 96.9 99.7 84 205.6 204«8 221.9 157.2Crude petroleum production 2/ 91.8 92.1 92.6 91.0 153.8 153,8 147.1 142.0
Public utilities:Telephone 186.9 185.2 184.6 153.7 .269.4 267.5 264.5 230.7Telegraph 101.8 104.6 107.4 124.7 185,4 189»1 190.5 176.9Electric light and power 103,2 102.5 103.0 94.7 163.7 159.5 161.6 138.3Street railways and busses 130.9 130.6 130.1 125.7 219.3 216.6 213.6 187.2
Wholesale trade 111.9 112,2 114.4 105.5 190.7 189*7 197.2 165.0-Retail trade * 109.6 110,3 126.5 104.3 187.0 187.7 212.2 157 ;1Food 111.2 108.5 111.9 106.8 197.1 189.4 194.6 161.7General merchandise 119.5 125.9 171.0 114.6. 199.0 213o4 277.2 165.5Apparel 108.2 110.3 135.5 104. 8 184o3 188.3 230.2 162.5Furniture and housefurnishings 84.3 84.3 90.4 72.9 143.8 144.1 165.7 112.5Automotive 98.2 98.3 100.2 06.9 172.7 170.4 178.8 140.5Lumber and building materials 113.9 113.4 116.1 103.3 196.8 193.4 200.5 161.5
Hotels, (year-round) 3/ 117.7 117.3 119.1 118.7 216.6 215.1 218.8 199.8Power laundries> 109,5 111.0 110,9 109.0 196.1 201o8 201.0 177.0Cleaning and dyeing 117.0 118.2 120.9 121.5 204.7 213.8 219.5 199.1Class I steam railroads i f 134.1 135.1 136.9 138.4 5/ & 5/i f Those figures aro based on roports from cooperating establishments covering full-
and part-tine employees who worked or rccoivod pay. during any part of one pay period ending nearest the 15th of.Fobr.uary 1947, as follows* liining; 2,700 establishments - 354,000 production workers*Publio ufcilitj.es: 7,000 establishments - 832,000 employees.VBiolesalc trade: 11,100 establishments - 311,000 employeos.Retail trade: 36,200 establishments - 929,000 employees.Hotels (year-round): 1,200 establishments - 133,000 employoes# power laundries and cleaning and dyeing: 1,500 establishments - 69,000 production workers.
2/ Doos not include well drilling or rig building.Cash payments only; additional value of board, room, and tips, not included;
4/ Source: Interstate Commerce Commission.5/ Mot available.
Digitized for FRASER http://fraser.stlouisfed.org/ Federal Reserve Bank of St. Louis
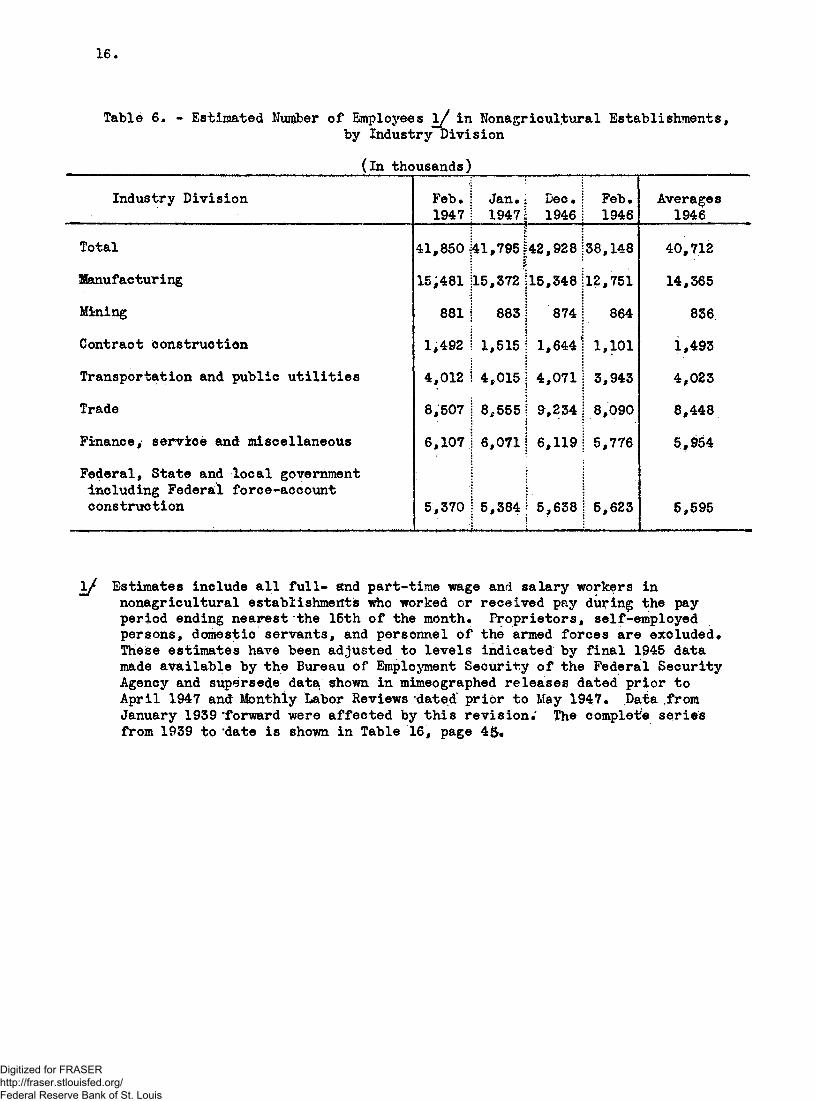
Table 6* - Estimated Number of Employees 1/ in Nonagricultural Establishments,by Industry Division
(In thousands)Industry Division Feb.
1947Jan. i 19471....... *
Dec.1946
Feb.1946
Averages1946
Total 41,850 41,795f42,928 38,148 40,712Manufacturing 15;481 15,372 |15,348 12,751 14,365Mining 881 883 | 874 864 836Contraot construction 1,492
i1,515 j 1,644' 1,101 1,493
Transportation and public utilities 4,012 4,015 j4,071 3,943 4,023Trade 8,507 8,555!
}9,234 8,090 8,448
Finance, service and miscellaneous 6,107 6,0711! 6,119 5,776 5,954Federal, State and local government including Federal force-account construction 5,370 5,384j
i5,638 5,623 5,595
i f Estimates include all full- and part-time wage and salary workers innonagricultural establishments who worked or received pay during the pay period ending nearest the 15th of the month. Proprietors, self-employed persons, domestio servants, and personnel of the armed forces are excluded. These estimates have been adjusted to levels indicated by final 1945 data made available by the Bureau of Employment Security of the Federal Security Agency and supersede data shown in mimeographed releases dated prior to April 1947 and Monthly Labor Reviews dated prior to May 1947. .Data .from January 1939 ‘forward were affected by this revision.' The complete series from 1939 to ’date is shown in Table 16, page 45.
Digitized for FRASER http://fraser.stlouisfed.org/ Federal Reserve Bank of St. Louis

Table 7 • - Estimated Number of Employees 1/ in Manufacturing Industries by MajorIndustry Group
17.
' All Employees (In thOtt&ancls) Feb. Jan. Dec. Feb.
Industry Group j 1947 1947 194-6 1946
All manufacturing ! 15,431 15,372 15,348 12,751Durable goods i 7,865 7,777 7,731 5,731Nondurable goods j 7,616 7,595 7,617 7,020
Iron and steel and their products i 1,833 1,823 1,787 1,136Electrical machinery i 780 773 771 481Machinery, except electrical i 1,507 1,501 1,489 1,161Transportation equipment, exceptautomobiles 601 602 600 632
Automobiles .969 924 943 551Nonferrous metals and their products .499 494 493 354Lumber and timber basic products 660 654 652 540Furniture and finished lumber products 526 514 504 444Stone, clay, and glass products 490l 492 492 432Textile-mill products and otherfiber manufactures 1,360 1,354 1,353 1,252Apparel and other finished textile
__ • products . ! 1,274 1,243 1,229 1,107feather and leather products : * 411 410 403 388Food S 1,4-85 1,512 1,548 1,462Tobacco manufactures | 102 104 105 94Paper and.allied products 466 465 465 426Printing, publishing, and allied . iindustries 687 683 683 629
Chemicals and allied products 747 741 732 694Products of petroleum and coal 221 222 221 204Rubber products ! 295 294 296 259Miscellaneous industries 563 567 577 505
1/ Estimates include all full- and part-time wage and salary workers in manufacturing' industries who worked or received pny during the pay period ending nearest the 15th of the month. Proprietors, self-employed persons, domestic servants, and personnel of the armed forces are excluded. These estimates have been adjusted to levels indicated by final 1945 data made available by the Bureau of Emoloyment Security of the Federal Security Agency and supersede’data shovm in mimeographed releases dated prior to April 1947 arid Monthly Labor..Reviews dated prior to May 1947.
2J Includes production and noK-production workers.
Digitized for FRASER http://fraser.stlouisfed.org/ Federal Reserve Bank of St. Louis

ie0 Table 8, - Estimated Number of Employees in Nonagricultural Establishments, by State ________ ___________ _ _______ (in thousands)______________________________„
. Region and StateAll industry divisions Manufacturing 1/Jan<1947
Dec01946
Jan.1946 Jan.
1947Dec.1946
Jan.1 1946
New England 2,917 3,009 2,769 1,573 1,578 ! 1,379Maine 2/ 227 235 226 113 114 110New Hampshire 2/ 143 147 136 82.4 83.0 76.1Vermont 2/ 88«9 91.0 84.4 43.3 43.1 38.8Massachusetts 3j. 1,479 1,534 1,460 762 767 685Rhode.Island 3Y 267 273 251 150 150 132Connecticut 3/ 712 729 612 422 421 337
Middle Atlantic 8,806 9,118 8,478 4,087 4,080 3,716New York 3/ 4,449 4,559 4,243 1,901 1,899 1,753New Jersey 3/ * 1,354 1,389 1,283 770 768 675Pennsylvania 3/ 3,003 3,170 2,952 1,416 1,413 1,288
East North Central 8,483 8,699 7,748 4,355 4,340 3,723Ohio 4/ 2,306 2,368 2,122 1,211 1,201 1,072Indiana 3/ 963 991 884 544 541 445Illinois 3/ 2,794 2,852 2,631 1,190 1,182 1,069Michigan 3/ 1,648 1,696 1,381 1,014 1*019 774Wisconsin 3/ 772 792 730 396 397 363
West North Central 2,757 2,859 2,645 828 833 759Minnesota 3/ 647 669 617 198 200 185Iowa 5/ 458 468 436 144 143 129Missouri 6/ 902 941 863 345 348 308North Dakota 5/ 79.8 85,5 74.5 6.7 7.1 5.8South Dakota 5/ 88.5 92 07 82.0 11.1 11.2 10.2Nebraska 5/ Kansas. 3/
243 252 242 44el 44.5 43.3339 351 330 78.9 79.6 77.8
South Atlantic 4,374 4,523 4,225 1,554 1,558 1,430Delaware 3/ 91 #2 93.7 85.4 45.3 45.2 42.2Maryland 3/ 600 630 571 238 241 .215District of Columbia 7/ 448 462 445 16.9 17.3 15.8Virginia 3/ 639 663 627 211 213 192West Virginia Aj 417 423 405 133 132 125North Carolina 3/ 733 754 694 373 371 346South Carolina 8/ 357 368 352 189 188 172Georgia 8/ 610 634 586 257 260 239Florida 3/ 479 495 460 90.6 90.4 83.0
East South Central 1,720 1,764 1,625 698 691 621Kentucky 4/ 423 437 425 128 128 116Tennessee 8/ Alabama 8/
548 560 503 252 248 226507 516 470 225 223 196
Mississippi 8/ 242 251 .227 92.7 91.5 82.6West South Central 2,324 2,423 2,292 580 589 548Arkansas 3/ 227 239 225 67*4 70f0 61.9Louisiana 3/ Oklahoma 6/
439 455 436 133 134 128339 352 335 54.7 55.4 56.4
Texas 3/ 1,319 1,377 1 1,296 325 330 302
Digitized for FRASER http://fraser.stlouisfed.org/ Federal Reserve Bank of St. Louis

Table fr* - Estimated Number of Employees in Nonagriculttxral Establishments, by State Centfd ___ ____________ (lii thousands) _______________ •
19,
Region and StateAll industry divisions Manufacturing 1/Jan*1947
Dec* 1946 i
Jan,1946
Jan,1947
Dso.1946Jan,1946
Mountain 910 949 i 882 144 152 123Montana 3/ Idaho 9/ 114 118* | 109 16,3 17.6 12.8
95*7! 102 $ 95,3 18.0 20.1 15,9Wyoming 9/ 58*7 i 61*0;1 68.9 5.9 6.7 5.2Colorado 9/ 275 285 : 255 55.7 56,2 47.6Nevr Mexico 9/ Arizona 10/
83*1! 85*2:1 82.8 10.3 10,2 8,4107 { 109 li 99,7 12,1 12,6 10.5Utah 3/ * 136 1 146 :l 131 22.1 24,9 19.8
Nevada 3/ ♦ 40*0 ] 42*3] 40.6 3,5 3,4 2.8Pacific 3,183 ! 3,314 *.2,985 974 986 898Washington 3/ < 510 j 531 \ 514 160 162 168Oregon 10/ ’ 302 ! 314 \ 293 116 118 108California 3/ 2,371 |\ 2,469 |i I
2,178 698 706 622
2/ Estimates for manufacturing hare been revised to oonfcrm with the.new series prepared bycooperating state cr Regional office* Because this series has been adjusted to recent data made available under the Federal Social Security program, it is not comparable with data previously shown npr with current estimates for.“All Industry Divisions”*• Comparable series for manufacturing estimates, January 1943 to date, available upon request to. Regional Director> U. S* Dept# of Labor or cooperating state agency*
. 2/ Address: Regional Director, IT* S, Dept* of Labor, Boston 8, Massachusetts*3/ Data secured in cooperation with:
/Massachusetts - Dept* of Labcr and Industries, State House, Boston 33*Rhode Island - Dept# of Labor, Division cf Census and Statistics, Providence 2*Connecticut - Bnployment Security Division, Hartford 15*New Jersey - Dept# of Labcr, Trenton 8*New YorkDivision of Research, Statistics and Publications, New York State Dept# cf Labor,
Albany 1*Pennsylvania — federal Reserve Bank of Philadelphia, 925 Chestnut Street, Philadelphia 1# Indiana - Jtknployment Security Division, Indianapolis 12#Illinois - Dept* of Labor, Division of Statistics and Research, Chicago 6,Michigan - Dept* of Labor and Industry, Lansing. 13*Wisconsin - Industrial Commission of Wisconsin, Madison 3*Minnesota - Division of Bnployment and Security, St# Pfcul 1*Kansas 4* Kansas State Labor Department, TopekaDelaware - Federal Reserve Bank of Philadelphia, 925 Chestnut Street, Philadelphia 1, Pa* Maryland - dept * of Labor and Industry, Baltimore 2#Virginia -‘Division of Research and Statistics, otate Dept* of Labcr and Industry, Richmon421 North Carolina — North Carolina Dept* of Labor, Raleigh*Florida Florida Industrial Commission, Tallahassee*Arkansas ~ Dept# of Labor, Little Rock*Louisiana, — Bureau of Business Research, College of Corrmerce, .Louisiana State University*
. Baton Rouge 3#Texas - Bureau of Business Research, University of Texas, Austin 12#Montana - Unemployment Compensation Commission of Montana, Helena#Utah - Dept* of linployment Security, Salt Lake City 13*Nevada - Employment Security Department, Carson City*Washington - Offioe of Unemployment Compehsation and Placement, P.O. Bex 367, Olympia# California Division cf Labor Statistics and Research, San Francisco 2*
4/ Address: Regional Direct or, U* S. Dept* of Labcr, Cleveland 14, Ohio*■5/ Address: Regional Director, U. S. Dept* of Labor, Chicago 6, Illinois,6/ Address: Regional Director, U, S* Dept, of Labcr, Dallas 1, Texas#2/ Address: U. S* Dept* of Labor, Washington 25, D* C*8/ Address: Regional Director, U* S, Dept* of Labcr, Atlanta 3, Georgia*9/ Address: Regional Director, U. S# Dept* of Labor, Denver 2, Colorado*
10/ Address: Regional Director, U* S. Dept, of Labor, San Francisco 3, California*♦ Estimates for manufacturing are revised because of adjustment to more recent benchmark
data made available under the Federal Security Agency program*
Digitized for FRASER http://fraser.stlouisfed.org/ Federal Reserve Bank of St. Louis

Table 9*~ISh) ^ and Pay Rolls for Regular Federal Servicesaad for Government Corporations, February 19 7 (In tbou&ai} )
- - - - - - u 1 1 . m « , r ~ t 11 j - - . u , . . - . U - l . .
Employment 1/ Pay rolls 2 j
Branch February1947 y
January1947 4/
February1946
February19473/
January1947 y
February1946 y
Total.. ... ... .............. 2,304.0 2,326.0 2,926.1 $514,535 $518,194 $502,043Executive 5/ ... 2,261.8 2,284.1 2,882.6 505,171 508,671 493,818Washington, D« C*
metropolitan area 6f,„_ 220.2 221.3 233.0 57,207 57,543 48,339War agencies *]J...Z __ 75.3 75.7 91.0 19,846 16,& 7Other agencies........ 144.9 145.6 142.0 37,697 31,642Other areas...... ...... 2,041.6 2,062.8 2,649,6 447.964 451,128 445,479Tfiar agencies 7/.....
Continental""United1,076,0 1,101.0 1,772.3 228,692 232,685 277,509
States..... ...... 782.5 795.6 1,286.0 1R9,266 191,948 241,313Cut si de continental
United States 8/.. 293.5 305.4 486.3 39,426 40,737 36,196
OtLer agencies.......... 965.6 961.8 877.3 219,272 218,443 167,970Continental UnitedStates...........
Outside continental 937.5 934.2 854.8 212,632 211,597 163,278
United States 8/ „ 28.1 27.6 22.5 6,640 6,846 4,692
Legislative ............... .... 7.1 6.8 6.5 2,308 2,345 1,768Judicial........ ................. 3.1 3.1 3.0 .1,691 1,191 940
Government corporations £/...... 32.0 32.0 34.0 5,965 5,987 5,517
l/ Employment is as of the first of the month*2/ Pay rolls for January and February 1Q4? cover tbe entire calendar month; pay rolls for Febru~
ary 1946 cover all pay periods ending within the month, or four weeks for most employees*3/ Subject to revision,4/ Revised*5/ Includes data for United States, navy yards and force-acoount construction which are also in-~ eluded under construction and shipbuilding and repair projects (tables 11 and 12)* Beginning
July 1945, data include clerks at third-class*pust offices, who previously were working on a contract basis# Substitute rural mail, carriers are excluded from the employment*
6f Includes areas in Maryland 'and Virginia which are within the metropolitan area, as defined by the Bureau of the Census «.
*lf Covers War and Navy Departments , Maritime Commission, National Advisory Conroittee for Aeronautics, The Panama Canal, and the war emergency and reconversion agencies*
8/ Includes Alaska and the Panama Canal Zone,lU Covers the Panama Railroad Company, the Federal Reserve banks, and banks of the Farm Credit
Atoinistration* Data for other Government corporations are included under the executive branch*
Kote: Reyisions which are made from time to time for months prior to those shown in this tableare available in the Monthly Labor Review* under ,?Trend of Ercploynmrfc, Earnings, and Hours-,*. Public l plxjyment*" Mimeographed tables showing Federal employment monthly fr#m 1939* to date and Federal pay rolls monthly from 1943 to date are available upon.request*
Digitized for FRASER http://fraser.stlouisfed.org/ Federal Reserve Bank of St. Louis

21.Table 10.— Personnel and Pay of the Military Branch
of the Federal Government in Selected Months(in thousands)
Branch, sex or type of payFebruary19)47(preliminary)
January191+7
(Preliminary)December1946
(Revised]February191+6
February191+2
Personnel, total l/..------ 1,906 1,937 2t20i* 5,956 2,1+65
Army — -— ...... ••... 1,25k 1,319 1,5H 3,1+69 1,890Navy 2/..--- ........ 652 663 ' 693 2,1+87 575
Men-... . .... ....... 1,881 1,961 2,176 5,815 2,1+57Women--------- ----- 25 . 26 28 ll+l 8
pay, total ---------- --- 5655,553 m , 8 7 3 |686,271 $1182,809 1178,173Army ....i..'.*. .... ... 100,618 i+23»99l+ ' 1*17,730 71+9,1+82 119,207Navy Zf --------- 22I*,735 270,879 268,51+1 1+33,327 58,966pay rolls 3/ ............ 301,220 319,1499 326,31*1 7l6,09li 178,173Mustering-out pay iV.. 18,311 27,736 14.3,712 355,572 --Family allowances . 23,ii2U . 29,298 32,195 HI,lid mmLeave payments bj---- 307,398 318,31+0 28)4,023 - -
dash_____ ____ ___ 21,638 22,958 1 16,1*68 - -Bonds --- -— .— .. 285,760 295,382 267,555 - -
\J Personnel is as. of the first of the calendar month and includes those on terminal leave, the missing, and those in the hands of the enemy.
f Data for the Navy cover the Navy, llarine Corps, and Coast Guard, pay rolls are computed from personnel records. The personnel used in the computations is the count as of the last day of the month for the Army and the average for the month for the Navy. Pay rolls for the Navy (Proper) include quarterly clothing allowances in January 191+7 in the amount of $5»127»175*
U/ Although payments may extend over a period of three months, data for the Navy "* (proper) inolude the total amount in the month of discharge.
Represents Government• s contribution. The men's share is included in the pay roll.
6/ Leave payments were authorized by Public Law 701+ of the 79th Congress to former enlisted personnel for accrued and unused leave and to present officers and enlisted personnel for leave accrued in excess of 60 days. Payment of present personnel while on terminal leave is included in the pay roll. Value of the bonds represents the face value; interest will be paid in addition to the faqe value at the time the bonds are oashed.
Digitized for FRASER http://fraser.stlouisfed.org/ Federal Reserve Bank of St. Louis

(22)
Table 11,— Total Employment in United States Navy Yards and Private Shipyards Within Continental United States
by Shipbuilding Eegion, February 1947 1/
Shipbuilding EegionEmployment (in thousands)
February1947
January1947
February1946
*ll • 3P©g«LOTXS 327.5 242*4 470.9
U* S. navy yards 2]....... 87.2 89.5 210.0Private shipyards_____ _ 240.3 152.9 260.9
Horth Atlantic_______________ 105,6 107.5 217.4^out h At x ant 1 c .oiMwiwmmi 30,5 30.3 54.9
29,0 28.0 38.0IPaO X f 1C 66*0 67.3 148.2Great Lakos 6.3 6.3 6.91 nl and ».••«•«••• ><«f | 2.8 3.0 5*4
1/ Preliminary.2J Includes all Navy Yards constructing or repairing ships* including
the Curtis Bay} Maryland, Coast Guard Yard.
Digitized for FRASER http://fraser.stlouisfed.org/ Federal Reserve Bank of St. Louis

(23)Table 12.— Estimated Employment and Pay Rolls on Construction in Continental United States,
February 1940, January 1947, February 1947
Employment (in thousands) Pay rolls (in thousands)Type of project February
1947 1/January1947 y
February1946 2/
February'1947 1/
January1947 y
February1946 2/
New construction, total 2/.. 1,538.8 1,627.6 1,363.5 4/ 4/ 4/
At the construction site--- 1,341.1 1,417.9 1,184.6 4/ 1/ 4/Federal projects *>/___«...Airports _____ __________Buildings ----------Residential _____Nonresidential 8/.....
Electrification --------Reclamation _________River, harbor, and flood
control...............
6/ 137.966.154.2
6 J 12e i11.8
21.525.9
1.04.3
6/ 164.2 1.0
86.4 l0 ' 9 6/ 15.5
6.911.9
23.728,61,04.7
6/ 82.9 2.1
43.4 8.0
6/ 35.4 2.46.316.4
2/$27,7s7106
13,726, 11,633
y 2,093 934
2,900
4,4314,657184849
2/$34,150172 18,682
. 15,989U 2,693
960 2,676
5,0335'522177913
7/$l4,826414
7,4361,309
2/ 6,127 353
1,329
3,1211,502
269402
Streets and highways____Water and sewer systems — Miscellaneous.— .......
8.41.52.4
Non-Federal projects....-----Buildings ......------------Residential .........._______Nonresidential__....____
1,203.2903.7413.7 490.0
68.5139.236.013.023.0 55.8
197.7
1,253.7936.4435.7500.775.7137.7 39=0 15.123.964.9
209.7
1,101.7858.8349.6509.2
60.0100.5
27.08.218.855.4178.9
219,6^04/1/
4/y ,
y
4/
4/244,400
d
4/%
f/4/4/
188,95^4/Fa to dwellings and ser
vice buildings..—Public utilities________Streets and highways_____
State _______________County and municipal .
Miscellaneous..... ..... .
mmi
i/4/
4/
4/Other j/--...... ... ..Maintenance of State roads 10/ 98.0 102.2 92.0 4/ 4/ 4/
1/ Preliminary Prepared in the Construction DivisionRevised.2/ Data for all construction workers (contract and fo^ce account) engaged on new construction,
additions^ alterations, a$d on repair work of the type usually covered by building penults*(Force-aecount employees are. workers hired directly by the owner ani utilized as a separate work force to perfora construction work of the type usually chargeable to capital account*) The construction, figure.* included in the Bureau* s nonagricultural employment series covers only employees of construction contractors and on Federal force account and excludes force- account workers of State and looal governments, public utilities, and private firms#
4/ Data not available*2/ Includes the following f orce-account employees, hired directly by the Federal Government,
and their pay rolls? February 1946, l6,419, $3>l64,980; January 1947, 21,492, $4*145,085; February 1947, 20,773* $4,147,449* These employees are also included under the Federal executive service (table 9 )> aii Mother workers were employed by contractors and subcontractors©
6/ includes employment on construction., of plants to produoe atomic bombs, which, for seourity reasons, was not previously included in these estimates but was shown in the classification •other®, as follows: February 1946, 4,500; January 1947, 1,200; February 1947, 1,200*
7/ Excludes pay-roll data for construction of plants to produce atomic bombs*8/ Employees and pay rolls for Defense Plant Corporation projects are included, but those for
projects financed from RFC loans are excluded* The latter are considered non-Federal projects •
2/ Includes central office force of construction contractors, shop employees rf special trades contractors, such as bench sheet-metal workers, etc,
10/ Data for other types of maintenance not available*
Digitized for FRASER http://fraser.stlouisfed.org/ Federal Reserve Bank of St. Louis

24.Table 13
Estimated Humber of Prodwrtion Workers and Index&a of Production-WorkerEmployment and Pay-Rolls in Msn»tfacturing Industries., 1945 and 1946 l /
Industry Group ' ' \ ( U N - 100)&*id Industry (thousands) Employment Pay Roll
- m § ~ .1945 j 1946 1945 1946 . 1945AIL MA1TUPAC TURIN G ‘ j11,630 L2,437 1 142.0 I5I.8 266.4 293.4DURABLE GOODS 1 5,805 6,951 1 160.8 192.5 289.3 374.7NONDURABLE GOODS ! 5,825i 5,485 • 127.2i 119.7 244.1 214.0
Durable Goods i i 157.8 285.4IRC®. AND S1EEL I ’D THEIR PRODUCTS 1,394 1,565 140.6 242.8Blast furnaces, steelworks, ! !1and rolling mills j 440.7 458.O I 113.5 117.? 180.7 206.0Gray-iron and semi-steel 1
i
castings 79.2 71.-k | 135.6 122.1 270.7 243.2Malleable-iron castings ' 23.1 23.7 : 127.9 131.4 259.3 264,0Steel castings 47.7 62.5 158.5 207.6 274,4 369.9Cast-iron pipe and fittings 17.4 15.1 i 105.2 91.6 215.9 181.1Tin cans and other tinware 39.7 39.7 ! 1254 125. Q 225.1 213.8Wire drawn from purchased rods ! 27.6 3P.3 ! 125.4 138.0 204.0 223.6Wi rework j 3 6.6 31.7 ! 120.3 104.3 229.0 203.4Cutlery and edge tools i 24.9 22.9 j 161.8 148.7 344.T •301.8Tools (except edge tools, maohine | itools, files, and saws) ! 24.8 25.1 162.3 164.3 315.0 306.7Hardware | 44; 6 41.6 : 125.0 116.6 244.3 234.6Plumbers’ supplies 1 25.4 21.1 : 103,0 85.6 178.5 3-52,9Staves, oil'burners, and heating jequipment not elsewhere classified] . 54.0 56.2 1 117.1 121.9 217.7 226.0Steam and hot-water heating ]! \apparatus and steam fittings j; ^5.6 48.5 1 150.6 160.2 275.6 297.1Stamped and enameled ware and ;! i ; * igalvanizing j 74.71 77.1 ! 134.5 138.9 260.5 27.4.5Fabricated structural andornamental metalwork 1 50.5 56.8 1142.1 159.8 240.7 287.7Metal doors, sash, framesmolding, and trim i 8.6 8.9 , 111.7 114.9 202.0 212.0Bolts, nuts, washers, and rivets 19.2 22.2 ! 133.9 154.9 227.6 297.8Forgings, iron and steel 25.8
|30.6 i167.8
I199.2 292.8 375.8Wrought pipe, welded and
heavy riveted | 12.2 19.9 i146.0 238.3 247.6 473.5Screw-machine products and 11 twood screws ! 27-5 35.5 j162.8 .209.8 312.4 405.1Steel barrels, begs, and drums ! 5.6 7.5 ; 91.6 123.0 191.6 239.3Firearms 1 13.01 21.7 1260.2 433*8 501.5 927.7
ELECTRICAL MACHINERY 1 509 638 ! 196.6 246.4 3k-2.k 437.6364.0Electrical equipment 269.3 369.6 1149.0 204.5 253.2
Radios and phonographs 78.2 94.0 |179.8 216. C 3^5.2 408.8Communication equipment } 82.5 89.9 256.8 280.0 449.3 465.6
Digitized for FRASER http://fraser.stlouisfed.org/ Federal Reserve Bank of St. Louis

25.Table 13 - Estiir.nte<i Nujnber of Pro!action Yforkors and Indexes of Employmentand Fay Soils in Manufacturing Industries for 1945 and 1946 _l/
~j~£ s tirna te d ~Fr o~ i duction Y/orke'rs Indexes (1939 «. .100)
and Industry (thousands) Employment Pay Rolls1946 1945 1946. 1945 1948 1945■ •' v/'. ■ ... i
.ViACEINERY, EXCEPT. BU|pTRICAL liachinery and machine-shop
1,0*4 1,10P 197.6 209.9 341.7 378,8products 348.2 iI 398.0 172,1 196.7 299,4 <i50,0
Engines and turbines 39.2 i! 56.6 210,3 303.3 399.2 589.7TractorsAgricultural machinery, excluding
4 7.-9 i 53.5 153.2 171.2 227.4 262.1tractors 38,7 40.8 139,1 146,6 237,2 283.0
Machine tools 59.7 66.7 163,1 182,0 272,2 320,0Machine-tool accessories 48.2 56.7 193,5 225.2 310.2 374,1Textile.machinery 31.4 ;; 26*0 143.1 118,5 268.8 222.7Pumps and pumping equipment ! 54.3 ii 63.0 224,2 260,1 413.9 525,1Typewriters'Cash registers, adding and
18c6 i 12,9 115,0 79.8 221,3 156.8calculating machines
Washing machines, wringers and35,0 27,8 167,9 111*1 303.9 260,9
driers, domestic Sewing machines, domestic and
10, S< • 10.7 145,4 1 143,3 245.4 251*2industrial
Refrigerators and refrigeration•8,5 !\ 9,3 i121,0 122,1 228.6 249,8
equipment TRAH3PCRTATIOil EQTJIF&EHT, EXCEPT
55,8 ‘isV . S 150.6 128.5 254.9 221,0
AlTTOiiOBILES 480 il,4C9 302*7 938.4 549.1 ISOS, 5LocomotivesCars, eleotrio- and steani-
22.8 ; 31,4 353.0 484.8 715.2 1046,0railroad
Aircraft and parts, excluding45 9 53.1 .187.1 216.5 345,1 414,1
aircraft' engines’ 129.9 421,3 327.5 1062,0 coi.e '2040.3Aircraft engines 26.0 136,5 292,2 1535.4 460,8 2578,6Shipbuilding and boatbuilding 180.5 605,8 260, 7 961.5 462.1 2016.8Motorcycles, bicycles, and parts 10,2 8,6 146,0 123.5 257.5 226,4
AUTOMOBILE SHOHFERROUS METALS AHD TEEIR
661 60S 164,3 160.4 262.7 253.8
PRODUCTS Sn~lting end. re-fining,: primary,
377 1 387 164.5 168.9 299.8 513.7of nonferrous maitals
Alloying and rolling and drawing34.1 37,7 123,4 136.3 218.5 ' 250.8
of nonfe ro'us nstajs axcept, tvluradnua 55.2 • 63t<| 144,0 163.2 258,4 302.5Clocks and ■vfctchogJewelry (proe.ious metals) and
26.5 23,7 130,8 116.8 267.3 238.0ja-vrele rs findings 17,1 13 118,1 94,1 220.8 165.9Silverware E.nd platsd ware 13.9 | 10.7 114,4 • 88.5 231,2 162.8Lighting equipment 26.5 | 23,2. 129,2 113.5 219,4. 196,9Aluminum Manufactures Sneet-matal v:ork, not- elsewhere
45.7 I•j1 57,0\
194.2 242.2 325.6 420.0classified 2 4 * 6: 28.'0. 131,2 149, 2 246,5 281.1
Digitized for FRASER http://fraser.stlouisfed.org/ Federal Reserve Bank of St. Louis

26. Table 13Estimated Number of Production Workers and Indexes of Production-WorkerEmployment and Pay Bolls in Manufacturing Indus tides, 1945 and 1946 _l/
Industry GroupJ'Estimted Pro- T Indexes {1939 * 100)
duction Workers-i... ’aylToTl~ 1946 " 1945 | 1946 i" 1945 19.16 1945
LUMBER AND TIMBER BASIC PRODUCTS 5*9--- T1*88 ! 130.6 116.2 253.9 209.5
Sawmills and logging oamps 222.8 210.3 77.* 73.0 150.5 132.8Planing and plywood mills 70.9 66.3 j 97.7 91.2 183.4 156.5
fURNITURE AND FINISHED LUMBER 1104.9PRODUCTS 393 344 1 119.9 237.? 193.0
Mattresses and bedsprings 20.5 16,7 . 112.0 91.1 208.4 160.1Furniture 160.6 i44.o 1 100.9 90.4 199.5 165.8Wooden boxes, other.than cigar 24. 9 25.* ' 98.* 100.2 208.5 198.4Caskets and other morticians’ > agoods 13.3 11.9 1 106,8 95.7 189.9 163.9Wood preserving 12.1 10.2 [107.7 90.7 241.7. 197.4Wood, turned and shaped 22.7 20.9 i103.2 95.2 207.1 173.1
3T0NE, CLAY AND GLASS PRODUCTS 397 325 i 135.2 110.6 243.5 188.0Glass and glassware 101.3 85.5 ;1*5.1 122.4 250.6 195.2Glass products made from ipurchased glass 11.9 10.7 ‘118,9 106.4 220.1 183.8Cement 26.6 17.9 ' 111.5 75.2 183,4 122.4Brick, tile, and terra ootta j[ 59.1 42.7 104.1 75-3 197.5 126.6Pottery and related products 1 *9.7 38.7 !138.0 U 6.9 236.I 184,4Gypsum '' 5.5 4.1 i110.8 83.8 203,4 144.5Wallboard, plaster (except i igypsum), and mineral wool ! 10.3 9.4 1127.1 115.4 255.2 216.7Lime 8.7 7.6 :
191.6 80.5 200.7 161.8Marble, granite, slate, and
other products 16.3 13.3 j 88.0 71.6 142,3 111.2Abrasives 18.6 19.6 ;240.7 252.9 390.5 429.7Asbestos produots 18.5 18. k 116.7 115.8 243.5 236.9Nondurable froods
EXTILE-MILL PRODUCTS J^D OTHERFIBER MANUFACTURES 1,187 1,072 103.8 93.7 222.3 173.6C otton manufacture s, exceptsmall wares 449.1 4l4.7 113.4 104.7 259.3 204.6Cotton small wares 14.1 13.2 106.2 99.0 213.0 186.3Silk and rayon goods 91.7 86.3 76.5 72,0. 173.2 139.4Woolen and worsted manufactures,except dyeing and finishing 158.1 1*1,4 105.9 94.7 235.6 184.5Hosiery 113.3 98.3 1 71.3 61.8 137.0 101.0Knitted doth 11.1 , 10.1 1101.4 92.7 208.7 169.3Knitted outerwear and knitted !gloves 30.6 ! 27.6 il08.8 98.1 229.7 184.9Knitted underwear 34.9 | 33.5 | 90.6 86.9 190.7 162.8Dyeing and finishing textiles. tincluding woolen and worsted i 63.* 1 57.1 j 9*. 8 85.3 I85.5 147.0Carpets and rugs, wool I 23.7 ! 19.2 ! 92*6 75.0 171.9 126.9Hats, fur-felt
10 I 9.3 j 75.0 63.8 165.6 124.8Jute goods, except felts i 3.8 \ 3-3 ‘105.I 92.8 223.9 183.1Cordag^ and twine j 1^.9 i 14.5 1122.9 119.5 244.8 227.2S
Digitized for FRASER http://fraser.stlouisfed.org/ Federal Reserve Bank of St. Louis

27,Table 13. - Estimated Humber of Production Workers and Indexes of Employment
and Pay Rolls in Manufacturing Industries for 1945 and 1946 l /
Industry GroupEstimated Production Workers Indexes (1939 = 100)
and Industry (thousands) Employment Pay Rolls1946 ■< 1945 1946 1945 1946 1945
APPAREL ASD -OTHER FINISHED TEXTILE PRODUCTS 1,016 914 128,7 115,8 262,2 209,0Men’s clothing, not elsewhere classified 194.2 190.5 88,8 87.1 179,2 153., 7Shirts, collars, and nightwear 55.8 49.0 76,3 69.5 162,5 127.2Underwear fend neckwear, men’s 12.0 11.6 74.4 72.1 175.0 147.6Work shirts 13.4 13.9 99.7 103.2 213.5 197.4Women's clothing, not elsewhere olassifjed 211.9 201,8 78.C 74.3 161.5 156.3
Corsets and allied garments 16.0 14.2 84.9 75.9 165.6 133,6Mfllinery 18.7 18.2 76.8 75.1 131,6 12a, 2Hahdkerohiefs 2.5 2.5 48.5 52.2 103.8 97.4Curtains, draperies, and bedspreads 13.4 10.6 79.1 62,8 166.4 126,4Housefurnishings,-other than Curtains, eto. 10.6 10.3 100,0 96,9 196.6 177,0Textile bags 13«8 14.6 114,7 121.7 205,4 207,5
LEATHER ABD LEATHER PRODUCTS' 356 318 102,6 91,6 201,9 168,6Leather 42,8 39.4 90.5 83,5. 162,5 148,8Boot and shoe cut1 stock and findings 17.9 16.2 94,8 85,7 170.9 146,4Boots and shoes 191.4 171.1 87,8 78.5 179,7 148,1Leather gloves and mittens 11.3 11.5 112.7 115,3 214,1 202,7Trunks and suitoases 14.2 12.3 169,6 147,3 316,5 248,0
FOOD 1,094 1,080 128,0 126,4 22S,0 209,4Slaughtering and meat packing 152*0 133.6 109,6 110,8 183,5 181,7i:\jtte r 24.-2 23.3 134.9 129,6 . 239.4 209,1Condensed and evaporated milk 14.0 14.5 143.9 149,8 •265.6 253,4Ice cream 17.8 15.6 113.4 99,4 185.7 147.2Flour 29.7 29.9 119.8 120.9 229.0 210,9Feeds, prepared 21.9 22.2 142.2 144.0 259.9 250,8Cereal preparations 10.4 9.2 140.1 123.9 248.1 224,8Faking 244,8 253,8 106.1 110.0 184.3 173,5Sugar refining, cane 13.2 13.8 9<s .4 97.7 150.3 155.3Sugar, beet 9.0 8.6 86.6 82.6 157.7 126.9Confectionery 51.9 54 o 4 104,4 109,4 195,6 187.6Beverages, nonalcoholic 23.8 25,5 111,8 119.8 163,9 161.9Malt liquors 52.6 52.1 145,9 144.4 224,5 217.1Canning dnd preserving 136.* 132,6 100,5 98,6 234.4 195,5
TOBACCO MANUFACTURES 86 82 92,0 87,4 187,1 164,7Cigarettes- 33.3 34.5 121,6 125.7 219,5 203,5Ci-gars 39*1 33.3 76.7 65,5 170,5 136,6Tobacco (chewing1 and smoking) and snuff 7.6 8,5
f82,8 92,8 143,5 154,1
J
Digitized for FRASER http://fraser.stlouisfed.org/ Federal Reserve Bank of St. Louis

28.Table 13, - Estimated Number of. Production Workers and Indexes of Employment
arid Pay Rolls in fenufacturing Industries for 1945 and 1946 \ /
Industry GroupEstimated Production Workers Indexes (1939 = 100)
arid Industry (thousands) Employment __ Pay Rolls1946 1945 1946 1945 1946 1945
PAPER AND ALLIED PRODUCTS 367 321 138.1 120.8 250.5 204.3Paper and pulp 165.6 145.5 120.5 105.8 220.3 183.3Paper goods, other 46.4 43.4 123.2 115.4 219.8 189.9Envelopes 10.4 9.4 119.1 108.7 205.9 171.6Paper bags 14.5 12.7 130.4 114.3 240.8 201.3Paper boxes 86.7 77.5 125.3 112,1 227.8 184.7
PRINTING, PUBLISHING,. AND ALLIED INDUSTRIES 396 336 120.7 102.4 194.8 148.2Newspapers and periodicals 130.0 111.8 109.6 94.2 ' 165.5 •126.-1Printing, book and .job 157.6 134.9 124,7 106.8 209.0 162,0Lithographing 28.9 24,7 111.2 94.9 178,4 140.5Bookbinding- 31.5 27.5 122.4 106.8 244,3 ,187.1
CHEMICALS AND ALLIED PRODUCTS 534 C32 185,3 219.3 323,6 3 6? . 1Paints, varnishes, and colqrs 35. 29,0 125.3 106.0 198,5 160.8Drugs, medicines, and insecticides 51.8 48.1 188.9 179,2 312.9 ' 274.3
Perfumes and cosmetics 12.2 i 12.3 118,1 115.0 192,7 173,0Soap 14.0 13.3 103,0 97.9 172.0 165,7Rayon and allied products 58.5 54.5 121.1 112.9 204.0 ; 184.0Chemicals, not elsewhere classified 117.5 113,2 168.8 162.8 286.8 284 .8
Explosives and safety fuses 13.6 72,2 187,0 996.1 295.0 1509.7Compressed and liquefied gases 5.6 5,8 142.0 . 146.6 233.5 254.8Ammunition, small-arms 7.5 .14,3 174.8 1040.1 • 336,9 2049.0Fireworks 3.0 15.3 256.0 1319.1 651.0 3637.8Cottonseed, oil 13,9 15.8 91.6 104.3 210,4 222,1Fortilizers 24.0 22,6 128.0 120.6 300.0 276.4
PRODUCTS OF PETROLEUM AND COAL 152 Hit 143.4 129.7 243.7 227.6Potroleum refining 98.4 92.0 135*2 126.3 224.1 216.8Coke and by-products 24.5 22.1 112.9 101.7 200.1 183.8Paving materials 1.9 1.6 78.0 67.5 , 150.7 131.7Roofing materials 11.8 9.6 146.1 118.8 275.4 215*9
RUBBER PRODUCTS 223 196 184,1 161*9 333.2 289.4Rubber tiros and inner tubes 105.2 SO,5 1S4.3 167.1 317.8 279.8Rubber boots and shoos 17,9 1G. 5 120.7 111.2 233.2 207.0Rubber goods, other 70.5 66,6 136.2 128.6 ■ 262.6 234.8
MISCELLANEOUS IF! DUS TRIES 416 398 170.1 162.7 318.9 •308.6Instruments (professional .and scieritifio), and fire control e-quipment 21.4 •: 48.9 . 193.4 414.9 331.3 770.8Photographic apparatus 24.3 j 25.4 140.8 147.0 230.6 243.2Optical instruments and ophthalmic goods 21.2 I 21.6 182.2 185.8 , 317.0 314.5
Pianos, organs, and parts 8.8 j 6.9 . 115.3 90.4 213.6 166.0Games, toys, and dolls 21.5 i 15.3 115.2 82.2 235.4 158.8Buttons 10.2 1 9.3 93.4 84.4 , 199.3 170.5Fire extinguishers 2.1 3,8 213.0 379.4 428.4 817.6
Digitized for FRASER http://fraser.stlouisfed.org/ Federal Reserve Bank of St. Louis

Tabl* 13EstiijsatM Number gf Pr®duoti«n Workers and. Xp^sxes of Prcniu<rbi«>-W«a*k« Employment and Pay Rolls in Manufacturing I**&jistries, 19^5 a»d 19^6 l/
Estimates and indexes for the major industry groups have" "been adjusted:‘to levels indicated by the final 19^5 data made available by the Bureau of Employment Security of the Federal Security Agency and supersede data shown in mimeographed releases dated prior to April 19^7 and Monthly Labor Reviews dated prior to May 19 7. Estimates and indexes for individual industries have been adjusted to levels indicated by the 1939 Census of Manufactures, but not to Federal Security Agency data. However, these are now in the process of being adjusted to mere current levels. As the industries comprising a single group are revised., they will be released.' Issuance of revisions will not be held pending completion of adjustments for all groups.
; Division of Employment Statistics
Digitized for FRASER http://fraser.stlouisfed.org/ Federal Reserve Bank of St. Louis

Table 14Estimated Humber of Employees and Indexes
of 3mployment and Pay Rolls in Selected Nonmanufacturing Industries,1945 and 1946
2 Q 9
Industry Group and Industry
Humber of Employees
(thousands)Indexes of
Employment Pay Rolls1546 1945 1946 j 1945 1946 1945
1939 average •* 100MiningsAnthraoite 67*6 60.1 81.6 72.6 181.1 137.9Bituminous coal 307 322 82.7 86*9 202.8 195.9Metal: 67*2 66.6 76 ol 75.5 127.3 123.3Iron 23*8 23.9 118.1 118*8 196.3 201.2Copper 19*4 20*5 81.2 86.2 142.2 142.2Lead and zino 14*5 14.0 93.5 90.3 181.4 170.6Gold and silver 7.2 5.6 29.0 22.6 41.5 29.2Miscellaneous 2.3 2.6 58.5 65.1 92.9 106.1,
Quarrying and nonmetallio P 2/ 96.2 80.2 200.8 152.9Crude petroleum production z/ y 1/ 92.9 84.0 147.0 135.2
Public utilities: Telephone 543 419 170.9 131,8 253.4 177.4Telegraph 42.9 45.4 114.0 120.5 180.0 176.731ectrio light and power 243 205 99.4 84.2 148.2 120,1Street railways and busses 248 230 128.2 118.7 200.4 177.8
Yiholesale trade 2/ 2/ 108.4 97.0 176.0 145.5Retail trade: mm. 109.7 99.5 174.4 138,5Food 2/yy
2/ 105.6 104.1 172.0 145.5General merchandise ii2/ 127.3 116.5 195.1 154.0Apparel 115.0 108.6 187.4 156.0Furniture and housefurnishings hK y, 73.8 64.0 129.6 93.3Automotive 2/ 92.5 71.8 155.5 110.7Lumber and building materials V y 109.7 93.5 179.0 139.8
Hotels (year-round) i/ 385 359 119.3 111.3 207.0 174.8Power laundries 2/ y 110.6 106 04 187.5 165.4Cleaning and dyeing y V 125.7 119.1 220.4 191.9Class, I steam railroads b/ 1,559 1,421 137.6 143.8 y y\J Data are for production workers only*2{ Hot available*
Does not include well drilling or rig building* i/ Cash payments only; additional value of board, room, and tips, not included*
Sources Interstate Commeroe Commission*
Digitized for FRASER http://fraser.stlouisfed.org/ Federal Reserve Bank of St. Louis

31,Table 15. - Revised Estimates of Manufacturing Production
Workers and Indexes of Employment and Pay Rolls, .by Major Industry Group, January 1945 -
December 1946 l/
Yearandmonth
ALL MANU]FACTURING DIVISIONS DURABLE: GOODS DIVISIONEstimated number of production workers
Indexes (1939 average * 100) Estimated
number of production workers
Indexes (1939 average « 100)
Production-workeremployment
Production- worker pay rolls
Production- worke r employment
Production- worker pay rolls
(thousands) (thousands)1945 12,437 151.8 293.4 6,951 192.5 374.71946 11,630 142.0 266.4 5,805 160.8 289,31945Jan.. 13,783 168.2 347.0 8,194 226.9 476,9Feb.. 13,819 168.7 347.5 8,219 227,6 476.7Mar.» 13,739 167.7 345.7 8,150 225.7 472.1Apr.. 13,537 165.2 338.5 8,001 221.6 460.6May.. 13,310 162.5 324.9 7,816 216.4 438.1June. 13,105 160.0 321.8 7,582 210.0 426,4July. 12,743 155.6 306.6 7,279 201.6 400,4Aug.. 12,431 151.7 273 .6 6,983 193.4 346.0Sept. 10,718 130.8 228.7 5,362 148.5 252,5Oot.. 10,639 129.9 227.7 5,281 146.2 250,5Nov... 10,692 130.5 227.7 5,310 147.1 248,4Dec.. 10,725 130.9 231.4 5,239 145.1 247,41946Jan.. 10,864 132.6 234.1 5,342 147,9 249,9Feb.. 10,147 123.9 214.3 4,522 125.2 204,2Mar.. 10,819 132.1 238.3 5,118 141.7 244.8Apr.. 11,347 138.5 254.8 5,629 155.9 275.7May.. 11,433 139.6 253.5 5,740 159.0 275.1June. 11,623 141.9 262,8 5,865 162.4 289,1July. 11,767 143.6 267,1 5,984 165,7 296,3Aug.. 12,101 147.7 284,4 6,160 170,6 316,1Sept. 12,244 149.5 290.3 6,249 173,1 323,3Oct.. 12,253 149.6 292,8 6,281 173.9 328,1Nov. * 12,449 152,0 298,2 6,379 176,7 331,1Deo.. 12,514 152.8 306,2 6,393 177,0 337,3
Source* Division of Employment Statistics (4-47)
Digitized for FRASER http://fraser.stlouisfed.org/ Federal Reserve Bank of St. Louis

32,Table 15. - Revised Estimates of Manufacturing Production
Workers and Indexes of Employment and Pay Rolls, byMajor Industry Group, January 1945 - December 1946 l /
NGNDURA]BLE GOODS DIVISION IRON AND STEEL AMD THEIR PRODUCTSYearandmonth
Estimated Indexes (1939 average « 100) Estimated
number of production workers
Indexes (1939 average = 100)n uxuDe r ox
production worke rs
Production-workeremployment
Production- worke r pay rolls
Production-workeremployment
Production- worker pay roils
1945(thousands)
5,485 119.7 214.0(thousands)
1,565 157.8 285.41946 5,825 127.2 244.1 1,394 140.6 242.81945Jan.. 5,589 122.0 220.0 1,739. 175.4 331.7Feb.. 5,600 122.2 221.1 1,761. 177.6 335.8Mar.. 5,589 122.0 222.2 1,762 177.7 339.2Apr.. 5,536 120.8 219.1 1,745. 176.0 336.3May*. 5,494 119.9 214.1 1,730 • 174.5 327.6June. 5,523 120.6 219.6 1,685 169.9 318.8July. 5,464 119.3 214.9 1,616 163.0 301.1Aug., 5,448 118.9 202.8 1,547 156.0 264.0Sept. 5,356 116.9 205.5 1,278 128.9 212.5Oct.. 5,358 117.0 205.4 1,279 129.0 213.4Nov.. 5,382 117.5 207.4 1,296 130.7 216.8Bee.. 5,486 119.8 215.7 1,337 134.9 227.51946TanT. 5,522 120.5 218.7 1,358 136.9 223.7Feb.. 5,625 122.8 224.1 877 88.4 132.6Mar.. 5,701 124.4 232.1 1,313 132.4 225..1Apr.. 5,718 124.8 234.4 1,395 140.7 242. XMay.. 5,693 124.3 232.3 1,380 139,1 232.3June. 5,758 125.7 237.0 1,403 141.5 240.3July. 5,783 126.2 238.5 1,445 145.7 247.5Aug.. 5,941 129.7 253.4 1,490 150.2 265.9Sept. 5,995 130.9 258.1 1,514 152.7 ■273.6Oct.. 5,972 130.4 258.3 1,500 151.2 273 .7Nov.. 6,070 132.5 266.0 1,535 154.9 280.8Dec.. 6,121 133.6 275.8 1,521 153.4 276.2
Source* Division of Employment Statistics (4-47)
Digitized for FRASER http://fraser.stlouisfed.org/ Federal Reserve Bank of St. Louis

Table 15* - Revised Estimates of Manufacturing'Produo.ti.on-Yforkers and Indexes of Employment and Pay Rolls, byMajor Industry Group, January 1945 - December 1946 l/
33
ELECTRICAL MACHINERY MACHINERY, EXCEPT ELECTRICALYear
Estimated . number of
Indexes (1939 average - ICO)
Estimated number of
Indexes (1939 average = 100)
andmonth
production worke rs (thousands)
•Production-workeremployment
Production- worker pay rolls
production workers (thousands)
Production-workeremployment
Production worke r pay rolls
1945 638 246 *4 437.6 1,109 209.9 378.81946 509 196,6 342.4 1,044 197.6 341.7
1945 J an» . c 733 282.8 530.3 1 ,2 2 1 231.1. 442.9Feb9«• 736 284,1 534.0 1,232 233*1 448*8Mcr.oo 738 284,7 537.2 1,226 232*1 446.0Apr*.* 731 281*9 529.0 1 ,2 1 0 228.9 'x35.8May*.* 723 278.9 514.0 1,194 225.9 415.8June,'. 713 275*2 505.8 1,180 223.4 420.4J uly*. 683 -263 o 7 478.0 1,148 217.2 389*2Aug,*. 663 255.8 413.8 1,116 211.3 351.7Se pt. « 460 177s6 278.0 944 178.6 294.4Oct... 483 186.5 299.3 940 177.8 294.3Nov.*. 496 191*5 312,6 941 178,2 293.1Dec... 502 193,6 319.5 959 181e5 303.5
1946J an..o 493 190c4 313.5 991 187.5 308.5Feb#•« 353 136*1 214.2 861 163.0 264.0Mar... 380 146.6 2o 2 . 3 910 172.3 287.3Apr... 461 177.9 296,6 983 186*1 312.9Kay... 503 194.2 323.0 1,025 194.1 322.5June*. 521 2 0 1 .2 347.9 1,049 198.6 342.0•July. . 526 203.2 351.0 If 066 2 0 1.8 346.2Aug..» 545 210.5 378.9 1,092 206.6 362.2Sept.. 563 217.3 397.2 1 ,1 1 2 210.3 376.2Oota.. 579 223.4 408.1’ 1,131 214.0 388.0KOV... 590 227.6 416.0 1,150 217.7 390.1Dec... 597 230.6 430.2 1,161 219.6 399.9
Source: Division of Employment Statistics (4-47)
Digitized for FRASER http://fraser.stlouisfed.org/ Federal Reserve Bank of St. Louis

34. Table 15, - Revised Estimates of Mamifaotjjring ProductionWorkers and Indexes of Employment and Pay Rolls, "byMajor Industry Group, January 19*5 - December 19*6 1/
Yearandmonth
TOAHSP(®TAl'I0lOlQl0IlMEOT, EXCEPT ' ________ AUTOMOBILES AUTOMOBILESEstimated number of
Indexes __(1939 average " 100)
Estimated number of
I Indexes I (1939 average =100)
productionworkers(thousands)
Production-workeremployment
j Production- j worker I pay rolls
production 1Production- j workers j worker (thousands) j employment
1 Froduction- j "worker jpay rplls
19*5 1,489 938.4 1909,5 605 150,4 253.819*6 480 302 0 7 549,1 661 164,3 262.7
19*5Jan.. 2,185 1376,6 2993.6 716 177,9 335.4Pet.. 2,157 1359,2 2912,7 719 178.7 337.5Mar.. 2,094 1319,5 2812.8 711 176,8 330.8Apr.. 2,007 1264.3 2671,9 703 175,4 324.4May.. 1,879 1184.1 2460,6 683 169,8 300,2June. 1,735 1093.3 2295,4 662 164*6 290.8July. 1,637 •1031,3 2145,9 624 155.0 262.7Aug.. 1,522 958.9 1805,8 577 143,3 19.0.2Sept. 816 514,0 873.9 441 109,6 156.6Oct.. 691 435.3 738,8 477 118.5 177.9Nov.. 594 374.2 604,4 544 135,2 199.1Dec.. 556 350.1 598,0 402 99*9 140.4
19*6 Jan.. 538 338.7 579,3 431 107.2 159.1Feb.. 484 305ol 509,4 430 106,8 147,6Mar.. 476 299,9 525,5 464 115.3 173.0Apr.. 504 317,6 578,7 64.6 160,5 250.7May.. 491 309,2 558o3 675 167,8 241.4June. 479 301.6 557,5 683 172,3 259.9July. 476 299.9 558,7 725 180.2 292.8Aug.. 468 294.7 553.1 755 187,8 319.0Sept. 455 286.8 524,1 788 196,0 330.3Oct.. 457 287,8 542,3' 774 192,3 324.3Nov.. 464 292.4 531,1 778 193,3 325.7Dec.. 473 298.2 571,2 774 192,3 328.9
Sotirce: Division of Employment Statistics ( 4-4^
Digitized for FRASER http://fraser.stlouisfed.org/ Federal Reserve Bank of St. Louis

Table 15» - Revised- 'Strtviiettee of ProductionWorkers and Ifciesj&a «f Etnj>l ffigat and Pay Bolls, byMajor Industry Group, January 19^5 - December 19^6 l/
35.
Yearaadmonth
Estimated | Indexesnumber of. | (1939 average « ICO) production j Producti on'-TTr oauc tion- wcrkers j worker j worker (thousands) j employment I pay rolls
LIMBER AND 'Hffl l4SIC ' H?0DUGgS~Estimated ! sunber of production workers (thousands)
Indexes _ ('*939 average - 100) ~&cduction-^"pr>oduetion- vorker worker eraployaent pay rolls
19^?19^6
. 19^ Jan.. Feb.. Mar.. Apr.. May.. June. July. Aug,. Sept. Oct.. Nov.. Dec..19^6 Jan.. Feb., Mar.. Apr.. May.. Jun.fi. July. Aug. 4 Sept. Oct.. Nav.. Dec. «
387377
417426432432432422399392312316330336
343294324352360378392406411417422426
168.9164,5
182.0185.8 188*7 188.,6 188*3 184ol 173*9 171.1 138 90137.8 144.0 146.7
149*6128»2141*4153.4157.0 164.9 171.2 177*3 179*5182.0 184.0 185.8
313.7299„8
354.2362.1369.9 367,7 356 06 348o8324.9 3C2,6 230*4 233a 25101 £57.3
262o5 226 »9 252*1276.5 281.4208.6 303.9 324 o 2c)D 1.8338*8345.3355.3
488549
508509 503 496501502 498 496 477 447 454 487
482487499521537552561584533590599592
116.2130.3
120*9 121 «0120.5 II80O 119«3219.5118.5 118.1113.5 106 «4 10?o9 111.1
114c 5116e0118.6123.8127.8 131.6133.5 139.0138.6140.4142.4140.8
209o 5 253,9
217.8 222.0 221*5 222,1 222*8 230.1211.8 207.6 202.3,186c8;182 *7 186.9'
194.4205*6219.1231.7244.2 261.9 252*1285.0285.2292.0284.7 290.6
Souree: Division of Employment Statistics (4-4 7)
Digitized for FRASER http://fraser.stlouisfed.org/ Federal Reserve Bank of St. Louis

36.
Yearandmonth
19^519k6
M Sdan.. F eb .. Mar.. Apr.. May.. June. July. Aug.. Sept. Oct.. Kov.. Dec..19^ Jan.. Pet.. Mar.. Apr.. May.. June. July. Aug.. Sept. Oct.. Kov., Dec..
Table 15 . - R evised E stim ates o f M a m if^ tu ririg P ro d u ctio n W orkers and In dexes o f Bngalcpen* and Pay Ro31s , by.
Ma.3o r In d u stry Groi p., Ja m a ry 19^5 - December 19*6 1 /‘ W HECSOSfi''fflSD Tni3HH2D“lI«SIS- - - - - - - - - - - - - - - - - - - - - - - - - - - - - - - - - - - - - - - - - - - - - - - - - - - - - - - - - - - - - - - - - - - - - - - - - - - - - - - - - - - - - - - - - - - - - - - - - - - - - - - - - - - - - - - - - - - - - - - - - - - - - - - - - - - - - - - “
____________ PRODUCES _____Estimated J Indexes'number o f j___ (1939 average = 100)production Production- i Production- workers worker '•« worker
344393
351355355351351354348344316320334351
TSTOKE, CLAY, AMD GLASS PRODUCTSEstimated' number of production workers
Indexes (1939 average = 100)
Production- ] Production-vorker ! worker
104.9 193.0 325 110.6 188*0119.9 237.9 397 135.2 243.5
106.9 200.7 324 110.4 186.8108,3 205.3 324 110.5 188.3108.2 205.1 326 111.1 192.7106.9 202,9 323 109.9 193.7107.0 200.3 323 109o9 189.2107*8 203o4 329 112,2 194.2106,2 196.5 326 111.1 190.8104.7 179.1 326 111.1 184.696.2 170*7- 318 108.4 100.397.5 175o8 328 111.7 188.0101.8 180#4 321 109.3 180.5106.9 136.0 323 112.0 186.6
362 110.5 201.1 344 117.3 190.4370 112.7 208,9 366 124.7 210.0373 114.6 217-,9 376 128.3 223.1382 115.3 323.9 385 131.1 230.3381 116.2 221.6 388 132.3 230.2391 119.1 233.3 398 135.6 241.4392 119.6 231*9 401 136.6 242.2405 123.4 2.50,0 415 141.6 260.1405 123.5 254 » 4 418 142 0 5 267.0411 125,2 264.2 422 143.8 271.3419 127,7 268.5 422 143.9 274.8425 129.6 279.1 424 144.4 281.6
Source: Division of Employment Statistics ( 4-47)
Digitized for FRASER http://fraser.stlouisfed.org/ Federal Reserve Bank of St. Louis

37.Table 15, - Revised Estimates of Manufacturing Production
Workers and Indexes of Employment and Pay Rolls, byMajor Industry Group, January 1945 - December 1946 i f
Yearandmonth
TEXTILE-MI FIBE
LL PRODUCTS AND OTHER MANUFACTURES
APPAREL AND OTHER FINISHED TEXTILE PRODUCTS
Estimated Indexes Estimated Indexesnumber of (1939 average « 100) number of (1939 average ■ 10©)produoti on Production- f Production- production Production-I Produotion-workers worker ! worker workers worker |worker(thousands) employment : pay rolls (thousands) employment i pay rolls
1945 1,072 93.7 173.6 914 115.8 209*01946 1,187 103*8 222.3 1,016 128.7 262.2
1945wmmmrnmmmuQJl» # 1,109 97*0 .178,0 934 118,3 217*7Feb.. 1,101 96.3 177,3 940 119.1 227.3Mar.. 1,093 95*6 177,3 944 119.5 232.8Apr*. 1,072 93.8 172 ,6 930 117*8 219.2May.* 1,062 92*9 167.9 915 115*9 203*9June. 1,068 93*4 176,8 912 115,5 207.0July. 1,047 91*6 172*1 865 109.6 190.5Aug.. 1,045 91*4 161,5 888 112.4 178*8Sept* 1,046 91*4 168.9 896 113o5 205.0Oct o O 1,051 91*9 .170 04 912 115.6 210*0Nov.* 1,057 92*4 173.9 914 115*8 204.6Dec.. 1,107 96.8 187*0 923 116.9 211*41946Jan.. 1,121 98.0 189,6 939 119.0 224o2Feb.» 1,150 100*6 202,5 976 123*7 236.1Mar.. 1,169 102*2 211.4 998 126.4 259.1Apr.. 1,176 102 o 8 214.4 1,000 126.7 259.0May.* 1,178 103*0 213.5 995 126 eO 254.2June. 1,191 104el 217*2 1,013 128.3 258.6July* 1,175 102*8 21oo3 983 124*5 240*3Aug., 1,189 104*0 229.4 1,030 130.5 272*5Sept. 1,204 105.2 235,5 1,049 132.9 283.0Oct.* 1,215 106*2 241,1 1,065 134.9 283.6Nov.. 1,230 107*6 246,0. 1,063 134*6 283*2Dec*. 1,242 108*6 253,7 1,079 136.6 292*7
Sourcej Division of Employment Statistics (4-47)
Digitized for FRASER http://fraser.stlouisfed.org/ Federal Reserve Bank of St. Louis

38#Table 15. - Revised-Estimates of Manufacturing Production
Workers and Indexes of Employment and Pay Rolls, by___ Major Industry Group, January 1945 -December 1946 l /
'TESTHER MIJTMTEEfrPROCUCTS' ‘ ! ---FOOTYearandmonth
Estimated number of
Indexes (1939 average « 100)
Estimated’ number of
Indexes (1939 average = 100)
production workers (thousands)
Product!on-workeremployment
Production- worker pay rolls
production-workers(thousands)
Production-! worker employment j
Production- worker pay rolls
1945 318 9106 168»6 1,080 126.4 209.41946 356 102,6 201e9 1,094 128,0 220.0
1945JanT. 319 9109 166 « 9 1,050 122.9 2^3.0Feb.. 319 91o9 16 9‘. 1 1,038 121.5 197.0Mar., 318 9108 172*9 1,024 119.9 196.0Apr.. 315 90® 8 170.2 1,025 119.9 1S7.0May®. 314 90,5 164.6 1,021 119.5 196.4June. 319 92 e0 174.4 1,046 122*4 205.9July. 315 90,9 169,3 1,110 129.9 216.7Aug.. 316 91*0 161.1 1,12 1 131*2 209.1Sept. 3® 7 88.6 161*5 1,201 140 0 5 230.1Oct. « 316 90.9 16 0.2 1*133 132.6 219.2Nov.• 323 93.1 166o5 1,10 1 128.9 218.2Dec.. 333 95»9 180©5 1,095 128.1 223 o 81946 Jan.« 340 98*1 196*6 1,067 124.9 21§.3Feb.. 351 lOlol 195.9 1,061 124.1 214.7Mar.. 358 103,1 203 06 1,050 12208 209.7Apr«. 358 103® 3 20S, 3 1,039 121*6 208.5May.. 359 103.4 20406 1,024 119.9 205.1Juno. 360 103 „ 8 204.9 1,033 120*9 20&,2July. 35 7 103.0 198*7 1,119 131.0 235,1Aug., 356 102,7 199<;5 1,184 138,6 254.3Sept. 358 103 ,1 204©7 1,175 137.5 246.5Oct., 355 102 o 2 199*5 1,091 127o7 232.3Nov.. 357 102 a 9 201*6 1,141 133*5 252.0Dec*. 362I 104.4 218e3 1,139 133.3 263.3
Source» Division of Employment Statistics (4-47)
Digitized for FRASER http://fraser.stlouisfed.org/ Federal Reserve Bank of St. Louis

Table 15* - Revised lirbimartes of Manufacturing ProductionWorkers and Indexes of Bmpio^ment and Pay Rolls, byMajor Industry Groups# January 19^5 - Docambar 19*16 l /
39.
TOBACCO MAKUFACT ORES PAPER 4LHD ALLIED PRODUCTSYear Estimated Indexes Estimated Indexesand number of (1939 average * 100) number of (1939 average * 100 )month production Production- Production- production Irocuction- Production-workers worker xror'zer workers worker worker
. (thousands) employment .pay rc>lls (thousands) employment pay rolls1945 82 87.4 164.7 321 120*8 20‘i ? 31946 86 92.0 187*1 367 138.1 250.519415 Jfr.n.. 82 88.2 167,0 319 120*3 201.4Teb.. 82 88.2 165,6. 321 121,0 202,6Mar.. 82 87.8 166.6 320 120,5 203.3Apr.. 81 86.8 160.8 315 118.7 201,6May.. 80 85.6 157.2 314 118.2 196,6June# 80 86,1 164.5 319 120.1 204 o 7July* 78 83.4 151,9 314 118*2 201*2Aug*. 79 84,3 149.3 315 118,7 191*9Sept* 83 89*5 176,0 316 118,9 203.2Oct»• 86 92,2 181,7 325 122»3 209.4Nov.. 83 89,2 172,2 330 124,4 213.6Dec.. 82 87*8 164,1 339 127,8 221,61946Jan.. 81 B7.0r, 166*7 345 130.1 224.3Feb.. 81 87.3 165.2 352 132.5 228.0Mar.. 82 87.9 171,3 357 134,4 235.4Apr*. 85 90.8 174*6 361 136 *0 238*6way.. 65 91.2 iei.1 363 136.8 240.0June. 86 92.1 lCd.l 363 138.8 247.0July. 85 90.7 178.3 335 137.4 246.4lug.. 86 91.7 186,2 339 139-2 256.5Sept. 67 93.5 196.0 372 140.0 259. &Oct.» 89 95.8 207.4 376 141,7 268.5llov.. 91 97*6 212.7 383 144.3 276.6Deo.. 92 98.3 222.0 387 145.7 284.5
Source; Division of Employment Statistics (4-47)
Digitized for FRASER http://fraser.stlouisfed.org/ Federal Reserve Bank of St. Louis

40.Table 15c - Revised Estimates of Manufacturing Production
Workers and Indexes of Employment and Pay Rolls, byMajor Industry Group, Jamiary 1945 - December 1946
Yearandmonth
— ...ALLIED INDUSTRIES
CHEMICALS AND ALLIED PRODUCTS
Estimated number of production worke rs (thousands)
Indexes (1939 average = 100)
Estimated number of production workers (thousands)
Indexes (1939 average = 100)
Froduction-workeremployment
| Production- worker
j pay rolls,Produetion-workeremployment
Production- worker pay rolls
1945 336 102.4 148*2 632 219.3 3 83 . x1946 396 120.7 1S4.8 534 185,3 323.61S453S5T. 325 99.2 140,5 688 238,9 421.4Feb.. 326 99.4 139.5 703 243.8 429,5Mar.. 327 99.6 141.5 706 245.1 436.0Apr.. 325 99.2 140,9 704 244,1 434.7May*. 327 99,9 142,2 695 241,3 433.9June. 329 100.4 143 o 7 686 238,1 427.2July. 328 100.1 142.5 661 229,2 408.4Aug.. 333 101*6 144,7 616 213,8 366.5Sept. 335 102.2 152,8 537. 186,3 316,3Oct.. 34-8 106,0 155.9 527 182,7 308,9Nov.. 359 109o6 lG'IroO 529 183,6 306.0Dec. ♦ 367 111,9 169,6 531 184.1 308.31946Jan.. 372 113,3 172.2 533 184.8 310«7Feb.. 381 116,2 17 7.,4 536 185.3 310.7ilar.. 386 117.7 183 o 8 540 187.3 317.0Apr.. 389 118.5 185.6 539 187.1 318.8May.. 389 118.7 186,4 527 182,8 311.1June. 393 119,9 .191,3 522 181,3 313*0July. 397 121.1 193,3 516 178.9 ol5<>5Aug . • 399 12106 198.1 520 180.5 320.0Sept, 401 122*3 203*1 530 184.0 329.1Oct.. 410 125.0 208.4 539 187.2 335.3:Nov.. 415 126,6 214.0 550 190.9 345.0Dec., 420 127.9 223.9 555 192,5 357 .0
Source: Division of Employment Statistics (4-47)
Digitized for FRASER http://fraser.stlouisfed.org/ Federal Reserve Bank of St. Louis

41Table 15 . - Revised Estimates of llamifacturing Production
Workers and Indexes of Employment and Pay Rolls, byMajor Industry-Group, January 1945 - December 1946 \ /
PRODUCTS OF PETR'OLE® AND COAL *' *"".^ ~ RUBBER PRODUCT 'WT, r . , ™ r , r - - « . ~oYearandmonth
Estimated nurabe r of
• Indexes j (1939 average = 100)
Estimated ' numbe r of
! Indexes ! (1939 average = 100)
production jFroducticn- workers j worker (thousands) jemployment
| Production- worker
j pay rcillsproduction v/orke rs (thousands)
Production-workeremployment
Production*- worker pay rolls
1945 137 129o7 227.6 196 161.9 289*41946 152 143,4 243.7 223 184.1 333.21945Jan.. 134 126.8 222.9 209 172.4 .337.9Feb.. 135 127,4 225.5 209 172.9 338.8Mar.* 136 128.1 227.2 209 172.6 314.5Apr.. 136 128.3 233.7 204* 168.9 314.6May.* 137 129.2 232,1 200 165.8 298.3June. 138 130.3 235.8 198 163.5 302,5July* 139 131.4 240.8 193 159.4 296.6Aug. . 139 131e3 235 .8 189 156.5 263 .2Sept* 134 126.4 217.5 163 134.9 228.6Oct.* 134 126.7 203.1 134 152.4 251.1Nov.. 143 134.7 228*6 191 158.0 254.5De c .. 144 135.7 228.0 201 165.9 271*71946Jan.. 146 137.5 226.7 206 170.2 286.0Feb.. 142 134.2 227.1 211 174.5 287.7Mar.. 149 140.4 237.2 216 178.7 298*2Apr.. 150 141.9 238.9 217 179.1 319.7May.«. 149 140.6 234.4 217 179,7 322.1June. 153 144*5 242.5 221 182.9 331.4July. 155 146.7 251.0 214 177.0 321*4Aug.. ■156 147.4 253.1 223 184.0 336.9Sept. 157 147.8 257.3 228 189.1 363.9Oct.. 155 146.8 252.7 236 194.5 361.3Uov.. 155 146*6 252.6 240 198.8 377.4:Dec.. 155 146 el 203.6 242 200.5 393.9
Sources Division of Braploynent Statistics (4/47)
Digitized for FRASER http://fraser.stlouisfed.org/ Federal Reserve Bank of St. Louis

42Table 15. - Revised Estimates of Manufacturing Production
Worke’rs and Indexes of Employment and Pay Rolls, byMajor Industry Group, January 1S45 - December 1946 l/
#YearMISCELLANEOUS INDUSTIilES
Estimated •number of
Indexes j (1939 average - 100)
l l Year
Estimated number of
Indexes (1939 average = 100)
andmonth
productionworkers(thousands)
Production! Production worker j worker employment;pay rolls
andmonth
productionworkers(thousands)
Production worker i employment!
Production worker pay rolls
1945 598 162.7 308*6 1946 416 170.1 318.9
1945Jan.. 420 171.5 341o6
1946 Jan. i 372 151.9 273.6
Feb.. 426 174.1 346.5 Feb.. 384 156.8 •280.6Mar.. 430 175.8 351.0 Mar. • 396 161.9 295.7Apr.. 429 175.3 349.2 Apr.. 404 165.1 304.2May.. 429 175.4 341,5 ;iMay.. 407 166.3 303.1June. 428 174.9 Ofj:3»4 June* 418 170.8 318.4July. 414 169,3 o21. 3 July. 417 170.5 314.2Aug.. 407 166.4 298.2 Aug.. 429 175.1 329.3Sept. 338 138.0 241. G Sept. 433 176.9 339.3Oct.. 342 139.8 245.7 Octs . 441 180*2 350.7Nov.. 352 143.7 253»6 Nov.. 445 182.0 354.0Dec.» 364 148.7 269*3 Dec .. 448 183.2 363.3
1{ Estimates and indexes for the major industry groups have been adjusted to levels indicated by the final 1945 data made available by the Bureau of Employment Seaurity of .the Federal Security Agorioy and supersede data shovm in mimeographed releases dated prior to April 19x7, and Monthly Labor Reviews dated prior.to May 1947. The present adjustment affects data from 1945 to the present only* Hours and earnings data are not affected by this adjustment.
Source: Division of Employment Statistics (4-47)
Digitized for FRASER http://fraser.stlouisfed.org/ Federal Reserve Bank of St. Louis

Table 1oRevised Estimates of Employees 1/ in Nonagricultural Establishments, by Industry
Division, January 1939Bef»<9sfeber 1946 Q(in thousands)
43*
Month and Year i Total Manufacturing
1939 Average1940 Average1941 Averagem iJanuaryFebruaryMarch April W&y.June
JulyAugustSeptemberOctoberNovemberDecember
1940JanuaryFebruarylvfe.rchAprilJuneJulyAugustSeptemberOctoberNovemberDeoember
1941JanuaryFebruaryLlarchAprilM&yJuneJulyAugustSeptemberOctoberNovemberDecember
30,28?32,03136,104
i 28,945 : 2^026 ; 29,436 • 29/fiB i 29,76s
30,132
: 30,108i 30,512 i 31,254 ! 31,629 1 31,491 3l#7io
30,60230,63230,95331,02331,35331,619
31,64432,210 I
I 33,ooi ‘ I 33,416 i 33,6i6 ! 34,301
33,41033,70334,19634,76335,61536,28336,84337,35137,9o637,96437>83i38,099
10,07810,78012,974
m9.7879.7879,;759,817
10,11710,48910,78010,74610,694
10,45310,47510,43910,34310,29810,35310,41110,83011,18211,4051142311,047
11,60311,87412,11312,39*12,64812,96713,27513,54013,78413,84713,82113,817
Mining;Construction
Transport tation and Public Utilities!
845916947
836853883931943928
9189169l68999028?4907.919927934934931
933930P I637944960
s 981 1,002 1,010 1,013 1,009 iL,00y
1,1501,2941,790
9291'1,0351,1321,2341,272
1.2851,3121.285 1,234 l,l6l 1,010
904930
1,0151*1461,2601,300
1,3421,3711,4691,6071,629
1,6061,5671,5321,6 41,7381,8031,9562,0142,03j?1,9691,8791,734
2,9123,0133,248
2, 92 2,813 2,847 2,872 2,9342,9412,947 2,994 3,017 3,00/
Trade;
Finanoe, ServicK, : and • Miscel- lanef.ns6,705*
2,9252,9302,9462,9963,028
3*0853,1023,0693,045
3,0113,0203,0683,1453,2243,2873,3413,3803,3983,4053,3693,333
,567|
6,432!6,417:6,49316,5726,6186J6&6,6026,608
4,6104,7815,016
4,4724,4694,5184,5644,6494,6884,6904,7024,7246,788 j 4,724
6,898 ! 4,634 ,009 6,980 j 4,598,960 7,389! 4,602
6,707 ! 4,6222,934 : 6,701 j 4,628
6,902 i 4,6&4 6,8541 4,749 6,945 j 4,815 7,021j 4,850§,929 I 4,8436,96414,870 7A5 6 Ujsfe 7,254 } 4,8407,369 1 4,803 7,854 I 4,800
i 4,822 I 4,829 14,893 1 4,986 \ 5,052 j 5,092'(5,112-5,133
5,1265,0765,0415,029
Government
3,9874,192
3,91|3,8863,9153,9263,9623,9573,9373,9734,0914,1054,054,4,127
4,0734,0484,0674,0864,1374,173
4,17|4,1964,3094,3314,3114,395
4,3414,3674,4284,4904,5744,6224,6384,6734,8224,8384,876
Digitized for FRASER http://fraser.stlouisfed.org/ Federal Reserve Bank of St. Louis

44. I'able 16Revised Estimates of Employees 1/ in Nonagricultural Establishment, by IndustryDivision, January. 1939—December 1946, Cont’d
(in thousands)
IMonth and Year; Total (Manufacturing I Mining Conntruo-tion
1942 Average1943 Average1944 Average1942January•FebruaryMarchAprilMayJuneJulyAugustSeptemberOctoberNovemberDecember
m iJanuaryFebruaryMarchAprilMayJuneJulyAugustSeptemberOctoberNoverfberDecember
1944JanuaryFebruaryMarchAprilMayJuneJulyAugustSeptemberOctoberNovemberDecember
39,69742,04241,480
37A8537,34637*90338*57739A2939,67340,16240^67241,15841,29641,37541,892
41,000 i41,206 !41,653 j 41,96242,004 !42,365 j42,352 j42,319 I42,2o9 | 42,32342,423 : 42,638
41-61141.55241.552 41,443 41,420 41,55841,47341,46741,35541,26741,841
15,05117>38117,111
13,74013,97114,18414,39114,57614,79115*14315,51915*80011,95610,12810,415
l6,57Q l6,816 17,03717,12917,18117*43112 ^ 1117,T3§17,69617*77717,85817,722
17,58717,58117,44717,235!7,10517,116
17,09117*085 16,888 16,758 16,695 .16,747
983917883
1,007993938 989939 987994 991 93X970961951
934935 931 922 908 915915912915910901907
900901 €96 892 090. 8958858G6878865859852
2,1701,5671,094
1*6751,6491,8342,0402,2222,4032'5S2,5772*53°2,3702.2121*957
1,8351,7801,7641*7411,6941,069
1,5801,5241,4511,3431,272i*k 7
1,1141,068l,06l1*075!,1°91,1471,1531,1571,1251,0921*057969
Transpor-I tat ion and Public Utilities! Trade
Finance, : Service, and j Misee1- [ laneous it Government
3,433
3,798
3,3053*2903,3143,3853,4193,4533,4853*5003,5*73*5193,5033,507
3,4873,4853,5203,570v y3,6893,043,6883*689\ $
3,6643,7043,7373,7803,8093,6533,86o 3,867 3,846 3 >820 3*819 3,816
7,4817,3227,399
7,2917,253
5,1485,l§75*169
5,0445*0235,0815,1405,1885,236
5,2325,2345,2295,1735,112-5,087
5,100 5,098 5,1425,1795,229 5,284
7,223 .. 5,2507,169 ! 5,2357,241 ; 5,2377,398 ; 5,185,576 5,160,865 j 5,149
7,2727 ooh 5.1195,1165*1565,1705,2055,271
5,2245*2095,2045,1465.119 • 5,099
5,431£,049.6,026
4,8824,9625'°i25,1675,2825,4075,4525,5685»2425*7975,8606,030
5,8665,938§,0556,1146,1626,121
6,0756,0496,0416,0215*9736,179
5,9555*9455,9^5.980 6,015 5*9765.9806,0666,0406,0326^48
Digitized for FRASER http://fraser.stlouisfed.org/ Federal Reserve Bank of St. Louis

Table 16Revised Estimates of Employees 1/ in Nonagricultural Establishments, by Industry
Division* January 1939-December 1946* Cont*d(in thousands)
45.
Month and Year*
1945 Average 1940 Average 1947 Average1945 January February March April May JuneJulyAugustSeptemberOctoberNovemberDecember
1946JanuaryFebruaryMarohAprilMayJuneJulyAugustSeptemberOctoberNovemberDecember
Total j Manufacturing t39,40,
40,87840,93941,09440,83040,68040,64840,33840,04738*25638,19238,61339*210
iI
ii 38,745 * 38,148 J 39,184 ; 39>908 ! 40,258 j 40,080j 40,877 !.41,46641,84842,06542,43942,928
15,30214,365
16,75316,80116,72816,52816,29216 06115,69315,34313 ..41413,30713,36713,331
13,49912,75113,43314,04514,15914,37114,52614,87615,03515,06415,27115,348
826836
848 845 844 80b 769843832832833%Z843855
86*864857542
81
873 886 884 883 883874
..Jt.
1 1 1 * | Construo-4 | tion 1j i
TransportationandPublicUtilities
Trade
Finance,Scrvice,and
Miscellaneous
! 1,082 I! 1,493 I
3,8724,023
7,6548,448 5,274
5,954
i 950 ; ! 955 i 1 985 1 I 1,030 i i 1,059 ! 1 I,!02 ;
3,7803,0113,0393,8433,8583,906
7,4507,4237,5207,425m
5,0825,0815,111
5>i665,247
; 1,136 ! : 1,170 i ! 1,159 1: 1,164 ? i 1,171 1 i 1,108 |
3,9273,922 3M6 3,86i 3,912 3,932
7,473y ,482I’6#7,87i8,1188,491
5,2755,2905,2965,4375,5345,^1
I 1,085 j •: 1,101 1 j 1,203 j\ 1,356 ! | 1,438 | 5 1,532 1
3,9323,9433,9933,5913,9463,996
8,0568,0908,1978,3298,3028,342
5,6965,7765,8405,9845,905,961
1,6?^ ! I f l 11,753 ! 3.,713 I : 1,644 ;
4,0514,1034,0644,0934,1014,071
8,3378,402I'M8*8989,234
j 5,975j 5,984i 5,990 1 6,054 i 6,098 1 6,119
Government
5,9675,595
6,015
6,062 6,066 6,0146,0026,0086,0225,7905,6685,862
5.613
5,6715,6ci5,6955.614
5,4885,5025,6055,5515,4755,638
1/ Estimates include all full- and part-time -wage and salary -workers -who worked or received pay during the pay period ending nearest the 15th of the month® Proprietors, self employed persons, domestic servants* and personnel of the armed forces are excluded# These estimates incorporate the revised estimates adjusted to final 1945 U* C* data and* therefore, supersede data shown in mimeographed releases dated prior to April 194^ and Monthly Labor Reviews dated prior to toy 194/• Data from January 1939 forward were affected by this revision#
Digitized for FRASER http://fraser.stlouisfed.org/ Federal Reserve Bank of St. Louis


![Monthly Monetary Trends [St. Louis Fed]](https://img.dokumen.tips/doc/110x75/577d21cc1a28ab4e1e95e8c6/monthly-monetary-trends-st-louis-fed.jpg)