Embed Size (px)
Citation preview

PARTICIPATION IN ON-SITE STRETCHING PROGRAM 1
EMPLOYEE PARTICIPATION IN AN ON-SITE STRETCHING PROGRAM:
A CASE STUDY IN A CENTRAL WISCONSIN
MANUFACTURING COMPANY
By
Barbara K. Thompson
A Research Paper
Submitted in Partial Fulfillment of theRequirements for the
Master of Science DegreeWith a Major in
Vocational Rehabilitation
Approved: 2 Semester Credits
_________________________Investigation Advisor
The Graduate CollegeUniversity of Wisconsin-Stout
May, 2000

PARTICIPATION IN ON-SITE STRETCHING PROGRAM 2
The Graduate CollegeUniversity of Wisconsin-Stout
Menomonie, WI 54751
ABSTRACT
Thompson Barbara K(Writer) (Last Name) (First) (Initial)
Employee Participation in an On-Site Stretching Program:(Title)A Case Study in a Central Wisconsin Manufacturing Company
Vocational Rehabilitation Dr. Robert Peters 5/2000 101 (Graduate Major) (Research Advisor) (Month/Year) (No. of Pages)
Publication Manual of the American Psychological Association, Fourth Edition(Name of Style Manual Used in this Study)
Musculoskeletal disorders are the single most controllable injury in today’s work
place. Musculoskeletal disorders are also costing the most lost time workers
compensation dollars and have been the leading work place injuries for the past five
years. One strategy to reducing such injuries is the implementation of a work
conditioning, on-site stretching program in the work place. However, in order for such a
program to be implemented and maintained successfully, it is important to learn a number
of things about the employees who will be participating in such a program. It is
important to learn what motivates employees to participate in such a program, and to
discover the attitudes regarding the perceptions of responsibility for conditioning
programs among management and employees in relation to work conditioning programs.
A review of the literature indicates that many companies have realized significant cost-
savings through the implementation of simple ergonomic adjustments and the initiation

PARTICIPATION IN ON-SITE STRETCHING PROGRAM 3
of on-site stretching programs. The literature also indicates a number of motivating
factors that serve to encourage or discourage employees from participating in exercise
programs, perceptions of the influencing factors on the causes of musculoskeletal pain
and also individual perceptions of health status as correlated with exercise activity. This
case study will also explore employee and management opinions on responsibilities for
health promotion activities, on-site stretching programs and general work place safety. It
is believed that a good understanding of these opinions will be instrumental in the
implementation process of an on-site stretching program.

PARTICIPATION IN ON-SITE STRETCHING PROGRAM 4
Table of Contents
CHAPTER I
Introduction 9 - 14
Statement of the Problem 14
Definition of Terms 14 - 15
CHAPTER II
Prevalence, Risk Factors and Costs of Musculoskeletal Injuries 16 - 20
Prevalence 16 - 17
Risk Factors 17 - 19
Costs 19 - 20
Prevalence, Risk Factors and Costs of Lower Back Injuries 20 - 27
Lower Back Injuries Defined 20
Prevalence of Lower Back Injuries 20 - 22
Costs of Lower Back Injuries 22 - 27
Direct Costs 22 - 23
Indirect Costs 24
The Future 24 - 25
Cost for Employees 25 - 27
Upper Extremity Injuries 27 - 35
Prevalence of Upper Extremity Injuries 29 - 31
Costs of Upper Extremity Injuries 31 - 33
Risk Factors and Upper Extremity Injuries 33 - 35
Wellness as Part of Disability Management 35 - 36

PARTICIPATION IN ON-SITE STRETCHING PROGRAM 5
Table of Contents (continued)
CHAPTER II (continued)
Value of Health Training Programs to Returning Injured Workers 36 - 37
Musculoskeletal Injury Reduction Programs and Stretching/Exercise 37 - 39
Benefits for Companies 40 - 42
Benefits for Employees 42 - 46
Viewpoints and Behavioral Change of Blue Collar Workers on Exercise Programs
Motivating Employee Participation 46 - 54
Participation in Work-Site Wellness Programs 54 - 57
CHAPTER III
Methodology 58 - 60
Subjects 58 - 59
Procedure 59 - 60
Instrumentation 60
Data Analysis 60
CHAPTER IV
Results 61 - 79
Demographics 61 - 63
Self-Perception of Health and Discomfort 63 - 71
Respondent Perception of Ergonomics 71 - 72
Respondent Perception of Responsibility 73
Respondent Attitude Regarding an On-Site Stretching Program and
Present Job 73 - 74

PARTICIPATION IN ON-SITE STRETCHING PROGRAM 6
Table of Contents (continued)
CHAPTER IV (continued)
Correlation Between Variables 74 - 76
Willingness Differences Between Workers and Managers 77
Perceived Motivators 77 - 78
Perceived Barriers 78 - 79
Synopsis 79
CHAPTER V
Respondent Demographics 80 - 81
Perception of Health 81 - 82
Discomfort Experience 82 - 83
Variables that Correlate with Belief in Stretching Program to Reduce Discomfort
83 - 84
Variables that Correlate with Willingness to Participate in an On-Site Stretching
Program 84 - 86
Willingness Differences Between Workers and Managers 87
Discussion of Motivators 87 - 88
Discussion of Barriers 88
Responses to Open-ended Survey Questions 88 - 90
Conclusions 90 - 91
SELECTED REFERENCES
92 - 98
APPENDIX A 99 - 101

PARTICIPATION IN ON-SITE STRETCHING PROGRAM 7
List of Tables
Table I. Age Group 63
Table II. Lower Level Discomfort 66
Table III. Higher Level Discomfort 67
Table IV. Intensity of Discomfort 68
Table V. Perception of Ergonomics 72
Table VI. Perception of Responsibility 73
Table VII. Willingness to Participate and Job Satisfaction 74
Table VIII. Correlation Coefficients 75 - 76
Table IX. Rank Ordered Motivators: Frequencies of Total Respondents 78
Table X. Rank Ordered Barriers: Frequencies of Total Respondents 79

PARTICIPATION IN ON-SITE STRETCHING PROGRAM 8
List of Figures
Figure I. Length of Time with Employer 62
Figure II. Perceived General Health Rating 64
Figure III. Perceived Level of Importance of Exercise 65
Figure IV. Time of Day Discomfort Experienced 69
Figure V. Duration of Discomfort 70
Figure VI. Pain Scale 71

PARTICIPATION IN ON-SITE STRETCHING PROGRAM 9
CHAPTER I
Introduction
According to the Bureau of Labor Statistics nearly one half of all work related
compensation injuries are a result of cumulative trauma disorders (VanFleet and Bates,
1995). Four years ago, according to US News & World Report CNN poll (1995), twenty-
five percent of Americans indicated that their work environment had caused them
physical problems, with the most common work-related physical health problems as back
injuries, 34 %; carpal tunnel syndrome, 12% and burns, cuts and bruises, 16%. In the
past, solutions for reducing musculoskeletal types of injuries focused on the mechanical
factors of ergonomics. Mechanical factors included making changes to the tools and
equipment, the workstation itself and the work environment. Recently, more focus is
placed on the human factors of ergonomics. In order for the mechanical changes to be
effective, the workers need to understand how to interact with their environment. It is
important for workers to recognize the impact their own characteristics such as weight
and physical condition has on their ability to interact within the work environment
(VanFleet and Bates, 1995).
The Bureau of Labor Statistics also report that for 1997, sprain and strain was the
leading cause of injury in every major industry division in their survey, ranging from 32
percent up to 52 percent (www.bls.gov/special.requests/ocwc/oshwc/osh/case/osn008.pdf
[July 25,1999]). The body part most affected by disabling work incidents in each
industry surveyed by the Bureau of Labor Statistics in 1997 was the trunk including the
back (www.bls.gov/special.requests/ocwc/oshwc/osh/case/osn008.pdf [July 25,1999]).
Some of the risk factors involved in the more significant back symptoms include: static

PARTICIPATION IN ON-SITE STRETCHING PROGRAM 10
postures (Yu, Roht, Wise, Kilian & Weir, 1984), heavy repetitive lifting, pushing,
pulling, long-distance driving (e.g. truck driving) and exposures to vibration (Frymoyer
and Cats-Baril, 1991). Other risk-factors for back injuries may include the psychosocial
factors of poor health habits, job dissatisfaction, poor work performance reviews, poor
working conditions, emotional difficulties and history of prior injuries (Frymoyer and
Cats-Baril, 1991). It is interesting to note that even the majority of the psychosocial risk
factors are still related to working conditions.
Injury severity was measured by the Bureau of Labor Statistics by the median
days away from work. In 1997, among major disabling injuries, carpal tunnel syndrome
was the highest with median days away from work at 25 days. For the sake of
comparison, the median days away from work for amputations were 18 days. Repetitive
motion resulted in the longest absences from work (17 days) among the leading events
and exposures (www.bls.gov/special.requests/ocwc/oshwc/osh/case/osn008.pdf [July
25,1999]). Approximately seven out of ten workers (or three-quarters) surveyed by the
1997 Bureau of Labor Statistics had one year or less time on the job when they were
injured. Over one forth of the injured workers had over five years of time on the job. It
was also the younger population of workers (ages 25 to 44) that made up the 57 percent
majority of work injuries. Workers of the ages 45 and over made up only 26 percent of
the work injuries. (www.bls.gov/special.requests/ocwc/oshwc/osh/case/osn008.pdf
[July 25,1999]). It could be argued that one reason for the higher rates of injury of the
younger and less experienced population of workers may be that those workers are not
physically conditioned to sustain the static and repetitive activities their job tasks dictate.
Whereas the older, more conditioned worker is more physically conditioned or

PARTICIPATION IN ON-SITE STRETCHING PROGRAM 11
accustomed to those types of tasks. Nonetheless, these types of disabling conditions are a
concern given the amount of years the younger workers will have to be employed. The
Occupational Safety and Health Association (OSHA) is currently proposing a draft of a
new ergonomics standard that requires manufacturing company operations and manual
handling company operations to control musculoskeletal disorders in the workplace. The
ergonomic program standard include: management leadership and employee
participation, hazard identification and information, job hazard analysis and control,
training, medical management and program evaluation
(www.ergoweb.com/Pub/Osha/ergoreg.html [April 3, 1999]). Musculoskeletal disorders
are defined as, “…injuries and disorders of the muscles, nerves, tendons, ligaments,
joints, cartilage and spinal disks,” with examples including but not limited to carpal
tunnel syndrome, low back pain, muscle strains/sprains, sciatica, and tendinitis.
(www.ergoweb.com/Pub/Osha/ergoreg.html [April 3, 1999]). According to Dr. Phillip
Polakoff (1995), “Normally, musculoskeletal injuries arises from mechanical causes (that
is, the force or stress on a tendon, ligament, muscle or cartilage that exceeds the tolerance
of the tissue),” (p. 30). According to the Bureau of Labor Statistics, the leading work
place injury between 1992 and 1996 was strains and sprains
(www.bls.gov/new.release/osh2.toc.html [April 3, 1999]). Also, according to the
Wisconsin Department of Workforce Development the leading work place injury
between 1994 and 1996 was strains and sprains (www.dwd.state.wi.us/wc/html [April 3,
1999]). In the year of 1972, statistics from Liberty Mutual Insurance Company indicated
that manual material handling tasks caused 79 percent of the injuries to the lower back.
At that time, 23 percent of all compensable work injuries were associated with manual

PARTICIPATION IN ON-SITE STRETCHING PROGRAM 12
material handling tasks (Snook, 1978). The implication of initiating an ergonomics
standard for industries is that adjustments made to workstations and employee training to
recognize the signs and symptoms of musculoskeletal disorders is anticipated to help to
reduce such injuries. Sometimes, however, it is not possible due to financial or job flow
processes for a company to re-design a workstation in order to ergonomically fit every
individual worker. Such a change would cause the company undo hardship or not allow
certain jobs to be performed. In circumstances when it is not possible to change the
workstation, it is necessary to examine what the worker can do to become more resilient
to the job performed. A worker could participate in a work-conditioning program that
involves a physical stretching routine prior to beginning the shift and also short, ten
second stretch breaks or “micro-stretch breaks” throughout the work shift. Such a
program may be beneficial even when workstations can be re-designed more
ergonomically. Although stretching programs are not included in the proposed
ergonomics standard, such programs are not prohibited by OSHA
(www.ergoweb.com/Pub/Osha/ergoreg.html [April 3, 1999]).
Two questions arise as work-conditioning programs are discussed. The question
of responsibility for implementing and maintaining such a program in the workplace
needs to be answered. Should it be the responsibility of the worker alone, the supervisors
or management, or is implementing and maintaining a work conditioning program the
responsibility of both management and employees? Answering this question will help
companies determine how to successfully implement a work-conditioning program. Of
course, each company is different. This case study is only reflective of one specific
company. Learning about expectations and motivators in a workplace could help work

PARTICIPATION IN ON-SITE STRETCHING PROGRAM 13
conditioning program implementation and maintenance to be successful. If employees
expect management to be responsible for teaching them how and why to stretch and
expect paid time to perform these stretches and management believes employees should
be independently initiating pre-work stretches there will be conflict in expectations.
Eliminating the assumptions made by both parties could reduce this conflict. Secondly,
there is the question of the effectiveness the implementation of a work-conditioning
program will have on reducing workers compensation work-related musculoskeletal
injury claims. In other words, is it really worth the effort to implement such a program
in order to reduce workers compensation claims and maintain a healthier work force in
relation to musculoskeletal injuries?
Previous studies have shown a reduction in compensible musculoskeletal injury
claims through the implementation of various administrative controls that include
stretching programs in combination with engineering controls such as job design,
additional equipment, etc.
In order to link the implementation of a work conditioning program and blue-
collar worker participation, it is believed it is important to realize the perceptions and
motivators present that would cause a population of blue-collar workers to participate in
such a program. OSHA seems to recognize the necessity to train employees on the signs,
symptoms and control of musculoskeletal disorders through the recent ergonomic
standard proposal. OSHA’s purpose for the proposal is to reduce the number and
severity of musculoskeletal disorders through the identification and control of the hazards
that cause such injuries (www.ergoweb.com/Pub/Osha/ergoreg.html [April 3, 1999]).
The level of responsibility employees take to maintain injury prevention programs will

PARTICIPATION IN ON-SITE STRETCHING PROGRAM 14
influence OSHA’s success with accomplishing their goal of reducing musculoskeletal
disorders in the workplace.
Statement of Problem
The purpose of this study is to describe both employee and management
viewpoints and motivations regarding responsibility for work conditioning program
implementation and maintenance as measured by survey response results. This study will
also describe the perceptions of responsibility for conditioning programs in the work
place among management and employees of a company in Central Wisconsin.
This study will focus on the following objectives:
(1) To determine employees’ opinion of who should be responsible for
implementing and maintaining a work conditioning program in their specific
company.
(2) To determine what elements serve to motivate blue-collar employees to
participate in a work-conditioning program.
(3) To determine employer (management, floor supervisors/lead people) opinion
on who should be responsible for implementing and maintaining a work
conditioning program in their specific company.
Definition of Terms
For the purpose of this study, the terms of employees, production and blue-collar
workers are interchangeable and refer to people who perform manual labor assembly,
manual material handling and manufacturing. Management and supervisory staff are
used to define people in supervisory positions and include work floor or shift supervisors,
members of administration, internal safety committee members and union representatives

PARTICIPATION IN ON-SITE STRETCHING PROGRAM 15
in the industrial setting. Internal safety committee members were included in the
management group as this group was viewed to be in positions of leadership and to have
decision-making authority in regard to workplace safety issues. The term administrative
positions refer to clerical, sales and accounting positions.

PARTICIPATION IN ON-SITE STRETCHING PROGRAM 16
CHAPTER II
Prevalence, Risk Factors and Costs of Musculoskeletal Injuries
Prevalence
Magrega and Spencer (1993) examined injured workers in the state of Alabama in
regard to return to work issues after work injury. Magrega and Spencer (1993) found that
manufacturing occupations accounted for the largest number of accidents in this
population and that the most common type of injury was overexertion. Over 50% of the
overexertion injuries were musculoskeletal and connective tissue types of injuries. The
most frequent location of injury was back injuries (Magrega and Spencer, 1993).
According to the Academy of Orthopaedic Surgeons, 3.2 million people who suffer back
pain miss an average of 5.5 days of work per incident (Matson, 1995).
According to the National Institute for Occupational Safety and Health, the most
current data available from the Bureau of Labor Statistics is from 1994. These data
indicated 367,424 injuries were due to overexertion with lifting, 93,325 injuries were due
to overexertion in pushing or pulling, and 68,992 injuries were due to overexertion in
holding, carrying or turning objects. These overexertion injuries resulted in an average of
six to seven lost workdays, depending on the nature of the injury. Also in 1994, the
number of injuries due to repetitive motion (e.g. typing, grasping, repetitive tool use, etc.)
was 92,576 and resulted in a median of 18 lost workdays. Of these, 55% affected the
wrist, 7% affected the shoulder and 6% affected the back. Overall 32% or approximately
705,800 injuries were the result of overexertion or repetitive motion.
(www.cdc.gov/niosh/ergtext1.html [August 7, 1999])

PARTICIPATION IN ON-SITE STRETCHING PROGRAM 17
Polakoff (1995) reviewed statistical data between the years of 1983 and 1992.
Polakoff (1995) found that in 1983 musculoskeletal injuries were the leading cause of
disability at that time and affected 19 million people, equating to one-half of the
workforce. Also at that time, the cost of musculoskeletal injuries accounted for one-third
of annual workers’ compensation cases and costs exceeded any other single health
disorder (Polakoff, 1995). The prediction at that time was that musculoskeletal injuries
would increase due to the aging workforce and the physical demands of job tasks
(Polakoff, 1995).
Risk Factors
Magrega and Spencer (1993) found the majority of the injuries occurred during
the employee’s earlier years of employment. The more veteran employees were less
likely to report injury. Bigos, Spengler, Martin, Zeh, Fisher and Nachemson (1986) in
their study at the Boeing Company also found, specific to back injuries, that new
employees tended to have more injuries compared to employees who had been with the
company longer. Bigos, et al., (1986) also found that younger workers tended to be
injured more frequently as well. Magrega and Spencer (1993) found employees at the
lower end of the pay scale seemed to report more injuries. There also seemed to be a
trend in more rural areas. There were fewer injuries reported in metropolitan areas of
Alabama compared to the more rural locations. Other risk factors included the
employee’s level of education paired with the complex nature of the machinery and
equipment utilized. Magrega and Spencer (1993) also stated that more research into
psychological variables such as personality characteristics of employees should be
completed in regard to injury prevalence and risk factors. James (1996) indicates there is

PARTICIPATION IN ON-SITE STRETCHING PROGRAM 18
statistical evidence of psychological risk factors influencing perception of back pain.
James (1996) asserted that unhappiness with an employee’s boss and a condition known
as somatization (and expression of mental distress by actually feeling physical
symptoms) are risk factors for back pain claims.
Bigos, et al., (1986) found women to have a higher number of high-cost claims
but lower numbers of low-cost claims specific to back injuries. Bigos, et al., (1986) also
found employees with higher costing back injury claims had lower scores on employee
appraisals.
Polakoff (1995) identified the highest rates of reported musculoskeletal injuries to
be in the occupations of meatpacking, poultry and automobile manufacturing industries.
Risk factors, according to Polakoff (1995), are well beyond repetitive motion and
include, high speed exertion, precision work that requires awkward postures, static or
non-moving body positions (e.g. computer terminal use for extended period), and any
activity that compromises circulation by compressing body tissue. Polakoff (1995) also
stated psychosocial issues such as undefined work roles, lack of supervisor support, lack
of environmental control and lack of job security, may also influence musculoskeletal
injury risks. Each person, according to Polakoff (1995) is affected differently by
different stressors. To learn these different stimuli to stress may prevent the occurrence
of musculoskeletal injuries, however may be difficult to test for particularity with the
Americans with Disabilities Act preventing pre-employment screening that would serve
to screen out someone with a pre-existing predisposition or condition for musculoskeletal
injury risk (Polakoff, 1995).

PARTICIPATION IN ON-SITE STRETCHING PROGRAM 19
The characteristics common to an injured worker have been found to be a person
in a blue-collar occupation, limited educational skills, within the ages of the early thirties
to the early fifties. Characteristically workers that are most often are married men and
perform medium exertion level to heavy exertion level work (Vander Kolk and Vander
Kolk, 1990). In their study, Vander Kolk and Vander Kolk (1990) found that of the 40
injured workers studied, 90% resulted in musculoskeletal disabilities, 43% of the workers
performed heavy work, and 33% performed medium work.
Costs
An obvious cost of having an employee off work due to injury is the cost of the
wages the employer needs to provide the injured worker. Additional costs for employee
absences are the loss of productivity, financing health care for the injured employee and
also the cost of replacing the worker with another. In some cases, retraining of existing
employees is necessary to replace the injured worker (Gottlieb, Vandergoot, and Lutsky,
1991). Lanes, Gauron, Spratt, Wernimont, Found, and Weinstein (1995) found a pattern
in their study of injured workers’ return to work:
“The longer patients were out of work, the less likely they were to return to work,
the less positive the overall job outcome, and the lower their perceptions of their
current well being relative to their pretreatment conditions,” (p. 804).
Furthermore, approximately 400,000 people annually need to seek other
employment after injury due to a number of reasons. These reasons include a lack of
transferable skills, reduced physical capacity, chronic pain, difficulty coping effectively
with their new disability, or because of experienced financial disincentives (e.g. earn less
money in new job), depression, and sleep disturbances (Vander Kolk and Vander Kolk,
PARTICIPATION IN ON-SITE STRETCHING PROGRAM 20
1990). Vander Kolk and Vander Kolk (1990) also stated that younger injured workers
are more likely to return to work compared to the older worker. The reasons that Vander
Kolk and Vander Kolk (1990) provided for this is that the older person may fear
additional injury or have doubts about their own ability to perform their job duties based
on the physical results of the injury. Employers may also be more apprehensive about
hiring back an older injured worker, especially if that worker has a history of injuries.
(Vander Kolk and Vander Kolk, 1990).
For the purpose of defining cost, the term direct costs include services of medical
care and indirect costs include lost work time, employee replacement and wage expenses.
To exemplify the costs associated with the most common occurring musculoskeletal
disorders the costs of lower back injuries and carpal tunnel injuries are reviewed.
Prevalence, Costs and the Future of Lower Back Injuries
Lower Back Injuries Defined
The literature uses a variety of terms to define low back injuries. These terms
vary from backache, chronic low back pain, back disability, back disorders. As defined
by Hashemi, Webster and Clancy (1988) the following definitions will be applied:
“Low back pain can be defined as pain that occurs in the lumbosacral region and
buttocks (and includes associated leg pain), which may or may not lead to
impairment, disability or compensation. Disability is an inability to work due to
pain and impairment, in part due to a physical disorder, and may also be
influenced by non-medical issues such as job demands or psychosocial issues,”
(p. 1110).
Prevalence of Lower Back Injury

PARTICIPATION IN ON-SITE STRETCHING PROGRAM 21
The lifetime prevalence of back pain range is 60% to 80% (Frymoyer and Cats-
Baril, 1991). It is estimated that at least 28% of the industrial population will be
temporarily disabled by back pain. Rizzo, Abbott, and Berger (1998) researched data
from the National Medical Care Expenditure Survey and found the average backache
prevalence to be 22.4%. Further, backache prevalence increased with age from 18% for
people between the ages of 18 to 30 to 30% for people between the ages of 61 to 70
(Rizzo, et al., 1998). Over seven million people are treated for conditions of chronic low
back pain annually (Lanes, et al., 1995). Yu, et al. (1984) reported that in a study of low-
back pain cases, 43% of the onsets of low-back pain occurred at work. Twenty-eight
percent of the low-back injuries in the study occurred at home (Yu, et al., 1984). Rizzo,
et al. (1998) found the prevalence of chronic backache was higher among non-employed
individuals compared to employed individuals by 12%. According to Yu, et al. (1984),
within a ten-year period of time, 35% of sedentary workers and 47% of material handlers
sought medical care for low back pain. In a 12-year period of time, 60% of workers in a
steel factory had been affected by low back pain (Yu, et al., 1984). Between the years of
1956 to 1976, the Social Security Administration awards for back disability increased by
2700 percent (Conte and Banerjee, 1993). It was estimated that back injuries accounted
for 400,000 disabling work injuries in 1978 (Yu, et al., 1984). Yu, et al. (1984) estimated
the reportable occupational injuries of low back pain was 26% to 29%. There is little
evidence that society is experiencing more back pain symptoms as was experienced 20
years ago. However, in contemporary times, the number of people becoming disabled by
back injury conditions is growing. It is estimated in America that 5.2 million people have
low back disabilities (Frymoyer and Cats-Baril, 1991). Of the 5.2 million, 2.6 are

PARTICIPATION IN ON-SITE STRETCHING PROGRAM 22
considered to have permanent disabilities as a result of low back injuries. Sweden and
the United Kingdom report similar statistics. Great Britain reported 27% of reportable
occupational injuries to be of the low back and Ontario reported 25% (Yu, et al., 1984).
Rizzo, et al. (1998) found the prevalence of backache to be slightly higher for women
than for men. Bigos, et al. (1986) found back injury claims to be caused more by lifting
and material handling than by slips and falls. At the Boeing Company, lifting was cited
as the most frequently reported cause of back injury, material handling was cited as the
most common type of injury and strains and sprains were cited as the most common
nature of injury (Bigos, et al., 1986).
Costs of Lower Back Injuries
Direct Costs
Between 70% and 90% of the total costs are related to disability (Frymoyer and
Cats-Baril, 1991). Frymoyer and Cats-Baril (1991) estimated an increase of total annual
direct costs for low back disorders in America. This increase is based on a 1984 study
that found the annual direct costs of low back disorders to be $12,922,740,000 and
indirect costs to be $2,950,000,000 (Frymoyer and Cats-Baril, 1991). Data from Liberty
Mutual Insurance Company in 1986 indicated the average individual claim cost of low
back injuries to be $6807 (Webster and Snook, 1994). Webster and Snook (1994)
analyzed data from 45 states covered by Liberty Mutual Insurance Company and found
the mean cost per low back pain case to be $8321, more than twice the average work-
related injury claim. Webster and Snook (1994) estimated if other insurance providers
had similar figures for low back pain costs, total workers’ compensation costs of low
back pain in the United States would be approximately $11.4 billion in 1989. Hashemi,

PARTICIPATION IN ON-SITE STRETCHING PROGRAM 23
et al. (1998) found this figure to be decreasing. Hashemi, et al. (1998) found in an eight-
year period of time, the cost of all low back pain claims decreased by 15.7%. The total
cost of all low back pain claims in 1996 was approximately $417 million (Hashemi, et al.,
1998). Of the direct costs, it is estimated that 11 million visits to health care providers
were due to strains, sprains and lumbar disc disorders. Webster and Snook (1994) found
medical costs to represent only one third of the total costs of low back pain claims at
Liberty Mutual Insurance Company during the year 1986. Some reasons as to why direct
costs have increased can be attributed to population increase, increased utilization of
more costly diagnostic equipment (e.g. CT and MRI) and also an increase in physical and
occupational therapy services. It is also important to note that 75% of these costs are
generated by 5% of the people who become either temporarily or permanently disabled
(Frymoyer and Cats-Baril, 1991). An earlier study at the Boeing Company, Spengler,
Bigos, Martin, Zeh Fisher and Nachemson (1986) found of 900 back injury claims, 90 of
the claims (or 10% of the back injury claims) accounted for 79% of the total back injury
costs. Spengler, et al. (1986) concluded, “Controlling the cost of back injury in industry
depends to a large degree on controlling or preventing the small percentage of high-cost
back injuries,” (p. 245). Surgical interventions have an unacceptable high rate of failure.
This failure rate can account for the high costs of surgical intervention compared to non-
invasive interventions (Conte and Banerjee, 1993). In 1993 (Conte and Banerjee) the
annual incidence of lumbar spinal surgeries in the United States was approximately 100
operations for every 100,000 people. Surgery positively correlates with a higher claim
cost and greater time away from work (Bigos, et al., 1986).

PARTICIPATION IN ON-SITE STRETCHING PROGRAM 24
Indirect Costs
One of the indirect costs of back injuries is the cost of labor and impact the
absence of the injured worker has on overall productivity. It has been estimated that
labor productivity loss in the United States is $87.8 billion annually (Rizzo, et al., 1998).
According to 1986 data collected at Liberty Mutual Insurance Company, of 98,999 back
injury claims 67.2% of the costs were for lost wages in comparison with 31.5% for
medical expenses (Webster and Snook, 1994).
The Future
The incidence of back injuries could be expected to continue. According to Conte
and Banerjee (1993):
“Persistent low back pain in older persons requires thorough investigations to rule
out inflammatory and neoplastic causes. However, degenerative changes are
often part of the aging process. Thus the worker on the assembly line who is 50
years of age and encounters severe, chronic low back pain may be simply too old
to perform this constant, repetitive type of work,” (p. 21).
On the average men have been found to have more physically demanding
occupations. According to Rizzo, et al. (1998), “As men age the effects of chronic
backache may increasingly impair their ability to perform the physically exerting tasks
required by their jobs,” (p. 1476). However, Rizzo, et al. (1998) also found that backache
has a negative impact on employment for women as well. Prior to Rizzo (1998) in a
study by Brown (1975) of 509 respondents from the occupational groups of warehouse
workers, hospital employees, removal and storage workers and workers in light industry,
back injuries to be 11% more frequent in women than in men. Perhaps, Brown’s (1975)

PARTICIPATION IN ON-SITE STRETCHING PROGRAM 25
study involved more women that were employed in health care settings in which lifting
occurred more frequently compared to Rizzo’s (1998) study that was a more
representative sample of the civilian population of the United States. Rizzo’s (1998)
study may have included more variety of occupational groups. However, this point
should not go unrecognized. Lifting is a concern in the health care industry and women
seem to be the majority in this occupational field. The National Institute for
Occupational Safety and Health reports according to a survey by the Bureau of Labor
Statistics (www.cdc.gov/niosh/ergtxt1.html [August 7, 1999]), 367,424 injuries in 1994
were due to overexertion in lifting and nursing and personal care facilities held the
highest incidence rates of overexertion injuries.
Cost for Employees
There is also a price that the injured employee pays as well. The price injured
employees pay is not necessarily monetary. It can be physical, emotional or behavioral
payments. According to Lanes, et al., (1995), the longer a person is off work from an
injury the less likely they were to return back to work after the recovery period. Lanes, et
al., (1995) also found that the longer a person was off work the lower the individual
perceived their overall well-being. Emotionally, the person with chronic low back pain,
as a result of being off work or in a different job that produces less income, may feel the
emotional loss of being the provider. Having an income and work identity are important
roles for many people. Loosing these roles can have a negative effect on the emotional
status of an individual. This feeling of loss may subsequently produce marital and family
problems as the injured employee attempts to cope with the stress and grief of their
PARTICIPATION IN ON-SITE STRETCHING PROGRAM 26
previous role. Also associated with chronic low back pain is depression and anxiety
(Lanes, et al., 1995).
A behavior demonstrated by some injured workers, not only specific to low back
injuries, but other injuries as well is what is referred to as Worker’s Disability Syndrome.
According to Hanson-Mayer (1984):
“A disability syndrome is a psychological state or frame of mind which
discourages, and ultimately prevents an injured worker from returning to
employment in a job that is consistent with his or her level of physical recovery,”
(p. 50).
Hanson-Mayer (1984) further stated that there are certain personality types or
predisposition factors that influence the presence of disability syndrome in people. These
factors include:
(1) The permanent residuals of the injury as indicated by the health care provider
(2) The attitude the employee and employer have in regard to one another
(3) Level of perceived job security
(4) Emotional and other behavioral factors such as depression, preoccupation
with the residual effects of the injury or with perceived pain, use of alcohol or
drugs. Almost a self-fulfilling prophecy, if the worker does not perceive he or
she is able to return to work, he or she will not.
(5) The injured worker’s perception that compensation is an entitlement. The
focus becomes more on how much money will be gained as opposed to how
to return to work quickly.

PARTICIPATION IN ON-SITE STRETCHING PROGRAM 27
Personality also is a determinant for predicting post-back surgery success. Bigos
and Battié (1987) found that the results of an individual’s scores on the Minnesota
Multiphasic Personality Inventory (MMPI) accounted for 74 percent of the prediction of
success after one year post-surgery. This is in comparison with results of myelogram and
CAT scan findings that accounted for only 20 percent of the predicted outcome success
one year post-surgery (Bigos and Battié, 1987).
In a later study at the Boeing Company, Bigos and Battié (1991) found a
significant correlation between job satisfaction and emotional distress and reports of back
pain. The strongest predictor of future back pain was low level job satisfaction and
denial of emotional distress. In this study, these perceptual issues were more
significantly correlated to back pain compared with physical factors (Bigos and Battié,
1991). This reinforces the influence employee perception has in relation to their physical
well being.
Attitude and personality seem to play an important and influential role during
injury recovery and return to work. If attitude and personality can effect the success of
an early return to work after injury, it seems that attitude and personality could equally
effect the success of injury prevention as well.
Upper Extremity Injuries
Carpal tunnel syndrome has been also described as repetitive strain injury or
cumulative trauma disorder. Often many other disorders of the wrist and forearm are
confused with carpal tunnel syndrome. For the purpose of this section on upper
extremity injuries, the term upper extremity injury will be used to define disorders such
as carpal tunnel syndrome, tendinitis, lateral epicondylitis, and all other injuries and

PARTICIPATION IN ON-SITE STRETCHING PROGRAM 28
disorders of the muscles, nerves, tendons, joints and cartilage of the neck and upper-
limbs.
Carpal tunnel syndrome occurs when internal or external pressure occurs on the
median nerve in the carpal tunnel area. Internal pressure can be a result of inflammation
of the tendons of the carpal tunnel or pressure on the median nerve in the neck region.
External pressure can be a result of movement of the carpal bones. The signs and
symptom progression of carpal tunnel syndrome are first a tingling sensation or
numbness along the median nerve distribution in the hand. This includes the palmar side
of the thumb, index, middle and half of the fourth finger, and the tips of each of the fore
mentioned digits. The disorder then progresses to pain in the median nerve distribution
areas. The pain may awaken the subject from sleep. In the final stage of carpal tunnel
progression, the subject may loose dexterity and sensation of the affected hand (Schenck,
1989).
Tendon disorders include the definitions of tendinitis and tenosynovitis
synonymously. Shoulder tendinitis is predisposed by degeneration caused by nutrition,
cell death and mechanical stressors such as poor circulation or static tension of the
tendons. The term tenosynovitis has been used to describe the occurrence of
inflammation of the tendon sheath (Armstrong, Buckle, Fine, Hagberg, Jonsson, Kilbom,
Kuorinka, Silverstein, Sjogaard, and Viikari-Juntura, 1993).
The exact pathology of lateral epicondylitis or “tennis elbow” is not clearly
defined. However, the theory is that micro-tears occur at the attachment of the muscle to
the bone causing inflammation. The theory continues that the cause of the micro-tears is

PARTICIPATION IN ON-SITE STRETCHING PROGRAM 29
repetitive motion. The name “tennis elbow” indicates the motion of forceful repetition
that the theory indicates as the cause of this disorder (Armstrong, et al., 1993).
There has been a large amount of controversy as to the actual origin cause of
these disorders. The literature reviews arguments for work and non-work related causes.
To define the term work-related, according to Armstrong, et al. (1993), “Work-related
diseases are defined as multifactorial when the work environment and the performance of
work contribute significantly, but as one of a number of factors, to the causation of
disease” (p. 74). Contributions may be in the form of exacerbation or aggravation of
symptoms. A disease would be defined as an occupational disease only if there is a direct
cause and effect relationship and occupational disease and work-related disease are not to
be confused.
Prevalence of Upper Extremity Injuries
In 1993, 31.7 cases per 10,000 workers filed workers compensation claims for
carpal tunnel syndrome, specifically (www.cdc.gov/niosh/ergtxt5a.html [August 7,
1999]). According to a 1996 study by Liberty Mutual Insurance, 78% of the upper
extremity injury claims and 56.8% of lost work time repetitive motion cases occurred
within goods-producing jobs. Comparatively, only 11% of upper extremity injury claims
were within use of video display units (Brogmus, Sorock, & Webster, 1996). In a
national survey of 400 hand surgeons, results indicated an average of 117 patient visits
for carpal tunnel syndrome annually per surgeon. Of the 117 patient visits, 58% were
treated by surgery intervention. These data produced a collective total of 26,000 carpal
tunnel surgeries annually for the 400 hand surgeons, not including other hand surgeons in
the nation (Schenck, 1989).

PARTICIPATION IN ON-SITE STRETCHING PROGRAM 30
According to James (1993), cumulative trauma disorders afflicted 185,400
Americans in 1990, almost nine times greater than those afflicted in 1982. Carpal tunnel
surgery is the second most common surgery in America (James, 1993).
Hagberg, Morgenstern and Kelsh (1992) prevalence study by occupational group
indicated high prevalence for occupations with high force and high repetition, gripping,
long lasting vibration exposure, wrist flexion and extension and key entry. The
occupations of grinding, butchers, grocery and frozen food factory workers were listed as
having the most risk for carpal tunnel syndrome. The lowest prevalence by occupational
group was for industrial workers with low force and low repetition jobs, specifically
slaughterhouse workers (Hagberg, et al., 1992).
Greer, Jenkins and Roberts (1992) examined a survey of grocery workers. The
results projected that up to 400,000 female grocery store checkers in the United States,
even those using electric scanners, may have one or more of the signs or symptoms of
carpal tunnel syndrome. In the survey, the highest reported rate of carpal tunnel
symptoms were within the age group of 35 to 49 (Greer, et al., 1992). This age group is
consistent with the overall average age group that experiences musculoskeletal disorders.
Schenck (1989) noted some common factors emerging in relation to carpal tunnel
syndrome in his study of hand surgeons. Schenck (1989) noted that 60% of carpal tunnel
syndrome complaints were reported by people between the ages of 40 and 60. Of those
reporting carpal tunnel syndrome, about one half had symptoms for over two years upon
diagnosis. In 70 to 90 percent of the cases, the dominant hand was more symptomatic.
Finally, women were three times more likely to be affected by carpal tunnel syndrome
(Schenck, 1989). Perhaps some of the reasons for this is that menopause, pregnancy and

PARTICIPATION IN ON-SITE STRETCHING PROGRAM 31
the use of oral contraceptives have been reported as risk factors for the condition of upper
extremity disorders, putting women at a higher risk than men for these disorders
(Brogmus, et al., 1996).
Costs of Upper Extremity Injuries
It has been difficult to track the actual associated costs due to the fact that the
diagnosis does not reflect the cause of the injury. Oftentimes the original diagnosis is
revised at a later date and is not changed in the databases of insurance providers (Webster
and Snook, 1994). A random sample of indemnity claims by the National Council on
Compensation Insurance in 1989 calculated an average disability claim of $24,158 for
cumulative injuries (Webster and Snook, 1994).
According to James (1993), the average cost per case is $29,000 for lost wages
and medical treatment of upper extremity disorders. Legal damages and fines issued by
OSHA increases the average cost per case by up to $50,000 additional dollars (James,
1993). In 1997, among major disabling injuries, carpal tunnel syndrome was the highest
with median days away from work at 25 days. For the sake of comparison, the median
days away from work for amputations were 18 days. Repetitive motion resulted in the
longest absences from work (17 days) among the leading events and exposures
(www.bls.gov/special.requests/ocwc/oshwc/osh/case/osn008.pdf [July 25,1999]).
A review by Liberty Mutual Insurance Company in 1989 for 45 states found the
mean cost per upper extremity injury claim to be $8070. Compared to the average
workers compensation claim mean cost, this figure was higher by approximately $3995.
This discrepancy was attributed to the uneven distribution of upper extremity injuries
(Webster and Snook, 1994). “In this study, 25% of the cases accounted for 89% of the

PARTICIPATION IN ON-SITE STRETCHING PROGRAM 32
costs,” (Webster and Snook, 1994, p. 714). Of these costs, direct medical payments made
up one third of the total, two thirds of the total were for indemnity payments for lost
wages, claims processing, and costs of worker replacement and training (Webster &
Snook, 1994). In a more recent study, Liberty Mutual Insurance Company found upper
extremity injuries mean costs to be $6760 in 1992. Although this figure is a reduction
from the mean cost in 1989, this cost still exceeds the average workers compensation
costs by 80% in 1992. Also, the discrepancy of uneven distribution of upper extremity
injuries continued (Brogmus, et al., 1996).
It is a controversial subject as to whether or not upper extremity disorders are
caused by work-related or non-work related factors. Determining work relatedness is a
challenge for many cases. A number of epidemiological studies have been conducted to
determine work-relatedness (www.cdc.gov/niosh/ertxt1.html [August 7, 1999]). In one
case, the controversy of work-relatedness ended up costing both the employer and the
injured worker. According to James (1993), a $1.4 million fine was issued by OSHA to
Pepperidge Farms biscuit-baking plant for violations under the General Duty clause, in
the absence of an actual ergonomics standard. Pepperidge Farms was cited for both
record keeping errors and exposing workers to repetitive motion. The court heard
arguments for proving and disproving that repetitive stress contributes to upper extremity
disorders. The judge deemed the issue as extremely controversial and reduced the fine by
one-half. In the end, both arguments won, but the employer paid the fine, direct and
indirect costs (James, 1993).
Employers may experience pressure to prevent such injuries due to the costly
consequences. A Boeing Company employee experienced an upper extremity injury,

PARTICIPATION IN ON-SITE STRETCHING PROGRAM 33
which lead to disability. The Boeing Company was not able to find her a job after she
became disabled. The former employee sued the Boeing Company on the grounds of
discrimination and was awarded $1.1 million (James, 1993).
Risk Factors and Upper Extremity Injuries
The literature reviews metabolic conditions, physical activities and specific
occupations in determining the risk or activities that may lead to upper extremity injuries.
Schenck (1989) indicated metabolic conditions such as hypothyroidism, gout, rheumatoid
arthritis, and pregnancy may be risk factors for the development of upper extremity
cumulative injuries. Schenck (1989) also outlined physical activities that were thought to
be risk factors. These activities include (1) repetitive wrist flexion and extension, (2)
gripping with the wrist in a bend posture, (3) palmar force, and (4) exposure to vibration.
Armstrong, et al. (1993) cautioned that, “…personal characteristics and environmental
and sociocultural factors usually play a role as risk factors for these diseases,” (p. 74).
Work stress and family stress are just some examples of the personal factors that may
influence the susceptibility to upper extremity injuries. Armstrong, et al. (1993) further
researched the influence of personal factors on upper extremity disorders. Armstrong, et
al. (1993) found some studies that indicated a strong link to be based on non-occupational
populations. However, the personal factors were small when compared with that
associated with occupational exposures in a quantified study (Armstrong, et al., 1993).
Webster and Snook (1994) found the ergonomic considerations of repetition,
force and posture to be potential risk factors for upper extremity injuries. Webster and
Snook (1994) concluded that job tasks that involved high repetition, high force with poor
posture were more of a problem in relation to the condition of upper extremity injuries.
PARTICIPATION IN ON-SITE STRETCHING PROGRAM 34
These risk factors could be remedied by ergonomic interventions such as job redesign,
purchase of different equipment or tools, job rotation or automation (Webster and Snook,
1994). Other literature supports these ergonomic considerations and also includes the
recommendation of rest periods (Greer, et al., 1992). According to Collins (1997),
“OSHA recommends adjusting your chair to fit your body, watching your posture
and exercising at your desk. Hold stretches for at least 10 seconds to relieve the
fingers and wrists and minimize neck strain,” (p. 147).
Brogmus, et al. (1996), found the increasing productivity demands as a risk factor
for upper extremity injuries. Data available for productivity in the United States was
reviewed by Brogmus, et al. (1996). Between the years of 1980 to 1986 there was an
increase of relative output per employee hour by approximately 3% annually. In 1987
the relative output per employee hour increased by about 7%. Again between 1987 and
1991, another 6% increase in relative output per employee hour occurred (Brogmus, et
al., 1996).
Brogmus, et al. (1996) also theorized that other reasons for the increasing number
of upper extremity injuries could be a result of the shift from goods producing (e.g.
mining, construction, manufacturing) to service industries (e.g. transportation, retail
trade, public utilities). In service industries there is an increasing use of video display
terminals of which Brogmus, et al. (1996) also found to be a risk factor. The growing
number of women entering the work force also could account for the increase in upper
extremity claims. Liberty Mutual Insurance Company data indicate that women account
for about 65% of upper extremity injuries, but only 30% of the claims Brogmus, et al.,
1996). Brogmus, et al. (1996) also theorized that the numbers of upper extremity injury

PARTICIPATION IN ON-SITE STRETCHING PROGRAM 35
claims are increasing as workers are becoming more knowledgeable about such disorders
and that the method of reporting and tracking these injuries has become easier.
The specific occupations found to be at higher risk levels for upper extremity
injuries are meatpacking, poultry processing and automobile assembly
(www.cdc.gov/niosh/ergtxt5a.html [August 7, 1999]). Carpal tunnel syndrome seems to
be more common in the occupations of butchers, garment workers, grocery checkers,
electronic assembly workers, typists, computer terminal operators, musicians, carpenters
and packers (Greer, et al., 1992). According to the Bureau of Labor Statistics, the top
five industries at risk for upper extremity injuries are (1) meat packing, (2) motor
vehicles, (3) shipbuilding and repair, (4) frozen bakery products, and (5) pens and pencils
(James, 1993).
Wellness as Part of Disability Management
A review of the literature provides information on previous case studies of
companies that successfully reduced work-related musculoskeletal disorders through the
implementation of administrative controls such as work conditioning programs as well as
engineering controls such as job design modifications. Additionally, literature reviews
of the perceptions held by management and blue-collar employees in regard to their
viewpoints about and motivation to participate in wellness and exercise programs.
Wellness programs can serve as a means to reducing workplace injuries,
absenteeism and other sick time away from work. Wellness programs were developed by
employers who were concerned by the increasing costs of chronic illness and injuries
occurring in the workplace. Early wellness programs included injury prevention,
identification of risks, light duty or transitional work duties for injured workers, job

PARTICIPATION IN ON-SITE STRETCHING PROGRAM 36
accommodations and also employee assistance programs to address the emotional needs
of employees as well (Tate, 1987). These early wellness programs seem to incorporate
some of what OSHA is proposing to be the six elements of the ergonomics standard.
Brandon (1985) outlined four elements of a wellness program: Self-responsibility,
Nutritional Awareness, Physical Fitness and Stress Management. Brandon (1985) writes
that the Centers for Disease Control in Atlanta estimated that 84 percent of a person’s
ability to handle disease is determined by self-responsibility of lifestyle, health care
choices and the environment the person is exposed to. Brandon (1985) states that the
benefits of assuming self-responsibility for one’s own health are increased self-esteem,
motivation and improved learning ability. Brandon (1985) further states that the self-
responsible people develop the ability to trust their own judgement in relation to personal
health issues. The self-responsible person is better able to motivate his or her self to
make changes in health and lifestyle habits (Brandon, 1985). In regard to physical
fitness, Brandon (1985) lists the benefits of increased range of motion, muscular strength
and endurance, improved work productivity, improve emotional health and also delaying
the degenerative changes associated with aging.
Value of Health Training Programs to Return Injured Workers
A study in Sweden involved employees off work for four to six weeks due to back
problems. These injured employees participated in a back school training program that
emphasized fitness and endurance. Results indicated a reduction of long-term disability
by 50 percent compared to the control group that received no training. From this study it
was estimated that the entire country of Sweden, population of 8,000,000 could realize an

PARTICIPATION IN ON-SITE STRETCHING PROGRAM 37
annual savings of $15 million by implementing this type of training for those people with
back injuries that experienced lost work time (Bigos and Battié, 1987).
In regard to return-to-work after an injury, LaCroix, Powell, Lloyd, Dosey,
Mitson and Aldam (1990) also support the need for training. LaCroix, et al. (1990) found
a consistent correlation between patients’ level of understanding of their treatment plans
for low back injuries and English proficiency. Patients with poor English skills and poor
education may have difficulty communicating with the health care provider. This
difficulty with communication may cause the patient to develop their own interpretations
about their condition that may not be medically accurate. This level of understanding
affects the individual’s successful return-to-work. LaCroix, et al. (1990) found that 94
percent of patients with a good understanding of the medical condition successfully
returned to work. Only 33 percent of those with poor understanding of their medical
condition successfully returned to work (LaCroix, et al., 1990).
Musculoskeletal Injury Reduction Programs and Stretching/Exercise
Little research has been done to explore the benefit of exercise in regard to
preventing or reducing musculoskeletal injuries. However, researchers in Austria,
Australia and Canada have found pre-work exercises to be beneficial in regard to
preventing the re-occurrence of injuries (Mann, Ed., 1999). Francis Puchalski of the
consulting firm P.E.E.R Services in Canada advocated for pre-work exercises,
“They provide an early warning signal when something is wrong and a
psychosocial benefit as people feel better about themselves. They also eliminate
some of the minor sprains and strain that might have otherwise occurred,”
(Mann, 1999, p. 11).

PARTICIPATION IN ON-SITE STRETCHING PROGRAM 38
Although there are arguments for and against work place exercise programs, no one
seems to disagree that there does seem to be some benefit to preparing the human body
for activity by increasing blood flow through exercise. Also, there seems to be some
agreement that exercises alone will not solve the issue of musculoskeletal injuries in the
workplace. Exercise or stretching may be a component to an overall ergonomics program
that includes environmental adjustments, engineering and administrative controls (Mann,
1999). According to Joseph Mann, Editor of CTD News (1999), any program whether it
is exercise or all encompassing ergonomics programs must have management support for
the programs to be successful. The suggestion that stretching or exercise alone will not
reduce musculoskeletal injury claims appears to be demonstrated by the companies that
report successful reductions of musculoskeletal recordable injuries.
Shephard (1999) reviewed work-site wellness programs, specifically physical
activity and fitness in the workplace. Shephard (1999) indicated that to take employees
away from production for 7 to 8 minutes to complete a calisthenics exercise routine was
acceptable in the 1970’s, however was concerned for this length of time away from
production in contemporary workplaces. Program success in the 1970’s was measured
by levels of employee health awareness, employee attitudes on health and by employee
interest in the program (Shephard, 1999). As work-site wellness programs evolved, these
means of measurement no longer satisfy company leaders. The interest is now more on
how the work-site wellness program affects the bottom line: is the company saving
money by investing time into these programs (Shephard, 1999)?
In the earlier work-site wellness projects Shephard (1999) found positive
advantages of such programs. Some of the advantages Shephard (1999) cited was: (1)

PARTICIPATION IN ON-SITE STRETCHING PROGRAM 39
the employees that participated in the wellness program had a lower turn over
employment rate, (2) productivity of program participants increased by up to 5%, (3)
approximately one half day less absenteeism rate among program participants, possibly
credited to improved employee loyalty as a result of improved mood, and (4) a reduction
in medical expenditures by approximately $100 to $400 annually. According to
Shephard (1999), the advantages for the employee include a reduction of body mass and
fat, improved aerobic power, muscle strength and endurance, flexibility, decrease of
cardiac risks (e.g. lower blood pressure, reduction of smokers in the workplace),
improved mood, and decrease risk of illness or injury. Shephard (1999) implied that
employers benefit from these advantages for employees as well. The employee
advantage of improved mood may provide the employer the benefit of a reduction in
medical claims. Shephard (1999) asserted that, “A person who feels better is less likely
to visit a physician with minor complaints,” (p. 13). Shephard (1999) also found that by
reducing employee stress through work-site wellness programs also served to reduce
stress-related illnesses.
Shephard (1999) noted that the biggest challenge to the success of work-site
wellness programs was maintaining on-going interest of participating employees and the
behavior modification techniques applied to convince non-participating employees to
participate in the wellness program. The keys to overcoming this challenge is by
involving senior management, enthusiastic program leadership, offering flexible program
hours, variety of health activities and the inclusion of family (Shephard, 1999).

PARTICIPATION IN ON-SITE STRETCHING PROGRAM 40
Benefits for Companies
Red Wing Shoe Company responded to the increasing amount of Cumulative
Trauma Disorders by implementing administrative and engineering controls.
Administratively, the company hired an ergonomist, implemented an exercise,
conditioning stretching and safety awareness program, provided safety and ergonomic
training to employees and re-structured how work was to be performed creating group
projects and requiring job rotation. Red Wing Shoe Company also re-engineered work
stations adding different chairs, anti-fatigue mats, pneumatic tools and re-designing the
position of the sewing machines. As a result of these changes the company realized a
reduction in employee exposures to cumulative trauma disorders, decreased workers’
compensation claims from 4.4 million dollars to 1.3 million dollars in 1995. Repetitive
motion injuries dropped to 25 to 30 percent of the total OSHA recordable injuries in a
three-year period of time. An added benefit for Red Wing Shoe Company was a
reduction in manufacturing time (Mann, 1995).
Xandex, Inc of California, a small manufacturer of semiconductor test and
assembly solutions in California, began having difficulties with worker’s compensation
claims for tendinitis. “In 1993, about 10 people on our 35-person work force had filed
CTD-related claims,” (Gauf, 1998, p. 16). By implementing some environmental
changes such as purchasing adjustable chairs, installing task lighting and replacing
hazardous tools and also incorporating morning and afternoon stretch breaks, Xandex,
Inc was able to reduce the costly worker’s compensation claims. Xandex, Inc. worker’s
compensation experience modifier decreased from 201 percent in 1994 to 122 percent in
1997 (Gauf, 1998).

PARTICIPATION IN ON-SITE STRETCHING PROGRAM 41
The 3M Company discovered that 35 percent of all of their OSHA recordable
cases and 53 percent of all lost-time cases were related to work-related musculoskeletal
disorders (www.osha-slc.gov/SLTC/ergonomics/3m.html [August 7, 1999]). 3M
Company implemented a company-wide ergonomics program that included
environmental changes as well as on-site stretching routine (Larson, 1999). Within a
five-year period of time, a 22 percent decrease in recordable cases and a 58 percent
decrease in lost-time cases was realized (www.osha-slc.gov/SLTC/ergonomics/3m.html
[August 7, 1999]).
The New York Times implemented an ergonomics program that included
training, replacement of chairs and desks to accommodate the workers and micro-breaks
for stretching throughout the day to address their incidences of cumulative trauma
disorders, especially among computer laptop users and other computer terminal users
(Gauf, 1998). The result of implementing the ergonomics program was an 84% reduction
in compensable cumulative trauma disorders, a 75% decrease in lost-time injuries and a
91% decrease in total days lost for the entire period between the years of 1992 and 1996
(Gauf, 1998).
Eastman Chemicals Company (formerly a part of Eastman Kodak Company)
developed an ergonomics program to address awkward postures and upper extremity
injury risks. Eastman Chemicals is also in the process of including a wellness component
to their ergonomics program. The wellness component will require workers in high-risk
departments to participate in stretching exercises on-site. Eastman Chemicals is also
working with a consultant to develop an exercise strengthening program (Gauf, 1998).
According to Eastman Chemicals chief ergonomist:

PARTICIPATION IN ON-SITE STRETCHING PROGRAM 42
“This will allow employees to actually condition muscles to better tolerate work
stresses and reduce whole-body fatigue. Workers are given 30 minutes of
company time to perform these exercises seven to eight times a month,” (Gauf,
1998, p.12-13).
Apparently some increases in worker strength has been observed as a result of the
exercise program (Gauf, 1998).
General Motors credits their worker wellness program implementation to cause a
50 percent reduction of employee grievances, a 50 percent decrease in work place
accidents, a 40 percent decrease in lost time injuries and a decrease in sickness and
accident payments by 60 percent. Kennecott Copper also realized a 55 percent reduction
in medical costs to the credit of the implementation of an exercise program (Ulmer,
1984).
Benefits for Employee
Not only does the literature indicate the benefits of exercise programs for
employers; the literature also indicates benefits for employee participation in exercise
programs as well. In regard to employees who have already experienced an injury,
Bigos and Battié (1987) suggest,
“Informing patients about the benefits of endurance training, beyond helping to
avoid long-term back problems, can be used to help motivate patients to comply
with their exercise programs. Regular endurance exercise has been shown to
improve cardiopulmonary function, sleeping habits, and mental alertness, as well
as reduce psychological stress, depression, and pain complaints” (p. 124-125).

PARTICIPATION IN ON-SITE STRETCHING PROGRAM 43
Bigos and Battié (1987) also warn that inactivity can cause depression and lowered self-
esteem. However, Bigos and Battié (1987) counter-argued that many times strength and
flexibility exercises may not be helpful as oftentimes these types of exercises are poorly
tolerated, causing up to a 50 percent drop out rate. Perhaps if it was realized what would
motivate these patients to continue an exercise program, strategies could be developed to
reduce the significant drop out rate.
Los Angeles fire fighters participated in a study (Cady, Thomas, & Karwasky,
1985) that was designed to measure the increase of muscular strength and endurance,
reduce the risk of coronary heart disease and as a result, reduce insurance claims of
musculoskeletal and cardiovascular injuries. For three years, 1652 firefighters
participating in the study, were given random physical examinations and exercise tests.
The exercise test was followed by a 20 minute individualized counseling session that
reinforced cardiovascular fitness, strength training and also information on nutrition and
the effects of tobacco usage. At the end of the study, participants were divided into
fitness categories based on flexibility, strength and heart rate measures. Seven percent of
the participants in the low fitness category experienced back injuries and three percent in
the mid-level fitness category experienced back injuries. Only one percent of the
participants in the high fitness level category experienced back injuries. The conclusion
was made that the protection of back injury was associated with better than average
physical fitness in regard to flexibility, strength, heart rate, diastolic blood pressure and
physical work capacity measures. This study also found, “The individuals with either
greater flexibility or strength or work capacity were characterized by much lower back
and total injury costs,” (Cady, et al., 1985 p. 112). A review of the Los Angeles fire
PARTICIPATION IN ON-SITE STRETCHING PROGRAM 44
department’s worker’s compensation after the three-year study period indicated a 16
percent decrease in disabling injuries, being lowest in the last two years of the study.
“Cost per $100 of payroll costs have decreased 25 percent,” (Cady, et al., 1985, p. 113).
Both a revised return-to-work program and the physical fitness program was credited for
the decrease of worker’s compensation costs for the three year study period (Cady, et al.,
1985).
Alexy (1990) asserted that there is considerable evidence that blue collar workers
engage in more health-risking behaviors that may lead to accidents or injuries in
comparison with white collar workers. These behaviors include physical inactivity
outside of work duties, cigarette smoking and using alcohol and other drugs. Desmond,
Conrad, Montgomery and Simon (1993) suggest that blue-collar workers need to be
physically fit in terms of strength and flexibility in order to perform their jobs safely.
Strategies for preventing repetitive work injuries need to be applied for a more
proactive response to physical degeneration. The Center for Disease Control and
Prevention reported that exercise can improve muscle function, cardio-vascular health
and physical performance for people with arthritis (Key, 1997). It seems logical that
people without arthritis could also receive some of the same benefits from exercise. The
Center for Disease Control surveyed 105,853 people and found 29.4 adults reported they
never engaged in exercise or physical activity other than what was required by their jobs
(Key, 1997). Federal health officials estimate that 53 million adult Americans are not
physically active during their leisure time (Key, 1997). A study by the University of
Maryland found that Americans between the ages of 18 and 45 spend 15.1 hours per
week of leisure time watching TV compared to 2.2 hours per week of leisure time playing

PARTICIPATION IN ON-SITE STRETCHING PROGRAM 45
sports (Chen and Griffin, 1993). Even young people are more physically inactive in
contemporary times. A study in Australia found fitness levels of boys to decrease by
30% and for girls, 20% between 1980 and 1990. Sedentary lifestyles was determined to
be the cause for this drop in fitness levels (Colman, 1997).
Brown (1975) in a sample of 509 respondents from various industries, found that
only 26% of the sample did not engage in athletic games. Of this 26%, men made up
21% and women, 30% (Brown, 1975). In a poll by Health magazine and the Gallup
Organization, it was found that approximately 250 of the 500 women polled failed to
exercise because they could not stick to a routine (Mason, 1998). The poll also indicated
that close to two-thirds of the respondents thought that not having enough time was the
number one obstacle in becoming involved in an exercise routine. Family came in
second place as a barrier to exercise for the female respondents where male respondents
were half as likely to perceive family as an obstacle to exercise routine involvement
(Mason, 1998). According to Mason (1998), “Women do not choose the sedentary life; it
is thrust upon them, the result of sexist social conditioning, misguided fitness marketing,
and failed suburban planning,” (p. 67). Traditionally women have been taught that
competition and strength activities were unbecoming and inappropriate. Athleticism for
women in the past had been discouraged. Now those women are finding it difficult to
value physical exercise. Mason (1998) argues that women spend an average of over
seven hours in a given week just driving: transporting children to various activities,
running errands, shopping for food and other family needs. Women also seem to still be
primarily responsible for the majority of the chores at home in addition to their careers.
This allows women little to no time for exercise. Mason (1998) also states that women

PARTICIPATION IN ON-SITE STRETCHING PROGRAM 46
are employed in less physical jobs, spending much of their workday in sedentary
positions. The Melpomene Institute studies ways to encourage women to exercise.
Melpomene Institute spokeswoman, Linda Feltes argues that people find time to do the
things they want to do. Women may say they do not have time to exercise, however
Feltes argues that if exercise was a priority women would be able to find the time. “The
president jogs everyday, and you’re busier than the president? No way,” (p. 69) Feltes
questioned. Mason (1998) stated that to change people’s behaviors in regard to exercise,
more incentives are needed. Mason (1998) suggested that companies provide employees
with fitness facilities and time to utilize the facilities and that HMOs offer lowered
premiums for people who exercise.
Viewpoints and Behavioral Change of Blue Collar Workers on Exercise Programs
Motivating Employee Participation
Alexy (1990) surveyed 152 blue-collar workers to assess “…perceived barrier to
and benefits of health promotion, motivational factors, (e.g. self-discipline and need for
rewards or incentives), need for social support, and convenience factors relative to the
use of the Wellness Center” (p.14). Alexy (1990) divided the randomly selected
participants into two groups: those who participated in the company’s Wellness Center
and those who did not. Alexy (1990) found that those who participated in the Wellness
Center perceived more benefits of and fewer barriers to health promotion activities than
the non-participants. Perceived physical barriers included shift work, amount of required
work hours, having a second job, car-pooling, commuting distance to work from home
and responsibilities within the home. Perceived psychological barriers included personal
ideas of being too old or too unfit to participate in a fitness program and that the work

PARTICIPATION IN ON-SITE STRETCHING PROGRAM 47
environment provided enough exercise that exercising outside of the work activity was
not necessary (Alexy, 1990).
Shephard and Cox (1980) researched the characteristics of people who participate
in industrial fitness programs. Shephard and Cox (1980) found that men are attracted to
fitness programs for the benefit of feeling better and relieving tension. Females are
attracted to fitness programs for the purpose of weight loss, improving their figure and
meeting people (Shephard and Cox, 1980). Shephard and Cox (1980) cite that the
reasons or risk factors for why people drop out of fitness programs is because of (1) lack
of spousal support, (2) maintain a below average concern for their own health, (3) more
likely to already smoke tobacco products, (4) physically have an above average body fat
percentage, (4) maintain a poor credit rating financially, (5) employed in blue-collar jobs,
(6) maintain a history of physical inactivity, and (7) have a Type B personality.
According to Linton and Warg (1993), Hyytiäinen (1994) and Weitzel (1989)
employee participation in wellness programs is somewhat dependent upon the
employee’s perception of the problem and employee self-efficacy. Self-efficacy in
Weitzel’s (1989) study was defined as a perception that the person can successfully
perform the required behavior to produce the desired outcome. Linton and Warg (1993)
theorized that for an employee to change his or her behavior, the employee must first
believe there is a connection between the cause of injury or illness and their behaviors.
Linton and Warg (1993) suggested that sometimes management may make decisions on
how to reduce the cause of injuries and illnesses through employee behavioral changes,
however, employees may not be in total agreement with the decision made due to their
own set of beliefs. In their study, Linton and Warg (1993) concluded that blue-collar

PARTICIPATION IN ON-SITE STRETCHING PROGRAM 48
workers tended to attribute the cause of musculoskeletal pain to the work environment,
whereas management tended to attribute the cause of musculoskeletal pain to the worker.
Linton and Warg (1993) also found a reluctance of blue-collar workers that were
specifically dissatisfied with their jobs to independently initiate preventative measures to
reduce musculoskeletal disorders. The study indicated dissatisfied blue-collar workers
believed prevention measures should be taken at the work place (Linton and Warg,
1993). Linton and Warg (1993) also found that workers less satisfied with their jobs
were more likely to report that musculoskeletal pain was a result of the work
environment. Linton and Warg (1993) found no statistically significant difference
between blue-collar workers and management on the Individual Prevention Sub-scale
aside from the dissatisfied workers.
Hyytiäinen (1994) completed a study of shipyard and ventilation equipment-
producing factory workers. Hyytiäinen (1994) surveyed workers to determine employee
experience of lower back pain and their opinion on how lower back pain could be
reduced through engineered solutions (e.g. postural changes, equipment modification,
etc) or through personal changes, specifically how much employees believed they could
influence their own health through their behaviors. Hyytiäinen (1994) found that in
regard to influencing health through the behavior of increased physical exercise,
employees became more pessimistic with age. Hyytiäinen (1994) suggested this
pessimism could be due to the increase of disease and disability with age or that the
employees may have experienced lower back pain for so long they have learned to live
with it. In regard to motivating employees to participate in preventing lower back pain
through exercise programs, Hyytiäinen (1994) stated that motivating symptom-free

PARTICIPATION IN ON-SITE STRETCHING PROGRAM 49
employees might be difficult. Hyytiäinen (1994) suggested, “…it is important to take an
active approach in health care to motivate subjects to take preventive action themselves
when they first experience lower back pain,” (p. 85).
Kelly, Zyzanski and Alemagno’s (1991) findings agree that to motivate people to
change how they care for themselves is influenced by their own health beliefs and self-
efficacy. Kelly et al. (1991) summarized, “…patients who think they are at risk in a
given lifestyle area usually feel that they would benefit by change, but also feel it would
be difficult to change or that their likelihood of success is low,” (p. 318). Kelly et al.
(1991) also found that people are more likely to be more motivated to change simple
behaviors like using a seat belt, as opposed to the more complex behaviors. Other
methods of change such as support, encouragement and educational information would
be necessary for a person to be motivated to change more complex behaviors, such as
stress reduction. Kelly et al. (1991) suggested that simple cues would help to encourage
the motivation to change even the most complex health behavioral changes.
Developing employee behavioral changes can be accomplished, according to
safety consultant, Michael Topf (1999) by combining the theories of cognitive and
behavioral psychology. In behavioral psychology, to change a behavior requires the
pairing of the desired behavior and a reward for the behavior. This may become
challenging for company managers to constantly monitor employees’ behaviors and
respond with the reward accordingly. Also, when the reward is no longer available, the
learned behavior may be forgotten. Cognitive theory contends that to change a behavior
the worker must understand the reason for changing the behavior and then develop a
personal belief system or attitude that values the behavioral change. This could be

PARTICIPATION IN ON-SITE STRETCHING PROGRAM 50
accomplished by raising employee awareness of the need for change and bringing to the
employees’ attention what is in it for them personally to change the behavior (Topf,
1999). According to Topf:
“To effectively prevent accidents and injuries, safety must become a personal
value that all employees bring to every task they perform every day, on or off the
job. When employees value and believe in safety for themselves, their co-
workers, and families, they will engage in the types of behaviors that offer the
greatest chance of avoiding injury. Their well-being becomes the primary prize,”
(Topf, 1999, p. 64).
Weitzel (1989) found that perceptions of health status (e.g. person reporting good
health demonstrates more interest in activities to promote good health) and self-efficacy
were the two most powerful predictors of health-promoting behaviors among blue-collar
workers. According to Weitzel (1989), “The implications are that the better a person
believes his health to be, the more likely he will act in ways to maintain it; and that
believing in one’s ability to accomplish a behavior acts as a motivator to perform the
behavior,” (p. 102).
In a follow up study, Desmond, et al. (1993) also found perceptions of health
status and self-efficacy to be predictors of participation in physical activity. In addition,
Desmond, et al. (1993) found job category and income to also be statistically significant
predictors of blue-collar worker participation in physical activity both during work and in
leisure time.
A study by Morgan, Shephard, Finucane, Schimmelfing and Jazmaji (1984) of
employees at General Foods Corporation in White Plain, New York also supports the

PARTICIPATION IN ON-SITE STRETCHING PROGRAM 51
findings that self-efficacy and perceptions of health influence employee participation in
health programs. At General Foods Corporation, Morgan et al. (1984) studied
characteristics of the employees that utilized and participated in activities within the
Health Fitness Center. The Health Fitness Center offered aerobic exercise, strength and
flexibility and also relaxation programs. Morgan et al. (1984) found that the employees
that believed their own health to be poor were not likely to take interest in the Health
Fitness Center programs. On the contrary, the employees that perceived themselves to be
healthy were more likely to maintain a regular attendance to an exercise program
(Morgan, et al., 1984).
Morgan, et al. (1984) further provided recommendations for the implementation
of a successful, on-site health program, based on their conclusions from their General
Foods Corporation study. Morgan, et al. (1984) concluded that a discussion of health
risks is not an effective strategy for recruiting employees into an exercise or other life-
style change program. Morgan, et al. (1984) theorized that the employees that
maintained an exercise program and that held a strong belief in the value of healthy
behaviors developed this belief over a long period of time. It would be unlikely that the
promotion of a specific health program would be able to change employee attitude in a
short period of time. Key elements of maintaining participation in health programs, are
the influence of personal preferences and also environmental reinforcements (Morgan, et
al., 1984). These elements may vary according to each individual, however, Morgan, et
al., (1984) did find some tendencies in their study. The men in the study found duties
outside the corporate headquarters (where the fitness center was located) to be a
significant deterrent to maintaining regular program participation. However, the women

PARTICIPATION IN ON-SITE STRETCHING PROGRAM 52
in the study were not deterred from regular participation in the health program due to
outside duties. Also, the men in the study who indicated they exercised to socialize were
less likely to maintain a regular exercise routine and these men, after exercising for a
period of time, found exercise to be less fun than they indicated earlier. Morgan, et al.
(1984) also found that younger employees were more likely to enroll and maintain
participation in the Health Fitness Center programs. These findings suggest that fun and
socialization do not serve as motivators for regular participation in this particular Health
Fitness Center programs (Morgan, et al., 1984).
In a later study of a random sample of South Carolina employees, Davis, Jackson,
Kronenfeld and Blair (1987) found a clear association between job stress and trait anxiety
with participation in a health program. Davis, et al. (1987) also examined the
effectiveness of risk reduction as a motivator for participation. The evidence provided
that when a person entered the program in the effort to reduce a health risk, it was not
enough of a motivator for the person either to maintain involvement or to succeed in
program gains (such as weight loss goal success). The people that tended to volunteer to
participate in the health promotion program in Davis et al. (1987) study did so according
to the level of job stress they perceived. Davis, et al. (1987) concluded that,
“Both job stress and anxiety show some promise as predictors, and participation
appears to have a positive impact on subjective stress—either by increasing the
sense of personal efficacy in handling it or reducing the felt level of stress,” (p.
204).
In regard to planning a health promotion program in the work place, Davis, et al. (1987)
recommend that health programs include the benefits of exercise in reducing job stress.

PARTICIPATION IN ON-SITE STRETCHING PROGRAM 53
According to a study by Sloan and Gruman (1988), employees are motivated to
participate in health promotion programs due to a feeling of vulnerability to health risk.
Sloan and Gruman (1988) discuss a chain of events that cause an employee to participate
in a health program. This chain begins with the perception of risk, health satisfaction and
intention to change health behaviors and ends with participation in health promotion
programs. Sloan and Gruman (1988) argue that the Health Belief Model is the catalyst to
participation. The Health Belief Model, according to Sloan and Gruman (1988),
“…proposes that the likelihood of a health action is a function of several factors
including perceived vulnerability or susceptibility (risk) to disease, severity of the
disease, barriers to action, efficacy of the action, and a cue to act,” (p. 283).
The Health Belief Model contends that people are more likely to accept health behaviors
that are consistent with their current health beliefs. Changing the health behaviors of a
person is easier if you have already convinced the person through education, that
changing their health behavior is a benefit to them personally.
Applying the Health Belief Model, Sloan and Gruman (1988) recommend that in
developing a health promotion program, employers should include employee education
of health risks prior to employee enrollment into the program. The realization of health
risks should, according to Sloan and Gruman (1988) have an impact on participation in
health promotion programs and also the success of program maintenance. Sloan and
Gruman (1988) also suggest that the relationship that management has with potential
program participants is critical. This relationship could be accomplished in a number of
different ways. One suggested method is to involve employees in the decision-making
process of the implementation of the health program. The more influence and input

PARTICIPATION IN ON-SITE STRETCHING PROGRAM 54
employees have in regard to the program, the more likely employees will be to use the
program. Sloan and Gruman (1988) also state that it is important that management
visibly support the health promotion program. This could be accomplished through
management use of the program and the provision of incentives for all employees
(management and workers) to utilize the health program. Sloan and Gruman (1988)
referenced an example of Boeing Company. General management at Boeing Company,
according to Sloan and Gruman (1988), are compensated in relation to safety promotion.
Sloan and Gruman (1988) suggest that similar arrangements be made to promote the use
of the health program and also to reduce employee absenteeism.
King, Carl, Birkel and Haskell (1988) outlined variables they found in their study
to have potential impact on the success of an exercise program specific to the demands of
blue-collar work. Although King, et al. (1988) refer to an exercise program separate
from the workplace, it is believed these suggestions would appropriately fit an on-site,
during work time stretching program. King, et al. (1988) suggest the time and location of
exercise routine be convenient to the worker and be specific to the types of tasks the
worker performs. Support from management would also facilitate success of the program
however employees need to be allowed input in the development of the work
conditioning or exercise program (King, et al., 1988).
Participation in Work-Site Wellness Programs
Participation in exercise in manual handling and manufacturing occupations
specifically by blue-collar workers is important according to the literature. Clearly the
literature shows there are benefits for companies in the reduction of injury, accident and
illness claims, improved employee morale, reduced absenteeism due to illnesses, a

PARTICIPATION IN ON-SITE STRETCHING PROGRAM 55
reduction in employee job stress, and reduced workers compensation costs. The literature
also outlines the importance of exercise for blue-collar workers who seem to be more
likely to engage in health-risk behaviors. As suggested by Shephard (1999), King, et al.
(1988) Linton and Warg (1993) and by Sloan and Gruman (1988), management must first
support the need for the implementation of a work conditioning exercise program and
then work toward facilitating blue-collar employees to learn and accept the value of such
a program.
The literature includes a number of recommendations to successful
implementation of exercise programs. These recommendations can be summarized as:
1. Be able to identify physical and psychological barriers (Alexy, 1990).
2. Facilitate positive self-efficacy and facilitate employee belief in the
connection between the cause of injury or illness and their behaviors (Linton
and Warg, 1993).
3. Provide a work environment that is satisfactory to employees (Linton and
Warg, 1993).
4. Intervene at the earliest on-set of pain to encourage preventive actions. This
also would seem to require encouraging early pain or injury reporting
(Hyytiäinen, 1994).
5. Provide support, encouragement and educational information via simple cues
to motivate the change of more complex behaviors (Kelly, et al., 1991).
6. Combine the theories of cognitive and behavioral psychology. Pair desired
behavior with the reward and also at the same time help the employee

PARTICIPATION IN ON-SITE STRETCHING PROGRAM 56
understand the reason for changing the behavior; help develop a personal
belief system or attitude that values the behavioral change (Topf, 1999).
7. Facilitate individual perceptions of good health (Weitzel, 1989, Desmond, et
al., 1993, and Morgan, et al., 1984).
8. Influence individual preferences and environmental reinforcements (Morgan,
et al., 1984).
9. If incorporating a fitness center, it should be easily accessible. On-site if
possible (Morgan, et al., 1984).
10. Fun and socialization may not be adequate motivators for participation in
health promotion programs (Morgan, et al., 1984).
11. Perceived job stress may serve as a motivator for participation in a health
promotion program. Be sure to include the benefits of exercise in reducing
job stress (Davis, et al., 1987).
12. Participation in a health promotion program is a four step process:
a.) perception of risk
b.) health satisfaction level
c.) intention to change
d.) participation in health promotion program
Because participant involvement is a process, employers are recommended to
include health risk education prior to employee involvement to facilitate the
success of program maintenance (Sloan and Gruman, 1998 and King, et al.,
1988).

PARTICIPATION IN ON-SITE STRETCHING PROGRAM 57
13. Develop a positive relationship with potential program participants through
involving employees in the decision-making process regarding the
implementation process (Sloan and Gruman, 1998).
14. Management show visible support of health promotion program (Shephard,
1999, Sloan and Gruman, 1998 and King, et al., 1988).
15. Employers provide time for employees to participate in the health promotion
program (King, et al., 1988).

PARTICIPATION IN ON-SITE STRETCHING PROGRAM 58
CHAPTER III
The literature describes a need for research in the area of the perception of
responsibility for conditioning programs among management and employees. This case
study of a Central Wisconsin company serves to describe workers perceptions in regard
to work conditioning activities.
Methodology
Subjects
This case study involved one Central Wisconsin manufacturing company.
Company selection criteria included having no current on-site stretching program, no on-
site health club or reduced health club rates, the company had not conducted a company-
wide training program on the value of stretching, and experienced a minimum of one
musculoskeletal injury claim within the past 365 days. The selection criteria also ruled
out any health care organizations (e.g. hospitals, nursing care facilities, group homes,
etc.). Informed consent was given by employees and management to participate in this
case study.
A Central Wisconsin furniture manufacturer was selected for this case study that
represented acceptable diversity in employees (male/female, ethnic diversity reflective of
typical Wisconsin industries for that size, location, etc.). This company employs
approximately 335 people with labor union participation. Of the 335 employees, 186 are
employed in manufacturing labor positions and approximately 150 are employed in office
positions.
Through the year of 1998 and up to October of 1999, the company recorded 62
musculoskeletal strain injuries. This accounted for 49.6% of the total injuries

PARTICIPATION IN ON-SITE STRETCHING PROGRAM 59
experienced. The company recorded 25 strain injuries in the low back, constituting
40.3% of the strain injuries recorded. In the same period, the company recorded 11 strain
injuries to the wrist and hand, constituting 17.7% of the strain injuries recorded. In
1998, 41% of all plant worker injuries were musculoskeletal strain injuries. In the first
quarter (January through March) of 1999, 59% of all plant worker injuries were
musculoskeletal injuries. In 1998, 71% of the musculoskeletal strain injuries occurred
within the first four hours of the plant workers’ shift. This rose to 80% of the
musculoskeletal strain injuries occurring within the first four hours of the plant workers’
shift in the first quarter of 1999. These records include only workers in the
manufacturing jobs. Office workers were not included in this study at the request of the
company safety director.
Procedure
The workers that were given surveys to complete in the company included all
plant workers and plant floor supervisors. Respondents were allowed to participate
voluntarily. The survey was completed at the work site during a weekly scheduled
department meeting time. Employees were not required to identify themselves, aside
from a selection of basic demographics (such as age range and gender) and by department
so that there was verification that all departments had completed the surveys.
Accommodations were made for the employees with reading difficulties. The same
survey was used with all employees of the company. (See Appendix A for a copy of the
survey).

PARTICIPATION IN ON-SITE STRETCHING PROGRAM 60
Response anonymity was guaranteed by having respondents immediately return
the completed surveys face down or folded in half and left on the table for their
supervisor to collect. A data summary was provided to the company at a later date.
Instrumentation
This survey included questions designed to produce responses that reflected
opinions about general satisfaction with the company/job, opinion about who is
responsible for ergonomics and worker safety and health. The survey requested self-
perception of general health and a report of any type of pain sensation while performing
individual jobs in order to determine the presence of unreported signs and symptoms of
musculoskeletal disorders. (See Appendix A for a copy of the survey).
Data Analysis
Data was analyzed with descriptive statistics and included: frequency, mean,
median, mode and standard deviation. Demographic data was complied through by
frequencies of responses to variables requested. Correlations were performed to assess
relationships of selected variables.

PARTICIPATION IN ON-SITE STRETCHING PROGRAM 61
CHAPTER IV
Results
Total number of respondents was 136 workers and 9 management for a combined
total of 145 respondents. For the purpose of this study, the worker group includes all
blue-collar position employees. The management group includes all department
supervisors.
Demographics
Of the total respondents, 72.4% (105) were males, 26.2% (38) females and 1.4%
(2) did not indicate a response to this question. Of the total number of respondents,
58.6% (85) indicated they did not smoke, 24.1% (35) responded as smokers and 17.2%
(25) did not respond either as smokers or non-smokers. Range of employment was from
as recent as four months to 39 years. The median length of employment was 13 years.
The mean length of employment of all respondents was 14.5430 years. Standard
deviation from the mean was 10.7842. Two respondents did not answer this question.

PARTICIPATION IN ON-SITE STRETCHING PROGRAM 62
Figure I. Frequency of respondents reporting the number of years of employment
with the company.
Age group was indicated in a range group. The most frequently occurring age
group was between the ages of 40 and 50 years of age. All respondents provided an
answer for the demographic grouping of age.
Figure I. Length of Time with Employer
41
26
1817
13
9
16
3
0
5
10
15
20
25
30
35
40
45
0 - 5 6 - 10 11 - 15 16 - 20 21 - 25 26 - 30 31 - 35 Over 35
Number of Years
Fre
quency

PARTICIPATION IN ON-SITE STRETCHING PROGRAM 63
Table I.
Age GroupAge 18-25 10.3% (15)
Age 29-39 26.9% (39)
Age 40-50 36.6% (53)
Age 51-61 26.2% (38)
Age 62 or over
Self-Perception of Health and Discomfort
Data for males and females were calculated as the percent average of the total
males and total females. Of the 105 male respondents, 31.4% (33) reported to be in
excellent health, 37.1% (39) reported to be in good health, 26.7% (28) reported to be in
average health and 2.8% (3) reported to be in poor health. Of the 38 female
respondents, 34.2% (13) reported to be in excellent health, 23.7% (9) reported to be in
good health, 34.2% (13) reported to be in average health and 5.2% (2) reported to be in
poor health. There were five respondents that did not answer this question.

PARTICIPATION IN ON-SITE STRETCHING PROGRAM 64
Figure II. Frequency of general health rating.
Survey respondents ranked on a scale from 1 to 10 (10 being the greatest) the
level of importance exercise was to them as individuals. Median response was 7. The
mode was 5 and the mean rating of importance of exercise at 6.2074. Standard deviation
was 2.9702. Ten of the respondents chose not to answer this question. There were 135
of the total respondents that provided an answer to this question.
Figure II. Perceived General Health Rating
4648
41
5
0
10
20
30
40
50
60
Exellent Good Average Poor
Rating
Fre
quen
cy

PARTICIPATION IN ON-SITE STRETCHING PROGRAM 65
Figure III. Frequency of ranking of perceived level of importance of exercise on
a scale of one to ten, ten being the greatest level of importance.
Data was analyzed using frequency calculation for the report of pain experienced
by each of the respondents that answered these questions. Responses varied by injury
type and body part. Frequency was also used to calculate the level of pain experienced
per body part, as indicated in Table II, Table III, and Table IV. There was a total of 69
responses to the discomfort experienced in the neck, 76 did not answer this question. For
the question of discomfort experienced in the elbow or forearm area, there were 45 out of
the 145 total respondents answering the question. One hundred people did not provide an
answer for this section. Responses to the question of discomfort in the wrist and hand
area were 59 of the 145 total respondents. Eighty-six people did not provide an answer
for the question of wrist or hand discomfort. There were 73 people responding to the
question about discomfort in the back region. Seventy-two people did not provide an
answer for this question. Twenty-four people provided an answer to the question about
the experience of discomfort in the hip area. There were 121 people that did not provide
Figure III. Perceived Level of Importance of Excercise
4
14
1
65
28
9
11
26
5
26
0
5
10
15
20
25
30
0 1 2 3 4 5 6 7 8 9 10
Ranking
Fre
qu
en
cy

PARTICIPATION IN ON-SITE STRETCHING PROGRAM 66
an answer to this question. Thirty-seven people provided an answer to the question about
discomfort experience in the knee area. There were 108 people that did not provide an
answer to the question about discomfort of the knee. Forty-five people provided an
answer to the question about the experience of discomfort in the feet. There were 100
people that did not provide an answer to this question.
Table II. Lower Level DiscomfortN = NumbnessP = Pins & NeedlesA = AchingS = StabbingX = No Discomfort
Neverexperiencediscomfortwith work
Rarelyexperiencediscomfortwith work
Discomfortdoes notinterfere withmy work
Total
NECK /SHOULDER 1 9 19 29
ELBOW/ FOREARM 2 9 12 23
WRIST/ HAND 1 12 11 24
MID/ LOW BACK 2 9 13 24
HIP 0 8 5 13
KNEE 0 8 10 18
ANKLE/ FOOT 2 8 10 20

PARTICIPATION IN ON-SITE STRETCHING PROGRAM 67
Table III. Higher Level DiscomfortN = NumbnessP = Pins & NeedlesA = AchingS = StabbingX = No Discomfort
I need to stop worksometimes due todiscomfort
I have missedwork days dueto discomfort
Total
NECK /SHOULDER 35 5 40
ELBOW/ FOREARM 18 4 22
WRIST/ HAND 30 5 35
MID/ LOW BACK 35 14 49
HIP 8 3 11
KNEE 16 3 19
ANKLE/ FOOT 20 5 25

PARTICIPATION IN ON-SITE STRETCHING PROGRAM 68
Table IV. Intensity of DiscomfortN = NumbnessP = Pins & NeedlesA = AchingS = StabbingX = No Discomfort
Of the responses,number that were“Aching Only”
Of theresponses,number thatwere“Stabbing/P&N/Numbness”
NECK /SHOULDER 50 19
ELBOW/ FOREARM 28 32
WRIST/ HAND 28 31
MID/ LOW BACK 53 20
HIP 16 8
KNEE 26 11
ANKLE/ FOOT 35 10
The respondents that reported the discomfort was a result of a work related injury
was 55.2% (80). Nineteen point three percent (28) of the respondents indicated that the
discomfort they experienced was not the result of a work- related injury. There was
25.5% (37) of the total respondents that did not provide an answer to this question.
The respondents that indicated the injury had been reported to a supervisor was
42.1% (61). The respondents that indicated the injury had not been reported to a
supervisor was 46.9% (68). Eleven- percent (16) of the total respondents did not provide
an answer to this question. The relationship between the experience of a work injury and
the work injury being reported to a supervisor was -.23562.

PARTICIPATION IN ON-SITE STRETCHING PROGRAM 69
Forty-four point one percent (64) of the respondents indicated that the discomfort
they had experienced did not interfere with daily activities, such as eating, sleeping,
sports and housework. Forty-two point eight percent (62) indicated that the discomfort
they had experienced did interfere with their daily activities. There was 13.1% (19) of
the total respondents that did not provide an answer to this question.
Figure IV. Percentages of respondents experiencing discomfort at various times
of day.
The time of day when discomfort was most likely to be experienced was
measured. Excluding 38.6% (56) of the respondents who did not answer this question,
26.9% (39) experienced most discomfort during work. In second place, 13.8%
(20) experienced discomfort after work. The experience of discomfort before work, after
and during sleeping were experienced equally at 4.1% (6) each.
Figure IV. Time of Day Discomfort Experienced
50%
26%
8%
8% 8%
Before Work
During Work
After Work
After Sleeping
During Sleep

PARTICIPATION IN ON-SITE STRETCHING PROGRAM 70
Of the discomfort experienced, 17.9%(26) had such discomfort for one year or
less. Some respondents were not able to accurately state just how long they had been
experiencing discomfort and used terminology such as “a long time”11.7 % (17) or
“unsure” 7.6%(11). There were 39.3% (57) responses missing for this question. Standard
deviation between categories was 2.2685.
Figure V. Frequency of respondents reporting duration of discomfort in terms of years.
Intensity level of discomfort experienced was also measured on a pain scale of 1
to 10, ten indicating the greatest intensity level of pain experienced. A total of 57.9%
(84) respondents answered this question. Of those, the mean level of pain reported was
5.2024, the mode and median were both 5, standard deviation was at 2.1328.
Figure V. Duration of Discomfort
1
26
8
12
9
4
17
11
0
5
10
15
20
25
30
None 1 Year orLess
2 - 3 Years 4 - 5 Years 6 - 10Years
11 or MoreYears
"LongTime"
"Unsure"
Length of Discomfort Experience
Fre
qe
ncy

PARTICIPATION IN ON-SITE STRETCHING PROGRAM 71
Figure VI. Frequency of rating of perceived pain intensity on a scale of one to ten,
ten being the greatest level of importance.
Of the total respondents, 59.3% (86) reported that they believed that an on-site
stretching program would help to reduce the discomfort experienced, 24.1% (35)
respondents reported that they did not believe that an on-site stretching program would
help to reduce the discomfort experienced. There were 25% (17.2) respondents that did
not provide an answer to this question.
Respondent Perception of Ergonomics
Respondents were asked a series of questions that related to their perception of
ergonomics at the work site. The responses to the questions were calculated by
frequency.
Figure VI. Pain Scale
1 1
6
9
13
24
8 89
1
4
0
5
10
15
20
25
30
0 1 2 3 4 5 6 7 8 9 10
Ranking
Fre
qu
ency

PARTICIPATION IN ON-SITE STRETCHING PROGRAM 72
Table V. Perception of Ergonomics1 2 3 4
Is your job: Stressful Average LittleStress
Unsure
Mean = 1.89 SD = .6693 24.1% (35) 60% (87) 8.3% (12) 2.8% (4)
Does your job involve repetitive motion: High Medium Low Unsure
Mean = 1.69 SD = .8437 51.7% (75) 27.6% (40) 15.9% (23) 2.8% (4)
Is the physical demand of your job: High Medium Low Unsure
Mean = 1.867 SD = .6944 29% (42) 55.9% (81) 11.7% (17) 2.1% (3)
Overall, does your workstation fit you? Yes No Not Apply Unsure
Mean = 1.73 SD = 1.142 64.8% (94) 11% (16) 6.9% (10) 15.9%
(23)
Is the worktable at the right height for you? Yes No Not Apply Unsure
Mean = 1.92 SD =1.045 48.3% (70) 17.9% (26) 22.8% (33) 9% (13)
Is there proper lighting at your work station? Yes No Not Apply Unsure
Mean = 1.54 SD = .86 63.4% (92) 21.4% (31) 7.6% (11) 5.5% (3)
Do you have enough space to perform you
duties?
Yes No Not Apply Unsure
Mean = 1.48 SD = .69 59.3% (86) 31% (45) 4.8% (7) 2.1% (3)
The calculations of mean and SD for this table exclude responses of “not apply” and
“unsure.” Although these categories are present in the chart, these data are considered to
be missing data and a definitive answer is not provided by these responses.
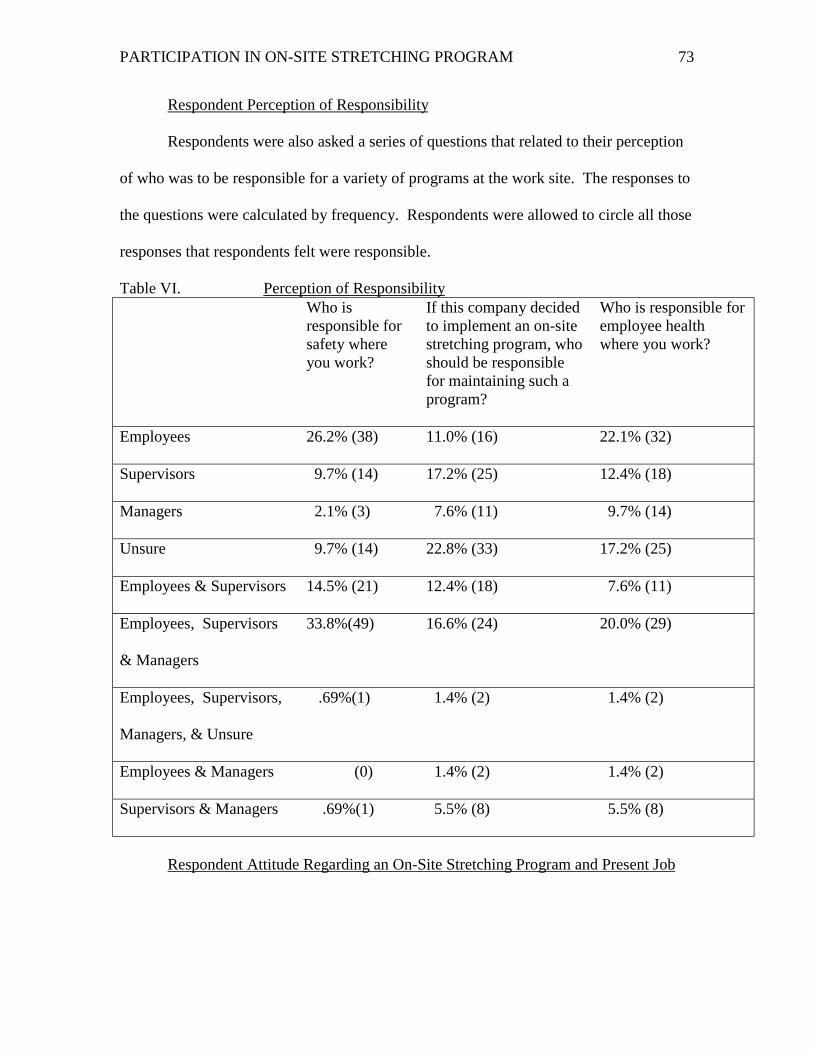
PARTICIPATION IN ON-SITE STRETCHING PROGRAM 73
Respondent Perception of Responsibility
Respondents were also asked a series of questions that related to their perception
of who was to be responsible for a variety of programs at the work site. The responses to
the questions were calculated by frequency. Respondents were allowed to circle all those
responses that respondents felt were responsible.
Table VI. Perception of ResponsibilityWho isresponsible forsafety whereyou work?
If this company decidedto implement an on-sitestretching program, whoshould be responsiblefor maintaining such aprogram?
Who is responsible foremployee healthwhere you work?
Employees 26.2% (38) 11.0% (16) 22.1% (32)
Supervisors 9.7% (14) 17.2% (25) 12.4% (18)
Managers 2.1% (3) 7.6% (11) 9.7% (14)
Unsure 9.7% (14) 22.8% (33) 17.2% (25)
Employees & Supervisors 14.5% (21) 12.4% (18) 7.6% (11)
Employees, Supervisors
& Managers
33.8%(49) 16.6% (24) 20.0% (29)
Employees, Supervisors,
Managers, & Unsure
.69%(1) 1.4% (2) 1.4% (2)
Employees & Managers (0) 1.4% (2) 1.4% (2)
Supervisors & Managers .69%(1) 5.5% (8) 5.5% (8)
Respondent Attitude Regarding an On-Site Stretching Program and Present Job

PARTICIPATION IN ON-SITE STRETCHING PROGRAM 74
Respondents were also asked two questions pertaining to their willingness to
participate in an on-site stretching program. They were also asked to rate their current
level of job satisfaction. The responses to the questions were calculated by frequency.
Table VII. Willingness to Participate and Job Satisfaction1 2 3 4
If your employer required you to stretch at the
work site daily, would you
ParticipateWillingly
FeelAwkward
Not Do It Unsure
52.4% (76) 15.9% (23) 7.6% (11) 15.2% (22)
Job satisfaction level at present: VerySatisfied
Neutral NotSatisfied
Unsure
Mean = 2.1304 SD = 1.2546 21.4% (31) 56.6% (82) 11% (16) 4.1% (6)
Correlation Between Variables
In order to determine influence variables on both the respondents’ opinion about
an on-site stretching program helping to reduce discomfort experienced by self and co-
workers the following correlation coefficients were examined with the level of
significance indicated within the chart below. Also, to determine influence variables on
the respondents’ willingness to participate in a daily stretch routine at the workplace, the
following correlation coefficients were examined with the level of significance indicated
within Table VIII.

PARTICIPATION IN ON-SITE STRETCHING PROGRAM 75
Table VIII. Correlation CoefficientsVariable Willingness to
Participate inOn-Site DailyStretchingProgram
Opinion AboutOn-Site StretchingProgram andReduction ofDiscomfortExperienced
Gender -0.101255 -0.0754
Non-Smoker/Smoker -0.1798542 -0.041204
Age Group 0.094354 0.113625
Self General Health Rating 0.036943 0.083231
Self Ranking Importance of PersonalExercise
-0.241046 -0.341593
Length of Employment with CurrentEmployer
0.160143 0.294708
Non-Work/Work Injury 0.094705 0.130048
Injury Reported to Supervisor 0.129488 0.081474
Injury Interference with DailyActivities
0.029072 0.075342
Duration of Discomfort Experience 0.166089 0.236663
Pain Scale -0.084165 -0.040179
Time of Day Discomfort isExperienced
-0.169558 -0.116536

PARTICIPATION IN ON-SITE STRETCHING PROGRAM 76
Table VIII. Correlation Coefficients (continued)Variable Willingness to
Participate inOn-Site DailyStretchingProgram
Opinion About On-SiteStretching Program andReduction ofDiscomfort Experienced
Opinion About On-Site StretchingProgram and Reduction ofDiscomfort Experienced
0.514359 No data calculated
Perception of Job Stress Level 0.001159 0.075382
Perception of Job InvolvingRepetitive Motion
0.051383 0.062621
Perception of Physical Demand ofJob
-0.070046 0.011346
Perception of Work Station Fit (asapplicable)
0.001978 0.076052
Perception of Appropriate TableHeight (as applicable)
0.063295 -0.048036
Perception of Proper Lighting (asapplicable)
0.002744 -0.092095
Perception of Space Available toPerform Job Duties (as applicable)
-0.052569 0.038788
Perception of Responsibility forSafety in the Workplace
0.11325 -0.015138
Perception of Responsibility forMaintaining an On-Site StretchingProgram in the Workplace
0.0289175 0.0322986
Perception of Responsibility forEmployee Health in the Workplace
0.106926 0.029356
Willingness to Participate in On-Site Daily Stretching Program
No datacalculated
0.514359
Level of Job Satisfaction 0.208759 0.255442

PARTICIPATION IN ON-SITE STRETCHING PROGRAM 77
Willingness Differences Between Workers and Managers
Of the managers, 77.8% indicated that they would be willing to participate in an
on-site stretching program. None of the managers indicated that they would not be
willing to participate in an on-site stretching program. Comparatively, 50.7% of the
workers indicated that they would be willing to participate in an on-site stretching
program, and 8% were not willing to participate.
Perceived Motivators
Respondents were asked to rank order items they thought would serve to motivate
their participation in an on-site stretching program. Responses varied by choice item.
The number of responses for the feel healthier category was 53 with 88 missing
responses. The number of responses for the job easier to perform category was 44 with
101 missing responses. The number of responses in the category of everyone
participating was 46 with 99 missing responses. The number of responses for the money
and prizes category was 42 with 103 missing responses. The number of responses for the
not take too much time category was 36 with 109 missing responses. The number of
responses for the do on company time category was 57 with 88 missing responses. The
number of responses for the category other (with open-ended answer) was 4 with 141
missing responses. Frequencies of responses are indicated in Table IX.

PARTICIPATION IN ON-SITE STRETCHING PROGRAM 78
Table IX. Rank Ordered Motivators: Frequencies of Total RespondentsRank Feel
HealthierJob Easier Everyone
ParticipateMoney/Prizes
Not TakeMuchTime
Do OnCompany
Time
Other
1 20.0% (29) 4.1% (6) 5.5% (8) 10.3% (15) 0 17.2% (25) 1.4% (2)
2 6.2% (9) 7.6% (11) 2.8% (4) .7% (1) 3.4% (5) 9.7% (14) 0
3 5.5% (8) 7.6% (11) 7.6% (11) 2.8% (4) 2.8% (4) 2.8% (4) 0
4 4.1 % (6) 4.8% (7) 6.9% (10) 1.4% (2) 6.2% (9) 2.8% (4) 0
5 0 4.1% (6) 6.9% (10) 5.5% (8) 6.2% (9) 3.4% (5) 0
6 .7% (1) 1.4% (2) 1.4% (2) 8.3% (12) 6.2% (9) 3.4% (5) .7% (1)
7 0 .7% (1) .7% (1) 0 0 0 .7% (1)
N 53 44 46 42 36 57 4
Mean 7.5714 6.2857 6.5714 6.0000 5.1429 8.1429 .5714
SD 10.1793 3.9036 4.1576 5.8023 4.0591 8.5524 .7898
Perceived Barriers
Respondents were asked to rank order items they thought were a barrier to their
participation in a personal exercise program. A total of 143 responses were made for this
rank-order selection. There were two of the total respondents that did not provide an
answer to this rank-order selection question. Frequencies of responses are indicated in
Table X.

PARTICIPATION IN ON-SITE STRETCHING PROGRAM 79
Table X. Rank Ordered Barriers: Frequencies of Total RespondentsRank Time Location Other
ResponsibilitiesMotivation Level Fatigue
1 20.0% (29) 9.0% (13) 13.8% (20) 19.3% (28) 4.1% (6)
2 7.6% (11) 13.8% (20) 4.8% (7) 3.4% (5) 2.8% (4)
3 9.7% (14) 4.8% (7) 6.2% (9) 5.5% (8) 3.4% (5)
4 1.4% (2) 6.2% (9) 8.3% (12) 4.8% (7) 9.0% (13)
5 1.4% (2) 1.4% (2) 4.8% (7) 6.9% (10) 14.5% (21)
N 58 51 55 58 49
Mean 11.6000 10.2000 11.0000 11.6000 9.8000
SD 11.1041 6.7602 5.4314 9.3434 7.1903
Synopsis
Demographic information was examined that included the gender, age and
smoking status of the respondents. A series of questions were also presented to measure
the health status and perception of health of the respondents. This study also included a
review of the respondents’ perception and opinion about the ergonomics of the work
environment and perception of responsibility for safety and health in the work
environment. Respondents were asked to respond in regard to their opinion of the impact
an on-site stretching program would have on discomfort levels experienced in the
company by the worker population. Willingness to participate in such a program was
also measured. This study also including the ranking of perceived motivators to program
participation and also a ranking of the perception of barriers to the independent
participation in a personal exercise program.

PARTICIPATION IN ON-SITE STRETCHING PROGRAM 80
CHAPTER V
Respondent Demographics
There were more males (105) than females (38) responding to this case study
survey. The actual human resource record of the division of males and females in the
company was not made available. However, through observation, it would be safe to
conclude that the male gender did make up the majority of the workforce in this
company.
Although age was not statistically significant with the research question variable
of willingness to participate in a stretching program nor was age statistically significant
with the research variable of worker opinion on a stretching program aiding in the
reduction of discomfort experienced, other consistencies were found. As the Bureau of
Labor Statistics found, the population of workers between the ages of 25 and 44 made up
57 percent of the majority of work injuries
(www.bls.gov/special.requests/ocwc/oshwc/osh/case/osn008.pdf [July 25, 1999]). In this
case study, the largest concentrations of age groups was age 29 to 39 (26.9%) and age 40
to 50 (36.6%). These two age groups made up 63.4% of the total respondents, compared
to the other age groups that constituted only 36.5% of the total respondents. Perhaps one
of the reasons why the age group of 25 to 44 makes up 57 percent of the majority of work
injuries is because this age range makes up the majority of the worker population.
Further study could be done to determine if this is a national trend or just unique to this
case study.

PARTICIPATION IN ON-SITE STRETCHING PROGRAM 81
A fair number (41) of the respondents indicated they were within their first five
years of employment with the company. This may account for some of the 49.6% (62)
strain injuries. A 1997 Bureau of Labor Statistics survey indicated that 75% of workers
who had been injured had one year or less time on the job at the time of injury
(www.bls.gov/special.requests/ocwc/oshwc/osh/case/osn008.pdf [July 25, 1999]).
Perception of Health
A fair number (33.1%) of the respondents believed themselves to be in good
health. Good health was defined as taking one or two personal sick days per year.
Excellent health was defined as taking no personal sick days per year. More than two
sick days per year equated to average or poor health. Only 31.7% of the respondents fell
in that category, whereas 64.8% of the respondents believed themselves to be in good to
excellent health. Perhaps this may be one reason for the 52.4% majority of workers
being willing to participate in an on-site stretching program. As found by Weitzel (1989)
and Desmond, et al. (1993), the better a person believes their health to be the more likely
they will work to maintain it. This may also be the reason why the highest-ranking
motivator for participation in an on-site stretching program was to feel healthier (20%).
There was not a significantly high ranking of importance of exercise according to
the respondents’ opinion. On a scale of one to ten, ten being the greatest, the mean
response was a ranking of 6.2074. The largest response regarding the importance of
exercise was 19.3% of respondents. These respondents ranked the importance of exercise
to them personally as a level five on a scale of one to ten. This may explain why
motivation level and time were the highest ranking of the rank-ordered barriers to
participation in a personal exercise program. If exercise is not personally important, time

PARTICIPATION IN ON-SITE STRETCHING PROGRAM 82
will not be found or made to exercise, and motivation to participate will not be present.
This is consistent with the finding of Alexy that blue-collar workers engage in more
health-risking behaviors, specifically physical inactivity outside the work duties (1990).
This is also consistent with the Center for Disease Control survey and by Federal health
officials that contemporary society is become more physically inactive (Key, 1997).
Discomfort Experience
The most frequent response (26.9%) to the question of the time of day when
discomfort was experienced was during work. The second (13.8%) most frequent
response was after work. It would be interesting to note if these reports change after an
on-site stretching program is implemented in which workers stretch prior to engaging in
work activity and also throughout the workday. A follow up study is recommended after
this company implements an on-site stretching program to discover any changes in the
time of day discomfort is experienced as a result of the on-site stretching activities.
Respondents experience the majority of their discomfort in the mid/low back (73),
neck/shoulders (69), and wrist/hand (59) according to frequency measures. Of the total
indications of discomfort, both the lower levels of discomfort and the higher levels of
discomfort involve the fore mentioned body parts. Neck/shoulder discomfort includes
more of the aching type of pain sensation (50) as opposed to more intense levels of pain
such as the sensation of pins and needles, stabbing, or numbness (19) according to
frequency measures. This is true also for mid/low back discomfort (53 and 20
respectively). Although wrist/hand discomfort ranks third in the top three locations of
discomfort, higher intensity of pain is experienced (31 and 28 respectively). Respondents
indicated a higher frequency of duration of the experience of pain within the past year.

PARTICIPATION IN ON-SITE STRETCHING PROGRAM 83
These reports on location and duration of discomfort are consistent with the company’s
record of injuries.
There was no statistical significance found that would indicate that the experience
of a work injury would also involve the reporting of the injury to a supervisor. Of the
55.2% (80) respondents that indicated they had experienced a work injury, only 42.1%
(61) indicated that they reported the discomfort to a supervisor. Nineteen (23.7%) of
those experiencing a work related injury did not report the injury to the supervisor. The
procedure for reporting injuries in the company is to report any and all injuries or pain to
a supervisor at the onset of injury or pain. This means that sixty-one of 145 workers
reported a work related injury while an additional 19 workers did not report a work
related injury or 80 of 145. That means that 65 workers did not have an injury that was
work related. This compares with the 68 of 80 workers, or 85% that did not report work
injury related discomfort to a supervisor.
Variables that Correlate with Belief in Stretching Program to Reduce Discomfort
Variables that were statistically significant at or below p= .05 level included
perception of space available to perform job (p= .0388), perception of responsibility for
maintaining an on-site stretching program (p= .0323) and perception of responsibility for
employee health in the workplace (p= .0293). The perception of having ample space
available to perform work tasks significantly correlated with the belief that an on-site
stretching program would help to reduce discomfort experienced. For both the
perception of responsibility for maintaining an on-site stretching program and for
employee health correlated on the level of employee involvement. Employee
responsibility for maintaining these programs correlated with the belief that an on-site

PARTICIPATION IN ON-SITE STRETCHING PROGRAM 84
stretching program would help to reduce discomfort experienced. This data is consistent
with the literature that indicates that employee empowerment and involvement leads to
higher success rates in participation and acceptance of a new exercise program.
However, a limitation of this case study is in the measurement of the perception
of responsibility. The items of respondent selection should have been forced choice.
Respondents should have been allowed to select only one of the options, not as many as
they felt applied.
Belief that an on-site stretching program would help to reduce discomfort
experienced did significantly correlate with willingness to participate in an on-site
stretching program. This finding is consistent with Sloan and Gruman’s Health Belief
Model (1988). The Health Belief Model contends that people are more likely to accept
health behaviors that are consistent with their current health beliefs. If a worker believes
that an on-site stretching program will help to reduce discomfort experienced, that worker
will be more likely to be willing to participate in such a program.
All other variables including job satisfaction level, repetitive motion and
ergonomics had no statistical significance on the belief that an on-site stretching program
would help to reduce discomfort experienced. According to the literature, these variables
had an influence on the experience of musculoskeletal injuries.
Variables that Correlate with Willingness to Participate in an On-Site Stretching Program
Variables that were statistically significant at or below p= .05 level included job
satisfaction level (p= .05), perception of job involving repetitive motion (p= .0514), and
perception of responsibility for maintaining an on-site stretching program (p= .0289).

PARTICIPATION IN ON-SITE STRETCHING PROGRAM 85
Variables that were statistically significant at or below p= .01 level was the perception of
job stress (p= .0012).
Workers who believed their job to involve high repetitive motion were more
likely to be willing to participate in an on-site stretching program. Also, the rating of
high-level job stress correlated with the willingness to participate in an on-site stretching
program. This is consistent with the findings of Linton and Warg that employees will be
more likely to change their behaviors if they believe there is a connection between the
cause of injury or illness and their behaviors (1993). The findings of this case study is
also consistent with the findings of Davis, et al. that found job stress and anxiety to show
promise as predictors to participation (1987).
Employee responsibility for maintaining these programs correlated with
willingness to participate in an on-site stretching program. This data is consistent with
the literature that indicates that employee empowerment and involvement leads to higher
success rates in participation and acceptance of a new exercise program. As suggested by
Sloan and Gruman, one method of the successful implementation of a health program is
to involve employees in the decision-making process (1988). It seems as though the
workers in this company would agree.
However, once again, a limitation of this case study is in the measurement of the
perception of responsibility. The items of respondent selection should have been forced
choice. Respondents should have been allowed to select only one of the options, not as
many as they felt applied.
The more satisfied a worker was with the job, the more willing the worker was to
be willing to participate in an on-site stretching program. This is somewhat consistent

PARTICIPATION IN ON-SITE STRETCHING PROGRAM 86
with the findings of Linton and Warg (1993). Linton and Warg (1993) who found that
dissatisfied blue-collar workers believed prevention measures should be taken at work.
However blue-collar workers were reluctant to independently initiate preventative
measures to reducing musculoskeletal disorders. In this case study, there was no
significant correlation between high satisfaction with job and the belief in an on-site
stretching program to reduce discomfort experienced. The correlation of willingness and
employee maintenance of an on-site stretching program would lead to the belief that
because the workers were generally satisfied with the jobs, they were more willing to
become involved in program maintenance.
Although 44.1% of the respondents indicated that the experience of discomfort
did not interfere with their daily activities, the interference of daily activities proved to be
a statistically significant indicator of willingness to participate. Kelly et al. (1991) found
that if an individual perceives that he or she is at risk in a given lifestyle habit, the
individual is more likely to believe he or she would benefit from changing that lifestyle
habit. The interruption of daily activity due to the experience of discomfort seems to be
an indicator that something needs to be done to improve the condition of the person
experiencing discomfort. Perhaps this personal observation by the respondents explains
some of the reason for their expressed willingness to participate in an on-site stretching
program that might change their discomfort experience.
In regard to measuring the correlation of variables, another limitation of this case
study was in the survey design. The manner in which survey selections were presented
was not as consistent across the survey. This layout lead to some interpretation of
correlation data.

PARTICIPATION IN ON-SITE STRETCHING PROGRAM 87
Willingness Differences Between Workers and Managers
Of the managers, proportionately 77.8% (7) indicated that they would be willing
to participate in an on-site stretching program. Two (22.2%) of the managers indicated
that they would feel awkward participating in an on-site stretching program. None of the
managers indicated that they would not be willing to participate in an on-site stretching
program. Comparatively, proportionately 50.7% (69) of the workers indicated that they
would be willing to participate in an on-site stretching program, 15.4% (21) of the
workers indicated that they would feel awkward participating in an on-site stretching
program, and 8% (11) were not willing to participate. The remaining 24.2% (35) of the
total respondents did not answer this question.
It is important for the success of a new program to have strong leadership
agreement. It is equally important to have worker willingness. It is believed that a
significant part in the successful implementation of an on-site stretching program is the
willingness of management and of the workers. The responses of the managers and of
the workers seem to indicate a willingness to participate in an on-site stretching program.
Although 15.9% of the total respondents would feel awkward, there are still more total
respondents willing to participate (52.5%) than those respondents who would just not do
it (7.6%).
Discussion of Motivators
Topf (1999) discussed that in developing a successful safety program, safety must
become a personal value that all employees bring to the work place and maintain away
from the work place. Developing the personal value serves as a motivator to maintain
safe practices at work and at home. The same concept could be applied to an on-site

PARTICIPATION IN ON-SITE STRETCHING PROGRAM 88
health or stretching program. The workers in this company indicated that feeling
healthier would motivate them to participate in an on-site stretching program. Contrary
to stereotypical beliefs that people only do things for monetary reward, Topf (1999)
found well being to be equal to winning a prize, in regard to motivators that facilitate
participation in safety programs. Feeling healthier seems to be the key motivator for
participation in an on-site stretching program in this company, according to frequency
measures (20%).
Another limitation of this case study is that accurate comparison of management
and workers could not be examined in relation to perceived motivators or perceived
barriers due to the small number of managers (9) as to workers (136).
Discussion of Barriers
Although the literature primarily discussed the barriers that women perceived to
be limiting their participation in a personal exercise program, the same barriers seemed to
be perceived in this company that is made up of a male majority. The study by Mason
(1998) found that the inability to stick to a routine and not having enough time were the
top barriers indicated by the women polled for the study. Interestingly, the top two rank-
ordered barriers in this case study were also not having enough time (20%) and
motivation level (19.3%), as reported by respondents.
Responses to Open-ended Survey Questions
Two open-ended questions were included on the survey. One question asked
respondent’s suggestions for improving how the job is performed, or improvements to the
workstation or how the job could be made easier to perform. Responses included:

PARTICIPATION IN ON-SITE STRETCHING PROGRAM 89
1. Reduce number of days in the workweek, or add employees, or increase wage
(8)
2. Drinks should be allowed on the floor (3)
3. Improve parts/equipment (8)
4. Reduce amount of lifting/bending/push-pull (8)
5. Improve work space/location of materials (12)
6. Additional breaks/stretch-time/exercise (9)
7. Cooperation/change of personnel (7)
8. Job rotation (1)
9. Improve/add anti-fatigue mats or not stand so much (7)
10. Reduce repetitive motions (4)
11. Improve lighting (4)
12. Workstation more ergonomic (5)
13. Working at the correct height/height of equipment (4)
14. Reduce stress (2)
15. Improve air/ventilation (2)
Although ergonomic issues such as work space, job design, environment and
repetitiveness were not significant influences on willingness to participate in an on-site
stretching program, these factors did seem to be important to the workers based on their
responses.
The second open-ended question asked respondent’s additional comments they
wished to make. Comments included:
1. “Waste of time.”

PARTICIPATION IN ON-SITE STRETCHING PROGRAM 90
2. “I do a lot of exercise at home.”
3. “Have an on-site gym, or look for group rates at (fitness clubs).”
4. “Forget it.”
5. “Some people may get injured from stretching!”
6. I think it’s a great idea.”
7. “Cold weather—arthritis.”
8. “I do exercise.”
9. “Do it.”
10. “Have the VPs come do it (stretch) with us.”
These comments seem to be consistent with the number of respondents that indicated a
willingness to participate in an on-site stretching program and those respondents that
were not.
Conclusions
One curiosity is the influence of experimenter effect on this group. The design of
the survey administered included a number of questions about health and exercise. The
unanswered question is the question of whether or not, the nature of the survey questions
led to any change in willingness to participate in an on-site stretching program.
It is believed this company will be successful in the implementation of an on-site
stretching program. The majority of the workers seem to support the theory that an on-
site stretching program will help them to maintain their existing good health or to
improve the experience of discomfort both during work and after work. Having the
majority of the managers being willing to participate in an on-site stretching program will
also help to maintain and facilitate the motivation of the workers.

PARTICIPATION IN ON-SITE STRETCHING PROGRAM 91
As the workers begin or continue to feel healthier as a result of their participation
in the program, they may be more likely to continue the program. The workers indicated
that feeling healthier would serve as their number one ranking motivator. It is believed
that it is important that the company allow time for the stretching to be performed at the
work site. The barriers sited were lack of time and motivation level. By participating in
a group, time is allocated and also by participating in stretching as a group, a support
group of sorts is formed. This support group concept has helped a number of people
maintain motivation for changing health habits. Perhaps the work environment will serve
as a similar support.

PARTICIPATION IN ON-SITE STRETCHING PROGRAM 92
SELECTED REFERENCES
Alexy, B. (1990). Workplace health promotion and the blue-collar worker. American
Association of Occupational Health Nursing 1, 38 (1), 12-16.
Armstrong, T.J., Buckle, P., Fine, L.J., Hagberg, M., Jonsson, B., Kilbom, A., Kuorinka,
I. A., Silverstein, B. A., Sjogaard, G., & Viikari-Juntura, E. R. (1993). A
conceptual model for work-related neck and upper-limb musculoskeletal
disorders. Scandinavian Journal of Work and Environmental Health, 19 (73). 73-
84.
Battié, M.C & Bigos, S.J. (1991). Industrial back pain complaints: A broader
perspective. Orthopedic Clinics of North America, 22 (2). 273-282.
Bigos, S.J. & Battié, M.C. (1987). Acute care to prevent back disability. Clinical
Orthopedics and Related Research, 221. 121-130.
Bigos, S.J., Spengler, D. M., Martin, N. A., Aeh, J., Fisher, L., Nachemson, A., & Wang,
M.H. (1986) Back injuries in industry: A retrospective study II Injury factors.
Spine, 11 (3). 246-251.
Bigos, S.J., Spengler, D. M., Martin, N. A., Zeh, J., Fisher, L., & Nachemson, A. (1986)
Back injuries in industry: A retrospective study III Employee related factors.
Spine, 11 (3). 252-256.
Brandon, J.E. (1985). Health promotion and wellness in rehabilitation services. Journal
of Rehabilitation, October/November/December. 54-57.
Brogmus, G. E., Sorock, G. S., & Webster, B. S. (1996). Recent trends in work-related
cumulative trauma disorders of the upper extremities in the United States: An
evaluation of possible reasons. Journal of Occupational and Environmental

PARTICIPATION IN ON-SITE STRETCHING PROGRAM 93
Medicine, 38 (4). 401-411.
Brown, J. R. (1975). Factors contributing to the development of low back pain in
industrial workers. American Industrial Hygiene Association Journal, 36. 26-31.
Bureau of Labor Statistics. (1997). Lost work time injuries and illnesses: Characteristics
and resulting time away from work, 1997. Retrieved July 25, 1999 from the
World Wide Web:
http://www.bls.gov/special.requests/ocwc/oshwc/osh/case/osn008.pdf [July
25,1999]).
Bureau of Labor Statistics. (1996). Occupational injures and illnesses by selected
categories. Retrieved April 3, 1999 from the World Wide Web:
http://www.bls.gov/new.release/osh2.toc.html
Cady, C.D., Thomas, P.C., & Karwasky, R. J. (1985). Program for increasing health and
physical fitness of fire fighters. Journal of Occupational Medicine, 27 (2). 110-
114.
Chen, I. & Griffin, K. (1993, Nov/Dec). Leisure time. Health, 7 (7). 16.
Collins, N.C. (December 1997). Is work getting painful? Black Enterprise, 28 (5). 146-
147.
Colman A. (1997, September). Fatter, not fitter. Youth Studies, 16 (3). 8.
Conte, L.E. & Banerjee, T. (1993). The rehabilitation of persons with low back pain.
Journal of Rehabilitation. April/May/June. 18-22.
Davis, K.E., Jackson, K.L., Kronenfeld, J.J. & Blair, S.N. (1987). Determinants of
participation in work site health promotion activities. Health Education Quarterly
14 (2), 195-205.

PARTICIPATION IN ON-SITE STRETCHING PROGRAM 94
Desmond, A.W., Conrad, K.M., Montgomery, A., & Simon, K.A. (1993). Factors
associated with male workers’ engagement in physical activity: White collar vs.
blue collar workers. American Association of Occupational Health Nursing
Journal , 41 (2), 73-83.
Frymoyer, J.W. & Cats-Baril, W.L. (1991). An overview of the incidences and costs of
low back pain. Orthopedic Clinics of North America, 22 (2), 263-271.
Gallup Poll Organization, (1995, April 24). Sore Workers. U.S. News & World Report,
118 (16), 70.
Gauf, M., Ed. (1998). Ergonomics that work: Case studies of companies cutting costs
through ergonomics. LRP Publications, Horsham, PA.
Gottlieb, A., Vandergoot, D., & Lutsky, L. (1991). The role of the rehabilitation
professional in corporate disability management. Journal of Rehabilitation,
April/May/June. 23-28.
Greer, B.G., Jenkins, W.M., & Roberts, R. (1992). Carpal tunnel syndrome: A
challenge for rehabilitation. Journal of Rehabilitation, April/May/June. 43-46.
Hagberg, M., Morgenstern, H., & Kelsh, M. (1992). Impact of occupations and job tasks
on the prevalence of carpal tunnel syndrome. Scandinavian Journal of Work and
Environmental Health, 18. 337-345.
Hanson-Mayer, T.P. (1984). The worker’s disability syndrome. Journal of
Rehabilitation, July/August/September, 50-54.
Hashemi, L., Webster, B. S., & Clancy, E.A. (1998). Trends in disability duration and
cost of workers’ compensation low back pain claims (1988-1996). Journal of
Occupational and Environmental Medicine, 40 (12). 1110-1119.

PARTICIPATION IN ON-SITE STRETCHING PROGRAM 95
Hyytiäinen, K. (1994). Attitudes towards prevention of low back disorders in industry.
Occupational Medicine, 44. 83-86.
James, S., Ed. (Winter 1996). The high cost of low back pain. Issues of Injury, 10 (4).
Retrieved August 6, 1999 from the World Wide Web:
http://www.mcn.com/ioi/1996/lowback.htm
James, S., Ed. (1993). The carpal tunnel. Issues of Injury, 7 (4).
Retrieved August 6, 1999 from the World Wide Web:
http://www.mcn.com/ioi/1993/carpal.htm
Kelly, R.B., Zyzanski, S.J, & Alemagno, S.A. (1991). Prediction of motivation and
behavior change following health promotion: Role of health beliefs, social
support and self-efficacy. Social Science Medicine, 32 (3). 311-320.
Key, S. W., Ed. (1997, May 19). Americans not getting enough physical activity.
Cancer Weekly Plus, 5/19/97. 15-17.
King, A.C., Carl, F., Birkel, L. & Haskell, W.L. (1988). Increasing exercise among blue-
collar employees: The tailoring of work site programs to meet specific needs.
Preventive Medicine, 17. 357-365.
LaCroix, J.M., Powell, J., Lloyd, G.J, Doxey, N.C., Mitson, G. L., & Aldam, C.F. (1990).
Low-back pain: Factors of value in predicting outcome. Spine, 15 (6). 495-499.
Lanes, T.C., Gauron, E.F., Spratt, K.F., Wernimont, T.J., Found, E.M., & Weinstein, J.N.
(1995). Long-term follow-up of patients with chronic back pain treated in a
multidisciplinary rehabilitation program. Spine, 20 (7). 801-806.
Larson, N. (1999, June). Best practices in implementing ergonomics programs. In Larry
Zobel (chair), Ergonomics Symposium Issues & Solutions. Symposium

PARTICIPATION IN ON-SITE STRETCHING PROGRAM 96
conducted at the 3M Company corporate headquarters open media meeting,
Saint Paul, Minnesota.
Linton, S.J. & Warg, L.E. (1993). Attributions (beliefs) and job satisfaction associated
with back pain in an industrial setting. Perceptual and Motor Skills, 76. 51-62.
Magrega, D.J. & Spencer, W.A. (1993). Factors involved in time taken in returning to
work after an industrial injury. Journal of Rehabilitation, April/May/June. 13-17.
Mann, J. Ed. (1995). Red wing shoes’ early warning system, ergonomics that work. CTD
News. Retrieved April 30, 1999 from the World Wide Web:
http://ergoweb.com/Pub/casestudies.html
Mann, J. Ed. (1999, January). Pre-work exercises present limitations, benefits. CTD
News, 8 (1). 11. Retrieved April 30, 1999 from the World Wide Web:
http://ergoweb.com/Pub/casestudies.html
Mason, M. (July/August 1998). Breaking free. Health, 12 (5). 66-71.
Matson, M. (1995). Good news for bad backs. Reader’s Digest, 146 (877). 119-123.
Morgan, P.P., Shephard, R.J, Finucane, R., Schimmelfing, L., & Jazmaji, V. (1984).
Health beliefs and exercise habits in an employee fitness programme. Canadian
Journal of Applied Sport Sciences 9 (2). 87-93.
National Institute for Occupational Safety & Health (1998). Musculoskeletal disorders
(MSDs) and workplace factors. Retrieved August 7, 1999 from the World Wide
Web: http://www.cdc.gov/niosh/ergtxt1.html
National Institute for Occupational Safety & Health (1998). Musculoskeletal disorders
(MSDs) and workplace factors. Retrieved August 7, 1999 from the World Wide
Web: http://www.cdc.gov/niosh/ergtxt5a.html

PARTICIPATION IN ON-SITE STRETCHING PROGRAM 97
Occupational Safety and Health Association (1999). 3M institutes ergonomic program,
reduces injuries. Retrieved August 7, 1999 from the World Wide Web:
http://www.osha-slc.gov/SLTC/ergonomics/3m.html
Occupational Safety and Health Association (1999). Working draft of a proposed
ergonomic standard. Retrieved April 3,1999 from the World Wide Web:
http://www.ergoweb.com/Pub/Osha/ergoreg.html
Polakoff, P.L. (1995). Without action on causes and effects, time fails to heal cumulative
trauma. Occupational Health & Safety, 64 (1). 29-30.
Rizzo, J. A., Abbott, T.A., Berger, M.L. (1998). The labor productivity effects of chronic
backache in the united states. Medical Care, 36 (10). 1471-1488.
Schenck, R.R. (1989). Carpal tunnel syndrome: The new industrial epidemic. American
Association of Occupational Health Nursing Journal, 37 (6). 226-231.
Shephard, R.J. (1999). Do work-site exercise and health programs work? The Physician
and Sportsmedicine Online, February 1999. Retrieved August 24, 1999 from the
World Wide Web:
http://www.physsportsmed.com/issues/1999/02_99/shephard.htm.
Shephard, R.J. & Cox, M. (1980). Some characteristics of participants in an industrial
fitness programme. Canadian Journal of Applied Sports Science, 5. 64-76.
Sloan, R.P. & Gruman, J.C. (1988). Participation in workplace health promotion
programs: the contribution of health and organizational factors. Health
Education Quarterly 15 (3), 269-288.
Snook, S. H. (1978). The design of manual handling tasks. Ergonomics, 21 (2). 963-
985.

PARTICIPATION IN ON-SITE STRETCHING PROGRAM 98
Spengler, D.M., Bigos, S.J. Martin, N.A., Zeh, J., Fisher, L., & Nachemson, A. (1986)
Back injuries in industry: A retrospective study I overview and cost analysis.
Spine, 11 (3). 241-245.
State of Wisconsin Department of Workforce Development (1996). Statistics/research
on workplace injuries. Closed in calendar year 1996. Closed in calendar year
1994-1995. Retrieved April 3, 1999 from the World Wide Web:
http://www.dwd.state.wi.us/wc/.html
Tate, D.G. (1987). The healthy corporation: Disability management and health
promotion practices at the workplace. Journal of Rehabilitation,
July/August/September. 63-66.
Topf, M. (1999, June) Chicken/egg/chegg! Occupational Health and Safety. 60-66.
Ulmer, D.D. (1984). Societal influences on health and life-styles. The Western Journal
of Medicine, 141 (6), 793-798.
Vander Kolk, C.J. & Vander Kolk, J.K. (1990). Follow-up of persons with litigation
related injuries. Journal of Rehabilitation, October/November/December. 36-40.
VanFleet, E.L. & Bates, R. (1995). Ergonomics. Facts & Resources, 1 (1). 1-2.
Webster, B.S. & Snook, S.H. (1994). The cost of 1989 workers’ compensation low back
pain claims. Spine, 19 (10). 1111-1115.
Weitzel, M.H. (1989). A test of the health promotion model with blue-collar workers.
Nursing Research, 38 (2), 99-104.
Yu, T., Roht, L.H., Wise, R.A., Kilian, J. & Weir, F.W. (1984). Low back pain in
industry: An old problem revisited. Journal of Occupational Medicine, 26 (7),
517-524.

PARTICIPATION IN ON-SITE STRETCHING PROGRAM 99
Appendix A
SurveyYour participation in this survey is voluntary. By participating you consent to this research. You will experience no significantrisks by participating in this survey. You will not be personally identified by any item on this survey thus remaining anonymous.Your responses will be kept confidential. Please read every question and answer each line to the best of your knowledge. Thankyou for your participation.
Please check the appropriate line:
Male Age 18 - 28Female Age 29 - 39
Age 40 - 50Non-Smoker Age 51 - 61Smoker Age 62 or over
Please fill in the blank:Job Name: ___________________________Department: __________________________
1. How would you rate your general health:___Excellent (0 personal sick days per year) ___Good (1to 2 personal sick days per year)___ Average (2-3 personal sick days per year) ___ Poor (more than 3 personal sick days per year)
2. On a scale of 1 - 10 (10 = highest), how important is exercising to you personally? _______
3. How long have your worked for this company? _____Years
4. Please mark the box using the codes listed that best describes your situation:N = NumbnessP = Pins & NeedlesA = AchingS = StabbingX = No Discomfort
Neverexperiencediscomfortwith work
Rarelyexperiencediscomfortwith work
Discomfort doesnot interferewith my work
I need to stop worksometimes due todiscomfort
I have missedwork days dueto discomfort
NECK /SHOULDERELBOW/FOREARMWRIST/ HANDMID/ LOW BACKHIPKNEEANKLE/ FOOT
5. Is this discomfort a result of a: ___non-work injury ___ work-related injury
6. Have you reported this discomfort to your supervisor? Yes _____ No _____
7. Has this discomfort interfered with your daily activities (such as eating, sleeping, sports, housework, etc)? Yes _____ No ___

PARTICIPATION IN ON-SITE STRETCHING PROGRAM 100
8. How long have you experienced this level of discomfort? _______________________
9. Pain Scale: (no pain) 0 1 2 3 4 5 6 7 8 9 10 (intolerable pain)
10. If you feel discomfort, when is the most common time?
Before Work ___ During Work ___ After Work ___After sleeping ___ During Sleep___
11. In your opinion, do you think an on-site stretching program would help reduce thediscomfort you and/or your co-workers may be experiencing? Yes _____ No _____
Please state your opinion on the following:12. Is your job: Stressful Average Little
StressUnsure
13. Does your job involve repetitive motion: High Medium Low Unsure
14. Is the physical demand of your job: High Medium Low Unsure
15. Overall, does your workstation fit you? Yes No Not Apply Unsure
16. Is the worktable at the right height for you? Yes No Not Apply Unsure
17. Is there proper lighting at your work station? Yes No Not Apply Unsure
18. Do you have enough space to perform you duties? Yes No Not Apply Unsure
19. Who is responsible for safety where you work? (circle all that apply to your opinion)
Employees Supervisors Managers Unsure
20. If this company decided to implement an on-sitestretching program, who should be responsible formaintaining such a program? (circle all that apply to your opinion)
Employees Supervisors Managers Unsure
21. Who is responsible for employee health where youwork? (circle all that apply to your opinion)
Employees Supervisors Managers Unsure
22. If your employer required you to stretch at the worksite daily, would you (circle all that apply to youropinion):
ParticipateWillingly
FeelAwkward
Not Do It Unsure
23. Job satisfaction level at present: VerySatisfied
Neutral NotSatisfied
Unsure

PARTICIPATION IN ON-SITE STRETCHING PROGRAM 101
24. What suggestions do you have that would improve how you perform your job,improve your workstation, or make your job easier to do?
25. What would motivate you to participate in an on-site stretching program? (Please rank order your selections)
__ Feel Healthier __ Job Easier to Perform__ Everyone Participating__ Prizes/Money__ Not Take Too Much Time__ Do on Company Time__ Other: _____________________
26. What do you perceive the barriers to be that prevents participation in a personalexercise program? (Please rank order your selections)
___ Time___ Location of Exercise Facility___ Other Responsibilities (home, family, job, etc.)___ Motivation Level___ Fatigue
27. Other comments you wish to make:
Thank you for your participation in this survey.