Embed Size (px)
Citation preview

Empirical study of the reverse-causality between organisational performance and employee
behaviour in the agricultural manufacturing sector of Malawi
Ronnie Timpuza Mvula
Student Number
1084466
Dissertation submitted to the School of Economic & Business Sciences in fulfilment for the
requirements of award of the degree: PhD Business Sciences (Human Resources Management)
in the Faculty of Commerce, Law and Management, University of the Witwatersrand.
Supervisor: Prof. Michael Olorunjuwon Samuel
July, 2018
Copyright (2018) University of the Witwatersrand
i | P a g e
DECLARATION
I, Ronnie Timpuza Mvula, hereby declare that this dissertation is my own work. The dissertation
will was submitted to meet the requirements for awarding of the degree of Doctor of Philosophy
(PhD) in the field of Human Resources Management at the University of the Witwatersrand,
Johannesburg. I declare that the dissertation has not been submitted before for the award of any
degree or examination at this or any other University.
I further declare that:
I am aware that plagiarism (the use of someone else’s work without permission and/or
acknowledging the original source) is wrong.
I have followed the required conventions in referencing the thoughts and ideas of others.
I understand that the University of the Witwatersrand may take disciplinary action against
me if there is a belief or proof that this dissertation is not my own unaided work or that I
have failed to acknowledge the source of the ideas or words in my writing.
I recognise that it was my responsibility to conduct this research in an ethical manner and
according to guidelines of the University of the Witwatersrand, and according to any laws or
legal frameworks that may apply, as well as according to the norms and expectations of the
Management discipline.
Signature ______________________________
Date ______________________________
July, 2018

ii | P a g e
ABSTRACT
Many organisations claim that Human Resources are their critical resource. However, what is
most critical is not merely the human resources but how the Human Resources are managed.
Human Resource Management is achieved through practices that the firm implements; these give
the firm sustained competitive advantage. Many studies have found positive and significant
relationship between HR management and firm performance. Previous studies have also studied
reverse causality investigating whether organisational performance affects HR management
policies and found significant positive relationship implying that it is good performing
organisations that can afford adopting HRM practices. The purpose of this study was to
investigate whether organisational performance motivates how employees behave at work in the
reverse causality in the agricultural manufacturing firms in Malawi. To achieve this purpose a
survey design was adopted using quantitative research strategy. Data were collected from a
probability sample of 77 managers and 308 employees totalling 385 participants. Descriptive and
inferential statistics using Structural Equation Modelling (SEM) were used to analyse and test
seven hypotheses.
The proposed relationships were tested using a number of statistical methods. Adequate
reliability was achieved on all measurement scales. Confirmatory factor analysis was conducted
on the content and structure of the measured constructs and were confirmed necessary.
Reasonable fit was achieved for all the refined measurement models. A Lisrel based SEM was
applied to examine whether the model fitted the data obtained from the sample and test the
relationships between latent variables. Consistent with previous research; results of SEM
revealed that Human Resource Management (HRM) practices are significant correlates of
organisational performance. Further results showed positive relationships between business
strategy and HRM practices; HRM practices and organisational performance. Significant
negative relationship was found between employee attitudes and employee behaviour and
employee behaviour and organisational performance.

iii | P a g e
It also revealed that organisational performance positively and significantly affects employee
behaviour (reverse causality). The positive effect implies that organisational performance is
increasing employee absenteeism and disputes which is a negative effect. This shows that
employee behaviour is driven by the performance of the organisation. The study recommends
that agricultural manufacturing firms in the medium to large scale sectors in Malawi should
embrace effective HRM practices to improve performance and competitiveness. Furthermore, the
study recommends that firms should focus on employee behaviours as drivers of performance;
they should look at organizational performance as driving employee behaviour. Managers should
seriously consider motivation of employees based on firm performance to counter increasing
negative employee behaviour..
The study contributes to existing literature on the management of Human Resources and firm
performance. It provides insights on the relationships between the constructs. Practical
implications are also provided to managers to help enhance organisational performance that can
motivate employee behaviour.
Limitations of the study and suggestions for further research are also stated.
iv | P a g e
ACKNOWLEDGEMENTS
I wish to express my profound gratitude to the following:
Prof Samuel Olorunjuwon (Promoter): for your painstaking efforts, guidance and
absolute commitment to the successful completion of this project. I would like to greatly
thank you for great supervision of my project through your guidance and advice. I
sincerely and profoundly appreciate everything that you have done to make this work a
success.
Dr Bright Mahembe: for statistical analysis and support.
The management of various organisations that were surveyed and their respective
employees: for granting permission to conduct the research and participation in the
survey.
My fellow PhD students from Nigeria, South Africa, Zimbabwe, Tanzania, Kenya, Ghana
and indeed Malawi for your support and guidance where their input was sought.
Lilongwe University of Agriculture and Natural Resources (Luanar) for the financial and
material support that have enabled me to complete the studies. Without your support, this
was unachievable.
Most importantly, to God Almighty for the strength and grace to successfully complete
this study programme.
To my wife and children.

v | P a g e
DEDICATION
I have always wondered how it would feel to receive a touching note from my kid, thanking me
for being a good father. While I wait, I don’t want to keep you waiting any longer.
I dedicate this to my mother Ellina Mvula and my aunt Lenitta Mvula for bringing me up like
this. You encouraged me from day one of my school life all the way to date. I have left you alone
many times to pursue my studies away from home and from you but you always encouraged me
to go.
Ellina and Lenitta you are like a soft sponge, you absorb your children’s tears and squeeze out
pretty bubbles of happiness and joy. Thanks for everything.

vi | P a g e
TABLE OF CONTENTS
DECLARATION ................................................................................................................ i
ABSTRACT ......................................................................................................................ii
ACKNOWLEDGEMENTS ...............................................................................................iv
DEDICATION .................................................................................................................. v
TABLE OF CONTENTS ..................................................................................................vi
LIST OF FIGURES .........................................................................................................xv
LIST OF APPENDICES ................................................................................................ xvii
LIST OF ABBREVIATIONS ........................................................................................... xix
CHAPTER ONE .............................................................................................................. 1
INTRODUCTION ............................................................................................................. 1
1.1 INTRODUCTION AND STUDY OVERVIEW ................................................................................ 1
1.2 REVERSE CAUSALITY ................................................................................................................... 3
1.3 STATEMENT OF THE PROBLEM. ................................................................................................. 3
1.5 PURPOSE OF THE STUDY. ............................................................................................................. 4
1.5.1 Research Questions ...................................................................................................................... 4
1.5.2 Specific Objectives ...................................................................................................................... 5
1.5.3 Research Gaps .............................................................................................................................. 5
1.5.4 Justification for the study ............................................................................................................. 5
1.6 VARIABLES OF THE STUDY. ........................................................................................................ 6
1.6.1 Business Strategy ......................................................................................................................... 6

vii | P a g e
1.6.2 Human Resource Management Practices ..................................................................................... 7
1.6.3 Employee Attitudes ................................................................................................................... 10
1.6.4 Employee Behaviours ................................................................................................................ 11
1.6.5 Organisational performance ....................................................................................................... 12
1.7 REVERSE CAUSALITY: ORGANISATIONAL PERFORMANCE EFFECT ON EMPLOYEE
BEHAVIOUR. ........................................................................................................................................ 12
1.8 CONTROL ........................................................................................................................................ 14
1.9 OVERVIEW OF THE STUDY. ....................................................................................................... 14
1.10. SUMMARY ................................................................................................................................... 15
CHAPTER TWO ............................................................................................................ 16
LITERATURE REVIEW ................................................................................................. 16
2.1 CHAPTER OVERVIEW .................................................................................................................. 16
2.2 INTRODUCTION ............................................................................................................................ 16
2.3 CONCEPTUALISING THE CONSTRUCTS .................................................................................. 16
2.3.1 Human Resource Management .................................................................................................. 16
2.3.2 Human Resource Management Practices ................................................................................... 17
2.3.3 Nature of Human Resource Management Practices ................................................................... 18
2.3.4 Factors Affecting Human Resource Management Practices and Firm performance. ................ 21
2.3.5 Human Resource Policies Vs Human Resource Practices ......................................................... 21
2.4 MANUFACTURING PERFORMANCE ......................................................................................... 21
2.5 HUMAN RESOURCE MANAGEMENT IN MALAWI ................................................................. 23
2.6 THE MALAWI MANUFACTURING SECTOR. ............................................................................ 25
2.7 HUMAN RESOURCE MANAGEMENT RESEARCH PERSPECTIVES ..................................... 26
2.7.1 The Universalistic or “Best Practice” ........................................................................................ 26
2.7.2 The Contingency perspective ..................................................................................................... 28

viii | P a g e
2.7.3 The configurational perspective ................................................................................................. 30
2.7.4 The Contextual perspective ........................................................................................................ 31
2.8 RELATIONSHIP BETWEEN CONSTRUCTS AND HYPOTHESIS DEVELOPMENT ............. 33
2.8.1 Business Strategy ....................................................................................................................... 33
2.8.2 Human Resource Management Practices ................................................................................... 35
2.8.3. Employee Attitudes ................................................................................................................... 38
2.8.4 Employee Behaviours ................................................................................................................ 40
2.8.5 Organisational performance ....................................................................................................... 42
2.9 REVERSE CAUSALITY ................................................................................................................. 44
2.9.1 Reverse causality: Organisational performance effect on employee behaviour ........................ 44
2.10 CONTROLS ................................................................................................................................... 45
2.11 THEORETICAL FRAMEWORK .................................................................................................. 47
2.11.1 Resource based theory ............................................................................................................. 47
2.11.2 Contingency theory .................................................................................................................. 51
2.11.3 AMO theory ............................................................................................................................. 51
2.11.4 General systems theory ............................................................................................................ 52
2.12 EXISTING KNOWLEDGE IN THE FIELD ................................................................................. 53
2.13 SUMMARY .................................................................................................................................... 65
CHAPTER THREE ........................................................................................................ 66
RESEARCH DESIGN AND METHODOLOGY .............................................................. 66
3.1 INTRODUCTION ............................................................................................................................ 66
3.2 RESEARCH METHODOLOGY ...................................................................................................... 66
3.2.1 Research design and justification ............................................................................................... 67
3.2.1.4 Measuring Instrument ................................................................................................................. 71
3.2.1.4.1. Business Strategy ................................................................................................................ 71

ix | P a g e
3.2.1.4 .2 Human Resource Management Practices ............................................................................ 71
3.2.1.4 .7. Employee attitudes ............................................................................................................. 73
3.2.1.4 .8. Employee Behaviour .......................................................................................................... 73
3.2.1.4 .9. Organisational Performance ............................................................................................... 74
3.2.2 Control variables ....................................................................................................................... 74
3.3 SAMPLING ...................................................................................................................................... 75
3.3.1 Population of the study .............................................................................................................. 75
3.3.2 Sampling frame .......................................................................................................................... 76
3.3.3 Sample size ................................................................................................................................ 76
3.3.4 Sampling methods ...................................................................................................................... 77
3.3.5 Data collection procedure ......................................................................................................... 79
3.3.6 Demographic profile of the sample ............................................................................................ 81
3.4 DATA CLEANING AND SCREENING ......................................................................................... 85
3.4.1 Missing data ............................................................................................................................... 85
3.5 DATA ANALYSIS ........................................................................................................................... 89
3.5.1 Testing Common bias ................................................................................................................ 89
3.7 STATISTICAL ANALYSIS ............................................................................................................ 90
3.6.1 Item Analysis ............................................................................................................................. 90
3.7.2 Exploratory Factor Analysis ...................................................................................................... 92
3.7.3 Confirmatory Factor Analysis .................................................................................................... 96
3.7.4 The Structural Equation Model .................................................................................................. 96
3.7.5 The Measurement Model (Outer Model) ................................................................................... 98
3.7.6 The Structural Model (Inner Model) .......................................................................................... 99
3.7.7 The Research Hypotheses ........................................................................................................ 101
3.8. ASSESSING MODEL FIT ........................................................................................................ 102

x | P a g e
3.8.3. Hierarchical Multiple Regression ............................................................................................... 104
3.8.4 Reliability ..................................................................................................................................... 104
3.8.5 Validity ........................................................................................................................................ 104
3.9 RESERACH ETHICS ..................................................................................................................... 105
3.10 CHAPTER SUMMARY ............................................................................................................... 105
CHAPTER FOUR ........................................................................................................ 106
PRESENTATION OF RESULTS ................................................................................. 106
4.0 INTRODUCTION .......................................................................................................................... 106
4.1 MISSING VALUES ....................................................................................................................... 106
4.2 COMPARATIVE ANALYSIS OF RESPONDENTS PERCEPTIONS ........................................ 106
4.2.1 Business Strategy ..................................................................................................................... 106
4.2.2 Recruitment and selection. ...................................................................................................... 108
4.2.3 Training and development. ...................................................................................................... 110
4.2.4 Performance Appraisal. ............................................................................................................ 112
4.2.5 Compensation. ......................................................................................................................... 114
4.2.6 Employees Attitude. ................................................................................................................. 115
4.2.7 Employee behaviour. ............................................................................................................... 117
4.3.8 Organizational performance. .................................................................................................... 118
4.3 ITEM ANALYSIS .......................................................................................................................... 120
4.2.1 Reliability Results: Business Strategy ..................................................................................... 122
4.2.2 Human Resource Management practices ................................................................................. 122
4.2.4 Reliability Results: Employee behaviour ................................................................................. 123
4.2.4 Reliability Results: Organisational performance ..................................................................... 124
4.2.5 Summary of the item analysis results ....................................................................................... 124
4.4 DIMENSIONALITY ANALYSIS ................................................................................................. 126

xi | P a g e
4.4.1 Dimensionality ......................................................................................................................... 126
4.4.2 Exploratory Factor Analysis .................................................................................................... 128
4.5 MEASUREMENT AND STRUCTURAL MODELS .................................................................... 132
4.5.1 Guidelines for Model Measurement and Structural Evaluation ............................................... 132
4.5.2 The Measurement Model ......................................................................................................... 133
4.5.2 Evaluating the Measurement Model Fit .................................................................... 138
4.5.3 Fitting the overall Measurement model ................................................................................... 143
4.5.4 The Structural Model ............................................................................................. 145
4.5.5 Validating the Structural Model ............................................................................................... 147
4.5.6 Structural Model Modification ................................................................................ 149
4.6 RELATIONSHIP BETWEEN LATENT VARIABLES ................................................................ 154
4.6.1 Relationship between Business strategy and HRM practices .................................................. 156
4.6.2 Relationship between HRM practices and employee attitudes ................................................ 156
4.6.3 Relationship between employee attitudes and employee behaviour ........................................ 157
4.6.4 Relationship between employee behaviour and organisational performance .......................... 157
4.6.5 Relationship between HRM practices and organisational performance .................................. 157
4.6.6 Relationship between organisational performance and employee behaviour .......................... 158
4.6.7 The influence of controls (organisational age, size & union intensity) on Human Resource
Management Practices. ..................................................................................................................... 159
4.6.8 The influence of controls (organisational age, size & union intensity) on Organisational
performance. ..................................................................................................................................... 163
4.7.1 Evaluating Mediation ............................................................................................................... 168
4.9 SUMMARY .................................................................................................................................... 174
CHAPTER FIVE .......................................................................................................... 175
DISCUSSION OF RESULTS, CONCLUSIONS AND RECOMMENDATIONS ............ 175
5.1 INTRODUCTION .......................................................................................................................... 175
xii | P a g e
5.2 AIM OF THE STUDY ................................................................................................................... 176
5.2.2 Conceptual framework ............................................................................................................. 177
5.3 SUMMARY AND DISCUSSION OF KEY FINDINGS ............................................................... 177
5.3.2 Do HRM practices affect organisational performance? ........................................................... 178
5.3.3 Is the reverse causality stronger than forward causality? ......................................................... 183
5.3.4 Does organisational performance motivate employee behaviour? .......................................... 186
5.4 COMPETING REGRESSION ANALYSIS ................................................................................... 188
5.5 CONTROL VARIABLES .............................................................................................................. 189
5.6 CONCLUSIONS ............................................................................................................................. 189
5.7 CONTRIBUTIONS OF THE STUDY ........................................................................................... 190
5.9 LIMITATIONS OF THE STUDY AND SUGGESTIONS FOR FUTURE RESEARCH ........... 194
REFERENCES ..................................................................................................................................... 197
5.11 APPENDICES .............................................................................................................................. 230
xiii | P a g e
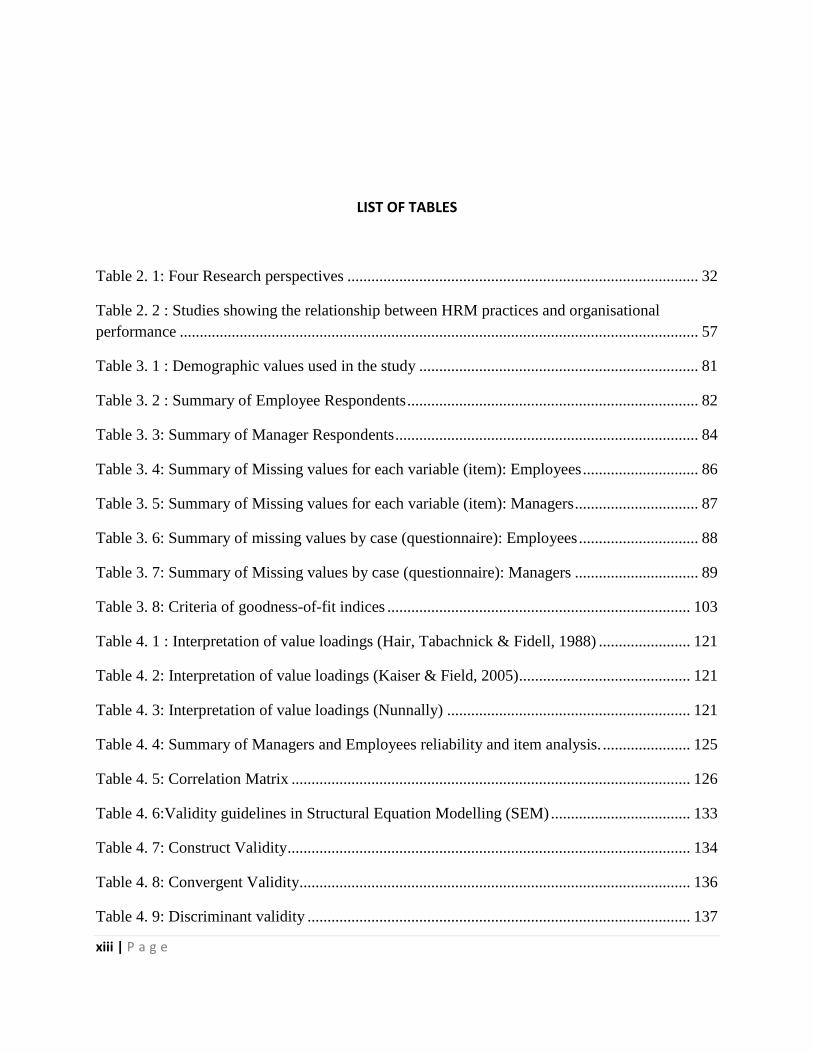
LIST OF TABLES
Table 2. 1: Four Research perspectives ........................................................................................ 32
Table 2. 2 : Studies showing the relationship between HRM practices and organisational
performance .................................................................................................................................. 57
Table 3. 1 : Demographic values used in the study ...................................................................... 81
Table 3. 2 : Summary of Employee Respondents ......................................................................... 82
Table 3. 3: Summary of Manager Respondents ............................................................................ 84
Table 3. 4: Summary of Missing values for each variable (item): Employees ............................. 86
Table 3. 5: Summary of Missing values for each variable (item): Managers ............................... 87
Table 3. 6: Summary of missing values by case (questionnaire): Employees .............................. 88
Table 3. 7: Summary of Missing values by case (questionnaire): Managers ............................... 89
Table 3. 8: Criteria of goodness-of-fit indices ............................................................................ 103
Table 4. 1 : Interpretation of value loadings (Hair, Tabachnick & Fidell, 1988) ....................... 121
Table 4. 2: Interpretation of value loadings (Kaiser & Field, 2005)........................................... 121
Table 4. 3: Interpretation of value loadings (Nunnally) ............................................................. 121
Table 4. 4: Summary of Managers and Employees reliability and item analysis. ...................... 125
Table 4. 5: Correlation Matrix .................................................................................................... 126
Table 4. 6:Validity guidelines in Structural Equation Modelling (SEM) ................................... 133
Table 4. 7: Construct Validity ..................................................................................................... 134
Table 4. 8: Convergent Validity.................................................................................................. 136
Table 4. 9: Discriminant validity ................................................................................................ 137

xiv | P a g e
Table 4. 10: Completely Standardised Solution ......................................................................... 139
Table 4. 11: Modification Indices for LAMBDA-X ................................................................... 140
Table 4. 12: Standardised Expected change for LAMBDA-X ................................................... 141
Table 4. 13: Completely Standardised Solutions ........................................................................ 142
Table 4. 14: Goodness-of-fit indices ........................................................................................... 146
Table 4. 15: Squared multiple correlations (R2). ........................................................................ 148
Table 4. 16: Squared Multiple Correlations for Y-Variables ..................................................... 149
Table 4. 17: Completely Standardised Solutions ........................................................................ 151
Table 4. 18: Beta Matrix ............................................................................................................. 155
Table 4. 19: Results of hypothesis testing .................................................................................. 158
Table 4. 20: Model Summary of organisational age, size & union intensity and Human Resource
Management practices ................................................................................................................ 160
Table 4. 21: Analysis of Variance Statistics of organisational age, size and union intensity ..... 160
Table 4. 22: Coefficients of organisational age, size and union intensity .................................. 162
Table 4. 23: Model Summary ..................................................................................................... 163
Table 4. 24: ANOVA .................................................................................................................. 164
Table 4. 25: Coefficients ............................................................................................................. 165
Table 4. 26: Estimated Regression Weights ............................................................................... 167
Table 4. 27: Standardized total, direct and indirect effects ......................................................... 170
Table 4. 28: Coefficients ............................................................................................................. 172
Table 4. 29: Model Summaries ................................................................................................... 173

xv | P a g e
LIST OF FIGURES
Figure 1. 1: Reversed Causality ...................................................................................................... 3
Figure 2. 1: Conceptual Model ..................................................................................................... 46
Figure 2. 2 : Identification of resource or capability. ................................................................... 50
Figure 3. 1: Four Stage process for developing a Measurement Model ....................................... 99
Figure 3. 2 : Two Stage Process for Developing a Structural Model ......................................... 100
Figure 4. 1 : Business Strategy (Managers) ................................................................................ 107
Figure 4. 2: Business Strategy (Employees) ............................................................................... 107
Figure 4. 3: Recruitment & Selection (Managers) ...................................................................... 109
Figure 4. 4: Recruitment & Selection (Employees) .................................................................... 109
Figure 4. 5: Training & Development (Managers) ..................................................................... 111
Figure 4. 6: Training & Development (Employees) ................................................................... 111
Figure 4. 7: Performance appraisal (Managers) .......................................................................... 113
Figure 4. 8: Performance appraisal (Employees) ........................................................................ 113
Figure 4. 9: Compensation (Managers) ...................................................................................... 115
Figure 4. 10: Compensation (Employees) ................................................................................. 115
Figure 4. 11: Employee attitude (Managers) .............................................................................. 116
Figure 4. 12: Employee attitude (Employees) ............................................................................ 117
Figure 4. 13: Employee Behaviour (Managers) .......................................................................... 118
Figure 4. 14: Employee Behaviour (Employees) ........................................................................ 118
Figure 4. 15: Organisational Performance (Managers) ............................................................... 119
Figure 4. 16: Organisational Performance (Employees) ............................................................. 120

xvi | P a g e
Figure 4. 17: Scree Plot ............................................................................................................... 127
Figure 4. 18: Path Diagram for the overall refined Measurement Mode .................................... 144
Figure4. 19: Structural Model ..................................................................................................... 153

xvii | P a g e
LIST OF APPENDICES
Appendix 1 1 : Managers Questionnaire .................................................................................... 230
Appendix 1 2: Employees Questionnaire ................................................................................... 235
Appendix 1 3: Consent to collect data ........................................................................................ 240
Appendix 3 1 Participant consent .............................................................................................. 243
Appendix 3 2: Ethics Clearance .................................................................................................. 246
Appendix 3 3: Approved PhD title ............................................................................................ 247
Appendix 4 1: Rotated Component Matrix ................................................................................ 248
Appendix 4 2: Reliability and item analysis for Business Strategy. ........................................... 249
Appendix 4 3: Reliability and item analysis for Business Strategy ............................................ 249
Appendix 4 4: Reliability and item analysis for Recruitment and Selection (Managers) .......... 250
Appendix 4 5: Reliability and item analysis for Recruitment & Selection (Employees) ........... 250
Appendix 4 6: Reliability and item analysis for Training and Development (Managers) .......... 251
Appendix 4 7 Reliability and item analysis for Training and Development (Employees) ......... 251
Appendix 4 8: Reliability and item analysis for Performance Appraisal (Managers) ................ 252
Appendix 4 9: Reliability and item analysis for Performance Appraisal (Employees) .............. 252
Appendix 4 10: Reliability and item analysis for compensation (Managers) ............................. 253
Appendix 4 11: Reliability and item analysis for Compensation (Employees) .......................... 253
Appendix 4 12: Reliability and item analysis for employee attitude (Managers) ...................... 254
Appendix 4 13: Reliability and item analysis for Employee Attitude (Employees) ................... 254
Appendix 4 14: Reliability Statistics for employee behaviour (Managers) ................................ 255
Appendix 4 15: Reliability and item analysis for Employee Behaviour (Employees) ............... 255
Appendix 4 16 Reliability and item analysis for Organisational performance (Managers) ....... 256
Appendix 4 17: Reliability and item statistics of the Organisational Performance scale
(Employees) ................................................................................................................................ 256

xviii | P a g e
Appendix 4 18: Results of exploratory factor analysis: Business Strategy ................................ 257
Appendix 4 19: Results of exploratory factor analysis: Human Resource Practices Sub-Scale
(Recruitment and Selection) ....................................................................................................... 258
Appendix 4 20: Results of exploratory factor analysis: Human Resource Practices Sub-Scale
(training and development) ......................................................................................................... 259
Appendix 4 21: Results of exploratory factor analysis: Human Resource Practices Sub-Scale
(Performance Appraisal) ............................................................................................................. 260
Appendix 4 22: Results of exploratory factor analysis: Human Resource Practice sub-scale
(compensation) ............................................................................................................................ 262
Appendix 4 23: Results of exploratory factor analysis: Employee Attitude scale ..................... 263
Appendix 4 24: Results of exploratory factor analysis: Employee Behaviour scale .................. 264
Appendix 4 25: Results of exploratory factor analysis: Organisational Performance scale ....... 265
Appendix 4 26: Modification Indices for LAMBDA-Y ............................................................. 266
Appendix 4 27: Expected Change for LAMBDA-Y .................................................................. 267
xix | P a g e
LIST OF ABBREVIATIONS
AGFI : Augmented Goodness of Fit Index
AMO : Ability + Motivation +Opportunity
ANOVA : Analysis of Variance
ASWAP : Agriculture Sector Wide Approach
AVE : Average Variance Extracted
BSFAC-1 : Business Strategy Indicator 1
BSFAC-2 : Business Strategy indicator 2
BSTTRAT : Business Strategy
CAP : Chapter
CFI : Composite Fit Index
COM : Compensation
COMESA : Common Market for Eastern and Southern Africa.
CVM : Common Variance Method
EA : Employee Attitudes
EA-1 : Employee attitude indicator one
EA-2 : Employee attitude indicator two
EATTIT : Employee Attitudes
EB : Employee Behaviour
EB-1 : Employee Behaviour indicator one
EB-2 : Employee behaviour indicator two
EBEHAV : Employee Behaviour
EFA : Exploratory Factor Analysis
xx | P a g e
E-HRM : Electronic Human Resource Management
GDP : Gross Domestic Product
GFI : Goodness of Fit Index
GoM : Government of Malawi
GST : General systems theory
H1 : Hypothesis one
HPWS : High Performance Work Systems
HRM : Human Resource Management
HRMP : Human Resource Management Practices
HRMP : Human Resource Management Practices
IFI : Incremental Fit Index
KMO : Kaiser-Meyer-Olkin
KSAs : Key Success
LISREL : Linear Structural Relations
MANOVA : Multiple Analyses Of Variance
MITC : Malawi Investment Trade Centre
NFI : Normed Fit Index
OCB : Organisational Citizenship Behaviour
OP-1 : Organisational Performance indicator one
OP-2 : Organisational Performance indicator two
ORGPERF : Organisational Performance
PA : Performance Appraisal
PCA : Principal Component Analysis
PFA : Principal factor Analysis

xxi | P a g e
RBT : Resource Based Theory
RBV : Resource Based View
RMSEA : Root Mean Square Error Approximation
ROA : Return on Assets
ROE : Return on Equity
RS : Recruitment and Selection
SCA : Sustainable Competitive Advantage
SEM : Structural Equation Model
SHRM : Strategic Human Resource Management
SMEs : Small and Medium Enterprises
SPSS : Statistical Packages for Social Science
TD : Training and Development
UK : United Kingdom
USA : United States of America
VRIN : valuable, rare, costly to imitate and non-substitutable
VRIO : valuable, rare, costly to imitate and organised
WEIRD : Western, Educated, Industrialised, Rich and Democratic
WFPMA : World Federation of People Management Associations
1 | P a g e
CHAPTER ONE
INTRODUCTION
1.1 INTRODUCTION AND STUDY OVERVIEW
Human resources are the most critical factor required to achieve organisational success in the
most efficient and effective way (Lee, Lee & Wu, 2010) because they can learn, grow and
contribute firm performance (Fitz-enz, 1995). Access to machinery, equipment and other assets
is not the differentiating factor anymore as these can be bought. This is why a company that lost
all its equipment but kept the skills and knowhow of its workforce could be back in business
relatively quickly. A company that lost its workforce, while keeping its equipment, would never
recover (Becker, Huselid & Ulrich, 2001). It is the management of human resources rather than
reliance on advanced technology or patents or strategic position that help firms achieve
competitive advantage (Becker, 2001).
Proving the value that human resource management adds to the firm has become increasingly
important since the 1990s (Arthur, 1994;; Huselid, 1995; Guest, 1997; McDuffie, 1995 Paauwe,
1997). Plethora of studies has shown positive and significant relationship between HRM
practices and organisational performance (Katuo & Budhwar, 2008; Katuo, 2012, 2013 Wright
& Gardner, 2000). However, some shortcomings have been identified in these studies. Level of
analysis has varied from plant (Appelbaum, Bailey, Berg & Kallenberg, 2000; Arthur, 1994;
MacDuffie, 1995; Youndt et al. 1996; Thompson, 2000;) to business unit and corporate levels
(Huselid, 1995).
HRM practices have been described differently; some authors have looked at the level or amount
of the practice or coverage e.g. how much training the employee receives while others have
looked at the percentage of employees covered by that practice (Huselid, 1995). Human
resources are one of the important considerations for strategy formulation and implementation
(Johnson & Scholes, 2010). According to Porter (1997) a business strategy refers to the long-
term direction and scope of an organization. In coming up with a strategy the firm must consider
its long-term; markets to compete; activities to be involved within those markets(scope);

2 | P a g e
resources required to compete (skills, assets, finances); external factors that affect the business
(environment); and stakeholder values and expectations (Johnson & Scholes, 2010).
An organization can pursue different strategies but Porter (1980, 1985) advocates three generic
business strategies of cost, innovation, and quality. These can be used by any business regardless
of the product, sector and industry. This study adopts these three generic strategies. The business
strategy that a firm pursues affects and informs the type of human resource strategy and practices
it implements.
Human resource practices are organisational activities aimed at managing the pool of human
resources and ensuring that organisational resources are directed at achieving the organisational
goals as set out in the strategic plan (Dessler, 2010; Barney, 2001). An organisation strategy
should align human resource practices required to achieve it. The following human resource
practices were analysed in the present study (1) Recruitment and selection, (2) training and
development, (3) performance appraisal and (4) Compensation (Gamage, 2015; Dessler, 2008,
Katuo & Budhwar, ; Fisher 2006).
Employee attitudes are viewpoints about aspects of the job, careers and their organisations
(Saari, 2004). Attitudes affect employees’ feelings about their job and the work environment
whether they are happy or not. Employee attitude has three variables (1) commitment, (2)
satisfaction, and (3) motivation. Employees who have positive high commitment, job satisfaction
and motivation work for the organisation’s benefit (Becker et al. 1997).
Employee behaviour refers to how employees conduct themselves at work. The behaviour that
employees display at work is guided by the attitudes they have about the job and work
environment (Grobler, 2002). Although employee attitudes are central to strategic human
resource management (Boxall & Purcell, 2002); they are not sufficient to improve organisational
performance until they affect employee behaviour.

3 | P a g e
Organisational performance refers to the comparison of the value produced by the firm against
the value expected by owners of capital (Aladwan, Ramudu & Fish, 2011). Various variables
have been applied to measure organisation performance like productivity (Huselid, 1995;
Combs, 2006); profitability (Gong, 2009); market performance (Chuang & Liao, 2010). The
present study measured organisational performance using four manufacturing specific variables
of (1) cost reduction, (2) flexibility, (3) time and (4) quality improvement.
1.2 REVERSE CAUSALITY
In the HRM practices and organisational performance relationship the usual causal pathway that
most theorists have suggested is a one way forward causality (Katuo & Budhwar, 2008; Katuo,
2011, 2010, 2012; Edwards, 2012; Amin, 2015).This clearly shows a sequential order in which
enactment of HRM practices leads to HRM- related outcomes of employee attitudes (motivation,
commitment and satisfaction) and employee behaviour (turnover, absences, disputes) which in
turn affect organisational performance.
HRM practices HRM outcomes Organisational performance
Figure1. 1: Reversed Causality
To the contrary, reserve causality is a concept of causality that looks at causality in a different
opposite direction as shown above. While forward causality looks at the effect of causes; reverse
causality looks at the causes of effects (Gelman, 2013). This study investigated the reverse
causality of organisational performance and employee behaviour.
1.3 STATEMENT OF THE PROBLEM.
The agricultural sector in Malawi employs 80% of the total national workforce, contributes over
80% to the country’s foreign exchange earnings, accounts for 39% of the gross domestic product
(GDP) and contributes significantly to national and household food security (Government of
Reverse Causality

4 | P a g e
Malawi, 2010). Agriculture is the vehicle that drives the Malawi economy; therefore, human
resources are the fuel driving that vehicle.
Malawi Government introduced the Agriculture Sector Wide Approach (ASWAP) in 2010 in
order to spur agricultural productivity and agro processing and value addition. However, these
may not be achieved if issues of human resources management and firm performance are not
fully understood in this sector in Malawi.
Various research frameworks have proposed that human resource management practices lead
directly or indirectly to organisational performance through mediating variables of HRM
outcomes (Wright, 2005; Jiang, 2012b). However, this one-way forward causality has been
criticized as being unsatisfactory (Katuo, 2012). Different authors have argued that rather than
human resource management practices leading to higher organisational performance; it is highly
performing firms that can afford human resource management practices (Edwards & Wright,
2001; Katuo, 2012; & Edwards, 2010).
In view of this, a number of reverse causality studies (Katuo, 2012; Edwards, 2010) have been
undertaken. However, systematic literature search conducted in this study revealed that no study
has investigated the reverse causality of employee behaviour and organisational performance.
The proposed study therefore develops and tests an alternative view of the association depicting
the influence of organisational performance on employee behaviour (turnover, absenteeism and
disputes - labour relations).
1.5 PURPOSE OF THE STUDY.
The study aims to investigate whether organisational performance influence employee behaviour
in agricultural manufacturing firms in Malawi.
1.5.1 Research Questions
The overarching research question to be addressed by this study is: does organisational
performance motivate employee behaviour in the Malawi agricultural manufacturing sector? The
following questions provide further guide for the conduct of the study:
1. What is the relationship between business strategy and human resource practices?
5 | P a g e
2. What is the relationship between human resource practices and employee attitudes?
3. What is the relationship between employee attitudes and employee behaviour?
4. What is the relationship between employee behaviour and organisational performance?
5. What is the relationship between human resource practices and organisation performance
without the mediating effect of employee attitudes and employee behaviour?
6. Does organisational performance affect employee behaviour?
7. Is the causal relationship stronger in the forward or reverse causality?
1.5.2 Specific Objectives
The proposed study seeks to achieve the following objectives:
1. Examine the effect of organisational age, size and union intensity on the HRM
practices and organisational performance in the agricultural manufacturing sector
2. Investigate the impact of HRM practices on organisational performance in the
agricultural manufacturing sector.
3. Examine the reversed causality of organisational performance on employee
behaviour on the relationship between HRM practices and organisational
performance in the agricultural manufacturing sector.
1.5.3 Research Gaps
Previous studies on reverse causality have investigated HRM practices (Katuo, 2012);
organisational performance and employee attitudes (Edwards, 2010); organisational performance
and business strategy (Hertog, 2004). However, no previous study has investigated the reverse
causality of whether organisational performance causes employee behaviour. This is the gap the
study sought to fill. Consequently, it is not clear whether organisational performance affects how
employees behave at work.
1.5.4 Justification for the study
Regardless of existing studies (e.g., Wright, Gardner & Moynihan, 2003) there continues to be
academic debate on whether human resource management affect organisational performance and
whether human resource management adds value to the bottom line of organisational
performance (Martell & Carroll, 1995). Organisational performance has often been regarded as a
dependent variable and many studies have attempted to investigate how organisational

6 | P a g e
performance can be improved. This study challenges the unidirectional approach and investigates
whether organisational performance motivates employee behaviour.
Value addition and agro processing is one of Malawi’s ASWAP document pillars which calls for
enhanced agricultural manufacturing. This can only be achieved if human resource practices in
these firms embrace the concepts of employee commitment, motivation and job satisfaction in
order to solicit positive behaviours that translate into good firm performance from its workforce.
The Malawi Growth and Development Strategy (GoM, 2011) also aims to increase
manufacturing output with growing value addition. However, the sector output has stagnated
with low capacity utilization across all sub-sectors hindered by poor management, which
includes human resources. The outcome of the study will assist Malawi increase manufacturing
output through adoption of HRM practices that enhance higher manufacturing performance.
Furthermore, managers will appreciate effect of organisational performance on employee
behaviours.
1.6 VARIABLES OF THE STUDY.
The variables of the study are discussed in the next section. The linear relationships of the
variables are presented in the conceptual model (See Figure 2.1). The model provides a
framework explaining how HRM practices affect organisational performance and how
organisational performance motivates employee behaviour.
1.6.1 Business Strategy
There are many strategies a firm can pursue to achieve competitive advantage these include
generic corporate strategies (growth, stability, defensive, and combination strategies), generic
business strategies (cost leadership, innovation and quality enhancement) which adopt the
competitive advantage concept (Porter, 1985). Other strategies are competitive product strategies
(defenders, prospectors, analyzers, and reactors) which emphasize on strategic choices made to
link the firm with its product market (Miles & Snow, 1984).
This study adopted Porters business generic strategies because it has shown to positively predict
organisational effectiveness (Youndt et al. 1996). It is generally believed that HRM practices and
firm performance depends on contextual factors like business strategy. Therefore, for HRM

7 | P a g e
policies to be effective; they must be consistent with business strategies. (Gomez-Mejia &
Balkin, 1992). Porter (1995) identified three generic business strategies like cost reduction,
quality enhancement and innovation. Business strategies also have an impact on HRM practices
(Schuler & Jackson, 1987).
Firms pursuing a cost leadership strategy minimize overhead costs and maximize economies of
scale thereby achieving positive firm performance (Schuler & Jackson, 1987). Quality strategy
aims at delivering quality products and services but also resource effectiveness and productivity
(Johnson & Scholes, 2010). Innovation strategy makes the firm a unique producer thereby
gaining competitive advantage (Segev, 1989)
1.6.2 Human Resource Management Practices
HRM practices refer to organisational activities directed at managing the pool of human
resources and ensuring that the resources are employed towards the fulfilment of organisational
goals (Schuler & Jackson, 1987; Schuler & MacMillan, 1984; Wright & Snell, 1991). These
practices differ from one organisation, country and industry to another.
Different researchers have attempted to identify the type of HRM practices applicable in
different sectors. Pfeffer (1994) identified 16 practices which are known as best practice which
were later reworked to seven practices: employment security; selective hiring; extensive training;
reduction in status differences; self managed team and team working; high compensation
contingent on performance of organisation and information sharing.
One of the questions that must be addressed in HRM research is whether or not there is a single
set of practices that represent a “universally superior approach” to managing people (Chandler &
McEvoy, 2000). Theories on best practices or high commitment suggest that universally, certain
HRM practices, either separately or in combination are associated with improved organisational
performance.
Redman and Matthews (1998), identified a “HRM bundle” of key practices which support
service organisations quality strategies and these are: extensive remuneration systems, for

8 | P a g e
example, bonuses available for staff willing to be multi-skilled; training and learning, for
example, front line staff having enhanced interpersonal and social skills; careful recruitment and
selection, for example quality recruitment, zero defects recruitment, right first time recruitment;
employee involvement, for example, keeping employees informed of key changes in the
organisation; team working and flexible job design, for example, encouraging a sense of
cohesiveness and designing empowered jobs; and performance appraisal with links to contingent
reward systems, for example, gathering customer feedback to recognize the work done by
employees over and above their expected duties, which in turn is likely to lead to a bonus for
staff.
1.6.2.1 Recruitment and selection
The two words are used interchangeably to mean the same but they are different. Recruitment is
the process by which organizations identify and attract individuals to fill job openings (Amin,
2014; Armstrong, 2012; Fisher, 1999; Noe, 2008; Ritson, 2011). Recruitment constitutes one of
the major functions of HRM because it helps organizations identify and acquire the best pool of
employees that in turn lead to better organizational performance (Redman, 2012).
Selection is the process of reducing the number of applicants and choosing those with relevant
qualifications (Bohlander & Snell, 2007). Without proper selection the organization cannot
achieve its objectives and experience human resource management problems including low
productivity, high employee turnover, employee stress and high absenteeism rates (Storey, 2007;
Way et al. 1998; Weil, 1995).
Recruitment and selection activities are important to an organisation because they help it identify
and select employees with the right skills, abilities, knowledge and attitudes who will help meet
the strategic goals of the firm. Organisations require talented and skilled workers (Liao & Chu,
2006) that create cooperation and cultural fit with the organisation (Williams, 2001) and
competitive advantage.
9 | P a g e
1.6.2.2Training and Development
Training is the process of equipping new or existing employees with abilities, skills and
knowledge to enable them perform better in their current jobs (DeNisi & Griffin, 2001; Li et al.
2008). It modifies employee skills and attitudes (Herold & Fedor, 2003). Training improves
employees’ capabilities which are crucial in improving overall organizational performance
(Mackelprang et al. 2012; Millar & Stevens, 2012). This study used five items referring to
individual and team training and development: monitoring training and development, individual
and team training and development, work design, and performance appraisal (Katou & Budhwar,
2007).
Development is the process by which employees acquire abilities; skills and knowledge to enable
them perform better in their future responsibilities (Li et al. 2008). Two were used referring to
competency, cooperation between management and employees, cooperation among employees.
This is so because although competencies are assumed to be foundational to all performance
improvement (Harde, 2003; Hortwitz, 1999;), they are not sufficient for improving
organisational performance unless employees are cooperated and motivated (Lopez et al. 2005).
1.6.2.3 Performance appraisal
Performance appraisal is the process of assessing employee performance by determining and
communicating how well the employee is performing on the job (Byars & Rue, 2004). It is an
objective employee assessment that includes an outline of improvement measures (Osman et al.
2011). It involves bi-annual and annual interviews between the subordinate and the superior to
discuss job performance for the previous half year or year and subsequent action plans to
improve performance (John & Steven, 2000). Previous research shows significant relationship
between performance appraisal and organizational performance (Khan, 2010; Qureshi et al.
2010; Abdullah, 2009). On the other hand, ineffective appraisal can lead to low morale,
decreased employee productivity that decrease organizational performance (Osman, 2011).
1.6.2.4 Compensation
Compensation is any monetary or non-monetary reward given to employees for their
contribution to the organization (Pedro & Vicente, 2007). Compensation may directly or

10 | P a g e
indirectly affect employee attitudes of satisfaction and motivation that leads to diminishing
employee behaviour of turnover, retain competent employees, enhance performance and disputes
(Katuo, 2012, Pedro &Vicente, 2007). It helps improve quality of products and services and
increases sales (Venkatesh, 2006; Chiu et al. 2002)
1.6.3 Employee Attitudes
Employee attitudes are viewpoints about aspects of the job, careers and their organisations
(Saari, 2004). The work situation and the work itself are the major causes of employee attitude.
Judge and Church (2000) found that when employees were asked to rate different facets of their
job such as pay, promotion, supervision, co-workers etc; the nature of their job emerged to be the
most important affecting their job satisfaction.
Employee attitudes are affected by sound selection methods and a good match between
employees and the job. Selection should ensure employees are selected and placed into jobs most
appropriate for them which in turn help to build their job satisfaction, motivation and
commitment. When employees are trained and developed; when their performance is evaluated
and are informed of how well they are doing; and when their efforts are appropriately rewarded;
they become motivated, satisfied and committed. Katuo and Budhwar (2006, 2008) and Katuo
(2010) classified employee attitudes as motivation, commitment and satisfaction. When
employees are happy they tend to be more productive (Saari, 2004).
1.6.3.1 Commitment
It is the psychological attachment that binds the employee and the resultant loyalty an employee
has for the organisation (Armstrong, 2012; Meyer, Allen 1991; Ritson, 2011). Committed
employees have positive feelings about the firm, are involved and attached to the firm. They feel
obliged to remain with the firm (Meyer, 2002).
1.6.3.2 Satisfaction
It is an employee attitude about how contented he or she is about the job (Nel, 2004). It is
measured using satisfaction survey which assesses issues related to workload, compensation,
perceptions of management, teamwork, flexibility, resources etc. (Armstrong, 2012; Rafique,
11 | P a g e
Tayyab, Kamran, Ahmed, 2014; Ritson, 2011). These issues are very important for firms which
want to retain their employees, keep their employees happy and reduce turnover.
1.6.3.3 Motivation
It is the organisational systems of practices designed to stimulate intrinsic motivation (Hartog &
Verburg, 2004). Motivation is encouraged by such factors as management and leadership
actions, treating employees with respect, employee recognition, above industry to average
compensation and benefits (Tamer & Elliot, 2015).
1.6.4 Employee Behaviours
Motivated, satisfied and committed employees develop organisational citizenship behaviour
(OCB) which is discretionary job performance (Youndt et al. 1996). In OCB employees go
beyond their prescribed job requirement behaviours that are not recognized by the formal reward
systems (Mester, 2003; Organ, 1988). Employees are engaged in helping behaviours towards
individuals and the organisation (Mester, 2003; Organ, 1988). Essentially all employees have the
capacity to display discretionary behaviour but it rests with the organisation to trigger these
behaviour that lead to higher organisational performance beyond basic job requirement
(Hutchinson, 2003). This study has classified employee behaviour as turnover, absenteeism and
disputes. It is important to note that these are negative employee behaviours.
1.6.4.1 Employee Turnover
It is the measure of how long employees stay with the firm and also how often employees have
to be replaced (Khan, 2014; Price & Mueller, 2001). Turnover can be voluntary where the
employee by his own volition decides to quit. Involuntary turnover is when the employee has
been laid off for many reasons (Khan, 2014).
Turnover can cost an organisation directly or indirectly and affect its performance. Direct costs
include the cost associated with relocation, pay compensation, pay terminal benefits, hire and
train new employees to take up the vacated posts. Indirect costs are difficult to quantify but
include lost sales, lost customers due to lost business networks, inexperienced staff or short of
staff, loss of knowledge of the firm operations, lack of institutional memory, and loss of
important routines. These affect the firm performance (Khan, 2014)

12 | P a g e
1.6.4.2 Employee absenteeism
It is non-attendance at work. It could be caused by sickness, looking after a sick relation, annual
leave, compassionate leave, maternity, paternity, adoption, time off for public or trade union
activities, care for dependents, attending to funerals etc. It is a significant cost to a firm and
negatively affects firm performance (Bennet, 2002).
1.6.4.3 Disputes
It is any difference between an employer or employers’ organisation and employees or a trade
union, as to the employment or no-employment, or the terms of employment, or the conditions of
labour or work done or to be done, of any person, or generally regarding the social or economic
interest of employees (Labour Relations Act, 1996) The disputes affect organisational
performance through lost time, reduced production, lost sales and absence from work in the
event of strikes, stay a ways, go slow etc. (Walker & Hamilton, 2011)
1.6.5 Organisational performance
This is a dependent variable which measures the bottom-line on which HR practices have an
impact (Wang et al. 2002). The organisational performance construct is usually measured by
items such as effectiveness, i.e. if the organisation meets its objective; efficiency, i.e. if the
organisation uses the fewest possible resources to meet its objectives; development, i.e. if the
organisation is developing in its capacity to meet future opportunities and challenges, satisfaction
of all participants-owners and investors, customers, society, other organisations, and
organisational members, innovation, for products and processes, and quality, percentage of
products of high quality (Wang et al. 2002).
1.7 REVERSE CAUSALITY: ORGANISATIONAL PERFORMANCE EFFECT ON
EMPLOYEE BEHAVIOUR.
The issue of causality is, of course, implied, presupposed or presumed in research on the HRM-P
link i.e. introducing some bundle of HRM practices causes increased performance. This is
forward causality. The same assumptions are applied in reverse causality that organisational
performance in return (in reverse) causes changes in HRM practices. The whole point of this
research is based upon the belief that there exists a statistical association (a causal claim)

13 | P a g e
between organisational performance and employee behaviour so that a causal claim can be made,
to the effect that organisational performance motivates employee behaviour.
This study then, tests a prediction or hypothesis to the effect that these organisational
performance indicators are associated with employee behaviour. Three important ideas are
assumed in this empirical research on organisational performance and employee behaviour
reverse linkage. These are that (i) the reverse relationship exists (ii) the existence of the reverse
relationship can be established or tested using typical quantitative techniques and (iii) the
relationship is negative and flows from organisational performance to employee behaviour.
In examining the Human Resource management practices and organisational performance
relationship, it is implicitly assumed that HR practices lead to organisational performance. It is
noted that HR practices influence organisational performance directly as in hypothesis 5 or
indirectly through employee attitudes and behaviours as in hypotheses 3 and 4. Training can
improve efficiency directly, by improving employee knowledge, abilities and skills.
Compensation and promotion can improve organisational development indirectly through
improving employee attitudes of satisfaction and motivation thereby diminishing employee
behaviours of turnover and disputes. The positive employee behaviours affect organisational
behaviour. An organisation that is performing well assures employees as a going concern and
real wage rises thereby making employees stay longer with the organisation (counter of
turnover). Real wages rise reduce instances of disputes.
This study is an extension of Katuo (2012) work. While Katuo studied the reverse causality of
organisational performance on HRM policies; this study examined the reverse causality of
organisational performance on employee behaviour. Furthermore; while Katuo used four HRM
policies (Resourcing, Development, and Rewards and Relations) this study used four generic
HRM practices (recruitment & selection, training & development, performance appraisal and
Compensation). Katuo used subjective organisational performance indicators of effectiveness,
efficiency, development and stakeholder satisfaction in service industry. This study applied
manufacturing specific organisational performance indicators of cost reduction, time
14 | P a g e
(Throughput), quality improvement and flexibility. Both studies used control variables except
that Katuo used two variables (sector and firm size) while this study used three variables (firm
age, size and union intensity). Both studies used generic business strategies, employee attitude
indicators and employee behaviour indicators.
1.8 CONTROL
Three control variables of firm age, size and union intensity were included in the Human
Resource practices and organisational performance model of the research design to avoid results
of the analyses being erroneous (Boselie et al. 2005).
Age of the firm was considered in order to make sure the firm is not new so that they may not
have put in place the human resource management practices. Age of the organisation was
determined as when it was established. In this study, organisations that are three years old and
beyond were considered.
Firm size was based on the logarithm of number of employees. In this study size refers to
medium and large organisations i.e. 20 employees and above. This was controlled because
medium and large firms are more likely to establish Human Resource practices due to economies
of scale (Huselid, 1995; Datta et al. 2005). Medium and Large firms have more resources than
small enterprise firms as such they can afford to introduce a range of human resource practices.
Union intensity was based on the number of employees as union members expressed as a
percentage. According to the Malawi Labour Relations Act No 6 of 1996; a firm is considered
and recognised for collective bargaining if it meets the threshold of 20% of the total number of
employees.
1.9 OVERVIEW OF THE STUDY.
Chapter 1 has dealt with the antecedents of HRM practices and organisational performance
relationship model. It further discussed the concept of reverse causality investigating whether the
performance of an organisation motivates how employees behave at work. It also focused on the
definition of the research domain, the objectives of the study and the importance of this research.
15 | P a g e
Chapter 2 is a comprehensive literature review, with the main concepts of the study being
discussed in detail. Definitions and conceptualisations of business strategy, human resource
management practices, employee attitude, employee behaviour, organisational performance,
control variables and reverse causality have been provided.
Chapter 3 is a detailed discussion of the methodology. It provides a detailed description of the
research design, the sample and the data collection procedures that have been employed. The
measuring instruments used for each of the variables in the study are defined and described.
Furthermore, the statistical analyses used to analyse the data are discussed.
Chapter 4 presents the research results. It describes the data analysis in detail, providing the
results of the analyses. Furthermore, it reports on the testing of the research hypotheses that were
hypothized.
Chapter 5 presents Discussion, conclusions and recommendations of the study. The results are
interpreted and discussed. Limitations of the study and suggestions for improving future research
are also proposed. Managerial and theoretical contributions of the study are stated. It ends with
managerial implications and concluding remarks.
1.10. SUMMARY
The chapter has dealt with the antecedents of HRM practices and organisational performance
relationship model. It further discussed the concept of reverse causality investigating whether the
performance of an organisation motivates how employees behave at work. It also focused on the
definition of the research domain, the objectives of the study and the importance of this research.
The next chapter reviews literature relating to the study and discusses theoretical perspectives
underpinning the study.
16 | P a g e
CHAPTER TWO
LITERATURE REVIEW
2.1 CHAPTER OVERVIEW
This chapter reviews literature on general human resource management theories as they apply to
human resource practices and firm performance. Brief reviews of methods and results obtained
by other research works on the topic have been reviewed. Literature has been reviewed on
contemporary scholarly debate on the relationship between human resources practices and firm
performance and reverse causality to identify what has already been empirically studied in order
to distinguish this study from prior studies. Theoretical perspectives are discussed explaining
their relevance to the study. Some empirical studies based on the theoretical perspectives are also
included. Research gaps have been identified from the review and articulated.
2.2 INTRODUCTION
The first systematic empirical studies on HRM- performance linkage were published in 1994
(Arthur 1994, 1995; McDuffie, 1995; Huselid 1995). Although the bulk of literature seems to
accept that HRM practices have a significant impact on organisational performance, there are
however two different approaches in scientific literature. Edgar, Geare, (2009) and Paauwe
(2009) argue that there is the conviction concerning the link while others doubt about the link
and/or even denial about the link itself. Studies about the relationship between HRM practices
and organisational performance have focused on both manufacturing and service sectors using
both objective (financial) and subjective (non-financial) performance measures. These studies
have largely considered forward causality with a few studies focusing on different aspects of
reverse causality.
2.3 CONCEPTUALISING THE CONSTRUCTS
2.3.1 Human Resource Management
According to Storey (1995; 2007); Hall and Torrington (1998), Human Resource Management is
a distinctive approach to employment management which seeks to obtain competitive advantage
through deployment of a highly committed and skilled workforce, using different techniques.

17 | P a g e
Furthermore, human resource management is concerned with examining how employees can be
made more productive and satisfied (Racelis, 2010). To achieve this, organisations must regard
the development of superior human resources as an essential competitive requirement that
requires good and careful planning, hard work and evaluation (Ivancevich, 2003; Racelis, 2010).
Employees being a source of competitive advantage require that firms must adopt human
resource practices that make the best use of its employees.
Similarly, HRM also results in profitability gains, high company survival rates and stock prices
increasing. Huselid, (1995) in a study of 968 firms found that a one standard deviation increase
in high performance work practices was associated with a relative decrease of 7.05% in staff
turnover. Similarly, Terpstra and Rozell, (1993), found a positive relationship between use of
human resource staff practices and profit growth. Guest (2002) argues that how HR practices
impact on organisational performance depends on how employees respond to HR practices. This
implies that negative employee perception leads to low performance and vice versa. Ekaterini
(2010); Wright et al. (1994) and Huselid (1995) reaffirm that the nature of the human capital and
how it is managed have an impact on employees and firm performance.
According to Koch and McGrath (1996); HRM can help organisations improve organisational
behaviour in areas like staff commitment, competency and flexibility, which in turn lead to
improved staff morale and eventually better organizational performance. To develop a sound
HRM system, the firm needs effective HRM practices. So, what are these human resource
management practices?
2.3.2 Human Resource Management Practices
According to Schuler and Jackson, (1987); Schuler and MacMillan, (1984); Wright and Snell,
(1991) HRM practices refer to organisational activities directed at managing the pool of human
resources and ensuring that the resources are employed towards the fulfilment of organisational
goals. These practices differ from one organisation, country and industry to another.
Different researchers have attempted to identify the type of HRM practices applicable in
different sectors. Pfeffer (1994) identified 16 practices which are known as “best practices”. This
18 | P a g e
was later reworked to seven practices (citation): employment security; selective hiring; extensive
training; reduction in status differences; self managed team and team works; high compensation
contingent on performance of organisation and information sharing.
However, according to Chandler and McEvoy (2000), one of the questions that must be
addressed in HRM research is whether or not there is a single set of practices that represent a
“universally superior approach” to managing people. Theories on best practices or high
commitment suggest that universally, certain HRM practices, either separately or in combination
are associated with improved organisational performance.
In Redman and Matthews (1998); Marler (2013), a “HRM bundle” of key practices which
support service organisations quality strategies was identified and these are: (1) extensive
remuneration systems, for example, bonuses available for staff willing to be multi-skilled; (2)
training and learning, for example, front line staff having enhanced interpersonal and social
skills; (3) careful recruitment and selection, for example quality recruitment, zero defects
recruitment, right first time recruitment; (4) employee involvement, for example, keeping
employees informed of key changes in the organisation; (5) team working and flexible job
design, for example, encouraging a sense of cohesiveness and designing empowered jobs; and
(6) performance appraisal with links to contingent reward systems, for example, gathering
customer feedback to recognize the work done by employees over and above their expected
duties, which in turn is likely to lead to a bonus for staff.
Saxena and Tiwari (2009) examined the HRM practices implemented by leading IT companies
in India like TATA, Infosys and Wipro. They developed the 3cTER Framework of HRM
practices and identified: Employer-Employee Relations; recognition through rewards; training
and development; career Development; culture building; compensation and benefits as important
HRM Practices.
2.3.3 Nature of Human Resource Management Practices
Human Resource Management researchers have devoted significant efforts towards
demonstrating that the ways people are managed, especially through HRM practices; have strong
19 | P a g e
linkage with performance (Buoziute, Rafanaviciene, Pundziene & Turauskas, 2009; Guest, 2011;
Pundziene, Alonderiene, Buoziute, 2007). However, there appears to be no agreement on the
nature of HRM (Paauwe & Boselie, 2005). There is no single agreed or fixed list of HR practices
or systems of practices that are used to define or measure human resource management.
HRM practices have been described differently by different authors. Bjorkman, (2001) described
them as “High-performance practices” which Huselid, (1995) listed as: comprehensive employee
recruitment and selection, incentive compensation and performance management systems, and
extensive employee involvement and training. It has been demonstrated that these practices do
improve abilities, skills and knowledge of current and potential employees, reduce shirking,
increase their motivation and retain quality employees while encouraging poor and no
performers to leave (Racelis, 2010). Some authors have tried to categorize HRM practices as
“high performance work systems- HPWS” (Appelbaum et al. 2000). Others have described them
as “high commitment management” (Arthur, 1994; Pfeffer, 1998; Wood and de Menezes, 1998)
or “high-involvement” (Guthrie, 2001). However; positive results appear to be revealed
regardless of the definition of HRM practices and the combination of the HRM practices. This
explains why scholars have used different combinations of HR practices like Katuo, 2012 (12
items) Gamage, 2015 (4 items), Boselie, 2005 (26 items) but each finding positive relationships
between HR practices and firm performance.
Huselid (1995) seminal work investigated 11 HRM practices (personnel selection, labour
management participation, incentive compensation, performance appraisal, grievance
procedures, information sharing, job design, attitude assessment, recruitment efforts, promotion
criteria and employee training and found a significant positive relationship between high work
practices like compensation and employee outcomes (Muchhal, 2014). Similarly, Teseema and
Soeters (2006) investigated 8 HR practices (recruitment and selection, placement, training,
compensation, employee performance evaluation, promotion, grievance procedure, and pension
or social security) and found positive relationship between HR practices and employee
performance (Jiang et al. 2012). On HRM practices (compensation, promotion and performance
evaluation) relationship with University lecturers’ performance in Pakistan; it was revealed that
20 | P a g e
compensation and promotion were significantly correlated with performance (Shezad et al. 2008;
2011). Compensation had a strong and positive significant relationship with lecturers
performance implying that the more lecturers are compensated fairly, the more they will perform
better. Promotion and performance evaluation were insignificant because these are usually vague
and not properly and fairly practiced (Shezad, 2011)
Furthermore, Delaney and Huselid (1996) used recruitment and selection, training and
development, participation and reward as HR practices. Employee productivity, product quality
and firm flexibility improves by use of training and development, team work, performance
appraisal, compensation/incentives, human resources planning and employment security as HR
practices by Lee and Lee, (2007). Qureshi et al. (2010) identified selection system, training, job
definition, performance appraisal, compensation, and career planning and employee participation
as HR practices.
Similarly, Boselie et al. (2005) identified 26 different practices that are used in different 104
studies, of which the top four, in order of popularity were: (1) training and development; (2)
contingent pay and reward schemes; (3) performance management (including appraisals); and (4)
careful recruitment and selection. Likewise, Nyandiko and Ongeri (2015), Gamage, (2015);
Dessler, (2008), Katuo & Budhwar, (2007) and Fisher (2006) applied the same four HRM
practices.
Consequently, this study applied these same four HRM practices as they generally reflect the
main objectives of the majority of strategic HRM programmes, which are, to identify and recruit
strong performers, provide them with the skills and confidence to work effectively, to monitor
their progress towards the required performance targets and reward staff well for meeting or
exceeding them (Batt, 2002; Paauwe & Boselie, 2005). These practices broadly correspond to the
so called High Performance Work systems; and are associated with AMO theory (Paauwe, 2009;
Edwards & Wright, 2001). Furthermore, these four HR practices are synergetic as they feed into
each other.
21 | P a g e
2.3.4 Factors Affecting Human Resource Management Practices and Firm performance.
HRM practices differ from one country, organisation and industry, to another. Factors which
affect implementation of HRM practices include external as well as internal (Ozutku &
Ozturkler, 2009). This is partly because different countries operate in different political,
economical, social and technological contexts resulting into different labour laws and practices.
Internal factors affecting Human Resource practices include: organisational size, (McPherson
2005; Jackson et al. 1989); organisational structure,( Garwin, 1986; Hudson et al. 2000);
business strategy, (Milkovichan & Boudreau 1991; Schuler 1992); human resource strategy,
(Gatavan et al. 2008); history, tradition and past practices, (Pardo & Fuentes, 2003); top
management, (Kane & Palmer 1993); Ondrack & Nininger, 1984line management, (Alas et al.
2008; Okpara & Wynn, 2007); academic and professional influences, (Kane & Palmer 1995).
External factors affecting HR practices include: economic changes, (Saton & Wang, 1994);
technological changes, (DeFillipi, 2002, Gatavan et al. 2008); national culture, (Chandrakumara
& Sparrow, 2004); legislations and regulations, (Kane & Palmer, 1995); actions of competitors,
(Poole & Jenkins, 1996; Narsimha, 2000), actions of unions, (Kochan et al. 1984) and
globalization, (Tayeb, 1998). This study took into consideration firm age (3 years and above),
firm size (medium to large employing 20 and above employees) and union presence as important
factors affecting HRM practices and firm performance.
2.3.5 Human Resource Policies Vs Human Resource Practices
Some studies have used HR policies (Katuo, 2012) others have used HR practices (Bharti, 2015;
Ogunyomi & Bruning, 2016; Mukanzi, 2013; Ogunyomi & Bruning, 2016). How do these differ
and how do they impact on firm performance? Human Resource policies and practices have been
used interchangeably to mean the same thing in other studies. Policies refer to activities for
employees and done by employees while practices are ways or methods by which the policies are
implemented (Torrington, 2014).
2.4 MANUFACTURING PERFORMANCE
Manufacturing performance refers to a measure of how firms in the manufacturing sector are
performing compared to manufacturing indicators (Pintzos, 2012). Manufacturing firm

22 | P a g e
performance can be looked at from the socio-economic perspective that looks at profit as the
most common feature of the firm’s performance. Other indicators are: internal rate of return,
productivity, effectiveness, capacity utilization, market share, growth of output, and net present
value (Leong et al. 1990; Ward et al. 1995 & 1998; White, 1996).
While it is widely accepted to use objective indicators to measure manufacturing performance
like financial indicators; the accountancy protocols on which financial indicators are criticised
for lacking credibility. This is so because of a number of corporate financial scandals where
accounting records have been cooked to portray a false picture of the firm performance. This
makes financial indicators not to be very reliable indicators. The Enron scandal is a case in point.
Furthermore, managers are more likely to act on the basis of their subjective perceptions of firm
performance, often in relation to performance of competitors than solely on objective
performance.
Furthermore, Wright et al. (2003) argue that financial performance lies at the distant end of the
causal chain, and that outcome measures that are more closely linked to HRM might be more
appropriate to consider. This is consistent with literature of the measures that have been reported
like labour turnover, aspects of productivity (Sirmon, et al. 2003). It is therefore important to use
a range of proximal (closer) than distal (distant) measures and examine how HR practices relate
to each of these.
Accordingly, many researchers agree that we need to use more non-financial performance
measures relevant to the organisation’s own situation and adequately gauge manufacturing
performance. These provide a better description of what goes on in the production of goods than
what financial measures do. Examples of non-financial measures of performance are efficiency,
dependability, quality, product and volume flexibility, cost reduction, high performance design,
on time delivery and reliability (Skinner, 1974; Hayes & Wheelwright, 1978; Krajewski &
Ritzman, 1987; Hill, 1989; DeMeyer, 1990). Two later studies, Ward et al. (1995 & 1998) factor
analyzed items relating to manufacturing priorities into four being (1) cost, (2) quality, (3) time

23 | P a g e
and (4) flexibility. This study adopted these same measures because they relate to manufacturing
measures of performance.
2.5 HUMAN RESOURCE MANAGEMENT IN MALAWI
Malawi is a member of the World Federation of People Management Associations (WFPMA)
through the Africa block of Africa Human Resources Confederation (AHRC) comprising 28
African Countries 1(WFPMA, 2014). Locally, the Institute of People Management Malawi
(IPMM) incorporated in 1984, is a professional association of HR managers aimed at promoting
human resource management in Malawi. The institute has developed a piece of legislation,
which is not enacted yet, to guide the practice of human resource management in Malawi in
order to bring order to the profession. This legislation aims at ensuring that only qualified HR
personnel are allowed to practice.
Human Resource Management is guided by the Labour Laws which include: Malawi constitution
(1994), the Labour Relations Act of 1996 (CAP 54:01); Occupational Safety, Health and Welfare
Act No. 21 of 1997 (CAP 55:07); the Employment Act No 6 of 2000 (CAP 55:01), and Workers
Compensation Act No. 7 of 2000 and the Pension Act of 2011. These provide minimum
provisions that affect how employees are used at work leading to organisational performance. In
terms of recruitment and selection, organisations are required not to recruit children less than 14
years (Employment Act, 2000). The law provides K962 per day (K25, 012.00 per month) as the
minimum wage (1US$=K730). Firms that pay way above this can motivate their employees and
diminish employee turnover. The Law provides 8 hours of work per day and maximum of 48
hours per week (employment Act, 2000). Firms can exceed this limit and pay employees over
time in order to meet their productivity targets. These laws place a lot of focus on employee
rights at the workplace.
1 Algeria, Angola, Benin, Botswana, Burkina Faso, Cameroon, Chad, Ethiopia, Kenya, Malawi, Mali, Mauritania,
Mauritius, Morocco, Namibia, Niger, Nigeria, Rwanda, Senegal, South Africa, Swaziland, Tanzania, Togo, Tunisia,
Uganda, Zambia, Zimbabwe.
24 | P a g e
In general some of the critical provisions include (1) non-discrimination based on sex, gender,
colour, race, religion, gender, height when employing people; (2) the right to equal pay for work
of equal value on legal tender; (3) minimum wage of K976/8 hr day; (4) employer to provide an
itemized pay statement i.e. pay slip; (5) no unauthorized deductions on anybody’s pay and even
if authorized; it should not exceed 50% of the employee’s net pay (Employment Act, 2000).
When employees’ services have been terminated; payment (severance, notice pay, holiday pay,
salary in lieu of notice) must be paid within 7 days (sec 53(1). Similarly; pension benefits must
be made available within 6 weeks (employment Act, 2000: 53(2))
The country is however faced with lack of enforcement mechanisms of these labour provisions.
There are no human resource management enforcement agencies to police enforcement of labour
laws like we have the Bureau of Standards which enforces adherence to certain standards,
Medical Council that polices how the medical profession operates; Road Traffic which enforces
adherence to traffic regulations by making snap checks on vehicles. No one monitors whether the
minimum wage, the hours of work, payment of terminal benefits within six weeks of
termination, among others, are adhered to. This promotes a lot of industrial unrest and abuse in
Malawi.
All employees on first appointment pending permanent established position are subjected to
probation period, i.e. period of observing the employee performance. The probation period
depends on the firm specific conditions of service. However, the Employment Act (2000) section
26 provides that probation period shall not, in any event, exceed 12 months. Many firms do not
follow this provision as many employees can go up to ten years without being confirmed. This
adversely affects employee motivation. However, due to high unemployment rates, employees
do not ask for their confirmation for fear of reprisals.
Government and private sector organisations use both internal and external recruitment methods
through advertising of the vacant positions. Appointments are made on merit and open to all with
relevant qualifications and experience. Top positions appointments are normally made by the
Board while Management of the firm handles recruitment for lower positions.

25 | P a g e
The human resource management practices used in Malawi are not different from what literature
highlights like the high-performance work systems as well as the traditional human resource
management practices of recruitment and selection; training and development; performance
appraisal and compensation. However, these HR practices are engrained in the culture of Malawi
e.g. where the employer is responsible to provide a coffin, transport and be present during burial
and are expected to speak. Burial is usually a day after one’s death and workmates are expected
to attend and pay their last respects leaving the organisation work.
Like many countries in the world and the region, in Malawi HRM professionals have been
affected by HIV/AIDS, social, economical and political challenges like political instability,
inflation, globalisation and a call to corporate governance. This calls for the profession to meet a
lot of employee demands in order to match the cost of living influenced by these factors. Malawi
is currently coming up with a qualification framework for human resource.
2.6 THE MALAWI MANUFACTURING SECTOR.
According to Comesa (2009) the Malawi industrial sector contributed 19% to GDP in 2009,
while manufacturing alone contributed 10% which had been at this since 2000’s (World Bank,
2010). In analyzing employment in Malawi in 2010; it was noted that manufacturing plays a
fairly small role in Malawi’s economy as it only attracted 5% of the working population; while
80% are involved with agricultural labour (ILO, 2010). This shows how under developed the
manufacturing sector is.
Main players of the manufacturing sector are textiles, footwear and clothing, agro processing
(tea, sugar, tobacco, soya, and macadamia nuts) and building materials i.e. cement and joinery
(World Bank, 2012). World Bank (2010) observed that manufacturing market is limited due to
the small domestic market. However, with the new initiatives government is implementing of,
among others, promoting purchase of locally made goods; this is likely to change. Low
productivity, high transport costs and shortage of skilled workers limit the capacity for exporting
manufactured goods (World Bank, 2010)

26 | P a g e
2.7 HUMAN RESOURCE MANAGEMENT RESEARCH PERSPECTIVES
Human Resource management and organisational performance research is advanced both
theoretically and empirically (Huselid, 1995, Huselid, Jackson & Schuler, 1997; Pfeffer, 1994).
Academic literature takes various perspectives exploring and demonstrating the value that HRM
adds to organisations. These perspectives are four: (1) the universalistic, (2) contingent, (3)
configurational and (4) contextual (Martin-Alcazar, Romero-Fernandez & Sanchez-Gardey,
2005).
2.7.1 The Universalistic or “Best Practice”
It argues that in order to beat competitors, firms need to identify and implement “best HR
practices” regardless of the firm context (Boxall & Purcell, 2000). This also implies that the
relationship between a dependent and an independent variable is universal across firms (Beer et
al.2015). It further assumes that: (1) there is a linear relationship between HR practices and
organisational performance; (2) “best practices” are universally accepted and successful; (3)
organisational performance is best measured in terms of financial performance like profits,
market share and sales levels.
Various empirical research support this model (Delaney & Huselid, 1995, Ichniowski & Shaw,
1999; Koch & McGrath, 1996; Pfeffer, 1994; ; Terpstra & Rozell, 1993) who investigated HRM
practices and showed their positive impact on organisational performance, measuring a number
of key indicators. Other studies investigated the effect of HR bundles on performance (Becker,
Huselid, Pickus & Sparatt, 1997; Huselid, 1995; Youndt, Dean & Lepak, 1996). The thinking is
that bundles (a system) of HR practices are more than the sum of its parts consequently; they can
better enhance organisational performance than single HR practices (Perry-Smith & Baum,
2000). A bundle refers to interrelated and internally matching practices, which create conditions
supporting employee motivation that leads to better performance (MacDuffie, 1995)
Proponents of this perspective argue that there is an identifiable set of best HRM practices which
have universal, additive and positive effects on firm performance (Laugen & Boer, 2007).
However, these authors have little agreement among themselves regarding which HRM practices
lead to better performance (Becker & Gerhart, 1996). High-performance work systems studies

27 | P a g e
differ regarding HR practices to be included. According to Delaney, Lewin and Ichniowski,
(1989) these include selection, performance appraisal, incentive compensation and job design.
However, Huselid (1995) adds on three more. Pfeffer (1994) uses 16 practices while Hoque
(1999) uses a list of 23 HR practices.
The notions sound logical and reasonable because use of a greater range of identified HRM
practices is better than using fewer or single practices in promoting organisational performance.
However, the perspective has been challenged for a number of limitations. Purcell (2001) argues
that by adopting “best HR practices” model both individually or collectively; firms are likely not
to differentiate themselves with other firms in the competition. It is like all firms will adopt the
same practices and no firm will have competitive advantage.
Similarly, it is argued that organisations differ in their goals, technology use, information
systems, their competitive environments as well as the nature and characteristics of their staff.
This poses a challenge for managers to adopt one approach and succeed.
Best HRM practices can add or destroy value depending on the competencies of management.
Boxall and Purcell (2000) question what goals are served by the “best practice” perspective? Is it
survival or seeking sustained competitive advantage? Boxall and Purcell argue that if the goal is
survival, then all firms have to implement it to remain viable in business, which is impossible
logically. Furthermore, if it aims at achieving sustainable competitive advantage; then only a few
organisations can achieve it and the best practice then ceases to be universal.
The other question is whose goals are being served by the best practice perspective. Are they
good for both shareholders and employees’ interests? If they are for both, then no one will object
to them, and will likely be abandoned if they are bad for both parties. If the practices are good
for shareholders and bad for employees, then the conflicting interests between shareholders and
employees will arise resulting in poor organisational performance (Lewin, 2001). The
perspective does not take into account differences in culture and institutional settings.
28 | P a g e
The other problem of the universalistic approach is diffusion and the question is: if best practices
do exist, why then do smart organisations do bad things? (Pfeffer, 1996; Purcell, 1999). The
linear and over simplistic logic of the model is also criticized for failure to account for impacts of
moderating variables like business strategy, firm size, union intensity, the environment and stage
of life cycle of the firm (Boxall & Purcell, 2001). In view of all these, researchers have shifted
their research interest to alternative models like the contingency perspective (Purcell, 1999).
2.7.2 The Contingency perspective
Baird and Meshoulam (1988) proposed a stage matrix for HRM activities by clearly discussing
the “fit” issues between HRM and other factors like organisational life stage and strategy. In
order to achieve business success, the firm must fit its HR activities with two factors
simultaneously (Baird & Meshoulam, 1988); (1) fit with the organisation evolution stage i.e.
from informal, (more flexible younger organisations) to more formal and professional as the firm
matures (Boxall & Purcell, 2000). This fit is termed “External” or “vertical”. (2) The firm must
also have “internal or horizontal” fit where HR policies and practices support each other.
Delery and Doty (1996) argue that the relationship between the relevant independent variable
and the dependent variable varies based on influences like company size, company age,
technology, and capital intensity, degree of union intensity, industry/sector, ownership and
location. This underscores the importance of contingency factors on HRM practices as well as on
organisational performance. Most literature proposes that HRM performance linkage is largely
influenced by competitive strategies of the firm. Becker et al. (1997) and Guest (1997) present
two models to show the impact of business strategy on HRM and performance linkage, which are
different in content but similar in format.
Becker et al. (1997) proposes a model that suggests business strategy shapes HRM system which
in turn influences excellence leading to firm performance. It is argued that best practice is only a
necessary condition but not sufficient condition for organisation success. Strategic decisions are
crucial in helping individual HR practices align with other HRM practices to promote business
priorities. This underscores the importance of business strategies pursued by the firm in
stimulating organisational performance.

29 | P a g e
Guest’s (1997) model assumes that the underlying goal of any organisation is to attain positive
financial outcomes. Strategies chosen by an organisation will determine what HRM practices the
organisation adopts. In this model Porter’s three generic business strategies of cost leadership,
differentiation and focus were pursued (Ekatereni, 2010). Instead of HRM systems, the chosen
HR practices influence employees’ behaviour and firm HRM performance and financial
outcomes. It is also assumed that higher organisational performance can only be achieved when
HRM outcomes of commitment, quality and flexibility are attained. The two models share some
common characteristics i.e. the HRM practices and performance relationship is assumed to be
linear and causal. The vertical fit between HRM and strategies is emphasized. Superior
performance heavily lies on employee behaviour that is necessitated by strategy and reward and
controlled by HR practices (Paauwe, 2004).
Delery and Doty (1996) observe that the linear HRM –performance linkage by the contingency
perspective is more complex than the universalistic perspective. They observe that there exists an
interactive relationship between the variables instead of a one-way relationship. Further, the
relationship between the independent and dependent variable is different for various levels of the
main contingency variable. This means one has to select a theory of business strategy and specify
how HR practices interact with the business strategy to enhance firm performance. Furthermore,
the model does not consider the reversed causality.
However, there are a number of questions raised about this model e.g. how many boxes should
be there between HR practices and firm performance in the model and what should they contain
as constructs and variables? (Wright & Paauwe, 2004). Becker et al. (1997) included three boxes
of (1) employee skills, (2) employee motivation and (3) employee behaviour (productivity,
creativity, discretionary effort). Purcell et al. (2003) stressed the role of line managers, relevance
of skills, motivation and opportunity to participate as important boxes. Wright and Nishii (2006)
distinguished between intended and actual HRM practices. This shows that the number of boxes
cannot be definitive or complete.

30 | P a g e
Wright and Gardner (2005) question how many items should be in each box, relating to the
linearity of the models. Wright and Gardner suggest that the complex reality is oversimplified by
the linear and causal process in the models. Picturing the relationships between variables as
interactive has been an attempt made by some authors to address this weakness.
Researchers can add any number of boxes and content therein that they want; however, this
would make the study unmanageable. Boxall and Purcell, (2000) make similar observations that
the contingency model is too thick as it throws in everything including the” kitchen sink”. They
advocate models that focus on the important connections only. Hope-Hailey, Farndale and Truss
(2005) and Wright and Gardner (2005) argue that the primary issue in model development is not
the number of boxes but that any theoretical or empirical effort should at least specify some
mediating variables.
This study adopts the contingency research perspective, where in a linear and causal relationship;
business strategy moderates HR practices which in turn influence organisational performance
mediated by employee attitudes and behaviours. A reversed causality dimension is investigated
between organisational performance and employee behaviour arguing that the output of this
model which is organisational performance can become the input motivating and causing
employee behaviour.
2.7.3 The configurational perspective
This emphasizes the importance of internal aspects of the HRM function. It views HRM as a
multidimensional set of elements, which when combined in different ways can form an infinite
number of configurations (Luo, 2010) from which practitioners can pick different ideal patterns
of how to manage human resources efficiently and effectively (Martin-Alcazar et al. 2005). In
order to achieve good firm performance HRM systems must be consistent with organisational
conditions and the environment, and the system elements must be internally coherent (Doty,
Glick & Huber, 1993)
Paauwe (2004) argues that the configurational perspective is more complex than the
universalistic and contingency approaches. Firstly, the configurations or patterns of factors
31 | P a g e
indicate non-linear effects and are of higher order interactions that are not captured by the
contingency theories. The configurational perspective hereby assumes multiple unique
configurations of the factors that result in superior performance. The configurations remain
theoretical without empirical support (Delery & Doty, 1996). In this regard, achieving business
success there is need to identify HRM configurations which maximize the internal (horizontal)
fit, and link them to maximize the external (vertical) fit.
2.7.4 The Contextual perspective
This undertakes a descriptive and global explanation using a broader model. It seeks to explain
what is contextually different and why (Brewster et al. 1999). Attention has moved to the HRM
system relationship and its context (Martin-Alcazar et al. 2005). Contextual proponents argue
that context is conditioned by HRM strategy. The value that strategies add to the firm is not only
judged by their contributions to organisational performance; but also by how they influence other
internal aspects of the firm, like HRM functions and the external environment.
The contextual perspective is relatively new compared to the other three perspectives and has
been ignored by many reviewers. Contextual perspective limits its contribution to theoretical
development of HRM and firm performance linkage because of its descriptive nature. It is thus
required that HRM is studied in a broader environment thereby considering the influence of
different industries and nations; laying a foundation for international HRM (Ferris et al. 1999). It
also adopts a multi-stakeholder approach (Schuler & Jackson, 2000) incorporating interest and
influence of ignored stakeholders like unions (Guest, 1990).
The current study adopts the contingency perspective because it recognises the importance of the
environment of the organisation (strategy, firm age, size and union intensity). These factors have
an effect on organisational performance. Table 2.1 Highlights of various research perspectives
that guide research assumptions, levels of analysis, relationship between variables and
methodology employed.

32 | P a g e
Table 2. 1: Four Research perspectives
Perspective Basic Assumption Relationship
among variables
Level of
analysis
Methodology
Universalistic Existence of best
human resource
management
Linear, and can be
universally
generalized
Single practice:
One single
practice leads to
superior
performance
Sets of practices:
A certain set of practices leads
to superior performance. They
do not consider synergistic or
interdependent relationships or
integration mechanisms.
Additive focus.
Contingent There are no “best
practices”. HRM
effects depend on a
third variable such as
corporate strategy or
internal and external
environment
The relationship
between
dependent and
independent
variable will be
mediated by
contingency
variables
Single practice:
Many studies
with a contingent
perspective just
focus on a single
practice
Set of practices:
In some cases, studies with a
contingent perspective focus
on a set of practices, but again
without defining parallel
configurations. The effects are
also cumulative, and although
there are constant calls for
analyzing the internal fit, the
integration of practices is not
studied.
Configurational It is possible to
identify SHRM
patterns from the
combination of
elements that built the
HRM system. Those
patterns could equally
be efficient.
Focusing on how
the HRM patterns
affect the
organisational
performance as a
whole
They always
adopt systematic
level of analysis
Set of Practices.
HRM as a multidimensional
set of elements, which when
combined in different ways
can form an infinite number of
configurations from which
practitioners can pick different
ideal patterns of how to
manage human resources
efficiently and effectively
Contextual SHRM is understood
as something broader
than managerial
decisions. It is
considered as part of
a bigger social macro-
system that both
influences and is
influenced by the
HRM strategy.
HRM variables are
integrated into a
supra-system
Supra-
organisational
level of analysis
Set of practices:
Context is shaped by HRM
strategy.
Source: Adapted from Martin-Alcazar et al. (2005)
33 | P a g e
2.8 RELATIONSHIP BETWEEN CONSTRUCTS AND HYPOTHESIS DEVELOPMENT
In studying this relationship; human resource practices is the independent variable while organisational
performance is the dependent variable. Business strategy is the moderating variable moderating human resource
practices while employee attitudes and employee behaviour are mediating variables. These variables are
discussed below.
2.8.1 Business Strategy
According to Porter (2010) a business strategy refers to the direction and scope of an organization in the long
term. Business strategies classification will follow methodologies of Snell and Dean (1992), Youndt et al.
(1996), and Huang (2001). There are different strategies that a firm can pursue to gain and maintain competitive
advantage. Literature generally cites three generic strategies an organisation can pursue: (1) generic corporate
strategies (defensive, growth, stability and combination strategies) which are adopted and followed by the entire
organisation (Anthony, 1996; Katuo, 2012). Generic business strategies (cost leadership, innovation, and quality
enhancement) which adopt the idea of competitive advantage (Porter, 1985). (3) Competitive product strategies,
(defenders, prospectors, analyzers and reactors) which involves the strategic choices the firm takes in order to
link the firm with the environment. i.e. the product market and establish the firm business direct.
Katuo (2012) found that improvement of organizational performance depends heavily on business strategies
pursued by an organization. This finding is critical because it shows that business strategies provide the initial
driver in improving organizational performance. This is the reason firms must ensure that there is fit between
human resource practices and business strategy. Human resource management must be integrated with strategy
in order to gain competitive advantage (Bayo-Moriones, 2002). This study used generic business strategies
because literature has shown these to be powerful predictors of firm performance (Youndt, 1996). This was
measured by 8 items (cost reduction, customer service, distribution channels, quality enhancement, brand
image, innovation, improvement for existing products, wide range of products)
34 | P a g e
2.8.1.1. The cost leadership strategy
This entails being the low-cost producer in an industry for a given level of quality (Johnson & Scholes, 2010)
The firm sells its products either at average industry prices to earn a profit higher than that of rivals, or below
the average industry prices to gain market share (Johnson & Scholes, 2010).
2.8.1.2. The Innovation strategy
This demands the development of a product or service that offers unique attributes that are valued by customers
and that customers perceive to be better than or different from the products of the competition. The value added
by the uniqueness of the product may allow the firm to charge a premium price for it. The firm hopes that the
higher price will more than cover the extra costs incurred in offering the unique product (Johnson & Scholes,
2010; Porter, 2010 ).
2.8.1.3. The quality enhancement strategy
This concentrates on a narrow segment and within that segment attempts to achieve either a cost advantage or
differentiation. The premise is that the needs of the group can better be serviced by focusing entirely on it. A
firm using this strategy often enjoys a high degree of customer loyalty, and this entrenched loyalty discourages
other firms from competing directly (Porter, 2010; Johnson & Scholes, 2010).
.
The cost dimension is comprised of the cost reduction item; while the quality dimension comprises of customer
service, brand image, quality enhancement, and distribution channels items; and the innovation dimension is
comprised of; improvement of goods, innovation, and wide range of product items (Sanz-Valee et al. 1999).
2.8.1.4. Business strategies effect on Human Resource Management Practices
Two basic fundamental approaches exist in the Human Resource Management performance link debate. These
are the “best practice” approach and the “best-fit” approach (Wright & Gardner, 2003). The best practice
approach is also called the “universalistic model.” The approach advocates independence; supporting the idea
that business strategies and HRM practices are mutually independent in determining organisational performance
(Katuo & Budhwar, 2010). The best –fit approach also called contingency model advocates sequence,
supporting the idea that business strategies are followed by HRM practices in determining organisational
performance (Katuo & Budhwar, 2010). This study focuses on the contingency model as the preferred one
(Katuo & Budhwar, 2012; Torrington, Hall, Taylor & Atkinson, 2014).
According to Porter (1985) an organisation can pursue three generic business strategies and these are cost
leadership, innovation and focus. Johnson and Scholes (2010). Gomez-Mejia and Balkin (1992) contend that

35 | P a g e
the best strategy is one which is based on the resources of the organisation. Thus, Human resource practices can
only be effective if they are consistent with business strategies. A recruitment and selection plan will be
effective if it draws from the business strategy. Human resource requirements must be drawn from the
business strategy (Senyucel, 2009; Garner, 2012). Without regard to the business strategy, the organisation will
either be overstaffed or under staffed.
When pursuing an innovation strategy, organisations will emphasize HR practices that promote interdependent,
cooperative behaviour and foster the exchange of ideas and taking risks. In the case of a quality strategy, the
emphasis is on seeking to promote quality by ensuring highly reliable behaviour from individual employees that
identify themselves with the organisational goals. A cost leadership strategy, HR aims at maximizing efficiency
through monitoring by managers and closely controlling employee activities (Katuo & Budhwar, 2010; Schuler
& Jackson, 1987). This therefore suggests that business strategy is followed by human resource practices in
determining organisational performance (contingency theory). In view of this, the study hypothesizes that:
Hypothesis 1. There is a positive relationship between business strategy (cost, innovation and quality) and
human resource practices (recruitment and selection, training and development, performance appraisal and
compensation).
2.8.2 Human Resource Management Practices
Four human resource management practices have been identified because of their synergy.
2.8.2.1 Recruitment and selection
Recruitment is the process by which organizations identify and attract individuals to fill job openings (Amin,
2014; Fisher, 1999; Noe, 2008; Armstrong, 2012; Ritson, 2011; Mathis & Jackson, 2010). It is one of the major
functions of HRM as it helps organizations recruit and select the best pool of employees that in turn lead to
better organizational performance (Redman, 2012).
Bohlander and Snell (2007) define selection as the process of reducing the number of applicants and choosing
those with relevant qualifications. If the suitable applicants are not assessed through recruitment and selection;
the organized might recruit unsuitable candidates and fail to achieve its set objectives. The organisation might
also experience human resource management problems including low productivity, high employee turnover,
employee stress and high absenteeism rates (Storey, 2007). When the best people are selected for the job,
production increases (Mina et al.2012). Recruitment and selection activities help to search for desired skills of

36 | P a g e
employees. Organisations require talented and skilled workers (Liao & Chu, 2006) that create cooperation and
cultural fit with the organisation (Williams, 2001) and enhance competitive advantage.
2.8.2.2 Training and Development
Training refers to process of equipping new or existing employees with abilities, skills and knowledge to enable
them perform better in their current jobs (DeNisi & Griffin, 2001; Li et al. 2008). It aims at modifying
employee skills and attitudes (Herold & Fedor, 2003). Training improves employees’ capabilities which are
crucial in improving overall organizational performance (Mackelprang et al. 2012; Millar & Stevens, 2012). For
the training construct this study used five items referring to individual and team training and development:
monitoring training and development, individual and team training and development, work design, and
performance appraisal (Katou & Budhwar, 2010).
Development is the process by which employees acquire abilities; skills and knowledge to enable them perform
better in their future responsibilities (Li et al. 2008). Two items will be used referring to competency,
cooperation between management and employees, cooperation among employees. This is so because although
competencies are assumed to be foundational to all performance improvement (Hortwitz, 1999; Harde, 2003),
they are not sufficient for improving organisational performance unless employees are cooperated and
motivated (Lopez et al. 2005).
2.8.2.3 Performance appraisal
It is the process of assessing employee performance by determining and communicating how well the employee
is performing on the job (Byars & Rue, 2004). It is an objective employee assessment that includes an outline of
improvement measures (Osman et al. 2011). It involves annual interviews between the subordinate and the
superior to discuss job performance for the previous year and subsequent action plans to improve performance
(John & Steven, 2000). Previous research shows significant relationship between performance appraisal and
organizational performance (Abdullah, 2009; Khan, 2010; Qureshi et al. 2010;). On the other hand, ineffective
appraisal can lead to low morale, decreased employee productivity that decrease organizational performance
(Osman, 2011). For performance appraisal to be effective; employees must know what is expected of them and
how their performance and results will be measured by the organisation (Rosemond & Ernesticia, 2011)
2.8.2.4. Compensation
It is any monetary or non-monetary reward given to employees for their contribution to the organization (Pedro
& Vicente, 2007). Compensation may directly or indirectly affect employee attitudes of satisfaction and
motivation that leads to diminishing employee behaviour of turnover, retain competent employees, enhance

37 | P a g e
performance and disputes (Katuo, 2012, Pedro &Vicente). It helps improve quality of products and services,
increases sales (Venkatesh, 2006; Chiu et al. 2002)
2.8.2.5 HRM Practices effect on employee attitudes
In examining the relationship between Human Resource practices and organisational performance, many
researchers have argued that employee attitudes like satisfaction, motivation and commitment do mediate the
relationship between HR practices and organisational performance (Purcell & Hutchinson, 2007). A typical
example is where Delery and Doty (1996); argue that HRM practices positively affect organisational
performance through creation of staff that is committed and motivated. Another support for using employee
motivation as mediating variable between HRM practices and organisational performance is provided by Fey,
(2000). Guest (2001) applied employee commitment and satisfaction or employee flexibility, quality and
commitment, as mediating variables. Employee satisfaction and motivation were used as HRM mediating
outcomes between HRM practices and organisational performance by Boselie et al. (2001). Employee
motivation was used as mediating variable between HRM systems and organisational performance (Park et al.
2003).The intervening variable of employee commitment has demonstrated affecting organisational
performance (Paul & Anantharaman, 2003). Human Resources practices are the vehicles through which
business planned strategic activities are implemented. A Business strategy is a mere plan its execution and
implementation is driven by the human resource practices available to the organisation.
Careful recruitment and selection of staff into the organisation is a very important practice because this helps to
bring people with the skills and behaviours that the organisation requires. Training and development as a human
resource practice helps to update the employee skills and abilities to fit with the activities and functions of the
organisation. This motivates the staff as they become more competent and contribute effectively to the
organisation. Performance appraisal helps staff be aware of how well or badly they are performing. It helps the
managers to identify performance gaps in staff and find ways of remedying such gaps through on or off the job
training. Compensation is a way by which employees are rewarded for their performance. It helps to motivate
employees when their contribution can be recognized and rewarded. There are different ways by which staff are
rewarded and incentivized like merit pay, bonuses; having shares etc. these human resource practices have a
positive impact on the employee attitudes. In view of this, the study formulates the following hypothesis:
Hypothesis 2. There is a positive relationship between human resource practices (recruitment and selection,
training and development, performance appraisal and compensation) and employee attitudes (employee
satisfaction, commitment, motivation).

38 | P a g e
2.8.3. Employee Attitudes
How employees behave at work usually depends on how they feel about being there. Understanding how
employees behave at work requires understanding their work attitudes. Attitude refers to opinions, beliefs, and
feelings about our environment. Employee attitudes are viewpoints about aspects of the job, careers and their
organisations (Saari, 2004). The work situation and the work itself are the major causes of employee attitude.
Judge and Church (2000) found that when employees were asked to rate different facets of their job such as pay,
promotion, supervision, co-workers etc. The nature of their job emerged to be the most important factor
affecting their job satisfaction. Three job attitudes are important here; satisfaction with the job, commitment to
the organisation, and motivated by the organisational policies and practices (Sandberg, 2008).
Employee attitudes are affected by sound selection methods and a good match between employees and the job.
Selection should ensure employees are selected and placed into jobs most appropriate for them which in turn
helps to build their job satisfaction, motivation and commitment (Hassan, 2016). When employees are trained
and developed; when their performance is evaluated and are informed of how well they are doing; and when
their efforts are appropriately rewarded; they become motivated, satisfied and committed (Hassan, 2016). Katuo
and Budhwar (2006, 2008) and Katuo (2010) classified employee attitudes as motivation, commitment and
satisfaction. When employees are happy they tend to be more productive (Saari, 2004).
2.8.3.1 What causes positive attitude?
Employees pay attention to several factors about their work environment such as characteristics of the job i.e.
how the job activities are organized; how they are treated i.e. leadership actions; the relationships they have
with co-workers and managers and the degree of stress the job entails.
2.8.3.1.1 Job characteristics
Employees are committed, motivated and satisfied in jobs that allow them use a variety of skills, which give
them autonomy, when they receive feedback on the job and when the job entails performing significant tasks
(Mathieu & Zajac, 1990). However, presence of these will affect employee attitudes differently because of
different employee personalities (Loher, Noe, Moeller & Fitzgerald, 1985).
39 | P a g e
2.8.3.1.2 Organisational justice
This is a feeling of how fairly employees are treated, including fairness of firm policies and procedures, fair and
kind treatment by supervisors, fairness of pay and other rewards (Cohen-Charash & Spector, 2001; Colquitt,
Conlon, Wesson, Porter & Ng 2001; Meyer, Herscivitch & Topolnytsky, 2002). These can positively or
negatively affect employee attitudes.
2.8.3.1.3 Relationships at Work
The people employees interact with at work affect employee attitudes. Issues are on how friendly they are, are
the employees socially accepted, and are the employees treated with respect? Employee relationship with the
manager also matters. How considerate is the manager, is there trust built between them? (Bauer, Bodner,
Erdogan, Truxillo & Tucker, 2007; Gerstner & Day, 1997; Judge, Piccolo & Ilies, 2004; Kinicki, Mckee-Ryan,
Schriesheim & Carson, 2002; Meyer, Herscivitch & Topolnytsky, 2002; Miller, Rutherford & Kolodinsky,
2008; Van de Voorde & Beijer,2015). Relationships can positively or negatively affect employee attitudes.
2.8.3.1.4 Stress
The amount of stress in a job affects employee attitude. Stress is caused by interpersonal issues (organisational
politics, conflicts with co-workers) environmental factors (noise, heat or insufficient ventilation); organisational
factors (pressure to avoid making mistakes, job security worries). The higher the stress the lower the positive
attitude tends to be (Kinicki, Mckee-Ryan, Schriesheim & Carson, 2002; Podsakoff, LePine & LePine, 2007).
Given that attitudes give a clue of who would leave or stay, who will perform better or the possibility of
disputes; tracking satisfaction, commitment and motivation levels is critical and helpful for managers.
2.8.3.2 Commitment
It is the psychological attachment that binds and the resultant loyalty an employee has for the organisation
(Meyer, Allen 1991; Armstrong, 2012; Ritson, 2011). Committed employees have positive feelings about the
firm, are involved and attached to the firm. They feel obliged to remain with the firm (Meyer, 2002).
2.8.3.3 Satisfaction
It is an employee attitude about how contented an employee is about the job (Nel, 2004). It is measured using
satisfaction survey which assesses issues related to workload, compensation, perceptions of management,
teamwork, flexibility, resources etc. (Rafique, Tayyab, Kamran & Ahmed, 2014; Armstrong, 2012; Ritson,
2011). These issues are very important for firms which want to retain their employees, keep their employees
happy and reduce turnover.
40 | P a g e
2.8.3.4 Motivation
It is the organisational systems of practices designed to stimulate intrinsic motivation (Den Hartog & Verburg
2004). Motivation is encouraged by such factors as management and leadership actions, treating employees
with respect, employee recognition, above industry to average compensation and benefits (Tamer, 2015).
2.8.3.5 Employee attitudes effect on employee behaviours
Based on the resource-based view (RBV) theory (Barney, 1991), it is argued that HRM practices like
recruitment, rewards, development, and relations play an important role in building the human capital pool of an
organisation through developing its rare, inimitable and no-substitutable internal resources (Katou & Budhwar,
2010). The Resource based view philosophy is that HRM practices have a direct impact on employee attitudes,
like employee motivation, satisfaction and commitment which then influence employee behaviour like
employee turnover, absences and disputes which directly affect organisational performance (Boselie et al. 2010;
Boxall & Steeneveld, 1999). In addition, the resource-based view advocates that business performance
differences can be explained by the ability of a firm to exploit the inimitable characteristics of its resources and
not merely to the HRM practices which are easily copied (Wright et al. 2003)
It is however assumed that only when positive employee attitudes and behaviours are attained will higher
organisational performance be achieved (Guest, 1997). Furthermore, it is assumed that positive employee
attitudes will yield low absences, disputes and turnover (Sturges et al. 2005; Pare & Tremblay, 2007; Perryer et
al. 2010). Consequently, the study hypothesizes that:
Hypothesis 3: There is a negative relationship between employee attitudes and employee behaviours
(employee absences, turnover and disputes).
2.8.4 Employee Behaviours
Motivated, satisfied and committed employees develop organisational citizenship behaviour (OCB) which is
discretionary job performance (Youndt et al. 1996). In OCB, employees go beyond their prescribed job
requirement behaviours that are not recognized by the formal reward systems (Mester, 2003; Organ, 1988).
Employees are engaged in helping behaviours towards individuals and the organisation (Mester, 2003; Organ,
1988). Essentially all employees have the capacity to display discretionary behaviour but it rests with the
organisation to trigger these behaviour that lead to higher organisational performance beyond basic job
requirement (Hutchinson, 2003). This study has classified employee behaviour as turnover, absenteeism and
disputes.

41 | P a g e
2.8.4 .1 Employee Turnover
It is the measure of how long employees stay with the firm and also how often employees have to be replaced
(Khan, 2014; Price & Mueller, 2001). Turnover can be voluntary where the employee by his own volition
decides to quit. Involuntary turnover is when the employee has been laid off for many reasons (Khan, 2014).
Turnover can cost an organisation directly or indirectly and affect its performance. Direct costs include the cost
associated with relocation, pay compensation, pay terminal benefits, hire and train new employees to take up
the vacated posts. Indirect costs are difficult to quantify but include lost sales, lost customers due to lost
business networks, inexperienced staff or short of staff, loss of knowledge of the firm operations, lack of
institutional memory, and loss of important routines. These affect the firm performance (Khan, 2014).
2.8.4 .2 Employee absenteeism
It is non-attendance at work. It is unscheduled absence from work (Gale, 2003). Absences are costly to the firm
and negatively affect firm performance (Bennet, 2002). Managers have to find a replacement for the absent
employee; other employees have to work overtime to cover the absent employee (Gale, 2003). Absences are
caused by health-related issues such as acute or serious illness, accidents, and acute stress (Kelliher &
Anderson, 2010). Work life balance caused absences include attending a funeral, wedding, skipping work to
study for an exam, annual leave, compassionate leave, maternity, paternity, adoption, time off for public or
trade union activities, care for dependents. Giving employees flexible working hours would deal with this
because as employees manage their own time; they are less likely to be absent. (Kelliher & Anderson, 2010, ).
2.8.4 .3. Labour relations/ dispute
It is any difference between an employer or employers’ organisation and employees or a trade union, as to the
employment or no-employment, or the terms of employment, or the conditions of labour or work done or to be
done, of any person, or generally regarding the social or economic interest of employees (Labour Relations Act,
1996). The disputes affect organisational performance through lost time, reduced production, lost sales and
absence from work in the event of strikes, stay a ways, go slow etc. (Walker & Hamilton, 2011)
2.8.4 .4 Employee behaviours effect on organisational performance
The performance of any organisation largely depends on the human resources available to it consistent with the
resource based view of the organisation (Katou & Budhwar, 2010). It also depends on the processes and
technology the organisation has (Curtis et al. 1995). For the human resources to work effectively with the
available processes and technology; the employees must be competent enough with skills and abilities. The
employees must again be in the right numbers otherwise the processes and technology will be underutilized;
42 | P a g e
overworked or not used properly and will easily malfunction (Katuo, 2012; Park et al. 2003; Pfeffer, 1994;
Richardson and Thompson, 1999; Timothy, et al, 2011;). The employees must also be satisfied ( Boselie et al.
2001; Guest, 2001); committed (Beer et al. 2014; Ulrich, 1997; Yeung and Berman, 1997) motivated (Arthur,
1994; Fey et al. 2000; Guest, 1999; Schuler,1998); cooperated (Guest, 1997; Park et al.. 2003); available in the
organisation (counterpart of turnover) (; Boselie et al. 2001; Fey et al. 2000); and lastly the employees must be
present (counterpart of absenteeism) (d’Arcimoles, 1997; Boselie, 2001).
Although employee attitudes are at the heart of strategic human resource management (Boselie et al. 2010;
Boxall & Purcell, 2002), they are not sufficient to improve organisational performance up until they affect
employee behaviour like absences, turnover and disputes. In view of the job performance theory (Campbell,
1997), it is the employees’ attitudes that have an impact on employee behaviour (Luna-Arocas & Camps, 2008)
which subsequently have an impact on organizational performance (Wright et al. 2003). It is therefore noted
that employee behaviour mediates the relationship between employee attitudes and organisational performance.
In the case of high employee absences, turnover and disputes the organisational performance will be impacted
negatively. The study therefore hypothesizes that:
Hypothesis 4: There is a negative relationship between employee behaviours and organisational
performance.
2.8.5 Organisational performance
How HRM practices impact on firm performance has widely been investigated in previous studies (Luc Sels et
al. 2006; Teo et al. 2011; Zheng et al. 2006;). Different performance measures have been used including
profitability, return on Investment (ROI), firm earnings, labour productivity, and product quality (Datta et al.
2005; Stup et al. 2006; Teo, 2011; Way, 2002; ). Other studies have used effectiveness, i.e. if the firm meets its
objective; efficiency, i.e. if the organisation uses the fewest possible resources to meet its objectives;
development, i.e. if the organisation is developing in its capacity to meet future opportunities and challenges,
satisfaction of all participants-owners and investors, customers, society, other organisations, and organisational
members, innovation, for products and processes, and quality, percentage of products of high quality (Wang et
al. 2002). This is a dependent variable which measures the bottom-line on which HRM practices have an impact
on organisational performance (Wang et al. 2002).
2.8.5.1 The Nature of Performance
Performance is a multidimensional construct (Ostroff & Bowen, 2000) and has been conceptualized differently
with different types of performance measures (Dyer & Reeves, 1995). Four performance measures have been

43 | P a g e
highlighted (i) HRM related outcomes (absenteeism, turnover, individual or group performance); (ii)
Organisational outcomes (productivity, quality, efficiencies); (iii) Financial outcomes (profitability, return on
assets, return on investment, sales); (iv) Market based outcomes (market value) (Boselie & Van der Wiele,
2002; Paauwe & Boselie, 2005). According to Wright (2003); this categorization of outcomes has a significant
importance exploring HRM-performance link and the relevance lies in two aspects: some outcomes like human
resource outcomes (employee attitudes and employee behaviours) are more proximal to human resource
practices than others and that the impact that human resource practices have on more distant outcomes e.g. firm
performance are through the impact on more proximal outcomes. This implies that distance matters very much
in as far as the impact of Human Resource practices is concerned.
To truly demonstrate the impact of HRM practices on profitability, it is basically to see how they impact close
outcomes and more distant outcomes like financial performance. Outcome measures that are more closely
linked to HRM should be more appropriate to consider in the study like labour turnover, aspects of productivity
(David, 2003). Based on the overview by Boselie et al. (2005), Paauwe (2009) conclude that financial measures
are only represented in half of all articles (104) included in their analysis. In the same connection, it is
important to consider the role and value of subjective and objective indicators (Guthrie, 2001). Objective
measures are being challenged because of corporate financial scandals that portray a false picture of the firm
performance.
2.8.5.2 Human Resource Practices effect on Organizational performance
Competency is an important factor affecting organisational effectiveness because when employees are
incompetent they will not help the organisation to perform well (Fey et al. 2000; Katuo, 2012). Further to this,
absenteeism and turnover may negatively affect effectiveness of the organisation (Katuo, 2012; Boselie et al.
2001). If the organisation cannot retain its staff; it will not be able take advantage of the human assets it has
developed within the organisation (Katuo, 2012; Fey et al. 2000). Employees who have good behaviours and
attitude are more likely to be committed and work for the benefit of the organisation and in return positively
affect the organisational performance. The study hypothizes that:
Hypothesis 5. There is a positive relationship exists between human resource practices and organisational
performance .

44 | P a g e
2.9 REVERSE CAUSALITY
A number of studies have investigated the reverse causality in the HRM practices and organisational
performance model (Katuo, 2012, De Beer et al. 2013; Tsai, et al. 2010; ). Reverse causality is illustrated by
an example like where the organisation with high profit as an organisational performance indicator would have
a higher willingness to invest in human resource management practices. Massimino and Kopelman (2012) agree
that high performing organisations will have the resources they can afford to share with employees and yield
higher compensation, training and create opportunities for staff growth. This perspective was confirmed with
Schneider et al. (2003) whose study revealed that profitability more likely causes job satisfaction than job
satisfaction causes profitability (Paauwe & Boselie, 2005) . De Beer, Pienaar and Rothmann (2013) investigated
reverse causality between engagement and burnout in South Africa and found that burnout had significant
negative longitudinal relationship with colleague and supervisor support.
Tsai, Edwards and Sengupta (2010) observed that in order to improve organisational performance, inputs from
human resource practices and employee attitudes are very critical. They also noted that changes in the
organisational performance affect HRM practices and employee attitudes. The authors reported that
organisational performance affects employee attitudes and HRM practices more than vice versa. This
demonstrates the importance of the reverse causality in the HRM and performance linkage model. However,
literature is scarce of any study examining reverse associations between organizational performance and
employee behaviour as distinct from other studies which studied reverse associations of organisational
performance and employee attitudes, business, engagement and HRM practices. Although use of longitudinal
data is the most appropriate to draw reverse causality associations from (De Beer 2010; Tsai et al. 2010), this
study used cross-sectional data due to resource constraints. As noted by Schneider, (2003), empirical
investigations of causal priorities are scarce because they need access to data collected over multiple time
periods. Kopelman (2010) and de Beer, Pienaar and Rothmann (2013) used time-lagged and longitudinal
investigation respectively.
2.9.1 Reverse causality: Organisational performance effect on employee behaviour
In examining the Human Resource practices and organisational performance relationship, it is implicitly
assumed that HRM practices lead to organisational performance (Ben et al. 2013). It is noted that HRM
practices influence organisational performance directly as in hypothesis 5 or indirectly through employee
attitudes and behaviours as in hypotheses 3 and 4. Training can improve efficiency directly, by improving
employee knowledge, abilities and skills. Compensation and promotion can improve organisational
development indirectly through improving employee attitudes of satisfaction and motivation thereby

45 | P a g e
diminishing employee behaviours of turnover and disputes (Sinikka & Stavrou, 2013). The positive employee
behaviours affect organisational behaviour. An organisation that is performing well assures employees as a
going concern and real wage rises thereby making employees stay longer with the organisation (counter of
turnover) (Sinikka & Stavrou, 2013). Real wages rise reduces instances of disputes. Drawing from the above
discussion, this study hypothesizes that:
Hypothesis 6: There is a negative relationship between organisational performance and employee behaviour.
2.10 CONTROLS
Control variables as inclusion/exclusion criteria of firm size, age and union intensity were included in the
Human Resource practices and organisational performance model of the research design to avoid results of the
analyses being erroneous (Boselie et al. 2005). The aim was to include other organisational and environmental
forces that are connected to adoption of both HRM practices and organisational performance (Delaney &
Huselid, 1996; Guest, 2001; Katuo, 2012).
Firm size was based on the logarithm of number of employees. In this study size refers to medium and large
organisations i.e. 20 employees and above. This is an inclusion/exclusion criterion because medium and large
firms are more likely to establish Human Resource practices due to economies of scale (Flood & McCurtain,
2009; Datta et al. 2005). Medium and Large firms have more resources than small enterprise firms as such they
can afford to introduce a range of human resource practices. Furthermore, medium and large organisations are
more likely than small organisations to pursue well developed HRM practices.
Age of the firm was considered in order to make sure the firm is not new so that they may not have put in place
the human resource management practices. It includes any confounding values and maturity effects of the firm.
In this study, organisations that are three years old and beyond were considered. It is claimed that unions affect
performance of the firm and adoption and implementation of HRM practices.
Union intensity
7-a. Controls (firm age, size & union intensity) influence HRM practices.
7-b. Controls (firm age, size & union intensity) influence organisational performance
2.10.1 Conceptual model

46 | P a g e
In view of the concepts and relationships discussed about the study; a conceptual model adopted from Katuo
(2012) is depicted in Figure 2.1.
H5
H1 H2 H3 H3 H4
H6
H7
Adopted from Katuo (2012)
Figure 2. 1: Conceptual Model
Business
Strategy
HRM
Practices
Employee
Attitudes
Employee
Behaviour
Organisati
onal
Performan
ce
Controls: Firm Age, Size & Union
Intensity

47 | P a g e
2.11 THEORETICAL FRAMEWORK
Ten years after Guest 1997 article; an overview of theories (Boselie et al. 2005) has provided some answers
although not conclusive. Boselie (2005) analyzed 104 empirical articles on human resource management and
performance linkage. The authors found and concluded that there are three most commonly used theories when
examining the relationship between HRM and performance. These are contingency theory; the AMO
framework and resource-based view (RBV). However, because of a new dimension of reverse causality added
to the model; a general systems theory has been added which was not in the previous studies reviewed by
Boselie, (2005).
Based on past research on reversed causality in HRM practices and firm performance model; different
theoretical backgrounds have been employed. In this study, the theoretical perspectives are guided by the
conceptual framework of the study where business strategy moderates HRM practices which in turn affect firm
performance mediated by employee attitudes and employee behaviours. A reverse dimension is investigated
arguing that firm performance motivates employee behaviour. The study is guided by two main theoretical
perspectives: the contingency theory and the Resource –based Theory. These will be discussed to justify their
choice as the bedrock theories for this study. Different empirical studies investigating reversed causality in the
HRM practices and organisational performance model have applied different theoretical backgrounds. Wright
and McMahan (1992) and Jackson and Schuler (1995) investigated six theoretical perspectives that determine
HRM practices in firms. These are behaviour perspective, resource-based theory, transaction cost theory,
resource dependency theory, institutional theory and cybemetics theory.
2.11.1 Resource based theory
In explaining sources of competitive advantage, strategic management literature presents two perspectives. The
first one is Porters five forces perspective and Kim and Oh (2004) resource-based theory (RBT) (Barney, 1991
& Grant, 1991). Porter’s five forces model describes competitive advantage as superior performance that an
organisation achieves by offering cost advantage (Porter, 1985). In this regard; competitive advantage is
attributed to the external environment which a firm must respond to by erecting entry barriers to competitors
through, capital requirements, product differentiation, among others.
The Resource-based theory as another model of competitive advantage assumes that the desired outcome of
management effort in the firm is sustainable competitive advantage (SCA). This allows the firm to earn returns
which are above industry average (Fahy & Smithee 1999). In this model SCA is seen as emanating from the

48 | P a g e
distinctive resources that a firm has which give it an edge over its competitors. An organisation is seen as a
bundle of specialized resources which are deployed and used to create a unique and privileged market position
for the organisation (Ghemawat, 1986; Singh, 2016). It therefore implies that managers of any firm have the
responsibility to identify, develop and deploy crucial resources to maximize returns (Fahy & Smithee 1999).
The RBT looks at the linkage between strategy and the internal resources of the organisation in order to achieve
sustainable competitive advantage instead of focusing on the industry environment which is typical of porters
five forces model in the traditional strategic analysis paradigm (Wright et al. 1994; Newbert, 2008; Takeuchi et
al. 2007; Wright et al. 2001)
The theory assumes that factors that an organisation owns and controls and the capacity to deploy resources are
heterogeneously distributed and imperfectly immobile. This allows for differences in firm resource endowments
a situation which persists over time. It is hypothesized therefore that if an organisation possesses and exploits its
rare and valuable resources and capabilities, it will attain competitive advantage. If these resources and
capabilities are inimitable and non-substitutable; the organisation will sustain the competitive advantage. A
firm’s resources include; knowledge, all assets, capabilities, firm attitudes, organisational processes,
information that the organisation controls enabling it to conceive and implement strategies that help to improve
its effectiveness and efficiency (Singh, 2016). Resource heterogeneity means the distribution of different
resources in the firm. It also means the productive resources used in the organisation have intrinsically
differential levels of efficiency where others are superior to others. In this regard; firms endowed with superior
resources tend to be economical in production and effective in the market as compared to those without superior
resources (Singh, 2016).
Immobility of resources refers to inability of competing firms to obtaining resources from other firms (Singh,
2016; Hassan, 2016). Several reasons explain this: Firstly, where the resources property rights are not well
defined (Dierickx & Cool, 1989); secondly when the resources cannot be used outside the firm (Williamson
1975); thirdly; when the resources are used in conjunction with another or when resources have high economic
value when employed together (Hassan, 2016) and fourthly; when there are high transaction costs associated
(Singh, 2016). In view of the immobile resources not being tradable; or have less value to other users, they
remain bound to the organisation and are available for use for the long run. In this regard; the resources become
a source of competitive advantage to the organisation. Heterogeneity and immobility of resources are necessary
but not sufficient basis for resources of a firm to hold potential for sustainable competitive advantage. Four
other attributes must be met to provide sustainable competitive advantage. These include firstly that the
49 | P a g e
resources must add value to the organisation; secondly, the resources must be rare amongst competitors; thirdly,
the resources must be imperfectly imitable and fourthly; the resources must not be strategically substitutable
with another resource by another competing firm (Barney, 1991; Singh, 2016). Question of value: Resources are
considered to be of value if they help the organization to increase the value they offer to customers. This is
achieved through increased differentiation and/or reducing the cost of production. Resources that cannot meet
these criteria lead to competitive disadvantage for the firm (Barney, 1991; Grant, 1991; Hassan, 2016).
Question of rarity: Resources are considered rare if they can only be acquired by one or few companies. It
results in competitive parity when more than few companies have the same resource or capability. If a large
number of firms possess a particular valuable resource, the resource becomes a source of competitive parity not
competitive advantage or sustainable competitive advantage (Barney 1991; Hassan, 2016). Question of
limitability: At least temporary competitive advantage is achieved by firm that has valuable and rare resource.
Furthermore, the resource must be costly to imitate or substitute it for a rival in order to achieve sustainable
competitive advantage. Question of organization: Resources themselves do not confer any advantage for a firm
if it is not organised to capture the value from them. If the firm is able to exploit the valuable, rare and imitable
resources it can achieve sustained competitive advantage (Barney, 1991; Grant, 1991; Singh, 2016).
This is referred to as the valuable, rare, costly to imitate and non-substitutable (VRIN) framework as it
examines whether the resources and capabilities are valuable, rare, costly to imitate and non-substitutable
(VRIN). The VRIN framework was later improved to valuable, rare, costly to imitate and organised (VRIO) by
adding the consideration of whether the company is organized to exploit the resources (Barney, 1991; Grant,
1991; Singh, 2016) as shown in Figure 2.2.
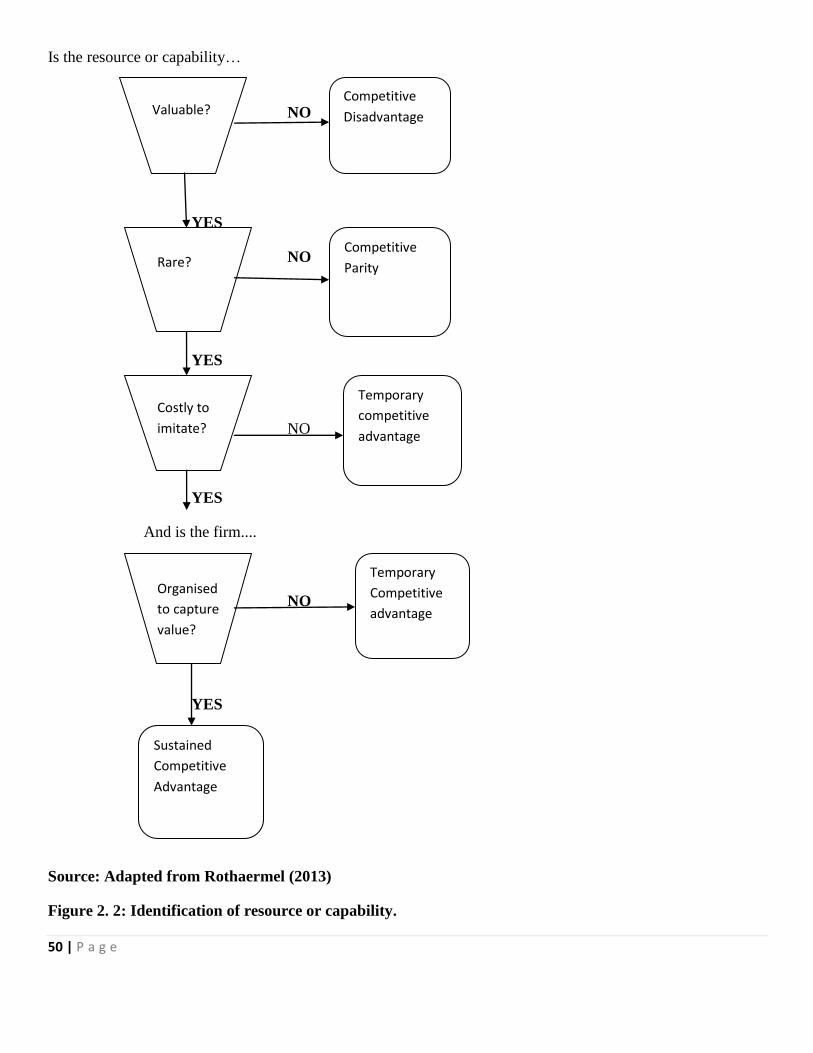
50 | P a g e
Is the resource or capability…
NO
YES
NO
YES
NO
YES
And is the firm....
NO
YES
Source: Adapted from Rothaermel (2013)
Figure 2. 2: Identification of resource or capability.
Valuable?
Rare?
Costly to
imitate?
Organised
to capture
value?
Competitive
Disadvantage
Competitive
Parity
Temporary
competitive
advantage
Temporary
Competitive
advantage
Sustained
Competitive
Advantage

51 | P a g e
2.11.2 Contingency theory
The theory acknowledges the interrelationships between sub-systems in an organisation but goes further to
acknowledge that there is no “best way” to manage an organization. The approach to human resource
management follows the similar lines of thought (Jackson & Schuler, 1987; Snell & Youndt, 1995; Delery &
Doty, 1996). It suggests that there is no “Ideal” collection of human resource strategies that all organisations
should adopt but this depends on the nature of the business strategy; resources available to the firm and the
environment (Context) in which the firm is operating (Johnson & Scholes, 2010). The theory argues that an
organisation’s HR practices effectiveness depends on presence or absence of certain contingency factors like
strategy, sectors or countries (Konter, 2014). This underscores the importance of context. This means HRM
practices are consistent or contingent with organisational business strategies (Katuo, 2011). On the other hand;
contrary to the “best practice” (universalistic) paradigm on HR and firm performance which argues that there is
“one best way” of managing employees applicable to all organisations (Truss; Mankin & Kelliher, 2012), the
contingency theory argues that the “one best way” to manage employees varies from one organisation to
another (Gobler & Warnich, 2012). In seeking better organisational performance, the human resource
management practices must fit with the business strategy (Singh, 2016)
2.11.3 AMO theory
The theory argues that organisational performance is best served by staffs that have the ability to do the work,
who possess the necessary skills and knowledge; who are “motivated” to work and who have the “opportunity”
to arrange their skills in doing their work (Appelbaum, 2000; Bailey, Berg & Kalleberg, 2012). This model
suggests that performance is a function of Ability + Motivation +Opportunity hence the acronym “AMO”
(Singh, 2016)
Work performance depends on the ability, motivation and opportunity for staff to make their contribution and
maintain their well-being. If one of the factors is zero, then the total equation becomes zero too. According to
the AMO theory; job performance is determined by Abilities, Motivation and Opportunities. This is to say, the
employee’s ability, the desire and opportunity to make a contribution (Appelbaum et al. 2000). It is possible to
have employees who are very competent and motivated, however if the employees do not have the opportunity
to make a contribution, or indeed if they do not thrive, then this goes beyond their performance on the job
(Appelbaum et al. 2000). The thinking behind the AMO theory is that there is no single specific HRM practices
list that can influence performance. It suggests that the whole process depends on HRM architecture which
covers practices designed to build and retain human capital and influence employee behaviour.

52 | P a g e
According to the HRM architecture, there is a variety of HRM policy domains which includes ability,
motivation, opportunity which are determined based on organisational context like industry, culture and
country. In order to turn AMO into action the human resource policies required are training and development;
career opportunities linked to ability and skill, recruitment and selection, rewards and benefits which are linked
to motivation and incentive and involvement, work-life balance, team working, job challenge and autonomy
linked to opportunity to participate.
Responding to AMO policies, staff will be committed, motivated and job satisfied which are attitudinal
outcomes. The attitudes will in turn lead to employees showing a range of positive behavioural outcomes. The
decision employees take like making right choices about how to do a job like; care, innovation, speed and style
are at the centre of the employment relationship. These are strongly connected to performance outcomes. When
employees are motivated and satisfied, they are more likely to engage discretionary behaviour to help the
organisation succeed (Appelbaum, 2000). In this regard, it is argued that one of the functions of AMO is to help
develop attitudes or feelings of commitment, satisfaction and motivation in many employees as these translate
into discretionary behaviour (Singh, 2016).
2.11.4 General systems theory
While the RBT and AMO claim one direction relationship in the HRM practices and performance linkage;
general systems theory (GST) adds a reversal causal effect of firm performance. Employee skills and abilities
are inputs while employee attitudes and behaviours are cellular mechanisms while firm performance is the
output which in turn generates inputs required to maintain the system (Katz & Kahn, 1966). It argues that
performance outputs generate inputs or feedback to the HRM practices and organisational performance linkage
(Shin & Konrad, 2014). It is implied that in order to understand the HRM practices and firm performance
relationship, consider the feedback loop from organisational performance to employee behaviour, which is
reversal causality.
Wright and Snell (1991) using the general systems theory consider an organisation as a system receiving inputs
from the environment then processing the inputs into outputs. There are different types of organisational
systems and organisational HRM is one of such important systems (Ferguson & Reio, 2010) where employees
are the inputs to the system and organisational performance is the output of the system. Through distinct,
interrelated activities and processes the system converts inputs to achieve organisational performance. The

53 | P a g e
argument is that HRM practices encourage positive employee attitudes and behaviours that lead to
organisational performance (Bowen & Ostroff, 2004; Lepak et al. 2006). This study employed the general
systems theory to illustrate that an organisation system consists of different subsystems which work together to
transform the inputs into outputs. The HRM as a subsystem consists of HRM practices as independent variables
which affect organisational performance as a dependent variable (Alsabbah & Ibrahim, 2014).
2.12 EXISTING KNOWLEDGE IN THE FIELD
The body of research examining the relationship between Human Resource Management practices and firm
performance has grown over the years. Mohinder and Katuo (2007) investigated the relationship between HRM
practices and organisational performance in the hotel industry and found positive relationship. Recruitment and
selection, man power planning, job design, training and development, quality circle, and pay systems were used
as HRM practices. Organisational performance was measured using sales growth, productivity, profitability,
goal achievement, and good service quality. The study used both objective and subjective measures of
organisational performance. However, the study did not consider the effect of control and mediating variables.
In another study, Atteya (2012) proposed and tested an integrative model of HRM practices that examined the
mediating variables in the HRM practices and organisational performance relationship in Egypt. The study
found that HRM practices indirectly influence job performance. The study used 13 HRM practices items as
developed by Tsaur and Lin (2002). The study controlled for firm size, firm age, capital intensity, and hotel
category. Both studies did not consider the reverse effect of any of the variables in the model.
Similarly, Dimba (2010) investigated HRM practices and firm performance in Kenya to establish the direct or
indirect relationship between the two using employee motivations as a mediating variable. The study found that
HRM practices and firm performance are positively related. HRM practices used in the study were training and
development, compensation systems, performance appraisal and flexible work systems. Organisational
performance was measured using image, interpersonal relations, and product quality. Furthermore, Karen
(2010) tested a model in which HRM inputs like motivation and employee skills and HRM practices (training,
development, profit sharing) contribute to organisational outputs and firm performance. Results suggest that
HRM practices influence firm performance with regard to return on assets, percent growth, and quality control
measures and market to book ratios. The study controlled for organisation type, firm size and union status. Peng
& Luo (2010) investigated how HRM contributes to improved organisational performance in the large-scale
hotel sector in New Zealand. The study found that HRM and organisational performance are positively related.
Furthermore, Razouk (2011) examined high-performance work systems and performance of SMEs. The study
found simultaneous and longitudinal correlations between high-performance work systems (appraisal,

54 | P a g e
participation, sharing information, compensation and communication) and all performance indicators. The study
also found that controlling for past performance made these effects disappear in a reverse causality. Firm
performance was measured using profitability, degree of innovation and social climate. Extraneous variables of
market structure, business strategy and stock exchange were controlled.
Mukanzi (2013) investigated the influence of HRM practices on firm performance of the banking sector in
Kenya. The study used recruitment and selection, training and development, performance appraisal and
reward/compensation as HRM practices. Performance was measured using both objective (net profit, return on
assets, return on equity & annual sales growth) and non-objective measures (productivity, market share, image
and interpersonal relations). The HRM practices measures used in this study are consistent with what this study
has employed. These are traditional HRM practices employed in strategic human resource management. Shin,
(2017) and Georgios (2014) investigated the relationship between human resource practices, knowledge
management, organisational learning and organisational capabilities and their impact on organisational
performance. The study found that manufacturing firms using best HRM practices attain higher performance
through interaction of HRM practices with knowledge management, organisational learning and creation of
organisational capabilities. Similarly, Amin (2014) examined the impact of HRM practices on the performance
of a public university and found that HRM practices (recruitment, training, performance appraisal, career
planning, employee participation, job definition, and compensation) have a significant relationship with
university performance. Khan (2014) investigated the factors that affect employee turnover in an organisation in
Pakistan. They study used retirement benefits, job security and financial crises as to measure how they impact
turnover. The study revealed that retirement benefits have more impact on turnover than job security and that
financial crises have moderate effect. Darwish, Singh, and Wood (2016) investigated the specific set of HRM
practices on organisational performance and found a positive relationship. The study used recruitment and
selection, training, internal career opportunity, performance appraisal, intrinsic incentive rewards, extrinsic
incentives and rewards and perceived financial performance. Organisational performance was measured using
return on assets (ROA) and return on equity (ROE). The study controlled for firm size and age.
Gamage (2015) investigated the role of HRM practices in improving labour productivity in manufacturing
SMEs in Japan using HRM outcomes as mediating variables. A strong positive relationship was found between
HRM practices and labour productivity. Staffing, training, and development, performance evaluation and
compensation were used as HRM practices. Occupational health and safety, job satisfaction, employee
commitment employee attitudes, employee motivation, employee loyalty, employee involvement and workplace
55 | P a g e
cooperation were used as HRM practices. However the study did not account for control and mediating
variables as well as the reverse effect of the variables. Similarly, Bharti (2015) investigated how automated
paperless HRM practices impact on organisational performance in the banking sector. E-HRM measures were:
e-recruitment, E-learning, E-succession planning. Study showed positive relationship with organisational
performance by increasing efficiency, reduces cost, leads to competitiveness, improves competitiveness,
improves quality, and helps retain employees. Furthermore, Ogunyomi and Bruning (2015) investigated the
relationship between HRM practices and financial and non-financial performance of SMEs in Nigeria. Found
partial support of a model of positive relationships between certain HRM practices and firm performance.
Nyandiko and Ongeri (2015) examined the relationship between strategic human resource management
practices and organisational performance of a seed company in Kenya. HRM measures used were employee
development, motivation, maintenance and staffing. Found positive relationship between SHRM practices and
the firm performance. However, these studies did not investigate the reverse effect of any of the variables.
Most of the studies in HRM practices and organisational performance have been conducted in the Western,
educated, industrialised, rich, and democratic (WEIRD) countries (Henrich et al. 2016) including on the
domestic operations of the United States of America (USA) firms (Appelbaum et al. 2000; Batt, 2002; Guthrie,
2001; Huselid, 1995; Ichniowski, Shaw, 1999; McDuffie, 1995, Barti, 2015; Cooke, 2015; Barti, 2015). Other
studies were also conducted in the United Kingdom (UK) and other parts of Europe (Guest & Hoque, 1994;
Hoque, 1999, Hartog & Verburg, 2004; Guthrie, 2001; Kapondoro 2015) and Asia (Huang, 2001; Huang &
Cullen, 2001, Khatri, 2000; Luo, 2010; Georgious, 2014; Shin, 2017; Mak & Akhtar, 2003; Wan, Kok & Ong,
2002). In Africa, similar studies have been conducted in Ghana (Seidu, 2011), Egypt (Atteya, 2012), Kenya
(Dimba, 2010); Nigeria (Odalipo, 2014) and South Africa (Walter, 2006). In all these studies, a positive
relationship was found between human resource management practices and firm performance. Also, all these
studies took a forward causality of human resource practices and organisational performance. Very few studies
have been conducted in Africa and Malawi in particular. In Malawi (Bakuwa, 2011; Nkhwangwa, 2014) studied
human resources management but investigated other aspects and not how Human Resource practices impact on
organisational performance and the reverse of organisational performance effect on employee behaviour. There
are no published Malawi company-level studies exploring the relationship between HRM practices and
organisational performance. There is therefore need for a comprehensive study that would determine whether
the findings reported in American, Indian, Malaysian, Greece, Egyptian, South African, and Ghanaian firms are
consistent with Malawi and therefore can be replicated in Malawi.

56 | P a g e
Other studies showing the relationship between HRM practices and organisational performance have been
summarized as shown in the Table 2.2

57 | P a g e
Table 2. 2: Studies showing the relationship between HRM practices and organisational performance
AUTHOR MOTIVATION
FOR STUDY
HR PRACTICES
MEASURED
RATIONALE
FOR
INCLUSION
HOW
PRACTICE
WAS
MEASURED
DEPENDENT
VARIABLE
HOW
DEPENDENT
VARIABLE
WAS
MEASURED
FINDINGS
Huselid
(1995)
Theory and
Conventional
wisdom suggest
that HR practices
can provide a
direct and
economically
significant
contribution to
firm performance.
However little
empirical
evidence exists.
Thirteen practices
measured at two bundles -
(a) employee skills and
organisational structures
(quality management
circles, teams; and (b)
employee motivation
performance appraisals
Included 10
practices that
Delaney,
Lewin, &
Ichniowski
(1989)
included. Also
added three
practices found
to affect firm
performance:
(1) intensity of
recruiting
efforts (2)
average number
of training
hours per
employee per
year (3)
promotion
criteria-
seniority Vs
Merit
Firm data was
collected on
survey sent to
the senior
human
resource
professionals
in each firm.
Turnover,
productivity,
corporate
financial
performance
Turnover
question about
annual rate on
survey
Productivity
logarithm of
sales per
employee
Corporate
financial
performance
Investments I n HR
practices associated
with lower employee
turnover and with
greater productivity
and corporate
financial
performance.
Nishii,
Lepak &
Schneider
(2008)
Examined the
effects of Hr
attributions on
firm performance
across units
within an
organisation
Five Hr attribution items
listed for each of the five
HR practices: staffing,
training, benefits pay, and
scheduling
Developed
items and
practices based
on two rounds
of five focus
groups and
research
literature
Department
level. Survey
data collected
from
employees
within each
department,
managers and
Customer
satisfaction
with people
Department
employees were
rated by
customers in a
survey
The attribution that
HR practices are
motivated by the
organisation’s
concern for
enhancing service
quality and
employee well-being
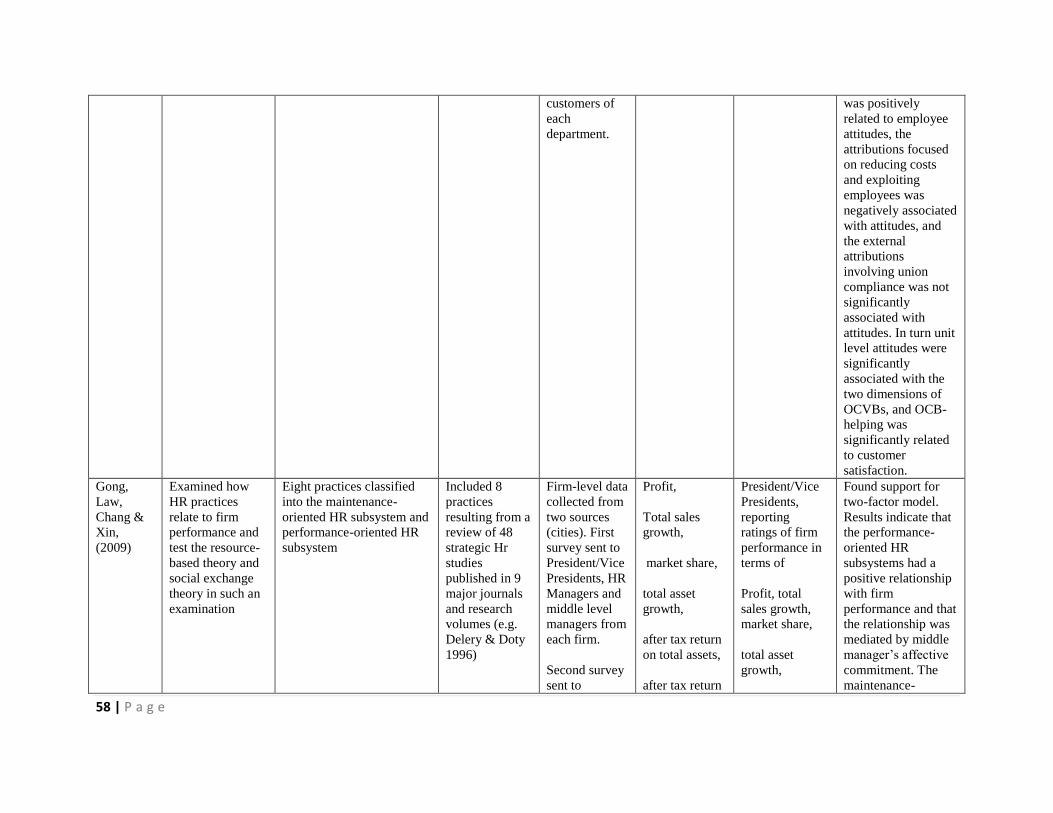
58 | P a g e
customers of
each
department.
was positively
related to employee
attitudes, the
attributions focused
on reducing costs
and exploiting
employees was
negatively associated
with attitudes, and
the external
attributions
involving union
compliance was not
significantly
associated with
attitudes. In turn unit
level attitudes were
significantly
associated with the
two dimensions of
OCVBs, and OCB-
helping was
significantly related
to customer
satisfaction.
Gong,
Law,
Chang &
Xin,
(2009)
Examined how
HR practices
relate to firm
performance and
test the resource-
based theory and
social exchange
theory in such an
examination
Eight practices classified
into the maintenance-
oriented HR subsystem and
performance-oriented HR
subsystem
Included 8
practices
resulting from a
review of 48
strategic Hr
studies
published in 9
major journals
and research
volumes (e.g.
Delery & Doty
1996)
Firm-level data
collected from
two sources
(cities). First
survey sent to
President/Vice
Presidents, HR
Managers and
middle level
managers from
each firm.
Second survey
sent to
Profit,
Total sales
growth,
market share,
total asset
growth,
after tax return
on total assets,
after tax return
President/Vice
Presidents,
reporting
ratings of firm
performance in
terms of
Profit, total
sales growth,
market share,
total asset
growth,
Found support for
two-factor model.
Results indicate that
the performance-
oriented HR
subsystems had a
positive relationship
with firm
performance and that
the relationship was
mediated by middle
manager’s affective
commitment. The
maintenance-
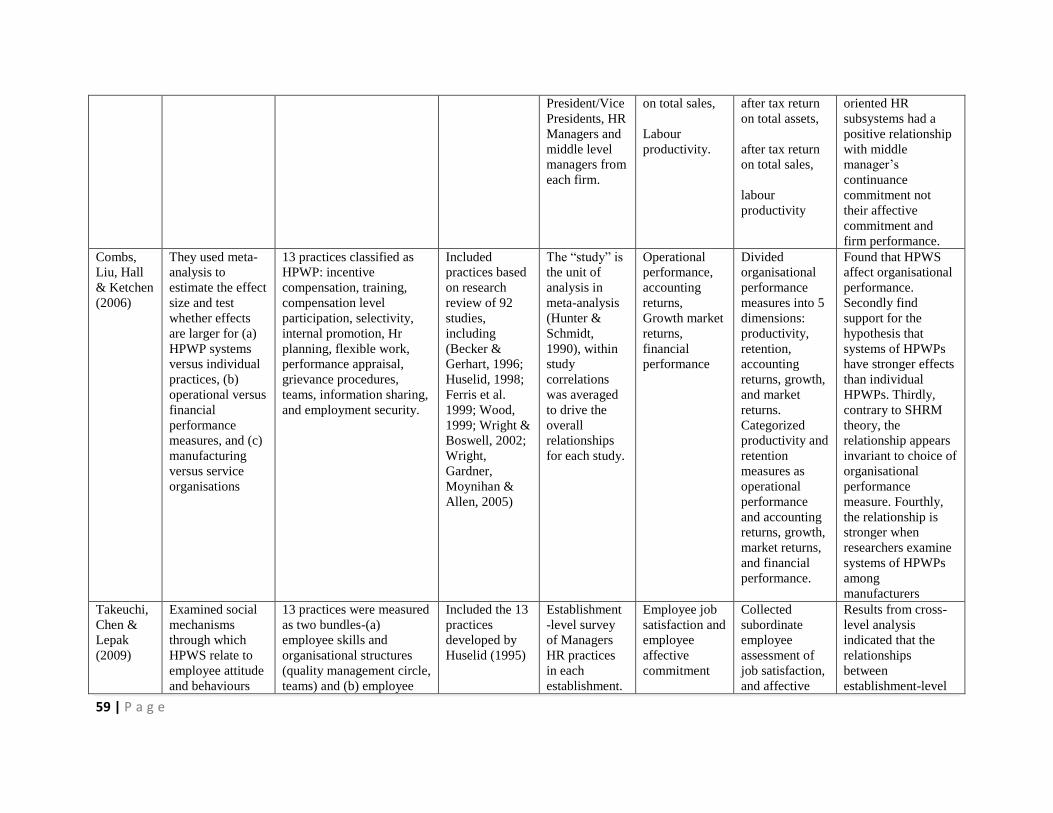
59 | P a g e
President/Vice
Presidents, HR
Managers and
middle level
managers from
each firm.
on total sales,
Labour
productivity.
after tax return
on total assets,
after tax return
on total sales,
labour
productivity
oriented HR
subsystems had a
positive relationship
with middle
manager’s
continuance
commitment not
their affective
commitment and
firm performance.
Combs,
Liu, Hall
& Ketchen
(2006)
They used meta-
analysis to
estimate the effect
size and test
whether effects
are larger for (a)
HPWP systems
versus individual
practices, (b)
operational versus
financial
performance
measures, and (c)
manufacturing
versus service
organisations
13 practices classified as
HPWP: incentive
compensation, training,
compensation level
participation, selectivity,
internal promotion, Hr
planning, flexible work,
performance appraisal,
grievance procedures,
teams, information sharing,
and employment security.
Included
practices based
on research
review of 92
studies,
including
(Becker &
Gerhart, 1996;
Huselid, 1998;
Ferris et al.
1999; Wood,
1999; Wright &
Boswell, 2002;
Wright,
Gardner,
Moynihan &
Allen, 2005)
The “study” is
the unit of
analysis in
meta-analysis
(Hunter &
Schmidt,
1990), within
study
correlations
was averaged
to drive the
overall
relationships
for each study.
Operational
performance,
accounting
returns,
Growth market
returns,
financial
performance
Divided
organisational
performance
measures into 5
dimensions:
productivity,
retention,
accounting
returns, growth,
and market
returns.
Categorized
productivity and
retention
measures as
operational
performance
and accounting
returns, growth,
market returns,
and financial
performance.
Found that HPWS
affect organisational
performance.
Secondly find
support for the
hypothesis that
systems of HPWPs
have stronger effects
than individual
HPWPs. Thirdly,
contrary to SHRM
theory, the
relationship appears
invariant to choice of
organisational
performance
measure. Fourthly,
the relationship is
stronger when
researchers examine
systems of HPWPs
among
manufacturers
Takeuchi,
Chen &
Lepak
(2009)
Examined social
mechanisms
through which
HPWS relate to
employee attitude
and behaviours
13 practices were measured
as two bundles-(a)
employee skills and
organisational structures
(quality management circle,
teams) and (b) employee
Included the 13
practices
developed by
Huselid (1995)
Establishment
-level survey
of Managers
HR practices
in each
establishment.
Employee job
satisfaction and
employee
affective
commitment
Collected
subordinate
employee
assessment of
job satisfaction,
and affective
Results from cross-
level analysis
indicated that the
relationships
between
establishment-level

60 | P a g e
using a multi-
level theoretical
perspective.
motivation (Performance
appraisals)
commitment. HPWS and
employee job
satisfaction and
affective
commitment were
fully mediated by
establishment-level
concern for
employees’ climate.
Kehoe &
Wright
(2010)
Few studies have
considered the
important role of
employees’
perceptions of HR
practice use. They
examined the
relationships
between
employees’
perceptions of
high-performance
HR practice use in
their job groups
and employee
absenteeism,
intent to remain
with the
organisation, and
OCB, dedicating a
focus to the
possible role of
affective
commitment in
these relationships
15 items compiled from
SHRM literature(HR
Practices) aimed at
improving employees’
KSAs and motivation and
opportunity to perform:
selective staffing (formal
selection test, structured
employment interviews);
employee participation
(formal participation
processes, fair complaint
procedures, employee
autonomy in job design):
performance based
compensation(bonuses
based on group, and
individual performance
outcomes, merit based pay
rises); formal performance
evaluation; regular
information-sharing
communication; merit
based promotion
opportunities; extensive
formal training.
Included items
and Hr
practices based
on previous
empirical
research in
SHRM
literature.
Specifically,
Huselid (1995);
Combs et al.
(2006); Sun et
al. (2007)
HR directors
administered
survey to a
randomly
selected group
of 20% or
more of
employees in
their unit in a
large food
service
organisation.
Organisational
Citizenship
behaviour,
intent to
remain with the
organisation,
absenteeism
Employees
reported
estimates of
OCB, intent to
remain in the
organisation,
and absenteeism
Employees’
perceptions of high
performance HR
practices use at the
job group level
positively related to
all dependent
variables and that
affective
organisational
commitment
partially mediated
the relationship
between HR practice
perceptions and
OCB and fully
mediated the
relationship between
HR practice and
intent to remain with
the organisation.
Chuang &
Liao,
(2010)
They investigated
the intermediate
linkages between
HR practices and
35 items including 6 HR
practices: staffing, training,
involvement/participation,
performance appraisal,
Practices and
items included
were based on a
literature
Business-unit
level data
collected on
survey sent to
Market
performance:
marketing,
sales growth,
Managers
reported of
ratings of
annual market
Managers’ reports of
HPWS positively
related to
employees’ reports
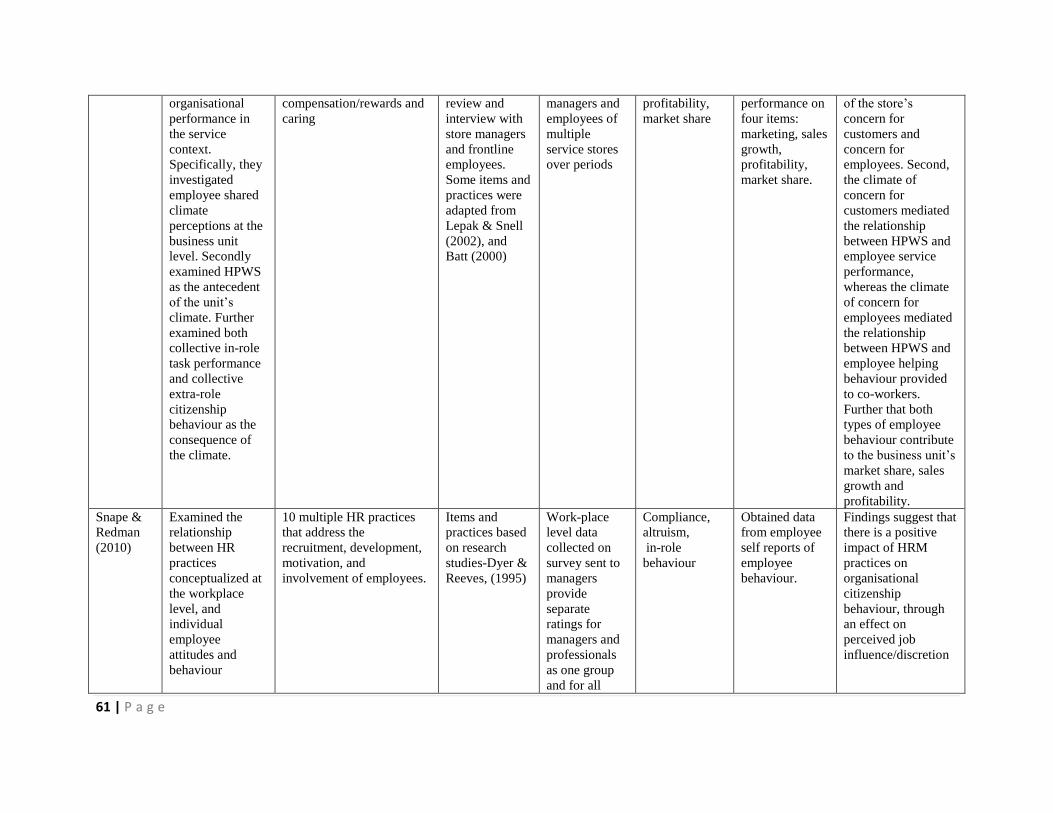
61 | P a g e
organisational
performance in
the service
context.
Specifically, they
investigated
employee shared
climate
perceptions at the
business unit
level. Secondly
examined HPWS
as the antecedent
of the unit’s
climate. Further
examined both
collective in-role
task performance
and collective
extra-role
citizenship
behaviour as the
consequence of
the climate.
compensation/rewards and
caring
review and
interview with
store managers
and frontline
employees.
Some items and
practices were
adapted from
Lepak & Snell
(2002), and
Batt (2000)
managers and
employees of
multiple
service stores
over periods
profitability,
market share
performance on
four items:
marketing, sales
growth,
profitability,
market share.
of the store’s
concern for
customers and
concern for
employees. Second,
the climate of
concern for
customers mediated
the relationship
between HPWS and
employee service
performance,
whereas the climate
of concern for
employees mediated
the relationship
between HPWS and
employee helping
behaviour provided
to co-workers.
Further that both
types of employee
behaviour contribute
to the business unit’s
market share, sales
growth and
profitability.
Snape &
Redman
(2010)
Examined the
relationship
between HR
practices
conceptualized at
the workplace
level, and
individual
employee
attitudes and
behaviour
10 multiple HR practices
that address the
recruitment, development,
motivation, and
involvement of employees.
Items and
practices based
on research
studies-Dyer &
Reeves, (1995)
Work-place
level data
collected on
survey sent to
managers
provide
separate
ratings for
managers and
professionals
as one group
and for all
Compliance,
altruism,
in-role
behaviour
Obtained data
from employee
self reports of
employee
behaviour.
Findings suggest that
there is a positive
impact of HRM
practices on
organisational
citizenship
behaviour, through
an effect on
perceived job
influence/discretion
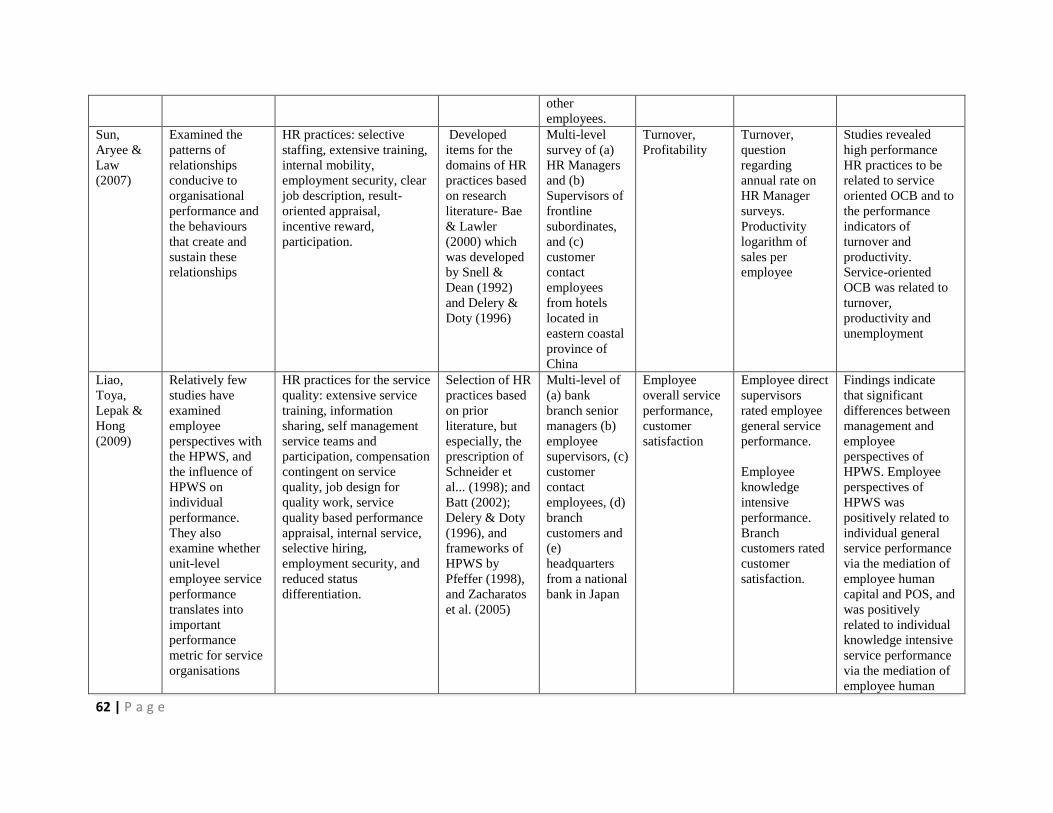
62 | P a g e
other
employees.
Sun,
Aryee &
Law
(2007)
Examined the
patterns of
relationships
conducive to
organisational
performance and
the behaviours
that create and
sustain these
relationships
HR practices: selective
staffing, extensive training,
internal mobility,
employment security, clear
job description, result-
oriented appraisal,
incentive reward,
participation.
Developed
items for the
domains of HR
practices based
on research
literature- Bae
& Lawler
(2000) which
was developed
by Snell &
Dean (1992)
and Delery &
Doty (1996)
Multi-level
survey of (a)
HR Managers
and (b)
Supervisors of
frontline
subordinates,
and (c)
customer
contact
employees
from hotels
located in
eastern coastal
province of
China
Turnover,
Profitability
Turnover,
question
regarding
annual rate on
HR Manager
surveys.
Productivity
logarithm of
sales per
employee
Studies revealed
high performance
HR practices to be
related to service
oriented OCB and to
the performance
indicators of
turnover and
productivity.
Service-oriented
OCB was related to
turnover,
productivity and
unemployment
Liao,
Toya,
Lepak &
Hong
(2009)
Relatively few
studies have
examined
employee
perspectives with
the HPWS, and
the influence of
HPWS on
individual
performance.
They also
examine whether
unit-level
employee service
performance
translates into
important
performance
metric for service
organisations
HR practices for the service
quality: extensive service
training, information
sharing, self management
service teams and
participation, compensation
contingent on service
quality, job design for
quality work, service
quality based performance
appraisal, internal service,
selective hiring,
employment security, and
reduced status
differentiation.
Selection of HR
practices based
on prior
literature, but
especially, the
prescription of
Schneider et
al... (1998); and
Batt (2002);
Delery & Doty
(1996), and
frameworks of
HPWS by
Pfeffer (1998),
and Zacharatos
et al. (2005)
Multi-level of
(a) bank
branch senior
managers (b)
employee
supervisors, (c)
customer
contact
employees, (d)
branch
customers and
(e)
headquarters
from a national
bank in Japan
Employee
overall service
performance,
customer
satisfaction
Employee direct
supervisors
rated employee
general service
performance.
Employee
knowledge
intensive
performance.
Branch
customers rated
customer
satisfaction.
Findings indicate
that significant
differences between
management and
employee
perspectives of
HPWS. Employee
perspectives of
HPWS was
positively related to
individual general
service performance
via the mediation of
employee human
capital and POS, and
was positively
related to individual
knowledge intensive
service performance
via the mediation of
employee human

63 | P a g e
capital and
psychological
empowerment.
Management
perspective of
HPWS was related
to human capital and
both types of service
performance. Overall
knowledge-intensive
performance was
related to overall
customer satisfaction
with the branch’s
service.
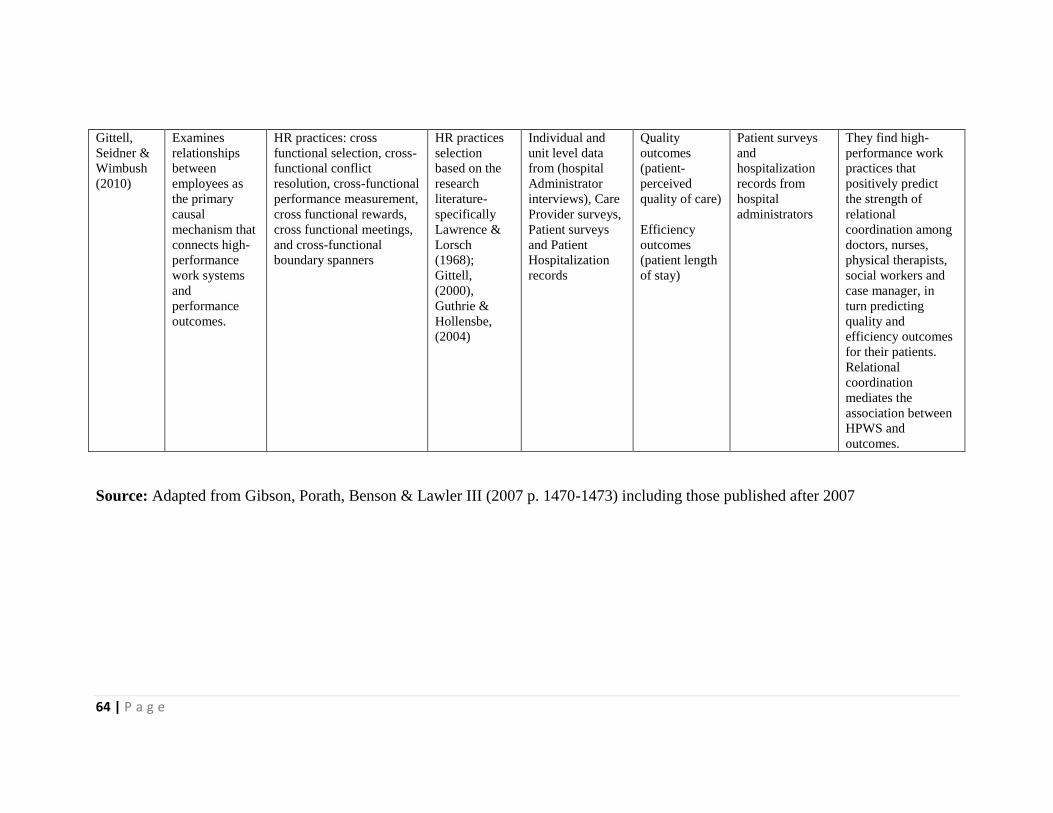
64 | P a g e
Gittell,
Seidner &
Wimbush
(2010)
Examines
relationships
between
employees as
the primary
causal
mechanism that
connects high-
performance
work systems
and
performance
outcomes.
HR practices: cross
functional selection, cross-
functional conflict
resolution, cross-functional
performance measurement,
cross functional rewards,
cross functional meetings,
and cross-functional
boundary spanners
HR practices
selection
based on the
research
literature-
specifically
Lawrence &
Lorsch
(1968);
Gittell,
(2000),
Guthrie &
Hollensbe,
(2004)
Individual and
unit level data
from (hospital
Administrator
interviews), Care
Provider surveys,
Patient surveys
and Patient
Hospitalization
records
Quality
outcomes
(patient-
perceived
quality of care)
Efficiency
outcomes
(patient length
of stay)
Patient surveys
and
hospitalization
records from
hospital
administrators
They find high-
performance work
practices that
positively predict
the strength of
relational
coordination among
doctors, nurses,
physical therapists,
social workers and
case manager, in
turn predicting
quality and
efficiency outcomes
for their patients.
Relational
coordination
mediates the
association between
HPWS and
outcomes.
Source: Adapted from Gibson, Porath, Benson & Lawler III (2007 p. 1470-1473) including those published after 2007

65 | P a g e
2.13 SUMMARY
Research has shown a positive relationship between human resource practices and organisational
performance. Although, research has shown significant positive relationship in the reverse
causality than forward causality; there has not been significant research in this area in different
sectors and contexts. The chapter has reviewed literature regarding the main concepts of the
study. Definitions and conceptualisations of business strategy, human resource management
practices, employee attitude, employee behaviour, organisational performance, control variables,
reverse causality and theoretical perspectives have been provided. Chapter three discusses the
research design and methodology that were followed in conducting the empirical study.

66 | P a g e
CHAPTER THREE
RESEARCH DESIGN AND METHODOLOGY
3.1 INTRODUCTION
This chapter describes the research setting where the study was conducted, data collection
procedures, measures of the variables in the conceptual model and the analytical techniques that
were employed to test the hypotheses. The chapter addresses issues relating to: (1) the research
paradigm; (2) research methodology; (3) the data collection instrument and (4) finally data
analysis techniques.
Following an in-depth review of the constructs in Chapter two; relationships between human
resource management practices and organisational performance as moderated by business
strategy and mediated by employee attitudes and employee behaviour were suggested for
research. A conceptual model with structural relations was conceived from the literature review
in order to determine the specific nature of the relationships. Data was analysed, results were
discussed, conclusions were drawn and recommendations for future research were stated.
3.2 RESEARCH METHODOLOGY
The collective term for the structured process for conducting research is referred to as research
methodology. It is a way of serving the epistemic ideal of science (Babbie & Mouton, 2006). In
order to search for valid explanations; science is attached to an epistemic imperative, whose
explanations can only be regarded as viable if the explanation closely fits the data available. If
the methodology used is only partially explained; it would be difficult to evaluate the merit of the
conclusions drawn. According to Babbie and Mouton (2006) description of the methodology
used would help other researchers identify methodological gaps and thereby determine the extent
to which the gap would influence the validity of the conclusions. To establish the reader’s
confidence in the scope and quality of the procedures that were used in this study, the research
process and the choice of the methodology that were used in this study are discussed in the
following sections. This chapter also discusses the following: the research design, sampling
67 | P a g e
strategy, data collection procedure, the measuring instruments, and a description of the statistical
analysis procedures that were used to analyse collected data.
3.2.1 Research design and justification
In order to test the structural relations as hypothesized in the conceptual structural model (Figure
2.1) an appropriate research design was required. It is a general plan in which the researcher
tries to find answers to the research question, explaining the source of data and possible
constraints (Pallant, 2013). According to Mouton and Babbie and Mouton (2001) and Kothari
(2004) a research design is a plan, blueprint or guideline on how research should be done. It is
determined by the research problem and the type of evidence needed to address the research
problem. It attempts to provide empirical evidence that can be interpreted in favour or against the
hypothesis to be tested.
Specific structural relationships between latent variables have been presented depicting
hypotheses linking the variables. In order to test empirically the merit of the structural
relationships a plan was designed. This plan is referred to as a research design (Kerlinger & Lee,
2000). It is a guideline on how research will be done (Babbie & Mouton, 2001). Different
research strategies are applied like survey; experiments, case study, grounded theory,
ethnography and action research (Saunders et al. 2000; Pallant, 2013). Experiments and surveys
are classified as quantitative while the other four are qualitative (Veerayangkur, 2000; Pallant,
2013). This study employed use of a survey through a questionnaire. This is a popular and
common strategy in scientific finding in business and management research. It collects data by
asking respondents the same set of questions (Saunders et al. 2000). It permits collection of large
data from a sizeable population in an economical way. It gives more control over the research
process. In this study; delivery and collection of the questionnaire was employed by the
researcher because this ensures a high response rate.
Descriptive study design was used to gain an overview of the situation regarding the variables
and explore facts about the population. Correlation design was also used to empirically test the
relationship between HRM practices and organisational performance. Regression design was
used to test the reverse causality between organisational performance and employee behaviours.

68 | P a g e
On the time basis, this study used a cross-sectional design where data was collected only at once.
Cross-sectional studies are relatively quick, cost effective, do not require follow up and are easy
to collect data (Kerlinger & Lee, 2000; Bhattacherjee et al. 2012).
The research design aims to provide answers to the research question, and it also endeavours to
control variance (Kerlinger & Lee, 2000). Variance, according to Theron (2007), represents the
extent to which the value of a variable differs/varies across units of analysis. The
unambiguousness, with which the empirical evidence can be interpreted for or against the
operational hypotheses, is largely determined by the degree to which the research design is able
to minimise error variance, maximise systematic variance and control extraneous variance
(Kerlinger, 1973).
Development and validation of the conceptual model (Figure 2.1) involves facilitating the
research process, arriving at a particular research design. The plan and structure of the current
study can best be achieved within the realms of the quantitative research design. According to
Cooper and Schindler (2003) quantitative research design is systematic scientific investigation of
quantitative properties and phenomena and their relationship. Quantitative approach aims at
developing and employing mathematical models, theories and/or hypotheses pertaining to a
phenomenon. Provision of measurement is very central to quantitative research, because it
provides the fundamental connection between empirical observation and mathematical
expression of quantitative relationships (Pallant, 2013). It is further argued that quantitative
research allows for data to be tested rigorously using statistical means that enhance reliability
(Leedy & Ormrod, 2001).
This study applied correlational research which aims at examining and describing the
associations and indirect relationships in data. It also allows the researcher to objectively
establish the variables that are closely associated with each other or influence one another.
Precisely, independent and dependent variables were observed across individuals in order to
identify any patterns of relationships between the two and measure the strength of a particular
relationship (Gravetter & Forzano, 2006). Although correlation cannot be used to demonstrate
cause-and-effect relationships between variables; this approach offers strong support to the

69 | P a g e
structural equations model theory which is used to test the validity of theories about sequential
relationships between two or more variables and determine the combination of variables that
predict a particular variable (Kerlinger, 1992).
3.2.1.1 Survey Research
To provide answers to the research questions a survey methodology using standardized
measuring instrument was used. This involved collection of primary data. Survey research
involves the administration of questionnaires to a sample of respondents that form part of a
population, in order to discover the relative incidence, distribution, and interrelations of
sociological and psychological variables (Kerlinger & Lee, 2000, Samuel; Shields et al, 2015;
Nardi, 2015, 2016). Surveys take various forms including mail, self-administered, face-to-face
and telephone surveys and they can be utilised for descriptive, exploratory and explanatory
research (Samuel, 2016). The self-administered survey (in which respondents independently
complete questionnaires) was employed in this study. This method is only appropriate when the
population that is being studied is adequately literate a requirement that was set to all
respondents.
3.2.1.2 Research Philosophy
Research must be based on a philosophy of knowledge. A research philosophy is also referred to
as a research paradigm i.e. a basic set of beliefs, feelings, and some established practices of
theoretical and methodological ideas about the world that guide action (Denzin & Lincoln, 2003;
Saunders, Lewis & Thornhill, 2007). A paradigm is a broad view or perspective of something
(Taylor, Kermode & Roberts, 2007; Pallant 2013).
Research philosophy determines what the enquiry is and how research will be done. It is the way
we think about the progress of knowledge (Mahomed, 2006; Pallant, 2013). This forms a
paradigm, an interpretive framework; which influences what should be investigated, how
research should be done and how the results are interpreted (Bryman & Bell, 2016; Liu, 2010;
Creswell et al. 2017; Veal, 2017; Brannen, 2017). According to Lincoln and Guba (2004)
paradigms are distinguished based on three main principles: (1) the stance about reality
70 | P a g e
(ontology) (2) relationship between the researcher and what is being investigated (epistemology)
(3) and the process for gathering knowledge about the world (methodology).
There are different views about how knowledge is developed each being very important in
business and management research (Saunders, et al. 2000). Positivist is an epistemological
approach advocating application of natural sciences to the study of social reality and beyond
(Bryman & Bell, 2016) where the researcher assumes an objective analyst role. Emphasis is on
quantifiable observation. Positivist is an epistemological position which advocates use of the
natural science to the study of social reality (Bryman & Bell, 2011). It is the dominant view in
research linking human resource management and performance (Boselie, 2005).
The main objective of this study is to investigate the reverse causality (mechanisms) between
employee behaviour and organisational performance. Given this aim, positivist perspective is
more appropriate because it uses survey questionnaire for data collection leading to a statistical
investigation. This allows objective analysis of data including hypothesis testing so that
relationships can be explained and valid generalisable conclusions made (Ericksson &
Kovalainen, 2008; Easterby-Smith, Thorpe & Jackson, 2008).
3.2.1.3 Designing the survey instrument
In order to collect quantitative data through a survey; a questionnaire was designed. It used
specific questions to motivate the respondents and limit response error (Pallant, 2013). The
process of questionnaire design was guided by the conceptual framework (Figure 2.1) which
gave insight on what to include in the questionnaire. Relevant variables were identified and their
measures derived from several previous studies (Katuo, 2010, 2012; Guest et al. 2001, 2003).
Specific HRM practices and manufacturing specific performance indicators were identified from
previous studies as discussed in Chapter two. Questionnaire measures dependent and
independent variables with limited researcher interference, as such no manipulations are
involved (Tharenou et al. 2007).
71 | P a g e
3.2.1.4 Measuring Instrument
Two measuring instruments were used; one for employees and another one for managers. The
aim was to cross check managers responses with what employees give. The instruments were
measuring the same constructs of business strategy, human resource management practices,
employee attitude, employee behaviour and organisational performance as developed in the
conceptual framework (Figure 2.1).
The questionnaire was divided in two sections. The first section gathered data on the
respondents’ profile, with questions regarding, gender, age, education, marital status, experience,
size of the organisation, union intensity and product the organisation is making. The second
section measured manager and/or employee perceptions about business strategy, HRM practices,
employee attitudes, employee behaviours and organisational performance their organizations.
Measures used in the study are summarised. As discussed in chapter one and two; this study
investigated the reverse causality between organisational performance and employee behaviour
using the HRM practices and organisational performance link model. To test these relationships;
two different questionnaires were used to seek responses from managers and employees. All the
variables were measured on a 5-point Likert scale. The actual specific measures used are
described below and listed in Appendix 1.2 and 1.3 for managers and employees respectively.
The Cronbach’s alpha (the realities) for the measurement scales are summarised in Table 4.10b
3.2.1.4.1. Business Strategy
The level of importance of business strategy was measured by eight selected items from cost
reduction strategy to customer service strategy as adopted from Katuo and Budhwar, (2010). A
sample item is “In your opinion, how would you rate the importance of the cost reduction
strategy in your organisation”. Respondents were asked to rate the level of importance they
attach to the item on a 5-point Likert Scale (1=not at all important to 5=extremely important).
The Cronbach’s Alpha for this scale was 0.772.
3.2.1.4 .2 Human Resource Management Practices
Unlike Katuo (2012) who used 12 practices; this study used four human resource management
practices. These have been chosen because, they are considered the most important practices in
strategic human resource management and are synergetic. Literature has also shown that these

72 | P a g e
have been the most prominent practices used in research (Katuo & Budhwar, 2010; Katuo,
2012). A five-point Likert scale was used.
3.2.1.4 .3. Recruitment and selection
This construct was measured using five items as developed by Katuo, (2012) (2 items) and also
used by Huselid, (1995) (2 items) and Guest, et al. (2003) (1 item). Manager and employee
respondents were asked to rate the effectiveness of recruitment and selection in the firm on a 5
point-Likert scale (1=not at all effective to 5=highly effective). An example of the question was
“In your opinion, how effective is your recruitment process?” The Cronbach’s Alpha for this
scale was 0.80.
3.2.1.4 .4. Training and Development
Training was measured using five item scales developed by Katuo and Budhwar (2008) (3 items)
and Katuo (2012) (2 items). These scales were also used by Ahmad and Schroeder, (2003);
Guthrie et al. (2009) and Ngo et al. (2008). Respondents were asked to rate the effectiveness of
the organisation training and development programmes and work design programmes on a 5-
point Likert scale (1=not at all effective to 5=highly effective). Development was measured by
asking respondents to rate employee competences and cooperation amongst them the past three
years on a 5-point Likert scale (1=very poor and 5=very good). An example of the question of
the training variable was “In your opinion, how effective are your employees training
programmes”, “In your opinion, how effective are your work design programmes”. For the
development aspect, an example of the question was “How would you rate employee
competences the past three years? How would you rate cooperation among employees the past
three years? The Cronbach’s alpha for this sub scale was 0.88. This factor was loading together
with performance appraisal for employees; as such the two factors were combined and named as
development.
3.2.1.4 .5. Performance appraisal
This sub scale was measured by 9 items scale developed by Guest et al. (2003) (3 items); Guthrie
et al. (2009) (1 item); Huang, (2001) (3 items) and Akhtar, (2008) (2 items). The respondents
were asked to rate their level of agreement with statements pertaining to how performance
appraisal is done in the firm on a 5-point Likert scale (1=strongly disagree to 5=strongly agree).

73 | P a g e
An example of the question of the performance appraisal was “performance appraisal is fair and
unbiased”. The Cronbach’s alpha for the sub scale was 0.857. This factor was termed as
development for employees.
3.2.1.4 .6. Compensation
The scale was measured by 8 items scale developed by Katuo and Budhwar (2008) (5 items) and
Guthrie et al. (2003) (3 items). The respondents were asked to rate the use of compensation
measures in the firm on a 5-point Likert scale (1=never use to 5=frequently used). An example of
the question of this scale was “how would you rate the use of rewards in your organisation”. The
Cronbach’s alpha for employees was 0.87
3.2.1.4 .7. Employee attitudes
This is a mediating variable. Employees’ attitudes were measured using a three items scale of
motivation, satisfaction and commitment developed by Parker et al. (2003) and Shields, (2015)
(1 item); Katuo (2010, 2012) (2 items). Respondents were asked to rate employee attitude based
on employee satisfaction, motivation and commitment in the organisation on a 5-point Likert
scale (1=very bad to 5=very good). An example of the question was “How would you rate
employee motivation in your organisation the past three years?” The Cronbach’s Alpha for this
scale was 0.952.
3.2.1.4 .8. Employee Behaviour
This is another mediating variable. Employees’ behaviour was measured using a three items
scale of turnover (counterpart of staying in the organisation), absenteeism (counterpart of
presence) and disputes developed by Richardson and Chmiel et al, 2017; (1999); Guest, (2001)
and Katuo, (2012); Raza-Ullah (2014); Brubaker et al. (2014); Giri, (2017) and Katuo and
Budhwar, (2010). Respondents were asked to rate employee behaviours in the firm based on the
number of voluntary leaves, absences and disputes in the organisation the past three years on a 5
point Likert scale (1= very small and 5=very big). However, Raza-Ullah (2014) changes disputes
into litigations. An example of the question was “How would you rate the number of voluntary
leaves in your organisation the past three years?” The Cronbach’s Alpha for this scale was 0.952

74 | P a g e
3.2.1.4 .9. Organisational Performance
Organisational performance was measured using five items (Guest, 2001) Respondents were
asked to rate their firm manufacturing performance as compared to their competitors using
organisational performance indicators of throughput (time), quality of products, delivery
flexibility, scope flexibility and production cost reduction on a 5-point Likert-scale of (1= very
poor to 5=very good). An example of the question was “How would you rate the overall
manufacturing throughput in the past three years?” The Cronbach’s Alpha for this scale was
0.929.
The study collected perceptual data and not actual data. This is consistent with previous studies
(Delaney & Huselid, 1996; Lahteenmaki et al. 1998; Ngo et al. 1998; Guthrie et al. 2009) which
also used perceptual performance indicators. Collecting actual data is challenging in most
organisations because such studies are regarded as espionage or spying on them or that the
researcher is working for a competing firm. In this regard, firms are unlikely to disclose their
actual performance data. It is argued that perceptions about firm performance by respondents are
valid performance indicators than actual data (Vlachos, 2008). This is so because self-reported
and perceptual measures reflect what is more current than actual data which is derived from
annual reports of previous years’ performance (Day & Nancy, 1996). On this basis, this study
measures HRM practices and organisational performance using perceptions of managers and
employees rather than actual data.
3.2.2 Control variables
Organisational size, age and union intensity were used as factors that affect the adoption of HRM
practices and organisational performance (Hassan, 2016; Katuo, 2012; Katuo & Budhwar, 2010).
Organisation size was determined by the number of employees and ranged from 20 to 121
employees and above. Organisational age ranged from 3 to 26 years and above. Union intensity
was examined by different levels ranging from 1-25% to 75-100%.

75 | P a g e
3.2.1.5 Research setting
This study was conducted in the agricultural manufacturing sector in Malawi in Mulanje,
Thyolo, Blantyre, Balaka, Lilongwe and Nkhotakota districts. Agriculture is the main stay of
Malawi’s economy and agro processing and value addition are some of the major policy
directions of the Malawi government. The research population were managers and employees of
medium and large Agricultural manufacturing firms in Malawi. The conceptual model was tested
using data collected in the field setting. This is consistent with Brewer (2000) who observes that
research conducted in the field yields greater external validity is more robust, representative and
provides relevant findings.
3.2.1.6 Pilot study
After getting the University Ethics Committee approval, a pilot study was undertaken in order to
check if the methods and procedures proposed would work (Arain, Campbell, Cooper &
Lancaster, 2011). The pilot sample consisted of two firms i.e. 10% of the projected sample
(Sekaran, 2010). The participants were 42 (6 managers and 36 employees). The two firms and its
managers and employees were excluded from the sample of the actual study.
The objectives of the pilot study were to pre-test the questionnaire items, detect errors and fine
tune them in order to ensure that there is no ambiguity or bias. This stage identified weaknesses
and the potential of the research regarding instrument clarity, wording and formatting of the
questionnaire. It is important to test the questionnaire before administering it. No validity tests
were conducted at this stage because validity tests require sample size of 80 (10 participants per
8 of the parameters) and above for meaningful analysis (Pallant, 2013; Wolf, et al.2013)).
3.3 SAMPLING
3.3.1 Population of the study
A population refers to all items under consideration in any field of enquiry (Kothari, 2004). The
target population of interest in this study were all agricultural manufacturing firms in Malawi
that have operated for a minimum of 3 years and have a workforce of not less than 20. There are
92 such firms and have been categorized according to region and product they manufacture i.e.
tea, cooking oil, sugar, dairy products, confectionary etc. The population of interest is however

76 | P a g e
49 firms i.e. those that meet the criteria of 3 years old and above (firm age) and having 20
employees and above (firm size).
3.3.2 Sampling frame
This refers to subjects of study and the researched environment (Freeman, 2017). The sampling
frame for this study constituted all agricultural manufacturing firms in Malawi. A list of these
subjects was obtained from the Malawi Investment and Trade Centre (MITC)2 and it involved 92
firms.
3.3.3 Sample size
Sample size is a subset of population and it refers to the number of elements included in the
study which meets the criteria of representativeness and adequacy (Kothari, 2004). Edriss (2013)
notes that a good sample is representative and is drawn using random sampling technique which
gives elements equal chance of being selected. (Kothari, 2004) observes that such a sample has a
small sampling error, is viable in the context of funds, controls systematic bias; and its results
can be universalized.
A sample is considered large enough if it contains at least 30 randomly selected elements
(Magnani, 1997). At that level, the sample can be construed as having normally distributed
elements that conform to the law of large numbers (central limit theorem). Edriss (2013) further
suggests that another way is to consider the number of variables in the model to determine the
sample size. This can be done where:
n = 10 times the number of relevant independent variables in a given model = 10K, where K is
the number of relevant independent variables included in the model and as long as, 10K is
greater than n=30 (the magic number in parametric statistics).
Sample size can be arrived at by using techniques such as census for small populations, using a
sample size for a similar study in the past, or using published tables and using formulas (Israel,
2 The organization promotes production and markets Malawi’s goods and services towards the
sustainable development through investment and trade with a focused sectoral approach.

77 | P a g e
2012; Creswell, 2017; Veal, 2017 2012). However, the actual sample size for a survey depends
on the type of research and other factors e.g. funding. Yamane (1967) uses the formula:
2)(1 eN
Nn
Equation 1
Where: n = Sample Size; N=49=population of interest; e=5%=absolute error in estimating p. A
95% confidence level and P=0.5 are assumed for the equation. This formulation is more precise
as agreed by Israel, (2012) where the population size and proportions are known,
2)05.0(491
49
n =43
Application of equation 1 yielded a sample size of 43 firms representing 89% of the population.
However due to resource constraints 30% of the population was surveyed (Magnani, 1997). This
gives a sample size of 15 firms. However, invitation was extended to 20 firms in order to make
provision for firms that might not give consent to participate in the survey. According to
Magnani (1997) this is statistically significant as it can be construed as having normally
distributed elements that conform to the law of large numbers (central limit theorem).
3.3.4 Sampling methods
Sampling is the process of selecting a representative number of elements from a population
(Edriss, 2013). Probability is where each element of the population has a known probability of
being included in the sample (Edmonds & Kennedy, 2012). This study adopted probability
sampling procedure using random sampling technique to choose participating firms as employed
in similar past studies (Katuo, 2010, 2012; Tsai et al 2011). This procedure is superior to non-
probability sampling because elements have equal chance of being selected thereby making it
reliable (Bryman & Bell, 2016).The results obtained can also be assured of probability i.e.
measure the errors of estimation and significance of the results (Kothari, 2004). Kothari further
argues that probability sampling meets the law of Statistical Regularity which posits that when
on average a sample is randomly selected, it will have the same characteristics and composition
as the universe (Edriss, 2013).

78 | P a g e
There are two methods of sampling: probability (random samples, stratified samples, systematic
samples and cluster samples) and non-probability (accidental samples, quota samples, snowball
samples, purposive samples and convenience samples). Probability is the selection of a random
sample from the population where each participant has an equal chance of being selected (Babbie
& Mouton, 2001). It is regarded as the most accurate, reliable and most widely used in research
studies with large representative samples (Edriss, 2013). However, this method is not always
practical and attainable hence use of non-probability sampling in selecting research participants.
3.3.4.1 Participating firms
A list of agricultural manufacturing firms was obtained from Malawi Investment and Trade
Centre (MITC). Since the population from which to draw the sample is not homogeneous the
firms have been stratified according to the products they make and simple random sample was
drawn from each stratum where the sample size of each stratum is proportionate to the
population size of the stratum using the equation: nh = (Nh / N) * n = (4/49)*15. Proportional
sampling is where the population is divided into strata then select subjects proportionally from
the different strata (Mason, 2002) (See Appendix 2.1).
3.3.4.2 Research participants
Participants included Human Resources Manager, Operations Manager; Production Manager and
Director of Finance from each of the participating companies. This category of employees is
considered vital since they hold aggregated key institutional information. This approach is
different from previous studies that used a single-rater (Gerhart et al. 2000; MacKinnon et al.
2002; Purcell, 2003) and suffered from reliability efficiency. Batt (1999) Guest and Peccei
(2001) used multi-raters and Gerhart et al. (2000) agrees and recommends that at least there must
be 4 raters per unit of analysis for HRM indicators and at least 3 for performance indicators.
Using snowball sampling each manager was requested to suggest six best performing employees
who had worked not less than 3 years in their department to complete the questionnaire. This
category of employees has better institutional memory of the firm and its human resource
management practices as suggested by Bjorkman (2011) Marsh, (2016); and Rambiyana, (2016).
Since the study employed a pencil and paper method of questionnaire administration; these
79 | P a g e
employees were sufficiently proficient in English language and had no difficulty in completing
the questionnaire. Having 18 employee respondents per firm was consistent with Katuo (2012);
Gerhart et al. (2000) who suggest that the reliability of structural measures increases when using
5-10 respondents per firm. Furthermore, Pallant (2013) argues that in order to do structural
equation modeling it is necessary to first do exploratory factor analysis whose minimum sample
size requirement is 150 respondents plus and there must be a ratio of at least 5 cases
(respondents) for each of the variables. This study had a total of 385 respondents (77 managers
& 308 employees) which is way above the minimum sample size required for exploratory factor
analysis.
Probability random sampling method was employed for firm selection. This was aimed at
ensuring that all firms had equal chances of being selected so that data would be collected from a
representative sample of the agricultural manufacturing firms. Purposive sampling was used to
select managers (research participants) because of their aggregate knowledge. Non probability
sampling using snowball technique was used in determining other research participants
(employees). The study relied on each manager to refer the researcher to the first employee who
in turn referred the researcher to the next employee and so on and so forth.
3.3.5 Data collection procedure
Data was collected from a random sample of Agricultural manufacturing firms in Malawi. In
particular, the study focussed on firms in Lilongwe and Nkhotakota (central region), Blantyre,
Thyolo, Balaka, and Mulanje (southern region) based on the agricultural products they
manufacture. Limiting respondents to Agriculture manufacturing constrains sources of variance
associated with employees from a wide variety of functions that could confound the effects of
independent variables and therefore allows better drawing of causal inferences.
The point of entry in each firm was the Human Resources Manager who referred the researcher
to the other managers (Operations/Production Manager and the Finance Manager). These
managers in turn referred the researcher to three employees in their respective departments to
complete the questionnaire. Dillman et al. (2014) argues that obtaining support from
management is crucial in soliciting trust from respondents, confirms the purported use of the
80 | P a g e
survey and increasing the probability of having a higher response rate. Data was collected using
a self-administered questionnaire using a Likert scale of 1 to 5 measures. The questionnaires
were appropriately numbered and items coded accordingly. After the data collection exercise,
data was entered into an SPSS version 24 file. This was saved with its own file name before
proceeding to clean the data.
Being a paper- and -pencil survey, incidents of social desirability distortion and large proportions
of missing values can be very evident. In this regard, data was subjected to cleaning to remove
measurement equivalence and comparable item variability (Donovan, Drasgow & Probst, 2000).
The data collection method used in this study has some merits: (a) they help to make the analysis
of large datasets possible by using computer technology, (b) they are relatively cheap and
concise, allowing quick completion, (c) interviewer bias is minimised and is largely accurate, (d)
they allow for anonymous and honest responses from respondents, and (e) the problem of
missing values in a data set is minimised or even eliminated, (f) are time and resource efficient as
they are purpose-designed for quick turnaround with minimal resources (Tharenou et al. 2007),
(g) allows identification of attributes of a large population from a small group (Fowler, 2009)..
Some demerits of survey research include: (a) the possibility of low response rate and a
significant response bias, (b) the researcher has no control over the conditions accompanying the
completion of the questionnaire, (c) incomplete questionnaires, and (d) lack of the researcher’s
observation regarding how respondents react towards questions and the research setting (Babbie
& Mouton, 2006; Moser, 2017; Kerlinger & Lee, 2000). In this study, a survey was the preferred
procedure for data collection regarding the relationship between HRM practices and
organisational performance and the reversed causality. A total of 110 questionnaires were
distributed with 77 usable questionnaires for managers. For employees 400 questionnaires were
distributed with 308 usable questionnaires received. This represents a 70% and 77% for
managers and employees respectively..

81 | P a g e
3.3.6 Demographic profile of the sample
Table 3. 1: Demographic values used in the study
Individual characteristics Organisational characteristics
Age (in years) Sector (in product made)
Gender Size (in number of employees)
Education (in qualifications) Percent of union (% of employees in a union)
Experience (in years) Age (in years)
Position (post held)
Marital status
For employees, there were 220 males (71.4%) and 88 females (28.6%). Most employees (51.9%)
n=160 were in the age range of 30 to 40 years with n=110 (35.7%) in the age range of 18-29
years. In terms of education, most employees (n=180) 58.4% have a diploma. Most employees
(54.2%) n=169 have a 6 to 9 years experience. Most respondents n=101 (32.8%) came from the
tea sector. The descriptive statistics are presented in Table 3.1.
For managers, there were 72 males (93.5%) and 5 females (6.5%). Most manager respondents
were between 30 to 40 years of age (48%). The majority are married 71 (92%). In terms of
education the majority of the Managers 54 (70%) had a first degree. In terms of tenure in post;
n=27 had 6 to 9 years’ experience representing 35% seconded by 24 (31%) with 1 to 5 years. In
terms of organisational size most organisations (n=42) were employing 121 employees and
above (54%). In terms of union intensity; most firms (n=28) are in the range of 1 to 25% (36 %).
Most firms (n=29) are 26 years old and above (37 %). The descriptive statistics are presented in
Table 3.2.

82 | P a g e
Table 3. 2: Summary of Employee Respondents
Variable Frequency Percentage%
Gender
Male 220 71.4
Female 88 28.6
Age
18-29 110 35.7
30-40 160 51.9
41-50 29 9.4
51 & above 9 2.9
Marital Status
Married 265 86.0
Single 40 13.0
Other 3 1.0
Education Level
Primary Certificate 53 17.2
Diploma 180 58.4
First Degree 27 8.8
Masters Degree 1 0.3
Professional Certificate 7 2.3
Other 40 13.0
Junior Certificate 10 3.2
Malawi School Certificate 27 8.8
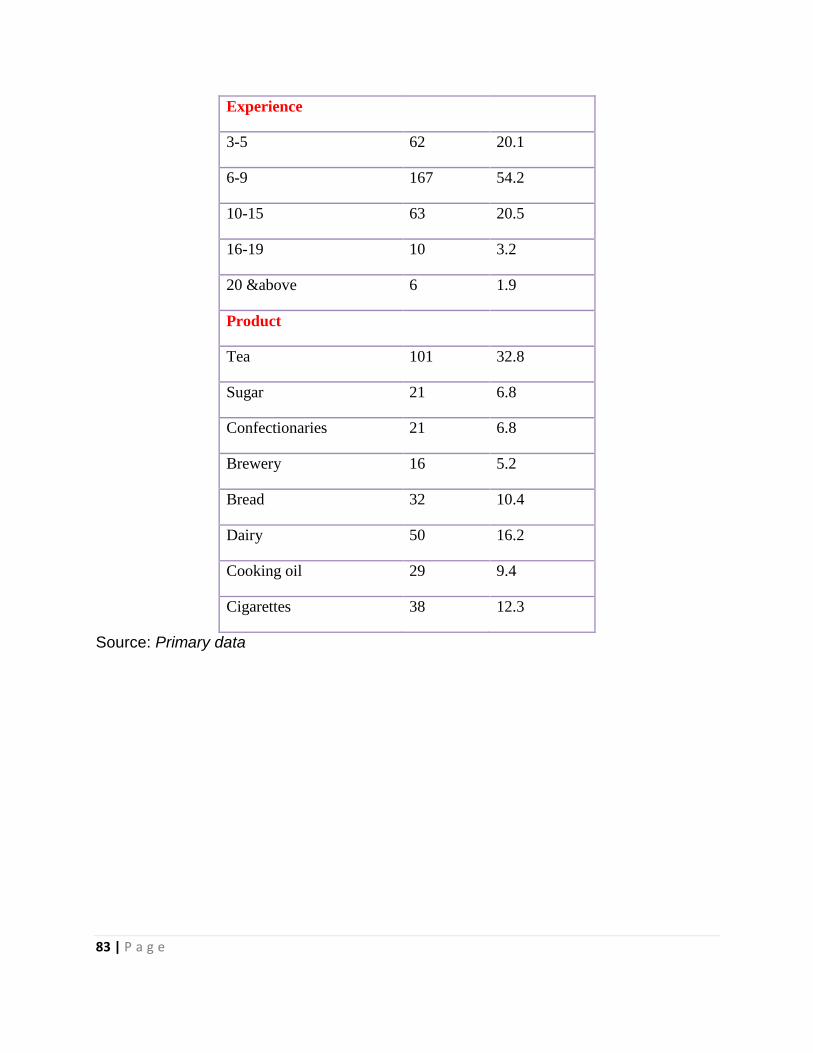
83 | P a g e
Experience
3-5 62 20.1
6-9 167 54.2
10-15 63 20.5
16-19 10 3.2
20 &above 6 1.9
Product
Tea 101 32.8
Sugar 21 6.8
Confectionaries 21 6.8
Brewery 16 5.2
Bread 32 10.4
Dairy 50 16.2
Cooking oil 29 9.4
Cigarettes 38 12.3
Source: Primary data

84 | P a g e
Table 3. 3: Summary of Manager Respondents
VARIABLE FREQUENCY PERCENTAGE (%) Position Ass HR Manager 1 1.3 Ass Production manager 1 1.3 Director of Finance 2 2.6 Financial Controller 4 5.2 Finance manager 12 15.6 Finance & Administration 1 1.3 General Manager 1 1.3 HR Manager 19 24.7 Operations Manager 17 22.0 Production Manager 19 24.7 Gender Male 72 93.5 Female 5 6.5 Age 18 to 29 years 5 6.5 30 to 40 years 37 48.1 40 to 50 years 25 32.5 51 years and above 10 13.0 Marital Status Married 71 92.2 Single 4 5.2 Other(specify) 2 2.6 Other Marital Status Widow 1 1.3 Education Certificate 6 7.8 Diploma 14 18.2 First Degree 54 70.1 Masters Degree 2 2.6 Professional certificate 1 1.3 Experience Less than one year 2 2.6 1 to 5 years 24 31.2 6 to 9 years 27 35.1 10 to 15 years 7 9.1 16 to 19 years 7 9.1 20 years above 10 13.0 Sector Tea 31 40.3 Sugar 4 5.2 Confectionaries 1 1.3 Brewery 4 5.2 Bread 8 10.4

85 | P a g e
Dairy 11 14.3 Cooking oil 10 13.0 Cigarettes 8 10.4 Organisational size 20 to 60 employees 26 33.8 61 to 90 employees 4 5.2 91 to 120 employees 5 6.5 121 employees &above 42 54.5 Union intensity None 21 27.3 1-25% 28 36.4 26-50% 20 26.0 51-75% 4 5.2 76-100% 4 5.2 Age of the firm 3 to 5 years 18 23.4 6 to 9 years 17 22.1 10 to 15 years 9 11.7 16 to 25 years 4 5.2 26 years & above 29 37.7
Source: Primary data
3.4 DATA CLEANING AND SCREENING
Three hundred and eight (308) and seventy-seven (77) responses were received from employees
and managers respectively. An initial examination of the responses found no incomplete
responses but a few missing data as such no responses were excluded from the analysis. Data
entry errors were avoided by using SPSS’s feature that defines acceptable value and labels for
each variable.
3.4.1 Missing data
Missing data is when valid values on one or more variables are not available for analysis (Hair et
al. 2010). A number of missing data identification and remedying steps have been suggested
(Hair et al. 2010). Firstly, it is important to identify the type of missing data in the data set i.e. is
it ignorable or cannot be ignored. Secondly, consider overall extent of missing data which is
determined by calculating the number of cases (questionnaires) with missing data for each
variable (item) and the number of variables (items) missing in each case (questionnaire).
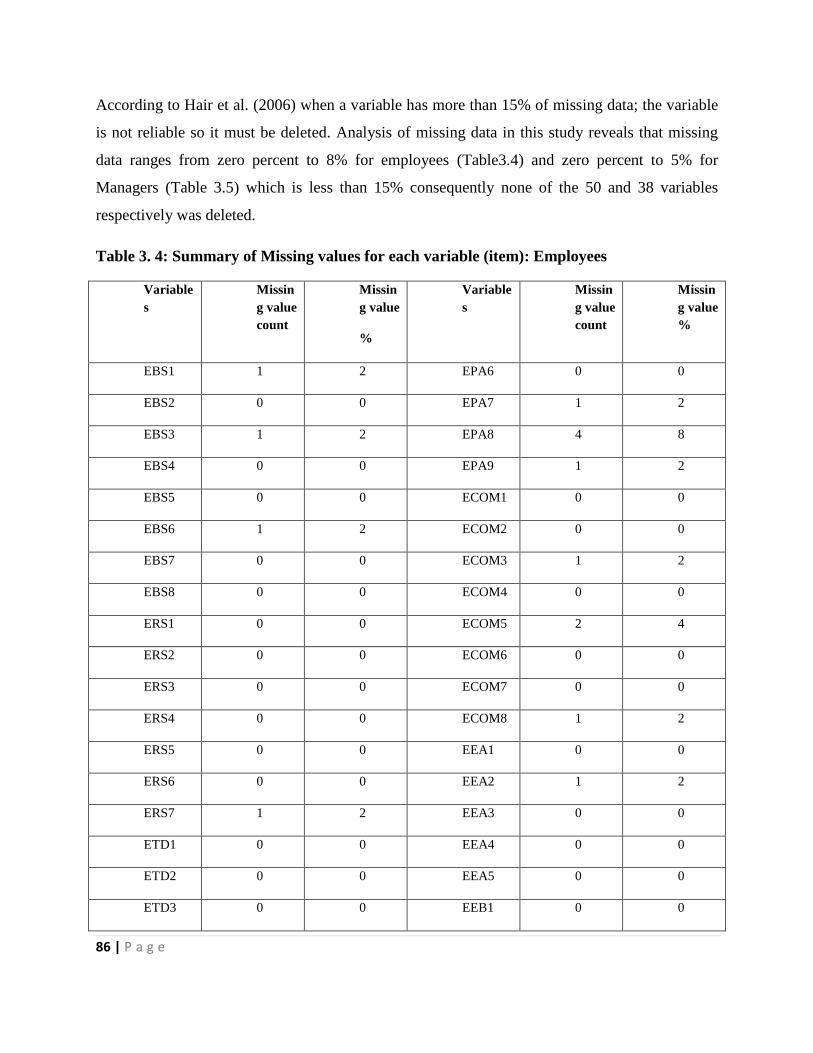
86 | P a g e
According to Hair et al. (2006) when a variable has more than 15% of missing data; the variable
is not reliable so it must be deleted. Analysis of missing data in this study reveals that missing
data ranges from zero percent to 8% for employees (Table3.4) and zero percent to 5% for
Managers (Table 3.5) which is less than 15% consequently none of the 50 and 38 variables
respectively was deleted.
Table 3. 4: Summary of Missing values for each variable (item): Employees
Variable
s
Missin
g value
count
Missin
g value
%
Variable
s
Missin
g value
count
Missin
g value
%
EBS1 1 2 EPA6 0 0
EBS2 0 0 EPA7 1 2
EBS3 1 2 EPA8 4 8
EBS4 0 0 EPA9 1 2
EBS5 0 0 ECOM1 0 0
EBS6 1 2 ECOM2 0 0
EBS7 0 0 ECOM3 1 2
EBS8 0 0 ECOM4 0 0
ERS1 0 0 ECOM5 2 4
ERS2 0 0 ECOM6 0 0
ERS3 0 0 ECOM7 0 0
ERS4 0 0 ECOM8 1 2
ERS5 0 0 EEA1 0 0
ERS6 0 0 EEA2 1 2
ERS7 1 2 EEA3 0 0
ETD1 0 0 EEA4 0 0
ETD2 0 0 EEA5 0 0
ETD3 0 0 EEB1 0 0

87 | P a g e
ETD4 0 0 EEB2 0 0
ETD5 1 2 EEB3 0 0
EPA1 2 4 EOP1 1 2
EPA2 0 0 EOP2 0 0
EPA3 0 0 EOP3 0 0
EPA4 0 0 EOP4 0 0
EPA5 0 0 EOP5 0 0
Total
number
of cases
50 Total
number
of cases
50
Table 3. 5: Summary of Missing values for each variable (item): Managers
Variable
s
Missin
g value
count
Missin
g value
%
Variable
s
Missin
g value
count
Missin
g value
%
BS1 0 0 PA3 0 0
BS2 0 0 PA4 0 0
BS3 0 0 COM1 1 3
BS4 0 0 COM2 0 0
BS5 1 3 COM3 0 0
BS6 0 0 COM4 1 3
BS7 0 0 COM5 0 0
BS8 0 0 EA1 0 0
RS1 0 0 EA2 0 0
RS2 0 0 EA3 0 0
RS3 0 0 EA4 1 3
RS4 0 0 EB1 0 0

88 | P a g e
RS5 0 0 EB2 0 0
TD1 0 0 EB3 1 3
TD2 0 0 OP1 0 0
TD3 2 5 OP2 0 0
TD4 0 0 OP3 0 0
TD5 0 0 OP4 0 0
PA1 0 0 OP5 0 0
PA2 0 0
Total
number
of cases
38 Total
number
of cases
38
Hair et al. (2006) further suggests that missing variables for an individual case that are under
10% of the total variables; the case should not be ignored, but be included in the analysis. In the
current study, missing variables by cases ranged from 0.3% to 1.0 % for employees (see Table
3.6) and 0% to 3% for managers (see Table 3.7) which is way below 10%, as such none of the
308 and 77 cases respectively was deleted.
Table 3. 6: Summary of missing values by case (questionnaire): Employees
Case
Ref. No
Numbe
r of
missing
values
Missin
g
values
%
Case
Ref. No
Numbe
r of
missing
values
Missin
g
values
%
171 1 0.3 270 2 1.0
130 1 0.3 266 1 0.3
104 1 0.3 272 2 1.0
275 1 0.3 128 1 0.3
129 1 0.3 287 1 0.3
275 4 1.0 225 1 0.3
270 1 0.3 130 1 0.3
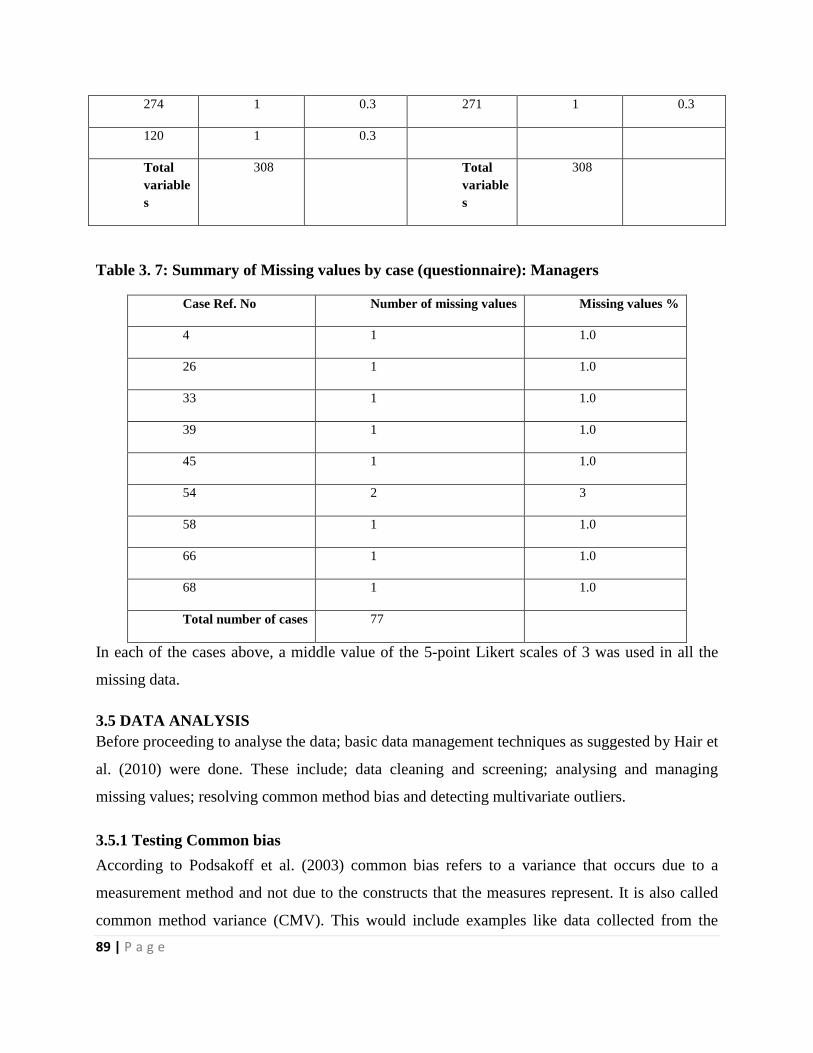
89 | P a g e
274 1 0.3 271 1 0.3
120 1 0.3
Total
variable
s
308 Total
variable
s
308
Table 3. 7: Summary of Missing values by case (questionnaire): Managers
Case Ref. No Number of missing values Missing values %
4 1 1.0
26 1 1.0
33 1 1.0
39 1 1.0
45 1 1.0
54 2 3
58 1 1.0
66 1 1.0
68 1 1.0
Total number of cases 77
In each of the cases above, a middle value of the 5-point Likert scales of 3 was used in all the
missing data.
3.5 DATA ANALYSIS
Before proceeding to analyse the data; basic data management techniques as suggested by Hair et
al. (2010) were done. These include; data cleaning and screening; analysing and managing
missing values; resolving common method bias and detecting multivariate outliers.
3.5.1 Testing Common bias
According to Podsakoff et al. (2003) common bias refers to a variance that occurs due to a
measurement method and not due to the constructs that the measures represent. It is also called
common method variance (CMV). This would include examples like data collected from the

90 | P a g e
same respondent for variables (single report) or data collected at one point of time ( one time
survey). If this bias exists, it may cause measurement error that negatively affects the validity of
the conclusions (Podsakoff et al. 2003).
Testing and diagnosis of common bias method uses different methods with Harman’s single
factor test as the most common (Podsakoff et al. 2003). This method requires loading all
measurement items into the factor analysis; then examine the unrotated factor solution due to an
exploratory factor analysis to determine the number of factors responsible for the variance in the
measurement items. According to Harman’s single factor analysis, common method bias occurs
only when either one factor accounts for the majority of the covariance (+50%) between the
measures or when one factor emerges from the factor analysis (Podsakoff et al. 2003).
In this study; using the unrotated principal component analysis, presence of 10 factors with an
eigenvalue of greater than 1 is revealed. This accounts for about 77 % of the variances in the
measures. It is also important to note that the first and greatest factor accounts for only 23 % of
the variances in the measures that is less than 50% which is required to indicate common method
bias. This indicates that one factor did not account for a larger proportion of the variance in the
measures and neither did a single factor emerge to represent the variance among all measurement
items. This indicates that common method bias due to data collection method is not a concern in
the current study.
3.7 STATISTICAL ANALYSIS
3.6.1 Item Analysis
Four factors affect how data is analysed (De Vaus, 2002). Firstly, the number of variables being
analysed determines whether a multivariate (three or more variables) bivariate (two variables) or
univariate (single variable) will be used. This study investigated the reversed causality of
organisational performance and employee behaviour using the HRM practices and organisational
performance model. Two variables are involved here firstly, HRM practices and organisational
performance and then organisational performance and employee behaviour in the reverse
causality. In this regard, bivariate statistics were used. Descriptive statistics of key variables were
initially obtained before running the bivariate statistics.

91 | P a g e
Within the categories mentioned above (univariate, bivariate, multivariate), it is important to
decide which analytical technique to use. To do this; it is important to know the level of
measurement of the variables. The level of measurement includes: interval, nominal and ordinal
(Sapsford, 2006). This study used ordinal level variables which do not require sophisticated
analytical techniques.
Thirdly ethics affect how data is analysed. The ethical principles of full, fair, appropriate and
challenging analysis were applied (Pallant, 2013). In view of the possibility of the results being
falsified and distorted, a number of recommendations are made to curb this. These include
reporting negative results and modifying theory instead of selectively reporting positive results
or indeed results that support a hypothesis (De Vaus, 2002). The other recommendation is use of
appropriate statistical techniques which include use of multivariate analysis to rigorously test
scales and evaluate the reliability of scales indicating how free the scale is from random error.
This can be illustrated by using the most common method, of an internal consistency score
(Pallant, 2013)
The degree to which the items of a scale measure the same underlying attribute is referred to as
internal consistency. When the items are highly correlated, the scale has high internal
consistency and results in Cronbach’s alphas of greater than .70 (Nunnally, 1978). The 50 and 38
items constituting the questionnaires were subjected to item analysis to determine their internal
consistency (see section 4.). The results of the item analysis are presented in Chapter 4.
Item analysis aims at determining whether a measurement is reliable or not (Pallant, 2013).
Further, it identifies poor items in these scales that do not represent the specific latent variable.
These items are unable to differentiate between various states of the latent variable they are
meant to explain. These items are considered for deletion (Theron, Spangenberg & Henning,
2004). Nunnally (1978) argues that a measurement is reliable only if it provides the same result,
regardless of any opportunities for variation that might occur.
92 | P a g e
In order to determine the reliability of the scales; coefficient alphas were calculated based on
internal consistency. Reliability coefficient size is based on both the average correlation among
items (internal consistency) and the number of items in a scale (Nunnally, 1978). All items were
subjected to item analysis using SPSS reliability procedure (Version 24) in order to identify and
delete poor items. Furthermore; item total correlations were also calculated to ensure internal
consistency of the measuring instruments. Item-total correlations of >0.20 were regarded as
satisfactory while those <0.20 were suitable for deletion (Nunnally, 1978)
The choice of statistics is determined by the purpose of the analysis. If the study is concerned
about summarising patterns of responses to cases in a sample, then descriptive statistics should
be used. If the study aims at exploring the relationship among variables, then a number of
techniques can be used (Pallant, 2013).
To analyse the relationship between HRM practices and organisational performance, scholars
have widely used statistical procedures like factor analysis and regression analysis (McDuffie,
1995; Huselid, 1995; Delaney & Huselid, 1996; Katuo, 2012; Guthrie, 2001; Zheng et al. 2006).
This study, adopted the use of descriptive statistics; correlation and regression analysis as
performed in SEM. Competing regression analysis was performed separately in order to test
mediation.
3.7.2 Exploratory Factor Analysis
Exploratory factor Analysis (EFA) determines if each scale contributes to internally consistent
description of the measuring model (Pallant, 2013). It is further used for reducing the number of
related variables to a manageable size before using them for further analysis like multiple
regressions (Pallant, 2013). It is used for exploring the relationships between a set of interrelated
variables that can be represented in terms of a few underlying factors. Uncorrelated factors can
also be extracted which can further be used as inputs for regression analysis, because this
technique requires an independent variable to be uncorrelated to avoid the possibility of
multicollinearity occurrence (Bryman & Bell, 2016).
EFA was performed to investigate the uni-dimensionality of the scales and sub scales. Items
contributing to the lack of coherency were detected. The unidimensionality of each scale and sub

93 | P a g e
scale was confirmed and inadequate factor loadings were removed (Theron et al. 2004). SPSS
(version 24) was used to test unidimensionality. The study used Principal Axis Factoring analysis
as an extraction technique (Pallant, 2013) and the extracted solution was then subjected to
Oblimim rotation with Kaiser Normalisation. After determining the number of significant
factors; factor loadings on the rotated matrix were investigated. Poor items were identified and
subjected to elimination based on the EFA decision criteria. According to Tabachnick and Fidell,
(2001) a factor loading is considered acceptable if it is >0.30.
The purpose of this study is to investigate the reverse causality of organisational performance
and employee behaviour using the HRM and performance linkage model. It is not certain
whether there are correlations among the variables (independent variables) in the model. Factor
analysis is able to reduce these variables to few underlying factors, which can be used to explain
changes in the other variables (dependent variables), hence it was used in this study.
Factor analysis involves principal component analysis (PCA) and principal factor analysis (PFA)
as analytical techniques. According to Pallant (2011.182), “both attempt to produce a smaller
number of linear combinations of the original variables in a way that captures most of the
variability in the pattern of correlations”
In principal component analysis, original variables are transformed into a smaller set of linear
combinations with all of the variance in the variables being used. In the principal factor analysis,
factors are estimated using a mathematical model where only the shared variance is analysed
(Tabachnick & Fidell, 2007). Tabachnick and Fidell (2007) argue that PCA is a better option if
researchers want an empirical summary of the data set. On the other hand, PFA is suitable for a
theoretical solution that is not contaminated by unique and error variability. This study found
PCA as the suitable factor analysis because it is the most commonly used (Bro et al. 2014) and
adopted in previous research (Zheng et al. 2006; Eckardt, Skaggs’ & Youndt, 2014; Huselid,
1995). In the current study, factor analysis standard procedure of three steps was followed (Julie,
2006; Pallant, 2013).

94 | P a g e
3.7.2.1 Assessing the suitability of the data
Data suitability for factor analysis must consider two factors which are the sample size and the
strength of the relationships between variables (Pallant, 2013). Tabachnick and Fidell () suggest
that a sample size of 150 cases should be enough when factor solutions have high loadings, and
also results in strong and few distinctive factors. Nunnally (1978) in trying to justify the sample
size proposes a ratio of participants to items of 10:1 i.e. 10 cases for each item to be factor
analysed. In this regard, factor analysis is suitable for this study because the data set of 308 for
employees’ cases is more than 150 (Tabachnick & Fidell, 2007; Pallant, 2013). The data set was
also well above the ratios recommended by Nunnally (1978). However; the sample size for
managers (77) was way below 150 or indeed meeting the ratio of 10:1 as such no factor analysis
was conducted on managers
With regard to the intercorrelations among the items; Tabachnick and Fidell (2007) argue that
factor analysis tends to be appropriate if most of the coefficients in the correlation matrix are
greater than 0.3. Two other statistical measures are used to evaluate the factorability of data
(Pallant, 2013). These are Kaiser-Meyer-Olkin (KMO) which is a measure of sampling adequacy
(Kaiser, 1970) and Bartlett’s test of sphericity (Bartlett, 1954). Where KMO is greater than 0.6
and the Bartlett’s test of sphericity is significant at P>.05 the factor analysis is suitable
(Tabachnick & Fidell, 2007).
3.7.2.2 The number of factors to retain
The number of underlying factors to retain is very crucial in factor analysis. The criteria for
determining the factors to retain include (1) eigenvalues larger than 1, (2) Scree plot and (3)
statistical significance of the separate eigenvalues (Pallant, 2013; Field, 2009).
Kaiser’s criterion, also called eigenvalues rule (Kaiser, 1970) recommends retaining all factors
with eigenvalues of greater than 1. On this basis, only factors with eigenvalues of 1.0 and above
are retained for further investigation in this study. It is argued that eigenvalues represent the total
variance amount as explained by that factor (Field, 2009). Field further argues that eigenvalues
of greater than 1 stand for a substantial amount of variance. Malhotra et al. (1996) recommend
95 | P a g e
that extracted factors must account for at least 60% of the variance. This criterion guided this
study in retaining the number of factors for each construct.
The above approach of determining the number of factors to retain may not always represent a
meaningful factor (Field, 2009), hence use of Catell’s Scree test. Catell (1966) suggests that a
Scree plot be drawn for each eigenvalue against the number of factors it is associated with. The
point of inflexion of the curve determines the cut-off point for retaining factors because these
factors contribute the most towards explaining the variance of the data (Pallant, 2013). This
study applied Scree plot to determine the number of factors to retain as support to the decision
criteria of Kaiser (1970) of eigenvalues of greater than 1.
Horn’s parallel analysis is another method used in past research (Choi et al. 2001; Horn, 1995). It
involves comparison of the size of eigenvalues with those obtained from randomly generated
data set from the same sample size. According to Pallant (2013) eigenvalues that exceed the
randomly generated data set are retained. It is however regarded as the least reliable in
determining the number of factors to retain because it is forced by sample size. In this regard,
this method was not used in determining the factors to retain in the current study.
3.7.2.3 Factor rotation and interpretation
After determining the number of factors to retain; the next step is to try to interpret them. In
order to do this; the factors are rotated (Pallant, 2013). Rotation involves rotating the axis within
the multidimensional space as was the case with factor analysis. Rotation helps to reduce the
number of variables that have a high loading on a factor which in turn improves the
interpretability of the factor.
Two methods of orthogonal and oblique rotation were used (Pallant, 2013). The varimax rotation
commonly uses orthogonal rotation method which minimises the number of variables with a high
loading on each factor (Pallant, 2013) thereby create uncorrelated factors. To the contrary, the
Direct Oblimim is commonly used in oblique technique and results in correlated factors. If the
factors are to be used in subsequent regression analysis, this one is not recommended. Since the
current study used Structural Equation model where no separate regression analysis is done;

96 | P a g e
direct Oblimim rotation commonly used in oblique rotation was used because of its
nonsuitability for subsequent regression analysis.
3.7.3 Confirmatory Factor Analysis
It is a technique by which hypotheses or theories about the structure underlying a set of variables
are tested (Pallant, 2013). In this study; LISREL 8.80 (Jöreskog & Sörbom, 2006) was used to
perform separate confirmatory factor analyses (CFAs) on the inner and outer models. The results
of CFA are discussed per model in terms of important fit indices (see Chapter 4).
The index of Root Mean Square Error of Approximation (RMSEA) was observed as an initial
test of model fit and an acceptable model fit (RMESA, 0.08) was obtained (See Table 4.33).
If a poor model fit was obtained (RMSEA.0.08), modification indices of THETA-DELTA were
investigated to determine the possibility of increasing the model fit. Modification indices
addresses the question of whether fixed parameters when freed, would significantly improve the
parsimonious fit of the model. MI indicates the extent to which the chi-square fit statistic would
decrease when a currently fixed parameter is freed and the model is re-examined (Jöreskog &
Sörbom, 1993). Modification indices of >6.6349 at significance level of 0.01 shows parameters
that, when set free, the model fit would significantly improve (p < 0.01) (Diamantopoulos &
Siguaw, 2000; Jöreskog & Sörbom, 1993).
In the current study, acceptable initial fit was found (RMSEA, 0.08). Consequently, each item
was evaluated in terms of its completely standardised factor loadings (LAMBDA-X). Significant
item loading should have a value of >0.50 (Diamantopoulos & Siguaw, 2000), however this
study, factor loadings of >0.60 were regarded as acceptable as the basis for indicating that the
item successfully contributed to the coherency of the scale
3.7.4 The Structural Equation Model
Structural equation Model is a family of a statistical model which explains the relationship
among variables (Hair et al. 2010). It is composed of two distinct statistical methods called path
analysis and measurement model (Kaplan, 2008). Structural Equation Modelling (SEM) was
used in this study. It is also referred to as covariance structure analysis or covariance of structure

97 | P a g e
modelling (Kline, 2011). It is a confirmatory technique performed by means of a computer
program, called LISREL 8.80 Kelloway (1998).
Path analysis tests complex relationships between different variables while measurement model
focuses on factor analysis, which is mainly concerned with defining the structural loadings of
different observed variables on latent variables (Hair et al., 2010; Salkind, 2010). However, both
methods fail to account for latent variables in the analysis and therefore increase the chances of
having measurement error. It is for this reason that SEM is recommended as it combines both
path and factor analysis to deal with measurement error. This helps to obtain improved parameter
estimates both in terms of bias and sampling variability (Kaplan, 2008).
SEM comprises five stages:
1. Model specification
2. Identification
3. Estimation
4. Testing fit
5. Re-specification
Completely standardised solutions or standardised residuals can be used for model modification.
This study used the standardised solution because it helped to covariate the observed variables
against its corresponding latent variables unlike with residuals where observed variables are
linked with other latent variables as such they cannot covariate but they have to be deleted.
Deleting would not help to improve the model.
3.7.4.1 Justification for using SEM
Structural Equation Models can also use LISREL programm. SEM was chosen to be used in the
current study because:
SEM is very flexible. It does not only deal with single simple or multiple linear
regressions; but with a system of regression equations. (Nachtigall et al. 2003).
SEM includes a technique of path diagrams and calculation of direct, indirect and
total effects from the methodology of path analysis. It further deals with latent

98 | P a g e
variables i.e. non-observable quantities or observed variables. Latent and observed
variables are connected in a measurement model (Edward & Bagozzi, 2000)
SEM is able to compare the model the empirical data leading to fit-statistics.
Regression coefficients are not predetermined by the user but estimated and tested
with SEM programme.
SEM allows for conducting and combining a vast variety of statistical procedures
like multiple regression, factor analysis, (M)ANOVA, and many more others.
3.7.5 The Measurement Model (Outer Model)
To test the research hypothesis a measurement was developed including 5 latent variables and 12
observed variables. A measurement can only be established when the variables have been
defined and the relationship between the latent and observed variables specified (Hair et al.
2010). Several steps were followed to establish the measurement as identified by Hair et al.
(2010:969) in Figure 3.1
Step 1:
Step 2:
Step 3:
Step 4:
NO YES
Define the individual constructs: Items to be
used as measured variables
Develop & specify the measurement model:
Draw a path diagram
Designing a study to produce empirical results
by assessing sample size and selection
vestimation methiods
Assessing measurement model validity by
assessing GOF and construct validity
Proceed to
structural
model
Refine
measures and
design new
study
Measurem
ent model
Valid?valid
?

99 | P a g e
Figure 3. 1:Four Stage process for developing a Measurement Model
3.7.6 The Structural Model (Inner Model)
According to Jöreskog and Sörbom, (1996, p.1) a structural model “specifies the causal
relationships among the latent variables, describes the causal effects and assigns the explained
and unexplained variance”. It has a set of linear structural equations.
According to Hair et al. (2010), structural models differ from measurement models because
emphasis moves from looking at the relationship between latent and observed variables to
looking at the nature and magnitude of relationships between constructs. The exogenous and
endogenous constructs to be included in the path analysis were carefully determined. This helped
in building the structural model (Hair et al. 2010) and largely depended on the theoretical and
hypothesised relationships. The study used the recursive type of structural model because of its
use of cross-sectional design which has a unidirectional effect (Kline, 2011).
Two options are available when designing the structural model. These are to treat factor loadings
and error variances of the measurement model as fixed parameters thereby not allowing them to
be freely estimated again when conducting the structural modelling part of SEM (Kline, 2011;
Aladwan, 2012; O’Rourke et al. 2013). The justification for this is that the factor loadings
estimated in the measurement model validation phase are already known at this stage and should
not be subjected to further validation in the structural model (Kline, 2011, Ramudu, 2013). This
permits easier estimations of the structural model. The second option is to freely estimate the
factor loadings and error covariance of the measurement model again in the structural model
(Kline, 2011; Aladwan 2012). It is argued that freely estimating the model again may reveal
changes in model fit between measurement and structural models due to the measurement model
errors (Hair et al. 2010).
This study employed the second option as the more appropriate because it allowed the researcher
to compare and assess the closeness of fit of the structural model against the measurement
model. The structural model was therefore assessed and validated in terms of model fit,
magnitude of variance explained (R2) and the direction and significance of the different
structural paths.
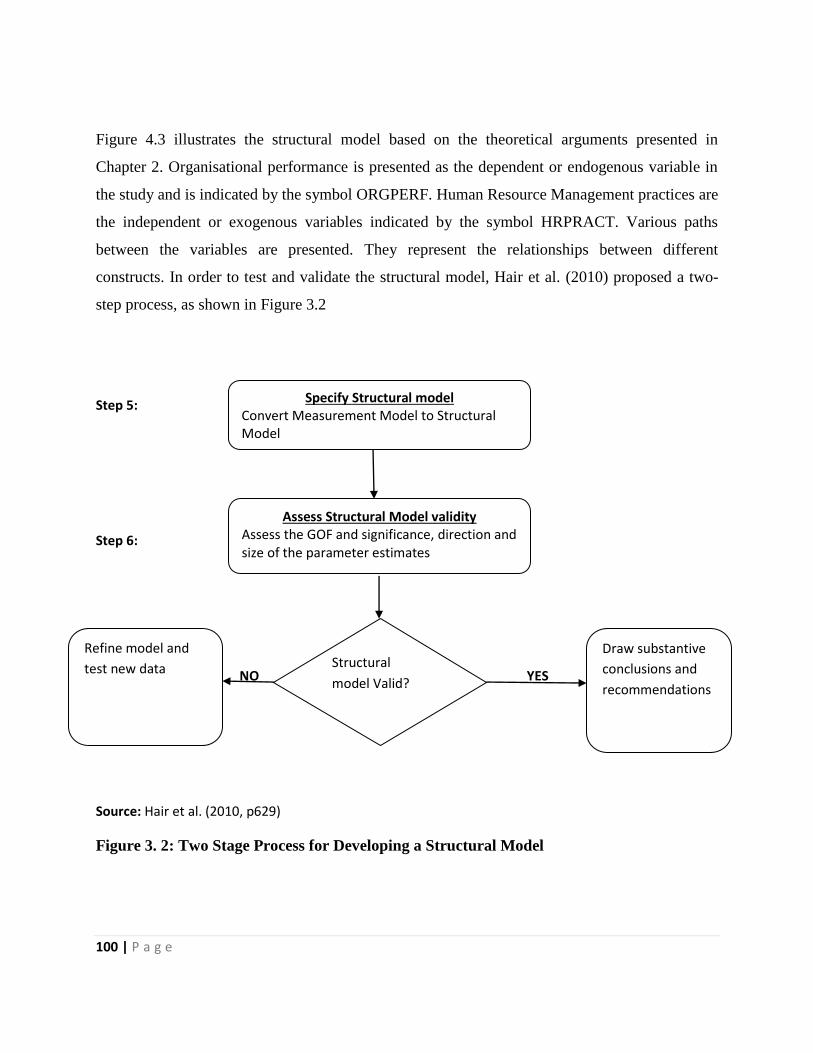
100 | P a g e
Figure 4.3 illustrates the structural model based on the theoretical arguments presented in
Chapter 2. Organisational performance is presented as the dependent or endogenous variable in
the study and is indicated by the symbol ORGPERF. Human Resource Management practices are
the independent or exogenous variables indicated by the symbol HRPRACT. Various paths
between the variables are presented. They represent the relationships between different
constructs. In order to test and validate the structural model, Hair et al. (2010) proposed a two-
step process, as shown in Figure 3.2
Step 5:
Step 6:
NO YES
Source: Hair et al. (2010, p629)
Figure 3. 2: Two Stage Process for Developing a Structural Model
Specify Structural model Convert Measurement Model to Structural Model
Assess Structural Model validity Assess the GOF and significance, direction and size of the parameter estimates
Structural
model Valid?
Draw substantive
conclusions and
recommendations
Refine model and
test new data
101 | P a g e
3.7.7 The Research Hypotheses
In order to address the research questions for this study, 7 hypotheses were formulated to
examine the relationships between HRM practices, employee attitudes, employee behaviour and
organisational performance. The aim of this study coupled with findings of previous studies;
believe that the proposed relationships between the constructs in the model do exist. The
hypotheses and their associated research questions are listed below:
Hypothesis 1
There is positive relationship between business strategy and human resource management
practices
Research Question
What is the relationship between business strategy and human resource management practices?
Hypothesis 2
There is a positive relationship between human resource practices and employee attitudes
Research Question
What is the relationship between human resource management practices and employee attitudes?
Hypothesis 3
There is a negative relationship between employee attitudes and employee behaviours
Research Question
What is the relationship between employee attitudes and employee behaviour?
Hypothesis 4
There is a negative relationship between employee behaviours and organisational performance.
Research Question
What is the relationship between employee behaviour and organisational performance?
102 | P a g e
Hypothesis 5
There is a positive relationship between human resource practices and organisational
performance
Research Question
What is the relationship between human resource practices and organisation performance
without the mediating effect of employee attitudes and employee behaviour?
Hypothesis 6
There is a negative relationship between organisational performance and employee behaviour
Research Question
Does organisational performance motivate employee behaviour in the Malawi agricultural
manufacturing sector?
Is the relationship stronger in the forward causality or reverse causality?
Hypothesis 7
7-a. Controls (firm age, size & union intensity) influence HRM practices.
7-b. Controls (firm age, size & union intensity) influence organisational performance.
3.8. ASSESSING MODEL FIT
Structural Equation Modelling is often used to assess model fit. A wide range of goodness-of-fit
statistics has been developed to assess a model’s overall fit. Goodness-of-fit indices are means
for assessing absolute and comparative fit (Kelloway, 1998). Goodness-of-fit analyses were
conducted for both the measurement and structural models.
3.8.1 Absolute Fit
Absolute fit indices assess how well a model reproduces the sample data (Kline.2011). It is
concerned with model-to-data matrix correspondence. Chi-square statistic is the first measure of
absolute fit. It measures overall fit and provides a test of perfect fit. When a Chi-square is
statistically significant; the model is rejected (Diamantopoulos & Siguaw, 2000).
3.8.2 Comparative Fit

103 | P a g e
Comparative fit presents the relative improvement in model fit as compared to the statistical base
model. Comparative fit measures are the Normed-fit Index (NFI), the Non-Normed Fit Index
(NNFI), the Incremental Fit Index (IFI), the Comparative Fit Index (CFI), the Relative Fit Index
(RFI) and the Adjusted Goodness-of-fit Index (AGFI). All of these fit indices have a range of 0
to 1. Values closer to one, especially values > 0.90, represent good fit (Kelloway, 1998).
Table 3. 8: Criteria of goodness-of-fit indices
Absolute fit measures Minimum fit function Chi-Square A non-significant result indicates model fit.
χ2/df Values between 2 and 5 indicate good fit.
Root Mean Square Error of
Approx (RMSEA)
Values of 0.08 or below indicates acceptable fit, those
below 0.05 indicate good fit, and values below 0.01
indicate outstanding fit.
P-Value for Test of Close Fit
(RMSEA <0.05)
Values > 0.05 indicate good fit.
90% Confidence Interval for
RMSEA
This is a 90% confidence interval of RMSEA testing the
closeness of fit, i.e., testing the hypothesis H0: RMSEA
< 0.05).
Root Mean Square Residual
(RMR)
Lower values indicate better fit with values below 0.08
indicative of good fit.
Standardised RMR Lower values indicate better fit, with values less than
0.05 indicating good fit.
Goodness of Fit Index (GFI) Values closer to 1 and > 0.90 represent good fit.
Incremental fit measures
Normed Fit Index (NFI) Values closer to 1 indicate better fit, with values > 0.09
indicative of good fit.
Non-Normed Fit Index (NNFI) Higher values indicate better fit, with values > 0.90
being indicative of good fit.
Adjusted Goodness of Fit (AGFI) Values closer to 1 indicate better fit, with values > 0.90
being indicative of good fit.
Comparative Fit Index (CFI) Values closer to 1 indicate better fit, with values > 0.90
being indicative of good fit.
Incremental Fit Index (IFI) Values closer to 1 indicate better fit, with values > 0.90
being indicative of good fit.
Relative Fit Index (RFI) Values closer to 1 indicate better fit, with values > 0.09
being indicative of good fit.
(Diamantopoulos & Siguaw, 2000; Kelloway, 1998)

104 | P a g e
3.8.3. Hierarchical Multiple Regression
Hierarchical multiple regression was used to test the ability of organizational age, size and union
intensity to predict Human Resource Management Practices on one hand and organisational
performance on the other. Hierarchical multiple regression was preferred because of its ability to
assess one independent variable or a block of independent variables added to the prediction of
the independent variable while controlling for the previous variables.
Before conducting a hierarchical multiple regressions, statistical analysis assumptions were
tested. A sample size of 308 was deemed sufficient given three independent variables that were
to be included in the analysis (Tabachnick & Fidell, 2001). Also, the assumption of singularity
was met since the independent variables were not a combination of other independent variables.
A two-stage hierarchical multiple regression was conducted where organisational age and size
were entered at stage one of the regression to control for union intensity. Union intensity was
entered at stage two. The relationship variables were entered in this order because it appears
chronologically appropriate that unionism would only be considered after organisational age and
size are considerably higher.
3.8.4 Reliability
The measurement model was assessed for reliability and validity (Henseler et al. 2009). The first
criterion was to check internal consistency reliability using the traditional criterion of Cronbach’s
Alpha (Cronbach, 1951). Cronbach’s Alpha provides an estimate of reliability based on the
indicator inter-correlations and assumes that all indicators are equally reliable. Since Cronbach’s
Alpha tends to provide a severe underestimation of the internal consistency reliability of latent
variables; a different measure of composite reliability was used (Moonen-Van Loon et al.2013;
Lareau, 2017). An internal reliability value of above 0.70 and values between 0.80 and 0.90 are
considered satisfactory in the early stages of research and in more advanced research stages
respectively (Nunnally & Bernstein, 1994).
3.8.5 Validity
Convergent validity shows whether a set of indicators represent the same underlying construct.
This representation is demonstrated by test for unidimensionality. Average variance extracted
(AVE) is used as a criterion for convergent validity (Fornell & Larcker, 1981). AVE values of

105 | P a g e
0.50 represent sufficient convergent validity. This means that the construct explains more than
half of the variance of its indicators on average (Götz, Liehr-Gobbers & Krafft, 2009).
3.9 RESERACH ETHICS
Consent to conduct the survey was obtained from the firms to be surveyed. The consent letters
were submitted along with the application for ethics (non medical) clearance. Ethics is important
in conducting research. This study abode by the guidelines set by the University of
Witwatersrand Ethics Committee in conducting research. This research obtained ethics clearance
approval (approved research protocol) from the Wits Non-Medical Ethics Committee (Appendix
3.3). The approved copy of the managers and employees survey questionnaires are included
(Appendix 1.1 and 1.2) Based on ethics guidelines, participation was voluntary with guaranteed
informed consent, anonymity and confidentiality (De Vaus, 2002).
During data collection, respondents were told that their participation was entirely voluntary
despite the researcher being granted consent by management of each organisation surveyed. The
respondents were assured that the study would not collect identifying information about them
e.g. their names, address, email address or phone numbers. Similarly, the research would not link
individual responses with participants’ identities. Furthermore, their identity and that of the
organisation was treated with utmost confidentiality. The respondents were assured that every
effort would be made to ensure that the data they provide cannot be traced back to them in the
report, presentations and other forms of dissemination.
The study was approved by the University of the Witwatersrand non-Medical Ethics committee
(Protocol Number:H15/09.25) to be conducted in agricultural manufacturing firms in Malawi
during the period 18th
September 2015 to 1st November, 2018. (See appendix 3.1).
3.10 CHAPTER SUMMARY
The chapter has stated the hypotheses for the study and the research methodology to test the
hypotheses. It has also provided an overview of the research design, sampling technique and the
resultant measuring instruments and statistical analyses that were employed. The next is chapter
four which presents results of the statistical analyses.

106 | P a g e
CHAPTER FOUR
PRESENTATION OF RESULTS
4.0 INTRODUCTION
Results from factor analysis of business strategy, HRM practices, employee attitudes, employee
behaviour and organisational performance are presented. Reliability and item analysis of each
construct is presented. Furthermore, dimensionality, bivariate, regression, correlation analyses,
measurements of structural models and relationship between latent variables is presented.
4.1 MISSING VALUES
Missing data is when valid values on one or more variables are not available for analysis (Hair et
al. 2010). A number of missing data identification and remedying steps as suggested by Hair et
al. (2010) and explained in Chapter three section 3.4.2 have been applied.
4.2 COMPARATIVE ANALYSIS OF RESPONDENTS PERCEPTIONS
This section presents managers and employees perceived responses on the variables investigated
in the study.
4.2.1 Business Strategy
Figures 4.1 and 4.2 show how managers and employees responded to the questions pertaining to
Business Strategy respectively. The scale has eight items. The managers found business strategy
to be extremely important (77%) as a driver of organisational performance. In particular, both
managers and employees felt having a wide variety of products (innovation strategy) as the most
extremely important strategy (76% and 59% respectively). This was followed by the quality
enhancement strategy (75% and 58% respectively). Improving existing products (innovation
strategy) was also rated highly (72%). From the three generic strategies; this study revealed that
managers feel innovation strategy was extremely important followed by quality strategy.
However, they do not find cost leadership strategy that important (55%).

107 | P a g e
Figure 4 1: Business Strategy (Managers)
Figure 4 2: Business Strategy (Employees)

108 | P a g e
4.2.2 Recruitment and selection.
Figures 4.3 and 4.4 provide information on the views by managers and employees towards the
recruitment and selection process employed by the organization.
The managers considered all aspects of recruitment and selection as very important, but only
placement of the right person on the right job as extremely important (55%). About 62% of the
managers consider the recruitment process to be very important. Recruitment process was
seconded by filling posts with qualified individuals from the same organization which was
reported as very important (61%) by managers. Employees strongly agreed (55%) that the
selection process indeed selects those that have the required knowledge and skills in the
organization. A significant proportion of the employees (53%) also strongly agreed that there
was formal induction, orientation and familiarization process designed to help the new recruits
understand the organization. Lastly, 59% of the employees strongly concurred that applicants
undergo structured interviews before being hired.
In summary, the results indicated that managers considered recruitment and selection as a very
important component, while employees viewed this as an extremely important component. This
shows that employees highly consider the recruitment and selection procedures than the
managers.

109 | P a g e
Figure 4 3: Recruitment & Selection (Managers)
Figure 4 4: Recruitment & Selection (Employees)

110 | P a g e
4.2.3 Training and development.
Figures 4.5 and 4.6 provide an analysis of the perceptions of managers and employees on the
effectiveness of training and development in the organization. Managers felt that both training
and development programs for employees are equally extremely important (58%). Managers felt
that identification of training needs amongst employees in the organization was also extremely
important and effective (57%). However, managers indicated that the employee’s competences
are not quite extremely important.
A large proportion of employees strongly agreed (45%) that the training needs that are identified
are realistic and based on the organization’s business strategy (ETD4) as well as that the
trainings (45%) improved the employees’ decision-making skills (ETD5). It was also noted that
45% of employees strongly agreed that the organization provides training opportunities for
learning and growth. About 49 % percent of the employees also agreed that the organization
conducts extensive training for its employees. To sum up, Managers considered training and
development as extremely important to the institution as all variables under Training and
development were rated as extremely important and above half apart from employees’
competences. As for the employees, they seemed to be satisfied with aspects of training and
development in the institution.

111 | P a g e
Figure 4 5: Training & Development (Managers)
Figure 4 6: Training & Development (Employees)

112 | P a g e
4.2.4 Performance Appraisal.
Figures 4.7 and 4.8 provide results of the managers’ and employees’ opinions on the use of
certain performance appraisal tools.
Managers felt that all performance appraisal tools and aspects are extremely important except for
the use of performance appraisals (PA1) which was deemed very important (48 %). About 57%
of the managers felt that upfront communication about the objectives of performance appraisal
(PA4) was the most extremely important factor. However, only 42% of the employees strongly
agreed that they clearly understood the objectives of performance appraisals. This means that
despite managers’ upfront communication about the objectives of performance appraisal; less
than half of the employees still don’t understand the objectives of appraisals. Managers rated use
of performance data in decision making (PA3) at 51% and 41% by employees. Use of written
performance appraisals was not extremely important to the managers (31%). Nonetheless, 47 %
of the employees strongly agreed that there was a formal and written performance appraisal
system.
Employees (46%) indicated that they receive feedback of their performance appraisal results.
Employees (45%) also indicated that performance was based on objective quantifiable results
and that the performance appraisal had a strong influence ((44%) on individual and team
behaviour. Despite the employees not strongly agreeing that the performance appraisals were fair
and unbiased, about 51% agreed that the appraisals were fair and unbiased. It can be concluded
that both managers and employees considered performance appraisals as extremely important.
However, less than half of the employees did not strongly agree with all the variables of
performance appraisal in the organization.
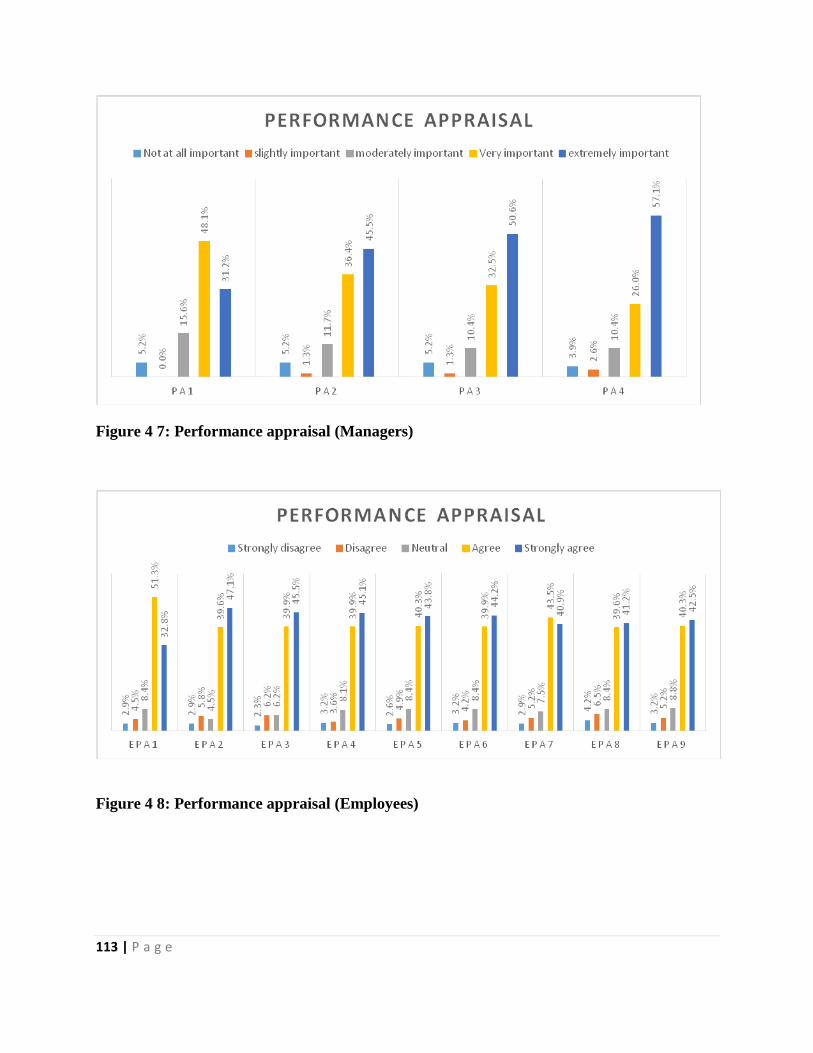
113 | P a g e
Figure 4 7: Performance appraisal (Managers)
Figure 4 8: Performance appraisal (Employees)

114 | P a g e
4.2.5 Compensation.
Figure 4.9 provides results on the how managers use and value compensation. Figure 4.10 shows
how employees felt about the rewards and compensation provided by the employers. From the
managers’ point of view, results showed that over half of the managers rated all the 5 aspects of
compensation as extremely important. This is evidenced by all scores being over 50%. This
means that managers in the agricultural manufacturing firms in Malawi consider compensation
as important tool in the management of their human resources and organisational performance
(Danlami et al. 2011).
Managers indicated that matching pay with performance system (COM3) was the most
extremely important (69%). This was in line with the employees who strongly agreed (51%) that
rewards are linked to performance (ECOM 7) and that compensation was based on employee
competence and ability (51%), ECOM8). Use of industry wide benefits (66%) in the
organization (COM4) was another important compensation factor. Use of incentives (COM 2)
and regular pay revision (COM 5) were also rated highly (62 %). The use of rewards (COM1)
was the least extremely important (51%) to the managers.
50% of the employees strongly agreed that the organization makes all payment due to the
employees in time (ECOM 3). Employees also expressed satisfaction (50%) with the rewards
that they receive from the organization (ECOM 4) despite rewards being the least extremely
important to the managers. A significant proportion (49%) of the employees indicated that they
were satisfied with the incentives that the institution provides (ECOM 6). Though 54 % agreed
that they were adequately paid, the employees however did not strongly agree (27%) that the
employees were paid adequately (ECOM 1) at 27 % indicating a feeling of underpayment. This
shows how important pay and incentives are as motivators for employees as compared to
managers.

115 | P a g e
Figure 4 9: Compensation (Managers)
Figure 4 10: Compensation (Employees)
4.2.6 Employees Attitude.
Figures 4.11 and 4.12 give a summary of results on how managers and employees felt about the
employees’ attitudes. About 47 % of the managers reported that the employee’s commitment
(EA2) has been very good over the years and it was considered extremely important. Similarly,
the employees equally strongly agreed that the employees were proud to work for their
organizations (EAS4) and felt a strong sense of loyalty (51%) to their organizations (EEA5)
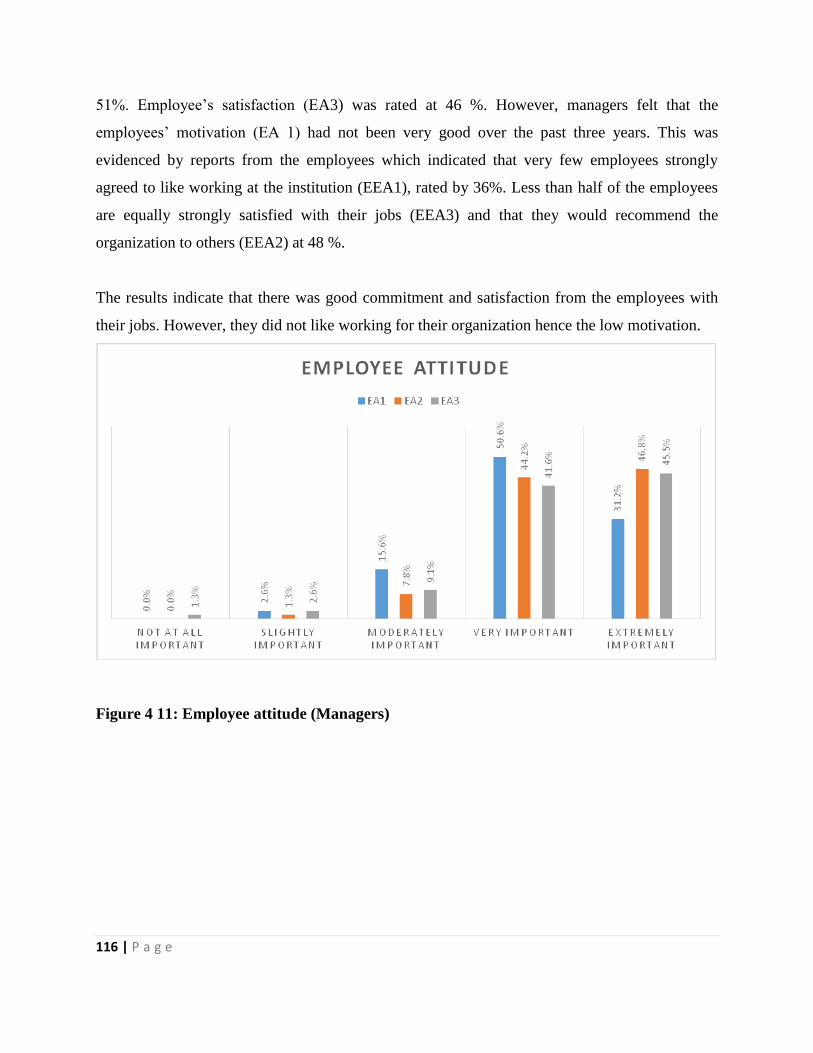
116 | P a g e
51%. Employee’s satisfaction (EA3) was rated at 46 %. However, managers felt that the
employees’ motivation (EA 1) had not been very good over the past three years. This was
evidenced by reports from the employees which indicated that very few employees strongly
agreed to like working at the institution (EEA1), rated by 36%. Less than half of the employees
are equally strongly satisfied with their jobs (EEA3) and that they would recommend the
organization to others (EEA2) at 48 %.
The results indicate that there was good commitment and satisfaction from the employees with
their jobs. However, they did not like working for their organization hence the low motivation.
Figure 4 11: Employee attitude (Managers)
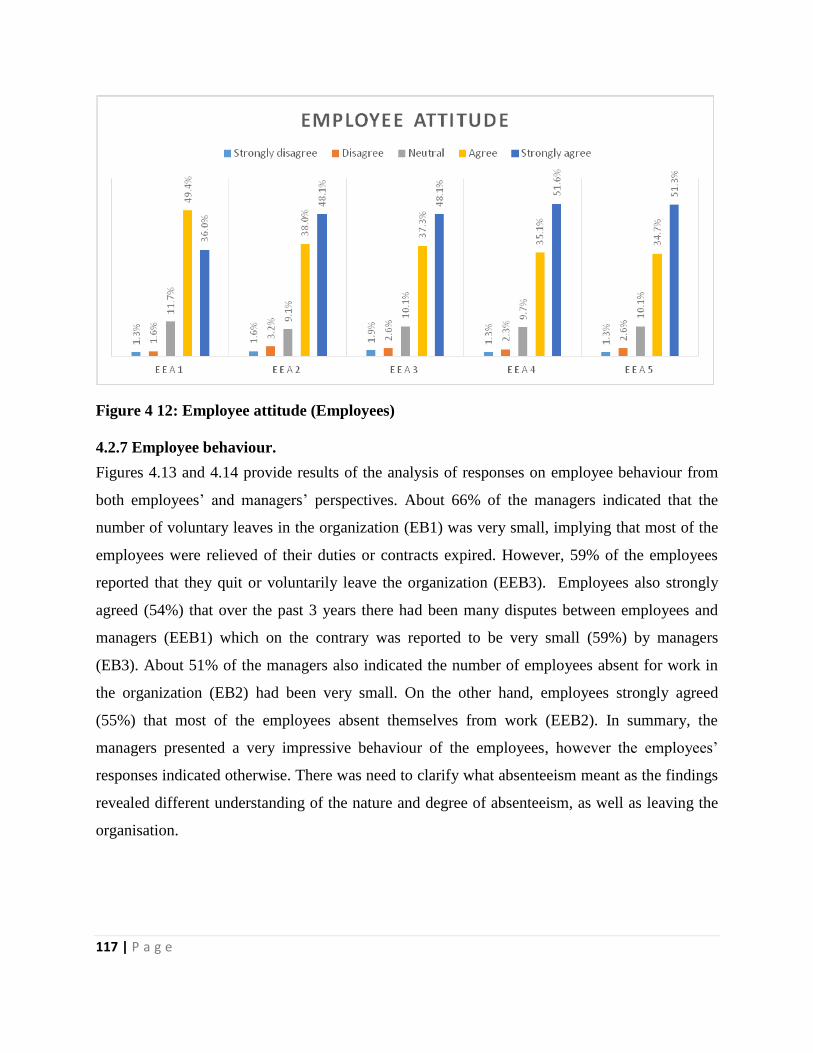
117 | P a g e
Figure 4 12: Employee attitude (Employees)
4.2.7 Employee behaviour.
Figures 4.13 and 4.14 provide results of the analysis of responses on employee behaviour from
both employees’ and managers’ perspectives. About 66% of the managers indicated that the
number of voluntary leaves in the organization (EB1) was very small, implying that most of the
employees were relieved of their duties or contracts expired. However, 59% of the employees
reported that they quit or voluntarily leave the organization (EEB3). Employees also strongly
agreed (54%) that over the past 3 years there had been many disputes between employees and
managers (EEB1) which on the contrary was reported to be very small (59%) by managers
(EB3). About 51% of the managers also indicated the number of employees absent for work in
the organization (EB2) had been very small. On the other hand, employees strongly agreed
(55%) that most of the employees absent themselves from work (EEB2). In summary, the
managers presented a very impressive behaviour of the employees, however the employees’
responses indicated otherwise. There was need to clarify what absenteeism meant as the findings
revealed different understanding of the nature and degree of absenteeism, as well as leaving the
organisation.

118 | P a g e
Figure 4 13: Employee Behaviour (Managers)
Figure 4 14: Employee Behaviour (Employees)
4.3.8 Organizational performance.
Figures 4.15 and 4.16 provide results of managers and employees perceptions on organizational
performance respectively. About 66% of the managers and 63% of the employees rated the
overall reduction of cost of production (OP5) of the organization as extremely important.
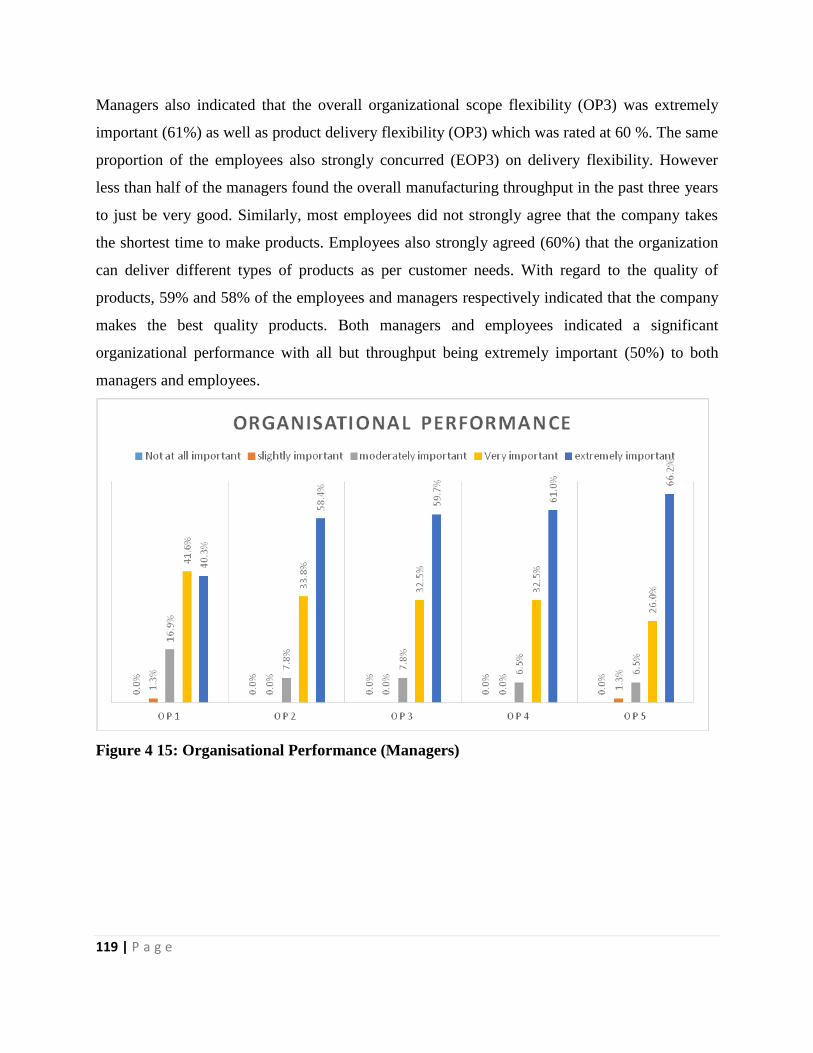
119 | P a g e
Managers also indicated that the overall organizational scope flexibility (OP3) was extremely
important (61%) as well as product delivery flexibility (OP3) which was rated at 60 %. The same
proportion of the employees also strongly concurred (EOP3) on delivery flexibility. However
less than half of the managers found the overall manufacturing throughput in the past three years
to just be very good. Similarly, most employees did not strongly agree that the company takes
the shortest time to make products. Employees also strongly agreed (60%) that the organization
can deliver different types of products as per customer needs. With regard to the quality of
products, 59% and 58% of the employees and managers respectively indicated that the company
makes the best quality products. Both managers and employees indicated a significant
organizational performance with all but throughput being extremely important (50%) to both
managers and employees.
Figure 4 15: Organisational Performance (Managers)

120 | P a g e
Figure 4 16 : Organisational Performance (Employees)
4.3 ITEM ANALYSIS
All the measurement scales were subjected to item analysis in order to ensure internal
consistency. It was also used to identify items that did not contribute to the internal description
of the latent variables. SPSS (Version 24) was used to perform item analysis.
From the item analysis; reliabilities of each scale were established. Cronbach’s alpha as an
indicator of the reliability of the scale should be >0.70 in order to be a reliable item (Kerlinger &
Lee, 2000; Nunnally & Marlowe, 1997; Pallant, 2013). In the current study, a Cronbach’s alpha
loading of >0.70 was regarded as acceptable and used for further analysis as this was deemed
good or acceptable (Hair et al. 1998; Tabachnick & Fidell, 2007). Reliability values of <0.70
therefore qualified for elimination. Only reliabilities for employees were subjected to further
analysis because of the low Managers sample size.
The corrected Item-Total Correlation was another important consideration as it indicates the
degree to which each item correlates with the total score. Values < 0.20 may indicate that the
item is not measuring the specific scale (Nunnally, 1978). The removal of such items was
considered as they may lead to a higher Cronbach’s alpha.
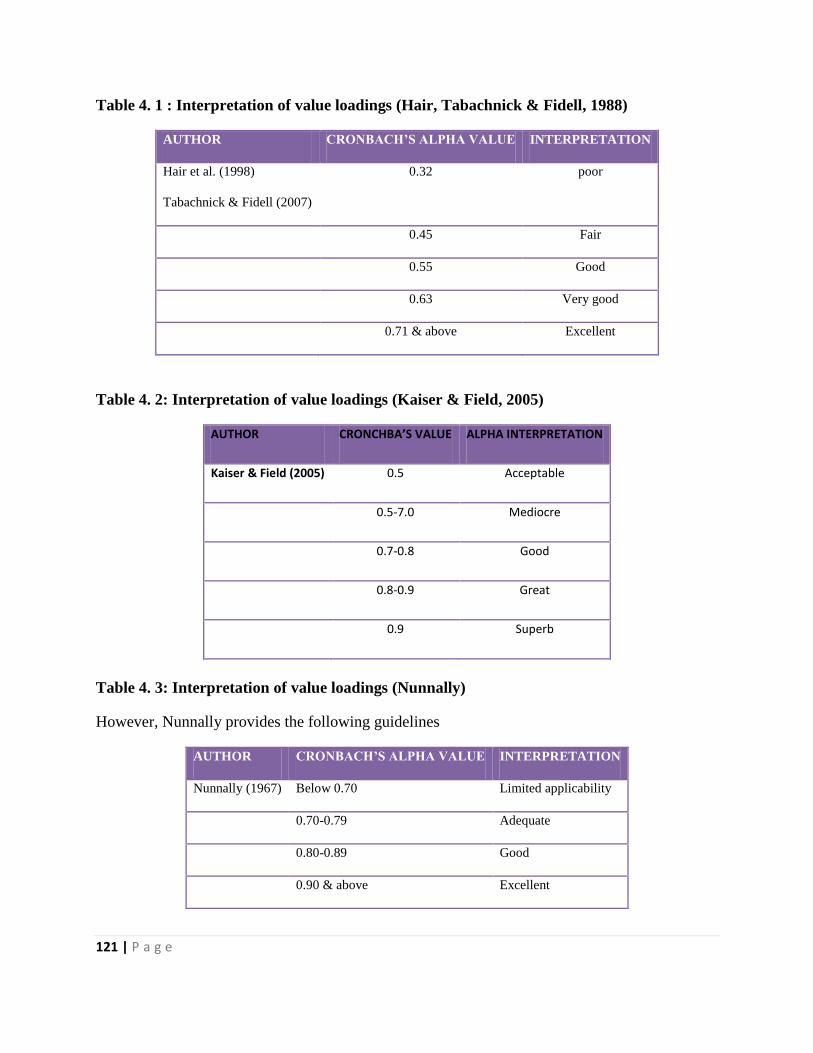
121 | P a g e
Table 4. 1 : Interpretation of value loadings (Hair, Tabachnick & Fidell, 1988)
AUTHOR CRONBACH’S ALPHA VALUE INTERPRETATION
Hair et al. (1998)
Tabachnick & Fidell (2007)
0.32 poor
0.45 Fair
0.55 Good
0.63 Very good
0.71 & above Excellent
Table 4. 2: Interpretation of value loadings (Kaiser & Field, 2005)
AUTHOR CRONCHBA’S VALUE ALPHA INTERPRETATION
Kaiser & Field (2005) 0.5 Acceptable
0.5-7.0 Mediocre
0.7-0.8 Good
0.8-0.9 Great
0.9 Superb
Table 4. 3: Interpretation of value loadings (Nunnally)
However, Nunnally provides the following guidelines
AUTHOR CRONBACH’S ALPHA VALUE INTERPRETATION
Nunnally (1967) Below 0.70 Limited applicability
0.70-0.79 Adequate
0.80-0.89 Good
0.90 & above Excellent
122 | P a g e
The study applied Hair et al. (1998) and Tabachnick and Fidell (2007) as they are more recent
than Nunnally (1967).
4.2.1 Reliability Results: Business Strategy
Appendix 4.2 and 4.3 show item analysis for business strategy scale (BS) for managers and
employees respectively. The scale has eight items and shows Cronbach’s alpha of 0.83 and 0.88
for managers and employees respectively. This shows that the scale has an excellent reliability.
All the eight items loaded between 0.79 - 0.83 for managers and 0.86-0.88 for Employees as
such no item was dropped for further analysis. This shows that the data collected was reliable
and results can be generalised with the target population.
4.2.2 Human Resource Management practices
This scale has four sub scales: recruitment and selection; training and development; performance
appraisal and compensation.
4.2.2.1 Reliability Results: Recruitment and selection
Appendix 4.4 and 4.5 present item analysis for recruitment and selection sub scale (RS). The
scale has 5 items for managers and 7 items for employees and shows Cronbach’s alpha of 0.93
and 0.88 for managers and employees respectively. This shows an excellent reliability as there
was no item with item total correlations below 0.7. Furthermore, all the five (0.816-0.871) and
seven (0.915-0.931) items loaded above 0.7. This was an excellent loading as described by Hair
et al. (1998) and Tabachnick and Fidell (2007). The researcher therefore retained all the seven
indicators of recruitment and selection for employees for further analysis. This shows that the
data collected was reliable and results can be generalised with the target population.
4.2.2.2 Reliability Results: Training and Development
Appendix 4.6 and 4.7 present item analysis results for training and development sub scale (TD)
for manager and employee respondents are presented. The scale has five items loading between
.816-. 871 and .910- .931 for managers and employees respectively with Cronbach’s alpha of .86
and .94 respectively. This shows excellent reliability as no item has a factor loading below .70
(Hair et al. 1998; Nunnally, 1976). This shows that the data collected was reliable and can be
generalised to the target population.
123 | P a g e
4.2.2.3 Reliability Results: Performance appraisal
Appendix 4.8 and 4.9 present item analysis results for performance appraisal sub scale (PA) for
manager and employee respondents. The scale has four items for Managers and nine items for
employees with a Cronbach’s alpha of .96 for both Managers and employees. This shows an
excellent reliability. All items loaded above 0.70 (.932-.953) and (.955-.960) for Managers and
employees respectively as such no item was dropped for further analysis. Furthermore, this
implies that the gathered data was reliable and can be generalised to the target population.
4.2.2.5 Reliability Results: Compensation
Appendix 4.10 and 4.11 present item analysis for compensation sub scale (COM). The scale has
five and eight items with a Cronbach’s alpha of 0.91 (.871-.907) and 0.94 (.929-.944) for
managers and employees respectively. The scales show excellent reliability (Nunnally, 1967) as
such no item was dropped for further analysis. This means also that the data collected was
reliable and its results can be generalised to the target population of the respondents.
4.2.3 Reliability Results: Employee attitude
Appendix 4.12 and 4.13 show Cronbach’s alpha value of 0.75 (.627-.738) and 0.91 (.870-.916)
for managers and employees respectively for item analysis associated with employee attitude
scale (EA). The scale consists of three items. The scales show excellent reliability except for
EA1 and EA2 which had <.70 loadings for managers. All five items loaded above 0.70 for
employees as such no item was dropped for further analysis. The Cronbach’s alpha values imply
that the data collected was reliable and its results can be generalised to the target population of
the respondents.
4.2.4 Reliability Results: Employee behaviour
Appendix 4.14 and 4.15 present items analysis associated with employee behaviour scale (EB).
The scale consists of three items with a Cronbach’s alpha of 0.81 (.631-.807) and 0.85 (.735-875)
for managers and employees respectively. This reflects an excellent reliability (Nunnally, 1976).

124 | P a g e
No item on the scale was deleted for further analysis. The alpha values show that the data which
was collected was reliable and can be generalised to the target population of the respondents.
4.2.4 Reliability Results: Organisational performance
Appendix 4.16 and 4.17 present items analysis for the organisational performance scale (OP).
The scale consists of five items with a Cronbach’s alpha of 0.85 and .78 for managers and
employees respectively. This shows an excellent reliability (Nunnally, 1967). All the five items
loaded above 0.7 except EOP 4 (.669) which was deleted for further analysis. The alpha value of
0.79 implies that the data that was collected was reliable and its results can be generalised to the
target population of the respondents.
4.2.5 Summary of the item analysis results
Table 4.4 provides a summary of the item analysis performed. All the scales had Cronbach’s
Alpha values exceeding the required 0.70 cut off with high item-total correlations. All items
were therefore internally consistent and reliable.
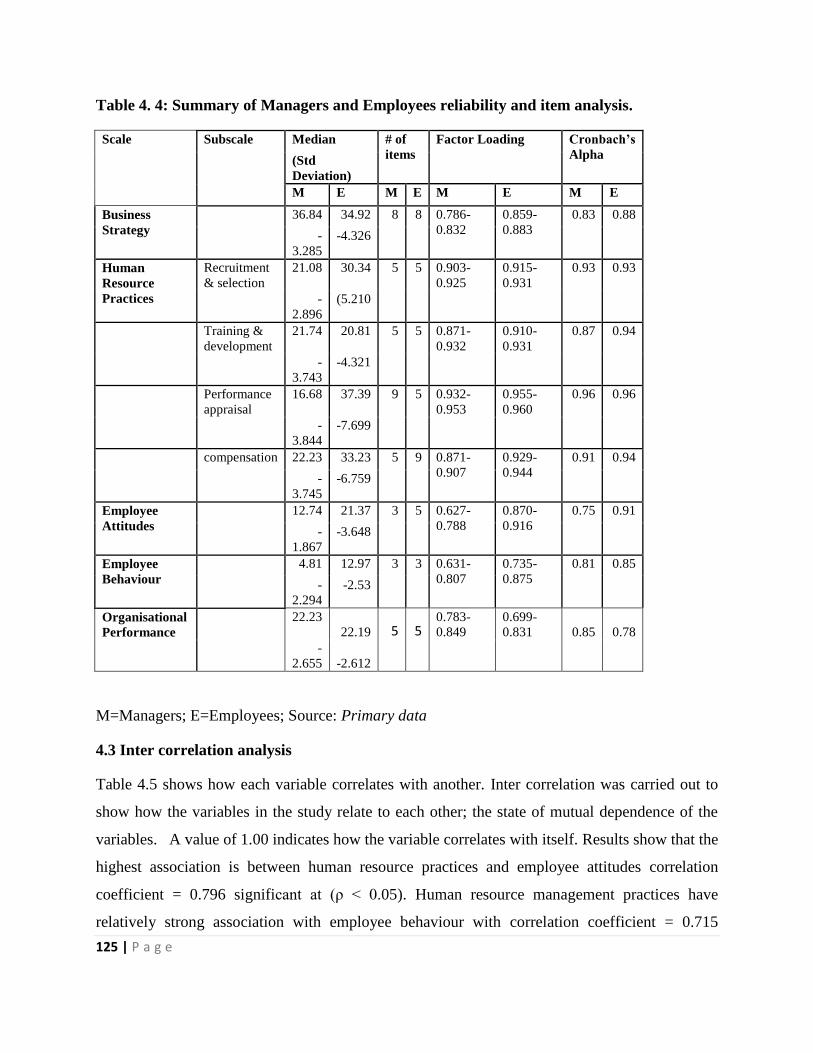
125 | P a g e
Table 4. 4: Summary of Managers and Employees reliability and item analysis.
Scale Subscale Median # of
items
Factor Loading Cronbach’s
Alpha (Std
Deviation)
M E M E M E M E
Business
Strategy
36.84 34.92 8 8 0.786-
0.832
0.859-
0.883
0.83 0.88
-
3.285
-4.326
Human
Resource
Practices
Recruitment
& selection
21.08 30.34 5 5 0.903-
0.925
0.915-
0.931
0.93 0.93
-
2.896
(5.210
Training &
development
21.74 20.81 5 5 0.871-
0.932
0.910-
0.931
0.87 0.94
-
3.743
-4.321
Performance
appraisal
16.68 37.39 9 5 0.932-
0.953
0.955-
0.960
0.96 0.96
-
3.844
-7.699
compensation 22.23 33.23 5 9 0.871-
0.907
0.929-
0.944
0.91 0.94
-
3.745
-6.759
Employee
Attitudes
12.74 21.37 3 5 0.627-
0.788
0.870-
0.916
0.75 0.91
-
1.867
-3.648
Employee
Behaviour
4.81 12.97 3 3 0.631-
0.807
0.735-
0.875
0.81 0.85
-
2.294
-2.53
Organisational
Performance 22.23
22.19 5 5 0.783-
0.849
0.699-
0.831 0.85 0.78
-
2.655 -2.612
M=Managers; E=Employees; Source: Primary data
4.3 Inter correlation analysis
Table 4.5 shows how each variable correlates with another. Inter correlation was carried out to
show how the variables in the study relate to each other; the state of mutual dependence of the
variables. A value of 1.00 indicates how the variable correlates with itself. Results show that the
highest association is between human resource practices and employee attitudes correlation
coefficient = 0.796 significant at (ρ < 0.05). Human resource management practices have
relatively strong association with employee behaviour with correlation coefficient = 0.715

126 | P a g e
significant at (ρ < 0.05). Furthermore; human resource management practices have relatively
strong association with business strategy with correlation coefficient =0.696 significant at (p<
0.05). There is also relatively strong association between employee attitudes and employee
behaviour correlation coefficient =0. 631; between employee attitudes and organisational
performance correlation coefficient =0.632 and between employee behaviour and organisational
performance correlation coefficient =0.622. There is moderate association between business
strategy and employee behaviour with correlation coefficient =0.536 significant at P<0.05) and
employee behaviour with correlation coefficient =0.54 significant at P< 0.05. The results indicate
that employee attitudes has the strongest association with business strategy with correlation
coefficient =0.525 significant at 0.05.
Table 4. 5: Correlation Matrix
BSTRAT EATTIT EBEHAV ORGPERF HRPRACT
BSTRAT 1.00
EATTIT 0.525 1.00
(0.052)*
10.053
EBEHAV 0.536 0.631 1.00
-0.061 (0.052)*
8.83 12.22
ORGPERF 0.637 0.632 0.622 1.00
-0.056 (0.047)* -0.058
11.34 13.433 10.786
HRPRACT 0.696 0.796 0.715 0.682 1.00
(0.047)* (0.031)* (0.055)* (0.042)*
14.791 25.37 13.022 16.157
Note: *0.05 degree of significance
4.4 DIMENSIONALITY ANALYSIS
4.4.1 Dimensionality
Unidimensionality can be tested in different ways (Tate, 2003). To establish unidimensionality,
one of the following two conditions from the results of an exploratory factor analysis must be
met (Reckase, 1999). Firstly, a factor analysis on the inter-item correlation matrix should

127 | P a g e
indicate that the first factor accounts for at least 20% of the variance of the unrotated factor
matrix. Secondly the eigenvalues of the first factor should very clearly exceed that of the second
factor. In Wiberg (2004) a high Cronbach’s alpha was also used as an indicator of
unidimensionality.
The factor analysis which was performed on the items using extraction method of principal
component analysis showed that the first factor had the initial eigenvalues (24.1) clearly
exceeding that of the second factor 3.8, (See Figure 4.17) as shown in the Scree plot for the 50
item Likert scale.
Figure 4 17: Scree Plot
Lord (1980) suggests that if the first eigenvalues is large enough compared to the second; and the
second eigenvalue is not much larger than any of the others; then the instrument may be
considered approximately uni-dimensional. The Cattell (Cattell, 1966) Spree plot for the 50 item
Likert scale (Figure 4.17) shows this pattern. The plot indicates that a single factor underlies the
data.

128 | P a g e
The steep slope shows the large factors associated with the loading greater than the eigenvalues
of 1. The gradual trailing off (Scree) shows the rest of the factors lower than eigenvalues of 1
(retain). There were ten factors whose eigenvalues was greater than 1 and one extracted
communality factor distinctly high than others, implying that the test was uni-dimensional in
nature. Furthermore; it can be concluded that the 50 items are one-dimensional
4.4.2 Exploratory Factor Analysis
In order to analyse the interrelationships of the items and suggest items for deletion (Hair et al.
2006); exploratory factor analysis (EFA) was conducted using principal axis factoring analysis
was used as an extraction technique. The extracted solution was then subjected to oblimin
rotation with Kaiser Normalisation.
Before undertaking EFA, measures of sampling adequacy were evaluated to determine if the
correlation matrix of the items constituting the scale was suitable for factor analysis. In this
study, a Kaiser-Meyer-Olkin (KMO), which is a measure of sampling adequacy, read 0.921
(>0.60) and significant (P<0.001). It is recommended to accept values greater than 0.5 as
acceptable; values between 0.5 and 0.7 as mediocre; and values between 0.7 and 0.8 as good,
while values between 0.8 and 0.9 are great and values above 0.9 are superb (Kaiser, as cited in
Field, 2005).
Eigenvalues were also investigated to determine which factors to retain for further analysis.
Kinnear and Gary (2004) argue that any factors with eigenvalues of less than 1 must be excluded
from the analysis. Factors were considered satisfactory if their loading was greater than 0.70.
When the value of the loading is higher, the more the factors explain the total variance of scores
on the concerned variable (Kinnear & Gray, 2004). Principal Axis Factoring analysis was used as
the extraction technique (Pallant, 2013). The extracted solution was then subjected to oblique
rotation.
After the number of significant factors had been determined, the factor loadings on the matrix
(See Figure 4.17) were studied. Poor items were identified and subjected to elimination

129 | P a g e
according to the EFA decision criteria (See Table 4.22). A factor loading was considered
acceptable if it loads > 0.70 (Kamarul, 2012).
The Scree plot can be used to determine the number of factors to be retained. The use of the
Scree plot involves inspecting the point at which the shape of the curve changes direction and
becomes horizontal (Pallant, 2013). It is argued that all factors above the elbow, or break, in the
plot should be retained, as these factors contribute the most to the explanation of the variance in
the data set (Catell, 1966).
Decision rules guiding the number of factors to be extracted were:
Factors whose eigenvalues are >1.00Factors (Kaiser, 1961).
Any Item loading >0.30 on any factor would be excluded (Field, 2005; Pallant, 2013;
Tabachnick & Fidell, 2001).
Any item not loading >0.30 on more than one factor would be excluded if the difference
between the higher and the lower loading was<0.25 (Nunnally & Bernstein, 1994;
Tabachnick & Fidell, 2001).
4.4.2.1 Business strategy scale
The business strategy scale achieved uni-dimensionality. A Kaiser-Meyer-Olkin (KMO) measure
of sampling adequacy of 0.827 (> 0.60) and a significant (p < 0.001) Bartlett’s test of sphericity
were achieved, indicating sufficient evidence that the correlation matrix was factor analysable
(Field, 2005). Only two factors (EBS1 and EBS2) with eigenvalues greater than 1 were obtained.
The Scree plot also suggested that two factors should be extracted. The factor matrix (see
Appendix 4.19) indicated that all the items loaded satisfactorily (> 0.50) on the two factors.
These factors accounted for 33.30% and 63.26% of the variance respectively.
4.4.2.2 Human Resource Practices Sub-Scale (Recruitment and Selection)
The recruitment and selection sub scale achieved uni-dimensionality. A Kaiser-Meyer-Olkin
(KMO) measure of sampling adequacy of 0.899 (> 0.60) and a significant (p < 0.001) Bartlett’s
test of sphericity were achieved, indicating sufficient evidence that the correlation matrix was
factor analysable (Field, 2005)
130 | P a g e
Only one factor (ERS1) with eigenvalues greater than 1 was obtained. The Scree plot also
suggested that a single factor should be extracted. The factor matrix (see Appendix 4.20)
indicated that all the items loaded satisfactorily (> 0.50) on one factor and this factor accounted
for 67.39% of the variance.
4.4.2.3 Human Resource Practices Sub-Scale (training and development)
The training and development sub scale achieved uni-dimensionality. A Kaiser-Meyer-Olkin
(KMO) measure of sampling adequacy of 0.856 (> 0.60) and a significant (p < 0.001) Bartlett’s
test of sphericity were achieved, indicating sufficient evidence that the correlation matrix was
factor analysable (Field, 2005)
Only one factor (ETD 1) with eigenvalues greater than 1 was obtained. The Scree plot also
suggested that a single factor should be extracted. The factor matrix (see Appendix 4.21)
indicated that all the items loaded satisfactorily (> 0.50) on one factor and this factor accounted
for 74.76% of the variance.
4.4.2.4 Human Resource Practices Sub-Scale (Performance Appraisal)
The performance appraisal sub scale achieved uni-dimensionality. A Kaiser-Meyer-Olkin
(KMO) measure of sampling adequacy of 0.911 (> 0.60) and a significant (p < 0.001) Bartlett’s
test of sphericity were achieved, indicating sufficient evidence that the correlation matrix was
factor analysable (Field, 2005)
Only one factor (EPA1) with eigenvalues greater than 1 was obtained. The Scree plot also
suggested that a single factor should be extracted. The factor matrix (see Appendix 4.22)
indicated that all the items loaded satisfactorily (> 0.50) on one factor and this factor accounted
for 83.57% of the variance.
4.4.2.5 Human Resource Practice sub-scale (compensation)
The compensation sub scale achieved uni-dimensionality. A Kaiser-Meyer-Olkin (KMO)
measure of sampling adequacy of 0.911 (> 0.60) and a significant (p < 0.001) Bartlett’s test of
sphericity were achieved, indicating sufficient evidence that the correlation matrix was factor
analysable (Field, 2005)
131 | P a g e
Only one factor (ECOM 1) with eigenvalues greater than 1 was obtained. The Scree plot also
suggested that a single factor should be extracted. The factor matrix (see Appendix 4.23)
indicated that all the items loaded satisfactorily (> 0.50) on one factor and this factor accounted
for 67.49% of the variance.
4.4.2.6 Employee Attitude scale
The employee attitude scale achieved uni-dimensionality. A Kaiser-Meyer-Olkin (KMO)
measure of sampling adequacy of 0.812 (> 0.60) and a significant (p < 0.001) Bartlett’s test of
sphericity were achieved, indicating sufficient evidence that the correlation matrix was factor
analysable (Field, 2005)
Only one factor (EEA 1) with eigenvalues greater than 1 was obtained. The Scree plot also
suggested that a single factor should be extracted. The factor matrix (see Appendix 4.24)
indicated that all the items loaded satisfactorily (> 0.50) on one factor and this factor accounted
for 67.61% of the variance
4.4.2.7 Employee Behaviour scale
The employee behaviour scale achieved uni-dimensionality. A Kaiser-Meyer-Olkin (KMO)
measure of sampling adequacy of 0.695 (> 0.60) and a significant (p < 0.001) Bartlett’s test of
sphericity were achieved, indicating sufficient evidence that the correlation matrix was factor
analysable (Field, 2005)
Only one factor (EEB 1) with eigenvalues greater than 1 was obtained. The Scree plot also
suggested that a single factor should be extracted. The factor matrix (see Appendix 4.25)
indicated that all the items loaded satisfactorily (> 0.50) on one factor and this factor accounted
for 66.83% of the variance.
4.4.2.8 Organisational Performance scale
The organisational performance scale achieved uni-dimensionality. A Kaiser-Meyer-Olkin
(KMO) measure of sampling adequacy of 0.703 (> 0.60) and a significant (p < 0.001) Bartlett’s
test of sphericity were achieved, indicating sufficient evidence that the correlation matrix was
factor analysable (Field, 2005)
132 | P a g e
Only one factor (EOP 1) with eigenvalues greater than 1 was obtained. The Scree plot also
suggested that a single factor should be extracted. The factor matrix (see Appendix 4.26)
indicated that all the items loaded satisfactorily (> 0.50) except EOP1 (0.390) on one factor and
this factor accounted for 48.12% of the variance.
4.5 MEASUREMENT AND STRUCTURAL MODELS
The aim of Structural Equation Modelling (SEM) is to provide a quantitative test of a theoretical
model using different models to show relationships among observed variables (Hair et al. 2014).
It also aims at determining the extent to which the proposed theoretical model is supported by
data. If the data does not support the model; then the model can be modified and tested again.
Covariance based SEM, as used in this study, is superior because it emphasises on normality of
data distribution (Ringle, Sarstedt & Straub, 2012). Violation of data normality can produce
unintended biases in the final statistical analyses (Fornell & Bookstein, 1982).
A Structural Equation Model has two sub models; the inner and outer models. The inner model
(structural model) specifies the relationship between independent and latent dependent variables
while the outer model (measurement model) specifies the relationships between latent variables
and their observed indicators (Hair et al. 2011). Both the measurement and structural models
were evaluated.
4.5.1 Guidelines for Model Measurement and Structural Evaluation
A two- step process is followed when using SEM. This involves separate assessments of the
measurement and structural models. Firstly, the measures of reliability and validity are examined
according to certain criteria associated with reflective and formative model specification. Table
4.29 summarises the validity guidelines for measurement and structural models evaluation. The
structural model can only be analysed after the measurement model has been validated.

133 | P a g e
Table 4. 6:Validity guidelines in Structural Equation Modelling (SEM)
Validity Type Criterion Guidelines
Measurement
Model
Internal
consistency
CR>0.7 (Exploratory study)
CR>0.8 (Advance research)
CR>0.6 (lack reliability)
Indicator
reliability
Indicator
loadings
Item’s loading >0.7 and significant at least at the 0.05 level
Convergent
Validity
AVE AVE>0.50
Discriminant
Validity
Cross loading
Fornell and
Lacker
Item’s loading of each indicator is highest for its designed
constructs.
The square root of AVE of a construct should be greater
than the correlations between the construct and other
construct in the model
Structural
Model
Model Validity (R2) 0.67-Substantial
0.333-Moderate
0.190-Weak
Model Validity Path
Coefficients
At least 0.100 and at significance of 0.05
Source: Kamarul (2012)
4.5.2 The Measurement Model
The measurement model is comprised of the relationship between observed variables against
their respective latent constructs. Figure 4.18 shows that the model consists of 20 variables in
total, of which 6 are latent variables and 14 are observable variables. A total of 12 free
parameters is estimated which includes 15 regression weights, and 12 measurement errors; due to
which the degree of freedom for the model is 44.
In order to determine accuracy of the measurement model, construct validity and reliability were
evaluated. Similarly, convergent and discriminant validity were calculated. It is suggested that
any item whose loading is less than 0.4 should be deleted (Duarte & Raposo, 2014; Hair et al.
2014; Hair et al. 2012; Hulland, 1999). Based on this criterion, the model was filtered by deleting
all items that loaded below 0.4. However, this study deleted all items loading below 0.7 and
retained all items loading between 0.7 and 0.8 as suggested by Kamarul (2012) that item
loadings should be >0.7.
After examining the factor loadings on the rotated matrix; it was found that out of 50 items, 23
items were to be deleted. These include EBS4, EBS5, ERS1, ERS2, ERS3, ERS7, ETD1,

134 | P a g e
ETD4.ETD5, EPA7, EPA8, EPA9, ECOM1, ECOM2, ECOM3, ECOM4, ECOM6 ECOM8,
EEA2, EEA4, EEA5, EOP4 and EOP5. This means 27 items were retained for the model (See
Table 4.31).
Table 4. 7: Construct Validity
Constructs Items Loadings Deleted due to low loading
Business strategy EBS1
EBS2
EBS3
EBS6
EBS7
EBS8
0.760
0.672
0.721
0.767
.0.845
0.781
EBS4
EBS5
Human resource management practices
ERS3
ERS4
ERS5
ERS6
ETD2
ETD3
ETD4
ETD5
EPA1
EPA2
EPA3
EPA4
EPA5
0.663
0.755
0.732
0.706
0.718
0.729
0.637
0.683
0.759
0.804
0.784
0.814
0.784
ERS1
ERS2
ERS7
ETD1
ETD4
ETD5
EPA7
EPA8
EPA9

135 | P a g e
EPA6
ECOM5
ECOM7
0.721
0.700
0.700
ECOM1
ECOM2
ECOM3
ECOM4
ECOM6
ECOM8
Employee attitudes EEA1
EEA2
EEA3
EEA4
0.781
0.685
0.775
0.662
EEA5
Employee behaviour EEB1
EEB2
EEB3
0.797
0.722
0.747
Organisational performance EOP1
EOP2
EOP3
0.719
0.828
0.815
EOP4
EOP5
4.5.2.1 Convergent validity
In testing the measurement model, the first step involved testing convergent validity. This was
tested using factor loadings, composite reliability and average variance extracted (Hair et al.
2010; Vigneron et al. 2017). Convergent validity helps to establish construct validity by
demonstrating that the constructs are distinct from each other (Campbell & Fiske, 1959). Hair et
al. (2010) argue that an outer loading of 0.70 is acceptable. Fornell and Lacker (1981) suggest
that the value of composite reliability (CR) for each construct should exceed 0.70 while the value
of average variance extracted (AVE) must exceed 0.50 for the convergent validity to be assured.
From the current study, the CR and AVE values of the constructs included in the model are all

136 | P a g e
above acceptable reliability levels (composite reliabilities above .70 Cronbach’s Alphas above
.70 and AVE above .50)
Table 4. 8: Convergent Validity
Mean
(Std Dev)
Cronbach’s %variance
Explained
AVE Composite reliability
EATTIT 21.37
(3.648)
.908 18.713 .605 .754
EBEHAV 12.97
(2.530)
.849 6.400 .572 .800
ORGPERF 22.19
(2.612)
.799 6.822 .622 .831
HRPRACT 30.44
(5.997)
.943 37.694 .658 .711
BSTRAT 34.92
(4.326)
.883 18.713 .602 .883
4.5.2.2 Discriminant Validity
The second step was measurement of the discriminant validity. This was applied to check if the
construct is exclusive from other constructs by empirical standard (Hair et al. 2014).
Discriminant validity is the extent to which a particular latent construct differs from other latent
constructs (Duarte & Raposo, 2010). In the current study, discriminant validity was assessed
using AVE as suggested by Fornell and Larcker (1981). To achieve this, correlations among
latent variables were compared with square roots of average variance extracted (Fornell &
Larcker, 1981). Discriminant validity is established when the square root of the AVE from the
construct is greater than the correlation shared between the construct and other constructs in the
model (Chin, 1998). Mohsin, et al 2017; Vigneron et al.2017 suggest that for discriminant
validity to be attained, initial cross loadings of the items must correspond to their constructs and
they must be greater than the other constructs.
Table 4.9 shows that the correlations among the latent constructs, compared with the square root
of AVE (in bold face) were all greater than the correlations among latent constructs, suggesting
adequate discriminant validity (Fornell & Larcker, 1981).

137 | P a g e
Table 4. 9: Discriminant validity
EATTIT EBEHAV ORGPERF HRPRACT BSTRAT
EATTIT 0.778
EBEHAV 0.575 0.756
ORGPERF 0.590 0.618 0.789
HRPRACT 0.805 0.734 0.704 0.811
BSTRAT 0.562 0.512 0.491 0.698 0.776
Note: The square roots of the constructs’ AVE values are shown in the diagonal line (in bold);
non-diagonal elements are latent variable correlations.
4.5.2.3 Measurement Model goodness-of-fit
The first step in doing SEM is to confirm the measurement model using confirmatory factor
analysis. CFA was used in order to confirm or reject the measurement theory. After the model
had been confirmed; SEM was carried out on the measurement model to achieve goodness-of-fit.
The degree of model fit, adequacy of the factor loadings, standardised loadings and explained
variances for the measured variables were determined using this process.
Confirmatory factor analysis was performed on all the five scales. This was aimed at
investigating the goodness-of –fit between the measurement model and the obtained data. The
results showed a good fit for the measurement model (See Table 4.8 and 4.9). This suggests that
the hypothesised structure fit the data better. LISREL 8.80 (Jöreskog & Sörbom, 1996) was used
to perform separate confirmatory factor analyses (CFA) on all five latent scales.
The initial results based on the fit index of the Root Mean Square Error of Approximation where
RMSEA < 0.08 showed a reasonable good model fit. Similarly RMSEA < 0.05 showed a very
good fit of the data (Diamantopoulos & Siguaw, 2000). Different further steps were followed
based on whether the results indicated good or poor model fit. If the evaluated model showed
138 | P a g e
poor fit, the modification indices were investigated in order to determine the possibility of
increasing model fit.
The fit of the model can be improved by freeing of model parameters (Diamantopoulos &
Siguaw, 2000). This requires investigating the theta-delta modification indices. Large
modification index values (> 6.6349 at a significance level of 0.01) show parameters that, if set
free, the model fit would improve significantly (p < 0.01) (Diamantopoulos & Siguaw, 2000;
Jöreskog & Sörbom, 1993). In this study, attempts were made to improve the goodness of fit
indices by using the theta-delta modification indices.
4.5.2 Evaluating the Measurement Model Fit
The goodness-of-fit statistics for measurement model are indicated in Table 4.38 as discussed in
following section.
5.4.2.1Absolute fit
Confirmatory factor analysis was performed on all items (after reliability testing, see Table 4.14).
The initial inspection of the fit statistics, revealed that good model fit had been achieved with
RMSEA=0.0495 being within reasonable limits (<0.08). The fit of the measurement model was
improved by using theta-delta modification indices. Table 4.14 shows that the refined
measurement model presented acceptable fit with data.
The standardised Root Mean Square Residual (SRMR) value of 0.0245 was below the 0.05
threshold, providing evidence of relatively good model fit. A positive picture was also expressed
by the Goodness of Fit Index (GFI). The GFI value of 0.955 for the measurement model is close
to 1 and above 0.90. This indicates that good absolute fit was achieved for the measurement
model.
4.5.2.2 Comparative fit
The incremental fit indices show that the measurement model achieved Normed Fit Index
(NFI=0.987), Non-Normed Fit Index (NNFI=0.991), Comparative Fit Index (CFI=0.994),
Incremental Fit Index (IFI) =0.994 and Relative Fit Index (RFI=0.980) indices which are > 0.90,
which represents good fit. These comparative indices therefore, appear to reveal a positive
picture of model fit. It therefore can be concluded that the measurement model provides a

139 | P a g e
credible explanation of the observed covariance matrix (See Table 4.14). All observed variables
loaded significantly (>0.50) on the latent variable (see Table 4.10). This shows that all the items
significantly represent the dimension they were designed to reflect.
Table 4. 10: Completely Standardised Solution
LAMBDA-X
BSTRAT EATTIT EBEHAV ORGPERF HRPRACT
EA-1 -- 0.939 -- -- --
EA-2 -- 0.938 -- -- --
EB-1 -- -- 0.844 -- --
EB-2 -- -- 0.876 -- --
OP-1 -- -- -- 0.860 --
OP-2 -- -- -- 0.858 --
TRAIND -- -- -- -- 0.790
PAPPRA -- -- -- -- 0.866
COMP -- -- -- -- 0.846
BSFAC-1 0.837 -- -- -- --
BSFAC-2 0.723 -- -- -- --
RECRUIT -- -- -- -- 0.827
4.5.2.3 Modification of the measurement model
Hair et al. (2010) recommends a modification of the initial model where it is found applicable.
Modification is achieved based on indicators such as modification indices (MI>4), standardised
residuals (<|4.0|), path estimates (>0.5) ideally >0.7 and must be significant), squared multiple
correlations (SMC or Reliability >0.3). These model diagnostics are applied to suggest some
changes to the model.

140 | P a g e
In order to determine the extent to which the structural model explains the observed covariances
among the apparent variables; modification was conducted. The study indicated that the largest
modification index was that for the factor loading associated with latent variable of “Employee
Attitudes” for the indicator of “benefits received being the same as other organisations’ of the
Compensation observed variable (ECOM5: 6.323, see Table 4.10). This indicates that, if this
parameter were to be freely estimated in a subsequent model, the overall x2 value would drop by
at least this amount.
Table 4. 11: Modification Indices for LAMBDA-X
LAMBDA-X
BSTRAT EATTIT EBEHAV ORGPERF HRPRACT
EA-1 2.088 -- 0.705 2.475 0.002
EA-2 2.166 -- 1.203 2.345 0.002
EB-1 0.354 5.706 -- 0.010 --
EB-2 0.252 5.368 -- 0.004 0.239
OP-1 3.612 3.252 0.322 -- --
OP-2 -- -- -- -- --
TRAIND 2.739 0.038 0.789 3.278 --
PAPPRA 1.612 3.183 0.814 0.106 --
COMP 1.293 6.323 4.041 0.014 --
BSFAC-1 -- 0.357 2.229 4.595 2.093
BSFAC-2 -- 0.517 3.916 6.139 --
RECRUIT 1.919 0.004 0.026 2.013 --
The standardised expected changes (see Table 4.12) show the expected values in the standardised
solution if the parameters were freed. Turning to the parameter change statistic related to
modification index parameter; we find a value of 0.165. This represents an approximate value
that the newly estimated parameter would assume (Bryne, 2013). In this case, the proposed

141 | P a g e
structural model appears to fit the data reasonably well because the expected change is minimal.
Inspection of the modification indices for the Beta matrix also suggests that there are no
additional paths between any endogenous latent variables that would significantly improve the fit
of the proposed structural model.
Table 4. 12: Standardised Expected change for LAMBDA-X
BSTRAT EATTIT EBEHAV ORGPERF HRPRACT
EA-1 0.048 -- -0.028 0.056 0.002
EA-2 -0.055 -- 0.053 -0.059 0.002
EB-1 -0.050 0.357 -- 0.011 --
EB-2 0.040 -0.381 -- -0.005 0.064
OP-1 -0.153 0.176 -0.045 -- --
OP-2 -- -- -- -- --
TRAIND -0.087 -0.012 -0.047 -0.091 --
PAPPRA 0.062 -0.092 -0.046 0.015 --
COMP -0.063 0.165 0.110 0.006 --
BSFAC-1 -- 0.031 -0.082 -0.190 0.125
BSFAC-2 -- -0.040 0.125 0.220 --
RECRUIT 0.071 0.004 -0.009 0.071 --
Similarly, the completely standardised solution estimates (See Table 4.13) indicate that the
solution is admissible because none of the parameters exceeds unity in absolute value.

142 | P a g e
Table 4. 13: Completely Standardised Solutions
LAMBDA-X
BSTRAT EATTIT EBEHAV ORGPERF HRPRACT
EA-1 -- 0.939 -- -- --
EA-2 -- 0.938 -- -- --
EB-1 -- -- 0.844 -- --
EB-2 -- -- 0.876 -- --
OP-1 -- -- -- 0.860 --
OP-2 -- -- -- 0.858 --
TRAIND -- -- -- -- 0.790
PAPPRA -- -- -- -- 0.866
COMP -- -- -- -- 0.846
BSFAC-1 0.837 -- -- -- --
BSFAC-2 0.723 -- -- -- --
RECRUIT -- -- -- -- 0.827
PHI
BSTRAT EATTIT EBEHAV ORGPERF HRPRACT
BSTRAT 1.000
EATTIT 0.525 1.000
EBEHAV 0.536 0.631 1.000
ORGPERF 0.637 0.632 0.622 1.000
HRPRACT 0.696 0.796 0.715 0.682 1.000

143 | P a g e
THETA-DELTA
EA-1 EA-2 EB-1 EB-2 OP-1 OP-2
0.118 0.119 0.288 0.233 0.261 0.264
THETA-DELTA
TRAIND PAPPRA COMP BSFAC-1 BSFAC-2 RECRUIT
0.376 0.250 0.285 0.299 0.477 0.316
4.5.3 Fitting the overall Measurement model
The path diagram in Figure 4.18 presents the refined measurement model. The diagram
illustrates that all items constituting the scales used in the study appear to load significantly on
their respective latent variables.

144 | P a g e
Figure 4 18: Path Diagram for the overall refined Measurement Model
KEY:
BSTRAT: Business Strategy; EATTIT: Employee Attitudes; EBEHAV: Employee Behaviour;
HRPRACT: Human Resource Management Practices; ORGPERF: Organisational
Performance; BSFAC: Business Strategy Factor; EA: Employee attitude; EB: Employee
Behaviour; OP: Organisational performance; TRAIND: Training and Development; PAPPRA:
Performance appraisal; COMP: Compensation; RECRUIT: Recruitment and Selection.

145 | P a g e
4.5.4 The Structural Model
After the measurement model was concluded to be acceptable; the second stage of SEM was
carried out. This was aimed at developing a structural model to verify the hypotheses for the
causal relationships between variables as guided by literature. Figure 4.19 shows the relationship
between the variables. The model consists of 17 variables in total, of which 5 are latent variables
and 12 are observable variables. A total of 6 free parameters is estimated which includes 16
regression weights, 4 variances, 2 correlations and 12 measurement errors; due to which the
degree of freedom for the model was 48. Boxes represent exogenous or endogenous observed
variables while the circles represent the related latent variables.
Having already done Confirmatory Factor Analysis on the measurement model; CFA was done
again in the structural model. This was aimed at investigating the goodness-of –fit between the
structural model and the obtained data. LISREL 8.80 (Jöreskog & Sörbom, 1996;
Diamantopoulos & Siguaw, 2000) was used to perform separate confirmatory factor analyses
(CFA) on all five latent scales (See Figure 4.19).
5.4.4.1Absolute fit
Confirmatory factor analysis was performed on all 25 items in the HRM practices scale (after
reliability testing (see Table 4.17). The initial inspection of the fit statistics, revealed that good
model fit had been achieved with RMSEA=0.0563 being within reasonable limits (<0.08). The
fit of the structural model was improved by using theta-delta modification indices (see Table
4.13). The standardised Root Mean Square Residual (SRMR) value of 0.0376 was below the
0.05 threshold, providing evidence of relatively good model fit. A positive picture was also
expressed by the Goodness of Fit Index (GFI). The GFI value of 0.944 for the structural model
was close to 1 and above 0.90. This indicates that good absolute fit has been achieved for the
structural model (See Table 4.13).
4.5.4.2 Comparative fit
The incremental fit indices confirm the validity of the structural model that it adequately
represents the entire set of relationships. Goodness of fit indices of Normed Fit Index
(NFI=0.983), Non-Normed Fit Index (NNFI=0.989), Comparative Fit Index (CFI=0.992),

146 | P a g e
Incremental Fit Index (IFI) =0.992 and Relative Fit Index (RFI=0.977) achieved which are >
0.90, represent good fit. These comparative indices therefore, appear to reveal a positive picture
of model fit. It therefore can be concluded that the structural model provides a credible
explanation of the observed covariance matrix. Moving from Model 1 to Model 2; Model 2
appears to be better than model1 on the basis of a better significant p-value of 0.000. Similarly,
model 2 has a higher degree of freedom (48). Higher degree of freedom is preferred than lower
degree of freedom. The RMSEA and parsimonious have also slightly improved in model 2 (See
Table 4.14).
Table 4. 14: Goodness-of-fit indices
Goodness –of- fit results Model 1 Model 2
Absolute predictive fit
X2 83.346
(p<0.000314)
104.266
(p<0.000)
Degrees of freedom(df) 44 48
Expected cross-validation index (ECVI) 0.472 0.504
Comparative fit
NFI 0.987 0.983
NNFI
0.991 0.989
CFI
0.994 0.992
IFI
0.994 0.992
GFI
0.955 0.944
PGFI
0.539 0.581
RMR
0.0137 0.0185
SRMR
0.0245 0.0376
RMSEA
0.0495 0.0563
RFI
0.980 0.977
SANTORRA-BENTLER 77.034 94.754

147 | P a g e
4.5.5 Validating the Structural Model
Structural models are assessed by R2 values and path coefficients. Unlike the measurement
model; the structural model focuses on latent variables. Table 4.15 presents R2 values of the
endogenous variables in the model. In the Lisrel output, R2 are presented as squared multiple
correlations.
The R2
values ranged between 0.05 and 0.70. The lowest value was that of organisational
performance (0.49), which indicates that the whole model accounted for only 49% of the
reported variance in organisational performance. Employee attitudes and employee behaviour
obtained moderate R2
values of 0.56 and 0.51 respectively. The highest R2 value was that of
human resource Management practices (0.70) indicating that the total model explains about 70%
of the variance explained in the HRM practices scale.
In terms of path coefficients; there are 7 paths that were hypothesised in the study. All paths
showed significant relationship between the variables except hypothesis 6 which was not
supported (See Figure 4.38). Furthermore; the X2 statistic for goodness-of-fit was 48, degree of
freedom was 104.266 and the p- value was 0.0000 (See Table 4.15)
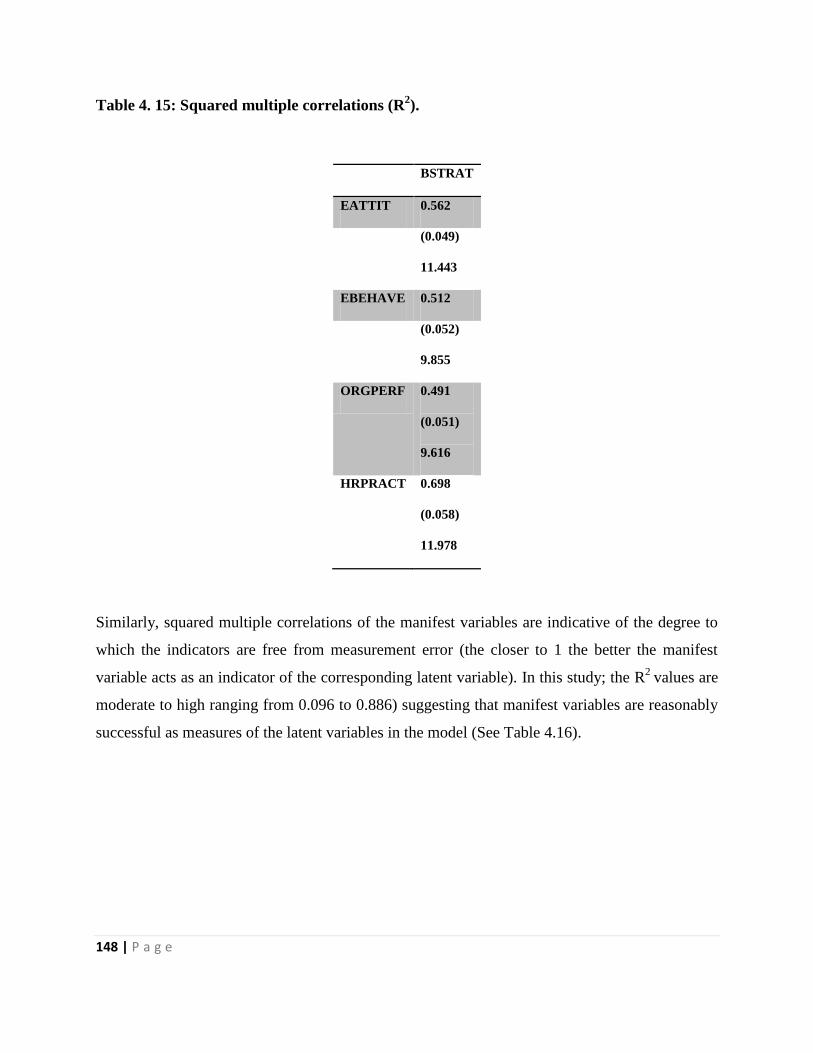
148 | P a g e
Table 4. 15: Squared multiple correlations (R2).
BSTRAT
EATTIT 0.562
(0.049)
11.443
EBEHAVE 0.512
(0.052)
9.855
ORGPERF 0.491
(0.051)
9.616
HRPRACT 0.698
(0.058)
11.978
Similarly, squared multiple correlations of the manifest variables are indicative of the degree to
which the indicators are free from measurement error (the closer to 1 the better the manifest
variable acts as an indicator of the corresponding latent variable). In this study; the R2
values are
moderate to high ranging from 0.096 to 0.886) suggesting that manifest variables are reasonably
successful as measures of the latent variables in the model (See Table 4.16).
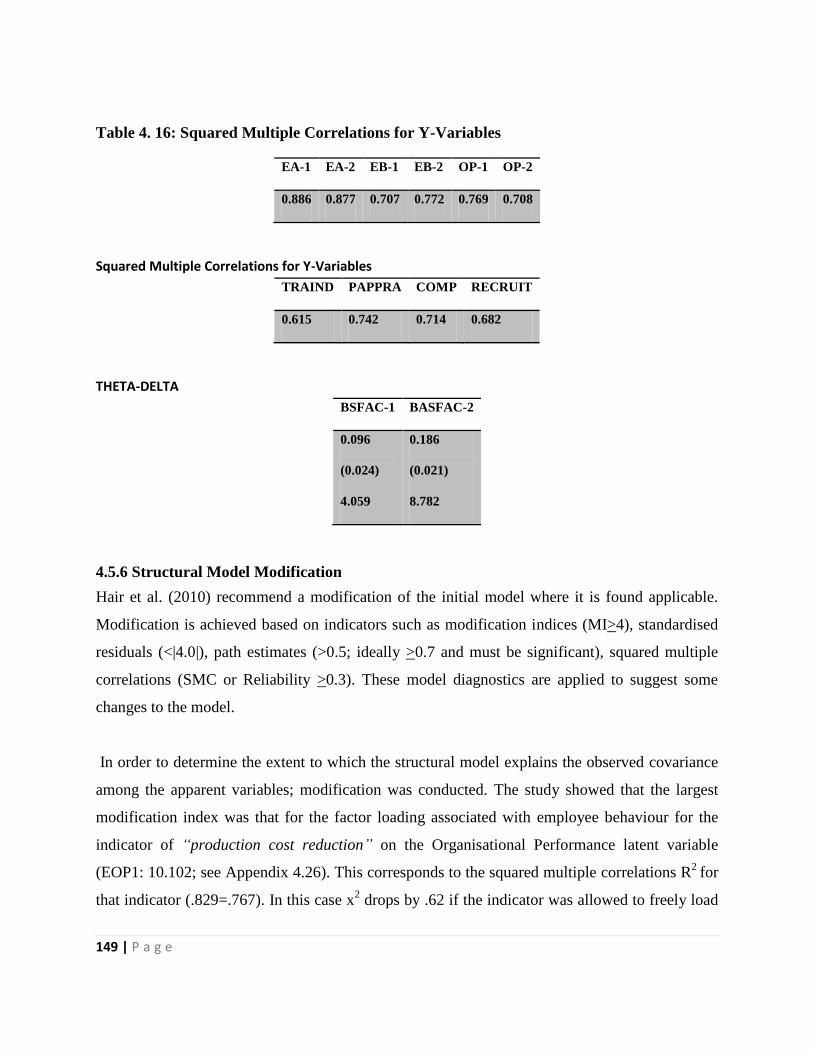
149 | P a g e
Table 4. 16: Squared Multiple Correlations for Y-Variables
EA-1 EA-2 EB-1 EB-2 OP-1 OP-2
0.886 0.877 0.707 0.772 0.769 0.708
Squared Multiple Correlations for Y-Variables
TRAIND PAPPRA COMP RECRUIT
0.615 0.742 0.714 0.682
THETA-DELTA
BSFAC-1 BASFAC-2
0.096
(0.024)
4.059
0.186
(0.021)
8.782
4.5.6 Structural Model Modification
Hair et al. (2010) recommend a modification of the initial model where it is found applicable.
Modification is achieved based on indicators such as modification indices (MI>4), standardised
residuals (<|4.0|), path estimates (>0.5; ideally >0.7 and must be significant), squared multiple
correlations (SMC or Reliability >0.3). These model diagnostics are applied to suggest some
changes to the model.
In order to determine the extent to which the structural model explains the observed covariance
among the apparent variables; modification was conducted. The study showed that the largest
modification index was that for the factor loading associated with employee behaviour for the
indicator of “production cost reduction” on the Organisational Performance latent variable
(EOP1: 10.102; see Appendix 4.26). This corresponds to the squared multiple correlations R2
for
that indicator (.829=.767). In this case x2 drops by .62 if the indicator was allowed to freely load
150 | P a g e
on both employee behaviour indicator 2 (EB-2) and latent variable employee behaviour instead
of just loading on EB-2 indicator. This indicates that, if this parameter were to be freely
estimated in a subsequent model, the overall value would drop by at least this amount.
The standardised expected changes (See Appendix 4. 27) shows the expected parameter change
statistic related to modification index of value -0.383. This represents an approximate value that
the newly estimated parameter would assume (Bryne, 2010). In this case, the proposed structural
model appears to fit the data reasonably well because the expected change was minimal.
Inspection of the modification indices for the Beta matrix also suggests that there are no
additional paths between any endogenous latent variables that would significantly improve the fit
of the proposed structural model.
Similarly, the completely standardised solution estimates (see Table 4.17) indicate that the
solution was admissible because none of the parameters exceeds unity in absolute value. Further,
Table 4.17 indicates the correlation between indicator and the factor. It also shows a standardised
regressive path reflecting the degree of standardised score change in the indicator given a
standardised unit increase in the factor. For example, the results show that; a one-unit increase in
employee attitudes (EATTIT) increases employee satisfaction (EA-1) by 0.941
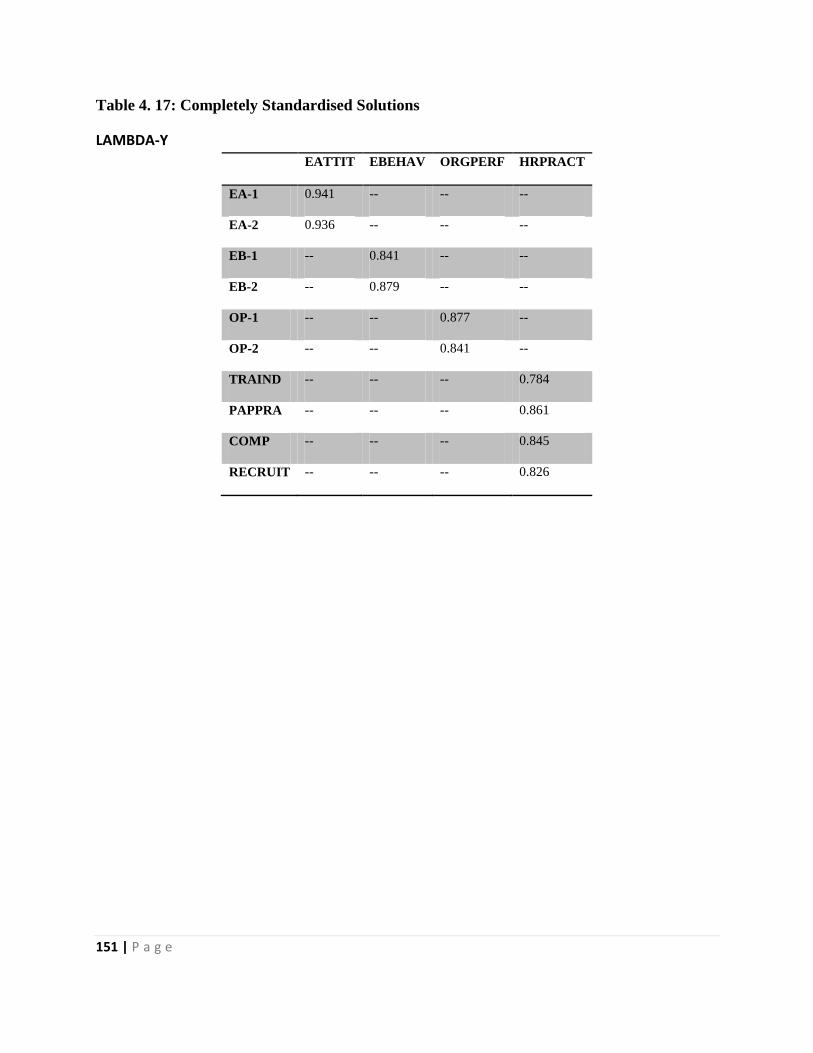
151 | P a g e
Table 4. 17: Completely Standardised Solutions
LAMBDA-Y
EATTIT EBEHAV ORGPERF HRPRACT
EA-1 0.941 -- -- --
EA-2 0.936 -- -- --
EB-1 -- 0.841 -- --
EB-2 -- 0.879 -- --
OP-1 -- -- 0.877 --
OP-2 -- -- 0.841 --
TRAIND -- -- -- 0.784
PAPPRA -- -- -- 0.861
COMP -- -- -- 0.845
RECRUIT -- -- -- 0.826

152 | P a g e
PHI
Note: this matrix is diagonal
EATTIT EBEHAV ORGPERF HRPRACT
0.351 0.921 1.766 0.513
THETA-EPS
EA-1 EA-2 EB-1 EB-2 OP-1 OP-2
0.114 0.123 0.293 0.228 0.231 0.292
THETA-EPS
TRAIND PAPPRA COMP RECRUIT
0.385 0.258 0.286 0.318
THETA-DELTA
BSFAC-1 BSFAC-2
0.262 0.503
Although standardised residuals and modification indices provide specific information on how
the model can be improved; the model review was not done in this study, because there were no
justifiable empirical or conceptual grounds (MacCallum, Roznowski & Necowitz, 1992).
Furthermore; a theoretical specification search aimed at revising the model based solely on large
standardised residual or modification indices can result in further model misspecification and
over fitting like inclusion of unnecessary parameter estimates arising from chance associations in
the data (Little, 2013).

153 | P a g e
Figure 4 19: Structural Model
154 | P a g e
KEY:
BSTRAT: Business Strategy; EATTIT: Employee Attitudes; EBEHAV: Employee Behaviour;
HRPRACT: Human Resource Management Practices; ORGPERF: Organisational
Performance; BSFAC: Business Strategy Factor; EA: Employee attitude; EB: Employee
Behaviour; OP: Organisational performance; TRAIND: Training and Development; PAPPRA:
Performance appraisal; COMP: Compensation; RECRUIT: Recruitment and Selection.
4.6 RELATIONSHIP BETWEEN LATENT VARIABLES
Based on the results of the fit indices, the structural model can be concluded to fit the data well.
The next step was to test the relationships between endogenous and exogenous latent variables.
The aim was to assess whether the linkages specified in the conceptual model are supported by
the data (Diamantopoulos & Siguaw, 2000).
Three relevant issues had to be considered first in order to assess the relationships. The first
consideration was to examine the signs of the parameters representing the paths between latent
variables. The aim was to determine whether the direction of the hypothesised relationships was
theoretically determined (Edwards & Bagozzi, 2000). The second consideration was to
investigate the magnitude of the estimated parameters. This investigation provides information
about the strength of the relationships. The third consideration was the R2 which indicates the
amount of variance in the endogenous variables explained by the latent variables linked to it
(Diamantopoulos & Siguaw, 2000).
The parameters that were assessed were the freed elements of gamma (see Table 4.18) and beta
(β) matrices (see Table 4.10). The Unstandardised gamma matrix was used to evaluate the
strength of the estimated path coefficients. According to Diamantopoulos and Siguaw, (2000) the
Unstandardised estimates are significant if t >1.96. A significant Y estimate suggests that the
related hypothesis will be rejected.
Gamma is a measure of the relationship between two ordinal variables that are either continuous
or discrete. It is one kind of correlation measure but unlike Pearson’s coefficient which is
labelled as R; gamma is not affected by outliers i.e. highly unusual points (Diamantopoulos &
Siguaw, 2000) Gamma deals with data that may have many ties. Gamma of above zero
represents positive relationship, while below zero represents a negative or inverse relationship
and near zero means little relationship.
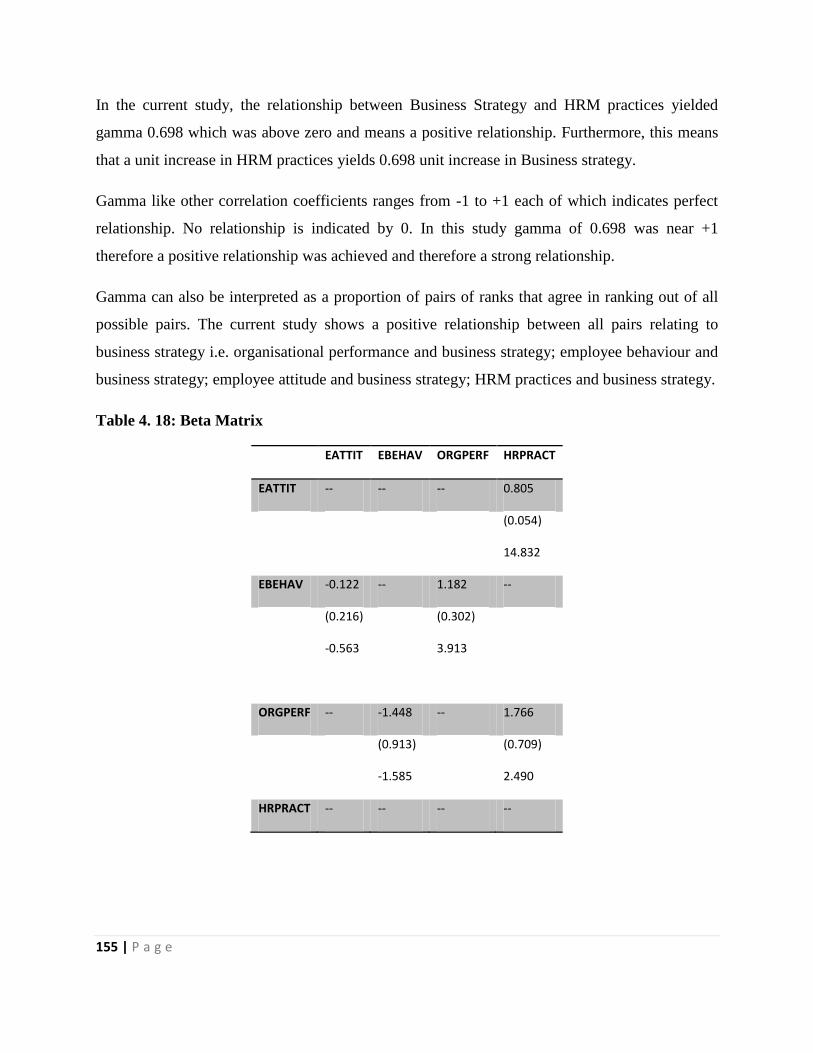
155 | P a g e
In the current study, the relationship between Business Strategy and HRM practices yielded
gamma 0.698 which was above zero and means a positive relationship. Furthermore, this means
that a unit increase in HRM practices yields 0.698 unit increase in Business strategy.
Gamma like other correlation coefficients ranges from -1 to +1 each of which indicates perfect
relationship. No relationship is indicated by 0. In this study gamma of 0.698 was near +1
therefore a positive relationship was achieved and therefore a strong relationship.
Gamma can also be interpreted as a proportion of pairs of ranks that agree in ranking out of all
possible pairs. The current study shows a positive relationship between all pairs relating to
business strategy i.e. organisational performance and business strategy; employee behaviour and
business strategy; employee attitude and business strategy; HRM practices and business strategy.
Table 4. 18: Beta Matrix
EATTIT EBEHAV ORGPERF HRPRACT
EATTIT -- -- -- 0.805
(0.054)
14.832
EBEHAV -0.122 -- 1.182 --
(0.216)
-0.563
(0.302)
3.913
ORGPERF -- -1.448 -- 1.766
(0.913)
-1.585
(0.709)
2.490
HRPRACT -- -- -- --

156 | P a g e
GAMMA
BSTRAT
EEATTIT --
EBEHAV --
ORGPERF --
HRPRACT 0.698
(0.058)
11.978
According to Cohen and Holliday (1982) correlations coefficients of less than 0.39 are low; of
0.40 to 0.69 are modest and of above 0.70 are high.
4.6.1 Relationship between Business strategy and HRM practices
The analysis found a significant, positive relationship (0.70) between business strategy and
Human HRM practices (see Table 4.18 & Figure 4.19). Thus, Hypothesis 1, stating a positive
relationship between the two variables, was supported. The estimated regression analysis also
confirms Hypothesis 1 (t = 11.978, p < .0001) (see Table 4.26).
Furthermore, results show that cost leadership (0.52 x 0.70=0.364) and quality (0.43 x
0.70=0.301) as antecedents of business strategy both have positive effect on HRM practices thus
supporting hypotheses 1. (See Figure 4.19)
4.6.2 Relationship between HRM practices and employee attitudes
The analysis found a significant, positive relationship (0.81) between Human HRM practices and
employee attitudes (see Table 4.18 & Figure 4.19). Thus, Hypothesis 2, stating a positive
relationship between the two variables, was supported. The estimated regression analysis also
confirms Hypothesis 2 (t =14.832, p <. 0001) (see Table 4.26).
Results also show that recruitment and selection (0.61 x 0.81=0.4941), training and development
(0.68 x 0.81=0.5508), performance appraisal (0.74 x0.81=0.5994) and compensation (0.71

157 | P a g e
x0.81=0.5751) as antecedents of HRM practices all have a positive effect on employee
satisfaction and commitment. Thus, supporting hypothesis 2 (See Figure 4.19)
4.6.3 Relationship between employee attitudes and employee behaviour
The analysis found a significant, negative relationship (-0.12) between employee attitudes and
employee behaviour (see Table 4.18 & Figure 4.19). Thus, Hypothesis 3, stating a negative
relationship between the two variables, was supported. The estimated regression analysis also
confirms Hypothesis 3 (t = -0.563, p <. 0001) (see Table 4.26).
Results also show that employee satisfaction (0.68 x -0.12=-0.0816), and employee commitment
(0.74 x -0.12= -0.888) as antecedents of employee attitude both have a negative effect on
employee behaviour. Thus, supporting hypothesis 3 (See Figure 4.19)
4.6.4 Relationship between employee behaviour and organisational performance
The analysis found a significant, negative relationship (-1.45) between employee behaviour and
organisational performance (see Table 4.18 & Figure 4.19). Thus, Hypothesis 4, stating a
negative relationship between the two variables, was supported. The estimated regression
analysis also confirms Hypothesis 4 (t = -1.585, p <. 0001) (see Table 4.26).
Results further show that absenteeism (0.73 x -1.45= -0.72) and disputes (0.83 x -1.45= -0.62) as
antecedents of employee behaviour both have a negative effect on organisational performance
thus supporting hypothesis 4 (See figure 4.19).
4.6.5 Relationship between HRM practices and organisational performance
The analysis found a significant, positive relationship (1.77) between Human HRM practices and
organisational performance (see Table 4.18 & Figure 4.19). Thus, Hypothesis 5, stating a
positive relationship between the two variables, was supported. The estimated regression
analysis also confirms Hypothesis 5 (t = 2.490, p <. 0001) (see Table 4.26).
Results also show that recruitment and selection (0.61 x 1.77 =1.08), training and development
(0.68 x 1.77=1.20), performance appraisal (0.74 x 1.77=1.31) and compensation (0.71 x
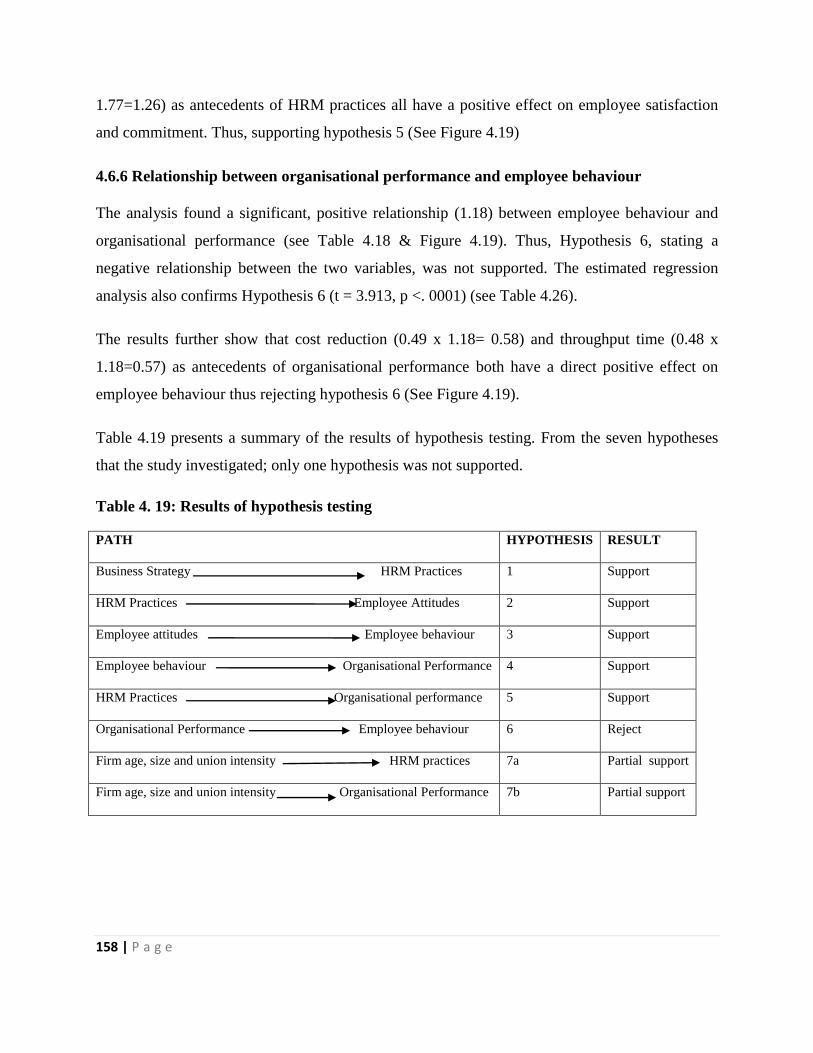
158 | P a g e
1.77=1.26) as antecedents of HRM practices all have a positive effect on employee satisfaction
and commitment. Thus, supporting hypothesis 5 (See Figure 4.19)
4.6.6 Relationship between organisational performance and employee behaviour
The analysis found a significant, positive relationship (1.18) between employee behaviour and
organisational performance (see Table 4.18 & Figure 4.19). Thus, Hypothesis 6, stating a
negative relationship between the two variables, was not supported. The estimated regression
analysis also confirms Hypothesis 6 (t = 3.913, p <. 0001) (see Table 4.26).
The results further show that cost reduction (0.49 x 1.18= 0.58) and throughput time (0.48 x
1.18=0.57) as antecedents of organisational performance both have a direct positive effect on
employee behaviour thus rejecting hypothesis 6 (See Figure 4.19).
Table 4.19 presents a summary of the results of hypothesis testing. From the seven hypotheses
that the study investigated; only one hypothesis was not supported.
Table 4. 19: Results of hypothesis testing
PATH HYPOTHESIS RESULT
Business Strategy HRM Practices 1 Support
HRM Practices Employee Attitudes 2 Support
Employee attitudes Employee behaviour 3 Support
Employee behaviour Organisational Performance 4 Support
HRM Practices Organisational performance 5 Support
Organisational Performance Employee behaviour 6 Reject
Firm age, size and union intensity HRM practices 7a Partial support
Firm age, size and union intensity Organisational Performance 7b Partial support
159 | P a g e
4.6.7 The influence of controls (organisational age, size & union intensity) on Human
Resource Management Practices. Moderation takes place when the relationship between variables is dependent on a third variable
which is referred to as the moderator. The effect of the moderator on the relationship between the
variables is termed as an interaction. According to Cohen et al. (2003); moderation analysis
involves use of linear regression analysis.
Two hypotheses regarding control variables (firm age, size and union intensity) were tested using
hierarchical regression in order to estimate the net effect of the variables on the independent
variable (firm age, size and union intensity) and dependent variable (HRM practices on one hand
and organisational performance on the other). This approach is consistent with Katuo (2008)
Katuo (2012) Shin (2017) Bryne (2016) and Khilji (2006). Two models are presented in tables
4.20 to 4.22 and tables 4.23 to 4.25 based on the regression results each of the independent
variables contributes to the explanation of variance in the separate dependent variables .Detailed
explanation of each model is presented.
The model summary of organisational age, size and union intensity and Human Resources
Management practices shows the coefficient of determination (R2) under model one was .004,
which meant that organisational age and size explained 0.4% of the variation in Human
Resources Management practices and 99.6% of the variations remaining unexplained. Model two
had R2 of .048 which meant that model two explained 4.8% of the variation in HRM practices
and left 95.2 % of variations unexplained. Thus, model two showed a relatively good fit than
model one implying that union intensity had the greatest effect on human resource management
practices (See Table 4. 20). The R square change shows how much of the overall change was
explained by union intensity. Table 4.20 shows that union intensity explains an additional 4.4%
of the variance in human resource management practices even when the effects of organisational
age and size are statistically controlled. This was a significant contribution, as evidenced by the
sig. F value of .000 for this line.

160 | P a g e
Table 4. 20: Model Summary of organisational age, size & union intensity and Human
Resource Management practices
Model Summaryc
Model R
R
Square
Adjusted R
Square
Std. Error of
the Estimate
Change Statistics
Durbin-
Watson
R Square
Change
F
Change df1 df2
Sig. F
Change
1 .062a .004 -.003 16.68223 .004 .588 2 305 .556
2 .219b .048 .039 16.33477 .044 14.114 1 304 .000 .739
a. Predictors: (Constant), Number of employees, Years of firm existence
b. Predictors: (Constant), Number of employees, Years of firm existence, percentage of unionism
c. Dependent Variable: Human resource management practices
ANOVA was used to assess the overall significance of the hierarchical regression model (See
Table 4.21). Under model one, the F-value (2,305) =.588, P<.005 (i.e. 0.556) and accounted for
0.4% of the variance in HRM practices. For model two, the F-value (3,304) =5.113, P<.005 (i.e.
0.002) and accounted for 4.4% of the variance in HRM practices. The table indicates that the
model as a whole was significant.
Table 4. 21: Analysis of Variance Statistics of organisational age, size and union intensity
ANOVAa
Model Sum of Squares df Mean Square F Sig.
1 Regression 327.288 2 163.644 .588 .556b
Residual 84880.569 305 278.297
Total 85207.857 307
2 Regression 4093.151 3 1364.384 5.113 .002c
Residual 81114.706 304 266.825
Total 85207.857 307
a. Dependent Variable: Human Resource Management practices
b. Predictors: (Constant), Number of employees, Years of firm existence
c. Predictors: (Constant), Number of employees, Years of firm existence, percentage of unionism

161 | P a g e
The study also examined how well each of the variables (organisational age, size and union
intensity) contributed to human resource management practices (See Table 4.22). Statistically
significant beta path coefficients of less than .005 were achieved. Organisational age, size and
union intensity exhibited significant interactions with human resource management practices.
Organisational age had positive beta value of .042 interacting effect with human resource
management practices. Organisational size and union intensity had negative beta values of -.006
and -.233 interacting effect with human resource management practices respectively.
Thus, hypothesis 7a suggesting a positive relationship between organisational age and human
resource management practices was partially supported. This was so because a positive
relationship between firm size and union intensity and human resource management practices
was not supported. Beta values represent the unique contribution of each variable, when the
overlapping effects of all other variables are statistically removed. The most important predictor
of HRM practices was organisational age which explained 4.2% of the variation in HRM
practices. Together, the three variables accounted for 4.8% of the variance in HRM practices.

162 | P a g e
Table 4. 22: Coefficients of organisational age, size and union intensity
Coefficientsa
Model
Unstandardize
d Coefficients
Standardize
d
Coefficients
t Sig.
95.0%
Confidence
Interval for B Correlations
Collinearity
Statistics
B
Std.
Error Beta
Lowe
r
Boun
d
Upper
Bound
Zero
-
orde
r
Partia
l Part
Toleranc
e VIF
1 (Constant
)
94.684 2.009
47.12
0
.00
0
90.73
0
98.638
Years of
firm
existence
-.521 .898 -.050 -.580 .56
2
-2.289 1.247 -.061 -.033 -
.03
3
.438 2.28
1
Number
of
employee
s
-.107 .621 -.015 -.172 .86
3
-1.328 1.114 -.052 -.010 -
.01
0
.438 2.28
1
2 (Constant
)
99.672 2.374
41.99
0
.00
0
95.00
1
104.34
3
Years of
firm
existence
.442 .916 .042 .482 .63
0
-1.361 2.245 -.061 .028 .02
7
.404 2.47
4
Number
of
employee
s
-.040 .608 -.006 -.066 .94
8
-1.236 1.156 -.052 -.004 -
.00
4
.438 2.28
3
percentag
e of
unionism
-3.702 .985 -.233 -3.757 .00
0
-5.641 -1.763 -.216 -.211 -
.21
0
.817 1.22
5
a. Dependent Variable: Human Resource Management Practices.

163 | P a g e
4.6.8 The influence of controls (organisational age, size & union intensity) on
Organisational performance.
The model summary of organisational age, size and union intensity and organisational
performance showed the coefficient of determination (R2) under model one was .003, which
meant that organisational age and size explained 0.3% of the variation in organisational
performance and with 99.7% of the variations remaining unexplained. Model two had R2 of .010
which meant that model two explained 1% of the variation in organisational performance and left
99 % of variations unexplained. Thus, model two showed a relatively good fit than model one
implying that union intensity had the greatest effect on organisational performance (See Table
4.23). The R square change shows how much of the overall change was explained by union intensity.
Table 4.23 shows that union intensity explained an additional 0.7% of the variance in organisational
performance even when the effects of organisational age and size are statistically controlled. This
was not a significant contribution, as evidenced by the sig. F value of .147 for this line.
Table 4. 23: Model Summary
Model Summaryc
Model R
R
Square
Adjusted R
Square
Std. Error of
the Estimate
Change Statistics
Durbin-
Watson
R Square
Change
F
Change df1 df2
Sig. F
Change
1 .056a .003 -.003 1.74749 .003 .472 2 305 .624
2 .100b .010 .000 1.74430 .007 2.119 1 304 .147 1.365
a. Predictors: (Constant), Years of firm existence, Number of employees
b. Predictors: (Constant), Years of firm existence, Number of employees, percentage of unionism
c. Dependent Variable: Organisational performance
ANOVA was used to assess the overall significance of the hierarchical regression model (See
Table 4.24). Under model one, the F-value (2,305) =.472, P<.005 (i.e. 0.624) was obtained and
accounted for 0.3 % of the variation in organisational performance. For model two, the F-value
(3,304) =1.022, P<.005 (i.e. 0.383) was obtained accounting for 0.7% of the variance. This
means that both models one and two were significant with P values less than .005.

164 | P a g e
Table 4. 24: ANOVA
ANOVAa
Model Sum of Squares df Mean Square F Sig.
1 Regression 2.880 2 1.440 .472 .624b
Residual 931.389 305 3.054
Total 934.269 307
2 Regression 9.328 3 3.109 1.022 .383c
Residual 924.942 304 3.043
Total 934.269 307
a. Dependent Variable: Organisational Performance
b. Predictors: (Constant), Years of firm existence, Number of employees
c. Predictors: (Constant), Years of firm existence, Number of employees, percentage of unionism
The study also examined how well each of the variables contributed to Organisational
Performance (See Table 4.25). Statistically significant beta path coefficients of less than .005
were achieved. Organisational age, size and union intensity exhibited significant interactions
with organisational performance. Organisational age had positive beta value of .026 interacting
effect with organisational performance. Organisational size and union intensity had negative beta
values of -.044 and -.092 interacting effect with organisational performance respectively.
Thus, hypothesis 7b suggesting a positive relationship between organisational age, size and
union intensity and organisational performance was partially supported. This is because a
positive relationship between firm size and union intensity and organisational performance was
not supported. The most important predictor of organisational performance was organisational
age which explained 2.6% of the variation in organisational performance. Together, the three
variables accounted for 1.0% of the variance in organisational performance.

165 | P a g e
Table 4. 25: Coefficients
Coefficientsa
Model
Unstandardize
d Coefficients
Standardize
d
Coefficients
t Sig.
95.0%
Confidence
Interval for B Correlations
Collinearity
Statistics
B
Std.
Error Beta
Lower
Boun
d
Upper
Boun
d
Zero
-
order
Partia
l Part
Toleranc
e VIF
1 (Constant
)
13.267 .210
63.02
7
.00
0
12.85
2
13.68
1
Number
of
employee
s
-.036 .065 -.048 -.551 .58
2
-.164 .092 -.055 -.032 -
.03
1
.438 2.28
1
Years of
firm
existence
-.011 .094 -.010 -.117 .90
7
-.196 .174 -.046 -.007 -
.00
7
.438 2.28
1
2 (Constant
)
13.473 .253
53.15
3
.00
0
12.97
4
13.97
2
Number
of
employee
s
-.033 .065 -.044 -.509 .61
1
-.161 .095 -.055 -.029 -
.02
9
.438 2.28
3
Years of
firm
existence
.029 .098 .026 .295 .76
8
-.164 .221 -.046 .017 .01
7
.404 2.47
4
percentag
e of
unionism
-.153 .105 -.092 -1.456 .14
7
-.360 .054 -.095 -.083 -
.08
3
.817 1.22
5
a. Dependent Variable: Organisational performance.
166 | P a g e
4.7 REGRESSION ANALYSIS
Regression is a statistical technique for studying linear relationships. It mainly focuses on the
dependent variable. The aim is to predict the value of the dependent variable or to estimate the
effect of some explanatory variable on the dependent variable (see Table 4.26). The estimated
regression weight for employee attitudes on HRM practices was 0.805 with a standard error of
0.054 (See Table 4.26). This loading was significant because its associated Wald statistic is
greater than 1.96 (14.832). This shows that HRM practices exert a significant influence on
employee attitudes. It means that one-unit increase in HRM practices results in 0.805-unit
increase in employee attitude. This demonstrates a positive association between the constructs.
The estimated regression weight loading for employee behaviour on employee attitudes was -
0.122 with a standard error of 0.0216 (See Table 4.26). This loading was significant because its
associated Wald statistic is greater than 1.96 (-0.563). This shows that employee behaviour exert
a significant influence on employee attitudes. It means that one-unit increase or decrease in
employee attitudes results in -0.122 unit decrease in employee behaviour. This demonstrates a
negative association between the constructs.
The estimated regression weight loading for employee behaviour on organisational performance
was 1.182 with a standard error of 0.302. This loading was significant because its associated
Wald statistic is greater than 1.96 (3.913). This shows that organisational performance exert a
significant influence on employee behaviour. It means that one-unit increase in organisational
performance (production cost reduction and throughput time) results in 1.182-unit increase in
employee behaviour. This demonstrates a positive association between the constructs.
The estimated regression weight loading for organisational performance on employee behaviour
was -1.448 with a standard error of 0.913 (See Table 4.26). This loading was significant because
its associated Wald statistic is greater than 1.96 (-1.585). This shows that employee behaviour
exert a significant influence on organisational performance. It means that one-unit increase in

167 | P a g e
employee behaviour (absenteeism and disputes) results in -1.448 unit decrease in organisational
performance. This demonstrates a negative association between the constructs.
The estimated regression weight loading for organisational performance on HRM practices
was1.766 with a standard error of 0709 (See Table 4.26). This loading was significant because its
associated Wald statistic is greater than 1.96 (2.490). This shows that HRM practices exert a
significant influence on organisational performance. It means that one-unit increase in HRM
practices results in -1.766-unit increase in organisational performance. This demonstrates a
positive association between the constructs. The estimated regression weight loading for HRM
practices on business strategy was 0.698 with a standard error of 0058 (See Table 4.26). This
loading was significant because its associated Wald statistic is greater than 1.96 (11.978). This
shows that business strategy exerts a significant influence on HRM practices. It means that one-
unit increase in business strategy results in 0.698-unit increase in HRM practices. This
demonstrates a positive association between the constructs
Table 4. 26: Estimated Regression Weights
EATTIT EBEHAV ORGPERF HRPRACT
EATTIT -- -- -- 0.805
(0.054)
14.832
EBEHAV -0.122 -- 1.182 --
(0.216)
-0.563
(0.302)
3.913
ORGPERF -- -1.448 -- 1.766
(0.913)
-1.585
(0.709)
2.490
HRPRACT -- -- -- --
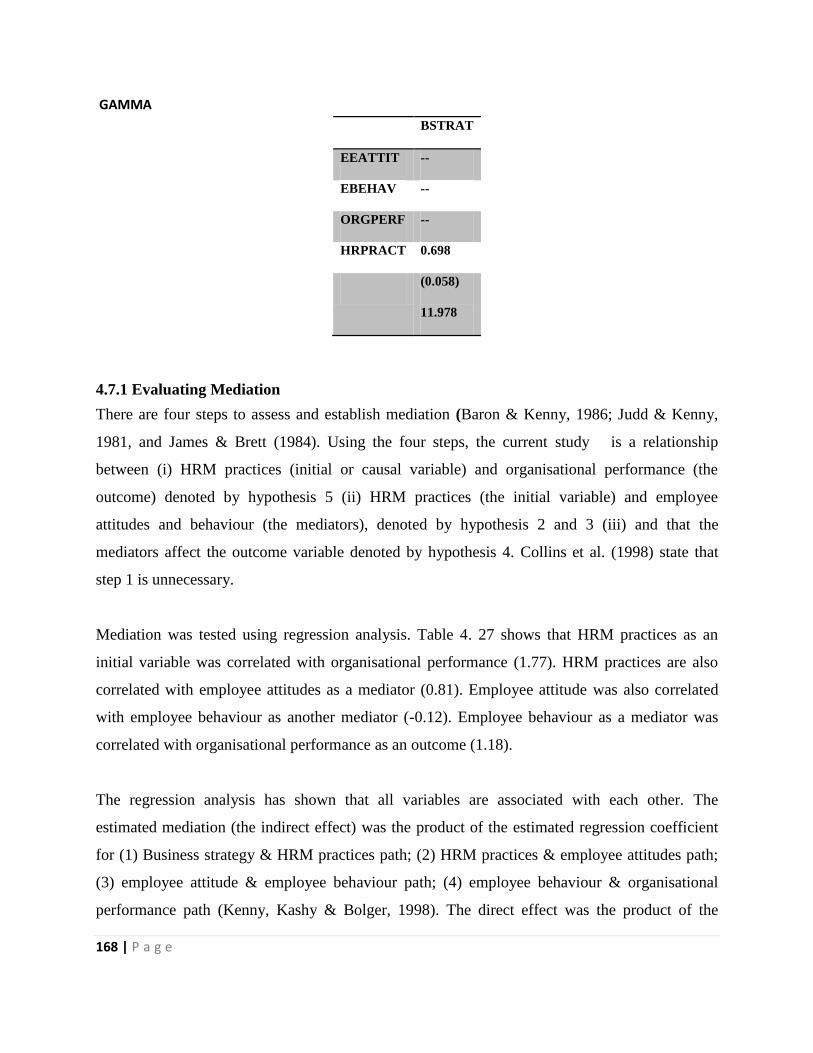
168 | P a g e
GAMMA
BSTRAT
EEATTIT --
EBEHAV --
ORGPERF --
HRPRACT 0.698
(0.058)
11.978
4.7.1 Evaluating Mediation
There are four steps to assess and establish mediation (Baron & Kenny, 1986; Judd & Kenny,
1981, and James & Brett (1984). Using the four steps, the current study is a relationship
between (i) HRM practices (initial or causal variable) and organisational performance (the
outcome) denoted by hypothesis 5 (ii) HRM practices (the initial variable) and employee
attitudes and behaviour (the mediators), denoted by hypothesis 2 and 3 (iii) and that the
mediators affect the outcome variable denoted by hypothesis 4. Collins et al. (1998) state that
step 1 is unnecessary.
Mediation was tested using regression analysis. Table 4. 27 shows that HRM practices as an
initial variable was correlated with organisational performance (1.77). HRM practices are also
correlated with employee attitudes as a mediator (0.81). Employee attitude was also correlated
with employee behaviour as another mediator (-0.12). Employee behaviour as a mediator was
correlated with organisational performance as an outcome (1.18).
The regression analysis has shown that all variables are associated with each other. The
estimated mediation (the indirect effect) was the product of the estimated regression coefficient
for (1) Business strategy & HRM practices path; (2) HRM practices & employee attitudes path;
(3) employee attitude & employee behaviour path; (4) employee behaviour & organisational
performance path (Kenny, Kashy & Bolger, 1998). The direct effect was the product of the
169 | P a g e
estimated regression coefficient of Business strategy and HRM practices and the HRM practices
and organisational performance path.
4.7.1.1 Assessment of direct and indirect paths
This was assessed using the additives relationship assumption. According to this approach, the
effects are additive such that the direct effect plus the indirect effect add up to the total effect.
Additive relationship is applied when HRM practices have independent and non-overlapping
effects on outcome. According to Katuo (2008), this translates into a case where the effect of
simultaneous use of the HRM practices is higher as compared to use of anyone HRM practice
alone. The simultaneous effect should not be more than the sum of the individual effects of each
HRM practice (Delery, 1998).
Table 4.27 shows the direct, indirect and total effects of statistically significant relationships as
shown in the tested structural model. Results reveal that HRM practices (0.70, directly) and
organisational performance (1.24 indirectly) are positively affected by business strategy. This
means that business strategy was the driver of organisational performance. Similarly, it means
HRM practices are contingent on business strategy. Furthermore, although there was no direct
effect of business strategy on organisational performance; their indirect impact on organisational
performance was very strong (1.24). Similarly, business strategy indirect effect on employee
attitudes and employee behaviour was significant (0.57 and 0.46) respectively.
The total effects of most variables, (except employee attitude & employee behaviour -0.12;
employee attitude & organisational performance -1.57 and employee behaviour & organisational
performance -1.45) are strongly and positively influenced by HRM practices.
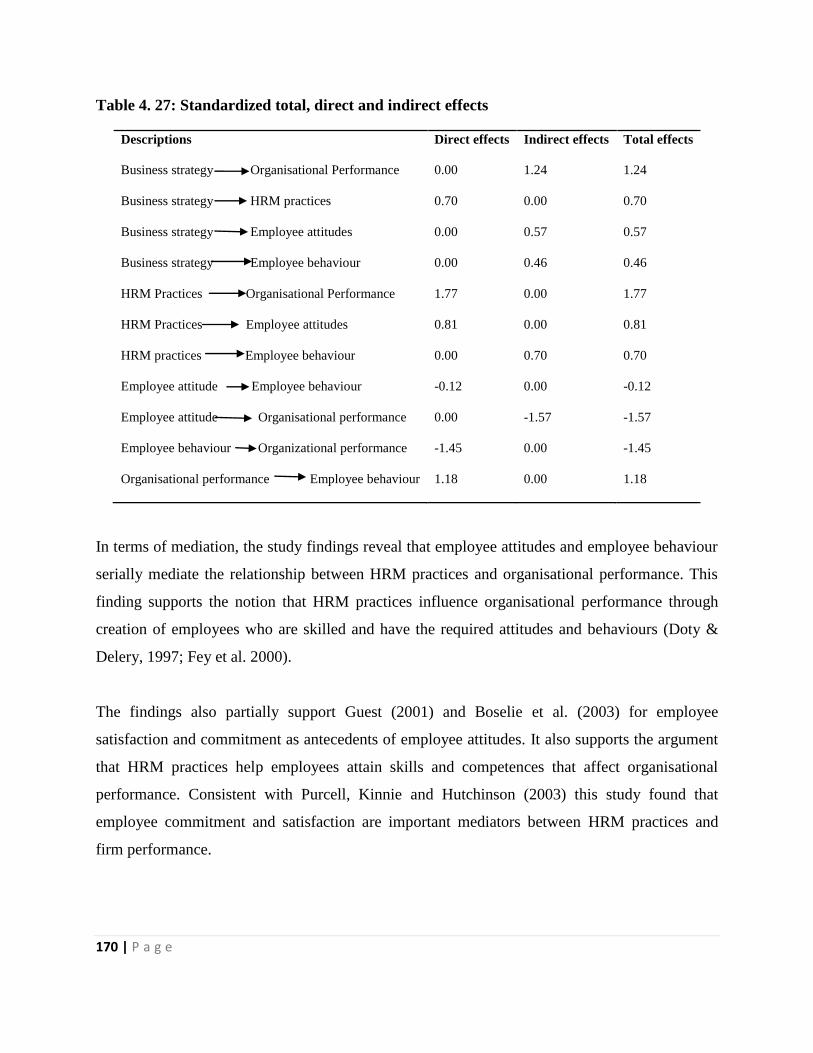
170 | P a g e
Table 4. 27: Standardized total, direct and indirect effects
Descriptions Direct effects Indirect effects Total effects
Business strategy Organisational Performance 0.00 1.24 1.24
Business strategy HRM practices 0.70 0.00 0.70
Business strategy Employee attitudes 0.00 0.57 0.57
Business strategy Employee behaviour 0.00 0.46 0.46
HRM Practices Organisational Performance 1.77 0.00 1.77
HRM Practices Employee attitudes 0.81 0.00 0.81
HRM practices Employee behaviour 0.00 0.70 0.70
Employee attitude Employee behaviour -0.12 0.00 -0.12
Employee attitude Organisational performance 0.00 -1.57 -1.57
Employee behaviour Organizational performance -1.45 0.00 -1.45
Organisational performance Employee behaviour 1.18 0.00 1.18
In terms of mediation, the study findings reveal that employee attitudes and employee behaviour
serially mediate the relationship between HRM practices and organisational performance. This
finding supports the notion that HRM practices influence organisational performance through
creation of employees who are skilled and have the required attitudes and behaviours (Doty &
Delery, 1997; Fey et al. 2000).
The findings also partially support Guest (2001) and Boselie et al. (2003) for employee
satisfaction and commitment as antecedents of employee attitudes. It also supports the argument
that HRM practices help employees attain skills and competences that affect organisational
performance. Consistent with Purcell, Kinnie and Hutchinson (2003) this study found that
employee commitment and satisfaction are important mediators between HRM practices and
firm performance.

171 | P a g e
4.7.1.2 Testing mediation through competing regression
Competing regression was used to test whether employee attitudes and employee behaviour
mediate the relationship between HRM practices and organisational performance (Baron &
Kenny, 1986; Katuo, 2011). Since the mediation is a hypothesised causal chain where one
variable (X) affects another variable (M) which in turn affects another variable, which affects a
fourth variable (Y ).
The results show that for every one -unit increase in employee behaviour (holding employee
attitude constant) employee attitude increases by 0.619 (See Table 4.28). This denotes a large
and direct effect of employee attitudes on employee behaviour. Furthermore, 28.6% of the
variance in employee behaviour was explained by employee attitude (See Table 4.29). This
shows how useful employee attitude was in predicting employee behaviour.
F-tests the significance of the model. It tests hypothesis 1 which states that there was a negative
relationship between employee attitudes and employee behaviour. To reject this hypothesis sig.
must be less than 0.05. This model was significant as sig is above 0.05 (sig. 1) thus supporting
the hypothesis. The results further show that for every one -unit increase in organisational
performance (holding employee attitude constant) increases employee attitude by .404 (See
Table 4.28). This represents a medium and direct effect of employee attitudes on organisational
performance. Results also show that a 31.9% of variance in organisational performance was
explained by employee attitudes (See Table 4.29)Employee attitude indirect effect on
organisational performance was 0.249 (i.e. 0.801 x 0.081) while its direct effect was 0.404.
Furthermore, for every one-unit increase in organisational performance (holding employee
attitude constant) increases employee attitude by .282 and employee behaviour by .251 (See
Table 4.28). These results represent a small relationship. Results also show that 38.4% of
variance in organisational performance was jointly explained by employee attitude and employee
behaviour (See Table 4.29).
Additionally, for every one-unit increase in organisational performance (holding employee
behaviour constant) increases employee behaviour by.307 (See Table 4.28). This represents a
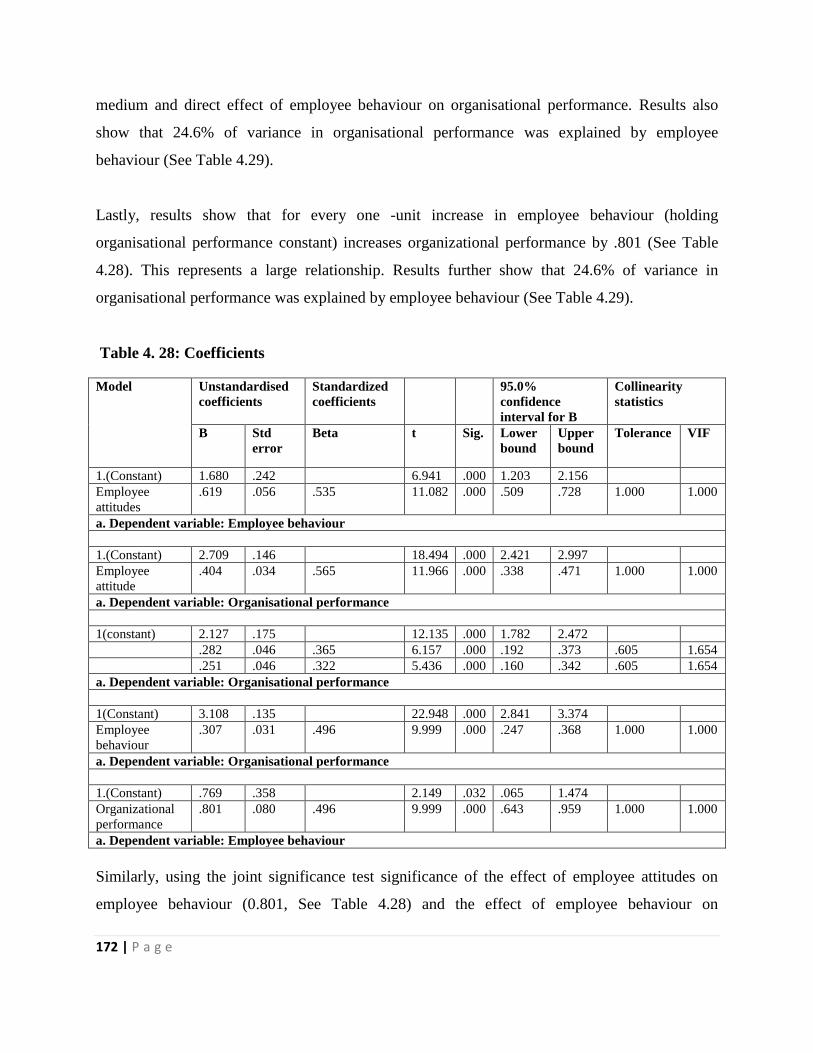
172 | P a g e
medium and direct effect of employee behaviour on organisational performance. Results also
show that 24.6% of variance in organisational performance was explained by employee
behaviour (See Table 4.29).
Lastly, results show that for every one -unit increase in employee behaviour (holding
organisational performance constant) increases organizational performance by .801 (See Table
4.28). This represents a large relationship. Results further show that 24.6% of variance in
organisational performance was explained by employee behaviour (See Table 4.29).
Table 4. 28: Coefficients
Model Unstandardised
coefficients
Standardized
coefficients
95.0%
confidence
interval for B
Collinearity
statistics
B Std
error
Beta t Sig. Lower
bound
Upper
bound
Tolerance VIF
1.(Constant) 1.680 .242 6.941 .000 1.203 2.156
Employee
attitudes
.619 .056 .535 11.082 .000 .509 .728 1.000 1.000
a. Dependent variable: Employee behaviour
1.(Constant) 2.709 .146 18.494 .000 2.421 2.997
Employee
attitude
.404 .034 .565 11.966 .000 .338 .471 1.000 1.000
a. Dependent variable: Organisational performance
1(constant) 2.127 .175 12.135 .000 1.782 2.472
.282 .046 .365 6.157 .000 .192 .373 .605 1.654
.251 .046 .322 5.436 .000 .160 .342 .605 1.654
a. Dependent variable: Organisational performance
1(Constant) 3.108 .135 22.948 .000 2.841 3.374
Employee
behaviour
.307 .031 .496 9.999 .000 .247 .368 1.000 1.000
a. Dependent variable: Organisational performance
1.(Constant) .769 .358 2.149 .032 .065 1.474
Organizational
performance
.801 .080 .496 9.999 .000 .643 .959 1.000 1.000
a. Dependent variable: Employee behaviour
Similarly, using the joint significance test significance of the effect of employee attitudes on
employee behaviour (0.801, See Table 4.28) and the effect of employee behaviour on
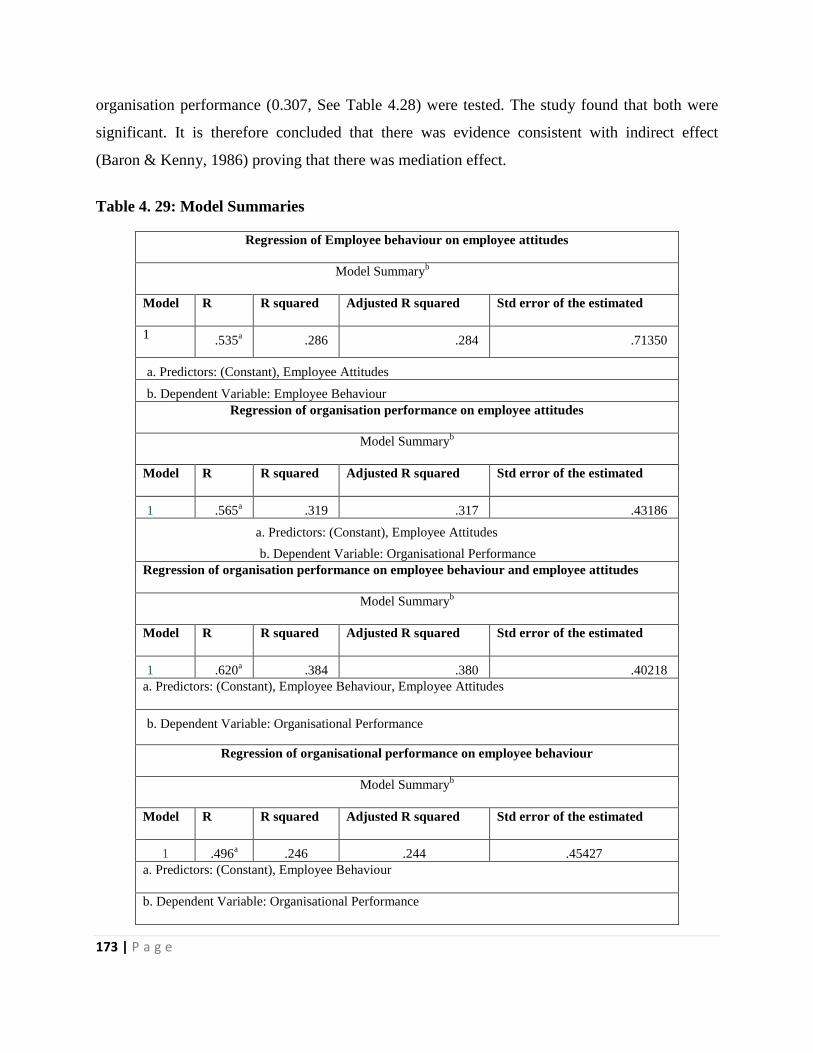
173 | P a g e
organisation performance (0.307, See Table 4.28) were tested. The study found that both were
significant. It is therefore concluded that there was evidence consistent with indirect effect
(Baron & Kenny, 1986) proving that there was mediation effect.
Table 4. 29: Model Summaries
Regression of Employee behaviour on employee attitudes
Model Summaryb
Model R R squared Adjusted R squared Std error of the estimated
1 .535a .286 .284 .71350
a. Predictors: (Constant), Employee Attitudes
b. Dependent Variable: Employee Behaviour
Regression of organisation performance on employee attitudes
Model Summaryb
Model R R squared Adjusted R squared Std error of the estimated
1 .565a .319 .317 .43186
a. Predictors: (Constant), Employee Attitudes
b. Dependent Variable: Organisational Performance
Regression of organisation performance on employee behaviour and employee attitudes
Model Summaryb
Model R R squared Adjusted R squared Std error of the estimated
1 .620a .384 .380 .40218
a. Predictors: (Constant), Employee Behaviour, Employee Attitudes
b. Dependent Variable: Organisational Performance
Regression of organisational performance on employee behaviour
Model Summaryb
Model R R squared Adjusted R squared Std error of the estimated
1 .496a .246 .244 .45427
a. Predictors: (Constant), Employee Behaviour
b. Dependent Variable: Organisational Performance

174 | P a g e
Regression of employee behaviour on organisational performance
Model Summaryb
Model R
R
Square
Adjusted R
Square
Std. Error of
the Estimate
Change Statistics
R Square
Change
F
Change df1 df2
Sig. F
Change
1 .496a .246 .244 .73330 .246 99.976 1 306 .000
a. Predictors: (Constant), Organisational
Performance
b. Dependent Variable: Employee Behaviour
4.9 SUMMARY
The chapter reported on the study findings. An investigation and refinement of the measuring
scales was the first task of the chapter. This was followed by examining the data and correcting it
wherever possible. Statistical outcomes of the hypothesised relationships were tested. The
following chapter five discusses conclusions from the study results in greater depth.
Recommendations for future research, study limitations and possible managerial implications
will be presented in the conclusion.

175 | P a g e
CHAPTER FIVE
DISCUSSION OF RESULTS, CONCLUSIONS AND RECOMMENDATIONS
5.1 INTRODUCTION
The earlier chapters have outlined why this study was undertaken. This chapter discusses key
findings of the thesis. The discussion centres on answering three key research questions (1) do
HRM practices affect performance of agricultural manufacturing firms in Malawi, (2) does the
performance of the agricultural manufacturing firms motivate how employees behave at work?
(3) Is the causal relationship stronger in the forward or reverse causality in the Malawi
agricultural manufacturing sector?
In an attempt to answer research question one; a comprehensive literature review was carried out
in Chapter two. The aim was to identify and discuss HRM practices that relate to manufacturing
in general and apply them to the Malawi agricultural manufacturing in particular. A conceptual
framework has been tested from the contingency theory, resource based theory, general systems
theory and the AMO theory. In the conceptual framework four HRM practices were
hypothesised to directly or indirectly influence four organisational performance indicators. To
answer this question a survey was conducted using a questionnaire. Based on the conceptual
model seven hypotheses were tested. The discussion focuses on examining the results of five
hypotheses with regard to question one. The hypotheses were: H1, H2, H3, H4, and H5
In order to answer the second question, a conceptual framework was tested that was developed
from general systems theory perspective. In the conceptual model four organisational
performance factors were hypothesised to motivate three employee behaviours (Details in
Chapter 3). The results of hypothesis 6 will be discussed. In order to answer the third question, a
comparison was made of the forward and reverse causality figures to derive which one has a
better rating. The rest of the chapter presents key research findings around research questions
and hypotheses discussed in detail. It also outlines theoretical and practical contributions of the
study. Then it addresses several limitations of the thesis and finally provides future research
directions in the area of HRM.
176 | P a g e
5.2 AIM OF THE STUDY
The aim of this study was to investigate whether organisational performance influence employee
behaviour in agricultural manufacturing firms in Malawi using the Human Resource
Management practices and organisational performance Model
This study is important because literature is scarce of studies of this nature in Malawi and no
study has investigated reversed causality of organisational performance and employee behaviour.
However other studies have compared HRM practices direct and indirect effect on organisational
performance.
5.2.1 Objectives of the study
The specific objectives were:
1. Examine the effect of organisational age, size and union intensity on the HRM practices
and organisational performance in the agricultural manufacturing sector
2. Investigate the impact of HRM practices on organisational performance in the
agricultural manufacturing sector.
3. Examine the reversed causality of organisational performance on employee behaviour on
the relationship between HRM practices and organisational performance in the
agricultural manufacturing sector.
Research questions
1. What is the relationship between business strategy and human resource practices?
2. What is the relationship between human resource practices and employee attitudes?
3. What is the relationship between employee attitudes and employee behaviour?
4. What is the relationship between employee behaviour and organisational performance?
5. What is the relationship between human resource practices and organisation performance
without the mediating effect of employee attitudes and employee behaviour?
6. Does organisational performance affect employee behaviour?
7. Is the causal relationship stronger in the forward or reverse causality?

177 | P a g e
5.2.2 Conceptual framework
The conceptual framework of this study is guided by the resource based theory (Barney, 1991)
and the contingency theory (Fiedler, 1964). In order to understand how human resources can be
acquired, trained and developed, assessed and rewarded appropriately; using organisational
human resources practices. This is an attempt to turn employees into rare, inimitable, non-
substitutable and valuable resources and create sustained competitive advantage. In this regard;
the resource based theory was used. The contingency theory justifies the inclusion of external
factors in the model to reflect the effect of control factors on human resources practices and
organisational performance. This study has included organisational age, size and union intensity
as control factors.
5.3 SUMMARY AND DISCUSSION OF KEY FINDINGS
The study research objectives aimed at ensuring that the measurement scales used to assess the
relationships were valid and internally reliable. This helped to ensure that the best statistical
results are attained when further analyses were done. Dimensionality and factorial validity were
assessed using exploratory factor analysis (EFA). Confirmatory factor analysis was performed to
assess whether the measurement and the overall structural model displayed acceptable model fit.
The key findings are discussed in the following section.
5.3.1 The effect of organisational age, size and union intensity on HRM practices and
organisational performance
The first objective was to investigate the effect of organisational age, size and union intensity on
HRM practices and Organisational performance. Hierarchical multiple regression was used to
investigate the effect. Findings revealed that union intensity had an additional 4.4% of variance
on HRM practices and an additional 0.7% of variance on organisational performance when
organisational age and size are statistically controlled. The results show that union intensity has a
more significant contribution to HRM practices than organisational performance. This is
explained by the fact that unions play a critical role in accepting, promoting or rejecting certain
HRM practices. The finding is consistent with Katuo (2012) who found insignificant effect of
organisational age and size on HRM practices and organisational performance.

178 | P a g e
On how well each of the three variables contributed to HRM practices and organisational
performance; Organisational age had positive beta values (.042) and (.026) interacting effect
with HRM practices and organisational performance respectively. Organisational size and union
intensity had negative beta values (-.066 & -.044 and -.233 & -.092) interacting effect with HRM
practices and organisational performance respectively. This shows that organisation age is the
greatest predictor of HRM practices and organisational performance. Age of the firm is very
critical for the firm in adopting HRM practices. When the firm gets older it becomes more
conversant with HRM practices and their effect towards management of its staff. Better
management of staff would result in better organisational performance. It is for this reason that
the study chose firms that are three years old or more as they would have well established HRM
practices that would positively affect organisational performance.
5.3.2 Do HRM practices affect organisational performance?
The second objective was to investigate the effect of HRM practices on organisational
performance in the agricultural manufacturing sector in Malawi. This relationship was
investigated as both a direct and indirect linkage (through mediation variables of employee
attitudes and behaviours) between HRM practices and organisational performance. The study
findings provide an affirmative response to the question as discussed in the subsequent sections.
5.3.2.1 The direct link
In the direct linkage; HRM practices and organisational performance relationship was
investigated. The results show a direct, significant positive effect of HRM practices on
organisational performance (1.77, P=0001). This finding is consistent with Boselie et al. (2005)
who found that HRM policies have a direct linkage with organisational performance. The results
support hypothesis 5 which states that there is a positive relationship between HRM practices
and organisational performance. The results reveal a number of interesting results.
With respect to HRM practices, performance appraisal (.74 x1.77=1.31), compensation (.71 x
1.77=1.26) and training and development (.68 x 1.77=1.20) had the greatest direct positive effect

179 | P a g e
on organisational performance. Similarly, performance appraisal was the dominant indicator of
HRM practices where one-unit increase of performance appraisal causes .74 unit increases in
HRM practices. Additionally, the improvement of organisational performance depends much
more heavily on HRM practices pursued by the organisation (total standardised effect =1.77,
P=0001) compared to the extent of business strategy adopted (total standardised effect 0.70 x
1.77=0.57). This finding is different from Katuo (2012) who found organisational performance
to be heavily dependent on business strategy than HRM practices. Although business strategy is
the initial driver of organisational performance; but HRM practices constitute the daily
operational details that directly affect organisational performance. It is surprising that
compensation appeared to have the least effect on HRM practices.
These results are consistent with previous research. A positive relationship between human
resource practices and manufacturing firm performance has been demonstrated before (Katuo,
2008; Katuo & Budhwar, 2010; Katuo, 2012).The results also show that business strategy has a
direct positive relationship with HRM practices confirming hypothesis 1. These results suggest
that Business strategies are followed by human resource management practices in determining
organisational performance (Katuo & Budhwar 2010). This study therefore supports the
contingency perspective represented by the link between business strategy and human resource
management practices in the model.
With regard to the contingency perspective, results show that agricultural manufacturing firms
put more emphasis on cost leadership and innovation (improvement of service and goods). This
is because firms believe it is hard to compete with imported goods which are cheaper and as a
result they try to gain competitive advantage through innovation and cost leadership (make
products at the cheapest cost). In this regard, agricultural manufacturing firms put more emphasis
on performance appraisal and compensation in order to attract employees’ commitment and
satisfaction.
5.3.2.2 The indirect link (mediation)
The other linkage between HRM practices and organisational performance is where employee
attitudes and behaviours mediated linkage through hypotheses 2, 3 and 4.

180 | P a g e
In terms of hypothesis 2 the results show a direct and positive effect (0.81, P=0001.) of HRM
practices on employee attitudes through employee satisfaction and commitment as antecedents of
employee attitudes. This finding supports hypothesis 2. Furthermore; all HRM practices
indicators show a positive effect on improving employee attitudes with performance appraisal
having the dominant effect. Recruitment and selection has the least effect on HRM practices
(0.61) and indeed on improving employee satisfaction and commitment (0.49). This is explained
by the fact that recruitment and selection concerns individuals who are not working for the
organisation as yet while others (training & development, performance appraisal &
compensation) deal with individuals after they are employed (Gatewood, Feild & Barrick, 2010).
Similarly training and development has an effect on employee attitudes by enhancing employee
abilities, skills and knowledge. This helps to empower employees to perform better resulting in
improved organisational performance through shorter throughput time and quality products
(Brown et al; 2011). Thus, the study supports the philosophy of the resource-based view of the
firm where HRM practices directly impact on employee attitudes, which in turn affect employee
behaviour which subsequently affect organisational performance.(Perryer et al, 2010) HRM
practices motivate employees to be committed and satisfied with the organisation. This in turn
makes employees stay on with the firm (counter of turnover) and minimise opportunities of
absenteeism and disputes. Training helps to raise the value of human capital (resource based
view) and image of the firm and remain competitive. Risks and safety problems at work are
reduced due to training (Bitsch & Harsh, 2004). Training that focuses on occupational health and
safety aspects reduces workplace job-related injuries which helps to lower employee absenteeism
arising from injuries at work.
Performance appraisal is an important employee development tool. It guides an employee on the
path to corporate advancement. Employees get clear of what is expected of them as such
performance appraisal acts a motivation for an employee. Compensation influences employee
motivation, satisfaction and commitment to the firm. It results in reduced absenteeism and fewer
disputes. Low pay contributes to job dissatisfaction. In view of the largest standardized
coefficients, it is evident that performance appraisal (0.74) and compensation (0.71) are the
dominant HRM practices that improve employee satisfaction and commitment.
181 | P a g e
Hypothesis 2 supports the Resource Based view where through the HRM practices the firm
attempts to achieve competitive advantage by creating a pool of human resources that are rare,
valuable and difficult to imitate (Barney, 1991). HRM practices show a direct effect on employee
attitudes, which subsequently affect employee behaviours that in turn affect organisational
performance (Guest & Conway, 2004; Perryer et al. 2010).
In terms of hypothesis 3 the results show that employee attitudes have a negative direct effect on
employee behaviour (-0.12, P=0001). Attitudes especially job satisfaction and organisational
commitment, are strong drivers of employee behaviour (Messersmith, Patel & Lepak, 2011).
When employees are not happy with some of HRM practices followed by the firm; they tend to
be dissatisfied which results into high levels of absenteeism and disputes (Shammot, 2014).
When employee fear losing their jobs due to poor economy they tend to lose trust with
management and argue more with management to have a pay rise in order to offset the effect of
inflation. Employees may absent themselves in order to go and look for alternative sources of
extra money.
In terms of hypothesis 4, results show that employee behaviour (absenteeism and disputes) have
a direct negative effect on organisational performance. Worker absenteeism and disputes
negatively cost the organisation in terms of productivity and profits. An organisation cannot
afford to manufacture a product in the shortest time (throughput) and make quality products
when employee absenteeism and disputes are putting a huge financial burden on it (Duggan,
2011). Assembly lines of agricultural manufacturing firms work better when every employee is
present. Absenteeism and disputes are very critical in the manufacturing assembly line because
of the value of the individual employee specialisations on the assembly line that cannot easily be
replaced. When an employee is absent management must scramble to find a replacement that is
not usually as proficient as the absent employee. This reduces quality of the product and
throughput time.
Hypotheses 3 and 4 support the AMO theory where the firm gives employees the ability,
motivation and opportunity to exercise their skills. According to Jiang et al. (2013) when
abilities, motivation and opportunities of employees are positively influenced by employee
perceived positive HRM practices; employees’ behaviour and performance is enhanced. This

182 | P a g e
means that if an organisation wants to improve its performance; it must develop and implement
good HRM practices (recruitment & selection; training & development; performance appraisal;
and compensation) that will positively shape employee behaviour (Boxall & Purcell, 2003;
Lepack et al. 2006). HRM outcomes like employee attitudes (satisfaction & commitment) and
employee behaviour (absenteeism & disputes) mediate the relationship between HRM practices
and organisational performance. In order to improve organisational performance, levels of
employee satisfaction and commitment must be enhanced; and employee absenteeism and
disputes must be reduced.
According to AMO theory; organisational interests are served better when there is a system that
pays attention to employees’ ability, motivation and opportunity (Jiang et al. 2013). Firms should
therefore attempt to firstly increase employees’ ability i.e. the knowledge and skills to do the job;
secondly motivate employees through internal and external rewards, balance between work and
life, performance reviews, feedback and career development; and thirdly provide opportunities
for employees to contribute to the firm.
These results of the mediated link depict both positive (H2) and negative significant relationships
(H3, H4) between HRM practices and organisational performance through employee attitudes
and behaviours. The mediated link yields -0.76 beta value which is lower than that of the direct
link (1.77) in hypothesis 5. This means that the effect of HRM practices on organisational
performance is better when unmediated (H5) unlike when mediated (H2, H3, and H4). This is
contrary to Katuo (2012) who found that the mediated link was better than the direct link in the
Greek context. However the study findings support the basic equation in the HRM practices and
performance relationship which states that HRM practices directly affect performance (Boselie et
al. 2005) In view of both a direct link and an indirect link existing between HRM practices and
organisational performance; it is concluded that employee attitudes and employee behaviour
partially mediate the relationship between HRM practices and organisational performance
(Baron & Kenny, 1986; Katuo, 2008). This may imply that HRM practices used in the
agricultural manufacturing sector do not promote good employee attitudes to positively affect
organisational performance. This implies that organisational manufacturing firms focus more on

183 | P a g e
productivity and less on the staff welfare. The mediated linkage is supposed to be the best
because it takes into consideration the human side of enterprise..
Furthermore, the results show that employee attitudes (satisfaction & commitment) and
employee behaviours (absenteeism & disputes) partially mediate the relationship between HRM
practices and organisational performance (Baron & Kenny, 1986). It can therefore be concluded
that both a direct and indirect link exists between HRM practices and organisational performance
(Huselid, 1995). This finding supports the notion that HRM practices affect organisational
performance through creation of a skilled workforce with appropriate attitudes and behaviours
(Delery, 1996; Guest, 2001 & Boselie et al. 2001). The study shows that this chain holds in
agricultural manufacturing firms as it holds in other firms. However, the results show that
employee attitudes and behaviour do not play well the role of mediators.
5.3.3 Is the reverse causality stronger than forward causality?
The third objective was to find out if reverse causality exists between organizational
performance and employee behaviour. Prowse and Prowse (2010) argue that reverse causality is
a critical issue that must be investigated. Regarding forward causality, the study revealed
existence of this as shown in the earlier discussion. The study found that the forward causality of
HRM practices on organisational performance is contingent on business strategies and that it is
better unmediated (yielding 1.77 beta value) than mediated(yielding -0.76 beta value).
Examining the effect of employee behaviour on organisational performance (forward causality)
results showed that a unit increase in employee behaviour (i.e. increase in absenteeism and
disputes) reduces organisational performance by -1.45. Reducing organisational performance has
a negative effect. With regard to reverse causality, the study found that a unit increase in
organisational performance positively influences employee behaviour (1.18) i.e. it increases
incidents of absenteeism and disputes, thus rejecting H6. The total standardized effect is much
higher computed to be equal to 1.18 (standard error=0.07, exact significance level=0.001),
implying that in Malawi agricultural manufacturing firms increasing organisational performance
increases employee behaviour (absenteeism and disputes). The finding is strange because
normally good organisational performance would result into good employee behaviour in

184 | P a g e
increased presence (counterpart of absenteeism) and industrial peace (counterpart of disputes) as
argued by Katuo and Budhwar (2010).However, the result of good organisational performance
increasing employee absenteeism and disputes is explained by the expectations that employees
have regarding the good organisational performance. It is organisational performance that leads
to high employee absenteeism and disputes (employee behaviour) and therefore organisational
performance has a negative effect (increased absenteeism and disputes).
To prove reverse causality, the negative effect of employee behaviour on organisational
behaviour (H4) should also be demonstrated as the negative effect of organisational performance
on employee behaviour (H6) in the reverse. This would answer the question as to which
construct negatively affects the other more. It must be understood that the employee behaviours
being used in this study are negative behaviours (absenteeism and disputes); so it is either we
increase these behaviours (negative) or we reduce them (positive). Increased organisational
behaviour leading to increasing employee absenteeism and attitudes maybe explained by the
expectations employees have as advanced by the expectancy theory Adams, 1965; Walster,
Berscheid, & Walster, 1973) that employees have because of increased performance. It is
important to note that the nature of the employee behaviours used in the study can have a
negative effect (when they increase) as well as a positive effect (when they decrease). .
From this study reverse causality has been proven because organisational performance increase
affects increase in employee absenteeism and disputes. Increased absenteeism and disputes are
not positive attributes about employee behaviour; they are negatives attributes. From this study,
forward causality (beta -1.45 with regression coefficient -1.448) compared with reverse causality
(beta 1.77 with regression coefficient 1.182). This is supported by the regression analysis results
which showed that a one unit increase in organisational performance resulted in 1.182 increase in
employee behaviour (absenteeism and disputes). This finding is inconsistent with Katuo (2012)
and Katuo and Budhwar (2010) who found a direct and positive relationship of the reverse
causality. It is clear from this comparison that it is organisational performance that affects
employee behaviour more than employee behaviour affecting organisational performance.
Organisational performance affects employee behaviour more than employee behaviour affecting

185 | P a g e
organisational because employee behaviour (absenteeism and disputes) are incidents of
absenteeism only affect a few individuals while disputes rarely occur in a month or year in the
organisations. Organisational performance is a continuous concern for the firm every month and
year. The study found that only 36% of the firms studied in agricultural manufacturing are
unionised. This means that most of the employees can not benefit from the collective bargaining
that unionism accords an employee as such individual mechanisms (absenteeism and disputes) of
dealing with unmet expectations take centre stage.
Unlike Katuo (2012) who used efficiency, effectiveness, development and stakeholders’
satisfaction; these indicators are distal to organisational performance. They do not directly relate
to employee behaviour. These indicators may come about due to machinery that the firm is using
which can be automated leaving out the human aspect in the formula. Similarly, Wright et al.
(2003) argue that financial performance lies at the distant end of the causal chain, and that
outcome measures that are more closely linked to HRM might be more appropriate to consider.
This is consistent with literature of the measures that have been reported like labour turnover,
aspects of productivity (David, 2003). It is for these reasons that this study used a range of
proximal than distal measures and examine how HR practices relate to each of these
organisational performance indicators.
Short throughput time refers to the ability to make a quality product with the shortest time. This
can be achieved through efficient operations, process technology and/or scale economies
(Vickery et al. 1997). Throughput time and quality products are performance indicators which
are directly and negatively affected by employee behaviours like absenteeism and disputes. They
are proximal factors which in turn feed into distal performance indicators like profits (Wright et
al. 2003). When a firm makes quality products; this translates into more sales at premium prices
thereby earning more profits. Likewise, when it takes the shortest time (throughput) to make its
product; the firm becomes more efficient by using fewer resources (cost efficient) thereby
earning more profits. A firm that is making more profits can be viewed as a going concern.
Employees expect that the firm can afford to effect pay increases and thereby reduce incidences
of disputes and absenteeism of its staff. In the event that no pay rise is effected; employee
186 | P a g e
disputes arise. This shows how increasing organisational performance can increase employee
behaviour (absenteeism and disputes). Increase in absenteeism and disputes are obviously a
negative effect of organisational performance on employee behaviour. This further shows that in
the HRM practices and organisational performance relationship; reverse causality is stronger
than forward causality of employee behaviour. It may be concluded from this finding that
organisations that are performing better in their manufacturing have the ability to retain their
employees. Consistent with the general systems theory, the results suggest that organisational
performance, as an output of the HRM practices and organisational performance relationship;
has direct positive and significant influence on employee behaviour. Throughput and quality
helps the firm to earn higher profits. With high profits, employees expect the firm to attend to
union demands like better conditions of service ( better health service, family friendly facilities,
thirteenth cheque etc) which result in positive employee behaviours such as presence
(counterpart of absenteeism) and industrial peace (counterpart of disputes) (Katuo & Budhwar,
2010). This study therefore supports the general systems theory represented by the relationship
between organisational performance and employee behaviour.
5.3.4 Does organisational performance motivate employee behaviour?
The current study had set out to investigate the reversed causality of organisational performance
and employee behaviour. The study hypothesized that there is a negative relationship between
organisational performance and employee behaviour i.e. a unit increase in organisational
behaviour reduces incidents of absenteeism and disputes. This would be of a positive
development with positive effect. The hypothesis (H6) suggests that improvement in
organisational performance (improved throughput and quality) leads to deterioration of employee
behaviour (absenteeism and disputes). While it was hypothesized that employee behaviour
negatively affects organisational performance (-1.45); the study showed that it is organisational
performance that negatively affects employee behaviour by increasing employee absenteeism
and disputes (1.18). The results of the reversed causality did not support the hypothesis as the
result was in the opposite direction (positive) to the direction expected (negative). This implies
that if organisational performance increases disputes and absenteeism will go up. Absenteeism
will go up because the employees will be stressed up and fatigued due to more work or more
hours of work in order to increase productivity. Improved throughput may attract more and
187 | P a g e
higher productivity. Improved quality will mean paying more attention to manufacturing
standards. Improved throughput time and quality translates into more distal performance
indicators of efficiency and profitability. The hypothesis was investigated by means of SEM
analysis and the resulting model was found to be a good fit to the sample data. Control variables
paths (firm age, size and union intensity) were specified with all the variables having a
significant relationship with their counterparts. This is explained by motivational theories.
Instead of only looking at HRM practices being the motivators of employee behaviour; the study
shows that the performance of the firm can motivate negative employee behaviours.
Employees feel a legitimate expectation that their work life will improve as they expect better
compensation from the organisation based on improved manufacturing throughput and quality of
the organisation. Improved throughput time would mean less staff required to manage the
manufacturing flow of work because some sections are mechanized or indeed some stages of the
manufacturing process removed from the system. De Lange et al (2004) argue that fatigued
employees, due to more work aimed at making maximum use of the short throughput time and
the need for more quality products, would translate into more absenteeism from employees.
Employees would, perceive their work environment more negatively. Fatigue may negatively
affect employees’ health which would in turn make them absent from work and raise a number
of demands for better conditions of employment with the employer. The study therefore has
proven that organisational performance motivates and promotes these negative employee
behaviours (absenteeism and disputes).
The study further found that organisational performance is negatively affected by disputes (0.82x
-1.45=0.73) more as compared to absenteeism (0.72 x -1.45=-0.62). This result is consistent with
the regression analysis which found that a one unit increase in employee behaviour (absenteeism
and disputes) resulted in a -1.448 unit decrease in organisational performance. This is explained
by the fact that absenteeism can involve only very few employees of the organisation unlike
disputes (strikes) which involve almost all the employees. This translates into great losses due
low productivity. Managers should therefore try to avoid incidents of employee disputes by
implementing good HRM practices that will create good employee attitudes that will in turn lead

188 | P a g e
to good employee behaviours. Results show that increasing manufacturing throughput (0.87)
would drive employee absenteeism and disputes more than increasing quality products (0.85).
Although literature talks about total quality management (TQM) employees in the agricultural
manufacturing are more concerned with the actual manufacturing process line which they are in
control of. Issues of quality assurance could be in the realm of some other staff. Managers should
pay particular attention to manufacturing through put as this increases incidents of employee
absenteeism and disputes because of the stress associated with it.
It is important to note that the effect of organisational performance on employee behaviour is
also affected by the age of the firm. This study targeted medium to large firms employing about
25 and above employees. Organisations of this size have more employees and have enough
manufacturing equipment. It is therefore expected that employees from these firms are better
informed of what is expected as their benefit when the firm performs better. Organisations under
study had gone past the formation or initial stage where organisational performance levels are
merely acceptable. In the subsequent stages of the organisation cycle; adaptive behaviour can be
expected to decline (Greve, 1998). This represents the stage where indeed organisational
performance affects employee behaviour.
The results show that organisational performance has a direct positive effect on employee
behaviour supporting the general systems theory where the output of the HRM-organisational
performance link has become input in influencing employee behaviour.
5.4 COMPETING REGRESSION ANALYSIS
Competing regression analysis showed that employee attitudes (satisfaction & commitment)
have a greater direct effect (.404) on organisational performance than the direct effect of
employee behaviour of .307 (absenteeism & disputes) on organisational performance. The total
effect of employee attitudes (.282) and employee behaviour (.251) on organisational
performance is .071. The total effect (.071) demonstrates that employee attitudes had the greatest
effect on organisational performance. This demonstrates how important employee attitudes are in
affecting organisational performance as compared to employee behaviour. This is so because
attitudes are internal to the individual and they take long time to develop. On the contrary,

189 | P a g e
behaviours are easy to detect, monitor and control. Many organisations have measures in place
that reward/reinforce good employee behaviour or punish bad employee behaviours at work but
have no similar measures that reward/reinforce good employee attitude or punish bad employee
attitudes. This shows how employee attitudes are generally overlooked at work
5.5 CONTROL VARIABLES
Meaningful control variables were used in the study in order to show the effect of contextual
variables on the relationship between HRM practices and organisational performance. However,
this study could not exhaust all of these factors.
Organisational age and size do not seem to be closely related. A positive relationship is found for
recruitment and selection with organisational age. This finding is consistent with Katuo (2012),
who investigated the outcomes of recruitment and selection practices. From four different
outcome indicators, firm age is related to one of these four. Delery and Doty (1996) included
firm age as one of the control variables and found it to be correlated to three of the seven human
resource practices.
5.6 CONCLUSIONS
Employee behaviour is very critical in achieving organisational goals. Employee behaviour has
been looked at as only having forward causality effects on organisational performance and not
that employee behaviour can be influenced by organisational performance in a reverse causality.
This investigation of whether organisational performance affects employee behaviour is critical.
Past research provides sufficient evidence that HRM practices and/or policies have a direct and
positive relationship with organisational performance (Katuo, 2010, 2012; Tsai et al. 2011). Past
research also demonstrates that organisational performance has a positive and significant reverse
causality on HRM practices (Katuo, 2012) but also on employee behaviour mediated by HRM
practices (Tsai et al. 2011) However; past research neglected the reverse causality of
organisational performance on employee behaviour. In this study, organisational performance is
hypothesised to negatively affect employee behaviour.

190 | P a g e
This is a significant contribution to the field of HRM and agricultural manufacturing and
agricultural production in Malawi. The study reveals that if employees are absenting themselves
and there are a lot of work place disputes; it is likely that they are not quite satisfied with their
jobs and committed to the organisation (Messersmith et al. 2011). This lack of satisfaction and
commitment is most likely as a result of bad HRM practices or systems. Managers should
therefore stop blaming employees for poor organisational performance but rather fix their HRM
practices, policies and systems to improve employee attitudes, behaviours and organisational
performance. Improved organisational performance will in turn motivate employees’ behaviour
of presence (counterpart of absence) and industrial peace (counterpart of disputes) (Katuo et al.
2008).
While not much is known about HRM practices in agriculture in Malawi and in the agricultural
manufacturing sector; the sector makes a significant contribution to the Malawi economy in
terms of labour, food security and national income. By demonstrating this positive relationship;
the study provides the foundation upon which future research can be built to further our
understanding of the relationship between organisational performance and employee behaviour
in other agricultural sectors like agricultural production and how it works. Further research
would investigate whether the relationship between organisational performance and employee
behaviour can be mediated. This will help to unlock the “black box” explaining what goes on
between organisational performance and employee behaviour in the Malawi agricultural
manufacturing sector.
5.7 CONTRIBUTIONS OF THE STUDY
5.7.1 Theoretical contribution
The study contributes to literature in several ways. Firstly, by investigating the relationship
between HRM practices and organisational performance, it contributes to both the HRM and
organisational performance literature. Secondly, by investigating the reverse causality of
organisational performance, it contributes to employee behaviour literature.
Secondly, the findings of this study will assist managers in their understanding of the manner in
which HRM practices influence employee attitudes and behaviours in order to help organisations
191 | P a g e
achieve their goals (Schuler & Jackson, 1987). Thirdly, the study shows in ranking order the
importance of the HRM practices used in the study as (1) Performance appraisal, (2)
compensation, (3) training & development and (4) recruitment & selection. This shows the
important HRM practices that can constitute an HRM strategy. Lastly, another contribution of
this study is the inclusion a non-traditional HRM theory of General Systems Theory. This study
provided a rationale to offer a theory to explain the causal mechanisms and processes in the
model. Katuo (2012) found that it is highly performing firms that can afford HRM policies.
Similarly Tsai et al. (2011) found that high performing firms affect employee attitudes mediated
by HRM practices. These reverse causality studies did not highlight a theory to back their
proposed enquiry of the reverse causality. Furthermore, these studies did not explain how reverse
causality is caused. This is the value the current study adds to literature. This theory has added
value to HRM literature by explaining how organisational performance becomes an input into
employee behaviour (reverse causality).
Finally with regard to theory; the study findings support all theoretical backgrounds supporting
the study. However, the study shows a shortfall of the general systems theory as the theory does
not clearly show whether the output (dependent variable) when it becomes the input
(independent variable) would positively or negatively affect the other variable.
5.7.2 Managerial Contribution.
While appreciating the importance of all the other constructs of business strategy, human
resource management practices and employee attitudes; employee behaviour is the most critical
factor affecting organisational performance. The findings of this study will help HRM
practitioners to design HRM practices that improve organisational performance in Malawi’s
agricultural manufacturing sector by focussing on firm performance as a driver for employee
behaviour.
On the overall, the outcome of the proposed study advances our current knowledge on HRM by
testing theory and offering new empirical evidence to explain the interactions between HRM
practices and organisational performance and how they affect the performance of agricultural

192 | P a g e
manufacturing sector in Malawi. It is important to recognise that empirical evidence from this
country is new and therefore represents an important contribution to existing body of knowledge.
The study gives insight on the management of employees in general. It provides insight for
managers on how employee behaviour relates with organisational performance. Firstly, HRM
practices positively affect employee attitudes which affect employee behaviour that in turn affect
organisational performance. Managers, policy makers and academicians should find ways to
positively affect employee attitudes. Negative employee behaviour negatively affects
organisational performance; managers should therefore find ways of avoiding negative employee
behaviours. Consistent with contingency theory, the study has shown that business strategies and
HRM practices are not mutually independent; consequently firms should develop and implement
HRM practices that are contingent on business strategies that they pursue. Organisations should
therefore ensure that they have HRM departments that have a voice on the board
The performance of an organisation heavily depends on the level employee attitudes (satisfaction
and commitment) and employee behaviours (absenteeism and disputes). Organisations
undertaking to develop and implement HRM practices and business strategies; should focus on
improving these employee attitudes and behaviours. Performance appraisal, compensation,
training & development and recruitment & selection, may constitute in that descending order the
important aspects of HRM strategy.
When implementing or choosing business strategy, HRM practices and indicators of
organisational performance; managers should take into account employee perceptions about the
choices because employees’ perceptions are different from those of managers. Managers and
employees have different perceptions about the importance and aspects of business strategy,
HRM practices, employee attitudes, employee behaviour and organisational performance. They
therefore attach different importance to different aspects of these factors.
Cost leadership and innovation may constitute the most important aspects of a business strategy.
Employee absenteeism and disputes may constitute the most important aspects of employee
behaviour negatively affecting organisational performance. Cost reduction and throughput time
may constitute the most important aspects of organisational performance. These implications

193 | P a g e
point at how managers, policy makers can enhance higher organisational performance and
improve employee behaviours at work.
The study contributes to management literature as it adds the much needed empirical evidence in
investigating the role of organisational performance as an independent variable and not a
dependent variable as most research has done.. Secondly that the sector, firm age, size and union
intensity in which an organisation operates presents an important contextual variable. While past
research has only investigated organisational performance and HRM practices; this study
provides new insights into the casual complexities surrounding employee behaviour and
organisational performance. The study provides insights into the relationship between
organisational performance and employee behaviour in Malawi. Managers must therefore
endeavour to find ways of making organisational performance a motivator of positive employee
behaviours.
People behave according to the perceptions they hold. Employees hold different perceptions
about how the organisation is performing. Managers may think organisational performance is
irrelevant to an employee. What is important is the employees’ input in productivity. But the real
issue is how the employee perceives that organisational performance. What employees get as a
reward like bonuses for promoting good organisational performance may bring in inequalities
which will lead to discontent resulting into absenteeism and disputes. This is consistent with
equity theory (Adams, 1965; Carell, 1978; Walster et al. 1973). Managers need to make sure that
any negative effects arising out performance based payments are minimised or avoided.
Performance based rewards perceived as inequitable may create absenteeism and disputes. Good
managers anticipate these negative perceptions about rewards for performance. As such they
should not let inequities get out of hand but carefully communicate the intended value of the
performance rewards to be given and clarify the basis on which the rewards were made
(performance appraisal).
When employees put in effort in organisational performance; they have an expectation. When
employees have high levels of expectation from the good organisation performance they have
contribute to; they expect to be rewarded attractively. If not then employees are demotivated and
194 | P a g e
display bad behaviours like absenteeism and disputes. Managers must therefore strengthen
employees’ perceptions of their efforts in boosting organisational performance by assuring them
that their efforts are possible and worthwhile. Clarify what is expected in return of their
enhancing good organisational performance, tie performance to rewards and ensure that rewards
are desirable. Managers must realise that failure to reward can modify employee behaviour.
Employees who believe that they deserve a reward for good organisational performance and they
do not get it will become disenchanted with their manager and organisation and consequently
absent themselves or engage in conflicts with employer or fellow employees.
Employees need feedback from managers about the good performance the firm is enjoying.
When employees get feedback of their individual contribution to the good organisational
performance it influences motivated behaviour and the opposite is true. Managers should try to
motivate employees and tell what they are doing right and what they are doing wrong. In trying
to attain good organisational performance; managers must tell individuals what they can do to
receive positive reinforcement. Rewards must be provided as closely as possible to the
occurrence of good organisational performance.
5.9 LIMITATIONS OF THE STUDY AND SUGGESTIONS FOR FUTURE RESEARCH
Limitations of this study are highlighted and how they might be addressed in future research. The
first limitation is that perceptual measures of performance (subjective measures) were collected.
Research indicates that perceptual measures are more appropriate where objective measures are
not available. However, objective measures like financial indicators (profitability) have been
blamed of not reflecting a true picture of the firm performance. Furthermore, these financial
indicators are distal; (distant) measures after the HRM outcomes. However, this study could have
been strengthened with use of more objective measures (Wall et al. 2004).
Secondly, the study used a limited number of alternative performance indicators. Previous
research has demonstrated the important role that leadership style, organisational and
environmental attributes play (Baum, Locke & Smith, 2001). While components of these were
used in the current study like business strategy, firm size, age and union intensity; not all the

195 | P a g e
variables could be included in the study. Other possible variables like leadership behaviours,
leader personality, organisational culture, other environmental attributes and other measures of
business level strategy could have been used that also contribute to organisational performance.
If future research can include these variables; the argument that HRM practices positively affect
organisational performance will be strengthened further.
Another limitation of the study was that data on organisational performance was collected from
employees and managers requiring them to compare with competitors. Furthermore; they were
required to recall how the firm performed the past three years. This was a limitation because of
memory lapse for employees who are not very much concerned with firm performance. Future
research could address this by targeting managers and supervisory level employees who are close
to organisational performance records and indicators. This level of employees has access to
annual reports of the firm.
Similarly, sample size is another limitation of the study. While a sample size of 385 respondents
(308 employees and 77 managers) is sufficient; it limited performance of additional analysis
around the effects of specific products, specific firm sizes, and specific business level strategies
employed by organisations in the sample. In particular, the sample size for managers (77) did not
permit further analyses. Future research should increase the sample size to allow for additional
analyses. The study used snowball sampling for managers to identify employees to be targeted in
their respective departments. This is a weaker method. It is recommended that a better and robust
methodology could be used
Lastly is a methodological limitation as this study used cross-sectional data. In view of the
reversed causality that the study investigated; cross-sectional data is not considered to be
sufficient to test reverse causality because it does not have time lags but rather longitudinal data.
Future research should consider using longitudinal data in order to build in time lags.

196 | P a g e
5.10 SUMMARY
The study showed significant relationships between HRM practices and organisational
performance and the relationship between organisational performance and employee behaviour.
The results make a significant contribution to literature by providing insights into the strengths
and direction of the relationships among the latent variables that were studied. Practically it
provides useful managerial insights on possible interventions to create and promote a workforce
that is committed and satisfied.
197 | P a g e
REFERENCES
Abdullah, R.B., Abdul K. N., Abdul P, M., Zahari, H., Nair, S., & Jussoff, K. (2009). The
linkage of employee satisfaction and loyalty in hotel industry in Klang valley, Malaysia.
International Journal of Business and Management, 4 (100) 152-160.
Ahmad, S., & Schroeder, R. G. (2003). The impact of human resource management practices on
operational performance: recognizing country and industry differences. Journal of Operations
Management, 21(1), 19-43.
Akhtar, S., Ding, D. Z., & Ge, G. L. (2008). Strategic HRM practices and their impact on
company performance in Chinese enterprises. Journal of Human Resource Management, 47(1),
15-32.
Aladwan, K., Ramudu, B., & Fish, A. (2011). Integrating Western HRM practices in Jordanian
organisations. Paper presented at Challenges for International Business in a Turbulent Global
Environment Conference, April 28–30, Melbourne, Australia.
Alas, R., Kaarelson, T., & Niglas, K. (2008). Human Resource Management in Cultural Context:
Empirical Study of 11 Countries. EBS Review, (24).
Alsabbah, M. Y., & Ibrahim, H. (2014). HRM practices and Employee competence. A General
System Perspective. London: McGraw-Hill.
Amin, M., Wan Ismail, W., Rashid, S., Selemani R.D., (2014). The impact of human resource
management practices on performance: Evidence from a Public University, The TQM Journal,
26 (2), 125 – 142.
Appelbaum, E., Bailey, T., Berg, P., & Kalleberg, A. (2000). Manufacturing competitive
advantage: The effects of high performance work systems on plant performance and company
outcomes. Manufacturing advantage: Why high-performance work systems pay off. New York:
Cornell University Press.
Arain, M., Campbell, M.J., Cooper, C.L., & Lancaster, G.A. (2011). What is a pilot or feasibility
study? A review of current practice and editorial policy. BMC Medical Research
Methodology, 10 (67), 1471-2288.
Armstrong, M. (2012). Handbook of Human Resource Management Practice, 12th
Ed. London:
Kogan Page.

198 | P a g e
Armstrong, M., & Taylor, S. (2014). Armstrong's handbook of human resource management
practice. London: Kogan Page Publishers.
Arthur, J. (1994). Effects of human resource systems on manufacturing performance and
turnover. Academy of Management Journal, 37(3), 670-687.
Atteya, N. M. (2012). Testing the impact of the human resource management practices on job
performance: An empirical study in the Egyptian joint venture petroleum companies.
International Journal of Business and Social Science, 3(9).
Babbie, E., & Mouton, J. (2001). The practice of social science research. Belmont, CA:
Wadsworth.
Babbie, E., & Mouton, J. (2006). The Practice of Social Research. Cape Town: Oxford
University Press Southern Africa.
Bae, J., & Lawler, J. J. (2000). Organizational and HRM strategies in Korea: Impact on firm
performance in an emerging economy. Academy of management journal, 43(3), 502-517.
Baird, L., & Meshoulam, I. (1988). Managing two fits of strategic human resource management,
Academy of Management Review, 13(1), 116-128.
Bakuwa, R. C. (2011). An analysis of factors hindering the adoption of HIV/AIDS workplace
policies: The case of private sector companies in Malawi. African Journal of Business
Management, 5(4), 1076.
Barney, J. B. (2001). Resource-based theories of competitive advantage: A ten-year retrospective
on the resource-based view. Journal of Management, 27(6), 643-650.
Barney, J. (1991). Firm resources and sustainable competitive advantage. Journal of
Management, 17(1), 99-120
Baron, R. M., & Kenny, D. A. (1986). The moderator–mediator variable distinction in social
psychological research: Conceptual, strategic, and statistical considerations. Journal of
Personality and Social Psychology, 51(6), 1173.
Batt, R. (2002). Managing customer services: Human Resource Practices, quit rates, and sales
growth. Academy of Management Journal, 32, 587-597.
Bharti, P. (2015). Impact of E-HRM System on Organizational Performance: A Case study on
Banking Sector. International Journal, 3(4), 732-734.
Bartlett, M. S. (1954). A note on the multiplying factors for various χ 2 approximations. Journal
of the Royal Statistical Society. Series B (Methodological), 296-298.

199 | P a g e
Bauer, T. N., Bodner, T., Erdogan, B., Truxillo, D. M., & Tucker, J.S. (2007). Newcomer
adjustment during organisational socialization: A meta-analytic review of antecedents, outcomes
and methods, Journal of Applied Psychology, 92, 707-721.
Baum, J. R., Locke, E. A., & Smith, K. G. (2001). A multidimensional model of venture
growth. Academy of Management Journal, 44(2), 292-303.
Bayo-Moriones, A., & de Cerio, J. M. D. (2002). Human resource management, strategy and
operational performance in the Spanish manufacturing industry. M@ n@ Gement, 5(3), 175-199.
Beer, M. (2015). HRM at a Crossroads: Comments on the Evolution of Strategic HRM through
two founding books: A 30th
Anniversary perspective on development of the field. Journal of
Human Resource Management, 54(3), 417-421
Becker, B., & Gerhart, B. (1996). The impact of human resource management on organisational
performance: Progress and prospects. Academy of Management Journal, 39(40), 779-801.
Becker, B. E., Huselid, M. A., & Ulrich, D. (2001). The HR scorecard: Linking people, strategy,
and performance. Washington: Harvard Business Press.
Becker, B., & Gerhart, B. (1996). The impact of human resource management on organizational
performance: Progress and prospects. Academy of Management Journal, 39(4), 779-801.
Becker, B., Huselid, M.A., Pickus, P.S., & Sparatt, M.F. (1997). HR as a source of stakeholder
value: Research and recommendations. Human Resource Management Journal, 36(10), 39-47.
Becker, M. C. (2001). Managing dispersed knowledge: organizational problems, managerial
strategies, and their effectiveness. Journal of Management Studies, 38(7), 1037-1051.
Berg, I., & Kalleberg, A. L. (Eds.). (2012). Sourcebook of labor markets: Evolving structures
and processes. London: Springer Science & Business Media.
Bharti, P. (2015). Impact of E-HRM System on Organizational Performance: A Case study on
Banking Sector. International Journal, 3(4), 732-734.
Bhattacherjee, A. (2012). Social Science Research: Principles, Methods and Practices.
Textbooks collection. Florida: University of South Florida. Scholar Commons
Bitsch, V., & Harsh, S. B. (2004). Labour risk attributes in the green industry: Business owners'
and managers' perspectives. Journal of Agricultural and Applied Economics, 36(3), 731-745.
Bjorkman, I., & Lu, Y. (2001). Institutionalization and bargaining power explanations of HRM
practices in international joint ventures. The case of Chinese-Western joint ventures.
Organization Studies, 22(3), 491-512.

200 | P a g e
Björkman, I., Ehrnrooth, M., Smale, A., & John, S. (2011). The determinants of line
management internalisation of HRM practices in MNC subsidiaries. The International Journal of
Human Resource Management, 22(8), 1654-1671.
Bohlander, G., & Snell, S. (2007), Managing Human Resources, 14th ed., Ohio: Thomson
Higher Education, Mason.
Boselie, J. P., Dietz, G., & Boon, C. (2005). Commonalities and Contradictions in research on
human resource management and performance. Human Resource Management Journal, 15(30,
67-94.
Boselie, P., Paauwe, J., & Jansen, P. (2001). Human resource management and performance:
lessons from the Netherlands. International Journal of Human Resource Management, 12(7),
1107-1125.
Boselie, P., & van der Wiele, T. (2002). Employee perceptions of HRM and TQM, and the
effects on satisfaction and intention to leave. Managing Service Quality: An International
Journal, 12(3), 165-172.
Boselie, P. (2010). High performance work practices in the health care sector: a Dutch case
study. International Journal of Manpower, 31(1), 42-58.
Bowen, D. E., & Ostroff, C. (2004). Understanding HRM–firm performance linkages: The role
of the “strength” of the HRM system. Academy of Management Review, 29(2), 203-221.
Boxall, P., & Purcell, J. (2000). Strategic human resource management: where have we come
from and where should we be going? International Journal of Management Reviews. 2(2), 183-
203.
Boxall, P., & Steeneveld, M. (1999). Human resource strategy and competitive advantage: A
longitudinal study of engineering consultancies. Journal of Management Studies, 36(4), 443-463.
Brannen, J. (Ed.). (2017). Mixing methods: Qualitative and quantitative research. London:
Routledge.
Bro, R., & Smilde, A. K. (2014). Principal component analysis. Analytical Methods, 6(9), 2812-
2831.
Brewer, J. (2000). Ethnography. London: McGraw-Hill Education (UK).
Brewster, C; Houldsworth, E; Sparrow, P; & Vernon, G. (2016). International Human Resource
Management, London: Kogan page Publishers.

201 | P a g e
Brewster, C. (1999). SHRM: The value of different paradigms. Management International
Review, October, 45-64.
Brown, K. G., & Sitzmann, T. (2011). Training and employee development for improved
performance. APA handbook of Industrial and Organizational Psychology, 2, 469-503.
Brubaker, D., Noble, C., Fincher, R., Park, S. K. Y., & Press, S. (2014). Conflict resolution in the
workplace: What will the future bring?. Conflict Resolution Quarterly, 31(4), 357-386.
Bryman, A., & Bell, E. (2011). Business research methods (3rd
Ed.). Oxford, UK: Oxford
University Press.
Bryman, A., & Bell. E. (2016). Social Research Methods. Second Edition. Ontario: Oxford:
University Press.
Byars, L.L., & Rue, W.L. (2004). Human Resources Management, 7th Ed, New York, NY.
McGraw-Hill.
Byrne, B. M., & Van de Vijver, F. J. (2010). Testing for measurement and structural equivalence
in large-scale cross-cultural studies: Addressing the issue of nonequivalence. International
Journal of Testing, 10(2), 107-132.
Byrne, B. M. (2013). Structural equation modelling with Mplus: Basic concepts, applications,
and programming. New York: Routledge.
Byrne, B.M. (2010). Structural equation modelling with AMOS: basic concepts, applications,
and programming, New York: Routledge.
Buoziute-Rafanaviciene, S., Pundziene, A., & Turauskas, L. (2009). Relation between the
attributes of executive successor and organizational performance. Inzinerine Ekonomika-
Engineering Economics (2), 65-74.
Campbell, C.M. (1997). “The determinants of dismissals, quits and layoffs: a multinomial logit
approach”, Southern Economic Journal, 63(4), 1066-73.
Campbell, D. T., & Fiske, D. W. (1959). Convergent and discriminant validation by the
multitrait-multimethod matrix. Psychological bulletin, 56(2), 81.
Cattell, R. B. (1966). The scree test for the number of factors. Multivariate behavioural
research, 1(2), 245-276.
Chandler, G. N., & G. M. McEvoy, (2000). Human Resource Management, TQM, and Firm
Performance in Small and Medium- Size Enterprises, Entrepreneurship: Theory and Practice,
25(1), 43-58.

202 | P a g e
Chandrakumara, A., & Sparrow, P. (2004). Work orientation as an element of national culture
and its impact on HRM policy-practice design choices: Lessons from Sri Lanka. International
Journal of Manpower, 25(6), 564-589.
Chin, W.W. (1998). “Issues and opinions on structural equation modeling”, MIS Quarterly,
22(1), 7-16.
Chmiel, N., Fraccaroli, F., & Sverke, M. (Eds.). (2017). An Introduction to Work and
Organizational Psychology: An International Perspective. London: John Wiley & Sons.
Choi, N., Fuqua, D.R., & Griffin, B.W. (2001). 'Exploratory analysis of the structure of scores
from the multidimensional scales of perceived self-efficacy', Educational and Psychological
Measurement, 61(3), 475-89.
Chuang, C.H., & Liao, H.U.I. (2010). Strategic human resource management in service context:
taking care of business by taking care of employees and customers’. Personnel Psychology, 63
(1), 153–196.
Chuang, Chih-Hsun, Susan E. Jackson, and Yuan Jiang. (2016). "Can knowledge-intensive
teamwork be managed? Examining the roles of HRM systems, leadership, and tacit
knowledge." Journal of Management 42(2), 524-554.
Cohen, L., & Holliday, M. (1982). Statistics for social scientists: an introductory text with
computer programs in basic. London: Harper and Row.
Cohen-Charash, J.A., & Spector, P. E. (2001).The role of justice in organizations. A meta-
analysis. Organisational Behaviour and Human Decision processes, 86, 278-321.
Collins, L. M., Graham, J. J., & Flaherty, B. P. (1998). An alternative framework for defining
mediation. Multivariate Behavioural Research, 33(2), 295-312.
Colquitt, J.A., Conlon, D.E., Wesson, M.J., Porter, C.O.L.H., & Ng, K. Y. (2001). Justice at the
Millennium: A meta-analytic review of organisational justice research. Journal of Applied
Psychology, 86,425-445.
Cooper, D. R., & Schindler, P. S. (2003). Business Research Methods (8 th edn.) . New York:
McGrawHill.
Combs, J., Jiu, Y., Hall, A., & Ketchen, D. (2006). How much do high performance work
practices matter? A Meta -analysis of their effects on organisational performance. Personnel
psychology, 59(3), 501-528.
Creswell, J. W., & Poth, C. N. (2017). Qualitative inquiry and research design: Choosing among
five approaches. London: Sage publications.

203 | P a g e
Cronbach, L.J. (1951). “Coefficient alpha and the internal structure of tests”, London:
Psychometrika.
d’Arcimoles, C.H. (1997). Human resource policies and company performance: a quantitative
approach using longitudinal data. Organization Studies, 18 (5), 857-874.
Danlami, A. S. (2011). Strategic human resource management and organizational performance in
the Nigerian manufacturing sector: An empirical investigation. International Journal of Business
and Management, 6(9), 46.
Darwish, T. K., Singh, S., & Wood, G. (2016). The impact of human resource practices on actual
and perceived organizational performance in a Middle Eastern emerging market. Human
Resource Management, 55(2), 261-281.
Datta, D. K., Guthrie, J. P., & Wright, P. M. (2005). Human resource management and labour
productivity: does industry matter? Academy of Management Journal, 48(1), 135-145.
Day, N & Nancy, E (1996). 'Compensation managers' beliefs about strategies that affect
compensation program goals', Journal of Business Strategies, 13(1), 65-88.
De Beer, L. T., Pienaar, J., & Rothmann Jr, S. (2013). Investigating the reversed causality of
engagement and burnout in job demands-resources theory. SA Journal of Industrial Psychology,
39(1), 01-09.
De Vaus, D. (2002). Analyzing social science data: 50 key problems in data analysis. London:
Sage.
DeFillipi, R. J. (2002). Organizational models for collaboration in the new economy. People and
Strategy, 25(4), 7.
Delaney, J. T., Lewin, D., & Ichniowski, C. (1989). Human resource policies and practices in
American firms. US Dept. of Labour, Bureau of Labour-Management Relations and Cooperative
Programs. Washington DC: Government Printing Office.
Delaney, J.L.D., & Ichniowski, C. (1989). Human Resource Policies and Practices in American
Firms. Washington, DC: Government Printing Office.
Delaney, J.T., & Huselid, M.A. (1996). 'The impact of human resource management practices on
perceptions of organizational performance', Academy of Management Journal, 39 (4), 949-69.
Delery, J. E. (1998). Issues of fit in strategic human resource management: Implications for
research. Human Resource Management Review, 8(3), 289-309.
204 | P a g e
Delery, J. E., Gupta, N., & Shaw, J. D. (1997). Human resource management and firm
performance: A systems perspective. Atlanta: In Southern Management Association Meeting.
De Beer, L. T., Pienaar, J., & Rothmann Jr, S. (2013). Investigating the reversed causality of
engagement and burnout in job demands-resources theory. SA Journal of Industrial
Psychology, 39(1), 01-09.
Den Hartog, D. N., Boselie, P., & Paauwe, J. (2004). Performance management: A model and
research agenda. Applied psychology, 53(4), 556-569.
De Lange, A. H., Taris, T. W., Kompier, M. A., Houtman, I. L., & Bongers, P. M. (2003). “The
very best of the millennium": longitudinal research and the demand-control-(support)
model. Journal of occupational health psychology, 8(4), 282.
DeNisi, S.A., & Griffin, W.R. (2001). Human Resources Management, New York: Houghton
Mifflin Company..
Denzin N.K., & Lincoln, Y.S. (2003). The Landscape of Qualitative Research (1-46). London:
Sage Publications.
Dessler, G. (2010). Human Resource Management: The Strategic Role of Human Resource
Management, New Jersey: Prentice Hall,
Dessler. G. (2008). Human Resource Management, 11th
ed, New Jersey: Pearson Prentice-Hall.
DeVaus, D. (2002). Surveys in social science research, New South Wales: Crows Nest.
Diamantopoulos, A., Siguaw, J. A., & Siguaw, J. A. (2000). Introducing LISREL: A guide for the
uninitiated. London: Sage.
Dierickx, I., & Cool, K. (1989). Asset stock accumulation and sustainability of competitive
advantage. Management Science, 35(12), 1504-1511.
Dillman, D. A., Smyth, J. D., & Christian, L. M. (2014). Internet, phone, mail, and mixed-mode
surveys: the tailored design method. London: John Wiley & Sons.
Dimba, B. (2010). Strategic Human Resource Management Practices: Effect on Performance:
African Journal of Economic and Management Studies. 1(2), 128-137.
Donovan, M. A., Drasgow, F., & Probst, T. M. (2000). Does computerizing paper-and-pencil job
attitude scales make a difference? New IRT analyses offer insight. Journal of Applied
Psychology, 85(2), 305.

205 | P a g e
Doty, D. H., Glick, W. H., & Huber, G. P. (1993). Fit, equifinality, and organizational
effectiveness: A test of two configurational theories. Academy of Management Journal, 36(6),
1196-1250.
Duarte, P. O., Alves, H. B., & Raposo, M. B. (2010). Understanding university image: a
structural equation model approach. International Review on Public and Nonprofit
Marketing, 7(1), 21-36.
Dyer, L., & Reeves, T. (1995). Human Resource Strategies and Firm Performance: What Do We
Know and Where Do We Need to Go? The International Journal of Human Resource
Management”, 6 (3), 656-70.
Easterby-Smith, M., Thorpe, R., Jackson, P. R., & Lowe, A. (2008). Management Research
(ed.). London: Sage.
Edgar, F., & Geare, A. (2009). “Inside the “black Box” and “HRM”. International Journal of
Manpower, 30(3), 220-236.
Edwards, J. R., & Bagozzi, R. P. (2000). On the nature and direction of relationships between
constructs and measures. Psychological methods, 5(2), 155.
Edwards, P., & Wright, M. (2001). High-involvement work systems and performance outcomes:
the strength of variable, contingent and context-bound relationships, International Journal of
Human Resource Management, 12, 568-85.
Eckardt, R., Skaggs, B. C., & Youndt, M. (2014). Turnover and knowledge loss: An examination
of the differential impact of production manager and worker turnover in service and
manufacturing firms. Journal of Management Studies, 51(7), 1025-1057.
Ekatereni, G. (2010). Impact of leadership on four variables of executive workforces,
International Journal of Business and Management, 5(6), 3-16
Eriksson, P., & Kovalainen, A. (2008), Qualitative Methods in Business Research, Sage, Los
Angeles: Prentice Hall.
Fahy, J., & Smithee, A. (1999). Strategic marketing and the resource based view of the
firm. Academy of Marketing Science Review, 1(2), 1143-1168.
Farrell, D., & Stamm, C.L. (1988). Meta-analysis of the correlates of employee absence. Human
Relations 41: 211-227.
Ferguson, K. L., & Reio Jr, T. G. (2010). Human Resource Management systems and firm
performance. Journal of Management Development, 29(5), 471-494.

206 | P a g e
Fernandez, S., & Moldogaziev, T. (2013). Employee empowerment, employee attitudes, and
performance: Testing a causal model. Public Administration Review, 73(3), 490-506.
Fiedler, F. E. (1964). A contingency model of leadership effectiveness. Advances in
Experimental Social Psychology, 1, 149-190.
Ferris, G.R., Hochwarter, W.A., Buckley, M.R., Harrell-Cook, G., & Frink, D.D. (1999). Human
Resource management: Some new directions, Journal of Management, 25(3)385-415.
Fisher, R. A. (1999). The Genetical Theory of Natural Selection: A complete variorum edition.
Oxford: Oxford University Press.
Fey, C.F., Bjorkman, I., & Pavlovskaya, A. (2000), The effect of Human Resource Management
practices on firm performance in Russia, International Journal of Human Resource
Management, 11 (1), 1-18.
Ferris, Gerald R., Michelle M. Arthur, Howard M. Berkson, David M. Kaplan, Gloria
Harrell-Cook, and Dwight D. Frink. (1998). "Toward a social context theory of the human
resource management-organization effectiveness relationship." Human Resource
Management Review, 8 (3)235-264.
Field, A. (2005). Discovering statistics using SPSS (2nd Ed.). Thousand Oaks, CA: Sage.
Field, A. (2009). Discovering statistics using SPSS. London: Sage publications.
Fisher, C.D., Schoenfeldt, L.F., & Shaw, J.B. (2006). Human Resource Management, 6th ed.
Boston, MA: Houghton Mifflin.
Fitz-Enz, J. (1995). Benchmarking staff: ventajas competitivas y servicio al cliente. Deusto.
Fornell, C., & Larcker, D.F. (1981). ‘Evaluating structural equation models with unobservable
variables and measurement error’, Journal of Marketing Research, 39–50.
Fornell, C., & Bookstein, F. L. (1982). Two structural equation models: LISREL and PLS
applied to consumer exit-voice theory. Journal of Marketing Research, 440-452.
Fowler Jr, F.J. (2009). Survey Research Methods, London: SAGE Publications, Incorporated.
Freeman, D. M. (2017). U.S. Patent No. 9,694,144. Washington, DC: Patent and Trademark
Office.
Gamage, A. (2015). Investigating the role of HRM practices in promoting labour productivity in
manufacturing in SMEs in Japan, Sri Lankan Journal of Human Resource Management, 5(1)
Garner, E. (2012). Recruitment and Selection: Hiring the people you want, London: Ventus
Publishing Aps.
207 | P a g e
Gatewood, R., Feild, H. S., & Barrick, M. (2015). Human Resource Selection. Nelson Education.
Garavan, T. N., & McCarthy, A. (2008). Collective learning processes and human resource
development. Advances in Developing Human Resources, 10(4), 451-471.
Gelman, A. (2013). Commentary: P values and statistical practice. Epidemiology, 24(1), 69-72.
Georgios N., & Theriou P. C. (2014). The impact of best HRM Practices on Performance –
identifying enabling factors, Employee Relations, 36 (5). 535 – 561
Gerhart, B., Wright, P.M., Mahan, G.C. & Snell, S.A. (2000). 'Measurement error in research on
human resources and firm performance: how much error is there and how does it influence effect
size estimates?’ Personnel Psychology, 53 (4), 803-34.
Gerhart, B., Wright, P. M., Mahan, G. C., & Snell, S. A. (2000). Measurement error in research
on human resources and firm performance: how much error is there and how does it influence
effect size estimates?. Personnel Psychology, 53(4), 803-834.
Gerstner, C. R., & Day, D. V. (1997). Meta-Analytic review of leader–member exchange theory:
Correlates and construct issues. London: Sage publications.
Ghemawat, P., & Spence, A. M. (1986). Modelling global competition. Competition in global
Industries, 61-79.
Gittell, J. H., Seidner, R., & Wimbush, J. (2010). A relational model of how high-performance
work systems work. Organization Science, 21(2), 490-506.
Giri, M. P. (2017). Industrial Relations–An Overview. Journal of Industrial Relationship,
Corporate Governance & Management Explorer, 1(1), 21-25.
Gobler,P., Warnich,S., Carrell, M.R., Elbert, N.F.,& Hatfield, R.D. (2006). Human Resource
Management in South Africa. London: Cengage Learning EMEA.
Gomez-Mejia, L.R., & Balkin, D.B. (1992), Compensation, Organizational Strategy and Firm
Performance, South-Western, Cincinnati, OH.
Gong, Y., Law, K.S., Chang, S., & Xin, K.R. (2009). Human resource management and firm
performance: the differential role of managerial affective and continuance commitment”.
Journal of Applied Psychology. 94(10), 263-275.
Gotz, O. Liehr-Gobbers, K., & Krafft, M.(2009). Evaluation of structural equation models using
the partial least squares (PLS) approach. V. Esposito Vinzi, WW.
208 | P a g e
Government of Malawi. (2010). Agriculture Sector Wide Approach, Malawi’s prioritised and
Harmonised Agricultural Development Agenda: Ministry of Agriculture and Food Security,
Zomba: Government Printer.
Government of Malawi. (2000). Employment Act, Number 6, Zomba: Government Printer.
Government of Malawi. (1996). Labour Relations Act, Number 16, Zomba: Government Printer.
Government of Malawi. (2011). Malawi Growth and Development Strategy, Ministry of Trade
and Industry, Zomba: Government Printer.
Government of Malawi. (2011). Pension Act, Number 6. Zomba: Government Printer.
Government of Malawi. (1997). Occupational Health Safety and Welfare, Act Number 21,
Zomba: Government Printer.
Government of Malawi. (2000). Workers Compensation Act, Number 7, Zomba: Government
Printer.
Guest, D. E., & Peccei, R. (2001). Partnership at work: mutuality and the balance of
advantage. British Journal of Industrial Relations, 39(2), 207-236.
Guest, D., Conway, N., & Dewe, P. (2004). Using sequential tree analysis to search for ‘bundles’
of HR practices. Human Resource Management Journal, 14(1), 79-96.
Guest, D.E. (1997). Human resource management and performance: a review and research
agenda, International Journal of Human Resource Management, 8 (3), 263-76.
Guest, D.E. (2001). Human resource management when research confronts theory. International
Journal of Human Resources Management, 12 (7) .1092-106
Guest, D.E., Michie, J., Conway, N., & Sheehan, M. (2003). 'Human resource management and
corporate performance in the UK', British Journal of Industrial Relations, 41 (2), 291-314.
Guest, D., & Hoque, K. (1994). Yes, personnel does make a difference. Personnel Management
Journal, 40, 40 .
Guthrie, J. P., Flood, P. C., Liu, W., & MacCurtain, S. (2009). High performance work systems
in Ireland: human resource and organizational outcomes. The International Journal of Human
Resource Management,, 20(1), 112-125.
Guthrie, J.P. (2001). High involvement work practices, turnover, and productivity: evidence
from New Zealand. Academy of Management Journal, 44, 180-190.

209 | P a g e
Guthrie, J.P., Flood, P.C., Liu, W., & MacCurtain, S. (2009). 'High performance work systems in
Ireland: human resource and organizational outcomes', The International Journal of Human
Resource Management, 20 (1), 112-25.
Grant, R. M. (1991). The resource-based theory of competitive advantage: implications for
strategy formulation. California Management Review, 33(3), 114-135.
Gravetter, F. J., & Forzano, L. B. (2006). Research Methods for the Behavioural Sciences 2nd,
London: Thomson Wadsworth.
Greve, H. R. (1998). Performance, aspirations, and risky organizational change. Administrative
Science Quarterly, 58-86
Hair, F. Jr, J., Sarstedt, M., Hopkins, L., & G. Kuppelwieser, V. (2014). Partial least squares
structural equation modelling (PLS-SEM) An emerging tool in business research. European
Business Review, 26(2), 106-121.
Hair, F., Anderson, R., Tatham, R., & Black, W. (2008). Multivariate Data Analysis with
Readings, London: Prentice-Hall, London.
Hair, J. F., Ringle, C. M., & Sarstedt, M. (2011). PLS-SEM: Indeed a silver bullet. Journal of
Marketing theory and Practice, 19(2), 139-152.
Hair, J. F., Black, W. C., Babin, B. J., Anderson, R. E., & Tatham, R. L. (1998). Multivariate
data analysis, New Jersey: Prentice hall.
Hair, J.F., Black, W.C., Babin, B.J., Anderson, R.E., & Tatham, R.L. (2006). Multivariate data
analysis. (6th
ed.). New Jersey: Pearson Prentice Hall.
Hair, J.F., Black, W.C., Babin, B.J., Anderson, R.E., & Tatham, R.L. (2010). Multivariate data
analysis, New Jersey: Pesrson Prentice Hall.
Hall, L., & Torrington, D. (1998). The Human Resource Function: The dynamics of change and
Development, London: Financial Times/Pitman Publishing.
Hartog, D. N., & Verburg, R. M. (2004). High performance work systems, organisational culture
and firm effectiveness. Human Resource Management Journal, 14(1), 55-78.
Hassan, S. (2016). Impact of Human Resource Practices on employee performance, International
Journal of Academic Research in Accounting, Finance and Management Sciences, 6(1), 15-22.
Hayes, R. H., & Wheelwright, S. C. (1979). Link manufacturing process and product life cycles.
Harvard business review, 57(1), 133-140.

210 | P a g e
Hayes R.H., & Wheelwright S.C., (1984). Restoring Our Competitive Edge: Competing Through
Manufacturing. New York: Wiley, N'Y.
Herold, D. M., & Fedor, D.B. (2003) Individual differences in feedback propensities and training
performance. Human Resource Management Review 13, 675 – 689.
Hill, C. W., & Snell, S. A. (1989). Effects of ownership structure and control on corporate
productivity. Academy of Management Journal, 32(1), 25-46.
Hope-Hailey, V., Farndale, E., & Truss, C. (2005). ‘The HR department’s role in
Hoque, K. (1999). New approaches to HRM in the UK hotel industry. Human Resource
Management Journal, 9(2), 64-76.
Hoque, K. (1999). Human resource management and performance in the UK hotel industry.
British Journal of Industrial Relations, 37(3), 419-443.
Horn, M. J. (1995). The political economy of public administration: Institutional choice in the
public sector. Cambridge: Cambridge University Press.
Horwitz, F.M. (1999). The emergence of strategic training and development: the current state of
play. Journal of European Industrial Training. 23(45), 180-190.
Hoque, K. (1999). Human resource management and performance in the UK hotel industry.
British Journal of Industrial Relations, 37(3), 419-443.
Huang, H. J., & Cullen, J. B. (2001). Labour flexibility and related HRM practices: a study of
large Taiwanese manufacturers. Canadian Journal of Administrative Sciences/Revue Canadienne
des Sciences de l'Administration, 18(1), 33-39.
Huang, T. C. (2001). The effects of linkage between business and human resource management
strategies. Personnel review, 30(2), 132-151.
Huang, Liang-Chih, David Ahlstrom, Amber Yun-Ping Lee, Shu-Yuan Chen, and
Meng-Jung Hsieh (2016). "High performance work systems, employee well-being, and job
involvement: an empirical study." Personnel Review, 45(2) 296-314.
Hulland, J. (1999). Use of partial least squares (PLS) in strategic management research: A
review of four recent studies. Strategic Management Journal, 195-204.
Huselid, M. (1995), 'The impact of human resource management practices on turnover,
productivity, and corporate financial performance', Academy of Management Journal, 38 (3),
635-672.

211 | P a g e
Huselid, M. A., Jackson, S. E., & Schuler, R. S. (1997). Technical and strategic human resources
management effectiveness as determinants of firm performance. Academy of Management
journal, 40(1), 171-188.
Hutchinson, S., & Purcell, J. (2010). Managing ward managers for roles in HRM in the NHS:
overworked and under‐resourced. Human Resource Management Journal, 20(4), 357-374.
Ichniowski, C., & Shaw, K. (1999). Effects of human resource management systems on
economic performance: An international Comparison of US and Japanese Plants’ Management
Science, 5(45), 704-21.
Innocenti, L., Pilati, M., & Peluso, A. M. (2011). Trust as moderator in the relationship between
HRM practices and employee attitudes. Human Resource Management Journal, 21(3), 303-317.
Ivancevich, J. M. (2003). Human Resource and Personal management. New Delhi: Tata
McGraw HiII publishing company limited.
Jackson, S.E., Schuler, R.S., & Carlos, R.J. (1989). Organisational characteristics as predictors of
personnel practices. Personnel Psychology, 42(4) 727-786.
Jackson, S. E., & Schuler, R. S. (1995). Understanding human resource management in the
context of organizations and their environments. Annual Review of Psychology, 46(1), 237-264.
James, L. R., & Brett, J. M. (1984). Mediators, moderators, and tests for mediation. Journal of
Applied Psychology, 69(2), 307.
Jiang, K., Lepak, D., Han, K., Hong, Y., Kim, A., & Winkler, A. (2012b). Clarifying the
construct of human resource systems: relating human resource management to employee
performance’. Human Resource Management Review, 22(2), 73–85.
Jiang, J.Y., & Liu, C. (2013). High performance work systems and organisational effectiveness.
The mediating role social capital. Human resource Management Review, 25, 126-137.
Judge, T.A., & Church, A.H (2000).Job satisfaction. Research and practice. In cary LCooper &
Edwin a. Locke (eds) Industrial and organisational psychology: Linking theory and practice,
Oxford: Blackwell.
John, P.W., & Steven, W. (2000). Performance appraisal: an obstacle to training and
development? Journal of European Industrial Training, 24 (7), 384-391
Johnson, G., & Scholes, K. (2010), Exploring Corporate Strategy, 9th
edition. London: Prentice
Hall.
212 | P a g e
Jöreskog, K. G., & Sörbom, D. (1993). LISREL 8: Structural equation modelling with the
SIMPLIS command language. Washington DC: Scientific Software International.
Jöreskog, K. G., & Sörbom, D. (1996). LISREL 8: User's reference guide. Washington DC:
Scientific Software International.
Jöreskog, K. G., & Sörbom, D. (2006). LISREL 8.80 for Windows [Computer software].
Lincolnwood, IL: Washington DC: Scientific Software International.
Judd, C. M., & Kenny, D. A. (1981). Process analysis: Estimating mediation in treatment
evaluations. Evaluation review, 5(5), 602-619.
Judge, T.A., Piccolo, R.F., & Ilies, R. (2004). The forgotten ones? The validity of consideration
and initiating structure in leadership research. Journal of Applied Psychology. 89, 36-89.
Julie, P. (2006). Spss Survival Manual Version. 12, 2 edn., : McGraw-Hill Education
Kaiser, H. F. (1961). A note on Guttman's lower bound for the number of common
factors. British Journal of Mathematical and Statistical Psychology, 14(1), 1-2.
Kaiser, H.F. (1970), 'A second generation little jiffy', Psychometrika, 35 (4) 40.
Kamarul, F.H. (2012). Understanding the determinants of continuous knowledge sharing
intention within business online communities, Auckland: Auckland University of technology
Kaplan, D. (2008). Structural equation modelling: foundations and extensions, vol. 10, London:
Sage Publications.
Kapondoro, L., Iwu, C. G., & Twum-D, M. (2015). Human capital advantage: a determinant of
organisational performance in the Hospitality sector. New Jersey: Pearson Prentice Hall.
Karen L. F., & Thomas, G. R. (2010). Human resource management systems and firm
performance, Journal of Management Development, 29 (5) 471-494
Katou, A.A. (2012). Investigating reverse causality between human resource management
policies and organizational performance in small firms, Management Research Review, 35(2),
134-156.
Katou, A. A. (2011). A mediation model linking business strategies, human resource
management, psychological contract, and organisational performance. International Journal of
Human Resources Development and Management, 11(1), 51-67.
Katou, A. A. (2013). The link between HR practices, psychological contract fulfilment, and
organisational performance in Greece: An economic crisis perspective. Journal of Industrial
Engineering and Management, 6(2), 568-594.
213 | P a g e
Katou, A. A., & Budhwar, P. S. (2010). Causal relationship between HRM policies and
organisational performance: Evidence from the Greek manufacturing sector. European
Management Journal, 28(1), 25-39.
Katuo, A.A., & Budhwar, P.S. (2006). Human resource management systems and organisational
performance: a test of mediating model in the Greek manufacturing context, Internal Journal of
Human Resource Management.17 (7) 1223-1253
Katuo, A.A., & Budhwar, P.S. (2008). The effect of human resource management policies on
organisational performance in Greek manufacturing firms. Thunderbird International Business
Review, 49 (1) 1-35.
Katou, A. A. (2008). Measuring the impact of HRM on organizational performance. Journal of
Industrial Engineering and Management, 1(2), 119-142.
Katz, D., & Kahn, R. L. (1966). The psychology of organizations. New York: HR Folks
International.
Kelloway, E.K. (1998). Using LISREL for structural equation modelling: A researcher’s guide.
Thousand Oaks, CA: Sage
Kenny, D. A., Kashy, D. A., & Bolger, N. (1998). Data analysis in social psychology (In D.
Gilbert, S. Fiske, & G. Lindzey (Eds.). The handbook of social psychology. 1, 233–265.
Kerlinger, F. N., & Lee, H. B. (2000). Foundations of Behavioural Research: Northridge, CA:
Wadsworth, Thomson Learning.
Kerlinger, F. N. F. N., & Pedhazur, E. J. (1973). Multiple regression in behavioral research (No.
04; HA31. 3, K4.).
Khan, M.A. (2010). Effects of human resource management practices on organizational
performance – an empirical study of oil and gas industry in Pakistan, European Journal of
Economics, Finance and Administrative Sciences, 24, 157-175.
Khan, S.A. (2014). The factors affecting employee turnover in an organization: The case of
Overseas Pakistanis foundation. African Journal of Business Management, 8(1), 25-34.
Khatri, N. (2000). Managing human resources for competitive advantage: a study of companies
in Singapore, International Journal of Human Resource Management, 11, 336-65
Kim, S., Wright, P. M., & Su, Z. (2010). Human resource management and firm performance in
China: A critical review. Asia Pacific Journal of Human Resources, 48(1), 58-85.
214 | P a g e
Kinicki, A.J., McKee-Ryan, F.M., Schriesheim, C.A., & Carson, K.P. (2002). Assessing the
construct validity of the job descriptive index: A review of meta-analysis. Journal of Applied
Psychology, 87, 14-32.
Kinnear, P.R., & Gray, C.D. (2004). SPSS 12 made simple. Hove and New York: Psychology
Press.
Khilji,S.E. and Wang, X. (2006) ‘Intended’ and ‘implemented’ HRM: the missing linchpin in
strategic human resource management research, The International Journal of Human Resource
Management, 17(7), 1171-1189
Kline, R. B. (2011). Principles and practice of structural equation modelling. (3rd Ed.). New
York: Guilford Press.
Koch, M. J., & McGrath, R. G. (1996). Improving labour productivity: Human resource
management policies do matter. Strategic management journal, 335-354.
Kochan, T. A. (1984). Worker Participation and American Unions. Threat or Opportunity? WE
Upjohn Institute for Employment Research, 300 South Westnedge Avenue, Kalamazoo, MI
49007.
Konter, D. (2014). Crossing Borders with HRM: An Inquiry of the Influence of Contextual
Differences in the Adoption and Effectiveness of HRM (No. EPS-2014-305-ORG).
Kothari, C. (2004). Research Methodology: methods and techniques, 2nd edition. New Delhi:
New Age International.
Krajewski, L. J., King, B. E., Ritzman, L. P., & Wong, D. S. (1987). Kanban, MRP, and shaping
the manufacturing environment. Management science, 33(1), 39-57.
Lahteenmaki, S., Storey, J., & Vanhala, S. (1998). 'HRM and company performance: the use of
measurement and the influence of economic cycles', Human resource management journal, 8
(2), 51-65
Laugen, B. T., & Boer, H. (pallant 2013). The implementation of best practices: process and
performance effects. Creativity and Innovation Management, 16(4), 397-407.
Lareau, N. P., Larson, L. K., Mook, J. R., Bacon, D. L., Tucker, D. W., VanDeusen, D. R., &
Greenbaum, M. (2017). Introduction. Labor and Employment Law, 7.
Lee, F., Lee, T., & Wu, W. (2010).The relationship between Organizational commitment and
work behaviour, Journal of Organizational Behaviour, 26 (7), 812-838.
215 | P a g e
Lee, F.H., & Lee, F.Z. (2007). The relationship between HRM practices, Leadership style,
Competitive strategy and business performance in Taiwanese Steel Industry, proceedings of the
13th
Asia Pacific Management Conference, Melbourne, 953-971.
Leedy, P. D., & Ormrod, J. E. (2001). Practical research: Planning and research. Upper Saddle:
Prentice Hall.
Leong, G. K., Snyder, D. L., & Ward, P. T. (1990). Research in the process and content of
manufacturing strategy. Omega, 18(2), 109-122.
Lepak, D. P., Liao, H., Chung, Y., & Harden, E. E. (2006). A conceptual review of Human
Resource Management systems in Strategic Human Resource Management Research. Research
in personnel and human resources management, 25(1), 217-271.
Lewin, D. (2001). IR and HR perspectives on workplace conflict: what can each learn from the
other? Human Resource Management Review, 11(4), 212-241.
Li, J., Qian, G., Liao, S., & Chu, C.W.L. (2008). Human Resource Management and the
globalness of firms. An Empirical Study in China. The International Journal of Human Resource
Management, 19(50), 828-839
Li, X., Frankel, S., & Sanders, K. (2011). How do perceptions of the HRM system affect
employee attitudes? A multilevel study of Chinese employee’s. International Journal of HRM. 2,
1823-1840.
Liao, H., Toya, K., Lepak, D.P., & Hong, Y. (2009). ‘Do they see eye to eye? Management and
employee perspectives of high-performance work systems and influence processes on service
quality’, Journal of Applied Psychology, 94(2), 371-391.
Lincoln, Y. S., & Guba, E. G. (2003). ‘Paradigmatic controversies, contradictions, and
emerging confluences’, In N. K. Denzin and Y. S. Lincoln (Eds.), The Landscape of Qualitative
Research (253-291). London: Sage Publications.
Lincoln, Y. S., & Guba, E. G. (2004). The roots of fourth generation evaluation. Evaluation
roots: Tracing Theorists' Views and Influences, 225-241.
Little, T. D. (Ed.). (2013). The Oxford handbook of quantitative methods, volume 1:
Foundations. Oxford: Oxford University Press.
Loher, B.T., Noe, R.A., Moeller, N.L., & Fitzgerald, M.P. (1985). A meta-analysis of the
relationship of the job characteristics to job satisfaction. Journal of Applied Psychology, 70,
280-289.

216 | P a g e
Lopez, S.P., Peon, J.M., & Ordas, C.J.V. (2005). Human Resource Practices, organisational
learning and business performance. Human Resource Development International, 8(2), 147-164
Lord, F. M. (1980). Applications of item response theory to practical testing problems. London:
Routledge.
Luna-Arocas, R., & Camps, J. (2008), “A model of high performance work practices and
turnover intentions”, Personnel Review, 37, 26-46.
MacCallum, R. C., Roznowski, M., & Necowitz, L. B. (1992). Model modifications in
covariance structure analysis: the problem of capitalization on chance. Psychological
Bulletin, 111(3), 490
MacDuffie, J.P. (1995). Human Resource bundles and manufacturing performance:
organisational logic and flexible production systems in the world auto industry. Industrial and
Labour Relations Review, 48, 197-221.
Mackelprang, A.W., Jayaram, J., & Xu, K. (2012). The influence of types of training on service
system performance in mass service and service shop operations, International Journal of
Production Economics, 138 (1), 183-194.
MacKinnon, D. P., Lockwood, C. M., Hoffman, J. M., West, S. G., & Sheets, V. (2002). A
comparison of methods to test mediation and other intervening variable effects. Psychological
Methods, 7(1), 83.
Mohamed, M., Stankosky, M., & Murray, A. (2006). Knowledge management and information
technology: can they work in perfect harmony?. Journal of Knowledge Management, 10(3), 103-
116.
Mak, S., & Akhtar, S. (2003). Human Resource Management practices, Strategic Orientations
and Company performance: A Correlation study of publicly listed companies. Journal of
American Academy of Business, 2(2), 510-516.
Marsh, S. Y. (2016). Retention of Institutional Memory Via Knowledge Management:
Perceptions Regarding the Effectiveness of Corporate Approaches Applied in Higher Education
(Doctoral dissertation).
Malhotra, N. K., Agarwal, J., & Peterson, M. (1996). Methodological issues in cross-cultural
marketing research: A state-of-the-art review. International Marketing Review, 13(5), 7-43.
Martín-Alcázar, F., Romero-Fernandez, P. M., & Sánchez-Gardey, G. (2005). Strategic human
resource management: integrating the universalistic, contingent, configurational and contextual
perspectives. The International Journal of Human Resource Management, 16(5), 633-659.

217 | P a g e
Mathis, R. L., & Jackson, J. H. (2010). Human Resource Management, Washington DC: South-
Western Learning.
Messersmith, J. G., Patel, P. C., Lepak, D. P., & Gould-Williams, J. S. (2011). Unlocking the
black box: exploring the link between high-performance work systems and performance. Journal
of Applied Psychology, 96(6), 1105.
Meyer, J. P., Stanley, D. J., Herscovitch, L., & Topolnytsky, L. (2002). Affective, continuance,
and normative commitment to the organization: A meta-analysis of antecedents, correlates, and
consequences. Journal of Vocational Behavior, 61(1), 20-52.
McPherson, E. G., & Muchnick, J. (2005). Effects of street tree shade on asphalt concrete
pavement performance.
Moonen-van Loon, J. M. W., Overeem, K., Donkers, H. H. L. M., Van der Vleuten, C. P. M., &
Driessen, E. W. (2013). Composite reliability of a workplace-based assessment toolbox for
postgraduate medical education. Advances in Health Sciences Education, 18(5), 1087-1102.
Moser, C. A., & Kalton, G. (2017). Survey methods in social investigation. London: Routledge.
Nardi, P. M. (2015). Doing survey research. London: Routledge.
Nyandiko, J. A., & Ongeri, L. (2015). Effectiveness of strategic human resource management on
organizational performance at Kenya Seed Company-Kitale. Journal of Emerging Trends in
Economics and Management Sciences, 6(1), 1.t review. International Marketing Review, 13(5),
7-43.
Magnani, R. (1997). Sampling Guide. IMPACT Food Security and Nutrition Monitoring Project,
Arlington, VA.
Mohamed, M., Stankosky, M., & Murray, A. (2006). Knowledge management and information
technology: can they work in perfect harmony?. Journal of Knowledge Management, 10(3), 103-
116.
Martell, K., & Carroll, S. (1995). How Strategic is HRM? Human Resource Management, 34(2),
253-76.
Martin-Alcazar, F., Romero-Fernandez, P.M., & Sanchez-Gardey, G. (2005). Researching on
SHRM: An Analysis of the debate over the role played by human resources in firm success.
Management Review, 16(20), 213-241.
Mason. (2002). Qualitative Researching, 2nd
Ed. London: Sage.

218 | P a g e
Massimino, P.M., & Kopelman, R.E. (2012). Management practices and Organisational
Performance: A longitudinal Analysis Using Cross-lagged Data. Journal of Global Business
Management. 8(2), 58
Mathieu, J, E., & Zajac, D.M. (1990). A review and meta-analysis of the antecedents, correlates
and consequences of organisational commitment. Psychological Bulletin, 108, 171-194.
Mester, C., Visser, D., & Roodt, G. (2003). Leadership Style and Its relation to Employee
attitudes and Behaviour. SA Journal of Industrial Psychology, 29(2) 72-82.
Meyer, J.P., & Allen, N.J. (1991). ‘A three-component conceptualization of organizational
commitment’, Human Resource Management Review, 1 (1), 61–89.
Meyer. J., Stanley, D., Herscovich, L., & Topolnytsky. L. (2002). Affective, continuance and
normative commitment to the organisation: A meta-analysis of antecedents, correlates and
consequences. Journal of Vocational Behaviour. 61, 20-52.
Miles, R. E., & Snow, C. C. (1984). Designing strategic human resources systems.
Organizational dynamics, 13(1), 36-52.
Millar, P., & Stevens, J. (2012). Management training and national sport organization managers:
examining the impact of training on individual and organizational performances, Sport
Management Review, 15 (3), 288-303.
Miller, B. K., Rutherford, M.A., & Kolodinsky, R.W. (2008). Perceptions of organisational
politics: A meta-analysis of outcomes. Journal of Business and Psychology, 22, 209-222.
Miller, D., & Friesen, P. H. (1986). Porter's (1980) generic strategies and performance: An
empirical examination with American data Part I: Testing Porter. Organization studies, 7(1), 37-
55.
Mina B., Mehdi K.., & Yaser, G. (2012). Researching the impact of human resources functions
on organizational performance using structural equations method (case research: Iran Behnoush
Company), Interdisciplinary Journal of Contemporary Research in Business, 3(9).
Mohinder, C., & Katuo, A. (2007). The Impact of HRM practices on Organisational Performance
in the Indian Hotel industry, Employee Relations, 29(6), 576-594.
Mouton, J., & Babbie, E. (2001). The practice of social research. Cape Town: Wadsworth
Publishing Company.
Muchhal, D.S. (2014). Human Resource Practices and Job Performance, Journal of Humanities
and Social science, 19(4), 55-61.

219 | P a g e
Mukanzi, C. M. (2013). Factors affecting performance appraisal process in the communication
industry. International Journal of Social Sciences and Entrepreneurship, 1(5), 533-543.
Nachtigall, C., Kroehne, U., Funke, F., & Steyer, R. (2003). Pros and cons of structural equation
modelling. Methods Psychological Research Online, 8(2), 1-22.
Nel, P.S. (2004). 6th ed, Human Resources Management, Oxford: Oxford University Press,
Newbert, S. L. (2008). Value, rareness, competitive advantage, and performance: a
conceptual‐level empirical investigation of the resource‐based view of the firm. Strategic
Management Journal, 29(7), 745-768.
Ngo, H.Y., Turban, D,, Lau, C.M., & Lui, S.Y. (1998). 'Human resource practices and firm
performance of multinational corporations: influences of country origin', International Journal of
Human Resource Management, 9 (4), 632-52.
Nishii, L, H., Lepak, D.P., & Schneider, B. (2008). ‘Employee attributions of the ‘why’ of HR
practices: their effects on employee attitudes and behaviours, and customer satisfaction’,
Personnel Psychology, 61 (3), 503–545.
Nkhwangwa, L. C. (2014). Achieving Strategic Fit/Integration between Business Strategies and
Human Resource Management (HRM) Strategies in the Banking Sector: An Assessment of the
Commercial Banks in Malawi. International Journal of Social Sciences and Management, 1(4),
143-159.
Noe, R. A., Hollenbeck, J. R., Gerhart, B., & Wright, P. M. (2004). Fundamentals of human
Resource Management. Toronto: McGraw-Hill.
Nunnally, J.C., & Bernstein, I.H. (1994). Psychometric Theory. New York, NY: McGraw-Hill.
Nunnally, J. C. 1976. Psychometric theory. New York: McGraw Hill.
Nunnally, J.C. (1967). Psychometric theory. New York: McGraw-Hill.
Nunnally, J.C. (1978). Psychometric Theory, McGraw-Hill, New York, NY.
Nunnally, R., & Marlowe, H. (1997). .Psychometric Theory. London: Routledge.
Nyandiko, J. A., & Ongeri, L. (2015). Effectiveness of strategic human resource management on
organizational performance at Kenya Seed Company-Kitale. Journal of Emerging Trends in
Economics and Management Sciences, 6(1), 1.

220 | P a g e
Ogunyomi, P., & Bruning, N. S. (2016). Human Resource Management and Organizational
performance of small and medium enterprises (SMEs) in Nigeria. The International Journal of
Human Resource Management, 27(6), 612-634.
Okpara, J. O., & Wynn, P. (2007). Human resource management practices in a transition
economy: Challenges and prospects. Management Research News, 31(1), 57-76.
Ondrack, D. A., & Nininger, J. R. (1984). Human Resource Strategies–the corporate
perspective. Business Quarterly, 49(4), 101-09.
Organ, D. W. (1988). Organizational citizenship behaviour: The good soldier syndrome.
Lexington MA: Lexington Books.
O'Rourke, N., & Hatcher, L. (2013). A step-by-step approach to using SAS for factor analysis
and structural equation modeling. Sas Institute.
Osman, I., Ho T.C.F., & Galang, M. C. (2011). The relationship between human resource
practices and firm performance: an empirical assessment of firms in Malaysia”, Business
Strategy Series, 12 (1), 41-48
Ostroff, C., & Bowen, D. E. (2000). Moving HR to a higher level: HR practices and
organizational effectiveness. London: Sage publications.
Ozutku, H., & Ozturkler, H. (2009). The determinants of human resource practices: An empirical
investigation in the Turkish manufacturing industry. Ege Academic Review, 9(1), 73-93.
Paauwe, J. (2004). HRM and performance: Achieving Long-term viability: Oxford: Oxford
University Press.
Paauwe, J., & Boselie, P. (2005). HRM and performance: What next? Human resource
management Journal, 15(4), 68-83
Paauwe, J., & Richardson, R. (1997). Introduction. International Journal of Human Resource
Management, 8(3), 257-262.
Paauwe, J. (2009). HRM and performance: Achievements, methodological issues and prospects.
Journal of Management Studies, 46(1), 129-142.
Paauwe, J., Wright, P., & Guest, D. (2013). HRM and performance: What do we know and
where should we go. HRM and performance: Achievements and challenges, 1-13.
Pallant, J. (2013). Survival Manual: SPSS a Step by Step to data analysis IBM SPSS, 5th ed.
McGraw-Hill, London.

221 | P a g e
Pardo del Val, M., & Martinez Fuentes, C. (2003). Resistance to change: a literature review and
empirical study. Management Decision, 41(2), 148-155.
Paré, G., & Tremblay, M. (2007). The influence of high-involvement human resources practices,
procedural justice, organizational commitment, and citizenship behaviours on information
technology professionals' turnover intentions. Group & Organization Management, 32(3), 326-
357.
Park, H.J., Mitsuhashi, H., Fey, C.F., & Bjorkman, I. (2003). The effect of human resource
management practices on Japanese MNC subsidiary performance- a partial mediating model,
Working paper No.03-102, Stockholm school of Economics-St Petersburg.
Paul, A. K., & Anantharaman, R. N. (2003). Impact of people management practices on
organizational performance: analysis of a causal model. International Journal of Human
Resource Management, 14(7), 1246-1266.
Peng, M. W., & Luo, Y. (2000). Managerial ties and firm performance in a transition economy:
The nature of a micro-macro link. Academy of Management Journal, 43(3), 486-501.
Perryer, C., Jordan, C., Firns, I., & Travaglione, A. (2010). Predicting turnover intentions: The
interactive effects of organizational commitment and perceived organizational support.
Management Research Review, 33(9), 911-923.
Perry-Smith, J.E., & Baum, T.C. (2000). Work-family human resource bundles and perceived
organisational performance. Academy of Management Journal, 43, 1107-1117
Pfeffer, J. (1994). Competitive advantage through people. California management review, 36(2),
9.
Pfeffer, J. (1998). The Human Equation: Building Profits by Putting People First, Boston, MA:
Harvard Business School Press.
Pfeffer, J. (1996). When it comes to “best practices”—why do smart organizations occasionally
do dumb things? Organizational Dynamics, 25(1), 33-44.
Pintzos, G., Matsas, M., & Chryssolouris, G. (2012). Defining manufacturing performance
indicators using semantic ontology representation. Procedia CIRP, 3, 8-13
Podsakoff, N.P., LePine J. A., & LePine, M.A. (2007). Differential challenge stressor-hindrance
stressor relationships with job attitudes, turnover intentions, turnover and withdrawal behaviour:
A meta-analysis . Journal of applied psychology, 92, 438-454.
Podsakoff, P.M., Mackenzie, S.B., Lee, J-Y., & Podsakoff, N.P. (2003). 'Common method biases
in behavioural research: A critical review of the literature and recommended remedies', Journal
of Applied Psychology, 88(5), 879-903.

222 | P a g e
Poole, M., & Jenkins, G. (1996). Competitiveness and human resource management policies.
Journal of General Management, 22, 1-19.
Porter, M. E., & Millar, V. E. (1985). How information gives you competitive advantage.
London: Sage publications.
Porter, M. E. (1981). The contributions of industrial organization to strategic management.
Academy of Management Review, 6(4), 609-620.
Price, J. L. (2001). Reflections on the determinants of voluntary turnover. International Journal
of Manpower, 22(7), 600-624.
Prowse, P., & Prowse, J. (2010). Whatever happened to human resource management
performance?. International Journal of Productivity and Performance Management, 59(2), 145-
162.
Pundzienė, A., Alonderienė, R., & Solveiga Buožiūtė, S. B. (2007). Managers’ change
communication competence links with the success of the organisational change. Engineering
Economics, 54(4).
Purcell, J. (2001). The meaning of strategy in human resource management. In Storey J (ed),
HRM: A critical text. London; Thomson Learning, 59-77
Purcell, J. (2003). Understanding the people and performance link: unlocking the black box.
London: CIPD Publishing.
Purcell, J., & Hutchinson, S. (2007). Front‐line managers as agents in the HRM‐performance
causal chain: theory, analysis and evidence. Human Resource Management Journal, 17(1), 3-20.
Purcell, J., Kinnie, N., & Hutchinson, S. (2003). Understanding the people and Performance
Link: Unlocking the Black Box, London: Chartered Institute of Personnel Development. .
Qureshi, M.T., Ayisha, A., Mohammad, A.K., Rauf, A.S. & Syed, T.H. (2010). Do human
resource management practices have an impact on financial performance of banks?, African
Journal of Business Management, 4 (7), 1281-1288.
Racelis, A.A. (2010). The influence of Organisational culture on the performance of Philippine
Banks. Social Diliman. 6(2), 29-49
Rafique, R., Tayyab M., Kamran, M., & Ahmed N. (2014). A study of the factors Determining
Motivational Level of Employees Working in Public Sector of Bahawalpur. International
Journal of Human Resource Studies, 4(3), 2162-3058

223 | P a g e
Rambiyana, R. T. (2016). Employees' perception on knowledge sharing within the Limpopo
provincial treasury (Doctoral dissertation).
Raza-Ullah, T., Bengtsson, M., & Kock, S. (2014). The competition paradox and tension in
competition at multiple levels. Industrial Marketing Management, 43(2), 189-198.
Razouk, A. (2011). High-performance work systems and performance of French small-and
medium-sized enterprises: examining causal order. The International Journal of Human
Resource Management, 22(02), 311-330.
Reckase, M.D. (1999). Uni-factor latent trait models applied to multifactor tests: Results and
implications. Journal of Educational Statistics, 4, 207-230.
Redman, T., & Mathews, B.P. (1998). ‘Service quality and human resource management: a
review and research agenda’, Personnel Review, 27(1), 57–77.
Richardson, R., & Thompson, M. (1999). The impact of people management practices on
business performance: a literature review. London: Institute of Personnel and Development.
Ringle, C. M., Sarstedt, M., & Straub, D. (2012). A critical look at the use of PLS-SEM in MIS
Quarterly.
Ritson, N. (2011). Strategic management, London: Ventus Publishing Aps.
Rosemond, B., & Ernesticia L. (2011). The Effect of Human Resource Management Practices on
Corporate Performance: A Research of Graphic Communications Group Limited. International
Business Research, 4(1).
Saari, L. M., & Judge, T. A. (2004). Employee attitudes and job satisfaction. Human resource
management, 43(4), 395-407.
Salkind, N.J. (2010). Encyclopaedia of research design, vol. 1, London: Sage.
Shammot, M. M. (2014). The role of human resources management practices represented by
employee's recruitment and training and motivating in realization competitive advantage. The
Retail and Marketing Review, 10(2), 18-37.
Sandberg, T., & Conner, M. (2008). Anticipated regret as an additional predictor in the theory of
planned behaviour: A meta-analysis. British Journal of Social Psychology, 47, 589-606
Sanz-Valee, R., Sabatier-Sanchez, R., & Aragon-Sanchez, A. (1999). Human Resource
management and business strategy links: an empirical study: The International Journal of
Human Resource Management, 4, 655-71
Sapsford, R . (2006). Survey research, London: Sage Publications Limited.

224 | P a g e
Saunders M., Lewis P. H., & Thornhill A. (2000) ‘Research Methods for Business Students.”
London: Pearson education limited.
Saunders, M., Lewis, P., & Thornhill, A. (2007). Formulating the research design. Research
methods for Business Students, 130-161.
Shields, J., Brown, M., Kaine, S., Dolle-Samuel, C., North-Samardzic, A., McLean, P., &
Plimmer, G. (2015). Managing Employee Performance & Reward: Concepts, Practices,
Strategies. Cambridge: Cambridge University Press.
Sirmon, D. G., & Hitt, M. A. (2003). Managing resources: Linking unique resources,
management, and wealth creation in family firms. Entrepreneurship theory and practice, 27(4),
339-358.
Saxena, K., & Tiwari, P. (2009). A Study of HRM Practices in Selected IT Companies of India,
AIMS Journal of Management, 1(3)29-44.
Schneider, B., Hanges, P.J., Smith, D.B. & Salvaggio, A.N. (2003). “Which comes first:
employee attitudes or organizational financial market performance?”, Journal of Applied
Psychology, 88 (5), 836-51.
Schuler R. S., & MacMillan I. C. (1984). Gaining Competitive Advantage through Human
Resource Management Practices, Journal of Human Resource Management, 23(3), 241-25.
Schuler, R.S. (1992). Strategic human resource management: Linking the people with the
strategic needs of the business. Organisational dynamics, 21(10, 18-32
Schuler, R.S., & Jackson, S.E. (1987). Linking competitive strategies with human resource
management practices, Academy of Management Executive, 1(3). 207-19.
Segev, E. (1989). A systematic comparative analysis and synthesis of two business‐level
strategic typologies. Strategic Management Journal, 10(5), 487-505.
Sekaran, V. (2005). Research Methods for Business: A Skill Building Approach, New York:
John Wiley and Sons.
Sels, L., De Winne, S., Maes, J., Delmotte, J., Faems, D., & Forrier, A. (2006). Unravelling the
HRM–Performance link: Value‐creating and cost‐increasing effects of small business
HRM. Journal of Management Studies, 43(2), 319-342.
Sinikka. V., & Stavrou, E. (2013)," Human resource management practices and the HRM-
performance link in public and private sector organizations in three Western societal clusters",
Baltic Journal of Management, 8(4), 416-437 Permanent link to this document. Management,
8(4), 416-437.

225 | P a g e
Senyucel, Z. (2009). Managing the Human Resource in the 21st Century, London: Ventus
Publishing Aps.
Shin, D., & Konrad, A. M. (2017). Causality between high-performance work systems and
organizational performance. Journal of Management, 43(4), 973-997.
Skinner, B. F. (1974). Walden two. London: Hackett Publishing.
Snape, E., & Redman, T. (2010). ‘HRM practices, organizational citizenship behaviour, and
performance: a multi‐level analysis’, Journal of Management Studies, 47(7), 1219–1247.
Snell, S. A., & Dean, J. W. (1992). Integrated manufacturing and human resource management:
A human capital perspective. Academy of Management journal, 35(3), 467-504.
Snell, S. A., & Dean, J. W. (1992). Integrated manufacturing and human resource management:
A human capital perspective. Academy of Management Journal, 35(3), 467-504.
Snell, S. A., & Youndt, M. A. (1995). Human resource management and firm performance:
Testing a contingency model of executive controls. Journal of Management, 21(4), 711-737
Storey, J. (2007), Human Resources Management: A Critical Text, 3rd
ed., London: Thomson
Corporation.
Stup, R. E., Hyde, J., & Holden, L. A. (2006). Relationships between selected human resource
management practices and dairy farm performance. Journal of Dairy Science, 89(3), 1116-1120.
Sun, L. Y., Aryee, S., & Law, K. S. (2007). High-performance human resource practices,
citizenship behaviour, and organizational performance: A relational perspective. Academy of
management Journal, 50(3), 558-577.
Tabachnick, B. G., & Fidell, L. S. (2007). Multivariate analysis of variance and
covariance. Using multivariate statistics, 3, 402-407.
Takeuchi, R., Lepak, D. P., Wang, H., & Takeuchi, K. (2007). An empirical examination of the
mechanisms mediating between high-performance work systems and the performance of
Japanese organizations. Journal of Applied Psychology, 92(4), 1069.
Takeuchi, R., Lepak, D., Wang, H., & Takeuchi, K. (2007). An Empirical Examination of the
Mechanisms Mediating Between High-Performance Work Systems and the Performance of
Japanese Organisations. Journal of Applied Psychology. 92(4), 1060-1083.
Tamer, S., & Elliott, S. J. (2015). Time and Attendance. Encyclopedia of Biometrics, 1533-1540.
226 | P a g e
Tate, R. (2003). A comparison of selected empirical methods for assessing the structure of
response to test items. Applied psychological Measurement, 27, 159-203.
Tayeb, M. (1998). Transfer of HRM practices across cultures: an American company in
Scotland. International Journal of Human Resource Management, 9(2), 332-358.
Tayeb, M. (1998). Transfer of HRM practices across cultures: an American company in
Scotland. International Journal of Human Resource Management, 9(2), 332-358.
Taylor, B., Kermode, S., & Roberts, K. (2007). Research in Nursing and Health Care: Evidence
for Practice, Sydney: Thomson.
Teo, S., Le Clerc, M., & Galang, M. (2011). Human Capital Enhancing Systems and frontline
enmployees in Australian manufacturing SMEs. International Journal of Human Resource
Management, 22, 2522-2538.
Terpstra, D.E., & Rozell, E.J. (1993), “The relationship of staffing practices to organizational
level measures of performance”, Personnel Psychology, 46, 27-48.
Teseema, M., & Soeters, J. (2006). Challenges and Prospects of HRM in developing countries:
Testing the HRM performance link in Eritrian Civil Service, Internal Journal of Human
Resource Management, 17(1), 86-105.
Tharenou, P., Donohue, R., & Cooper, B (2007). Management research methods, Cambridge:
University Press Cambridge.
Theron, C.C., Spangenberg, H.H., & Henning, R. (2004). An elaboration of the internal structure
of the unit performance construct as measured by the Performance Index (PI). Management
Dynamics, 13(2), 35-52
Timothy, C., Andy T., Victoria O., & Idowu A. (2011). Effects of leadership style on
organizational performance in small scale enterprises. Australian Journal of Business and
Management Research, 1(7), 100-111.
Torrington, D., Hall, L., Taylor, S., & Atkinson, C. (2014). Human Resource Management. 9th
ed, London: Pearson.
Truss, C., Mankin, D., & Kelliher, C. (2012). Strategic human resource management. Oxford
University Press.

227 | P a g e
Tsai, C. J., Edwards, P., & Sengupta, S. (2011). Human Resource Management, Organizational
Performance and Employee Attitudes and Behaviours: Exploring the Linkages. Journal. www.
esrc. ac. uk.
Ulrich, D. (1997). Human resource champions: The next agenda for adding value to HR
practices. Boston MA: Harvard Business School Press,
Van den Brink, M., Fruytier, B., & Thunnissen, M. (2013). Talent management in academia:
performance systems and HRM policies. Human Resource Management Journal, 23(2), 180-
195.
Van De Voorde, K., & Beijer, S. (2015). The role of employee HR attributions in the relationship
between high‐performance work systems and employee outcomes. Human Resource
Management Journal, 25(1), 62-78.
Veal, A. J. (2017). Research methods for leisure and tourism. London: Pearson UK.
Venkatesh, A., & Peñaloza, L. (2006). From marketing to the market. Does marketing need
reform? Fresh Perspectives on the future, 134-50.
Vickery, S. K., Dröge, C., & Markland, R. E. (1997). Dimensions of manufacturing strength in
the furniture industry. Journal of Operations Management, 15(4), 317-330.
Vigneron, F., & Johnson, L. W. (2017). Measuring perceptions of brand luxury. In Advances in
Luxury Brand Management. London: Palgrave Macmillan.
Vlachos, I. (2008). "The effect of human resource practices on organizational performance:
Evidence from Greece." The International Journal of Human Resource Management, 19(1), 74-
97.
Walker, B., & Hamilton, R. (2011). Employment Rights disputes: What is the Role of HR
Professionals? Asia Pacific Journal of Human Resources, 49(4), 409-424.
Wall, T.D., & Wood, S.J. (2005). The romance of human resource management and firm
performance and the case for big science. Human Relations, 58(4), 429-462
Wall, T.D., Michie, J., Patterson, M., Wood, S.J., Sheehan, M., Clegg, C.W., & West, M. (2004),
‘On the validity of subjective measures of company performance’, Personnel Psychology, 57(1),
95–118.
Walter, A., Auer, M., & Ritter, T. (2006). The impact of network capabilities and entrepreneurial
orientation on university spin-off performance. Journal of Business Venturing, 21(4), 541-567.
228 | P a g e
Wan, D., Ong, C. H., & Kok, V. (2002). Strategic human resource management and
organizational performance in Singapore. Compensation & Benefits Review, 34(4), 33-42.
Wang, G. (2002). Control group methods for HPT program evaluation and measurement.
Performance improvement quarterly, 15(2), 32-44
Way C.T., & Robinson C.D. (1998). "Reducing Staff Turnover: A Case Study of Dialysis
Facilities", Health Care Manage. Rev. 23(4), 21-42.
Way, S. (2002). High performance work systems and intermediate indicators of firm
performance within the US Small Business sector. Journal of Management, 28, 765-785
Weil, P.A., Kimball, P.A. (1995). A Model of Voluntary Turnover among Hospital CEOs. Hosp.
Health Service Adm. 40(3), 362-385.
Wiberg, M. (2004), Classical Test Theory versus Item Response Theory. An Evaluation of the
Theory of test in the Driving License Test. Retrieved from www.umcl.se
White, H. (1996). Estimation, inference and specification analysis (No. 22). Cambridge:
university press.
Williams, A.P.O. (2001). A brief-focused process of organisational learning. Journal of
Management Studies, 38 (1), 65-87.
Williamson, O. E. (1975). Markets and hierarchies. New York, 26-30.
Schwab, K. (2010). The global competitiveness report 2010-2011. Geneva: World Economic
Forum.
World of Work Report, (2010). From one crisis to the Next? Geneva: International Labour
Office.
Wright, P. M., & Boswell, W. R. (2002). Desegregating HRM: A review and synthesis of micro
and macro human resource management research. Journal of Management, 28(3), 247-276.
Wright, P. M., Dunford, B. B., & Snell, S. A. (2001). Human resources and the resource based
view of the firm. Journal of Management, 27(6), 701-721.
Wright, P. M., & McMahan, G. C. (1992). Theoretical perspectives for strategic human resource
management. Journal of management, 18(2), 295-320.
Wright, P. M., Gardner, T. M., & Moynihan, L. M. (2003). The impact of HR practices on the
performance of business units. Human Resource Management Journal, 13(3), 21-36.

229 | P a g e
Wright, P.M., Gardner, T.M., Moynihan, L.M., & Allen, M.R. (2005). The relationship between
HR practices and firm performance: examining causal order. Personnel Psychology, 58(2), 409–
446.
Wright, P., McMahan, G., & McWilliams, A. (1994). Human resource as a source of competitive
advantage: A resource based view. International Journal of Human Resource Management, 5,
299-324.
Wright, P. M., McMahan, G. C., McCormick, B., & Scott, S. W. (1998). Strategy, core
competence, and HR involvement as determinants of HR effectiveness and refinery performance.
Journal of Human Resource Management, 37(1), 17.
Wright, P. M., & Snell, S. A. (1991). Toward an integrative view of strategic human resource
management. Human Resource Management Review, 1(3), 203-225.
Yamane, T. (1967). An Introductory Analysis. 3rd
Ed. New York: Harper and Row
Yeung, Arthur K.; Berman, Bob (1997)."Adding value through human resources: Reorienting
human resource measurement to drive business performance." Journal of Human Resource
Management 36(3): 321-335.
Youndt, M., Snell, S., Dean, J. & Lepak, D. (1996). Human resource management,
manufacturing strategy, and firm performance, Academy of Management Journal, 39, .836-866.
Kim, Y. B., & Oh, H. (2004). How do hotel firms obtain a competitive advantage? International
Journal of Contemporary Hospitality Management, 16(1), 65-71.
Zacharatos, A., Barling, J., & Iverson, R. D. (2005). High-performance work systems and
occupational safety. Journal of Applied Psychology, 90(1), 77.
Zheng, C., Morrison, M., & O'Neill, G. (2006). 'An empirical study of high performance
Zikmund, W. G. (1997). Business Research Methods, 5th
Ed. Orlando, FL: The Dryden Press,
Harcourt Brace College Publishers.

230 | P a g e
5.11 APPENDICES
Appendix 1 1 : Managers Questionnaire
Questionnaire No.
MANAGERS QUESTIONNAIRE
UNIVERSITY OF THE WITWATERSRAND; FACULTY OF COMMERCE, LAW AND MANAGEMENT;
SCHOOL OF ECONOMICS AND BUSINESS SCIENCES; JOHANNESBURG
This questionnaire contains a number of statements. Please indicate your preference by TICKING (√) against the
statements that have options ranging from “not at all effective” to “highly effective”, “very bad” to “very good”,
“poor” to “excellent” and by selecting a numerical value against the statements that require one option in numerical
values ranging from 1 to 5 (please select only one value between 1 to 5 on all the options against these types of
statements).
Your cooperation is earnestly solicited for carrying out an effective research.
SECTION A: PERSONAL INFORMATION
Name of Organisation
Position of the Respondent
Please complete the following questionnaire by placing a TICK (√) in the appropriate box
GENDER:
Male Female
1 2
AGE OF RESPONDENT (How old are you?)
18 to 29 years 30 to 40 years 41 to 50 years 51 Years & above
1 2 3 4
MARITAL STATUS
Married Single Other (Specify)
1 2 3
EDUCATION LEVEL: (What is your highest educational qualification?)
Certificate Diploma First Degree Masters
Degree
Professional
certificate
PhD Other
1 2 3 4 5 6 7
EXPERIENCE IN POST: (How many years have you worked in this post?)
Less than
one year
1 to 5 years 6 to 9 years 10 to 15 years 16 to 19 years 20 years & above
1 2 3 4 5 6

231 | P a g e
SECTOR: (What product is your organisation producing?)
Tea Sug
ar
Confectionar
ies
Brew
ery
Bread Dairy Cookin
g oil
Ethanol Cigarett
es
Other(Sp
ecify)
1 2 3 4 5 6 7 8 9 10
ORGANISATION SIZE: (Number of Employees in the organisation)
20 to 60
employees
61 to 90
employees
91 to 120
employees
121 to 150
employees
151 to 200
employees
201 employees
& above
1 2 3 4 5 6
PERCENTAGE OF UNIONISM (Percentage of organisational employees in a union):
None 1-25% 26-50% 51-75% 76-100%
1 2 3 4 5
AGE OF THE FIRM (Years):
3 to 5 years 6 to 9 years 10 to 15 years 16 to 25 years 26 years & above.
1 2 3 4 5
Please complete the following questionnaire by placing a TICK (√) in the appropriate box
SECTION B: BUSINESS STRATYEGY
Please indicate in your opinion, the extent of the importance of business strategy in each important
CODE ITEMS
No
t a
t a
ll i
mp
ort
an
t
slig
htl
y i
mp
ort
an
t
mo
der
ate
ly
imp
ort
an
t
Ver
y i
mp
ort
an
t
extr
em
ely
imp
ort
an
t
BS1 In your opinion, how would you rate the importance of
the cost reduction strategy in your organisation
1 2 3 4 5
BS2 In your opinion, how would you rate the importance of
the price reduction strategy in your organisation
1 2 3 4 5
BS3 In your opinion, how would you rate the importance of
the innovation strategy in your organisation
1 2 3 4 5
BS4 In your opinion, how would you rate the importance of
the improvement of existing products strategy in your
organisation
1 2 3 4 5
BS5 In your opinion, how would you rate the importance of
having a wide variety of products strategy in your
1 2 3 4 5

232 | P a g e
organisation
BS6 In your opinion, how would you rate the importance of
the quality enhancement strategy in your organisation
1 2 3 4 5
BS7 In your opinion, how would you rate the importance of
the distribution channels strategy in your organisation
1 2 3 4 5
BS8 In your opinion, how would you rate the importance of
the customer service strategy in your organisation
1 2 3 4 5
SECTION C: HUMAN RESOURCE MANAGEMENT PRACTICES
RECRUITMENT AND SELECTION
Please rate the effectiveness of recruitment and selection in your organisation in each statement below
CODE ITEMS
no
t a
t a
ll
effe
cti
ve
slig
htl
y
effe
cti
ve
mo
der
ate
l
y e
ffec
tiv
e
ver
y
effe
cti
ve
hig
hly
effe
cti
ve
RS1 In your opinion, how effective is your recruitment
process
1 2 3 4 5
RS2 In your opinion, how effective is your selection
process
1 2 3 4 5
RS3 In your opinion how effective is Selection of a
candidate in your organization based on his/her merit.
1 2 3 4 5
RS4 In your opinion, how effective is your organization
placement of the right person in the right job.
1 2 3 4 5
RS5 In your opinion, how effective filling of vacancies
from qualified employees
who are working in the organization.
1 2 3 4 5
TRAINING AND DEVELOPMENT
Please rate the effectiveness of training and development in your organisation in the statements below
CODE ITEMS
no
t a
t a
ll
effe
cti
ve
slig
htl
y
effe
cti
ve
mo
der
ate
l
y e
ffec
tiv
e
ver
y
effe
cti
ve
hig
hly
effe
cti
ve
TD1 In your opinion, how effective are employee
competences
1 2 3 4 5
TD2 In your opinion how effective is cooperation among
employees
1 2 3 4 5
TD3 In your opinion, how effective is the identification of
training needs
1 2 3 4 5
TD4 In your opinion how effective are training programmes 1 2 3 4 5
TD5 In your opinion how effective are employee
development programmes
1 2 3 4 5

233 | P a g e
PERFORMANCE APPRAISAL
Please rate the use of performance appraisal in your organisation in the statement below
CODE ITEMS
Nev
er u
se
Alm
ost
nev
er
Occ
asi
on
a
lly
/so
met
i
mes
Alm
ost
ever
y t
ime
freq
uen
tly
use
PA1 How would you rate the use of performance appraisal in
your organisation?
1 2 3 4 5
PA2 How would you rate use of formal & written
performance appraisal system
1 2 3 4 5
PA3 How would you rate use of performance appraisal data
in making decisions
1 2 3 4 5
PA4 How would you rate upfront communication about the
objective of performance appraisal
1 2 3 4 5
COMPENSATION
Please rate the use of compensation in your organisation in the statements below
CODE ITEMS
Nev
er u
se
Alm
ost
nev
er
Occ
asi
on
a
lly
/so
met
i
mes
Alm
ost
ever
y t
ime
freq
uen
tly
use
COM1 How would you rate the use of rewards in your
organisation?
1 2 3 4 5
COM2 How would you rate the use of incentives in your
organisation?
1 2 3 4 5
COM3 How would you rate use of matching pay with
performance
1 2 3 4 5
COM4 How would you rate use of industry wide benefits in
your organisation
1 2 3 4 5
COM5 How would you rate use of regular pay revisions in
your organization.
1 2 3 4 5
SECTION D: EMPLOYEE ATTITUDES
Please rate employee attitudes in your organisation in the statements below

234 | P a g e
CODE ITEMS
ver
y b
ad
Ba
d
Fa
ir
Go
od
ver
y g
oo
d
EA1 How would you rate employee motivation in your
organisation the past three years?
1 2 3 4 5
EA2 How would you rate employee commitment in your
organisation the past three years?
1 2 3 4 5
EA3 How would you rate employee satisfaction in your
organisation the past three years?
1 2 3 4 5
SECTION E: EMPLOYEE BEHAVIOURS
Please rate employee behaviours in your organisation in the statements below
CODE ITEMS
ver
y s
ma
ll
Sm
all
Fa
ir
Big
ver
y B
ig
EB1 How would you rate the number of voluntary leaves in
your organisation the past three years?
1 2 3 4 5
EB2 How would you rate the number of absences in your
organisation the past three years?
1 2 3 4 5
EB3 How would you rate the number of disputes within the
organisation the past three years?
1 2 3 4 5
SECTION F: ORGANISATIONAL PERFORMANCE
Please rate the performance of your organisation against your competitors in your industry for the past three years in
the statements below.
CODE ITEMS
ver
y p
oo
r
Po
or
Fa
ir
Go
od
Ver
y
Go
od
OP1 How would you rate the overall manufacturing
throughput in the past three years?
1 2 3 4 5
OP2 How would you rate the overall quality of products the
past three years?
1 2 3 4 5
OP3 How would you rate the overall organisational
delivery flexibility?
1 2 3 4 5
OP4 How would you rate the overall organizational scope
flexibility?
1 2 3 4 5
OP5 How would you rate the overall cost reduction 1 2 3 4 5
THANK YOU FOR YOUR PARTICIPATYION IN THE SURVEY
YOUR TIME AND EFFORT IN COMPLETING THE QUESTIONNAIRE IS MUCH APPRECIATED.

235 | P a g e
Appendix 1 2: Employees Questionnaire
Questionnaire No.
EMPLOYEES QUESTIONNAIRE
UNIVERSITY OF THE WITWATERSRAND; FACULTY OF COMMERCE, LAW AND MANAGEMENT;
SCHOOL OF ECONOMICS AND BUSINESS SCIENCES; JOHANNESBURG
This questionnaire contains a number of statements. Please indicate your preference by TICKING (√) against the
statements that have options by encircling a numerical value against the statements that require only one option in
numerical values ranging from 1 meaning you “strongly disagree” to 5 meaning you “strongly agree” (please select
only one value between 1 to 5 on all the options against these types of statements).
Your cooperation is earnestly solicited for carrying out an effective research.
SECTION A: PERSONAL INFORMATION
Name of Organisation
Position of the Respondent
Please complete the following questionnaire by placing a TICK (√) in the appropriate box
GENDER:
Male Female
1 2
AGE OF RESPONDENT (How old are you?)
18 to 29 years 30 to 40 years 40 to 50 years 51 Years and above
1 2 3 4
MARITAL STATUS
Married Single Other (Specify)
1 2 3
EDUCATION LEVEL: (What is your highest educational qualification?)
Primary
Certificate
Diploma First Degree Masters Degree Professional
certificate
PhD Other
1 2 3 4 5 6 7
EXPERIENCE IN POST: (How many years have you worked in this post?)
3 to 5 years 6 to 9 years 10 to 15 years 16 to 19 years 20 years & above
1 2 3 4 5

236 | P a g e
SECTOR: (What product is your organisation producing?)
Tea Sugar Confectionaries Brewery Bread Dairy Cooking oil Ethanol Other(Spec
ify)
1 2 3 4 5 6 7 8 9
DEPARTMENT (Which department do you belong to?)
Human Resources Finance Operations/Production
1 2 3
Please complete the following questionnaire by placing a TICK (√) in the appropriate box.
SECTION B: BUSINESS STRATEGY
Please indicate the level of your agreement with the statements below.
CODE ITEMS
Str
on
gly
dis
ag
ree
Dis
ag
ree
Neu
tra
l
Ag
ree
Str
on
gly
ag
ree
EBS1 This organisation undertakes to minimize costs of production
as important.
1 2 3 4 5
EBS2 This organisation considers price reduction of our products
as important.
1 2 3 4 5
EBS3 This organisation takes innovation of the products it makes
as important.
1 2 3 4 5
EBS4 This organisation considers improving quality of its existing
products important.
1 2 3 4 5
EBS5 This organisation considers important having a wide variety
of products.
1 2 3 4 5
EBS6 This firm puts importance on enhancing the quality of its
products.
1 2 3 4 5
EBS7 This firm considers distribution channels of its products very
important.
1 2 3 4 5
EBS8 This organisation considers customer service to be very
important.
1 2 3 4 5
SECTION C: HUMAN RESOURCE MANAGEMENT PRACTICES
RECRUITMENT AND SELECTION
Please indicate the level of your agreement with the statements below

237 | P a g e
CODE ITEMS
Str
on
gly
dis
ag
ree
Dis
ag
ree
Neu
tra
l
Ag
ree
Str
on
gly
ag
ree
ERS1 Applicants are fully informed about the qualifications
required to perform the job before being hired.
1 2 3 4 5
ERS2 Applicants undergo a medical test before being hired. 1 2 3 4 5
ERS3 Vacancies are filled from qualified employees 1 2 3 4 5
ERS4 Applicants undergo structured interviews (job related
questions, same questions asked of all applicants) before
being hired.
1 2 3 4 5
ERS5 Job advertisements in newspapers are used by the company to
recruit people.
1 2 3 4 5
ERS6 In this organization, there is formal induction, orientation and
familiarization process designed to help the new recruits
understand the organization.
1 2 3 4 5
ERS7 Selection system in our organization selects those having the
desired knowledge, skills and attitudes.
1 2 3 4 5
TRAINING AND DEVELOPMENT
Please indicate the level of your agreement with the statements below
CODE ITEMS
Str
on
gly
dis
ag
ree
Dis
ag
ree
Neu
tra
l
Ag
ree
Str
on
gly
ag
ree
ETD1 This organization conducts extensive training programs for
its employees in all aspects.
1 2 3 4 5
ETD2 This organisation provides training opportunities to learn and
grow
1 2 3 4 5
ETD3 The objective of the training programmes is complete
understanding of different management functions in its
totality.
1 2 3 4 5
ETD4 Training needs identified are realistic, useful and based on
the business strategy of the organization.
1 2 3 4 5
ETD5 The training programmes have improved my decision-
making skills
1 2 3 4 5
PERFORMANCE APPRAISAL
Please indicate the level of your agreement with the statements below
CODE ITEMS
Str
on
gly
dis
ag
ree
Dis
ag
ree
Neu
tra
l
Ag
ree
Str
on
gly
ag
ree
EPA1 The performance appraisal is fair and unbiased. 1 2 3 4 5
EPA2 There is a formal & written performance 1 2 3 4 5
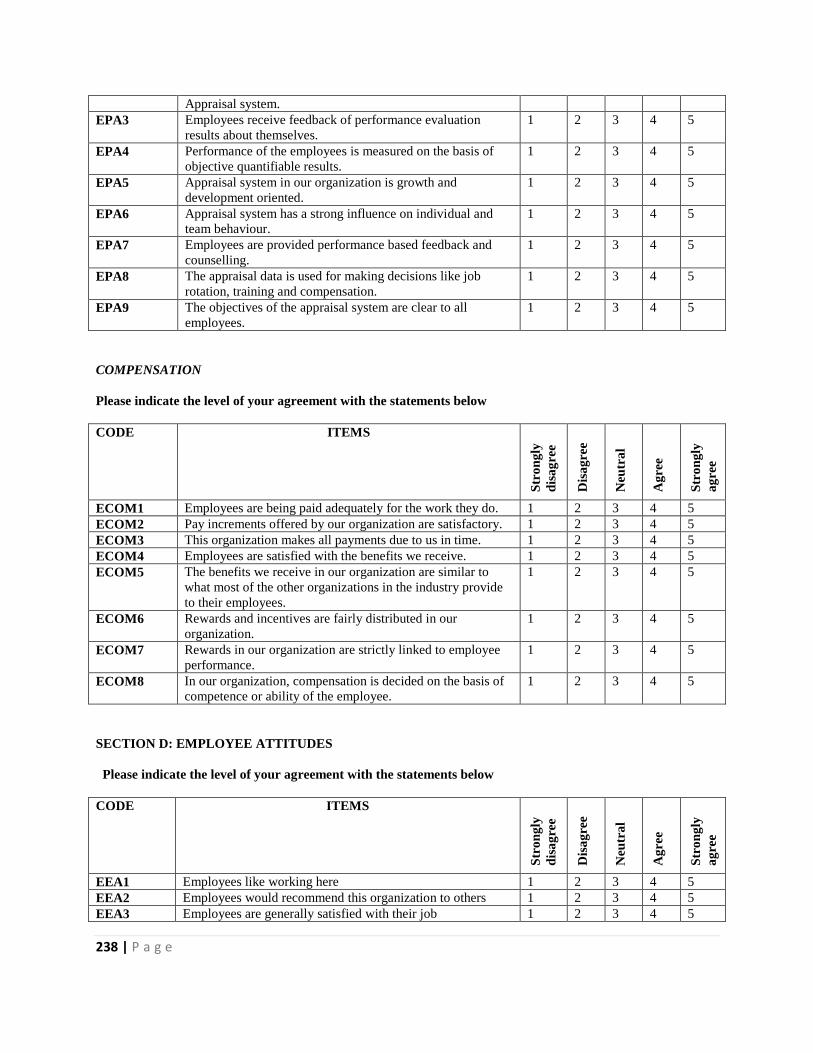
238 | P a g e
Appraisal system.
EPA3 Employees receive feedback of performance evaluation
results about themselves.
1 2 3 4 5
EPA4 Performance of the employees is measured on the basis of
objective quantifiable results.
1 2 3 4 5
EPA5 Appraisal system in our organization is growth and
development oriented.
1 2 3 4 5
EPA6 Appraisal system has a strong influence on individual and
team behaviour.
1 2 3 4 5
EPA7 Employees are provided performance based feedback and
counselling.
1 2 3 4 5
EPA8 The appraisal data is used for making decisions like job
rotation, training and compensation.
1 2 3 4 5
EPA9 The objectives of the appraisal system are clear to all
employees.
1 2 3 4 5
COMPENSATION
Please indicate the level of your agreement with the statements below
CODE ITEMS
Str
on
gly
dis
ag
ree
Dis
ag
ree
Neu
tra
l
Ag
ree
Str
on
gly
ag
ree
ECOM1 Employees are being paid adequately for the work they do. 1 2 3 4 5
ECOM2 Pay increments offered by our organization are satisfactory. 1 2 3 4 5
ECOM3 This organization makes all payments due to us in time. 1 2 3 4 5
ECOM4 Employees are satisfied with the benefits we receive. 1 2 3 4 5
ECOM5 The benefits we receive in our organization are similar to
what most of the other organizations in the industry provide
to their employees.
1 2 3 4 5
ECOM6 Rewards and incentives are fairly distributed in our
organization.
1 2 3 4 5
ECOM7 Rewards in our organization are strictly linked to employee
performance.
1 2 3 4 5
ECOM8 In our organization, compensation is decided on the basis of
competence or ability of the employee.
1 2 3 4 5
SECTION D: EMPLOYEE ATTITUDES
Please indicate the level of your agreement with the statements below
CODE ITEMS
Str
on
gly
dis
ag
ree
Dis
ag
ree
Neu
tra
l
Ag
ree
Str
on
gly
ag
ree
EEA1 Employees like working here 1 2 3 4 5
EEA2 Employees would recommend this organization to others 1 2 3 4 5
EEA3 Employees are generally satisfied with their job 1 2 3 4 5

239 | P a g e
EEA4 Employees are proud to work for this organisation 1 2 3 4 5
EEA5 Employees feel a strong sense of loyalty to this organisation 1 2 3 4 5
SECTION E: EMPLOYEE BEHAVIOURS
Please indicate the level of your agreement with the statements below
CODE ITEMS
Str
on
gly
dis
ag
ree
Dis
ag
ree
Neu
tra
l
Ag
ree
Str
on
gly
ag
ree
EEB1 There are many disputes with the employer in the firm 1 2 3 4 5
EEB2 Many employees do absent themselves from work 1 2 3 4 5
EEB3 Many employees leave or quit this organisation 1 2 3 4 5
SECTION F: ORGANISATIONAL PERFORMANCE
Please indicate the level of your agreement with the statements below
CODE ITEMS
Str
on
gly
dis
ag
ree
Dis
ag
ree
Neu
tra
l
Ag
ree
Str
on
gly
ag
ree
EOP1 This organisation takes the shortest time to make a product 1 2 3 4 5
EOP2 This organisation makes the best quality products 1 2 3 4 5
EOP3 This organisation is flexible with delivery of the products 1 2 3 4 5
EOP4 This organisation can deliver different types of products as
per customer needs
1 2 3 4 5
EOP5 This organisation works hard to reduce costs 1 2 3 4 5
THANK YOU FOR YOUR PARTICIPATYION IN THE SURVEY
YOUR TIME AND EFFORT IN COMPLETING THE QUESTIONNAIRE IS MUCH APPRECIATED.
Appendix 2. 1: Proportionate Sampling
STRATUM STRATUM POPULATION SIZE STRATUM SAMPLE
SIZE
Sugar 4 1.6 2
Tea 9 3.6 3

240 | P a g e
Cooking oil 12 4.8 4
Dairy/Juices 7 2.8 3
Cigarettes 2 0.8 1
Beverages 7 2.8 3
Confectionaries 4 1.6 2
Textiles 2 0.8 1
Ethanol Fuel 2 0.8 1
Total 49 19.6 20
Appendix 1 3: Consent to collect data
LILONGWEDAIRY (2001) LTD. LONG UFE Mil k
Processors of Dairy Products and Fruit Juices Tel: +2651 754111/753111
Fax: +2651 752 111 E-mail: [email protected]
P.O. Box 111 Lilongwe, Malawi
Our Ref: Your Ref:
University of the Witwatersrand
School of Economics & Business Sciences
Johannesburg South Africa 9 June 2015 Dear Sir, REF: CONSENT OF REQUEST TO CONDUCT ACADEMIC RESEARCH - PRIMARY RESEARCHER RONNIE MVULA We acknowledge your request for Lilongwe Dairy (2001) Limited to be in the sample of organizations for your research and are pleased to give consent to Mr. Ronnie Mvula to collect data for his research from our firm. As an agricultural manufacturing firm we would be pleased to have a share of the study findings after the research is concluded. EDWIN CHILUNDO GENERAL MANAGER - OPERATIONS AND BUSINESS DEVELOPMENT

241 | P a g e

242 | P a g e

243 | P a g e
Appendix 3 1 Participant consent
EMPLOYEE PARTICIPATION LETTER
Empirical Study of the reverse causality of organisational behaviour and employee
behaviour in the Agricultural manufacturing sector of Malawi.
21st October, 2015
Dear Sir/Madam,
My name is Ronnie Mvula and Iam a PhD student in the Management and Human Resource
Division at the University of the Witwatersrand, Johannesburg. I am conducting research on the
topic “Reverse causality of organisational behaviour and employee behaviour in the Agricultural
manufacturing sector of Malawi”. Reverse causality is concerned with whether the performance
of the firm motivates the behaviour of employees is the Human Resources practices and firm
performance model. The purpose of this survey is to investigate how organisational performance
motivates employee behaviour.
Studies have shown that human resource management practices influence organisational
performance through employee attitudes and behaviour. However, there is no study providing
evidence of how organisational performance affects employee behaviour.
As an employee, you are invited to take part in this survey by completing a questionnaire. Your
response is important and there are no right or wrong answers. This survey is both confidential
and anonymous. Anonymity and confidentiality are guaranteed by not needing to enter your
name on the questionnaire. Your participation is completely voluntary and involves no risk,
penalty, or loss of benefits whether or not you participate. You may withdraw from the survey at
any stage.
The first part of the survey captures some demographic data. Please tick whichever boxes are
applicable. The second part of the survey comprises 50 statements. Please indicate the extent to
which you agree with each statement, by ticking in the appropriate box. The entire survey should
take between 15 to 20 minutes to complete. The survey was approved unconditionally by the
Wits University Research Ethics Committee (Non-Medical), Protocol Number: H15/09/25.

244 | P a g e
Thank you for considering participating. Should you have any questions, or should you wish to
obtain a copy of the results of the survey, please contact me on +27613093907 or at
[email protected]; or [email protected];
My supervisor’s name and email are: Prof. Michael O. Samuel; Email:
Kind regards
Ronnie Mvula
PhD Student
Division of Management and Human Resources Management.
School of Economic and Business Sciences
University of the Witwatersrand, Johannesburg
MANAGERS PARTICIPATION LETTER
Empirical Study of the reverse causality of organisational behaviour and employee
behaviour in the Agricultural manufacturing sector of Malawi.
21st
October, 2015
Dear Sir/Madam,
My name is Ronnie Mvula and Iam a PhD student in the Management and Human Resource
Division at the University of the Witwatersrand, Johannesburg. I am conducting research on the
topic “Reverse causality of organisational behaviour and employee behaviour in the Agricultural
manufacturing sector of Malawi”. Reverse causality is concerned with whether the performance
of the firm motivates the behaviour of employees is the Human Resources practices and firm
performance model. The purpose of this survey is to investigate how organisational performance
motivates employee behaviour.

245 | P a g e
Studies have shown that human resource management practices influence organisational
performance through employee attitudes and behaviour. However, there is no study providing
evidence of how organisational performance affects employee behaviour.
As a Manager, you are invited to take part in this survey by completing a questionnaire. Your
response is important and there are no right or wrong answers. This survey is both confidential
and anonymous. Anonymity and confidentiality are guaranteed by not needing to enter your
name on the questionnaire. Your participation is completely voluntary and involves no risk,
penalty, or loss of benefits whether or not you participate. You may withdraw from the survey at
any stage.
The first part of the survey captures some demographic data. Please tick whichever boxes are
applicable. The second part of the survey comprises 28 statements. Please indicate the extent to
which you agree with each statement, by ticking in the appropriate box. The entire survey should
take between 10 to 15 minutes to complete. The survey was approved unconditionally by the
Wits University Research Ethics Committee (Non-Medical), Protocol Number: H15/09/25.
Thank you for considering participating. Should you have any questions, or should you wish to
obtain a copy of the results of the survey, please contact me on +27613093907 or at
[email protected]; or [email protected];
My supervisor’s name and email are: Prof. Michael O. Samuel; Email:
Kind regards
Ronnie Mvula
PhD Student
Division of Management and Human Resources Management.
School of Economic and Business Sciences
University of the Witwatersrand, Johannesburg

246 | P a g e
Appendix 3 2: Ethics
Clearance

247 | P a g e
Appendix 3 3: Approved PhD title

248 | P a g e
Appendix 4 1: Rotated Component Matrix
Rotated Component Matrixa
Component
1 2 3 4 5 6
EPA4 .795 .187 .129 .302 .181 .132
EPA5 .788 .211 .154 .258 .157 .186
EPA2 .773 .235 .188 .241 .125 .114
EPA3 .759 .239 .181 .297 .128 .110
EPA6 .757 .252 .253 .121 .146 .201
EPA7 .737 .326 .208 .014 .184 .199
EPA1 .725 .191 .149 .244 .141 .030
ETD3 .720 .194 .176 .224 .113 .181
EPA9 .709 .328 .235 .038 .140 .257
ETD5 .706 .414 .121 .224 .075 .062
ETD2 .696 .265 .251 .218 .108 .125
EPA8 .675 .319 .219 .088 .115 .312
ETD4 .671 .295 .091 .216 .138 .189
ERS4 .322 .766 .235 .190 .142 .140
ERS5 .291 .749 .226 .132 .185 .123
ERS1 .227 .725 .285 .183 .129 .065
ERS6 .376 .720 .235 .161 .154 .089
ERS3 .435 .680 .161 .258 .133 .146
ERS7 .371 .635 .031 .006 .225 .179
ERS2 .366 .575 .169 .386 .130 .196
EEA3 .274 .286 .812 .174 .106 .188
EEA1 .191 .238 .810 .102 .152 .093
EEA2 .357 .157 .697 .216 .031 .300
EEA4 .344 .297 .692 .239 .133 .140
ECOM5 .354 .264 .217 .739 .155 .135
ECOM7 .462 .246 .171 .699 .108 .257
ECOM6 .471 .264 .230 .674 .090 .245
ECOM8 .478 .216 .274 .668 .065 .191
EBS3 .182 .118 .135 .089 .850 .107
EBS4 .148 .117 .186 .007 .825 -.042
EBS1 .062 .205 -.059 .049 .714 .139
EBS2 .349 .161 .113 .209 .668 .262
EEB1 .149 .149 .110 .086 .106 .791

249 | P a g e
EEB3 .304 .097 .184 .226 .132 .770
EEB2 .259 .187 .206 .173 .139 .758
Appendix 4 2: Reliability and item analysis for Business Strategy.
Scale Mean if
Item Deleted
Scale Variance if
Item Deleted
Corrected Item-Total
Correlation
Squared Multiple
Correlation
Cronbach's Alpha if
Item Deleted
BS1 32.36 8.971 .367 .363 .832
BS2 32.27 8.464 .474 .407 .818
BS3 32.26 7.932 .657 .652 .791
BS4 32.17 7.984 .697 .640 .786
BS5 32.17 8.116 .598 .591 .800
BS6 32.09 8.900 .658 .553 .800
BS7 32.29 8.549 .515 .456 .811
BS8 32.30 8.817 .510 .384 .812
Source: Primary data
Reliability Statistics for Business Strategy Scale
Cronbach's Alpha Cronbach's Alpha Based on Standardized Items N of Items
.827 .833 8
Source: Primary data
Appendix 4 3: Reliability and item analysis for Business Strategy
Item-Total Statistics
Scale Mean
if Item
Deleted
Scale
Variance if
Item Deleted
Corrected Item-
Total
Correlation
Squared
Multiple
Correlation
Cronbach's
Alpha if Item
Deleted
EBS1 30.77 15.487 .491 .412 .883
EBS2 30.81 13.845 .605 .543 .876
EBS3 30.56 14.423 .744 .709 .859
EBS4 30.47 14.628 .721 .691 .862
EBS5 30.43 14.298 .722 .671 .861
EBS6 30.46 13.878 .738 .712 .859
EBS7 30.47 14.686 .671 .706 .866
EBS8 30.46 15.292 .550 .505 .878
Reliability Statistics
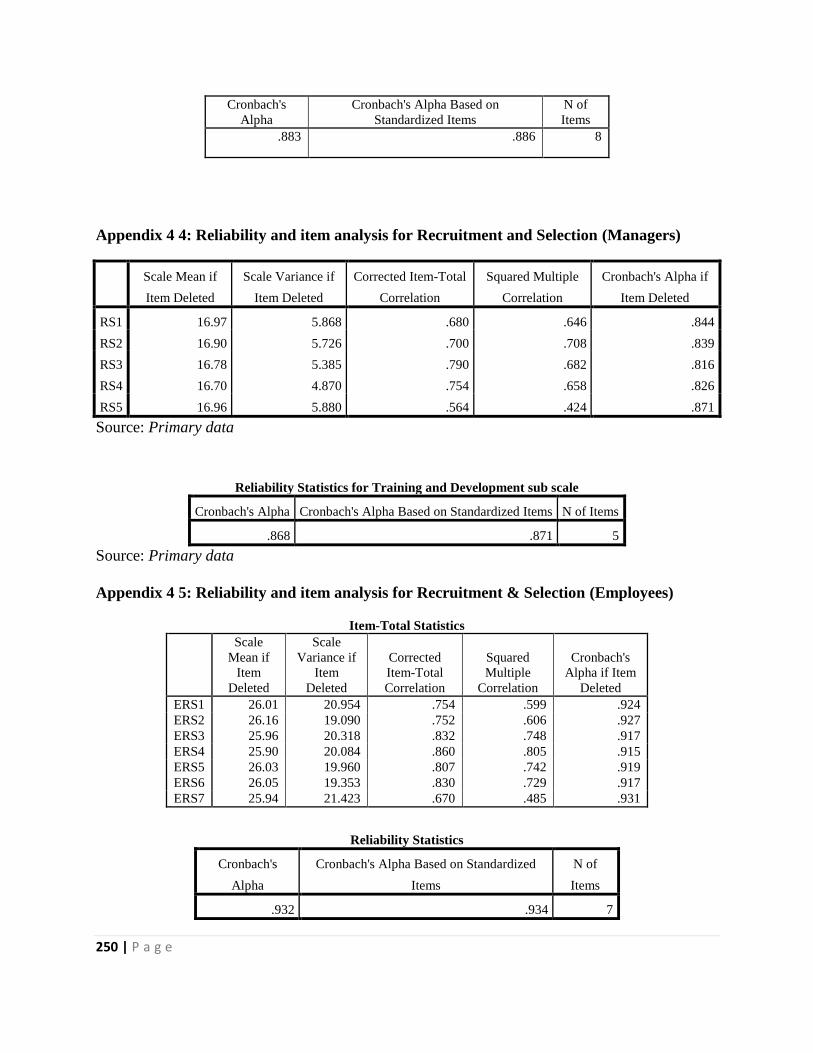
250 | P a g e
Cronbach's
Alpha
Cronbach's Alpha Based on
Standardized Items
N of
Items
.883 .886 8
Appendix 4 4: Reliability and item analysis for Recruitment and Selection (Managers)
Scale Mean if
Item Deleted
Scale Variance if
Item Deleted
Corrected Item-Total
Correlation
Squared Multiple
Correlation
Cronbach's Alpha if
Item Deleted
RS1 16.97 5.868 .680 .646 .844
RS2 16.90 5.726 .700 .708 .839
RS3 16.78 5.385 .790 .682 .816
RS4 16.70 4.870 .754 .658 .826
RS5 16.96 5.880 .564 .424 .871
Source: Primary data
Reliability Statistics for Training and Development sub scale
Cronbach's Alpha Cronbach's Alpha Based on Standardized Items N of Items
.868 .871 5
Source: Primary data
Appendix 4 5: Reliability and item analysis for Recruitment & Selection (Employees)
Item-Total Statistics
Scale
Mean if
Item
Deleted
Scale
Variance if
Item
Deleted
Corrected
Item-Total
Correlation
Squared
Multiple
Correlation
Cronbach's
Alpha if Item
Deleted
ERS1 26.01 20.954 .754 .599 .924
ERS2 26.16 19.090 .752 .606 .927
ERS3 25.96 20.318 .832 .748 .917
ERS4 25.90 20.084 .860 .805 .915
ERS5 26.03 19.960 .807 .742 .919
ERS6 26.05 19.353 .830 .729 .917
ERS7 25.94 21.423 .670 .485 .931
Reliability Statistics
Cronbach's
Alpha
Cronbach's Alpha Based on Standardized
Items
N of
Items
.932 .934 7

251 | P a g e
Appendix 4 6: Reliability and item analysis for Training and Development (Managers)
Scale Mean if
Item Deleted
Scale Variance if
Item Deleted
Corrected Item-Total
Correlation
Squared Multiple
Correlation
Cronbach's Alpha if
Item Deleted
TD1 17.53 9.910 .707 .607 .925
TD2 17.34 9.437 .824 .708 .905
TD3 17.32 9.327 .827 .738 .904
TD4 17.42 8.167 .856 .860 .899
TD5 17.35 8.836 .827 .806 .903
Source: Primary data
Reliability Statistics for Recruitment and Selection subscale
Cronbach's Alpha Cronbach's Alpha Based on Standardized Items N of Items
.925 .926 5
Source: Primary data
Appendix 4 7 Reliability and item analysis for Training and Development (Employees)
Item-Total Statistics
Scale Mean if
Item Deleted
Scale Variance if
Item Deleted
Corrected Item-
Total Correlation
Cronbach's Alpha if
Item Deleted
EDT1 16.72 12.137 .823 .922
EDT2 16.64 11.672 .887 .910
ETD3 16.63 12.233 .854 .916
ETD4 16.62 12.354 .806 .925
ETD5 16.64 12.323 .773 .931
Reliability Statistics
Cronbach's Alpha Cronbach's Alpha Based on Standardized Items N of Items
.936 .936 5
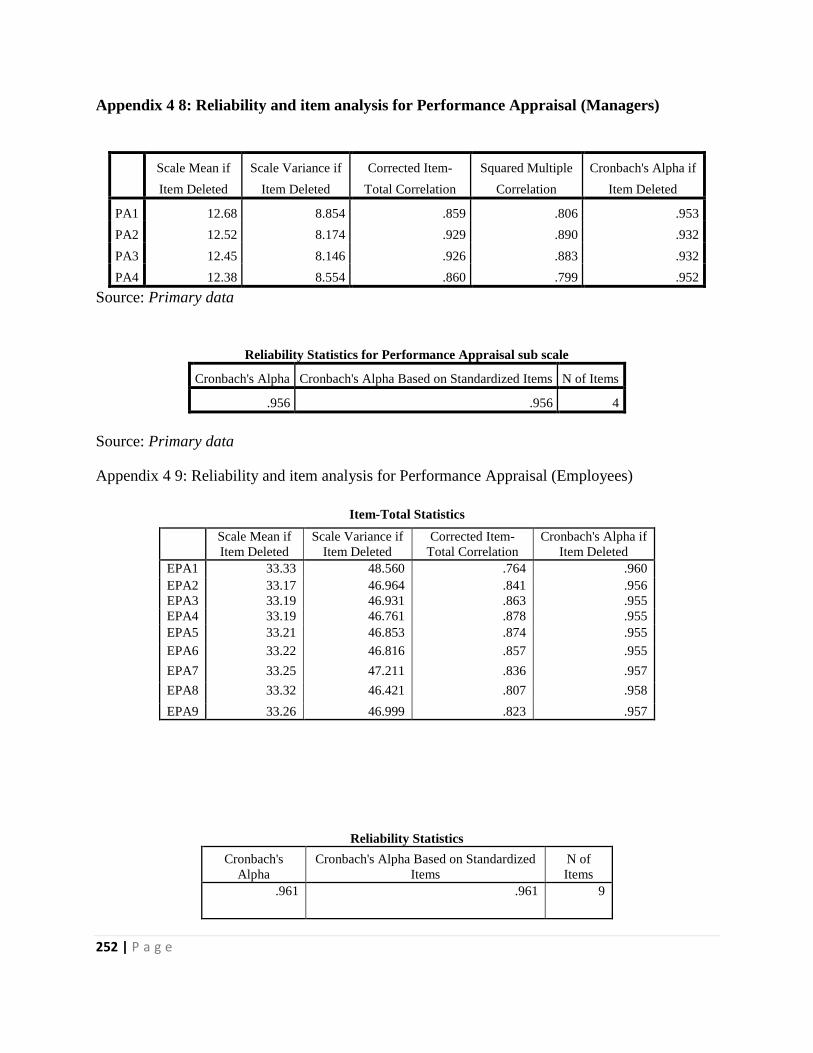
252 | P a g e
Appendix 4 8: Reliability and item analysis for Performance Appraisal (Managers)
Scale Mean if
Item Deleted
Scale Variance if
Item Deleted
Corrected Item-
Total Correlation
Squared Multiple
Correlation
Cronbach's Alpha if
Item Deleted
PA1 12.68 8.854 .859 .806 .953
PA2 12.52 8.174 .929 .890 .932
PA3 12.45 8.146 .926 .883 .932
PA4 12.38 8.554 .860 .799 .952
Source: Primary data
Reliability Statistics for Performance Appraisal sub scale
Cronbach's Alpha Cronbach's Alpha Based on Standardized Items N of Items
.956 .956 4
Source: Primary data
Appendix 4 9: Reliability and item analysis for Performance Appraisal (Employees)
Item-Total Statistics
Scale Mean if
Item Deleted
Scale Variance if
Item Deleted
Corrected Item-
Total Correlation
Cronbach's Alpha if
Item Deleted
EPA1 33.33 48.560 .764 .960
EPA2 33.17 46.964 .841 .956
EPA3 33.19 46.931 .863 .955
EPA4 33.19 46.761 .878 .955
EPA5 33.21 46.853 .874 .955
EPA6 33.22 46.816 .857 .955
EPA7 33.25 47.211 .836 .957
EPA8 33.32 46.421 .807 .958
EPA9 33.26 46.999 .823 .957
Reliability Statistics
Cronbach's
Alpha
Cronbach's Alpha Based on Standardized
Items
N of
Items
.961 .961 9

253 | P a g e
Appendix 4 10: Reliability and item analysis for compensation (Managers)
Scale
Mean if
Item
Deleted
Scale
Variance if
Item
Deleted
Corrected
Item-Total
Correlation
Squared
Multiple
Correlation
Cronbach's
Alpha if Item
Deleted
COM1 17.90 9.200 .773 .723 .895
COM2 17.81 8.922 .787 .773 .892
COM3 17.73 8.490 .884 .807 .871
COM4 17.69 10.007 .747 .720 .902
COM5 17.82 9.230 .719 .691 .907
Source: Primary data
Reliability Statistics for compensation sub scale
Cronbach's
Alpha
Cronbach's Alpha Based on
Standardized Items
N of
Items
.913 .914 5
Source: Primary data.
Appendix 4 11: Reliability and item analysis for Compensation (Employees)
Item-Total Statistics
Scale Mean if
Item Deleted
Scale Variance if
Item Deleted
Corrected Item-
Total Correlation
Cronbach's Alpha if
Item Deleted
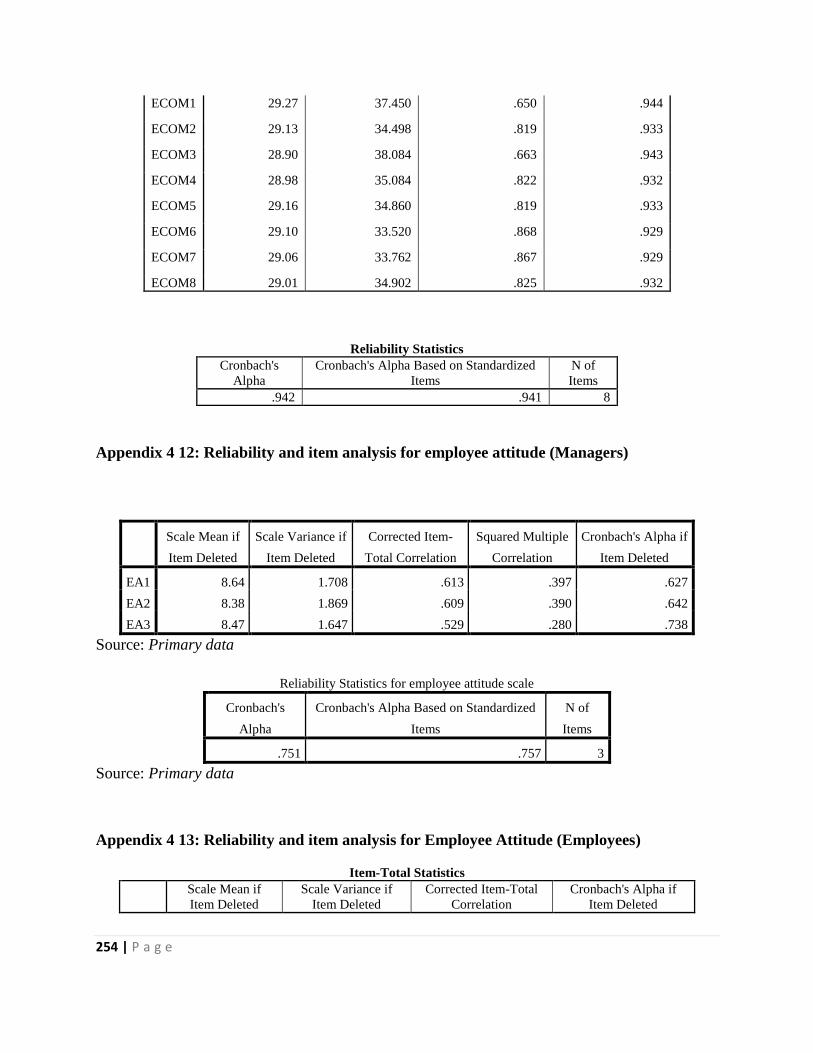
254 | P a g e
ECOM1 29.27 37.450 .650 .944
ECOM2 29.13 34.498 .819 .933
ECOM3 28.90 38.084 .663 .943
ECOM4 28.98 35.084 .822 .932
ECOM5 29.16 34.860 .819 .933
ECOM6 29.10 33.520 .868 .929
ECOM7 29.06 33.762 .867 .929
ECOM8 29.01 34.902 .825 .932
Reliability Statistics
Cronbach's
Alpha
Cronbach's Alpha Based on Standardized
Items
N of
Items
.942 .941 8
Appendix 4 12: Reliability and item analysis for employee attitude (Managers)
Scale Mean if
Item Deleted
Scale Variance if
Item Deleted
Corrected Item-
Total Correlation
Squared Multiple
Correlation
Cronbach's Alpha if
Item Deleted
EA1 8.64 1.708 .613 .397 .627
EA2 8.38 1.869 .609 .390 .642
EA3 8.47 1.647 .529 .280 .738
Source: Primary data
Reliability Statistics for employee attitude scale
Cronbach's
Alpha
Cronbach's Alpha Based on Standardized
Items
N of
Items
.751 .757 3
Source: Primary data
Appendix 4 13: Reliability and item analysis for Employee Attitude (Employees)
Item-Total Statistics
Scale Mean if
Item Deleted
Scale Variance if
Item Deleted
Corrected Item-Total
Correlation
Cronbach's Alpha if
Item Deleted

255 | P a g e
EEA1 17.20 9.275 .703 .901
EEA2 17.10 8.492 .789 .883
EEA3 17.10 8.080 .878 .863
EEA4 17.04 8.435 .849 .870
EEA5 17.05 9.287 .630 .916
Reliability Statistics
Cronbach's
Alpha
Cronbach's Alpha Based on
Standardized Items
N of
Items
.908 .908 5
Appendix 4 14: Reliability Statistics for employee behaviour (Managers)
Scale Mean if
Item Deleted
Scale Variance if
Item Deleted
Corrected Item-
Total Correlation
Squared Multiple
Correlation
Cronbach's Alpha if
Item Deleted
EB1 3.25 2.557 .626 .464 .764
EB2 3.16 2.528 .761 .583 .631
EB3 3.21 2.614 .587 .390 .807
Source: Primary data
Reliability Statistics for employee behaviour scale
Cronbach's
Alpha
Cronbach's Alpha Based on
Standardized Items
N of
Items
.806 .810 3
Source: Primary data
Appendix 4 15: Reliability and item analysis for Employee Behaviour (Employees)
Item-Total Statistics

256 | P a g e
Scale Mean if
Item Deleted
Scale Variance if
Item Deleted
Corrected Item-Total
Correlation
Cronbach's Alpha if
Item Deleted
EEB1 8.67 3.318 .625 .875
EEB2 8.63 2.982 .777 .735
EEB3 8.64 2.875 .760 .749
Reliability Statistics
Cronbach's
Alpha
Cronbach's Alpha Based on Standardized
Items
N of
Items
.849 .849 3
Appendix 4 16 Reliability and item analysis for Organisational performance (Managers)
Scale Mean if
Item Deleted
Scale Variance
if Item Deleted
Corrected Item-
Total Correlation
Squared Multiple
Correlation
Cronbach's Alpha
if Item Deleted
OP1 18.14 4.492 .605 .617 .840
OP2 17.84 4.765 .668 .719 .818
OP3 17.83 4.458 .805 .716 .783
OP4 17.81 4.738 .715 .700 .808
OP5 17.78 4.937 .548 .580 .849
Source: Primary data
Reliability Statistics for Organisational performance scale
Cronbach's
Alpha
Cronbach's Alpha Based on Standardized
Items
N of
Items
.851 .855 5
Source: Primary data
Appendix 4 17: Reliability and item statistics of the Organisational Performance scale
(Employees)

257 | P a g e
Item-Total Statistics
Scale Mean if
Item Deleted
Scale Variance if
Item Deleted
Corrected Item-Total
Correlation
Cronbach's Alpha if
Item Deleted
EOP1 18.15 4.496 .364 .831
EOP2 17.67 4.666 .620 .719
EOP3 17.65 4.548 .672 .702
EOP4 17.66 4.478 .679 .699
EOP5 17.62 4.849 .549 .741
Reliability Statistics
Cronbach's
Alpha
Cronbach's Alpha Based on
Standardized Items
N of
Items
.779 .803 5
Appendix 4 18: Results of exploratory factor analysis: Business Strategy
KMO and Bartlett's Test
Kaiser-Meyer-Olkin Measure of Sampling Adequacy. .827
Bartlett's Test of Sphericity Approx. Chi-Square 1551.409
df 28
Sig. .000
Factor Matrixa
Factor
1 2
EBS1 .512 .396
EBS2 .642 .391
EBS3 .801 .339
EBS4 .775 .198
EBS5 .780 -.081
EBS6 .826 -.329
EBS7 .773 -.499
EBS8 .597 -.265
Extraction Method: Principal Axis Factoring.
a. 2 factors extracted. 12 iterations required.
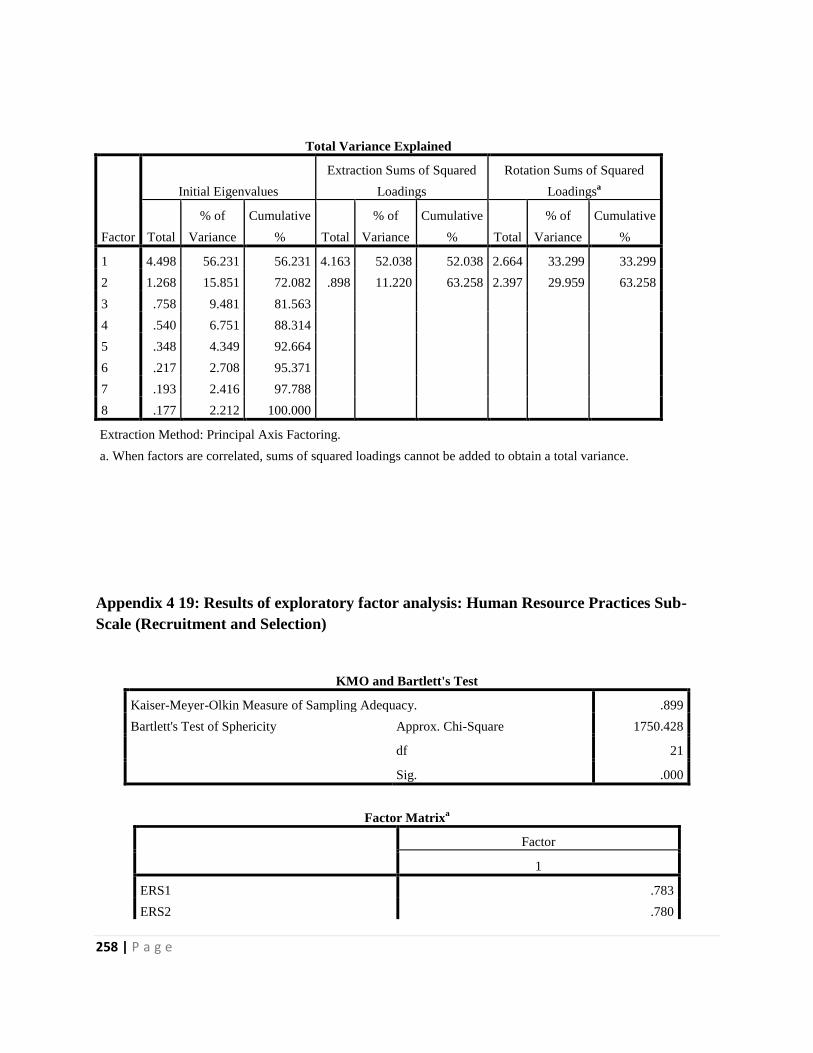
258 | P a g e
Total Variance Explained
Factor
Initial Eigenvalues
Extraction Sums of Squared
Loadings
Rotation Sums of Squared
Loadingsa
Total
% of
Variance
Cumulative
% Total
% of
Variance
Cumulative
% Total
% of
Variance
Cumulative
%
1 4.498 56.231 56.231 4.163 52.038 52.038 2.664 33.299 33.299
2 1.268 15.851 72.082 .898 11.220 63.258 2.397 29.959 63.258
3 .758 9.481 81.563
4 .540 6.751 88.314
5 .348 4.349 92.664
6 .217 2.708 95.371
7 .193 2.416 97.788
8 .177 2.212 100.000
Extraction Method: Principal Axis Factoring.
a. When factors are correlated, sums of squared loadings cannot be added to obtain a total variance.
Appendix 4 19: Results of exploratory factor analysis: Human Resource Practices Sub-
Scale (Recruitment and Selection)
KMO and Bartlett's Test
Kaiser-Meyer-Olkin Measure of Sampling Adequacy. .899
Bartlett's Test of Sphericity Approx. Chi-Square 1750.428
df 21
Sig. .000
Factor Matrixa
Factor
1
ERS1 .783
ERS2 .780

259 | P a g e
ERS3 .866
ERS4 .903
ERS5 .843
ERS6 .860
ERS7 .692
Extraction Method: Principal Axis Factoring.
a. 1 factors extracted. 4 iterations required.
Total Variance Explained
Factor
Initial Eigenvalues Extraction Sums of Squared Loadings
Total % of Variance Cumulative % Total % of Variance Cumulative %
1 5.029 71.844 71.844 4.717 67.388 67.388
2 .547 7.813 79.657
3 .442 6.310 85.967
4 .360 5.139 91.105
5 .320 4.574 95.679
6 .171 2.437 98.116
7 .132 1.884 100.000
Extraction Method: Principal Axis Factoring.
Appendix 4 20: Results of exploratory factor analysis: Human Resource Practices Sub-
Scale (training and development)
KMO and Bartlett's Test
Kaiser-Meyer-Olkin Measure of Sampling Adequacy. .856
Bartlett's Test of Sphericity Approx. Chi-Square 1405.133
df 10
Sig. .000
Factor Matrixa
Factor
1
ETD1 .860

260 | P a g e
ETD2 .932
ETD3 .892
ETD4 .833
ETD5 .799
Extraction Method: Principal Axis Factoring.
a. 1 factors extracted. 5 iterations required.
Total Variance Explained
Factor
Initial Eigenvalues Extraction Sums of Squared Loadings
Total % of Variance Cumulative % Total % of Variance Cumulative %
1 3.983 79.670 79.670 3.738 74.755 74.755
2 .455 9.097 88.767
3 .251 5.029 93.797
4 .203 4.063 97.860
5 .107 2.140 100.000
Extraction Method: Principal Axis Factoring.
Appendix 4 21: Results of exploratory factor analysis: Human Resource Practices Sub-
Scale (Performance Appraisal)
KMO and Bartlett's Test
Kaiser-Meyer-Olkin Measure of Sampling Adequacy. .911
Bartlett's Test of Sphericity Approx. Chi-Square 3409.862
df 36
Sig. .000
Factor Matrixa
Factor
1
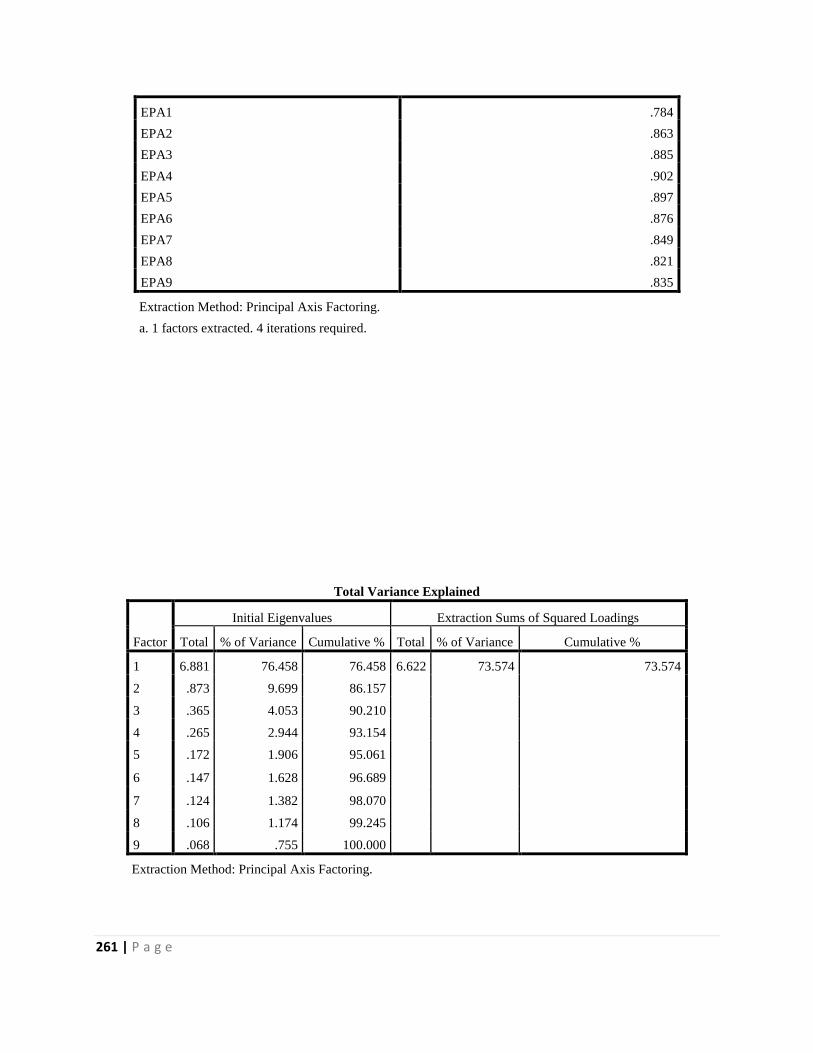
261 | P a g e
EPA1 .784
EPA2 .863
EPA3 .885
EPA4 .902
EPA5 .897
EPA6 .876
EPA7 .849
EPA8 .821
EPA9 .835
Extraction Method: Principal Axis Factoring.
a. 1 factors extracted. 4 iterations required.
Total Variance Explained
Factor
Initial Eigenvalues Extraction Sums of Squared Loadings
Total % of Variance Cumulative % Total % of Variance Cumulative %
1 6.881 76.458 76.458 6.622 73.574 73.574
2 .873 9.699 86.157
3 .365 4.053 90.210
4 .265 2.944 93.154
5 .172 1.906 95.061
6 .147 1.628 96.689
7 .124 1.382 98.070
8 .106 1.174 99.245
9 .068 .755 100.000
Extraction Method: Principal Axis Factoring.
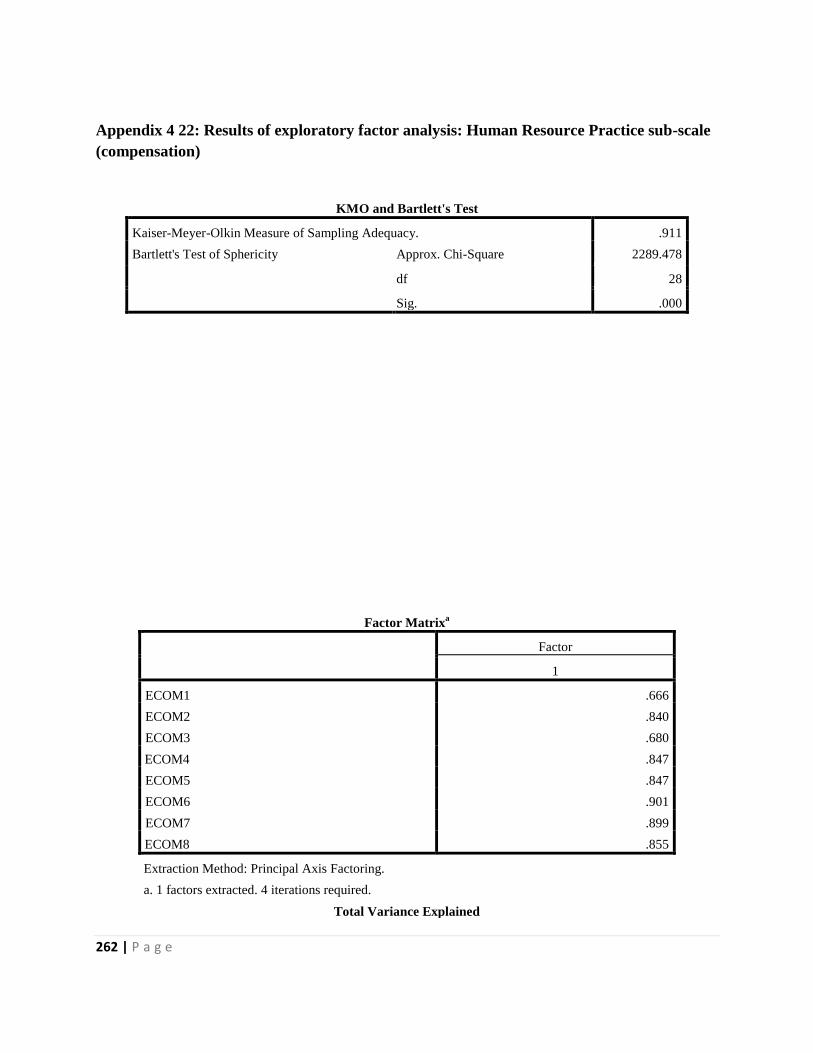
262 | P a g e
Appendix 4 22: Results of exploratory factor analysis: Human Resource Practice sub-scale
(compensation)
KMO and Bartlett's Test
Kaiser-Meyer-Olkin Measure of Sampling Adequacy. .911
Bartlett's Test of Sphericity Approx. Chi-Square 2289.478
df 28
Sig. .000
Total Variance Explained
Factor Matrixa
Factor
1
ECOM1 .666
ECOM2 .840
ECOM3 .680
ECOM4 .847
ECOM5 .847
ECOM6 .901
ECOM7 .899
ECOM8 .855
Extraction Method: Principal Axis Factoring.
a. 1 factors extracted. 4 iterations required.

263 | P a g e
Factor
Initial Eigenvalues Extraction Sums of Squared Loadings
Total % of Variance Cumulative % Total % of Variance Cumulative %
1 5.701 71.259 71.259 5.400 67.494 67.494
2 .788 9.851 81.110
3 .511 6.392 87.502
4 .298 3.722 91.224
5 .247 3.093 94.318
6 .204 2.546 96.864
7 .145 1.812 98.676
8 .106 1.324 100.000
Extraction Method: Principal Axis Factoring.
Appendix 4 23: Results of exploratory factor analysis: Employee Attitude scale
KMO and Bartlett's Test
Kaiser-Meyer-Olkin Measure of Sampling Adequacy. .812
Bartlett's Test of Sphericity Approx. Chi-Square 1184.852
df 10
Sig. .000
Factor Matrixa
Factor
1
EEA1 .748
EEA2 .833
EEA3 .945
EEA4 .893
EEA5 .661
Extraction Method: Principal Axis Factoring.
a. 1 factors extracted. 7 iterations required.
Total Variance Explained
Factor Initial Eigenvalues Extraction Sums of Squared Loadings

264 | P a g e
Total % of Variance Cumulative % Total % of Variance Cumulative %
1 3.672 73.440 73.440 3.380 67.605 67.605
2 .681 13.623 87.064
3 .308 6.156 93.219
4 .217 4.330 97.550
5 .123 2.450 100.000
Extraction Method: Principal Axis Factoring.
Appendix 4 24: Results of exploratory factor analysis: Employee Behaviour scale
KMO and Bartlett's Test
Kaiser-Meyer-Olkin Measure of Sampling Adequacy. .695
Bartlett's Test of Sphericity Approx. Chi-Square 436.849
df 3
Sig. .000
Factor Matrixa
Factor
1
EEB1 .669
EEB2 .894
EEB3 .871
Extraction Method: Principal Axis Factoring.
a. 1 factors extracted. 9 iterations required.
Total Variance Explained
Factor
Initial Eigenvalues Extraction Sums of Squared Loadings
Total % of Variance Cumulative % Total % of Variance Cumulative %
1 2.310 77.009 77.009 2.005 66.830 66.830
2 .469 15.646 92.655
3 .220 7.345 100.000

265 | P a g e
Total Variance Explained
Factor
Initial Eigenvalues Extraction Sums of Squared Loadings
Total % of Variance Cumulative % Total % of Variance Cumulative %
1 2.310 77.009 77.009 2.005 66.830 66.830
2 .469 15.646 92.655
3 .220 7.345 100.000
Extraction Method: Principal Axis Factoring.
Appendix 4 25: Results of exploratory factor analysis: Organisational Performance scale
KMO and Bartlett's Test
Kaiser-Meyer-Olkin Measure of Sampling Adequacy. .703
Bartlett's Test of Sphericity Approx. Chi-Square 620.949
df 10
Sig. .000
Factor Matrixa
Factor
1
EOP1 .390
EOP2 .716
EOP3 .842
EOP4 .804
EOP5 .621
Extraction Method: Principal Axis Factoring.
a. 1 factors extracted. 7 iterations required.
Total Variance Explained
Factor
Initial Eigenvalues Extraction Sums of Squared Loadings
Total % of Variance Cumulative % Total % of Variance Cumulative %
1 2.854 57.078 57.078 2.406 48.115 48.115
2 .831 16.627 73.705
3 .770 15.392 89.097
4 .328 6.553 95.650
5 .217 4.350 100.000

266 | P a g e
Total Variance Explained
Factor
Initial Eigenvalues Extraction Sums of Squared Loadings
Total % of Variance Cumulative % Total % of Variance Cumulative %
1 2.854 57.078 57.078 2.406 48.115 48.115
2 .831 16.627 73.705
3 .770 15.392 89.097
4 .328 6.553 95.650
5 .217 4.350 100.000
Extraction Method: Principal Axis Factoring.
Appendix 4 26: Modification Indices for LAMBDA-Y
EATTIT EBEHAV ORGPERF HRPRACT
EA-1 -- 0.019 4.800 0.058
EA-2 -- 2.837 0.386 0.055
EB-1 4.642 -- 0.319 --
EB-2 0.019 -- 0.137 0.009
OP-1 2.069 10.012 -- --
OP-2 -- -- -- --

267 | P a g e
TRAIND 0.092 1.371 5.197 --
PAPPRA 3.862 1.779 0.248 --
COMP 3.491 1.129 0.678 --
RECRUIT 0.104 0.651 0.169 --
Appendix 4 27: Expected Change for LAMBDA-Y
EATTIT EBEHAV ORGPERF HRPRACT
EA-1 -- -0.004 0.091 -0.014
EA-2 -- 0.062 -0.023 0.016
EB-1 0.159 -- 0.057 --
EB-2 -0.010 -- 0.028 -0.012
OP-1 0.165 -0.383 -- --
OP-2 -- -- -- --
TRAIND -0.018 -0.062 -0.120 --
PAPPRA -0.101 -0.065 -0.024 --
COMP 0.121 0.054 -0.042 --
RECRUIT -0.018 -0.041 0.021 --