Embed Size (px)
Citation preview

Empirical Research in Foreign Market
Entry Mode
2015-5
Jesper Nydam Wulff
PhD Thesis
DEPARTMENT OF ECONOMICS AND BUSINESS
AARHUS UNIVERSITY � DENMARK

Empirical Research in Foreign Market Entry Mode
Jesper Nydam Wulff
A PhD thesis submitted to
School of Business and Social Sciences, Aarhus University,
in partial fulfilment of the requirements of
the PhD degree in
Economics and Business
September 2014

This page has intentionally been left blank.

i
Preface This thesis was written in the period September 2011 – September 2014 during my studies at the
Department of Economics and Business, formerly the School of Economics and Management, at
Aarhus University and during my research visit at the Department of Global Business and Trade,
Vienna University of Economics and Business. I would like to thank these institutions for
offering me the chance to work on my projects in their research environments. I very much
appreciate the financial support of the Department of Economics and Business for my
participation in numerous courses, workshops and conferences in Denmark and abroad offering
the benefits of continued learning. I am also tremendously grateful for the funding from
Ferdinand Sallings Mindefond, Augustinus Fonden, Oticon fonden and Solar Fonden. They have
provided me with the opportunities for collecting data, research visits and summer school stays
abroad. There are several people I would like to thank for their help, support and contribution to
my work. All remaining errors are, of course, my own.
I would like to thank my two supervisors, Niels Peter Mols and Kristina Risom Jespersen. I
would like to thank Niels Peter for providing me with valuable support and guidance, for his
calm and friendly being, and for encouraging me to write a PhD. I am also indebted to my
secondary advisor, Kristina, especially for advice on pursuing a career in academia and invaluable
support in the process of taking the first steps towards this goal.
I deeply appreciate my stay and the people I met at Vienna University of Economics and
Business. A stay that would not have been possible without Desislava Dikova, who gave me the
opportunity to visit her in her department and not the least for taking time to review and
comment on some of my work. In this regard, I would also like to thank the PhD students in
Vienna who made my stay as much a joy as a learning experience. Benny, Verena, Laura, Edith,
Gregor, Namik and the rest of the crew whom I met – thank you for many inspiring and fun
hours. Ich wünsche euch alles erdenklich Gute.
I would also like to spend a few words on some people who have offered me excellent advice
and/or provided me with valuable feedback. I would like to thank Keith D. Brouthers for taking
interest in my work and taking his time to discuss it with me. I would also like to thank the
teachers Marco Steenbergen, Jeff Gill, Mark Bryan and Fred Boehmke at my two months
summer school stays at the University of Essex to whom I owe planting the seeds for what has
later become a passion for data analysis and programming. I greatly appreciate the feedback on
my papers and sound advice during peer-review processes from Jesper Rosenberg Hansen and
Anders Ryom Villadsen. Also, I would like to thank Anders for – let’s not call it babysitting but
rather - taking me under his wing at my first few times at the Academy of Management Meetings.
I would also like to thank Mikael Søndergaard, Karina Skovvang, Ann-Kristina Løkke, Morten
Berg, Marianne Simonsen and Allan Würtz. Finally, I would like to thank Martin Schultz, Jens,
Andreas, Rune, Varneskov, Manuel, Mette, Anne Christine, Astrid and all the other PhD-
students I have forgot to mention for many good times.
Lastly, I would like to thank my family, my mom, dad and sister, for all the support over the
years. For obvious reasons, I owe most of what I have and will accomplish to you. Most of all,
my gratitude goes to my wonderful girlfriend, Linda. She has helped solve the paradox what
happens when an unstoppable force of support meets an unbearable partner by putting up with

ii
my travels, late nights at the office; by helping me through frustrating times and reviewing most
of my work.
Jesper N. Wulff, Aarhus University, September 2014
Amended preface
The pre-defense was held on January 8, 2015. I would like to sincerely thank the members of the
assessment committee, Bent Petersen, Keith D. Brouthers and Mikael Søndergaard (Chair), for
their careful reading of this dissertation and their many insightful comments and suggestions.
Some of the suggestions have already been incorporated and more will follow in the near future.
Jesper N. Wulff, Aarhus University, January 2015

iii
Contents Preface ............................................................................................................................................................. i
Contents ........................................................................................................................................................ iii
Introduction and summary ......................................................................................................................... v
CHAPTER 1. A Systematic Assessment of Empirical Research on Foreign Entry Mode ................................................................................................................................... 1
CHAPTER 2. Interpreting Results from the Multinomial Logit Model: Demonstrated by Foreign Market Entry ................................................................................................ 41
CHAPTER 3. Entry Mode and Performance of Nordic Firms: How Sources of Firm-Specific Advantages Moderate the Effect of Non-Location Bound International Experience ............................................................................... 71

iv
v
1. Introduction and summary
This dissertation seeks to shed light on questions in the field of foreign market entry mode. This
is done by taking an empirically-focused approach on the entry mode research field through (1)
reviewing the empirical literature, (2) suggesting adjustments in methodological practice and (3)
empirically testing proposed hypotheses.
In three self-contained papers, I deal with various aspects of empirical research and analysis in
the field of foreign market entry mode. In these three chapters, the overall theme is the empirical
investigation of factors that determine a firm’s mode of entry (MOE). In the first chapter, I
review the state of the field through a systematic assessment of the empirical literature. In the
second paper, I provide guidelines and illustrate steps essential for an analysis of results from the
multinomial logit model, which is commonly applied in MOE research. In the third paper, I
investigate the moderating effect of certain firm-specific assets on the relationship between
international experience and MOE as well as its consequences for post-entry performance using a
sample of 250 market entries made by Norwegian, Danish and Swedish firms.
Overall, the dissertation contributes to the literature on MOE in three main ways: First,
reviewing the state of the field provides guidelines for future research. Second, suggestions about
the interpretation of multiple outcome models may help improve the quality of future MOE
research. Third, the final chapter contributes to entry mode literature on international experience
and has managerial implications for the MOEs made by Nordic firms.
This introduction serves to provide some background for the subsequent chapters. That being
said, the papers are all “stand-alone” meaning that each can be read outside the context of the
others or this introduction. What ties the papers together is the focus on the empirical
investigation of the determinants of MOE. I use the remainder of this introduction to provide a
brief overview of central entry mode terminology and concepts. First, I discuss what researchers
mean by entry mode and how different mode choices may be differentiated from each other and
how this is done in the empirical praxis. Then, I comment on the focus of the dissertation by
briefly discussing some research challenges relevant to contemporary research. Finally, the three
papers are introduced.
1.1. Entry mode classification
The choice of foreign market entry mode is the decision of which form of operation to use to
enter foreign markets. Firms expanding beyond their national boundaries are faced with the
strategic decision of how to effectively establish themselves abroad. To understand and
investigate firms’ MOE is what concerns researchers in foreign market entry.
Entry mode researchers have investigated a large number of entry mode types, but the size of
this number is not completely agreed upon. To name a few, Anderson and Gatignon (1986) list
17, Pan and Tse (2000) suggest 10, Erramilli and Rao (1990) define 11 while Brouthers and
Hennart (2007) identify 16 different entry mode types in the empirical literature. While it is hardly
relevant for this introduction to go into detail about the specifics of each one of these individual
types, it does seem appropriate to provide a more general discussion of how these types are
classified and related to each other.
Besides different views on the exact number of types, researchers also suggest various ways to
classify entry mode types. However, there seems to be consensus on three (or four) broad

vi
categories into which the various types fall. These follow a tradition built around the works of
Root (1987), which has later been adopted as well as adapted by many (e.g. Pan & Tse, 2000;
Sharma & Erramilli, 2004). These types are export, contractual, and investment/establishment
entry modes. A relatively common way to classify these is presented in the overview in Figure 1.
Export entries refer to modes where the firm enters the foreign market through an agent or
distributor in the host country, contractual entries include licensing, franchising or other contractual
non-equity agreements, and investment/establishment modes involve actual equity ownership by the
entrant through e.g. a JV or wholly owned subsidiary (WOS). As it can be seen from Figure 1,
these different categories may again be divided into subcategories that may again be
subcategorized and so on.
Establishment mode
Greenfield Acquisition
Ownership
mode
Shared
JV
(greenfield)
Partial
acquisition
Full
WOS
(greenfield)
WOS
(acquisition)
Brouthers and Hennart (2007) argue that there exist two different views in the literature on
the differences between and the meaning of entry mode structures. In the first view, authors
classify exports, contracts, JVs and WOSs along a continuum from minimum to maximum
control, risk, commitment and potential return. A long range of often cited classical papers view
MOE from this perspective (e.g. Anderson & Gatignon, 1986; Hill, Hwang, & Kim, 1990). This
view implies that the same set of independent variables can be used to determine MOE
regardless of where we are on the continuum. For instance, the size of the entrant may both
determine the choice between independent exporting and WOS, and that between JV and WOS.
Typically, firm size is hypothesized to be positively related to MOE meaning that small firms
enter through exports, intermediate-sized firms through JV and large firms through WOS.
Entry types
Non-equity
Export
Direct
Indirect
Other
Contracts
Licensing
R&D contracts
Alliances
Other
Equity
JV
Minority
Equal
Majority
WOS
Greenfield
Acquisition
Figure 1. Entry Modes Table I. Establishment Modes
Note: Adapted from Pan and Tse (2000) and Root (1987)
Note: Adapted from Brouthers and Hennart (2007)

vii
The second view does not share the idea of placing JVs in the middle of the continuum
described above. Instead, it distinguishes clearly between non-equity and equity modes where JVs
are placed in the latter category. Table I illustrates this link between modes of establishment and
ownership level. According to this view, mainly articulated by Hennart (1988; 2000), the variables
that determine the choice between equity modes need not be the same as those that determine
the choice between e.g. equity and non-equity entries. For instance, firm size may determine the
choice between JV and WOS whilst not being related to the choice between equity and non-
equity modes.
In this dissertation, I turn the focus to the entry mode choice including the ownership level
(JV vs. WOS), but excluding establishment modes1 (greenfield vs. acquisitions). There are several
reasons for this focus. First, as argued by Brouthers and Hennart (2007) empirical evidence so far
suggests that firms make the two choices independently (Hennart, 2000; Padmanabhan & Cho,
1996). Second, given the immense amount of literature in the field, focus should be sought
whenever possible. Assumed that the first point applies it seems natural to draw the line between
entry and establishment modes to focus the research questions asked.
1.1.1. Restriction or expansion of the choice set
Most MOE articles restrict the choice set to a limited range of entry modes and examine the
choice among them. The examples used above are not drawn from imagination, on the contrary
they are rather heavily influenced by the dominant practice in entry mode research: To limit the
set to a binary variable2 (e.g. JV vs. WOS).
There may be many reasons to focus on a limited set of entry modes. One is theoretical focus.
If a theoretical framework predicts the equity level, it may make sense to discriminate between
non-equity and equity modes or perhaps non-equity alliances and equity JVs (Pan & Tse, 2000).
Another is convenience. Researchers have argued that the immense use of binary logistic
regression in entry mode research is “logical” as MOE “can easily be coded as a dichotomous variable”
(Canabal & White, 2008, p. 275) and thus makes studies “empirically tractable” (Shaver, 2013, p. 26).
A third reason may be data. Some datasets are limited in the sense that they contain data on
equity modes only, thus restricting the analysis to these types. Other datasets may only contains
few observations with certain modes of entry, as e.g. licensing or exporting (e.g. Brouthers, 2002),
which could warrant eliminating such observations.
But there are also strong arguments for why the entry mode choice should be expanded. First,
entry mode scholars agree that there exists a broad range of entry modes for firms to choose
from. While restraining the choice set to a binary variable may provide focus, it also reduces the
empirical investigation to a very specific part of a broader question (Shaver, 2013). Limiting our
interpretations to choice A versus choice B, makes our empirical results rely on the aggregation
of dissimilar entry mode types or the deletion of whole choice categories (Martin, 2013). Given
the current focus on some choices (e.g. JV vs. WOS), we may miss the opportunity to explain
1 It is worth mentioning that the establishment modes terminology is still relatively new and far from accepted in the
general literature (Harzing, 2002; Martin, 2013). A thorough discussion of the establishment modes literature is beyond the scope of this introduction. 2 In their extensive literature review, Canabal and White (2008) show that 63% of empirical entry mode studies in the
period 1980-2006 use some sort of binary approach, most commonly logit or probit models.

viii
variation in entry mode decision outcome that could have been explained had we allowed for
multiple entry outcomes. Second, strategic choices are rarely binary and the entry mode choice is
no different (Kogut & Singh, 1988). A broadening of the choice set may lead to a better
understanding of the real world entry mode decision where managers stand before multiple entry
mode options. The assumption that managers stand before a binary decision may be too
simplistic, and therefore we risk that important insights are lost in the pooling or elimination of
entry modes.
1.1.1.1. The possibilities
Broadening the entry mode choice can come at a price. Studying multiple outcomes becomes
more complex and sometimes requires invoking a different set of assumptions. It becomes
necessary to question whether a new set of assumptions is invoked and if these assumptions are
more or less restrictive. Still, a more complex model allowing for multiple outcomes may be
justified if it provides richer insight than a simpler choice.
Entry mode researchers most commonly use the multinomial logit model (MLM) when they
expand the choice set in their empirical analyses. However, its popularity cannot compare to that
of the binary model (Canabal & White, 2008). In the light of the discussion above, this is curious
as researchers seem to agree that managers have many entry options at their disposal when they
choose how to enter a foreign market. Perhaps by studying multiple outcomes we invoke a new
set of undesirable assumptions? Or do we simply not gain any substantial insight over the
classical choice?
First, let us consider any additional assumptions of the MLM. Compared to the standard
logistic model, the MLM explicitly assumes independence of irrelevant alternatives (IIA). To use
an example from entry mode, the IIA assumption means that the odds of entry through WOS
compared to the odds of JV are the same regardless of whether we include independent
exporting in the choice set or not. In other words, all else being equal a firm’s choice between
two alternative entry modes is unaffected by other available entry modes.
Even though the IIA assumption is probably not very attractive in an entry mode context, it is
not an additional assumption that many MOE researchers would have to make. The reason is
that the IIA assumption is implicitly invoked in much of the empirical MOE literature already.
Indeed, MOE researchers have long used one very practical advantage of the IIA when they
investigate a subset of alternative entry modes instead of all entry mode types: Assuming that the
excluded modes do not affect the relative odds between the included ones (Train, 2003). For
instance, when scholars are interested in investigating the factors that influence firms’ choice
between JV and WOS, they usually estimate a binary model with JV and WOS as the choice
alternatives. Thus, by excluding say exporting entries we implicitly assume that this exclusion
does not affect the odds of WOS relative to the odds of JV3.
Thus, using the MLM does not require us to invoke a different set of assumptions compared
to those already made in the dominant empirical MOE literature. But what do entry mode
researchers stand to gain from a MLM approach compared to a binary approach? Apart from the
3 This assumption is likely to be even less reasonable in the establishment mode literature, where JVs are sometimes excluded and the focus put solely on greenfields vs. acquisitions (e.g. Brouthers & Dikova, 2010).

ix
theoretical arguments about broadening the choice set made above, there are appealing empirical
reasons as well. Even though multiple outcome models such as the MLM may be more
challenging to interpret, modern statistical software allows for relatively straightforward means to
transform statistical complexity into intuitive interpretation. As it is illustrated in this dissertation,
interpreting results from models allowing for multiple outcomes becomes more intuitive when
applying graphical interpretations. Such graphics may enable MOE researchers to gain valuable
insights about several entry mode types simultaneously and their relationship to the model
variables. Thus, by opening the choice set up for more than two entry types, the model makes it
possible to investigate a broader range of research questions than the regular model.
1.1.1.2. The challenges
Of course, the MLM is not without its downsides. As the reader might have noticed, I briefly
mentioned that the IIA assumption is probably not justifiable when studying MOE. For instance,
although seeing great potential for its future potential in entry mode research, Martin (2013)
argues that the assumption of IIA is a major hurdle in the MLM’s usability. In this dissertation, I
do not advocate the MLM as the ‘best’ model, but I do argue that it may have some very
attractive features in comparison to the practice dominating the current binary-focused literature.
Modeling multiple entry modes can be done in several different ways and choosing the most
optimal model is complicated and depends on many factors counting the research questions,
model specification, data etc. Therefore, it would be a very ambitious task to let this introduction
contain an exhaustive discussion on the appropriateness of using multiple outcome models in
entry mode research.
In this thesis, I have chosen not to introduce new advanced multiple outcome models that are
not already used in the empirical literature. Instead, I have found it more constructive to start at a
more basic level and present some ways in which MOE researchers can make substantial
advancements in their empirical analyses when using the models they currently apply. While I
personally see great potential for the use of more sophisticated models4, I also believe that an
introduction to these would be premature before mastering core points about less advanced
models. In other words, as elegantly put by Brambor, Clark and Golder (2005, p. 81) about the
use of interactions in the political science discipline: “While more computationally complex and
impressive methodological advances are to be welcomed, their contributions will be diminished to the extent that we,
as a discipline, ignore the basics”.
1.1.2. Research focus challenges
As explained earlier, entry mode researchers are concerned with understanding and investigating
firms’ MOE. Through the past four decades, researchers have built up a huge arsenal of
theoretical lenses usually mixing firm- and country-level considerations (Martin et al., 2007;
4 Some more advanced multiple outcome models as e.g. the alternative-specific multinomial probit or nested logit relax the IIA assumption by allowing for interdependence across entry mode alternatives. These methods have yet to be introduced to entry mode research (Martin, Swminathan, & Tihanyi, 2007), and it has yet to be thoroughly investigated whether assessing interdependence between entry modes will have a substantial rather than marginal impact on our understanding of MOE (Shaver, 2013).

x
Sharma & Erramilli, 2004). This is not surprising considering the complexity of MOE
relationships.
Earlier but still relevant work counts theories having emerged within the entry mode field
itself, e.g. Johanson and Vahlne’s (1977) Internationalization theory, as well as frameworks such
as Dunning’s (1980) popular OLI model that draws on theories such as Transaction Cost Theory
(Anderson & Gatignon, 1986) and the Resource-based view (Madhok, 1997). Even though entry
mode researchers continue to test earlier theories, theories spilling over from other fields ensure
that the entry mode decision is constantly viewed from several different perspectives, spanning
from the macro perspective of uncertainty (Ahsan & Musteen, 2011) to the micro level of
decision maker characteristics (Herrmann & Datta, 2002). In turn, this has led and is still leading
to a constant emergence of new angles on these theories alone (e.g. Maekelburger, Schwens, &
Kabst, 2012) or in combination (e.g. Brouthers, Brouthers, & Werner, 2008).
To focus on what is missing from our explanations is not necessarily a bad thing. But as some
authors have noted, it sometimes can be. Even though many different and new theoretical
explanations have brought great insight, leading researchers have cautioned that research may be
becoming increasingly marginal. Specifically, scholars who have made high impact contributions
are concerned that entry mode research as a field may be focusing too much on maximizing
explanatory power. Shaver (2013, p. 24) calls this “playing the R2 game” and it refers to the endless
task of adding new explanations. Because of the huge number of complexly related MOE
determinants, researchers may engage in a Sisyphean task because their models will never include
enough factors. Considering the diminishing marginal returns on adding new factors to our
theoretical frameworks, the steps we are making forward may be incremental instead of
substantive. Instead, Shaver (2013) suggests, we may still have much to gain from questioning
what we already know and focusing on refining core relationships of whose existence we are
convinced.
Seeking new insights through an empirical focus may be filled with potential pitfalls, too. As
stated earlier, if switching from one method to another invokes equally or more restrictive
assumptions and does not provide more precise explanations, then the switch may not be worth
the effort. Thus, we must be cautious of (1) any additional assumptions and (2) the additional
benefit by changing empirical method.
When it comes to the empirical analyses in entry mode research, I believe there are some low
hanging fruits that may help us make considerable progress in our understanding of firms’ entry
mode choice. More specifically, chapter two in this dissertation suggests that scholars should
accept well-established methodological points concerning the interpretation of model results. The
arguments for this are mainly two-fold. First, substantial meaningful estimates and interpretations
of marginal effects and their standard errors are often omitted making analyses incomplete.
Second, by not following recommended methodological practices researchers risk drawing invalid
inferences about relationships between core theoretical factors and MOE. Indeed, chapter one in
this dissertation suggests that entry mode studies have largely produced inconsistent findings
regarding core entry mode predictors. Presenting results that are potentially misleading has the
unfortunate consequence that much of what we know empirically about certain areas in MOE is

xi
based on studies that contain results risking misinterpretation or that leave out the most
substantial parts of the analysis.
The empirical approaches used and presented in this dissertation are by no means the only
ways of conducting the analyses. However, my hope is that MOE researchers can drastically
improve their empirical analyses if they learn from well-established recommendations in the
organizational research methodology literature.
1.2. The content of the dissertation
This dissertation consists of three self-contained papers focused around central aspects of
empirical research in foreign market entry mode. The first paper reviews the empirical literature;
the second illustrates interpretation of an often used empirical model and the third empirically
investigates entry mode and performance determinants. An overview of the papers can be found
in Table II below. In the following, I summarize the three papers.
1.2.1. Chapter one
In chapter one, I ask the research question: According to the empirical literature, which factors
determine the MOE? Previous reviews have brought invaluable insights about the empirical
support for core relationships between firm- and macro-level variables on the one side and MOE
on the other. Still, past reviews are limited in at least three important ways. First, traditional
narrative reviews are limited in the way that they are largely unsystematic with no explicit
selection and objective evaluation criteria (Shelanski & Klein, 1995). This makes it difficult to
thoroughly assess the empirical support and replicate the studies. Second, more sophisticated
meta-analytical quantitative procedures are powerful, but are ill-suited for analyzing entry mode
data that cover multiple different dependent variables and a large number of heterogeneous
measures of independent variables (Hunter & Schmidt, 1990; Light & Pillemer, 1984; Stanley &
Doucouliagos, 2012). Third, most likely due to differences in methodological approaches past
entry mode reviews disagree when it comes to the empirical support for tenets as e.g. asset
specificity that are very often included in entry mode research.
This review seeks to overcome these limitations by applying a method already used
successfully in general strategic management (David & Han, 2004; Newbert, 2007). In total, I
examine 1134 statistical tests from 112 studies in 40 different scientific journals in the period
2000-2013.
Through the use of transparent criteria for the selection of studies as well as simple
quantitative tools for systematic assessment of empirical relationships, this study contributes to
the existing literature in at least three ways. First, by exploring the consistency in empirical
support across different dependent variables and variables measures, I find that empirical support
seems to depend on construct measurement. For instance, the R&D- and advertising intensity
measure have produced non-significant results to a large extent even though they are very
popular measures of asset specificity. Second, by also investigating control variables, I find one of
the most commonly used controls, firm size, has shown very mixed results. Third, findings
suggest that statements about the importance of mode choice for performance may be
premature. Even though results look promising the bulk of empirical literature is still too limited
to warrant conclusions about performance implications. Finally, I identify critical methodological

xii
issues with regard to the broadness of the choice set and interpretation of results from models
that include interaction effects or allow for multiple outcomes.
This paper provides valuable insights in questions about empirical research and contributes to
the existing literature with suggestions for future research. Thus, the review is relevant to
researchers or practitioners seeking an overview over the research literature.
Table II. Summary of the three papers
Article type Core goal Main findings / contributions
Chapter 1 Literature review To transparently and systematically
review the empirical literature on
the foreign market entry mode of
the firm.
Empirical results
- are contingent on entry mode
operationalization.
- seem to depend on variable
measurement.
- are sparce when it comes to
performance-focused studies.
Existing research is challenged
methodologically with regard to
- examination of moderating
effects and
- interpretation of results of
multiple outcome models.
Chapter 2 Methodological
study
To draw attention to systematic
issues with interpretation of results
from the MLM in entry mode
research.
To illustrate the extra care that
needs to be taken when interpreting
results from the MLM.
Highlights the central challenges
while suggesting and illustrating a
procedure using graphical
illustrations.
Contains a practical guide to help
MOE researchers analyze and
interpret results.
Chapter 3 Empirical study To investigate the moderating effect
of firm size and multinational
experience, respectively, on the
relationship between international
experience and equity mode choice.
To investigate the performance
implications of making entries based
on the proposed adjusted model.
Evidence suggests that the
association between international
experience and mode choice
becomes negative in the presence of
higher levels of multinational
experience.
Firms adjusting their mode of entry
by accounting for moderating
effects of firm size and
multinational experience yield
higher performance.
1.2.2. Chapter two
Chapter two draws from the findings in chapter one about the use of multiple outcome models
in entry mode research. The multinomial logit model (MLM) is the second most commonly used
statistical model by entry mode researchers. However, a review of the literature shows that MOE

xiii
researchers rarely avoid the commonly encountered problems when interpreting results from the
MLM.
Chapter two contributes to the methodological literature that draws attention to systematic
problems with empirical strategies currently used in strategy research, specifically studies that
have illustrated guidelines essential to the use of limited dependent variables models. My goal is
not to provide an exhaustive discussion of the literature of the MLM, but to present and illustrate
a set of guidelines that entry mode researchers may use to considerably improve their empirical
analysis when using this type of model. As an example, I use the relationship between firm size
and MOE due to the mixed results found in empirical research as shown in chapter one.
When interpreting results from the MLM, I suggest that interpretations based on the model
coefficients should made with great care as these do not represent the relationship between a
predictor and the predicted probability of a specific outcome. Instead, the most complete analysis
and presentation of the relationship between the predictor and the dependent variable is achieved
through a graphical representation. I show how intuitive graphs of predicted probabilities and
marginal effects, respectively, may lead to valuable insights about the relationship between firm
size and MOE. If the marginal effects do not change sign or significance across their range of
variation, measures such as marginal effects at the mean (MEM) may be reported to summarize
the relationship. If the marginal effects are too complicated to sum up in single measure, e.g. due
to changes in sign, significance or major changes in magnitude, one should take great care when
reporting and interpreting summary measures.
It is my hope that entry mode researchers can make considerable progress in our
understanding of the determinants of MOE if they recognize and follow the guidelines presented
in this paper.
1.2.3. Chapter three
In chapter three, I follow up on some of the core findings in chapter one. I empirically
investigate whether the relationship between MOE and international experience is negatively
moderated by firm size and multinational experience, respectively. Using a sample of 250 market
entries made by Norwegian, Danish and Swedish firms, I find evidence to suggest that the
association between equity mode choice and non-location bound international experience
becomes negative in the presence of higher levels of multinational experience. Even though a
negative moderating effect of firm size is somewhat supported, it seems to be more complicated
than the one proposed.
Furthermore, I investigate the performance implications of the Nordic firms adjusting their
MOE by accounting for a moderating effect of firm size and multinational experience. Especially
when adjusting for firm size, the evidence suggests that Nordic firms, on average, rate their post-
entry performance higher relative to those who do not.
This study sheds light on inconsistent results found in previous research investigating the
impact of international experience and has practical implications for managerial decision-making.

xiv
Dansk resumé Denne afhandling består af tre artikler fokuseret på centrale aspekter i empirisk forskning af
virksomheders indtræden på udenlandske markeder. Den første artikel gennemgår den empiriske
litteratur, den anden illustrerer fortolkningen af en empirisk model, og den tredje foretager en
empirisk undersøgelse af faktorer afgørende for markedsindtrædningsmåde (MIM) og
eksportmarkedssucces.
I kapitel 1 stilles forskningsspørgsmålet: Hvilke faktorer er afgørende for virksomheders MIM
ifølge den empiriske litteratur? Tidligere forskning har givet værdifuld indsigt i empirisk støtte til
nøglekoblinger mellem variable på virksomheds- og makroniveau på den ene side og
virksomheders MIM på den anden. Tidligere litteraturgennemgange er dog begrænsede på mindst
tre forskellige områder. For det første er traditionelle gennemgange begrænsede ved at være
overvejende usystematiske uden hverken eksplicitte udvælgelses- eller objektive
evalueringskriterier. Dette gør det vanskeligt både at grundigt vurdere den empiriske opbakning
og at genskabe studierne. For den andet er mere sofistikerede meta-analytiske kvantitative
procedurer mindre godt egnede til at analysere MIM-data, da disse indeholder mange forskellige
afhængige variable og kovariater, der er målt på mange forskellige måder. For det tredje har
tidligere litteraturstudier ikke kunne nå de samme konklusioner på en række centrale områder.
Det gælder eksempelvis effekten af aktivspecificitet.
Dette litteraturstudie har til mål at imødekomme disse begrænsninger ved at anvende en
metode, som allerede har haft fundet succesfuld anvendelse i den generelle ledelseslitteratur.
Datagrundlaget for litteraturstudiet består af 1134 statistiske tests foretaget i 112 studier udgivet i
40 forskellige videnskabelige tidsskrifter i perioden 2000-2013.
Ved at bruge gennemskuelige kriterier til, hvordan studier udvælges, samt simple, kvantitative
værktøjer til systematisk at vurdere de empiriske relationer, bidrager dette studie til den
eksisterende litterature i mindst tre henseender. For det første fastlås det, at empiriske resultater
ser ud til at afhænge af, hvordan teoretiske konstrukter er målt. Dette undersøges ved at stille
skarpt på resultaters konsistens på tværs af forskellige afhængige variable og kovariatmål. For
eksempel lader mål på forsknings-og udviklingsintensitet til oftere at producere ikke-signifikante
resultater, selvom de i praksis er meget populære måder at måle aktivspecificitet på. For det andet
findes det, at virksomhedsstørrelse, der er en hyppigt anvendt kontrolvariabel i litteraturen, er
forbundet med meget blandede resultater. For det tredje finder studiet, at det muligvis er for
tidligt at udtale sig om vigtigheden af MIM for eksportmarkedssucces. Selvom resultaterne ser
lovende ud, så er mængden er empirisk litteratur stadig for lille til at kunne retfærdiggøre
konklusioner om konsekvenserne for performance. Slutteligt identificeres kritiske metodiske
udfordringer mht. bredden af sættet af indtrædningstyper og fortolkningen af resultater, der
indeholder interaktionseffekter eller tillader flere end to kategorier i den afhængige variabel.
Dette studie giver indsigt i spørgsmål omkring empirisk støtte og bidrager til den eksisterende
litterature med forslag til fremtidig forskning. Litteraturgennemgangen er således relevant for
forskere eller praktikere, der søger at danne sig et overblik over forskningen i virksomheders
MIM.
Kapitel 2 er baseret på centrale fund gjort i kapitel 1. Det drejer sig her især om brugen af
multiple outcome-modeller i MIM-forskningen. Den multinomiale logit model (MLM) er den
anden mest brugte statistiske model i MIM-litteraturen. En gennemgang af litteraturen viser dog,
xv
at MIM-forskere sjældent undgår de problemer, der typisk opstår, når man skal fortolke resultater
fra MLM.
Kapitel 2 bidrager til den metodiske litteratur, som gør opmærksom på systematiske
problemer med empiriske strategier, som er populære i strategiforskningen. Her tænkes der især
på studier, som har illustreret guidelines, som essentielle for brugen af modeller med begrænsede
afhængige variable. Målet er ikke at foretage en udtømmende diskussion af MLM-litteraturen,
men snarere at præsentere og illustrere helt centrale guidelines, som MIM-forskere kan anvende
til at forbedre deres empiriske analyser. I studiet anvendes et data-eksempel, der stiller skarpt på
forholdet mellem virksomhedsstørrelse og MIM.
I studiet foreslår jeg, at fortolkning baseret på koefficienter generelt bør undgås, da disse ikke
repræsenterer forholdet mellem en kovariat og den forudsagte sandsynlighed for en specifik
kategori. Den mest komplette analyse og præsentation af resultater opnås i stedet ved at
producere og tolke på grafiske fremstillinger. I kapitlet vises det, hvordan intuitive grafer af
forudsagte sandsynligheder og marginale effekter kan føre til værdifuld indsigt i forholdet mellem
virksomhedsstørrelse of MOE. Hvis de marginale effekter ikke skifter fortegn eller signifikans
langs deres variationsrækkevidde, kan opsummeringsmål som eks. marginale effekter udregnet
ved middelværdier rapporteres til at opsummere forhold mellem variable i data. Hvis de
marginale effekter til gengæld er for komplicerede til at opsummere i ét enkelt mål, hvis de
eksempelvis ændrer fortegn, signifikans eller effektstørrelse, bør forskere være meget påpasselige
med at rapportere og fortolke opsummeringsmål.
Undertegnede håber, at MIM-forskere kan gøre betydelige fremskridt, når det kommer til
vores forståelse af determinanter af virksomheders MIM, hvis de anerkender og følger den guide,
som præsenteres i dette kapitel.
I kapitel 3 følges op på enkelte af nøglefundene i kapitel 1. Det er undersøges empirisk, om
forholdet mellem MIM og international erfaring påvirkes negativt af to faktorer:
Virksomhedsstørrelse og multinational erfaring. Som datagrundlag anvendes et datasæt bestående
af 250 markedsindtrædninger foretaget af norske, danske og svenske virksomheder. Resultaterne
viser, at forholdet mellem valg af equity-mode og international erfaring er negativt, hvis
virksomheder har høj multinational erfaring. Resultaterne understøtter også, at
virksomhedsstørrelse har en modererende indvirkning på effekten af international erfaring, men
denne viser sig at være mere kompleks, end det er foreslået af hypoteserne.
Derudover undersøges implikationer for, hvor godt virksomhederne klarer sig på det
udenlandske marked. Resultaterne viser, at de nordiske virksomheder, hvis indtrædning kan
forudsiges af en model, hvor effekten af international erfaring modereres, klarer sig bedre i
gennemsnit relativt til de virksomheder, hvis entry ikke følger modellen.
Studiet giver mulige forklaringer på de inkonsistente resultater, som er fundet i tidligere
forskning mht. betydningen af international erfaring for virksomheders MIM. Desuden har
studiets resultater praktisk betydning for beslutningstagning i virksomheder, der agerer på
udenlandske markeder.

xvi
References
Ahsan, M., & Musteen, M. (2011). Multinational enterprises' entry mode strategies and
uncertainty: A review and extension. International Journal of Management Reviews, 13(4), 376-392.
Anderson, E., & Gatignon, H. (1986). Modes of foreign entry: A transaction cost analysis and
propositions. Journal of International Business Studies, 17(3), 1-26.
Brambor, T., Clark, W. R., & Golder, M. (2005). Understanding interaction models: Improving
empirical analyses. Political Analysis, 14(1), 63-82.
Brouthers, K. D. (2002). Institutional, cultural and transaction cost influences on entry mode
choice and performance. Journal of International Business Studies, 33(2), 203-221.
Brouthers, K. D., Brouthers, L. E., & Werner, S. (2008). Real options, international entry mode
choice and performance. Journal of Management Studies, 45(5), 936-960.
Brouthers, K. D., & Dikova, D. (2010). Acquisitions and real options: The greenfield alternative.
Journal of Management Studies, 47(6), 1048-1071.
Brouthers, K. D., & Hennart, J. (2007). Boundaries of the firm: Insights from international entry
mode research. Journal of Management, 33(3), 395-425.
Canabal, A., & White, G. O. (2008). Entry mode research: Past and future. International Business
Review, 17(3), 267-284.
David, R., & Han, S. (2004). A systematic assessment of the empirical support for transaction
cost economics. Strategic Management Journal, 25(1), 39-58.
Dunning, J. H. (1980). Toward an eclectic theory of international production: Some empirical
tests. Journal of International Business Studies, 11(1), 9-31.
Erramilli, M. K., & Rao, C. P. (1990). Choice of foreign market entry modes by service firms:
Role of market knowledge. Management International Review, 30(2), 135-150.
Harzing, A. W. (2002). Acquisitions versus greenfield investments: International strategy and
management of entry modes. Strategic Management Journal, 23(3), 211-227.
Hennart, J. (1988). A transaction costs theory of equity joint ventures. Strategic Management Journal,
9(4), 361-374.
Hennart, J. (2000). The transaction cost theory of the multinational enterprise. In C. Pitelis, & R.
Sugden (Eds.), The nature of the transnational firm (pp. 81-116). London: Routledge.

xvii
Herrmann, P., & Datta, D. (2002). CEO successor characteristics and the choice of foreign
market entry mode: An empirical study. Journal of International Business Studies, 33(3), 551-569.
Hill, C. W. L., Hwang, P., & Kim, W. C. (1990). An eclectic theory of the choice of international
entry mode. Strategic Management Journal, 11(2), 117-128.
Hunter, J. E., & Schmidt, F. L. (1990). Methods of meta-analysis. Newbury Park, CA: Sage.
Johanson, J., & Vahlne, J. (1977). The internationalization process of the firm-A model of
knowledge development and increasing foreign market commitments. Journal of International
Business Studies, 8(1), 23-32.
Kogut, B., & Singh, H. (1988). The effect of national culture on the choice of entry mode. Journal
of International Business Studies, 19(3)
Light, R. J., & Pillemer, D. B. (1984). Summing up: The science of reviewing research. Cambridge, MA:
Harvard University Press.
Madhok, A. (1997). Cost, value and foreign market entry mode: The transaction and the firm.
Strategic Management Journal, 18(1), 39-61.
Maekelburger, B., Schwens, C., & Kabst, R. (2012). Asset specificity and foreign market entry
mode choice of small and medium-sized enterprises: The moderating influence of
knowledge safeguards and institutional safeguards. Journal of International Business Studies,
43(5), 458-476.
Martin, X. (2013). Solving theoretical and empirical conundrums in international strategy
research: Linking foreign entry mode choices and performance. Journal of International Business
Studies, 44(1), 28-41.
Martin, X., Swminathan, A., & Tihanyi, L. (2007). Modeling international expansion. In D. J.
Ketchen, & D. Bergh (Eds.), Research methodology in strategy and management, volume 4 (pp. 103-
119) Emerald Group Publishing Limited.
Newbert, S. L. (2007). Empirical research on the resource-based view of the firm: An assessment
and suggestions for future research. Strategic Management Journal, 28(2), 121-146.
Padmanabhan, P., & Cho, K. R. (1996). Ownership strategy for a foreign affiliate: An empirical
investigation of japanese firms. Management International Review, 36(1), 45-65.
Pan, Y., & Tse, D. K. (2000). The hierarchical model of market entry modes. Journal of International
Business Studies, 31(4), 535-554.
Root, F. J. (1987). Foreign market entry strategies. New York: AMACOM.

xviii
Sharma, V. M., & Erramilli, M. K. (2004). Resource-based explanation of entry mode choice.
Journal of Marketing Theory and Practice, 12(1), 1-18.
Shaver, J. M. (2013). Do we really need more entry mode studies? Journal of International Business
Studies, 44, 23-27.
Shelanski, H. A., & Klein, P. G. (1995). Empirical research on transaction cost economics: A
review and assessment. Journal of Law, Economics, & Organization, 11(2), 335-361.
Stanley, T. D., & Doucouliagos, H. (2012). Meta-regression analysis in economics and business (1st ed.).
London and New York: Routledge.
Train, K. (2003). Discrete choice methods with simulation (1st ed.). New York: Cambridge University
Press.

CH. 1. A Systematic Assessment of Empirical Research on Foreign Market Entry Mode
1
CHAPTER 1 A Systematic Assessment of Empirical Research on Foreign Entry Mode1
Jesper N. Wulff Aarhus University
1st round revise and resubmit for the European Journal of Marketing
Abstract
This review on the empirical literature on foreign market entry mode provides a systematic assessment of empirical research through a simple quantitative procedure using transparent criteria for article selection. In total, 1134 statistical tests from 112 studies published in 40 different scientific journals in the period 2000-2013 are examined across a range of dimensions. Findings question the frequent use of commonly used measures (R&D- and advertising intensity) and control variables (firm size) and suggest that statements about the importance of mode choice for subsidiary performance may be premature. Methodologically, this study identifies critical issues with regard to interpretation of interactions and the entry mode choice set. The review is relevant to researchers and practitioners seeking an overview over the research literature.
Keywords: Foreign market entry mode, literature review, transaction cost, resource-based view, OLI
1 This paper was accepted for and presented at the 2012 Academy of Management Meeting in a session entitled Internationalization for Asset-Seeking Purposes. I am grateful to the participants and the facilitator for useful comments and feedback. Material from this paper has been presented at the International Business Conference and Doctoral Conference, Aalborg University; the IM division Doctoral Consortium 2012; and the PhD-course Applied Quantitative Analysis using Stata, Copenhagen University. I thank participants at these occasions for their comments. Finally, a shorter version of the paper is in a 1st round revise and resubmit for the European Journal of Marketing.

CH. 1. A Systematic Assessment of Empirical Research on Foreign Market Entry Mode
2
What determines how a firm chooses to enter a foreign market? This research question has been
posed and studied extensively making it one of the key questions in international business
research (Shaver, 2013). However, past reviews of the empirical literature are limited in at least
three important ways. First, traditional narrative reviews are limited in the way that they are
largely unsystematic with no explicit selection and objective evaluation criteria (Shelanski &
Klein, 1995). This makes it difficult to thoroughly assess the empirical support and replicate the
studies. Second, more sophisticated meta-analytical quantitative procedures are powerful, but ill-
suited for analyzing entry mode data that cover multiple dependent variables and a large number
of heterogeneous measures of independent variables (Hunter & Schmidt, 1990; Light & Pillemer,
1984; Stanley & Doucouliagos, 2012). Third, past entry mode reviews disagree when it comes to
the empirical support for tenets as e.g. asset specificity that are very often included in entry mode
research.
This review seeks to overcome these limitations by applying a method already used
successfully in general strategic management (David & Han, 2004; Newbert, 2007). Through the
use of transparent criteria for the selection of studies as well as simple quantitative tools for the
systematic assessment of empirical relationships, this study contributes to the existing literature in
at least three ways. First, it allows for the exploration of consistency in empirical support across
different dependent variables, and the measurement of independent variables. Second, by also
including tests of control variables, the study was able to broaden the review to variables that are
commonly used, but rarely commented on in reviews. Finally, this review identified critical
methodological issues with regard to the entry mode choice set and tests of interaction effects
that have yet to be raised in previous reviews.
In a recent commentary in the Journal of International Business Studies, Shaver (2013) argues that
scholars should question whether more entry mode studies are needed. One of the arguments is
that we have gained a clear understanding of what determines firm entry mode choice. However,
in this review, I identify some serious inconsistent findings with regard to core determinants of
entry mode choice. I present descriptive evidence to suggest that these inconsistencies may be
associated with (1) disparate dependent variables, (2) inconsistent and inferior measurement,
and/or (3) questionable use of methodology. In addition, quite a few entry mode studies suggest
that mode choice is important for subsidiary performance (Brouthers & Hennart, 2007). Even
though current research shows promising results, the results presented in this study show that
such statements may be premature because of the limited number of performance studies. Based
upon these observations, I argue that future research may still make substantive rather than
incremental contributions as mixed findings and too few performance studies reflect that our
knowledge is still incomplete (Hennart and Slangen, 2015).
I begin by briefly summarizing the most common theoretical foundations used in the article
sample. Next, I describe the method, data and selection process used to select the articles. Finally,
I present my results and discuss two core areas with implications for future research: Consistency
of results, performance and methodological issues. The paper ends with a short conclusion.

CH. 1. A Systematic Assessment of Empirical Research on Foreign Market Entry Mode
3
1. Literature review
Entry modes can be characterized as institutional arrangements for how to organize and conduct
business transactions when a firm enters a foreign country (Root, 1987). This definition covers
export, contractual agreement modes (licensing, franchising) and foreign investment (joint
venture [JV] and wholly owned subsidiaries [WOS]), and it has been the starting point for the
development of later definitions (Sharma & Erramilli, 2004).
Entry mode choice is commonly viewed from two different perspectives (K. D. Brouthers &
Hennart, 2007). The first view refers to a mode of entry as a governance structure where
exporting modes, contracts, JVs and WOSs are arranged on a continuum ranging from low to
high control, commitment and risk (Anderson & Gatignon, 1986). The other perspective
categorizes modes into two groups depending on whether they contain equity investments or not
(Hennart, 1988; Hennart, 2000). According to the latter view, JVs and WOSs are the only modes
involving equity investments why JV is not placed in the middle of a continuum of increasing
control, but rather in the equity category. A further distinction made by some entry mode
scholars is the one between the entry mode choice as described above and the so-called
establishment mode choice between acquisitions and greenfields (Dikova & van Witteloostuijn,
2007; Hennart & Slangen, 2008). Even though this distinction is not commonly accepted (Martin,
2013), there are theoretical and empirical reasons to believe that the entry mode and
establishment mode choices are made independently (Hennart, 2000; Padmanabhan & Cho,
1996). For this reason, I follow previous entry mode reviews (K. D. Brouthers & Hennart, 2007;
Zhao, Luo, & Taewon Suh, 2004) and do not include research addressing the establishment
mode choice.
Several different theories have been used to explain the determinants of foreign entry mode
choice. As explained in detail in the methodology section below, transaction costs theory (TCT),
the resource-based view (RBV) and the eclectic framework (OLI) accounted for around 80% of
the articles included in this study. Therefore, this paper is focused around these three
frameworks, with a few occasional comments on other theories such as e.g. new institutional
theory (Scott, 1995; Yiu & Makino, 2002) and real options theory (Li & Rugman, 2007).
Williamson’s (1985) TCT is widely considered as the most commonly applied theory in
foreign entry mode research (K. D. Brouthers & Hennart, 2007; Canabal & White, 2008). The
core idea is that a firm should internalize its foreign transaction if the costs of internalization are
less than those of entering through the market (Anderson & Gatignon, 1986). Hence, TCT
determines the boundary decision of the firm from a cost efficiency perspective (K. D. Brouthers
& Brouthers, 2000; Madhok, 1997). The most cost efficient entry mode is determined by three
contingency-factors: asset specificity, uncertainty and transaction frequency (Williamson, 1985).
As assets become increasingly specific, the risk of hold-up grows larger. The result is that the
entering firm internalizes the transaction as a safeguard against opportunism (Anderson &
Gatignon, 1986; Aulakh & Kotabe, 1997; Klein, Frazier, & Roth, 1990; Williamson, 1985). In the
presence of specific assets, uncertainty raises transaction costs and thereby increases the
preferences for internalizing the international transaction (Williamson, 1985). Finally, a high
transaction frequency is necessary to justify the bureaucratic costs of the hierarchy.

CH. 1. A Systematic Assessment of Empirical Research on Foreign Market Entry Mode
4
The resource-based view (RBV), including organizational capabilities and the knowledge-
based view (K. D. Brouthers & Hennart, 2007), takes the approach of effective and efficient
transfer of resources to the host market. In this process the firm should avoid eroding the value
of the transferred resources and thereby damaging the firm’s competitive advantage (Sharma &
Erramilli, 2004). Therefore, firms should adopt the entry mode strategies that their resources
support (Ekeledo & Sivakumar, 2004). Similar to TCT, RBV proposes that a high degree of tacit
firm know-how being transferred across borders, will lead the market to fail as a knowledge
conductor (Dev, Erramilli, & Agarwal, 2002; Teece, 1986). Hence, as the ratio of tacit to generic
know-how increases, the preference for internalization (e.g. WOS) becomes greater than for
cooperation (e.g. JV). In addition, some RBV-scholars focus on the context into which the
critical resources are transferred. Thus, the hierarchy will fail if the firm does not possess
adequate context specific knowledge (Tan, Erramilli, & Liang, 2001). Consequently, as the need
for critical know-how specific to the context of the host-country increases, the preference for
cooperation becomes greater (Madhok, 1997). The rationale is that the firm knowledge-base can
be supplemented by partners, assuming that such potential partners are present (Contractor &
Kundu, 1998).
Integrating both international trade theory, RBV and TCT, the eclectic framework predicts the
choice of entry mode from the following three key determinants: Ownership, locational and
internalization advantages (Dunning, 1980; Dunning, 1988). In an entry mode context, scholars
see the decision as a tradeoff between desirable levels of return, risk, control, and resource
commitment (Akhter & Robles, 2006; Andersen, 1997). The ownership-based advantages
represent the assets and skills that are specific with regard to the firm (Dunning, 1993) and
increase firm preferences for establishing hierarchal governance structures (Agarwal &
Ramaswami, 1992; K. D. Brouthers, Brouthers, & Werner, 1996). The internalization dimension
determines whether it is more cost efficient for the firm to internalize or to make use of
contractual agreements with local firms (Anderson & Coughlan, 1987; Chiles & McMackin, 1996;
Dunning & Mcqueen, 1981; Hill, 1990). Finally, the location advantage stipulates that as location
specific drivers (e.g. market potential) grow more attractive, entering firms will prefer more
integrated entry modes (K. Brouthers, Brouthers, & Werner, 2001; Pearce & Papanastassiou,
1996). In short, the framework states that when OLI-advantages are high, firms prefer choosing
more integrated entry modes (L. E. Brouthers, Brouthers, & Werner, 1999).
2. Data and methodology
Since Andersen’s (1997) conceptual review, scholars have reviewed entry mode research from
varying narrative approaches (Ahsan & Musteen, 2011; K. D. Brouthers & Hennart, 2007;
Canabal & White, 2008; Harzing, 2003; Sarkar & Cavusgil, 1996; Seggie, 2012) or by using more
complex meta-analytical techniques (Morschett, Schramm-Klein, & Swoboda, 2010; Tihanyi,
Griffith, & Russell, 2005; Zhao et al., 2004). These articles have brought important and valuable
insight about core findings hiding in the still growing bulk of entry mode-focused studies.
This study takes a different approach by using a method developed and applied by David and
Han (2004) and Newbert (2007). Its simplistic nature combined with systematic and explicit
selection criteria makes the approach “a powerful tool in the building of knowledge” (David &

CH. 1. A Systematic Assessment of Empirical Research on Foreign Market Entry Mode
5
Han, 2004: 42). The method is different from the traditional narrative reviews of entry mode
research as it is more explicit in its selection of studies and more quantitative in its evaluation of
these. With regard to the latter, I considered using more advanced quantitative analysis
procedures as e.g. Zhao et al. (2004), but I preferred David & Han’s (2004) simpler method for
the following two reasons. First, the data systematically collected in this study was characterized
by a high degree of heterogeneity2 as researchers had used 45 different operationalizations of the
dependent variable and multiple different measures of independent variables3. Second, parameter
estimates needed to be comparable for a more advanced quantitative analysis. Even though the
majority of the collected tests were performed using logistic regression (68%), the rest of the tests
used parameters from OLS-based studies (10%), multinomial logit (9%), probit (4.5%) etc. As no
technique currently exists that can combine estimates from binary regressions with estimates
from continuous regressions (Stanley & Doucouliagos, 2012), I chose an alternative research
strategy and followed David & Han (2004). This strategy involved several choices outlined below.
2.1. Selection process
My goal was to identify a large, representative sample of entry mode studies published in peer-
reviewed scientific journals. To minimize unwarranted subjective bias in the article selection
process, I used a clear set of selection criteria. Full transparency in the selection process makes
replication of results possible, adds positively to the study’s reliability and makes it possible to
subject the search criteria to criticism and discussion (Light & Pillemer, 1984; Newbert, 2007;
Stroup et al., 2000).
Following Newbert’s (2007) adoption of David and Han’s (2004) method I used the following
selection criteria for the sampling of empirical articles. First, I searched the Web of Science
database. Second, I chose to base my article selection on the entry mode definition stated in the
introduction. Thus, to secure substantive relevance in the selected articles, I restricted the search
to include only articles containing at least one of the keywords ‘entry mode’, ‘joint venture’,
‘wholly owned subsidiary’, ‘licensing’, or ‘franchising’ together with at least one of the following
three primary keywords in their title, abstract or keywords list: international, multinational or
foreign. I selected these keywords based on the reference lists of reviews of foreign entry mode
research. Initial test runs were performed to adjust the selection criteria in order to minimize the
proportion of substantively and methodologically irrelevant results. The keywords ‘exports’ and
‘exporting’ were excluded because their presence boosted the number of irrelevant studies
excluded through the final more subjective selection criteria. This was mainly due to most of
studies originating from fields related to international trade that investigated exports outside of an
entry mode context. In addition, even without the mentioned exporting-focused keywords, entry
mode studies including a type of exporting mode in their dependent variable were still caught by
the search criteria. Thus, in order to not skew the selection unfavorably in a subjective direction
2 To cope with the data heterogeneity I considered different research strategies. First, I ruled out dropping studies not appling the most common entry mode operationalization (JV vs. WOS) efficient as this would cut the data by almost 65%. Second, I considered combining related dependent variables (e.g. JV vs. WOS and shared vs. full control) but as this may skew results and induce a spurious structure into the data (Hunter & Schmidt, 1990; Light & Pillemer, 1984), I did not find it preferable. 3 Authors had used 63 different dependent variable measures when counting performance-focused tests.

CH. 1. A Systematic Assessment of Empirical Research on Foreign Market Entry Mode
6
and because it did not seem to cause the process to miss relevant studies, these keywords were
not included in the final article selection. Third, I ensured empirical content by requiring that the
selected articles also contain at least one of the following seven keywords in their title or abstract:
data, empirical, test, statistical, finding, result or evidence. Fourth, I restricted the search to
journals within the following categories: Business, management, economics, operations research,
management science and business finance. Fifth, I focused the search to include only articles
published during the period 2000-2014 (February). This was not done to discredit any research
published earlier, but simply to focus this study on the newest research trends. Sixth, I ensured
substantive and empirical relevance by reading all remaining abstracts for substantive context (i.e.,
discussion of entry mode frameworks and matching of the chosen entry mode definition) and
empirical content (i.e., mention of statistical tests). Finally, I ensured substantive and empirical
relevance by reading all remaining articles in their entirety for substantive context (i.e., tests of
core tenets) and adequate empirical content (i.e., presentation of results based on statistical tests).
The search was performed on the 1st of October 2011 and updated on the 1st of February
2014. As other reviews of foreign entry mode literature (e.g. Brouthers & Hennart, 2007), this
study was influenced by resource restrictions and thus had to make decisions on the amount of
quantitative research to identify, review, code and analyze. Facing such trade-offs, authors usually
focus on a smaller number of top-tier journals (e.g. Hennart & Slangen, 2015). As most empirical
entry mode studies are published in non-top-tier journals, I chose to make no restrictions based
on journal rankings to ensure a more representative sample. Instead, I chose to more explicitly
focus on more recent research (2000-2013) to clearly position my study among existing reviews
that have extensively covered earlier research (e.g. Sarkar & Cavusgil, 1996; Zhao et al., 2004;
Canabal & White, 2008; Tihanyi, Griffith & Russell, 2005).
Because of a rising interest in studies focusing on entry mode performance, I chose to code
these as well. Still, the main focus of this study lies on entry mode choice why results from
performance-studies are mainly considered separately. I excluded articles that did not meet the
criteria. Among these were studies examining establishment mode choice (Dikova & van
Witteloostuijn, 2007), payment mode (Reuer, Shenkar, & Ragozzino, 2004) and entry timing
(Fisch, 2008). The selection process is summed in Table I, the search syntax can be found in
Appendix and full citations are marked (*) under references.
2.2. Sample description and coding
The selection process resulted in 89 studies meeting the search criteria, 112 if counting
performance-focused studies. My sample compares favorably to quantitative reviews in general
management applying similar methodology: Newbert (2007) included 55 articles, David & Han
(2004) reviewed 63, and Ketchen et al. (1997) had a sample of 40. Additionally, my sample
compares very favorably to past entry mode reviews. The 112 studies in the sample were from 40
different scientific journals. The most frequent were Journal of Business Research (11),
International Business Review (11), Journal of International Business Studies (10) and Journal of
World Business (7). The studies were spread relatively uniformly across different years in the
period 2000-2013 despite small peaks in 2007 and 2009, and the most frequent authors were K.
D. Brouthers (8), Steve Werner (6), and L.E. Brouthers (5).

CH. 1. A Systematic Assessment of Empirical Research on Foreign Market Entry Mode
7
An advanced graduate student and I coded the test results separately including formulated
hypotheses, bibliographic information, variables (independent, dependent and control variables)
and their operationalization resulting in a 92.4% agreement rate. Disagreements were resolved
through joint discussions. Following David & Han (2004), only full model results were coded.
Dependent variables were coded to create consistency in the direction of relationships. Thus, a
positive relationship indicates a higher propensity to choose a higher mode alternatively to one
or more lower modes.
The 89 entry mode articles thus selected for analysis contained 881 statistical tests of entry
mode related relationships. The most frequently tested relationships were based on transaction
cost theory (48%), the resource-based view (24%), and the OLI-model (7%) either alone or in
combination.
Table I. Summary of selection criteriaa
Filter type Description
Database
result
Substantive
All articles with at least one of five entry mode keywords and
with at least one of three additional keywords in title, abstract or
keywords.
1786
Methodological All articles with at least one of seven keywords indicating
empirical data or analysis in title, abstract or keywords. 1246
Substantive All articles in business, economics, operations research,
management science and business finance. 673
Substantive All articles published in the time frame 2000-2014b. 577
Substantive and
Methodological
Remaining abstracts read for both substantive relevance and
statistical analysis 180
Substantive and
Methodological
Remaining full articles read for both substantive relevance and
statistical analysis 112
a The selection criteria are based on and/or adapted from those developed and used by David and Han (2004) and
Newbert (2007). b The search was performed on the 1st of February 2014.
3. Results
Overall, of the 881 mode-related tests, 496 (56%) produced significant results, and 385 (44%)
produced unreliable results. A χ2-test indicated that the difference between the two groups was
significant (χ2 = 27.97, p-value < 0.001). In the section below, I break down the results by
independent variable, dependent variable and independent variable measures. Finally, I comment
on the most common independent-dependent variable pairs and publication year.
3.1. Independent variables
Table II presents the results of the most commonly tested independent variables sorted by
theoretical perspective. Asset specificity was the most tested independent variable in the TCT
framework and appeared in 106 independent statistical tests. 34% of these tests were positively
significant, 18.9 % were negatively significant and 47.2% were non-significant. A χ2-test for

CH. 1. A Systematic Assessment of Empirical Research on Foreign Market Entry Mode
8
equality of proportions showed that these proportions were significantly different (χ2 = 19.13, p-
value < 0.001). Pairwise comparisons for proportions4 indicated a significant difference between
the proportions of non-significant vs. positive results (p-value < 0.05). This suggests evidence in
favor of a higher proportion of unreliable findings. For example, Shieh and Wu (2012) found that
brand specific assets were not associated with the equity-based entry mode choice (JV vs. WOS)
into Vietnam made by corporations in the Greater Chinese Economic Area. Conceptually very
similar to asset specificity, tests of the ownership advantage in the OLI-model showed similar
results with 30% showing a significantly positive relation to choosing higher modes, while 50%
showed a non-significant relationship. Proportions were not significantly different at an alpha of
10% (χ2 = 4.2, p-value = 0.12). RBV tests showed 50% significantly positive results while 37.5%
were non-significant when occasionally testing the relationship between specific assets, most
commonly through specific know-how, and entry mode choice (8 tests). These proportions were
not significantly different (χ2 = 2.625, p-value = 0.27). For example, Reddy, Osborn and Hennart
(2002) found that specific know-how and R&D intensity were significantly related to the
investment or alliance relationship between Japanese and US partners. Together, these results do
not speak in favor of a positive relationship of specific assets with entering through a higher entry
mode, but rather in favor of a non-significant relationship.
The most tested resource within the RBV, international experience, showed results pointing
toward a positive or non-significant relationship. 47.8% of the tests were significantly positively
related to higher modes and 52.2% were unreliable. Overall, the three proportions were
significantly different (p-value < 0.001), but I found no significant difference between the
proportion of positive and the proportion of non-significant results at an alpha of 10% (p-value
= 0.99). For example, analyzing data collected from China, Luo (2001) found that JVs are
preferred when firm host country experience is low. When used to operationalize internal
uncertainty in TCT-based examinations, tests of international experience were less convincing
with 60% being unreliable and 40% being significantly positive. The pairwise comparison test
could not reject the null-hypothesis of no difference between proportions (p-value = 0.65), but
the χ2-test showed evidence against a negative relationship (p-value = 0.02). For example,
Ruiz-Moreno, Mas-Ruiz and Nicolau-Gonzálbez (2007) found mostly non-significant results
when investigating the effect of internal uncertainty on the choice between full and partial
ownership both in a single-stage and a two-stage process. In tests of the OLI-model,
international experience had been used to measure the ownership advantage of the entrant. The
pairwise difference between proportions of 75% positive and 25% non-significant results was
itself non-significant. Here, statistical tests showed no significant difference between the
proportions of negative, non-significant and positive results. Finally, as it can be seen from the
overview of commonly used control variables in Table III, international experience, host country
experience and regional experience had been used relatively often as control variables (16 tests).
International and host country experience showed mostly indications of a positive relationship to
choosing higher modes (both around 60%) even though this was not significantly higher than the
proportion of non-significant results (p-value = 0.2651). However, statistical testing showed
4 The pairwise comparisons between pairs of proportions with correction for multiple testing were performed using the R function pairwise.prop.test. The p-values were adjusted using the correction included by Holm (1979).

CH. 1. A Systematic Assessment of Empirical Research on Foreign Market Entry Mode
9
evidence against a negative relationship (χ2 = 9.18, p-value = 0.01). For instance, Pla-Barber,
Sanchez-Peinado and Madhok (2010) found that firms characterized by higher international
experience entered more often through equity modes alternative to non-equity modes, while it
did not affect their choice between full and shared control. Pairwise comparisons showed no
significant difference depending on whether international experience was used as a main variable
or as a control.
Together, these results suggest that international experience is either positively or not related
to entry mode choice across paradigms. Further, results show no significant difference between
studies employing international experience as a main construct versus studies using it as a control
variable.
Not uncommonly, entry mode researchers had tested hypotheses involving interaction effects.
77 tests of interactions between independent variables were found. Of these over half of the tests
were published within the last four years. The most tested moderator was asset specificity found
within the TCT-paradigm and appearing in interactions with a wide range of different variables,
mostly uncertainty. Other variables that were relatively often included in interactions were
international experience (e.g. Schwens, Eiche, & Kabst, 2011), dynamic learning capabilities (e.g.
K. D. Brouthers, Brouthers, & Werner, 2008b), institutional factors (e.g. Chiao, Lo, & Yu, 2010)
and uncertainty (e.g. Khemakhem, 2010). However, it is uncertain whether moderating
hypotheses in entry mode research have been tested as recommended in the organizational
research methodology literature. Only 54% of the interactions were interpreted using graphical
illustrations and none of the interactions between two continuous variables were interpreted
using the recommended illustrations or statistical tests. As a consequence, analyses of interacting
relationships may be incomplete.
3.2. Dependent variables
Table IV presents the results sorted by dependent variable and further by theoretical perspective.
When sorted by dependent variable, two dominating variable categories could be classified: (1)
Governance form and (2) Degree of control / coordination / integration. The most examined
entry mode choice was the dichotomy between JV and WOS appearing in 314 tests. TCT-based
and RBV-based tests showed some success in establishing a statistical association with this choice
set with 64% of the tests being significant (p-value < 0.001). For instance, Demirbag, Glaister
and Tatoglu (2007) performed a wide range of TCT- and institutional-based tests on JV and
WOS entries into emerging markets finding several significant results. Another very popular
dependent variable across frameworks was the choice between non-equity and equity modes.
This choice showed significant results in 50% of the TCT-based tests (p-value = 0.86), 88% of
the RBV-based tests (p-value < 0.01) and 50% of the OLI-model tests (p-value = 0.99). For
instance, Ji and Dimitratos (2013) found that their OLI-model enriched by Confusian Dynamism
did a good job explaining Chinese private firms’ choice between equity and non-equity modes. In
sum, RBV-based test seemed to have had success explaining equity-mode choice.
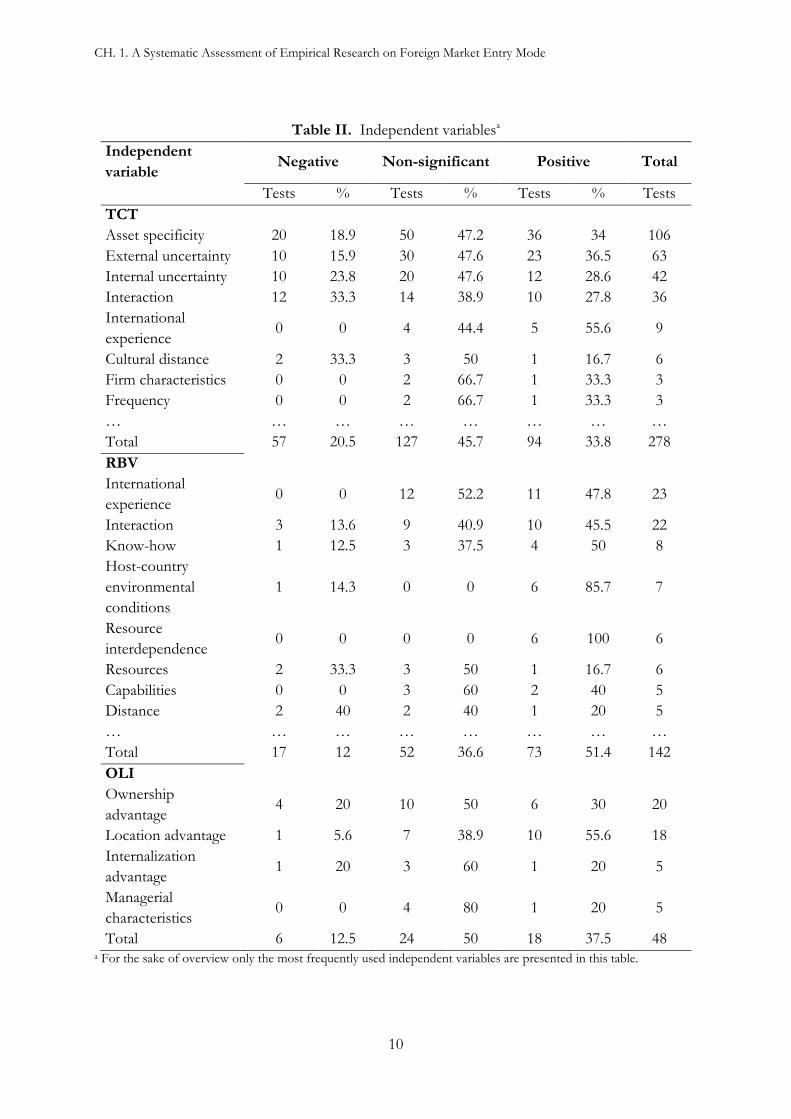
CH. 1. A Systematic Assessment of Empirical Research on Foreign Market Entry Mode
10
Table II. Independent variablesa
Independent
variable Negative Non-significant Positive Total
Tests % Tests % Tests % Tests
TCT
Asset specificity 20 18.9 50 47.2 36 34 106
External uncertainty 10 15.9 30 47.6 23 36.5 63
Internal uncertainty 10 23.8 20 47.6 12 28.6 42
Interaction 12 33.3 14 38.9 10 27.8 36
International
experience 0 0 4 44.4 5 55.6 9
Cultural distance 2 33.3 3 50 1 16.7 6
Firm characteristics 0 0 2 66.7 1 33.3 3
Frequency 0 0 2 66.7 1 33.3 3
… … … … … … … …
Total 57 20.5 127 45.7 94 33.8 278
RBV
International
experience 0 0 12 52.2 11 47.8 23
Interaction 3 13.6 9 40.9 10 45.5 22
Know-how 1 12.5 3 37.5 4 50 8
Host-country
environmental
conditions
1 14.3 0 0 6 85.7 7
Resource
interdependence 0 0 0 0 6 100 6
Resources 2 33.3 3 50 1 16.7 6
Capabilities 0 0 3 60 2 40 5
Distance 2 40 2 40 1 20 5
… … … … … … … …
Total 17 12 52 36.6 73 51.4 142
OLI
Ownership
advantage 4 20 10 50 6 30 20
Location advantage 1 5.6 7 38.9 10 55.6 18
Internalization
advantage 1 20 3 60 1 20 5
Managerial
characteristics 0 0 4 80 1 20 5
Total 6 12.5 24 50 18 37.5 48 a For the sake of overview only the most frequently used independent variables are presented in this table.

CH. 1. A Systematic Assessment of Empirical Research on Foreign Market Entry Mode
11
Table II. (Continued)
Independent
variable Negative Non-significant Positive Total
Tests % Tests % Tests % Tests
Other
Interaction 1 5.3 13 68.4 5 26.3 19
Normative 0 0 2 20 8 80 10
Bargaining power 2 28.6 2 28.6 3 42.9 7
Distance 1 20 2 40 2 40 5
Other 2 40 0 0 3 60 5
Cognitive 0 0 0 0 4 100 4
External uncertainty 1 25 3 75 0 0 4
Location 4 100 0 0 0 0 4
Shareholding 0 0 1 25 3 75 4
International
experience 3 100 0 0 0 0 3
… … … … … … … …
Total 16 17.8 37 41.1 37 41.1 90
Table III. Control variablesa
Control Negative Non-significant Positive Total
Tests % Tests % Tests % Tests
Firm size 5 13.5 18 48.6 14 37.8 37
Industry 1 4.3 10 43.5 12 52.2 23
International
experience 1 6.3 6 37.5 9 56.3 16
R&D intensity 3 25 6 50 3 25 12
Cultural distance 4 57.1 1 14.3 2 28.6 7
Location 1 16.7 3 50 2 33.3 6
GDP growth rate 1 20 3 60 1 20 5
Host country
experience 1 20 1 20 3 60 5
Advertising intensity 2 50 2 50 0 0 4
Country risk 1 25 1 25 2 50 4
GDP 1 25 2 50 1 25 4
JV duration 0 0 1 25 3 75 4
Market size 3 75 1 25 0 0 4
Regional experience 1 25 3 75 0 0 4
… … … … … … … …
Total 66 20.4 145 44.9 112 34.7 323 a For the sake of overview only the most frequently used control variables are presented in this table.

CH. 1. A Systematic Assessment of Empirical Research on Foreign Market Entry Mode
12
Despite general recognition of there being a wide range of different entry mode types, very
few tests of more than two different types against each other could be found. In fact, only 10
articles out of 89 used a model involving multiple outcomes. One such example was Tsang’s
(2005) study that used a multinomial logistic model to investigate the choice between several
different entry modes in a Vietnamese context. Other studies commonly reduced the entry mode
range by pooling choices (e.g. Musteen, Datta, & Herrmann, 2009) or excluding observations
(e.g. Kim & Gray, 2009). It is not clear, however, whether the studies using either a Multinomial
Logit or Ordered Logit model have provided an adequate reporting of results. All studies
employing a multiple outcomes model relied solely on coefficient interpretation when drawing
conclusions about support for their hypotheses. This may be problematic as the sign of a model
coefficient does not need to indicate the direction of the relationship between an independent
and a dependent variable (Cameron & Trivedi, 2005).
In sum, future research can fill an important gap by broadening the entry mode choice set.
However, this poses a different set of challenges for entry mode researchers and it is questionable
whether research so far has met these to a satisfactory extent.
The sample contained 253 statistical tests of performance with 46% being non-significant,
40% showing a significantly positive association with performance and 15% showing the
opposite. Table V presents the results sorted by commonly used performance variables. The
most frequent way of operationalizing performance was through satisfaction with entry mode
performance, generally (67 tests) or with a specific entry mode (JV in 29 tests and WOS in 22
tests). For example, Brouthers, Brouthers and Werner (2000) examined satisfaction with financial
and non-financial performance while Ainuddin, Beamish, Hulland and Rouse (2007) focused
exclusively on JV performance. JV survival (18 tests), alliance performance (17 tests) financial
profitability (12 tests) and WOS survival (12 tests) had also been considered relatively often.
Overall, none of the most commonly used operationalizations proved to be more effective than
others in predicting entry mode performance.
Table VI focuses on the associations between frequently used variables and performance.
Asset specificity was significantly related to higher performance in 54% of the tests, no relation
could be found in 31% of the tests and 15% established a significantly negative relation.
However, tests are too few to conclude a significant difference between the proportions at an
alpha of 10% (χ2 = 4.38, p-value = 0.11). For example, Chang, Chung and Moon (2013) found
that R&D intensive firms performed better when comparing performances of JVs converted into
WOSs to continued JVs. A frequent way of testing performance had been to generate an entry
mode fit dummy variable indicating whether a firm’s entry in the sample could be predicted by
the proposed model. When the model fitted was a TCT model, tests showed a significantly
positive relation to entry mode performance in three out of three tests. For instance, Brouthers,
Brouthers and Werner (2008a) found that Dutch and Greek firms entering Central and Eastern
European markets using their combined TCT and real options model were associated with
significantly higher subsidiary performance than firms that did not. When not using a fit variable,
TCT showed very mixed results with regard to predicting entry mode performance. One popular
test was of JV survival (18). With regard to the former, only 26 % were significantly positively
related to the probability of JV survival while 19% showed a significant negative association. For

CH. 1. A Systematic Assessment of Empirical Research on Foreign Market Entry Mode
13
example, Lu and Hébert (J. Lu & Hébert, 2005) found that when Japanese firms entering Asian
countries had specific assets, high control over foreign equity lead to higher JV survival rates.
Tests with general performance as a dependent variable showed similar results with 32% showing
a significantly positive relation and 32% a negative. Some performance tests showed more
convincing results. 66% of tests with WOS survival as dependent variable were significantly
positive and 33% non-significant. However, the number of tests was too small to reject the null-
hypothesis that no differences exist between proportions. Sorted by theoretical perspective, RBV
had the most success with half of the tests predicting higher performance. Together, these results
suggest some success with explaining performance as preliminary results point in the direction of
a positive association with performance. However, tests are still too few to reject that the
observed associations are a coincidence.
The second section of Table VI presents results of tests of the association between commonly
used control variables and performance. Considering often used control variables, some variables
showed convincing relation to higher entry mode performance. These were firm size (55%),
R&D intensity (50%), and advertising intensity (50%). Even though tested in nine independent
tests, differences between manufacturing and service industry were not significantly related to
performance in 78% of the cases. For instance, Dikova (2009) did not find that manufacturing
and service firms from Western Europe entering Central and Eastern Europe differed with
regard to subsidiary performance. As with the other performance-based results in this study, tests
are still too few to conclude that the observed differences are statistically significant.
3.3. Measures of independent variables and controls
To dig further into the results, I examined some of the most frequently used measures that had
been used across theoretical frameworks: Cultural distance (33 tests), R&D intensity (36 tests),
advertising intensity (18 tests) and international experience (29 tests). Table VII presents these
results sorted first by measure and then by theoretical perspective.
R&D intensity had been used commonly in TCT to operationalize asset specificity. Support
for the theory was not very convincing as 57.9% of the tests were non-significant, 26.3%
significantly positive according to theory, and 15.8% significantly negative contradictory to
theory. A χ2-test showed significant differences between the groups (χ2 = 8.21, p-value = 0.02)
while a pair-wise test showed a significant difference between the proportion of non-significant
and negative results (p-value = 0.05). This is some evidence in favor of a non-significant
relationship between entry mode choice and R&D intensity. For example, Slangen and Tulder
(2009) did not find evidence to support that Dutch firms’ choice between JV and WOS could be
explained by the intensity of their R&D investment. Of the eight statistical RBV-based tests using
R&D intensity as a measure, 75% were significantly positively related to higher mode choice and
25% were non-significant. However, this number of tests was too small to conclude a significant
difference. For instance, Cho and Padmanabhan (2005) found that Japanese firms with higher
R&D intensity had a higher preference for choosing full control modes relative to shared control
modes.
Advertising intensity, also used as a proxy for asset specificity, was used only in TCT-based
tests and was mostly non-significant with 14.3% supporting the proposed positive relation,

CH. 1. A Systematic Assessment of Empirical Research on Foreign Market Entry Mode
14
21.4% contradicting by showing significantly negative results, and 64.3% being non-significant.
At an alpha of 10%, both a χ2- and a pairwise test indicate a significant group difference. There
did not seem to be any notable or significant differences whether R&D intensity or advertising
intensity had been used as a control variable or not. Together, R&D and advertising intensity,
also commonly referred to as intangible asset ratios, did not show particular convincing results.
Surprisingly, the results of firm size and industry seemed weak no matter whether they were
used for measuring core constructs or as control variables. Returning to Table III, it can be seen
that even though firm size, typically determined by number of employees, had been subject to a
total of 37 independent tests as a control variable, only 37.8% showed a significantly positive
relationship and 13.5% even showed a negative relationship with choosing higher modes. A χ2-
(χ2 = 10.78, p-value = 0.005) and a pairwise test suggest an either positive or non-significant
relationship. This was consistent with the picture of firm size as a proxy for an ownership
advantage in the OLI-model. Another very commonly used control variable was firm industry
where 23 tests focused on the difference between manufacturing and service firms. Here, 52.2%
of tests found that service firms were more inclined to choose higher control modes and 43.5%
of the cases still indicated no significant relation to entry mode choice. For example, López-
Duarte and Videl-Suárez (2010) did not find that differences between Spanish manufacturing and
service firms could explain the choice between WOS and other entry modes. Together, these
results indicate surprisingly weak and ambiguous results for some the most frequently used
control variables, especially firm size.
3.4. Variable pairs, journal and publication year
To further assess the results provided above, I calculated the frequencies for the most commonly
appearing independent-dependent variables pairs. These results are presented in Table VIII. Not
surprisingly, the most common pair was JV vs. WOS and asset specificity (39 tests). These results
were consistent with the general results presented above. Noteworthy, asset specificity seemed to
be a much more effective predictor of the choice between non-equity and equity mode as 85.7%
of the seven tests showed a significantly positive relationship between the variable and the use of
equity modes. This was supported by a χ2- and a pairwise test. In addition, international
experience was notably more effective when paired with JV vs. WOS (57.1% positive) or Full vs.
Shared control (50 % positive). χ2- and a pairwise test suggest a significant difference between
negative, and positive and non-significant results, but the pairwise test did not indicate a
significant difference between non-significant and positively significant groups. Together, these
results suggest notable differences depending on independent-dependent variable pairs.
The 112 articles in my sample came from journals mostly within the fields of international
business and general management or marketing. I sorted the journals by number of articles in the
sample. The largest number of articles was found in Journal of Business Research accounting for 11
studies with 103 statistical tests showing a significance rate of 60%, close to the overall
significance rate of 56%. Two international business journals, International Business Review and
Journal of International Business Studies, were the next largest contributors with 114 and 142 tests,
respectively. The significance rate in the former was 43%, a little lower than the overall rate, while
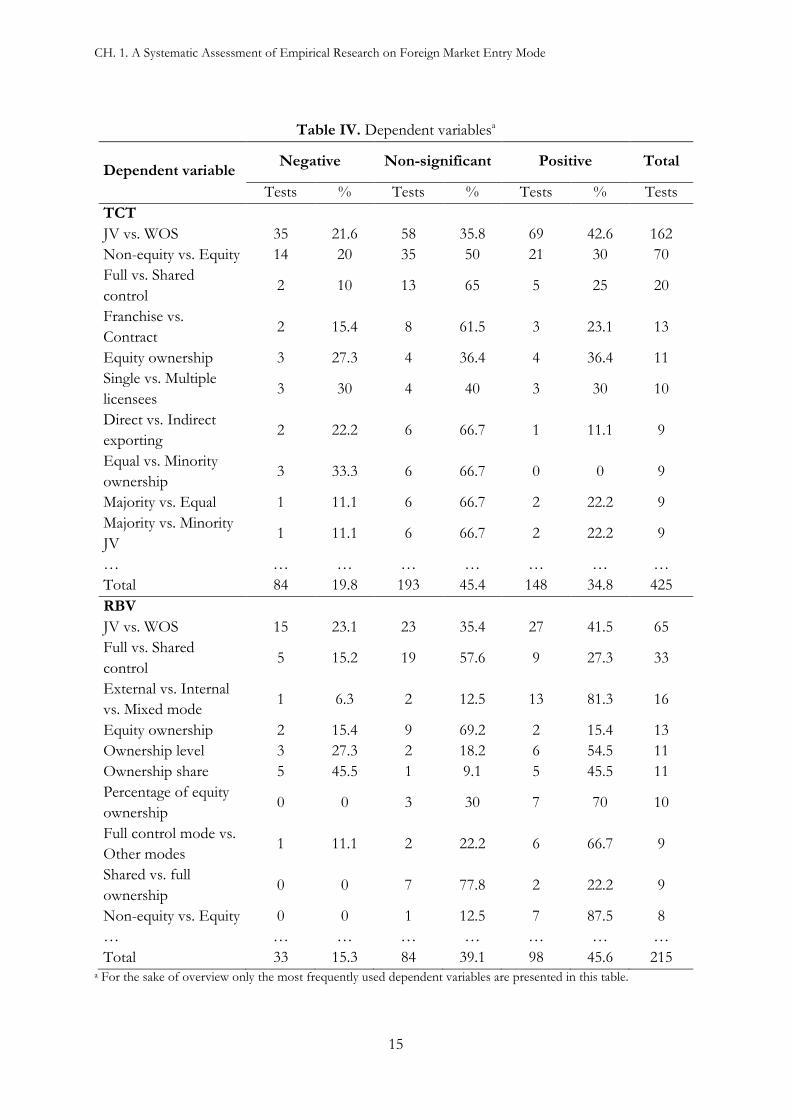
CH. 1. A Systematic Assessment of Empirical Research on Foreign Market Entry Mode
15
Table IV. Dependent variablesa
Dependent variable Negative Non-significant Positive Total
Tests % Tests % Tests % Tests
TCT
JV vs. WOS 35 21.6 58 35.8 69 42.6 162
Non-equity vs. Equity 14 20 35 50 21 30 70
Full vs. Shared
control 2 10 13 65 5 25 20
Franchise vs.
Contract 2 15.4 8 61.5 3 23.1 13
Equity ownership 3 27.3 4 36.4 4 36.4 11
Single vs. Multiple
licensees 3 30 4 40 3 30 10
Direct vs. Indirect
exporting 2 22.2 6 66.7 1 11.1 9
Equal vs. Minority
ownership 3 33.3 6 66.7 0 0 9
Majority vs. Equal 1 11.1 6 66.7 2 22.2 9
Majority vs. Minority
JV 1 11.1 6 66.7 2 22.2 9
… … … … … … … …
Total 84 19.8 193 45.4 148 34.8 425
RBV
JV vs. WOS 15 23.1 23 35.4 27 41.5 65
Full vs. Shared
control 5 15.2 19 57.6 9 27.3 33
External vs. Internal
vs. Mixed mode 1 6.3 2 12.5 13 81.3 16
Equity ownership 2 15.4 9 69.2 2 15.4 13
Ownership level 3 27.3 2 18.2 6 54.5 11
Ownership share 5 45.5 1 9.1 5 45.5 11
Percentage of equity
ownership 0 0 3 30 7 70 10
Full control mode vs.
Other modes 1 11.1 2 22.2 6 66.7 9
Shared vs. full
ownership 0 0 7 77.8 2 22.2 9
Non-equity vs. Equity 0 0 1 12.5 7 87.5 8
… … … … … … … …
Total 33 15.3 84 39.1 98 45.6 215 a For the sake of overview only the most frequently used dependent variables are presented in this table.
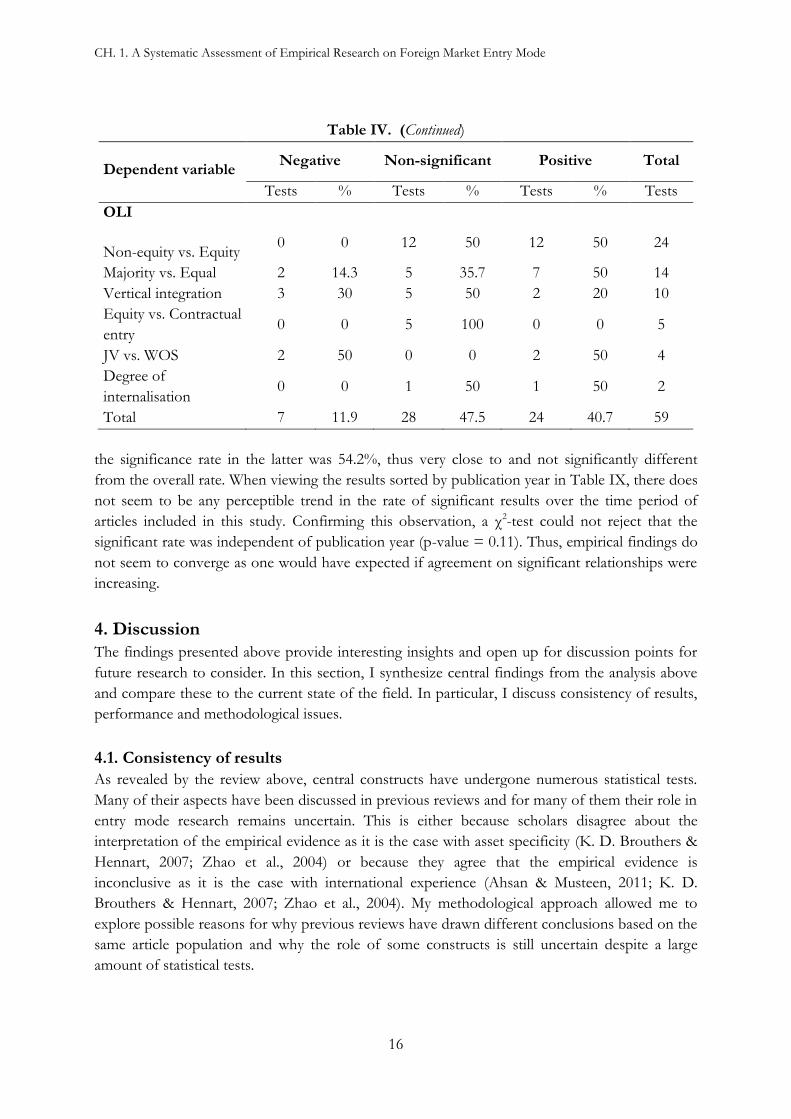
CH. 1. A Systematic Assessment of Empirical Research on Foreign Market Entry Mode
16
Table IV. (Continued)
Dependent variable Negative Non-significant Positive Total
Tests % Tests % Tests % Tests
OLI
Non-equity vs. Equity 0 0 12 50 12 50 24
Majority vs. Equal 2 14.3 5 35.7 7 50 14
Vertical integration 3 30 5 50 2 20 10
Equity vs. Contractual
entry 0 0 5 100 0 0 5
JV vs. WOS 2 50 0 0 2 50 4
Degree of
internalisation 0 0 1 50 1 50 2
Total 7 11.9 28 47.5 24 40.7 59
the significance rate in the latter was 54.2%, thus very close to and not significantly different
from the overall rate. When viewing the results sorted by publication year in Table IX, there does
not seem to be any perceptible trend in the rate of significant results over the time period of
articles included in this study. Confirming this observation, a χ2-test could not reject that the
significant rate was independent of publication year (p-value = 0.11). Thus, empirical findings do
not seem to converge as one would have expected if agreement on significant relationships were
increasing.
4. Discussion
The findings presented above provide interesting insights and open up for discussion points for
future research to consider. In this section, I synthesize central findings from the analysis above
and compare these to the current state of the field. In particular, I discuss consistency of results,
performance and methodological issues.
4.1. Consistency of results
As revealed by the review above, central constructs have undergone numerous statistical tests.
Many of their aspects have been discussed in previous reviews and for many of them their role in
entry mode research remains uncertain. This is either because scholars disagree about the
interpretation of the empirical evidence as it is the case with asset specificity (K. D. Brouthers &
Hennart, 2007; Zhao et al., 2004) or because they agree that the empirical evidence is
inconclusive as it is the case with international experience (Ahsan & Musteen, 2011; K. D.
Brouthers & Hennart, 2007; Zhao et al., 2004). My methodological approach allowed me to
explore possible reasons for why previous reviews have drawn different conclusions based on the
same article population and why the role of some constructs is still uncertain despite a large
amount of statistical tests.

CH. 1. A Systematic Assessment of Empirical Research on Foreign Market Entry Mode
17
Table V. Performance as dependent variable
Dependent
variable Negative Non-significant Positive Total
Tests % Tests % Tests % Tests
Performance 18 26.9 28 41.8 21 31.3 67
JV performance 0 0 18 62.1 11 37.9 29
Subsidiary
performance 5 22.7 10 45.5 7 31.8 22
JV survival 2 11.1 10 55.6 6 33.3 18
Alliance
performance 2 11.8 9 52.9 6 35.3 17
Profitability 1 8.3 6 50 5 41.7 12
WOS survival 2 16.7 4 33.3 6 50 12
JV termination 0 0 9 90 1 10 10
Sales growth 1 10 6 60 3 30 10
JV satisfaction 0 0 6 66.7 3 33.3 9
Non-financial
performance 0 0 2 22.2 7 77.8 9
Subsidiary
mortality 0 0 0 0 9 100 9
Entry mode
success 3 42.9 1 14.3 3 42.9 7
JV knowledge
absorbtion
effectiveness
0 0 4 66.7 2 33.3 6
Entry performance 3 60 1 20 1 20 5
Financial
Performance 0 0 1 20 4 80 5
Financial
performance 0 0 1 25 3 75 4
Majority
ownership 0 0 0 0 2 100 2
Total 37 14.6 116 45.8 100 39.5 253

CH. 1. A Systematic Assessment of Empirical Research on Foreign Market Entry Mode
18
Table VI. Independent variables and performance as dependent variablea
Independent variable
Negative Non-significant Positive Total
Main Tests % Tests % Tests % Tests
Asset specificity 2 15.4 4 30.8 7 53.8 13
Entry mode fit 1 9.1 3 27.3 7 63.6 11
Internal uncertainty
1 9.1 4 36.4 6 54.5 11
Ownership advantage
3 30 3 30 4 40 10
External uncertainty
2 22.2 7 77.8 0 0 9
International experience
0 0 2 28.6 5 71.4 7
Transaction costs 4 80 0 0 1 20 5
Resource type 0 0 0 0 4 100 4
Competition 1 33.3 1 33.3 1 33.3 3
Institutional distance
0 0 0 0 2 100 2
… … … … … … … …
Total 15 14.2 38 35.8 53 50 106
Control
Firm size 2 18.2 3 27.3 6 54.5 11
Industry 1 11.1 7 77.8 1 11.1 9
R&D intensity 2 25 2 25 4 50 8
Cultural distance 2 28.6 3 42.9 2 28.6 7
International experience
3 42.9 4 57.1 0 0 7
Advertising intensity
1 16.7 2 33.3 3 50 6
Host country experience
1 20 2 40 2 40 5
Subsidiary age 1 20 2 40 2 40 5
Subsidiary size 2 40 0 0 3 60 5
Entry mode 0 0 4 100 0 0 4
Mode experience 0 0 2 50 2 50 4
Asia 0 0 0 0 3 100 3
Europe 0 0 3 100 0 0 3
North America 0 0 3 100 0 0 3
Parent firm size 2 66.7 1 33.3 0 0 3
… … … … … … … …
Total 34 16 91 42.9 87 41 212 a For the sake of overview only the independent variables most frequently used in conjunction with performance are
presented in this table.
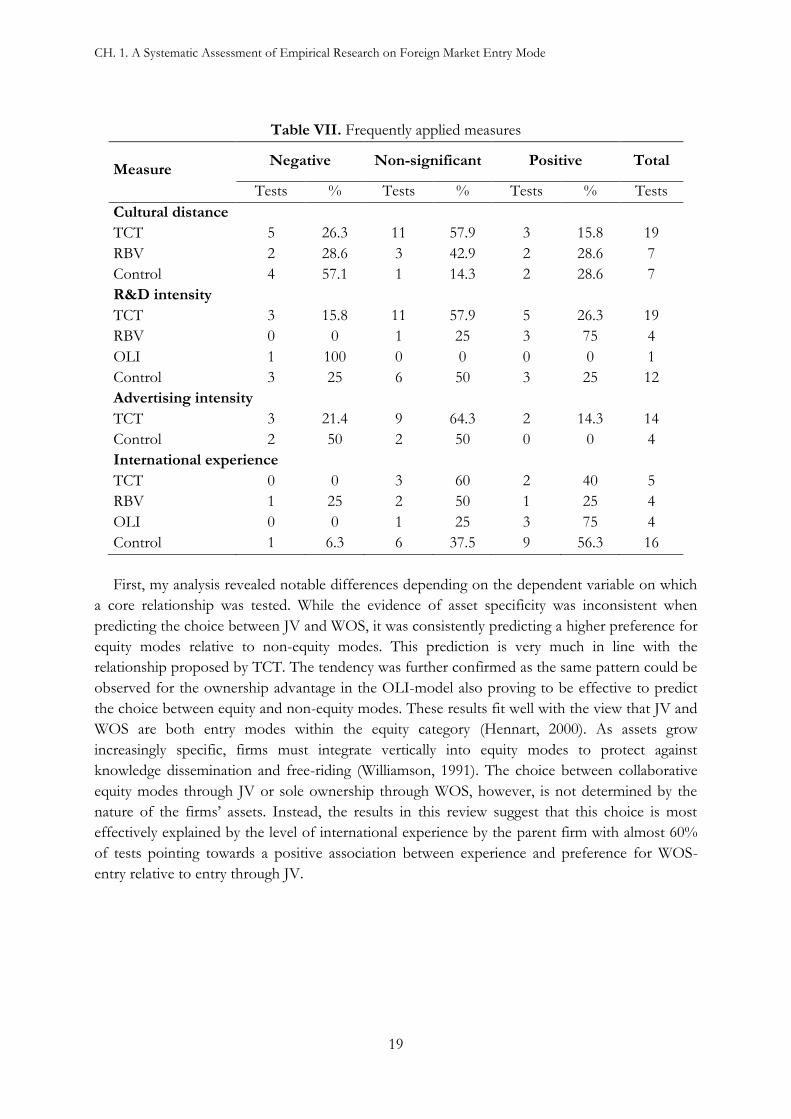
CH. 1. A Systematic Assessment of Empirical Research on Foreign Market Entry Mode
19
Table VII. Frequently applied measures
Measure Negative Non-significant Positive Total
Tests % Tests % Tests % Tests
Cultural distance
TCT 5 26.3 11 57.9 3 15.8 19
RBV 2 28.6 3 42.9 2 28.6 7
Control 4 57.1 1 14.3 2 28.6 7
R&D intensity
TCT 3 15.8 11 57.9 5 26.3 19
RBV 0 0 1 25 3 75 4
OLI 1 100 0 0 0 0 1
Control 3 25 6 50 3 25 12
Advertising intensity
TCT 3 21.4 9 64.3 2 14.3 14
Control 2 50 2 50 0 0 4
International experience
TCT 0 0 3 60 2 40 5
RBV 1 25 2 50 1 25 4
OLI 0 0 1 25 3 75 4
Control 1 6.3 6 37.5 9 56.3 16
First, my analysis revealed notable differences depending on the dependent variable on which
a core relationship was tested. While the evidence of asset specificity was inconsistent when
predicting the choice between JV and WOS, it was consistently predicting a higher preference for
equity modes relative to non-equity modes. This prediction is very much in line with the
relationship proposed by TCT. The tendency was further confirmed as the same pattern could be
observed for the ownership advantage in the OLI-model also proving to be effective to predict
the choice between equity and non-equity modes. These results fit well with the view that JV and
WOS are both entry modes within the equity category (Hennart, 2000). As assets grow
increasingly specific, firms must integrate vertically into equity modes to protect against
knowledge dissemination and free-riding (Williamson, 1991). The choice between collaborative
equity modes through JV or sole ownership through WOS, however, is not determined by the
nature of the firms’ assets. Instead, the results in this review suggest that this choice is most
effectively explained by the level of international experience by the parent firm with almost 60%
of tests pointing towards a positive association between experience and preference for WOS-
entry relative to entry through JV.

CH. 1. A Systematic Assessment of Empirical Research on Foreign Market Entry Mode
20
Table VIII. Independent-dependent variable pairsa
Dependent-independent variable pair
Negative Non-significant Positive Total
Tests % Tests % Tests % Tests
JV vs. WOS
Asset specificity 8 20.5 16 41 15 38.5 39
External uncertainty
7 28 8 32 10 40 25
Internal uncertainty
5 38.5 5 38.5 3 23.1 13
Distance 3 42.9 3 42.9 1 14.3 7
International experience 0 0 3 42.9 4 57.1 7
Cultural distance 1 16.7 3 50 2 33.3 6
… … … … … … … …
Total 35 24.3 50 34.7 59 41 144
Non-equity vs. Equity
External uncertainty
1 11.1 8 88.9 0 0 9
Ownership advantage
0 0 2 22.2 7 77.8 9
Location advantage
0 0 5 62.5 3 37.5 8
Asset specificity 0 0 1 14.3 6 85.7 7
Managerial characteristics
0 0 4 80 1 20 5
Internal uncertainty
1 25 2 50 1 25 4
… … … … … … … …
Total 2 3.9 23 45.1 26 51 51
Full vs. Shared control
International experience 0 0 6 50 6 50 12
External uncertainty
0 0 5 83.3 1 16.7 6
Internal uncertainty
1 16.7 4 66.7 1 16.7 6
Asset specificity 0 0 3 75 1 25 4
Assets 1 50 1 50 0 0 2
Business relatedness 0 0 1 50 1 50 2
… … … … … … … …
Total 2 5.1 23 59 14 35.9 39

CH. 1. A Systematic Assessment of Empirical Research on Foreign Market Entry Mode
21
Table IX. Results by year
Year Negative Non-significant Positive Total
Articles Tests % Tests % Tests % Tests
2000 6 12 18.5 20 30.8 33 50.8 65
2001 5 12 11.7 51 49.5 40 38.8 103
2002 9 18 17 41 38.7 47 44.3 106
2003 6 16 26.7 19 31.7 25 41.7 60
2004 6 5 8.8 19 33.3 33 57.9 57
2005 8 30 29.4 56 54.9 16 15.7 102
2006 3 4 16 11 44 10 40 25
2007 15 24 17.5 69 50.4 44 32.1 137
2008 14 32 20.5 71 45.5 53 34 156
2009 17 23 16.4 55 39.3 62 44.3 140
2010 6 14 16.9 45 54.2 24 28.9 83
2011 4 4 8.9 21 46.7 20 44.4 45
2012 5 12 27.9 18 41.9 13 30.2 43
2013 8 6 11.1 23 42.6 25 46.3 54
Total 112 212 18 519 44.1 445 37.8 1,176
Second, direction and significance of results seem to depend on measurement. The so-called
intangible asset ratios, R&D and advertising intensity, have been used to a large extent both as
measures of core constructs but also as mere control variables. Thus, there appears to be some
consensus that these are relevant predictors of entry mode choice even though convincing
empirical evidence is still lacking. In TCT, R&D-intensity has typically been applied as a proxy
for physical asset specificity, while advertising intensity is set to manifest brand specificity (Zhao
et al., 2004). Both types of specificity give rise to a free-riding problem because transferring and
sharing technology and reputation involves hazards of appropriability (Oxley, 1997). This study
shows that R&D- and advertising intensity have not produced convincing results. This is not
consistent with the conclusion made by Zhao et al. (2004), who conclude a significant relation to
the choice between JV and WOS.
There may be several reasons for this. First, Zhao et al. (2004) do not include newer research
in their analysis. Second, focusing on more than one operationalization of the dependent variable,
this study was able to get a broader view on mode choice. Third, it may be that because Zhao et
al.’s (2004) methodology allows them to explicitly take sample sizes, standard errors and effect
sizes of individual studies into account, a more precise estimate of a narrower focused
relationship can be reached. Nevertheless, it is interesting that the results are unclear considering
how frequently these measures are used in practice. Indeed, one alternative explanation for the
results found in this study may be that R&D- and advertising intensity are not good proxies for
asset specificity. In fact, because of their characteristics as input variables, high R&D- and
advertising expenditure may actually neither result in specific assets nor information asymmetry
(Burgel & Murray, 2000).

CH. 1. A Systematic Assessment of Empirical Research on Foreign Market Entry Mode
22
Third, it was remarkable to find little and conflicting evidence for a relationship between some
of the most frequently used control variables and entry mode choice. Previous reviews in entry
mode research have commented little on often used control variables such as firm size and
industry. In empirical studies, it is frequently suggested that larger firms tend to use more
integrated entry modes. Commonly, it is argued that larger firms possess more resources than
smaller firms (Combs & Ketchen, 1999), and that firm size is an indication of a firm’s potential to
meet resource requirements (Buckley & Casson, 1998). Even though this study largely rejects a
negative relationship, it cannot reject that there is no difference between the proportion of non-
significant and positive results. This is rather disappointing considering that firm size is the most
popular control variable in entry mode research. Clearly, future research should focus more on
this relationship as it is curious why the evidence is not more compelling after numerous tests.
To sum up, results of the relationship between firm size and entry mode choice are not what
one might have hoped for. It seems that more thought needs to be given into the nature of the
relationship between firm size and entry mode choice. Insightful relationships involving
interactions have been proposed and supported in a few studies in the empirical literature,
showing a promising direction for solving the control variable paradox. Still, more testing is
needed to say anything conclusive.
4.2. Performance
The sample in this study included several performance-oriented studies. The interest in
conducting studies focusing on the connection between entry mode choice and performance is
growing: In this study, 55% of all performance tests had been made in the period 2007-2013.
Despite the seemingly growing interest, I argue that further research is still needed. I also caution
that that it may be too early to conclude that mode choice is important for subsidiary. Still, I
believe that current research shows promise and that some existing practices may show the way
for future research.
As strategic management researchers, we are often eager to draw conclusions about the
superiority of one strategy over another. Investigating causal links between a firm strategy and
superior performance is at the heart of research in business strategy. Still, we must be careful not
to make claims about the importance of mode choice for performance before the sufficient
empirical evidence exists.
According to results in this study, too few tests exist to conclude about the link between
performance and choosing the theoretical ‘right’ entry mode. Such statements are premature as
the bulk of empirical evidence at its current state is simply not large enough. I ague that
researchers should put the link between the theoretically ‘right’ entry mode and performance on
the agenda. Four recent commentaries (Hennart & Slangen, 2015; Martin, 2013; Shaver, 2013;
Brouthers, 2013) in the Journal of International Business Studies explicitly discuss the importance of
distinguishing between what firms do and what they should be doing, but only one of them puts
more performance-oriented research on the top of research agenda (Brouthers, 2013). I argue
that if we wish to approach more conclusive statements about the performance consequences of
making entry mode decisions based on even dominating theoretical frameworks, we require more
research of this kind.

CH. 1. A Systematic Assessment of Empirical Research on Foreign Market Entry Mode
23
With this word of caution in mind, there are approaches in the current literature that certainly
show some promise. One such approach is to generate an entry mode fit variable through a first-
stage logistic or probit regression and then include this variable in a second-stage OLS regression
using performance as a dependent variable (e.g. K. D. Brouthers, 2002). A variation of this
approach has been applied using Heckman-correction as first suggested by Shaver (1998) in an
entry mode context. This procedure produces a self-correction variable in the first-stage probit
estimations, which is then incorporated in the second-stage (e.g. K. D. Brouthers et al., 2008a).
This approach is discussed extensively by Martin (2013) and Brouthers (2013) and may be
adopted by future research such that more conclusive statements about the importance of mode
choice for performance may be made.
In sum, even though a line of performance-studies has shown promising results when linking
theoretical fit to entry mode performance, this study shows that it is still premature to conclude
any significant difference between significantly positive and non-significant results. Based on this
observation, I recommend that performance-based studies are not neglected when discussing
what should be on the future research agenda. To derive normative implications of often used
theories as e.g. transaction cost theory should be a mandatory goal that currently does not find
itself among our top priorities.
4.3. Methodological issues
My review revealed two critical issues with regard to the methodological praxis in previous entry
mode studies. First, I found that entry mode choice has very rarely been operationalized as
anything other than a dichotomous variable, most commonly JV vs. WOS, Non-equity vs. Equity
modes and Full vs. Shared control. Despite the wide range of entry modes firms can choose from
(Anderson & Gatignon, 1986), researchers have so far had a disproportionate focus on a few
relationships where many of the most typical entry mode types are excluded. In my opinion,
future entry mode research may benefit in at least two important ways from putting fewer
restrictions on the entry options and instead broadening the choice set. First, strategic choices are
rarely binary and the entry mode choice is no different (Kogut & Singh, 1988). A broadening of
the choice set may lead to a better understanding of the real world entry mode decision where
managers stand before multiple entry mode options. Second, by broadening the choice set we
avoid that our empirical results rely on the aggregation of dissimilar entry mode types or the
deletion of whole choice categories (Martin, 2013). If we stay on the current path we may miss
the opportunity to explain the variation in entry mode decision outcome that could have been
explained by allowing for multiple entry outcomes.
Allowing multiple unordered or ordered discrete alternatives is not without challenges. Indeed,
researchers in strategy research often mistakenly borrow from their regular logit and probit
toolbox and rely on coefficient interpretation when dealing with multiple outcomes (Bowen &
Wiersema, 2004). Instead it is necessary to calculate marginal effects to correctly conclude on the
direction and magnitude of the relationship (Cameron & Trivedi, 2005). Further complicating the
issue is the fact that the marginal effects are not constant across observations. This has the
consequence that the marginal effects may be positive for some observations and negative for
others (Greene, 2003). Thus, an analysis relying solely on a summary measure of the marginal

CH. 1. A Systematic Assessment of Empirical Research on Foreign Market Entry Mode
24
effect becomes incomplete leaving out important information about the nature of the true
marginal effect (Wiersema & Bowen, 2009). This study found that entry mode research has yet to
meet these challenges, thus risking wrong conclusions on the direction of relationships. In fact,
the large proportions of non-significant findings with regard to commonly used control variables
such as firm size may be explained in part by such inferior practices. It is crucial that future
research implement the correct practice as suggested in econometric and organizational research
methodology literature in order to draw correct inferences about the hypothesized relationships.
Second, I found serious issues in past entry mode research with regard to the interpretation of
interaction effects. Similar issues have been found in the majority of past research in strategic
management using logistic regression models (Hoetker, 2007). The main problem is the extension
of the intuition from linear to non-linear models. Unlike linear models, there are many values of
the marginal effect in non-linear models, each with its own standard error (Wiersema & Bowen,
2009). Therefore, the interactions in non-linear models commonly used in entry mode should not
be interpreted by observing the sign, magnitude and statistical significance of the estimated
coefficient of the interaction term as these differ at each observation in the sample (Karaca-
Mandic, Norton, & Dowd, 2012). This is where graphical representations of the moderating
effects become very powerful.
In my review of the empirical literature, I found that entry mode researchers commonly use
techniques from OLS analysis. Little over half of the interactions identified in this study were
most commonly presented through a graphical illustration containing two (or three) lines. In
these figures, the slope of each line indicates the marginal effect of the independent variable at a
low, mean and a high value of the moderating variable. However, there are two serious problems
with such a graphical analysis. First, without reporting confidence intervals around each line, such
an approach completely ignores the statistical significance of each marginal effect and that z-
statistic values differ for each observation in the sample (Hoetker, 2007).This was considered in
only one of the articles included in this study. Second, the analysis becomes incomplete as it
ignores the fact that the marginal effect of a variable in a non-linear model is by no means
constant. Assuming a constant marginal effect over all values of the moderator without further
analysis may lead to false conclusions. In a best case scenario, using such representations alone
can only be suggestive of a moderating effect and risk being misleading (Wiersema & Bowen,
2009).
To overcome the challenges described above, researchers should follow guidelines described
in the econometric and organizational research methodology literature. Wiersema and Bowen
(2009) recommend first performing a graphical analysis where the value and z-statistic of the
marginal effect is computed at each observation in the sample. This accounts for the possible
change in sign and significance of the marginal effects. Second, to illustrate the directional effect
of the moderator on the marginal effect of the main variable, the value and significance of the
marginal effect of each main variable should be computed at selected values of the moderator
holding all other model variables fixed at their means (or other relevant values). As stressed by
the authors, the above procedure should always be performed in order to prevent misleading
results.

CH. 1. A Systematic Assessment of Empirical Research on Foreign Market Entry Mode
25
In sum, future entry mode research can benefit from broadening its decision set and removing
focus from narrow dichotomous mode conceptualizations. In addition, researchers stand before
critical challenges when it comes to handling multiple outcome models and correctly testing
hypotheses involving moderating effects. It is crucial that future research overcomes these
hurdles by following the methodological guidelines recommended in the literature.
5. Conclusion and Limitations
In this review, I sought to overcome some of the limitations of past entry mode reviews through
a methodological approach used in general strategic management. This method opened up for an
investigation of weak and inconsistent results from tests of commonly used variables and their
measures, which led to evidence questioning the success of often used measures for core
constructs (R&D- and advertising intensity) and control variables (firm size). These variables are
used to such an extent in the literature that consistent results are necessary if we are to claim that
we are moving towards a better understanding of the determinants of foreign entry mode.
I also found that conclusions about the link between entry mode choice variables and
performance may be premature. To derive normative conclusions about some of most often
applied theoretical frameworks as e.g. TCT, we require more research testing the association
between selecting the theoretically ‘right’ entry mode and post-entry performance.
Performance-oriented research is essential to the entry mode field because it makes sure that
we do not make unjustified leaps by drawing normative conclusions based on research that
describes how firms enter foreign countries. Entry mode researchers are to an increasing degree
acknowledging that what firms do and what firms should be doing is not necessarily the same. In
this review of the empirical literature I question whether statements about the importance of
mode choice for performance may be made prematurely. To make such statements, we require
more research investigating the importance of theoretical fit for subsidiary performance.
I identified critical methodological issues of which future research should be aware. First, I
found that empirical results are highly contingent on how the entry mode choice was
operationalized. This led to a discussion about broadening the entry mode choice set. I argued
for minimizing the risk that future empirical results depend on a too narrow operationalization of
entry mode choice that removes it too far away from the choice that managers face in the real
world. Second, I highlighted methodological challenges in the examination of moderating effects
in the models most commonly used in entry mode research and when interpreting results from
discrete models with multiple outcomes.
Of course, my methodological approach has its own limitations. Even though it provides a
systematic assessment of empirical results based on an article sample drawn through a
transparent and repeatable selection process, it is limited to explore relationships through a
simple procedure that puts a lot of focus on significance and less on effect sizes. Further, I
restricted the study to cover only empirical research excluding theoretical papers that have helped
advance our knowledge. An additional limitation is due to the choice of putting no restriction on
the number of different journals at the cost of a shorter time period.

CH. 1. A Systematic Assessment of Empirical Research on Foreign Market Entry Mode
26
References5
Agarwal, S., & Ramaswami, S. N. (1992). Choice of foreign-market entry mode - impact of
ownership,
location and internalization factors. Journal of International Business Studies, 23(1), 1-27.
*Ahmed, Z., Mohamad, O., Tan, B., & Johnson, J. (2002). International risk perceptions and
mode of entry: A case study of malaysian multinational firms. Journal of Business Research,
55(10), 805-813.
Ahsan, M., & Musteen, M. (2011). Multinational enterprises' entry mode strategies and
uncertainty: A review and extension. International Journal of Management Reviews, 13(4), 376-392.
*Ainuddin, R. A., Beamish, P. W., Hulland, J. S., & Rouse, M. J. (2007). Resource attributes and
firm performance in international joint ventures. Journal of World Business, 42(1), 47-60.
Akhter, S., & Robles, F. (2006). Leveraging internal competency and managing environmental
uncertainty - propensity to collaborate in international markets. International Marketing Review,
23(1), 98-115.
Andersen, O. (1997). Internationalization and market entry mode: A review of theories and
conceptual frameworks. Management International Review, 37(2), 27-42.
*Andersen, O., & Buvik, A. (2001). Inter-fim co-ordination: International versus domestic buyer-
seller relationships. Omega, 29(2), 207-219.
Anderson, E., & Coughlan, A. T. (1987). International market entry and expansion via
independent or integrated channels of distribution. The Journal of Marketing, 51(1), 71-82.
Anderson, E., & Gatignon, H. (1986). Modes of foreign entry: A transaction cost analysis and
propositions. Journal of International Business Studies, 17(3), 1-26.
*Aulakh, P. S., Jiang, M. S., & Pan, Y. (2010). International technology licensing: Monopoly rents,
transaction costs and exclusive rights. Journal of International Business Studies, 41(4), 587-605.
Aulakh, P. S., & Kotabe, M. (1997). Antecedents and performance implications of channel
integration in foreign markets. Journal of International Business Studies, 28(1), 145-175.
*Blomstermo, A., Sharma, D. D., & Sallis, J. (2006). Choice of foreign market entry mode in
service firms. International Marketing Review, 23(2-3), 211-229.
5 Studies preceded by ’*’ were included in the empirical dataset.

CH. 1. A Systematic Assessment of Empirical Research on Foreign Market Entry Mode
27
*Bouquet, C., Hébert, L., & Delios, A. (2004). Foreign expansion in service industries:
Separability and human capital intensity. Journal of Business Research, 57(1), 35-46.
Bowen, H. P., & Wiersema, M. F. (2004). Modeling limited dependent variables: Guidelines for
researchers of strategic management. In D. J. Ketchen, & D. Bergh (Eds.), Research
methodology in strategy and management (volume 1) (pp. 87-134). Oxford, UK: JAI/Elsevier Press.
*Bradley, F., & Gannon, M. (2000). Does the firm's technology and marketing profile affect
foreign market entry? Journal of International Marketing, 8(4), 12-36.
*Brouthers, K. D., & Nakos, G. (2004). SME entry mode choice and performance: A transaction
cost perspective. Entrepreneurship-Theory and Practice, 28(3), 229-247.
*Brouthers, K., Brouthers, L., & Werner, S. (2001). R&D mode choices in central and eastern
europe. Journal of Business Research, 52(1), 83-91.
*Brouthers, K., Brouthers, L., & Werner, S. (2002). Industrial sector, perceived environmental
uncertainty and entry mode strategy. Journal of Business Research, 55(6), 495-507.
Brouthers, K. D. (2013). A retrospective on: Institutional, cultural and transaction cost influences
on entry mode choice and performance. Journal of International Business Studies, 44(1), 14-22.
Brouthers, K. D. (2002). Institutional, cultural and transaction cost influences on entry mode
choice and performance. Journal of International Business Studies, 33(2), 203-221.
Brouthers, K. D., & Brouthers, L. E. (2000). Acquisition or greenfield start-up? institutional,
cultural and transaction cost influences. Strategic Management Journal, 21(1), 89-97.
*Brouthers, K. D., & Brouthers, L. E. (2003). Why service and manufacturing entry mode
choices differ: The influence of transaction cost factors, risk and trust*. Journal of Management
Studies, 40(5), 1179-1204.
Brouthers, K. D., Brouthers, L. E., & Werner, S. (1996). Dunning's eclectic theory and the
smaller firm: The impact of ownership and locational advantages on the choice of entry-
modes in the computer software industry. International Business Review, 5(4), 377-394.
*Brouthers, K. D., Brouthers, L. E., & Werner, S. (2003). Transaction cost-enhanced entry mode
choices and firm performance. Strategic Management Journal, 24(12), 1239-1248.
*Brouthers, K. D., Brouthers, L. E., & Werner, S. (2008a). Real options, international entry mode
choice and performance. Journal of Management Studies, 45(5), 936-960.
*Brouthers, K. D., Brouthers, L. E., & Werner, S. (2008b). Resource-based advantages in an
international context. Journal of Management, 34(2), 189-217.

CH. 1. A Systematic Assessment of Empirical Research on Foreign Market Entry Mode
28
Brouthers, K. D., & Hennart, J. (2007). Boundaries of the firm: Insights from international entry
mode research. Journal of Management, 33(3), 395-425.
Brouthers, L. E., Brouthers, K. D., & Werner, S. (1999). Is dunning's eclectic framework
descriptive or normative? Journal of International Business Studies, 30(4), 831-844.
*Brouthers, L. E., Brouthers, K. D., & Werner, S. (2000). Perceived environmental uncertainty,
entry mode choice and satisfaction with EC-MNC performance. British Journal of Management,
11(3), 183-195.
Buckley, P. J., & Casson, M. C. (1998). Models of the multinational enterprise. Journal of
International Business Studies, 29(1), 21-44.
*Burgel, O., & Murray, G. (2000). The international market entry choices of start-up companies
in high-technology industries. Journal of International Marketing, 8(2), 33-62.
Cameron, A. C., & Trivedi, K. P. (2005). Microeconometrics: Methods and applications. New York:
Cambridge University Press.
Canabal, A., & White, G. O. (2008). Entry mode research: Past and future. International Business
Review, 17(3), 267-284.
*Chadee, D. (2002). Foreign ownership structure of service equity joint ventures in china.
International Journal of Service Industry Management, 13(2), 181-201.
*Chang, S., Chung, J., & Moon, J. J. (2013). When do wholly owned subsidiaries perform better
than joint ventures? Strategic Management Journal, 34(3), 317-337.
*Chen, J. J., & Dimou, I. (2005). Expansion strategy of international hotel firms. Journal of
Business Research, 58(12), 1730-1740.
Chen, H., Hsu, C., & Caskey, D. (2013). Internationalization of taiwanese manufacturing firms:
The evolution of subsidiary mandates and capabilities. Asian Business & Management, 12(1),
37-60.
*Chen, M., & Chang, J. (2011). The choice of foreign market entry mode: An analysis of the
dynamic probit model. Economic Modelling, 28(1-2), 439-450.
*Chen, P. 2013, "Modes of Foreign Direct Investment and Intellectual Property Rights
Protection: Wholly-owned or Joint Venture? Firm-level Evidence from Taiwanese
Multinational Manufacturing Enterprises", Review of International Economics, vol. 21, no. 3, pp.
549-561.
CH. 1. A Systematic Assessment of Empirical Research on Foreign Market Entry Mode
29
*Chiao, Y., Lo, F., & Yu, C. (2010). Choosing between wholly-owned subsidiaries and joint
ventures of MNCs from an emerging market. International Marketing Review, 27(3), 338-365.
Chiles, T. H., & McMackin, J. F. (1996). Integrating variable risk preferences, trust, and
transaction cost economics. The Academy of Management Review, 21(1), 73-99.
*Cho, K. R., & Padmanabhan, P. (2005). Revisiting the role of cultural distance in MNC's foreign
ownership mode choice: The moderating effect of experience attributes. International Business
Review, 14(3), 307-324.
Choi, C. (2012). Trust, capability, and management control in international joint ventures in
korea: A dynamic perspective. Journal of Korea Trade, 16(1), 23-38.
*Chun, B. G. (2009). Firm's choice of ownership structure: An empirical test with korean
multinationals. Japan and the World Economy, 21(1), 26-38.
*Claver, E., Rienda, L., & Quer, D. (2009). Family firms' international commitment the influence
of family-related factors. Family Business Review, 22(2), 125-135.
Combs, J. G., & Ketchen, J.,David J. (1999). Explaining interfirm cooperation and performance:
Toward a reconciliation of predictions from the resource-based view and organizational
economics. Strategic Management Journal, 20(9), 867-888.
Contractor, F. J., & Kundu, S. K. (1998). Franchising versus company-run operations: Modal
choice in the global hotel sector. Journal of International Marketing, 6(2), 28-53.
*Cui, L., & Jiang, F. (2009). FDI entry mode choice of chinese firms: A strategic behavior
perspective. Journal of World Business, 44(4), 434-444.
*Czinkota, M. R., Grossman, D. A., Javalgi, R. G., & Nugent, N. (2009). Foreign market entry
mode of service firms: The case of US MBA programs. Journal of World Business, 44(3), 274-
286.
David, R., & Han, S. (2004). A systematic assessment of the empirical support for transaction
cost economics. Strategic Management Journal, 25(1), 39-58.
*Davis, P. S., Desai, A. B., & Francis, J. D. (2000). Mode of international entry: An isomorphism
perspective. Journal of International Business Studies, 31(2), 239-258.
*Delios, A., & Beamish, P. W. (2001). Survival and profitability: The roles of experience and
intangible assets in foreign subsidiary performance. The Academy of Management Journal, 44(5),
1028-1038.
CH. 1. A Systematic Assessment of Empirical Research on Foreign Market Entry Mode
30
*Demirbag, M., Glaister, K. W., & Tatoglu, E. (2007). Institutional and transaction cost
influences on MNEs’ ownership strategies of their affiliates: Evidence from an emerging
market. Journal of World Business, 42(4), 418-434.
*Demirbag, M., Tatoglu, E., & Glaister, K. W. (2009). Equity-based entry modes of emerging
country multinationals: Lessons from turkey. Journal of World Business, 44(4), 445-462.
Dev, C. S., Erramilli, M. K., & Agarwal, S. (2002). Brands across borders: Determining factors in
choosing franchising or management contracts for entering international markets. The Cornell
Hotel and Restaurant Administration Quarterly, 43(6), 91-104.
*Dhanaraj, C., & Beamish, P. W. (2009). Institutional environment and subsidiary survival.
Management International Review, 49(3), 291-312.
Dikova, D., & van Witteloostuijn, A. (2007). Foreign direct investment mode choice: Entry and
establishment modes in transition economies. Journal of International Business Studies, 38(6),
1013-1033.
*Dikova, D. (2009). Performance of foreign subsidiaries: Does psychic distance matter?
International Business Review, 18(1), 38-49.
*Dong, B., Zou, S., & Taylor, C. R. (2008). Factors that influence multinational corporations'
control of their operations in foreign markets: An empirical investigation. Journal of
International Marketing, 16(1), 98-119.
*Dow, D., & Larimo, J. (2009). Challenging the conceptualization and measurement of distance
and international experience in entry mode choice research. Journal of International Marketing,
17(2), 74-98.
Dunning, J. H. (1980). Toward an eclectic theory of international production: Some empirical
tests. Journal of International Business Studies, 11(1), 9-31.
Dunning, J. H. (1988). The eclectic paradigm of international production: A restatement and
some possible extensions. Journal of International Business Studies, 19(1), 1-31.
Dunning, J. H. (1993). Multinational enterprises and the global economy. Wokingham, UK: Addison-
Wesley.
Dunning, J. H., & Mcqueen, M. (1981). The eclectic theory of international production: A case
study of the international hotel industry. Managerial and Decision Economics, 2(4, Multinational
Business), 197-210.

CH. 1. A Systematic Assessment of Empirical Research on Foreign Market Entry Mode
31
*Dunning, J. H., Pak, Y. S., & Beldona, S. (2007). Foreign ownership strategies of UK and US
international franchisors: An exploratory application of dunning's envelope paradigm.
International Business Review, 16(5), 531-548.
*Efrat, K., & Shoham, A. (2013). The interaction between environment and strategic orientation
in born globals' choice of entry mode. International Marketing Review, 30(6), 536-558.
*Ekeledo, I., & Sivakumar, K. (2004). International market entry mode strategies of
manufacturing firms and service firms - A resource-based perspective. International Marketing
Review, 21(1), 68-101.
*Ertuna, B., & Yamak, S. (2011). Foreign equity configurations in an emerging country:
Implications for performance. European Management Journal, 29(2), 117-128.
*Filatotchev, I., Strange, R., Piesse, J., & Lien, Y. (2007). FDI by firms from newly industrialised
economies in emerging markets: Corporate governance, entry mode and location. Journal of
International Business Studies, 38(4), 556-572.
*Fisch, J. H. (2008). Internalization and internationalization under competing real options. Journal
of International Management, 14(2), 108-123.
*Gleason, K. C., & Wiggenhorn, J. (2007). Born globals, the choice of globalization strategy, and
the market's perception of performance. Journal of World Business, 42(3), 322-335.
Greene, W. H. (2003). Econometric analysis (5th ed.). Upper Saddle River, NJ.: Prentice Hall.
*Guillen, M. (2003). Experience, imitation, and the sequence of foreign entry: Wholly owned and
joint-venture manufacturing by south korean firms and business groups in china, 1987-1995.
Journal of International Business Studies, 34(2), 185-198.
Harzing, A. W. (2003). The role of culture in entry mode studies: From neglect to myopia?
Advances in International Management, 15, 75-127.
Hennart, J. (1988). A transaction costs theory of equity joint ventures. Strategic Management Journal,
9(4), 361-374.
Hennart, J. (2000). The transaction cost theory of the multinational enterprise. In C. Pitelis, & R.
Sugden (Eds.), The nature of the transnational firm (pp. 81-116). London: Routledge.
Hennart, J., & Slangen, A. H. L. (2008). Do foreign greenfields outperform foreign acquisitions
or vice-versa? an institutional perspective. Journal of Management Studies, 45(7), 1301-1328.
Hennart, J., & Slangen, A. H. L. (2015). Yes, we really do need more entry mode studies! A
commentary on Shaver. Journal of International Business Studies, 46(1), 114-122.

CH. 1. A Systematic Assessment of Empirical Research on Foreign Market Entry Mode
32
*Herrmann, P., & Datta, D. (2002). CEO successor characteristics and the choice of foreign
market entry mode: An empirical study. Journal of International Business Studies, 33(3), 551-569.
Hill, C. W. L. (1990). Cooperation, opportunism, and the invisible hand: Implications for
transaction cost theory. The Academy of Management Review, 15(3), 500-513.
Hoetker, G. (2007). The use of logit and probit models in strategic management research: Critical
issues. Strategic Management Journal, 28(4), 331-343.
Holm, S. (1979). A simple sequentially rejective multiple test procedure. Scandinavian Journal of
Statistics, 6, 1165-1188.
*Hu, M., Zhang, G., & Chen, H. (2004). Modeling foreign equity control in sino-foreign joint
ventures with neural networks. European Journal of Operational Research, 159(3), 729-740.
Hunter, J. E., & Schmidt, F. L. (1990). Methods of meta-analysis. Newbury Park, CA: Sage.
*Indro, D. C., & Richards, M. (2007). The determinants of foreign partner's equity ownership in
southeast asian joint ventures. International Business Review, 16(2), 177-206.
*Ji, J., & Dimitratos, P. (2013). Confucian dynamism and dunning's framework: Direct and
moderation associations in internationalized chinese private firms. Journal of Business Research,
66(12), 2375-2382.
*Johnson, J., & Tellis, G. J. (2008). Drivers of success for market entry into china and india.
Journal of Marketing, 72(3), 1-13.
*Jung, J., Beamish, P. W., & Goerzen, A. (2008). FDI ownership strategy: A japanese-US MNE
comparison. Management International Review, 48(5), 491-524.
*Jung, J. 2004, "Acquisitions or joint ventures: Foreign market entry strategy of US advertising
agencies", Journal of Media Economics, vol. 17, no. 1, pp. 35-50.
Karaca-Mandic, P., Norton, E. C., & Dowd, B. (2012). Interaction terms in nonlinear models.
Health Services Research, 47(1pt1), 255-274.
*Kawai, N., & Jonas, M. (2009). Market entry strategies in post-financial crisis southeast asia: The
case of japanese manufacturing firms<br />. Asian Business & Management, 8(3), 247-275.
Ketchen, D. J.,Jr., Combs, J. G., Russell, C. J., Shook, C., Dean, M. A., Runge, J., . . . Lamoureux,
S. (1997). Organizational configurations and performance: A meta-analysis. The Academy of
Management Journal, 40(1), 223-240.
CH. 1. A Systematic Assessment of Empirical Research on Foreign Market Entry Mode
33
*Khemakhem, R. (2010). Explaining the entry mode choice among tunisian exporting firms:
Development and test of an integrated model. European Journal of Marketing, 44(1/2), 223-
244.
*Kim, Y., & Gray, S. J. (2008). The impact of entry mode choice on foreign affiliate performance:
The case of foreign MNEs in south korea. Management International Review, 48(2), 165-188.
*Kim, Y., & Gray, S. J. (2009). An assessment of alternative empirical measures of cultural
distance: Evidence from the republic of korea. Asia Pacific Journal of Management, 26(1), 55-74.
Klein, S., Frazier, G. L., & Roth, V. J. (1990). A transaction cost analysis model of channel
integration in international markets. Journal of Marketing Research, 27(2), 196-208.
*Klijn, E., Reuer, J. J., Van den Bosch, F. A. J., & Volberda, H. W. (2013). Performance
implications of IJV boards: A contingency perspective. Journal of Management Studies, 50(7),
1245-1266.
Kogut, B., & Singh, H. (1988). The effect of national culture on the choice of entry mode. Journal
of International Business Studies, 19(3)
*Konopaske, R., Werner, S., & Neupert, K. (2002). Entry mode strategy and performance: The
role of FDI staffing. Journal of Business Research, 55(9), 759-770.
*Krishnan, R., Martin, X., & Noorderhaven, N. G. (2006). When does trust matter to alliance
performance? The Academy of Management Journal, 49(5), 894-917.
*Kundu, S. K., Kumar, V., & Peters, S. D. (2008). Impact of ownership and location factors on
service multinationals' internalisation. The Service Industries Journal, 28(5), 567-580.
*Kuo, A., Kao, M., Chang, Y., & Chiu, C. (2012). The influence of international experience on
entry mode choice: Difference between family and non-family firms. European Management
Journal, 30(3), 248-263.
*Larimo, J. (2003). Form of investment by nordic firms in world markets. Journal of Business
Research, 56(10), 791-803.
Li, J., & Rugman, A. M. (2007). Real options and the theory of foreign direct investment.
International Business Review, 16, 687-712.
*Li, N. (2008). Religion, opportunism, and international market entry via non-equity alliances or
joint ventures. Journal of Business Ethics, 80(4), 771-789.
*Li, P., & Meyer, K. E. (2009). Contextualizing experience effects in international business: A
study of ownership strategies. Journal of World Business, 44(4), 370-382.

CH. 1. A Systematic Assessment of Empirical Research on Foreign Market Entry Mode
34
*Liang, X., Musteen, M., & Datta, D. K. (2009). Strategic orientation and the choice of foreign
market entry mode an empirical examination. Management International Review, 49(3), 269-290.
Light, R. J., & Pillemer, D. B. (1984). Summing up: The science of reviewing research. Cambridge, MA:
Harvard University Press.
*Lin, C., & Png, I. (2003). Monitoring costs and the mode of international investment. Journal of
Economic Geography, 3(3), 261-274.
*Lin, X., & Wang, C. L. (2008). Enforcement and performance: The role of ownership, legalism
and trust in international joint ventures. Journal of World Business, 43(3), 340-351.
*Lopez-Duarte, C., & Vidal-Suarez, M. M. (2013). Cultural distance and the choice between
wholly owned subsidiaries and joint ventures. Journal of Business Research, 66(11), 2252-2261.
*López-Duarte, C., & Vidal-Suárez, M. M. (2010). External uncertainty and entry mode choice:
Cultural distance, political risk and language diversity. International Business Review, 19(6), 575-
588.
*Lu, J. W. (2002). Intra- and inter-organizational imitative behavior: Institutional influences on
japanese firms' entry mode choice. Journal of International Business Studies, 33(1), 19-37.
*Lu, J., & Hébert, L. (2005). Equity control and the survival of international joint ventures: A
contingency approach. Journal of Business Research, 58(6), 736-745.
*Luo, Y. (2001). Determinants of entry in an emerging economy: A multilevel approach. Journal of
Management Studies, 38(3), 443-472.
Madhok, A. (1997). Cost, value and foreign market entry mode: The transaction and the firm.
Strategic Management Journal, 18(1), 39-61.
*Maekelburger, B., Schwens, C., & Kabst, R. (2012). Asset specificity and foreign market entry
mode choice of small and medium-sized enterprises: The moderating influence of
knowledge safeguards and institutional safeguards. Journal of International Business Studies,
43(5), 458-476.
*Majocchi, A., Mayrhofer, U., & Camps, J. (2013). Joint ventures or non-equity alliances?
evidence from italian firms. Management Decision, 51(1-2), 380-395.
*Makino, S., & Neupert, K. E. (2000). National culture, transaction costs, and the choice between
joint venture and wholly owned subsidiary. Journal of International Business Studies, 31(4), 705-
713.

CH. 1. A Systematic Assessment of Empirical Research on Foreign Market Entry Mode
35
Martin, X. (2013). Solving theoretical and empirical conundrums in international strategy
research: Linking foreign entry mode choices and performance. Journal of International Business
Studies, 44(1), 28-41.
*Meschi, P. (2005). Environmental uncertainty and survival of international joint ventures: The
case of political and economic risk in emerging countries. European Management Review, 2(2),
143-152.
*Meschi, P., & Ricclo, E. L. (2008). Country risk, national cultural differences between partners
and survival of international joint ventures in brazil. International Business Review, 17(3), 250-
266.
*Meyer, K. E. (2001). Institutions, transaction costs, and entry mode choice in eastern europe.
Journal of International Business Studies, 32(2), 357-367.
*Meyer, K., & Nguyen, H. (2005). Foreign investment strategies and sub-national institutions in
emerging markets: Evidence from vietnam. Journal of Management Studies, 42(1), 63-93.
*Morschett, D., Schramm-Klein, H., & Swoboda, B. (2008). Entry modes for manufacturers'
international after-sales service: Analysis of transaction-specific, firm-specific and country-
specific determinants. Management International Review, 48(5), 525-549.
Morschett, D., Schramm-Klein, H., & Swoboda, B. (2010). Decades of research on market entry
modes: What do we really know about external antecedents of entry mode choice? Journal of
International Management, 16(1), 60-77.
*Musteen, M., Datta, D. K., & Herrmann, P. (2009). Ownership structure and CEO
compensation: Implications for the choice of foreign market entry modes. Journal of
International Business Studies, 40(2), 321-338.
Newbert, S. L. (2007). Empirical research on the resource-based view of the firm: An assessment
and suggestions for future research. Strategic Management Journal, 28(2), 121-146.
*Nielsen, B. B., & Nielsen, S. (2011). The role of top management team international orientation
in international strategic decision-making: The choice of foreign entry mode. Journal of World
Business, 46(2), 185-193.
*Ogasavara, M., & Hoshino, Y. (2008). The effects of entry strategy and inter-firm trust on the
survival of japanese manufacturing subsidiaries in brazil. Asian Business & Management, 7(3),
353-380.
*Ogasavara, M. H., & Hoshino, Y. (2007). The impact of ownership, internalization, and entry
mode on japanese subsidiaries' performance in brazil. Japan and the World Economy, 19(1), 1-
25.

CH. 1. A Systematic Assessment of Empirical Research on Foreign Market Entry Mode
36
Oxley, J. E. (1997). Appropriability hazards and governance in strategic alliances: A transaction
cost approach. Journal of Law, Economics, & Organization, 13(2), 387-409.
Padmanabhan, P., & Cho, K. R. (1996). Ownership strategy for a foreign affiliate: An empirical
investigation of japanese firms. Management International Review, 36(1), 45-65.
*Pangarkar, N., & Klein, S. (2004). The impact of control on international joint venture
performance: A contingency approach. Journal of International Marketing, 12(3), 86-107.
Pearce, R., & Papanastassiou, M. (1996). R&D networks and innovation: Decentralized product
development in multinational enterprises. R&D, 26(4), 315-333.
*Pehrsson, A. (2008). Strategy antecedents of modes of entry into foreign markets. Journal of
Business Research, 61(2), 132-140.
*Petrou, A. P. (2009). Foreign market entry strategies in retail banking: Choosing an entry mode
in a landscape of constraints. Long Range Planning, 42(5-6), 614-632.
*Pinho, J. C. (2007). The impact of ownership - location-specific advantages and managerial
characteristics on SME foreign entry mode choices. International Marketing Review, 24(6), 715-
734.
*Pla-Barber, J., Sanchez-Peinado, E., & Madhok, A. (2010). Investment and control decisions in
foreign markets: Evidence from service industries. British Journal of Management, 21(3), 736-
753.
*Quer, D., Claver, E., & Andreu, R. (2007). Foreign market entry mode in the hotel industry: The
impact of country- and firm-specific factors. International Business Review, 16(3), 362-376.
*Raff, H., Ryan, M., & Staehler, F. (2012). Firm productivity and the foreign-market entry
decision. Journal of Economics & Management Strategy, 21(3), 849-871.
*Rasheed, H. (2005). Foreign entry mode and performance: The moderating effects of
environment. Journal of Small Business Management, 43(1), 41-54.
*Reddy, S., Osborn, R., & Hennart, J. F. (2002). The prevalence of equity and non-equity cross-
border linkages: Japanese investments and alliances in the united states. Organization Studies,
23(5), 759-780.
Reuer, J. J., Shenkar, O., & Ragozzino, R. (2004). Mitigating risk in international mergers and
acquisitions: The role of contingent payouts. Journal of International Business Studies, 35(1), 19-
32.

CH. 1. A Systematic Assessment of Empirical Research on Foreign Market Entry Mode
37
*Richards, M., & Yang, Y. (2007). Determinants of foreign ownership in international R&D
joint ventures: Transaction costs and national culture. Journal of International Management,
13(2), 110-130.
*Ripolles, M., Blesa, A., & Monferrer, D. (2012). Factors enhancing the choice of higher resource
commitment entry modes in international new ventures. International Business Review, 21(4),
648-666.
*Rodriguez, A. (2002). Determining factors in entry choice for international expansion. the case
of the spanish hotel industry. Tourism Management, 23(6), 597-607.
Root, F. J. (1987). Foreign market entry strategies. New York: AMACOM.
*Ruiz-Moreno, F., Mas-Ruiz, F. J., & Nicolau-Gonzalbez, J. L. (2007). Two-stage choice process
of FDI: Ownership structure and diversification mode. Journal of Business Research, 60(7), 795-
805.
*Sanchez-Peinado, E., & Pla-Barber, J. (2006). A multidimensional concept of uncertainty and its
influence on the entry mode choice: An empirical analysis in the service sector. International
Business Review, 15(3), 215-232.
*Sanchez-Peinado, E., Pla-Barber, J., & Hébert, L. (2007). Strategic variables that influence entry
mode choice in service firms. Journal of International Marketing, 15(1), 67-91.
Sarkar, M., & Cavusgil, S. T. (1996). Trends in international business thought and literature: A
review of international market entry mode research: Integration and synthesis. The
International Executive, 38(6), 825-847.
*Schwens, C., Eiche, J., & Kabst, R. (2011). The moderating impact of informal institutional
distance and formal institutional risk on SME entry mode choice. Journal of Management
Studies, 48(2), 330-351.
Scott, W. R. (1995). Institutions and organizations. Thousand Oaks, CA: Sage.
Seggie, S. H. (2012). Transaction cost economics in international marketing. Journal of International
Marketing, 20(2), 49-71.
Sharma, V. M., & Erramilli, M. K. (2004). Resource-based explanation of entry mode choice.
Journal of Marketing Theory and Practice, 12(1), 1-18.
Shaver, J. M. (1998). Accounting for endogeneity when assessing strategy performance: Does
entry mode choice affect FDI survival? Management Science, 44(4), pp. 571-585.

CH. 1. A Systematic Assessment of Empirical Research on Foreign Market Entry Mode
38
Shaver, J. M. (2013). Do we really need more entry mode studies? Journal of International Business
Studies, 44, 23-27.
Shelanski, H. A., & Klein, P. G. (1995). Empirical research on transaction cost economics: A
review and assessment. Journal of Law, Economics, & Organization, 11(2), 335-361.
*Shieh, B., & Wu, T. (2012). Equity-based entry modes of the greater chinese economic area's
foreign direct investments in vietnam. International Business Review, 21(3), 508-517.
*Slangen, A. H. L., & van Tulder, R. J. M. (2009). Cultural distance, political risk, or governance
quality? towards a more accurate conceptualization and measurement of external uncertainty
in foreign entry mode research. International Business Review, 18(3), 276-291.
Stanley, T. D., & Doucouliagos, H. (2012). Meta-regression analysis in economics and business (1st ed.).
London and New York: Routledge.
Stroup, D. F., Berlin, J. A., Morton, S. C., Olkin, I., Williamson, G. D., Rennie, D., Moher, D.,
Becker, B.J., & B.J., Shipe, T.A., Thacker, S.B. (2000). Meta-analysis of observational studies
in epidemiology: A proposal for reporting. Journal of American Medical Association, 283, 2008-
12.
*Talay, M. B., & Cavusgil, S. T. (2009). Choice of ownership mode in joint ventures: An event
history analysis from the automotive industry. Industrial Marketing Management, 38(1), 71-82.
Tan, B., Erramilli, K., & Liang, T. W. (2001). The influence of dissemination risks, strategic
control and global management skills on firms' modal decision in host countries. International
Business Review, 10(3), 323-340.
*Tatoglu, E., Glaister, K. W., & Erdal, F. (2003). Determinants of foreign ownership in turkish
manufacturing. Eastern European Economics, 41(2), 5-41.
*Taylor, C., Zou, S., & Osland, G. (2000). Foreign market entry strategies of japanese MNCs.
International Marketing Review, 17(2-3), 146-163.
Teece, D. J. (1986). Transactions cost economics and the multinational enterprise: An
assessment. Journal of Economic Behavior and Organization, 7(1), 21-4.
Tihanyi, L., Griffith, D. A., & Russell, C. J. (2005). The effect of cultural distance on entry mode
choice, international diversification, and MNE performance: A meta-analysis. Journal of
International Business Studies, 36(3), 270-283.
*Tomassen, S., & Benito, G. R. G. (2009). The costs of governance in international companies.
International Business Review, 18(3), 292-304.

CH. 1. A Systematic Assessment of Empirical Research on Foreign Market Entry Mode
39
*Tsang, E. (2005). Influences on foreign ownership level and entry mode choice in vietnam.
International Business Review, 14(4), 441-463.
*Tseng, C., & Lee, R. P. (2010). Host environmental uncertainty and equity-based entry mode
dilemma: The role of market linking capability. International Business Review, 19(4), 407-418.
*Wang, H., & Schaan, J. (2008). How much distance do we need? revisiting the "national cultural
distance paradox". Management International Review, 48(3), 263-277.
*Wei, Y., Liu, B., & Liu, X. (2005). Entry modes of foreign direct investment in china: A
multinomial logit approach. Journal of Business Research, 58(11), 1495-1505.
Wiersema, M. F., & Bowen, H. P. (2009). The use of limited dependent variable techniques in
strategy research: Issues and methods. Strategic Management Journal, 30(6), 679-692.
*Wilkinson, T. J., Peng, G. Z., Brouthers, L. E., & Beamish, P. W. (2008). The diminishing effect
of cultural distance on subsidiary control. Journal of International Management, 14(2), 93-107.
Williamson, O. E. (1985). The economic institutions of capitalism. New York: Free Press.
Williamson, O. E. (1991). Comparative economic organization: The analysis of discrete structural
alternatives. Administrative Science Quarterly, 33(2), 269-296.
*Yao, Z., Yang, Z., Fisher, G. J., Ma, C., & Fang, E. (2013). Knowledge complementarity,
knowledge absorption effectiveness, and new product performance: The exploration of
international joint ventures in china. International Business Review, 22(1), 216-227.
*Yiu, D., & Makino, S. (2002). The choice between joint venture and wholly owned subsidiary:
An institutional perspective. Organization Science, 13(6), 667-683.
*Zhang, Y., Zhang, Z., & Liu, Z. (2007). Choice of entry modes in sequential FDI in an emerging
economy. Management Decision, 45(4), 749-772.
Zhao, H., Luo, Y., & Taewon Suh. (2004). Transaction cost determinants and ownership-based
entry mode choice: A meta-analytical review. Journal of International Business Studies, 35(6), 524-
544.

CH. 1. A Systematic Assessment of Empirical Research on Foreign Market Entry Mode
40
Appendix
Search code for Web of Science
TOPIC: ("entry mode" OR "joint venture" OR "wholly owned subsidiary" OR "licensing" OR "franchising")
AND TOPIC: (international OR multinational OR foreign) AND TOPIC: (data OR empirical OR test
OR statistical OR finding OR result OR evidence)
Refined by: WEB OF SCIENCE CATEGORIES=( BUSINESS OR ECONOMICS OR
OPERATIONS RESEARCH MANAGEMENT SCIENCE OR BUSINESS FINANCE ) AND
DOCUMENT TYPES=( ARTICLE ) AND PUBLICATION YEARS=( 2013 OR 2005 OR
2002 OR 2014 OR 2012 OR 2000 OR 2009 OR 2004 OR 2007 OR 2006 OR 2011 OR 2001 OR
2008 OR 2003 OR 2010 )
Timespan=All years. Indexes=SCI-EXPANDED, SSCI, A&HCI, CPCI-S, CPCI-SSH.
CH. 2. Interpreting Results from the Multinomial Logit Model
41
CHAPTER 2
Interpreting Results from the Multinomial Logit Model Demonstrated by Foreign Market Entry1
Jesper N. Wulff
Aarhus University
Accepted for publication in forthcoming issues of Organizational Research Methods
Abstract
This paper provides guidelines and illustrates practical steps necessary for an analysis of results
from the multinomial logit model (MLM). The MLM is a popular model in the strategy literature
because it allows researchers to examine strategic choices with multiple outcomes. However,
there seem to be systematic issues with regard to how researchers interpret their results when
using the MLM. In this study, I present a set of guidelines critical to analyzing and interpreting
results from the MLM. The procedure involves intuitive graphical representations of predicted
probabilities and marginal effects suitable for both interpretation and communication of results.
The practical steps are illustrated through an application of the MLM to the choice of foreign
market entry mode.
Keywords: Multinomial logit, empirical methods, marginal effects, predicted probabilities, graphical
interpretation, entry mode
1 This paper was accepted for and presented at the 2014 Academy of Management Meeting, Philadelphia, in a paper session entitled Approaches to Modelling: Bayesian, Computational, and Multinomial Logit. The author would like to thank the participants and the chair for valuable comments and insights that helped improve this paper. The paper has been accepted for publication in Organizational Research Methods and has been published online ahead of print. I wish to thank the reviewers and Associate Editor Brian Boyd for helpful and constructive comments. Finally, I would like to thank Morten Berg and Marianne Simonsen for valuable comments. I gratefully acknowledge the financial support funded by Ferdinand Sallings Mindefond, Augustinus Fonden, Oticon Fonden, and Solar Fonden.

CH. 2. Interpreting Results from the Multinomial Logit Model
42
Researchers in business strategy often wish to draw inferences about factors underlying the
strategic choices that firms make. Because such choices are rarely binary, they regularly apply
discrete choice models allowing for multiple outcomes such as multinomial logit/probit.
However, when interpreting such models, scholars are faced with a set of different challenges
than in the binary dependent variable case. One very critical difference is that the sign of the
estimated model coefficients do not determine the direction of the relationship between an
independent variable and the probability of choosing a specific alternative (Bowen & Wiersema,
2004). Instead, to be able to draw valid conclusions about relationships scholars must rely on
other interpretational devices such as predicted probabilities and marginal effects based on
equivocal approaches.
Despite the importance of this difference in interpretation, assessments of the use of limited
dependent variable models in strategic research have found that many studies have severe
limitations in the implementation and interpretation of results (Wiersema & Bowen, 2009).
Hoetker (2007) identifies coefficient interpretation as one of four critical issues, and Bowen and
Wiersema (2004) find that researchers routinely assume that the sign and significance of MLM
model coefficients can be used to evaluate their hypotheses. This tendency has motivated authors
such as Wiersema and Bowen (2009), Hoetker (2007) and Zelner (2009) to present important
guidelines for the implementation and interpretation of limited dependent variable models.
This paper contributes to the methodological literature that draws attention to systematic
problems with the empirical strategies currently used in strategy research. More specifically, to
studies that have illustrated guidelines essential to the use of limited dependent variables models.
In this study, I focus on the most commonly applied model when researchers examine strategic
choices that have multiple unordered choices, the multinomial logit model (MLM). I describe
how and why this model complicates the interpretation of results. Because many researchers may
not be familiar with the special care that must be taken when interpreting results from an MLM
in comparison to regular binary models, I believe that it is valuable to further introduce them to
this important topic. As a part of this introduction, I present a set of guidelines to follow while
mentioning some of the consequences of choosing not to do so. Therefore, the contribution of
this study lies in highlighting central challenges and illustrating the procedure essential for using
and interpreting results from the MLM illustrated by an example from the entry mode literature.
To achieve this goal, I review the use of discrete choice models with multiple outcome
alternatives within the field of foreign market entry. Because managers choose from a variety of
different options when they enter a foreign market, entry mode researchers commonly use the
MLM (Canabal & White, 2008). Next, I consider the complexity of analyzing relationships in
MLMs, and present and illustrate the necessary techniques for analyzing results from an MLM. In
particular, I recommend specific graphical representations that are powerful not only for
interpretation but also for presentation of results. The Stata code for generating the computed
quantities and graphical representations are available in Appendix sections A1 and A2.
1. Multiple Outcome Models and Entry Mode
In the literature, the conceptualization of entry mode choice (EMC) has been defined in a variety
of ways. Canabal and White’s (2008) review shows that researchers most often view mode choice
CH. 2. Interpreting Results from the Multinomial Logit Model
43
as a choice between wholly owned subsidiary (WOS) and joint venture (JV) (e.g. Chang, Chung,
& Moon, 2013). Other popular ways to conceptualize EMC include acquisition vs. greenfield (e.g.
Brouthers & Dikova, 2010), equity vs. non-equity (e.g. Schwens, Eiche, & Kabst, 2011), licensing
vs. exporting (e.g. Martin & Salomon, 2003), or non-equity partnership vs. equity JV (e.g.
Sampson, 2004). Methodologically, such studies all specify entry mode choice as a binary variable.
Most commonly, this leads to an analysis utilizing a limited dependent variable model, often
logistic regression (Canabal & White, 2008).
When researchers reduce the choice to a binary variable and perform a logistic regression it
often involves either pooling choices together or deleting observations. Martin (2013) argues that
even researchers that acknowledge a distinction between multiple modes of entry (e.g.
acquisition, greenfield and JV) reduce the dependent variable to a binary choice. However, as the
author suggests researchers can avoid having theory and interpretation of their results depend on
the exclusion of some modes of entry by conducting a multinomial logistic regression analysis. In
the entry mode literature, the method is used in studies focusing on a dependent variable
involving more than two types of entry modes (Agarwal & Ramaswami, 1992; Anand & Delios,
1997; Kim & Hwang, 1992).
Considering the wide range of entry modes a firm can choose from, it is surprising that
statistical methods that allow a dependent variable to have more than two outcomes are not
dominating the entry mode literature. One reason for this might be that modeling EMC as
multiple discrete alternatives confronts the researcher with a much more complex set of
challenges than a binary approach. First, the model includes several parameters depending on the
number of choice possibilities, which may make both understanding and communicating results
seem overwhelming (Long & Freese, 2006). Second, the interpretation of coefficients becomes
more complex in multiple outcome models than in binary ones (Long, 1997). For instance, the
sign and size of the coefficients indicate neither the direction nor the size of the marginal effect
on the probability that an alternative is chosen (Cameron & Trivedi, 2005; Greene, 2003).
Still, limited dependent variable models with multiple outcomes are still the second most
popular choice for entry mode researchers (Canabal & White, 2008). Generally, studies using
such models can be classified into two different categories. One line of work relies mainly on
coefficient interpretation when assessing the direction and significance of a predictor. However,
these studies often fail to consider that the coefficient does not indicate the direction of the
relationship of interest. Examples include Gatignon & Anderson (1988), who find that their
MLM has some value in explaining higher control modes while being less successful explaining
lower control choices. Distinguishing between transaction costs and costs arising from cultural
factors, Kogut & Singh (1988) also apply an MLM and interpret their results as both supporting
and contradicting transaction cost theory. In later studies, authors have expanded the traditional
transaction cost-framework when using an MLM for analysis. For instance, Klein, Frazier, and
Roth (1990) compare market, intermediate and hierarchical entry options; Kim & Hwang (1992)
find support for their expanded transaction cost-model; and Meyer (2001) establishes a link
between institutional theory and transaction cost theory. In more recent studies, authors have
continued the praxis on interpreting model coefficients but on new theoretical frameworks. For
example, Brouthers, Brouthers, and Werner (2008a) examine predictions from real options theory

CH. 2. Interpreting Results from the Multinomial Logit Model
44
when analyzing the choice between a variety of entry modes focusing mainly on JVs. Based on
institutional theory, Uhlenbruck (2004) studies model coefficients to determine the relationship
between host country corruption and different types of non-equity and equity modes.
Basing the analysis on coefficient interpretation has some unfortunate downsides. First, it
greatly limits interpretation and complicates communication of results. For instance, researchers
limit themselves to making statements about how a predictor is related to the probability of one
choice outcome relative to the base category. This neglects that outcomes are inexorably linked
and makes it very difficult to see the implications for each category. Second, it increases the risk
of misinterpretation. The reason is that the sign on a single coefficient only tells us about the
contrast among two categories. If researchers use a model coefficient as support for a hypothesis
about the effect that a single predictor has on the probability of a single outcome, it risks leading
to invalid inference and creates uncertainty of what to make of the results of their empirical work.
In another line of studies, on the other hand, scholars recognize the limitations of coefficient
interpretations and supply their analysis with important additional computations. Most
commonly, they draw on marginal effects or predicted probabilities as methods of interpretation.
However, they rarely take into account that there are many different marginal effects and that
these may change sign depending on the observations in the sample. For instance, Chen (2005)
performs an ordered logistic regression analysis adding computations of predicted probabilities in
the interpretation of the results. By computing and reporting marginal effects, Meyer, Estrin,
Bhaumik, and Peng (2009) investigate the influence of market-supporting institutions on the
choice between greenfield, acquisition, and JVs finding evidence suggesting that JVs are
important in weaker institutional contexts. A prime example is found in a paper by Li and Li
(2010), who report single measures for predicted probabilities and marginal effects while also
including odds ratios interpretations to analyze the relationship between options-based variables
and different types of equity entries. Although still including interpretations of coefficients, Wei,
Liu, and Liu (2005) find a positive marginal effect of host country intensity on the probability of
choosing an equity joint venture.
Even though reporting summary measures of marginal effects can be a good way to sum up
results, it may not be sufficient when using an MLM. The econometric and organizational
research methodology literature warns that the marginal effects are not constant across the range
of the specific predictor. In discrete choice models with multiple outcomes, this has the
consequence that the marginal effects may be positive for some values of the predictor and
negative for others (Greene, 2003). When authors limit the interpretation to summary measures,
they may miss important variations across the range of the predictor. For instance, the marginal
effects may be significant for some values while insignificant for others or even change from
negative to positive. This makes an analysis relying solely on a single summary measure of the
marginal effects incomplete leaving out important information about the nature of the marginal
effects.
In sum, as in the general strategic literature (Bowen & Wiersema, 2004), the EMC-literature
shows systematic issues with the interpretation of the results from MLMs. Issues of this kind are
concerning as they may lead to invalid inferences creating uncertainty about the conclusions to be
drawn from past research findings (Wiersema & Bowen, 2009). Moreover, previous research may

CH. 2. Interpreting Results from the Multinomial Logit Model
45
be missing important findings about key theoretical relationships that are very difficult to
discover and present without the use of a graphical approach.
2. Interpreting Results from the Multinomial Logit Model
In particular, two issues complicate the interpretation of the coefficients in an MLM2. First, the
outcomes represent contrasts among the categories, making it difficult to see the implications for
each category from the coefficients. Further complicating the issue is the fact that unlike binary
models a positive sign on a coefficient in an MLM does not necessarily mean that an increase in
the independent variable corresponds to an increase in the probability of choosing a particular
mode of entry (Long, 1997; Long & Freese, 2006). Second, the relationship between the
explanatory variables and the probability of a given choice outcome is non-linear and may even
change sign across the distribution of a single predictor.
Consequently, it is necessary to use other means of interpretation than we are used to in linear
models. In the following, I describe two core devices3 that researchers may use when drawing
conclusions about the direction, magnitude and significance of model variables: Predicted
probabilities and marginal effects.
2.1. Predicted Probabilities
One way of interpreting the relationship between a predictor and the dependent variable in an
MLM is by computing and plotting predicted probabilities.
The dependent variable in this study can take the values 0 (Exports), 1 (JV) and 2 (WOS). In
the MLM the predicted probabilities can be calculated as
pij = Pr(yi = j|𝐱i) =
exp(𝐱i′𝛃j)
∑ exp(𝐱i′𝛃j)2j=0
( 1 )
which is the probability that the ith firm will choose alternative j (j = 0, 1, 2), xi are case-specific
regressors thought to explain entry mode choice, 𝛃j is the coefficient vector and contains the
intercept β0jand the slope coefficients βkj. Thus, there is one set of coefficients for each choice
alternative. In this example, the model in Equation 1 has 3 (J) equations of which only 2 (J – 1)
can be estimated. Therefore, to guarantee identification, 𝛃j is set to zero for one of the categories.
This category is the base category, and coefficients are interpreted with respect to that category.
Setting 𝛃0= 0 and computing the predicted probabilities yields
2 I am grateful to an anonymous reviewer for suggesting this intuitive summary of the issues complicating coefficient
interpretation in an MLM. 3 Another way of analyzing results from an MLM is the odds ratio, i.e. the ratio of the choice probabilities for two
distinct alternatives. Odds ratios have nice properties, for instance they neither depend on the level of the predictor
nor do they depend on any other predictor in the model. However, their interpretation is less intuitive and many
people have difficulties grasping the concept of odds. A discussion of the use of odds ratios can be found in e.g.
Long and Freese (2006).

CH. 2. Interpreting Results from the Multinomial Logit Model
46
pij = Pr(yi = j|𝐱i) =
exp(𝐱i′𝛃j)
exp(𝐱i′𝟎) + ∑ exp(𝐱i′𝛃j)
2j=1
( 2 )
=
exp(𝐱i′𝛃j)
1 + ∑ exp(𝐱i′𝛃j)2j=1
( 3 )
And for the base-line category, we have
pij = Pr(y = 0|𝐱i) =
exp(𝐱i′𝟎)
exp(𝐱i′𝟎) + ∑ exp(𝐱i′𝛃j)
2j=1
( 4 )
=
1
1 + ∑ exp(𝐱i′𝛃j)2j=1
( 5 )
With equations 3 and 5 in our hands, we can the compute predicted probabilities in order to
assess the relationship between a predictor and each outcome. Plotting the predicted probabilities
provides a quick and informative way of presenting the relationship between a selected predictor
and the predicted probabilities of the different alternatives. Figure 1 provides an example of this
in the empirical example below. Because the predicted probabilities are point estimates, it is
recommended to compute a confidence interval to take sampling variability into account. There
are several procedures that can achieve this. As I show in Appendix sections A1 and A2, Stata
allows for straightforward computation of standard errors using a variety of methods, e.g. the
delta method.
2.2. Marginal Effects
While predicted probabilities provide us with very informative graphical information about the
direction and magnitude of the relationship, it may be difficult to precisely determine whether a
relationship can really be established, especially at places where the curve is flat. To further make
sense of our results, we may rely on another powerful interpretative device: marginal effects. The
marginal effects are defined as the slope of the prediction function at a given value of the
explanatory variable and thus inform us about the change in predicted probabilities due to a
change in a particular predictor. This has made authors argue that if one wishes to draw valid
conclusions about the direction and magnitude of the relation between an independent and
dependent variables in an MLM, one must calculate marginal effects (Bowen & Wiersema, 2004).
Even though marginal effects for a multinomial model may be complicated to derive
(Wooldridge, 2010) they have a quite distinctive and simple form (Greene, 2003). For a
continuous4 independent variable the marginal effects are
4 Changes for discrete independent variables are conventionally calculated by letting the predictor vary between two
values, while holding all of the remaining predictors constant at their mean values. For a dummy variable xk, the

CH. 2. Interpreting Results from the Multinomial Logit Model
47
MEij =
∂pij
∂xik=∂Pr(y = j|𝐱i)
∂xik= pij(βkj − β̅i)
( 6 )
where β̅i = ∑ βkmPr(y = m|𝐱𝐢)2m=1 is a probability weighted average of βkm. Equation 6 shows that
the marginal effects are non-linear and vary across values of all the variables in the model. It is
highly noteworthy that the value of the marginal effect depends on several factors, counting the
probabilities of other alternatives and the effect of xik on the same probabilities. This means that
not only do the values of the marginal effect change as the model variables 𝐱i change, the
marginal effect may be positive (βkj > β̅i) for some values of xikand negative (βkj < β̅i) for others.
In other words, the sign of the marginal effect may change across the range of the predictor.
The result in equation 6 has some important implications. First, testing whether a specific
coefficient is equal to zero and/or interpreting its sign makes little sense if one wishes to draw
valid conclusions about the direction, significance and/or magnitude of the relationship between
the dependent variable and a given predictor (Bowen & Wiersema, 2004; Cameron & Trivedi,
2005). Indeed, there is no guarantee that the marginal effects share the sign of the coefficients in
the model. Instead, the coefficient of a predictor with regard to a specific category tells us about
how that predictor relates to the probability of observing a particular category relative to the base
category. This means that if we insist on using a binary logit interpretation of the coefficients, we
must restrict our comparisons to the base category. As I have argued, this is quite different from
making statements about the relationship between a predictor and the probability of a specific
outcome. More details about this are available in Appendix section A.3.
Second, because the values of the marginal effects may change sign across the predictor range,
it would be very valuable to have a way of observing how the values of the marginal effects
change as xik changes. Here, a graphical representation proves to be a powerful way to interpret
the changes in sign and significance of the marginal effects (Hoetker, 2007). First, the marginal
effects are assessed by computing the values of the marginal effects for a given predictor from its
smallest to its largest sample value while holding other model variables at their mean5. Then, the
computed marginal effects and their confidence intervals are plotted against the corresponding
predictor to show how the marginal effects change from low to high predictor values. An
example is provided in Figure 2 in the empirical example given later.
2.3. Summary Measures
After the graphical analysis, results can be summarized by computing the marginal effects while
setting the values of the model variables. Great care must be taken to not neglect important
information provided in the graphical representation. There are two main ways in which results
discrete change in predicted probabilities is given by Δp
ij
Δ𝐱ik= Pr(y = m|�̅�, xik = 1) − Pr(y = m|�̅�, xik = 0). Long (2006)
suggests computing an average absolute discrete change measure that summarizes the J discrete-change coefficients
for a predictor xk: ∆̅= 1
J∑
ΔPr(y=j|�̅�)
Δxik
Jj=1
5 Alternatively, it may sometimes make more sense to hold other model variables at other values. For instance,
dummy variables may be held at the mode while other variables may be held at their median value.

CH. 2. Interpreting Results from the Multinomial Logit Model
48
are usually summarized. The first is to set all of the predictors to their mean values resulting in
marginal effects at the mean (MEM):
MEM = p̅j(βkj − β̅i) ( 7 )
where p̅j is now calculated by holding 𝐱i at their mean values. Obviously, centering or
standardizing all independent variables considerably simplifies the computation. One downside
of MEMs is that it is unlikely that there is a unit in the sample that is average on all model
variables. To avoid this, another approach called average marginal effects (AME) relies on actual
values of the independent variables. First, the marginal effects for each unit are produced and
then averaged:
AME =
1
n∑pij(βkj − β̅i)
n
i=1
( 8 )
Because the MEM and AME may produce different estimates (Bartus, 2005) and because there is
no agreement as to which of the two is the most representative (Greene, 2003), both can be
included to provide the most informative summary of the marginal effects. They should be
computed at relevant values (e.g. low, mean and high) of the predictor, especially if the graphical
analysis reveals that the marginal effects change sign across the range of the predictor. An
example is provided in Table IV.
An intuitive way to interpret marginal effects is through elasticities. The elasticity with respect
to pij for the predictor xik is given by
kxik = xik(βkj − β̅i) ( 9 )
While marginal effects may be interpreted as an instantaneous change in the predicted probability
due to a one point change in the value of xik, elasticities have another helpful interpretation,
namely the percentage change in the predicted probability due to a one percentage change in the
independent variable. If the predictor is already on a log-scale, as in the empirical example below,
most statistical software packages can easily compute so-called semielasticities to avoid
unintuitive interpretations. This gives us the percentage change in the predicted probability due
to a one unit change in xik.
It is worth repeating that the real analysis lies in the graphical representation described above
and illustrated below, which should therefore always be reported. If space limitations prevent
including plots, the author should as a minimum comment on changes in the sign and
significance of the marginal effect across the range of the predictor.
In order to determine the statistical significance of the marginal effects, one cannot rely on the
model coefficient of the relevant predictor. Because of the complex nature of the marginal
effects, it is necessary to compute the values of the marginal effect from the smallest to the
largest sample value of the predictor, its standard error and z-statistic. As with the predicted
probabilities the standard errors can be obtained using the delta method. The standard errors are

CH. 2. Interpreting Results from the Multinomial Logit Model
49
used to compute the confidence intervals which are included together with the values of the
marginal effects in the graphical representation.
Summarized, the sign of an estimated coefficient in an MLM cannot be used to determine the
relation between an independent variable and EMC. Instead, the relationship should be analyzed
by computing marginal effects, elasticities and their standard errors. In the following section, I
adapt and build on the approach suggested by Wiersema and Bowen (2009). First, I plot
predicted probabilities for the entry mode options against each predictor. Then, I plot the
computed marginal effect surrounded by confidence intervals against the values of the predictor.
Finally, I report the MEMs, AMEs, and elasticities to supply and summarize the results provided
in the graphical representation.
3. Data and Variables
3.1. Data
The empirical example in this study is based on a sample of Danish, Swedish and Norwegian
firms focusing on the entry mode choice (exporting/JV/WOS) made by these companies. A
questionnaire was used to collect the data except for the data on the cultural distance measure.
The firms were asked for their most recent foreign entry. Consequently, about 90% of all entries
in the sample were within the time span from 2007 - 2012. This ensured that institutional
environmental changes that happen over time were relatively fixed (Brouthers, Brouthers, &
Werner, 2008b). Moreover, potential problems caused by recall bias were minimized by only
asking with regard to the most recent entry (Brouthers & Brouthers, 2003).
The sample was drawn from the Userneeds database. A random sample was drawn from the
database and online questionnaires were sent to managers at the corporate level. 876 Danish
(DK), 1014 Swedish (S) and 1739 Norwegian (N) firms were contacted yielding a total of 3629
firms. After follow-up rounds, 2107 (656 from DK, 609 from S, and 842 from N) had responded
to the survey. 1420 indicated that they had no international activity and 332 selected not to
participate leaving 355. The final sample used in the empirical example includes 246 firms (82
Danish, 86 Swedish and 78 Norwegian). Subtracting firms with no international activity, the
overall response rate was 16% and the usable response rate was about 11.1%6. Respondents in
the sample had a median of 113 and a mean of 12335 employees and the majority was service
firms (72% of the sample). In the sample, ca. 43% of the entries were WOS, 16% were JVs, and
41% were exporting. These firms made their latest entries in 91 different countries of which the
most commonly entered were Sweden (19), China (18), Germany (14) and the USA (12).
3.2. Variables
Entry mode type was obtained from respondent firms. In the questionnaire, the respondents were
asked which entry mode was chosen in their most recent foreign market entry. The respondents
could choose between greenfield, acquisition, JV, contractual agreements and independent
exporting. I conceptualized the mode of entry as a categorical variable: (0) independent
6 Usable response rates in past survey-based entry mode studies are typically of this size. A couple of examples
include 7.5 % (Dikova & van Witteloostuijn, 2007), 8.9 % (Schwens et al., 2011) and 13.3 % (Brouthers, Brouthers,
& Werner, 2003).

CH. 2. Interpreting Results from the Multinomial Logit Model
50
exporting, (1) JV and (2) WOS (including greenfield and acquisition). Independent exporting
modes are defined as non-equity market based modes where the firm uses entities in the host
country to either provide or produce their product or service. JVs are modes where the entrant
shares equity ownership of the host country operations with a local partner. WOS are operations
where the investing firms hold an equity-share of 95 percent or more (Brouthers et al., 2008a).
The predictor variable used as an example in the empirical demonstration is Firm size. In the
entry mode literature, Firm size is one of the most commonly used predictors found in 40 studies
in the period 1980-2006 (Canabal & White, 2008). Scholars suggest that larger firms tend to use
more integrated entry modes. Commonly, it is argued that larger firms possess more resources
than smaller firms (Combs & Ketchen, 1999), and that firm size is an indication of a firm’s
potential to meet resource requirements (Buckley & Casson, 1998). However, literature reviews
report inconsistent empirical findings (see e.g. Brouthers & Hennart, 2007). Some studies find no
significant difference in the choice between equity and non-equity modes (Brouthers & Nakos,
2004; Nakos & Brouthers, 2002) depending on the size of the entrant, while others have found
evidence to suggest that firm size has different impacts on exporting, JV and WOS modes
(Shrader, 2001). In the empirical example in this study, I measure Firm size as the log of the
number of employees worldwide (Brouthers & Brouthers, 2000).
Several control variables were included. I controlled for the degree of International experience
measured using two different items (alpha = 0.75) from Brouthers et al. (2008a) and Brouthers
and Dikova (2010). I used the log-transformed value of the intensity of firm experience (number
of years of general international experience) as well as the log-transformed value of the diversity
of firm experience (number of countries where the firm had operations). Furthermore, I
controlled for potential influences from industry differences (Erramilli & Rao, 1990). Following
previous research (Brouthers & Nakos, 2004; Brouthers, 2002; Brouthers & Brouthers, 2003), I
created a dummy variable, Service, based on the respondents’ answers to whether the organization
had established a manufacturing (value of 0) or a service operation (value of 1). I controlled for
potential home country differences (Brouthers et al., 2008b). A Danish and a Norwegian dummy
variable were each coded one (1) if the respondent was from the specified home country and
zero (0) if otherwise.
Finally, I included variables based on transaction cost theory (TCT). In TCT-terminology,
specific assets have less value outside the transaction in which they are tailored to be utilized
(Williamson, 1985). To gauge the specificity of assets, I followed Dikova & van Witteloostuijn
(2007) and asked respondents how much money as a percentage of annual sales was spent on
R&D (Technological intensity). Internal uncertainty was measured using Kogut & Singh’s (1988)
cultural distance index. This index uses the differences in the scores on Hofstede’s (1980; 2001)
cultural indices between the foreign country and the home country of the entering firm, which in
the case of this study was either Denmark, Norway or Sweden. The higher the score on the
cultural index, the higher the level of cultural distance. Finally, External uncertainty was measured
using a set of nine 7-point scale Likert type questions taken from Brouthers & Dikova (2010) and
Brouthers (2002). Confirmatory factor analysis showed acceptable fit (CFI = 0.91, RMSEA =
0.08, SRMR = 0.05). Low values of the composite index represent low uncertainty, and high

CH. 2. Interpreting Results from the Multinomial Logit Model
51
values represent high uncertainty. Because the measures of the control variables are on different
scales, they are standardized before the analysis.
4. Empirical Example
In the following empirical example, I present the recommended procedure for an analysis of the
results from an MLM. Specifically, I concentrate on the association between Firm size and EMC.
First, I consider hypothesis testing and model fit. Then, I analyze the association between Firm
size and EMC through graphical representations, first using predicted probabilities and then
marginal effects. Finally, I summarize the results using the summary measures presented above.
The Stata code that generates the figures and measures is available in Appendix sections A1. and
A2.
Table I reports the means, standard deviations, and correlations of all variables. Table II
presents the coefficients and model fit statistics of the multinomial logistic regression analysis7
with EMC as an unordered categorical dependent variable.
4.1. Hypothesis Testing and Model Fit
Model A (Panels 1, 2, and 3) contains only the control variables. Model B (Panels 4, 5, and 6)
adds the predictor variable Firm size to the control variables. Table II contains the model
coefficients for the different combinations of outcomes. Because there is no natural base-case,
the three possible combinations of choices are computed by varying the base case with the last
mentioned category being the base. For instance, in the choice equation JV vs. WOS, WOS is the
base case. Thus, for studies with the same number of alternatives and a natural base case, the
output may be simplified to two columns per model.
Looking at the model fit statistics, we observe that the likelihood ratio (LR) test in Model A is
significant (p < 0.001, R2 = 0.214) meaning that at least a subset of the predictors have non-zero
effects. Model B including Firm size exhibits a significant increase in χ2 (p < 0.001) and a
substantial increase in R2 from 0.214 to 0.437. Thus, Model B demonstrates increased explanatory
power over Model A. Model B’s AIC is lower (1.781), which is an indication that the model fit is
improved enough to compensate for the fact that the model grows in complexity (Raftery, 1996).
Overall, these results indicate a good model fit with the predictor Firm size.
7 The multinomial logit model relies on the assumption of independence of irrelevant alternatives (IIA). In the terms
of the model, this means that Pr(y=m|𝐱i)
Pr(y=n|𝐱i)= exp{𝐱i(βm|b − βn|b)}, where the odds are not dependent on other available
alternatives. Therefore, the odds of one choice versus an alternative choice are not dependent on the number of choice alternatives included. To test the IIA assumption, one may perform the Hausman-Mcfadden test (1984) and the Small-Hsiao test (1985). The Small-Hsiao test randomly divides the data into subsamples why the results will change with each computation. To ensure that results can be replicated, the seed of the random-number generator must be set (in this example the seed is set to 1000). These tests have shown poor properties in small samples and often show conflicting results under certain data structures (Cheng & Long, 2007), but they are still the most common tests available to test the assumption of IIA and recommended in parts of the literature to help choose between the MLM and the multinomial probit model (Bowen & Wiersema, 2004). The mentioned tests compare the estimated coefficients from the null model to the estimated coefficients from a restricted model where one or more of the alternatives are excluded. Thus, a significant test statistic rejects the assumption of IIA. In the example used in this study, both tests were insignificant, thus the assumption of IIA could not be rejected.

CH. 2. Interpreting Results from the Multinomial Logit Model
52
Table I. Correlation and descriptive statistics
Variables Mean S.D. 1 2 3 4 5 6 7 8
1. Exports (0) vs JV
(1) vs WOS (2) 1.03 0.92
2. Firm size (log) 5.27 3.09 0.392 ***
3. International
experience (log) 2.48 1.00 -0.041 0.494 ***
4. Service 0.72 0.45 0.059 -0.138 * -0.164 *
5.Denmark 0.33 0.47 0.053 0.041 0.067 0.045
6. Norway 0.32 0.47 0.084 0.000 -0.076 -0.054 -0.482 ***
7. Technological
intensity 0.15 0.21 0.020 -0.052
-0.172 ** 0.023
-0.005
0.056
8. Cultural distance 2.81 1.90 -0.132 * 0.056 0.343 *** -0.089 0.056 -0.184 * -0.090
9. External
uncertainty 3.7 1.38 -0.250 *** 0.055
0.249 *** 0.044
0.002
0.004
-0.126 * 0.298 ***
*** p<0.001, ** p<0.01, * p<0.05, † p<0.1

CH. 2. Interpreting Results from the Multinomial Logit Model
53
Table II. Results of Multinomial regression
Model A Model B
(1) (2) (3) (4) (5) (6) Variables Exports vs.
JV Exports vs.
WOS JV vs. WOS Exports vs.
JV Exports vs.
WOS JV vs. WOS
International experience 0.782*** 0.143 -0.639** 0.140 -0.706** -0.846** (0.230) (0.162) (0.232) (0.293) (0.225) (0.283) Service -0.317 0.424 0.741† -0.151 0.695† 0.846† (0.422) (0.332) (0.436) (0.447) (0.393) (0.447) Denmark 0.452 0.574 0.122 0.496 0.683 0.187 (0.468) (0.358) (0.479) (0.491) (0.416) (0.490) Norway 0.039 0.505 0.466 0.270 0.872* 0.602 (0.525) (0.353) (0.538) (0.560) (0.424) (0.542) Technological intensity -0.180 0.018 0.198 -0.243 -0.059 0.184 (0.279) (0.140) (0.279) (0.290) (0.166) (0.288) Cultural distance 0.430† -0.071 -0.501* 0.536* 0.017 -0.520* (0.225) (0.163) (0.229) (0.243) (0.194) (0.243) External uncertainty -0.245 -0.564*** -0.319 -0.297 -0.709*** -0.412† (0.227) (0.160) (0.233) (0.238) (0.191) (0.249) Firm size 0.369*** 0.541*** 0.171† (0.093) (0.081) (0.089) Constant -3.220*** -1.027† 2.193** -3.486*** -1.968** 1.518† (0.809) (0.552) (0.834) (0.847) (0.663) (0.855) R2 Nagelkerke 0.214 0.214 0.214 0.437 0.437 0.437 AIC 2.018 2.018 2.018 1.781 1.781 1.781 χ2 51.96*** 51.96*** 51.96*** 117.8*** 117.8*** 117.8*** Correctly classified 56.75 56.75 56.75 67.07 67.07 67.07 N 246 246 246 246 246 246 Change in χ2 Model A 65.86*** 65.86*** 65.86***
Standard errors in parentheses *** p<0.001, ** p<0.01, * p<0.05, † p<0.1
CH. 2. Interpreting Results from the Multinomial Logit Model
54
Note that the procedure for assessing model significance and the interpretation of model fit
statistics is the same as in binary models.
The model fit statistics form an important basis for the whole analysis and should always be
reported and commented on as it is custom in binary models. If the overall model is significant
we can start examining the hypotheses about individual predictors. Several hypotheses may be
tested in an MLM. Using an LR test or a Wald test we can test the H0 that Firm size is
insignificant for the choice between the three entry modes. This type of hypothesis testing is
different from binary models because we have more than one coefficient for each variable. Thus,
we require a test of the overall significance of a predictor. Because we already used the LR test
when comparing the models with and without the predictor above, I use the Wald test to test this
hypothesis. Letting β1kbe the coefficient for Firm size, the Wald test returns a value of 45.14 (p <
0.000) and we can thus reject H0 : β1k = 0, where k = 0, 1, 2. Put differently, we can reject the
hypothesis that Firm size has no impact on EMC. This fits the information we gain from
observing the coefficients in Table II: Firm size is statistically significant and positively related to
choosing JV over Exports (p < 0.001), WOS over Exports (p < 0.001) and WOS over JV (p <
0.1). It is worth mentioning that even though a variable turns out to be insignificant in the choice
equation, it may still make sense to carry out the analysis of predicted probabilities and marginal
effects below (Bowen & Wiersema, 2004). However, if an individual LR statistics (or Wald test)
of the predictor turns out insignificant, it makes little sense to continue with further analyses of
predicted probabilities and marginal effects17.
We might also be interested in testing whether two alternatives are non-distinct. In an entry
mode context this is interesting as the categories JV and WOS are often collapsed to a single
category labeled equity modes. We can test whether the coefficients of the predictors are the same
for JV and WOS. If β1,1|2, … , βK,1|2 are the coefficients for x1 through xK from the choice of 1 (JV)
versus 2 (WOS), the hypothesis becomes H0 :β1,1|2 = ⋯βK,1|2 = 0, if WOS is set as the base. With
a Wald statistic of 28.71 (p < 0.001) we reject that JV and WOS are indistinguishable categories
why they should not be collapsed into a single entry mode category.
4.2. Analysis of Predicted Probabilities
As explained above, the directional relationship between a predictor and the probability of a
choice depends on all variables and their estimated coefficients across the choice alternatives.
Therefore, we cannot rely on the estimated coefficients when evaluating the direction of the
relationship between Firm size and the probability of choosing a specific entry mode. Instead, we
make sense of the results by computing and plotting the predicted probabilities. A plot of the
predicted probabilities for the three different entry mode categories and Firm size is shown in
Figure 1.
17 The individual z-statistic and p-value for an independent variable in a given choice equation can be used to assess
whether that particular variable is significant in determining the probability of that particular choice. However, an LR
test of an individual variable tests the significance of that variable as a whole by comparing the maximum likelihood
value of the full model (𝑙0) to the maximum likelihood value of the model excluding that particular variable (𝑙1). The
LR test statistic follows a χ2-distribution with J degrees of freedom: LR = 2(𝑙1 − 𝑙0)~𝜒2.
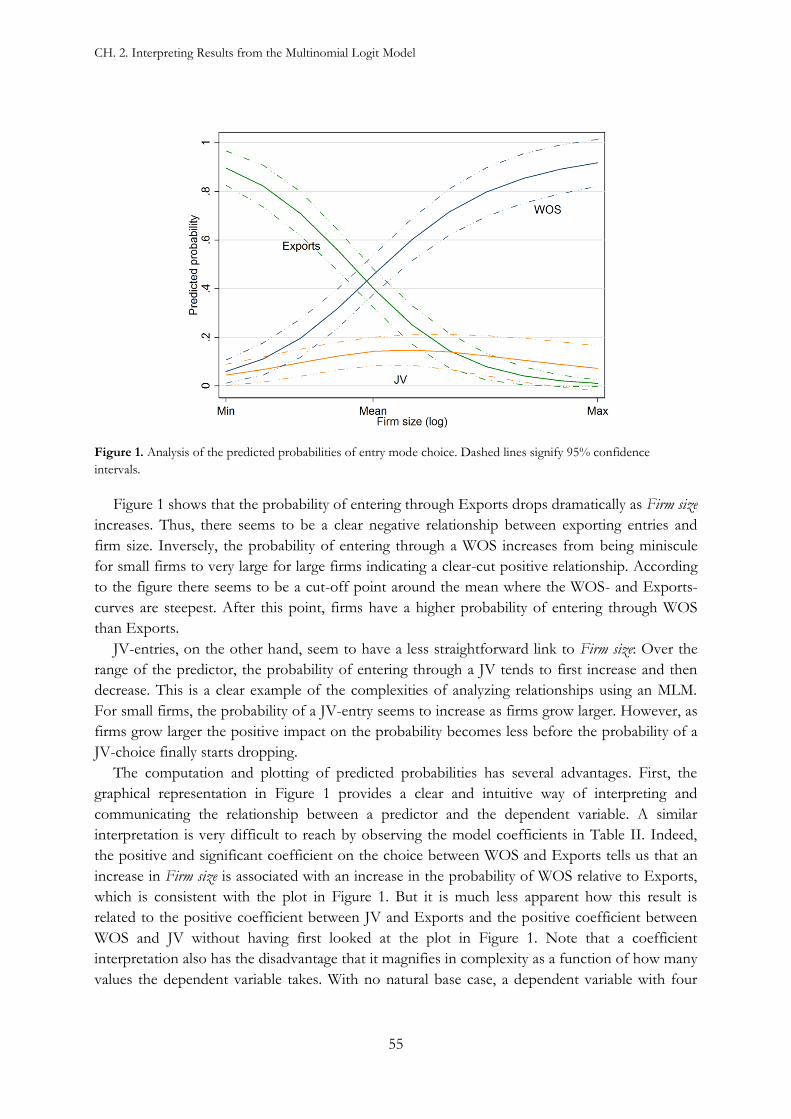
CH. 2. Interpreting Results from the Multinomial Logit Model
55
Figure 1. Analysis of the predicted probabilities of entry mode choice. Dashed lines signify 95% confidence
intervals.
Figure 1 shows that the probability of entering through Exports drops dramatically as Firm size
increases. Thus, there seems to be a clear negative relationship between exporting entries and
firm size. Inversely, the probability of entering through a WOS increases from being miniscule
for small firms to very large for large firms indicating a clear-cut positive relationship. According
to the figure there seems to be a cut-off point around the mean where the WOS- and Exports-
curves are steepest. After this point, firms have a higher probability of entering through WOS
than Exports.
JV-entries, on the other hand, seem to have a less straightforward link to Firm size: Over the
range of the predictor, the probability of entering through a JV tends to first increase and then
decrease. This is a clear example of the complexities of analyzing relationships using an MLM.
For small firms, the probability of a JV-entry seems to increase as firms grow larger. However, as
firms grow larger the positive impact on the probability becomes less before the probability of a
JV-choice finally starts dropping.
The computation and plotting of predicted probabilities has several advantages. First, the
graphical representation in Figure 1 provides a clear and intuitive way of interpreting and
communicating the relationship between a predictor and the dependent variable. A similar
interpretation is very difficult to reach by observing the model coefficients in Table II. Indeed,
the positive and significant coefficient on the choice between WOS and Exports tells us that an
increase in Firm size is associated with an increase in the probability of WOS relative to Exports,
which is consistent with the plot in Figure 1. But it is much less apparent how this result is
related to the positive coefficient between JV and Exports and the positive coefficient between
WOS and JV without having first looked at the plot in Figure 1. Note that a coefficient
interpretation also has the disadvantage that it magnifies in complexity as a function of how many
values the dependent variable takes. With no natural base case, a dependent variable with four
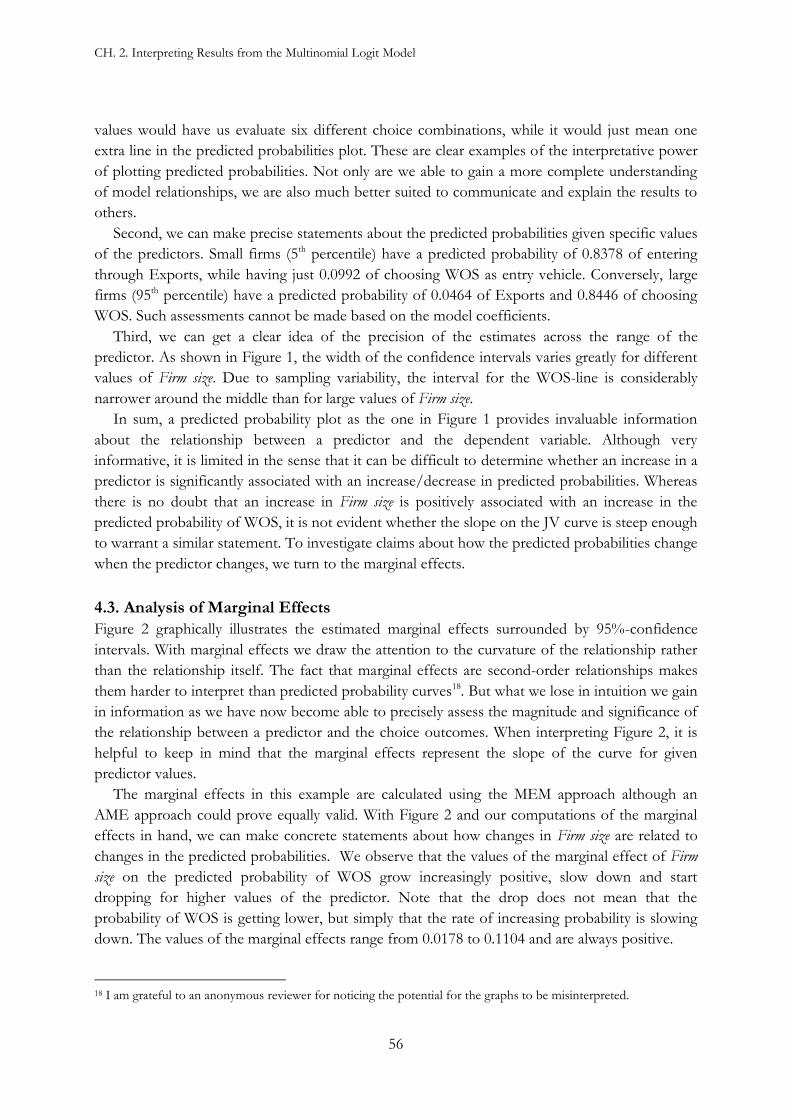
CH. 2. Interpreting Results from the Multinomial Logit Model
56
values would have us evaluate six different choice combinations, while it would just mean one
extra line in the predicted probabilities plot. These are clear examples of the interpretative power
of plotting predicted probabilities. Not only are we able to gain a more complete understanding
of model relationships, we are also much better suited to communicate and explain the results to
others.
Second, we can make precise statements about the predicted probabilities given specific values
of the predictors. Small firms (5th percentile) have a predicted probability of 0.8378 of entering
through Exports, while having just 0.0992 of choosing WOS as entry vehicle. Conversely, large
firms (95th percentile) have a predicted probability of 0.0464 of Exports and 0.8446 of choosing
WOS. Such assessments cannot be made based on the model coefficients.
Third, we can get a clear idea of the precision of the estimates across the range of the
predictor. As shown in Figure 1, the width of the confidence intervals varies greatly for different
values of Firm size. Due to sampling variability, the interval for the WOS-line is considerably
narrower around the middle than for large values of Firm size.
In sum, a predicted probability plot as the one in Figure 1 provides invaluable information
about the relationship between a predictor and the dependent variable. Although very
informative, it is limited in the sense that it can be difficult to determine whether an increase in a
predictor is significantly associated with an increase/decrease in predicted probabilities. Whereas
there is no doubt that an increase in Firm size is positively associated with an increase in the
predicted probability of WOS, it is not evident whether the slope on the JV curve is steep enough
to warrant a similar statement. To investigate claims about how the predicted probabilities change
when the predictor changes, we turn to the marginal effects.
4.3. Analysis of Marginal Effects
Figure 2 graphically illustrates the estimated marginal effects surrounded by 95%-confidence
intervals. With marginal effects we draw the attention to the curvature of the relationship rather
than the relationship itself. The fact that marginal effects are second-order relationships makes
them harder to interpret than predicted probability curves18. But what we lose in intuition we gain
in information as we have now become able to precisely assess the magnitude and significance of
the relationship between a predictor and the choice outcomes. When interpreting Figure 2, it is
helpful to keep in mind that the marginal effects represent the slope of the curve for given
predictor values.
The marginal effects in this example are calculated using the MEM approach although an
AME approach could prove equally valid. With Figure 2 and our computations of the marginal
effects in hand, we can make concrete statements about how changes in Firm size are related to
changes in the predicted probabilities. We observe that the values of the marginal effect of Firm
size on the predicted probability of WOS grow increasingly positive, slow down and start
dropping for higher values of the predictor. Note that the drop does not mean that the
probability of WOS is getting lower, but simply that the rate of increasing probability is slowing
down. The values of the marginal effects range from 0.0178 to 0.1104 and are always positive.
18 I am grateful to an anonymous reviewer for noticing the potential for the graphs to be misinterpreted.

CH. 2. Interpreting Results from the Multinomial Logit Model
57
Figure 2. Analysis of the marginal effects of firm size on entry mode choice. Dashed lines signify 95% confidence
intervals.
The smallest firms (5th percentile) have a value around 0.0289, mean-sized firms have a peak
value around 0.1104 and the largest firms (95th percentile) have a marginal effect value around
0.0178. Intuitively, this makes sense as the smallest/largest firms already have a very low/high
probability of entering through a WOS: An equal increase in Firm size is much more likely to
affect firms that are equally likely to choose a WOS over another entry mode than a firm that is
already very likely to enter through a WOS.
A clear advantage of marginal effects is that they provide us with rich and intuitively
meaningful information not available through interpretation of coefficients. For mean-sized
firms, a 1% increase in firm size is associated with an increase of 0.1104 in the predicted
probability of entering through WOS. On the other hand, an equal increase in firm size for small
firms is associated with an increase of just 0.0178 in the predicted probability. Note that this
interpretation is completely consistent with the information gained from Figure 1 where it can be
seen that the slope of the WOS-curve is steepest around the mean. By adding the computation
and plotting of the marginal effect to our analysis, we can make formal statements about how
much the predicted probabilities for a given outcome changes when we change Firm size at
specific values.
During the analysis of Figure 1 above, it became evident that the relationship between the
probability of JV-entry and Firm size was more complicated to interpret. The JV-curve in Figure 2
confirms our notion that the marginal effects shift from being positive for small firms and
negative for large firms with a range spanning from 0.0216 to -0.0138. Observing the JV-curve in
Figure 2, another benefit of the marginal effects graph becomes clear: Where it was difficult to
tell from Figure 1 whether the increase and decrease in the probabilities for small and large firms,
respectively, were significantly different from zero, Figure 2 clearly informs us about the
uncertainty around the estimates and how it depends on the predictor level. We observe that for

CH. 2. Interpreting Results from the Multinomial Logit Model
58
small firms the confidence intervals do not include zero until it nears the mean of Firm size where
the marginal effects become insignificant. Further, we observe that for firms near the maximum
level of Firm size the marginal effects become significantly negative. The z-statistic values reflect
this observation, as they span from 4.27 to -4.65 over the range of Firm size. Note that not only is
this important information unobtainable through an analysis of the coefficients, but it may also
be difficult to deduct from an analysis of the predicted probabilities alone.
The results from the above analysis are consistent with the distinguishability test performed in
the beginning: The marginal effects of Firm size exhibit very different behavior depending on the
outcome category. This supports the conclusion made earlier that the JV- and WOS-categories
should not be collapsed into a single equity-category.
When presenting the results, I recommend graphing the marginal effects for the three
outcomes together as it is done for the predicted probabilities19. This provides a clear picture of
how the distribution shifts from one category to another across the levels of the predictor. If
authors choose to graph the outcomes separately they should be cautious about exaggerating
trivial effects due to differences in scaling and careful about encouraging that the relationships are
treated as if they were independent.
A graphical analysis such as the one in Figures 1 and 2 offers the most complete assessment of
the relationship between a given predictor and the dependent variable in an MLM and should
always be reported. Furthermore, the visualizations make is considerably easier to communicate
the results. If space limitations or other restrictions prevent their inclusion, summaries of the
marginal effects may be reported (see below) with comments about the range of the marginal
effects, the uncertainty of the estimates (e.g. their z-statistic values) and a description of whether
the values of the marginal effects change sign over the range of prediction.
4.4. Summarizing Results
As described earlier, marginal effects can be summarized after the graphical interpretation.
However, in an MLM great care must be taken to avoid valuable information to be lost to too
simplistic conclusions. For instance, when computing the MEM, AME and semielasticity for Firm
size with regard to the three outcomes we get the quantities reported in Table III.
When comparing the results to information gained from Figures 1 and 2, the measures are
clearly ignoring important information about relationships, most severely with regard to the JV-
category. According to the MEM-measure, holding all variables, even Firm size, at their mean
value and increasing Firm size by 1% is associated with an insignificant increase in the probability
of a JV-entry of 0.0099. Indeed, this result is consistent with what we observed in Figure 2:
Around the mean, the marginal effect of Firm size is insignificant. However, this completely
ignores the significant marginal effects for small and large firms. The AME measure does not do
any better. The reason is that the averaging of all marginal effects makes the positive and negative
values cancel each other out arriving at a value near zero.
19 I am indebted to two anonymous reviewers for the valuable suggestion of graphing the marginal effects
collectively.

CH. 2. Interpreting Results from the Multinomial Logit Model
59
Table III. The marginal effect of firm size on the probability of choosing Exports, JV, or WOS
Marginal effect on the probability of
Marginal effect at
variable means (MEM)
Average marginal
effect (AME)
Semielasticity at variable means
Exports -0.1202*** -0.0829*** -0.2938*** (0.0174) (0.0462) (0.0968) JV 0.0099 0.0094 0.0756 (0.0096) (0.0073) (0.0698) WOS 0.1102*** 0.0735*** 0.2470*** (0.0175) (0.0086) (0.0429)
Delta-method standard errors in parentheses *** p<0.001, ** p<0.01, * p<0.05, † p<0.1
Table IV. The marginal effect of firm size on the probability of choosing JV
Value of predictor
Marginal effect at
variable means (MEM)
Average marginal
effect (AME)
Semielasticity at variable means
Low (1 SD below) 0.0213*** 0.0223*** 0.2174* (0.0054) (0.0042) (0.0878) Mean 0.0100 0.0174* 0.0623 (0.0096) (0.0087) (0.0623) High (1 SD above) -0.0110 -0.0022 (-0.0631) (0.0091) (0.0094) (0.0723)
Delta-method standard errors in parentheses *** p<0.001, ** p<0.01, * p<0.05, † p<0.1
Instead, when summing up the marginal effect, I recommend computing the summary
measures at a low, mean and high value of the predictor. For low and high values, I choose one
standard deviation below and above the mean. Table IV shows the recommended presentation
format for the JV-outcome.
Table IV more precisely sums up the nature of the marginal effect across the range of the
predictor. At low values of the predictor, the marginal effect of Firm size is significantly positive.
The semielasticity measure tells us that for firms with a size one standard deviation below the
mean, a 1% increase in Firm size is associated with an increase of 21.74% in the predicted
probability of entering through a JV. Similarly, the AME-measure tells us that when averaging the
marginal effects computed for each sample unit and holding the predictor at one standard
deviation below the mean, a 1% increase in Firm size is significantly associated with a 0.0223
increase in the probability of a JV-entry. This is consistent with what we learned from Figures 1
and 2.

CH. 2. Interpreting Results from the Multinomial Logit Model
60
Two further comments are worth making about Table IV. First, the AME actually reports a
significantly positive marginal effect at the predictor mean for the JV outcome. This is an
example of the differences that may arise when not fixing the model variables at their mean but
at their actual sample values. Despite of this difference, the measures still summarize the
tendency we observed in the figures. Second, the sign of the summary measures for firms with a
size one standard deviation above the mean is negative, but not significant. While this does not
suggest a negative marginal effect for large firms, I caution that the summary measures are
neither a test nor a complete description of the marginal effect in an MLM. As we saw in Figure
2, the marginal effects do not become significantly negative until near the maximum value. In
fact, summary measures with Firm size fixed at the 95th percentile return significantly negative
values. However, after a thorough analysis of the relationship between the predictor and the
dependent variable as performed above, the format in Table IV can be a good way to summarize
the marginal effects.
5. Conclusion
To summarize, extra care needs to be taken when analyzing and testing hypotheses about
marginal effects in MLMs compared to binary models. First, the entire set of predictors is tested
using an LR or Wald test procedure. If a specific predictor does not have a zero effect in the
population and improves model fit statistics to a satisfactory amount over the base model, the
predicted probabilities and marginal effects are calculated and analyzed to evaluate the sign,
magnitude and statistical significance of the marginal effects. Interpretations based on the model
coefficients should generally be avoided as these do not represent the relationship between a
predictor and the predicted probability of a specific outcome. Instead, the most complete analysis
and presentation of the relationship between the predictor and the dependent variable is achieved
through a graphical representation. In the first graph, the predicted probabilities (incl. confidence
intervals) are plotted against the predictor to gain an intuitive understanding of the relationship as
in Figure 1. In the second graph, the marginal effects (incl. confidence intervals) are plotted to
assert the variation in sign, magnitude and statistical significance across the range of the predictor
as in Figure 2. If the marginal effects do not change sign or significance across their range of
variation, measures such as MEM, AME and elasticities may be reported to summarize the
relationship. If the marginal effects are too complicated to sum up in single measure, e.g. due to
changes in sign, significance or major changes in magnitude, MEM, AME and elasticities may be
reported with great care for relevant values (e.g. low, mean and high) of the predictor as shown in
Table IV.

CH. 2. Interpreting Results from the Multinomial Logit Model
61
Appendix
A1. Stata Code for Hypothesis Tests and Producing Figure 1
The following Stata code performs the hypothesis tests and generates the model fit statistics used
in the empirical example. The annotated commands appear below.
1. /*Hypothesis Testing and Model Fit*/
2. mlogit exjvwo $indvars
3. fitstat, saving(m1)
4. mlogit exjvwo $indvars firmsize
5. fitstat, using(m1)
6.
7. /*Individual hypothesis testing*/
8. test firmsize // Wald test of firm size
9. test[1=2] // Wald test of distinguishability
The commands are largely self-explanatory. Line 2 runs the multinomial logit command for the
model including only the control variables contained in the global variable indvars and saves the
model fit statistics in ‘m1’. In lines 4-5 the model is run including the variable of interest, in this
case firm size, and the model fit characteristics are compared to those in the baseline model (m1).
In line 8 the individual hypothesis of firm size is run and line 9 shows the command for testing
for distinguishability between the JV (1) and WOS (2) outcomes. An indistinguishability test that
tests all pairs of alternatives can be obtained by calling: mlogtest, combine
The next piece of code shows how to generate and graph the predicted probabilities as done in
Figure 2. After running the mlogit command, this can be accomplished using the following
command contained in the Stata add-on SPost (Long & Freese, 2006):
prgen firmsize, gen(pr) rest(mean) ci
The command has several options. The ones used here generate three sets of new variables with
the prefix ‘pr’, one set for each outcome in the dependent variable. The rest(mean) option sets
the rest of the model variables to the desired relevant values, in this case the mean. The ci option
generates variables with the suffices ‘lb’ and ‘ub’ containing the upper and lower bound
confidence intervals, respectively, for each outcome. The variables can then easily be plotted
using the conventional twoway command. The code that generated Figure 1 appears below.
1. /*Analysis of Predicted Probabilities*/
2. prgen firmsize, gen(pr) rest(mean) ci
3.
4. /*Generate graph*/
5. twoway (line prp0 prx, lcolor(green) lpattern(solid)) ///
6. (line prp0lb prx, lcolor(green) lpattern(dash_3dot) lwidth(thin)) ///
7. (line prp0ub prx, lcolor(green) lpattern(dash_3dot) lwidth(thin)) ///
8. ///
9. (line prp1 prx, lcolor(orange) lpattern(solid)) ///
11. (line prp1lb prx, lcolor(orange) lpattern(dash_3dot) lwidth(thin)) ///
11. (line prp1ub prx, lcolor(orange) lpattern(dash_3dot) lwidth(thin)) ///
12. ///

CH. 2. Interpreting Results from the Multinomial Logit Model
62
13. (line prp2 prx, lcolor(navy) lpattern(solid)) ///
14. (line prp2lb prx, lcolor(navy) lpattern(dash_3dot) lwidth(thin)) ///
15. (line prp2ub prx, lcolor(navy) lpattern(dash_3dot) lwidth(thin)) ///
16. , scheme(s1color) ///
17. ytitle("Predicted probability", color(gs1)) ///
18. ylabel(, grid) ///
19. xtitle("Firm size (log)", color(gs1)) ///
20. text(0.05 6 "JV", place(se)) text(0.75 11 "WOS", place(se)) ///
21. text(0.6 2 "Exports", place(se)) ///
22. legend(off) ///
23. xlabel(`minValFirm’ "Min" `meanValFirm’ "Mean" `maxValFirm’ "Max")
Predicted values for specific values of the predictor can be generated using the prvalue
command. The examples below shows the predictions used in the empirical example in this study
for firm size set at the 5th and 95th percentile, here represented by local variables. The delta option
specifies that the standard errors are calculated using the delta method:
prvalue, x(firmsize=`5thPercentile’) rest(mean) delta
prvalue, x(firmsize=`95thPercentile’) rest(mean) delta
A2. Stata Code for Producing Figure 2
To compute the marginal effects the very useful margins command can be used. However, in
order to generate Figure 2 some additional programming is necessary. While computing and
generating the marginal effects for each outcome separately is easily achieved through the
marginsplot command, combining the marginal effects across the predictor range for each
outcome in one graph requires some additional programming. The reason is that the margins
command is limited in the sense that it only simulates one model at a time. This makes it a little
convoluted to use for estimations of the multinomial logit model with different outcomes.
Luckily, using a nested loop we can create a not too overly complicated procedure that saves the
marginal effects data for each outcome:
1. forvalues j=0/2 {
2. qui mlogit exjvwo $indvars firmsize
3. qui margins, dydx(firmsize) at(firmsize=(0(1)13)) ///
4. predict(outcome(`j')) atmeans post
5. mat x=J(13,3,.)
6. mat z=(1\2\3\4\5\6\7\8\9\10\11\12\13)
7. forvalues i=1/13 {
8. mat x[`i',1] = _b[`i'._at] // get marginal effect estimates
9. mat x[`i',2] = _b[`i'._at] - 1.96*_se[`i'._at] // compute lower limit
10. mat x[`i',3] = _b[`i'._at] + 1.96*_se[`i'._at] // compute upper limit
11. }
12.
13. mat x=x,z
14. mat colnames x = marg_`j' lci_`j' uci_`j' at_`j'
15. svmat x, names(col)
16. }

CH. 2. Interpreting Results from the Multinomial Logit Model
63
Inside the first loop the mlogit and margins commands are run for each outcome J. Thus, in this
study the `j’ is replaced by first 0, 1 and finally 2 in the margins command. The output is
suppressed using the quietly prefix. Running the margins command with the option
dydx(firmsize) atmeans computes the marginal effects at the mean. Dropping the atmeans option
instead computes the average marginal effects, and changing the dydx to eyex computes
elasticities instead. The marginal effects are calculated for the specified range of the predictor
inside the at() option. In this piece of code, increments of 1 are used to save space while the
values in the empirical example are calculated using increments of 0.5. Finally, the post argument
is used to save the results of the estimation in matrix form.
In line 5, an empty matrix ‘x’ consisting of 13 rows and 3 columns is created. This will later be
filled with the marginal effects data. Line 6 creates an empty vector ‘z’ explicitly containing the
_at values 1 through 13.
In lines 7-11, we iterate 13 times and each time store the marginal effects data in the ‘x’ matrix.
Line 8 stores the marginal effect estimates and lines 9-10 store the lower and upper bounds of
the 95% confidence intervals. In line 13, the ‘z’ vector is appended to the ‘x’ matrix after which
the column names can be changed in lines 14-15.
1. /*Generate graph*/
2. twoway (line marg_0 at_0, lcolor(green) lpattern(solid)) /// J =
Exports
3. (line lci_0 at_0, lcolor(green) lpattern(dash_3dot) lwidth(thin)) ///
4. (line uci_0 at_0, lcolor(green) lpattern(dash_3dot) lwidth(thin)) ///
5. ///
6. (line marg_1 at_1, lcolor(orange) lpattern(solid)) /// J = JV
7. (line lci_1 at_1, lcolor(orange) lpattern(dash_3dot) lwidth(thin)) ///
8. (line uci_1 at_1, lcolor(orange) lpattern(dash_3dot) lwidth(thin)) ///
9. ///
10. (line marg_2 at_2, lcolor(navy) lpattern(solid)) /// J = WOS
11. (line lci_2 at_2, lcolor(navy) lpattern(dash_3dot) lwidth(thin)) ///
12. (line uci_2 at_2, lcolor(navy) lpattern(dash_3dot) lwidth(thin)) ///
13. , legend(off) ///
14. scheme(s1mono) ///
15. ylabel(, grid) ///
16. ytitle("Marginal effect on Pr(Y = j)", color(gs1)) ///
17. xtitle("Firm size (log)", color(gs1)) ///
18. title("") ///
19. xlabel(`MinVal’ "Min" `MeanVal’ "Mean" `MaxVal’ "Max") ///
20. text(0.02 13 "JV", place(se)) ///
21. text(0.08 20 "WOS", place(se)) ///
22. text(-0.08 18 "Exports", place(se))
The above piece of code is simply the twoway command used to generate Figure 2. It uses the
values computed in the above loops to generate one line for each outcome, each surrounded by a
confidence interval. Of course, this can be moderated to change the looks of the graphs. Note
that the above procedure can easily be adapted to be used for other discrete models with multiple
outcomes as ordered logit, multinomial probit, etc. For more on how to use the margins
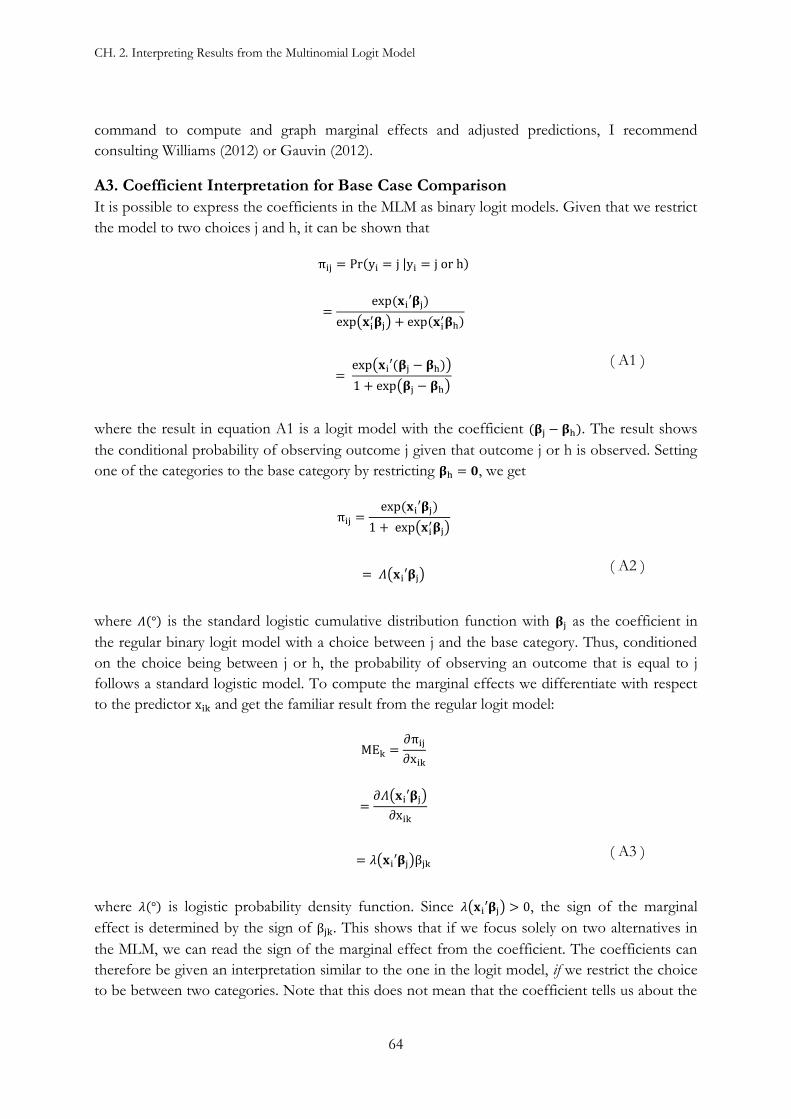
CH. 2. Interpreting Results from the Multinomial Logit Model
64
command to compute and graph marginal effects and adjusted predictions, I recommend
consulting Williams (2012) or Gauvin (2012).
A3. Coefficient Interpretation for Base Case Comparison
It is possible to express the coefficients in the MLM as binary logit models. Given that we restrict
the model to two choices j and h, it can be shown that
πij = Pr(yi = j|yi = jorh)
=
exp(𝐱i′𝛃j)
exp(𝐱i′𝛃j) + exp(𝐱i
′𝛃h)
=
exp(𝐱i′(𝛃j − 𝛃h))
1 + exp(𝛃j − 𝛃h)
( A1 )
where the result in equation A1 is a logit model with the coefficient (𝛃j − 𝛃h). The result shows
the conditional probability of observing outcome j given that outcome j or h is observed. Setting
one of the categories to the base category by restricting 𝛃h = 𝟎, we get
πij =
exp(𝐱i′𝛃j)
1 + exp(𝐱i′𝛃j)
= 𝛬(𝐱i′𝛃j)
( A2 )
where 𝛬(°) is the standard logistic cumulative distribution function with 𝛃j as the coefficient in
the regular binary logit model with a choice between j and the base category. Thus, conditioned
on the choice being between j or h, the probability of observing an outcome that is equal to j
follows a standard logistic model. To compute the marginal effects we differentiate with respect
to the predictor xik and get the familiar result from the regular logit model:
MEk =
∂πij
∂xik
=∂𝛬(𝐱i′𝛃j)
∂xik
= 𝜆(𝐱i′𝛃j)βjk
( A3 )
where 𝜆(°) is logistic probability density function. Since 𝜆(𝐱i′𝛃j) > 0, the sign of the marginal
effect is determined by the sign of βjk. This shows that if we focus solely on two alternatives in
the MLM, we can read the sign of the marginal effect from the coefficient. The coefficients can
therefore be given an interpretation similar to the one in the logit model, if we restrict the choice
to be between two categories. Note that this does not mean that the coefficient tells us about the

CH. 2. Interpreting Results from the Multinomial Logit Model
65
direction of the relationship between a predictor and the probability of a specific choice. Instead,
if we wish to interpret our results in this manner, we need to drop the imposed initial restriction.
This operation brings us back to the result in Equation 6 where the sign of an estimated
coefficient does not tell us about the direction of the relationship between a predictor and the
probability of a specific choice. For a more detailed explanation, see Cameron and Trivedi (2005),
Wooldridge (2010) or Green (2003).

CH. 2. Interpreting Results from the Multinomial Logit Model
66
References
Agarwal, S., & Ramaswami, S. N. (1992). Choice of foreign-market entry mode - impact of
ownership, location and internalization factors. Journal of International Business Studies, 23(1), 1-
27.
Anand, J., & Delios, A. (1997). Location specificity and the transferability of downstream assets
to foreign subsidiaries. Journal of International Business Studies, 28(3), 579-603.
Bartus, T. (2005). Estimation of marginal effects using margeff. Stata Journal, 5(3), 309-329.
Bowen, H. P., & Wiersema, M. F. (2004). Modeling limited dependent variables: Guidelines for
researchers of strategic management. In D. J. Ketchen, & D. Bergh (Eds.), Research
methodology in strategy and management (volume 1) (pp. 87-134). Oxford, UK: JAI/Elsevier Press.
Brouthers, K. D., & Nakos, G. (2004). SME entry mode choice and performance: A transaction
cost perspective. Entrepreneurship-Theory and Practice, 28(3), 229-247.
Brouthers, K. D. (2002). Institutional, cultural and transaction cost influences on entry mode
choice and performance. Journal of International Business Studies, 33(2), 203-221.
Brouthers, K. D., & Brouthers, L. E. (2000). Acquisition or greenfield start-up? institutional,
cultural and transaction cost influences. Strategic Management Journal, 21(1), 89-97.
Brouthers, K. D., & Brouthers, L. E. (2003). Why service and manufacturing entry mode choices
differ: The influence of transaction cost factors, risk and trust*. Journal of Management Studies,
40(5), 1179-1204.
Brouthers, K. D., Brouthers, L. E., & Werner, S. (2003). Transaction cost-enhanced entry mode
choices and firm performance. Strategic Management Journal, 24(12), 1239-1248.
Brouthers, K. D., Brouthers, L. E., & Werner, S. (2008a). Real options, international entry mode
choice and performance. Journal of Management Studies, 45(5), 936-960.
Brouthers, K. D., Brouthers, L. E., & Werner, S. (2008b). Resource-based advantages in an
international context. Journal of Management, 34(2), 189-217.
Brouthers, K. D., & Dikova, D. (2010). Acquisitions and real options: The greenfield alternative.
Journal of Management Studies, 47(6), 1048-1071.
Brouthers, K. D., & Hennart, J. (2007). Boundaries of the firm: Insights from international entry
mode research. Journal of Management, 33(3), 395-425.

CH. 2. Interpreting Results from the Multinomial Logit Model
67
Buckley, P. J., & Casson, M. C. (1998). Models of the multinational enterprise. Journal of
International Business Studies, 29(1), 21-44.
Cameron, A. C., & Trivedi, K. P. (2005). Microeconometrics: Methods and applications. New York:
Cambridge University Press.
Canabal, A., & White, G. O. (2008). Entry mode research: Past and future. International Business
Review, 17(3), 267-284.
Chang, S., Chung, J., & Moon, J. J. (2013). When do wholly owned subsidiaries perform better
than joint ventures? Strategic Management Journal, 34(3), 317-337.
Chen, J. J., & Dimou, I. (2005). Expansion strategy of international hotel firms. Journal of Business
Research, 58(12), 1730-1740.
Cheng, S., & Long, J. S. (2007). Testing for IIA in the multinomial logit model. Sociological Methods
& Research, 35(4), 583-600.
Combs, J. G., & Ketchen, J.,David J. (1999). Explaining interfirm cooperation and performance:
Toward a reconciliation of predictions from the resource-based view and organizational
economics. Strategic Management Journal, 20(9), 867-888.
Dikova, D., & van Witteloostuijn, A. (2007). Foreign direct investment mode choice: Entry and
establishment modes in transition economies. Journal of International Business Studies, 38(6),
1013-1033.
Erramilli, M. K., & Rao, C. P. (1990). Choice of foreign market entry modes by service firms:
Role of market knowledge. Management International Review, 30(2), 135-150.
Gatignon, H., & Anderson, E. (1988). The multinational corporation's degree of control over
foreign subsidiaries: An empirical test of a transaction cost explanation. Journal of Law,
Economics, & Organization, 4(2), 305-336.
Gauvin, J. (2012). A quick look at the margins command. Unpublished manuscript.
Greene, W. H. (2003). Econometric analysis (5th ed.). Upper Saddle River, NJ.: Prentice Hall.
Hausman, J., & McFadden, D. (1984). Specification tests for the multinomial logit model.
Econometrica, 52(5), 1219-1240.
Hoetker, G. (2007). The use of logit and probit models in strategic management research: Critical
issues. Strategic Management Journal, 28(4), 331-343.
CH. 2. Interpreting Results from the Multinomial Logit Model
68
Hofstede, G. (1980). Culture's consequences : International differences in work-related values. Beverly Hills:
Sage.
Hofstede, G. (2001). Culture's consequences: Comparing values, behaviors, institutions and organizations
across nations (2nd ed.). Thousand Oaks: Sage Publications.
Kim, W. C., & Hwang, P. (1992). Global strategy and multinationals' entry mode choice. Journal of
International Business Studies, 23(1), 29-53.
Klein, S., Frazier, G. L., & Roth, V. J. (1990). A transaction cost analysis model of channel
integration in international markets. Journal of Marketing Research, 27(2), 196-208.
Kogut, B., & Singh, H. (1988). The effect of national culture on the choice of entry mode. Journal
of International Business Studies, 19(3)
Li, J., & Li, Y. (2010). Flexibility versus commitment: MNEs' ownership strategy in china. Journal
of International Business Studies, 41(9), 1550-1571.
Long, J. S. (1997). Regression models for categorical and limited dependent variables (advanced quantitative
techniques in the social sciences). Thousand Oaks, CA: Sage.
Long, J. S., & Freese, J. (2006). Regression models for categorical dependent variables using stata (2nd ed.).
Texas: Stata Press.
Martin, X. (2013). Solving theoretical and empirical conundrums in international strategy
research: Linking foreign entry mode choices and performance. Journal of International Business
Studies, 44(1), 28-41.
Martin, X., & Salomon, R. (2003). Knowledge transfer capacity and its implications for the theory
of the multinational corporation. Journal of International Business Studies, 34(4), 356-373.
Meyer, K. E. (2001). Institutions, transaction costs, and entry mode choice in eastern europe.
Journal of International Business Studies, 32(2), 357-367.
Meyer, K. E., Estrin, S., Bhaumik, S. K., & Peng, M. W. (2009). Institutions, resources, and entry
strategies in emerging economies. Strategic Management Journal, 30(1), 61-80.
Nakos, G., & Brouthers, K. D. (2002). Entry mode choice of SMEs in central and eastern
europe. Entrepreneurship Theory and Practice, 27(1), 47-63.
Raftery, A. E. (1996). Baysian model selection in social research. In P. V. Marsden (Ed.),
Sociological methodology (pp. 111-163). Oxford: Blackwell.

CH. 2. Interpreting Results from the Multinomial Logit Model
69
Sampson, R. C. (2004). The cost of misaligned governance in R&D alliances. Journal of Law,
Economics, & Organization, 20(2), 484-526.
Schwens, C., Eiche, J., & Kabst, R. (2011). The moderating impact of informal institutional
distance and formal institutional risk on SME entry mode choice. Journal of Management
Studies, 48(2), 330-351.
Shrader, R. (2001). Collaboration and performance in foreign markets: The case of young high-
technology manufacturing firms. Academy of Management Journal, 44(1), 45-60.
Small, K. A., & Hsiao, C. (1985). Multinomial logit specification tests. International Economic Review,
26(3), 619-627.
Uhlenbruck, K. (2004). Developing acquired foreign subsidiaries: The experience of MNEs in
transition economies. Journal of International Business Studies, 35(2), 109-123.
Wei, Y., Liu, B., & Liu, X. (2005). Entry modes of foreign direct investment in china: A
multinomial logit approach. Journal of Business Research, 58(11), 1495-1505.
Wiersema, M. F., & Bowen, H. P. (2009). The use of limited dependent variable techniques in
strategy research: Issues and methods. Strategic Management Journal, 30(6), 679-692.
Williams, R. (2012). Using the margins command to estimate and interpret adjusted predictions
and marginal effects. The Stata Journal, 12(2), 308-331.
Williamson, O. E. (1985). The economic institutions of capitalism. New York: Free Press.
Wooldridge, J. M. (2010). Econometric analysis of cross section and panel data (2nd ed.). Cambridge MA:
The MIT Press.
Zelner, B. A. (2009). Using simulation to interpret results from logit, probit, and other nonlinear
models. Strategic Management Journal, 30(12), 1335-1348.

CH. 2. Interpreting Results from the Multinomial Logit Model
70

CH. 3. Entry Mode Choice and Performance of Nordic Firms
71
CHAPTER 3
Entry Mode Choice and Performance of Nordic Firms How Sources of Firm-Specific Advantages Moderate the Effect of Non-
location Bound International Experience1
Jesper N. Wulff Aarhus University
Abstract
Theoretical frameworks in international business suggest that the length and diversity of a firm’s
previous experience abroad is related to its foreign market entry mode: Doing business in
different markets over a longer period of time results in the generation of firm-specific
advantages (FSAs). FSAs can help international entrants bear and handle the risk and control
associated with equity entry modes characterized by higher returns and commitment. In this
study, I suggest that the association between experience-built FSAs and equity entries diminishes
in the presence of two other factors known to generate FSAs: Firm size and foreign sales ratio.
Further, I suggest that firms whose entry mode decision can be predicted through this
relationship, on average, yield higher post-entry performance. I test the hypotheses on data based
on 250 foreign market entries made by Norwegian, Danish and Swedish firms. This study
contributes to previous experience-based research and has practical implications for managerial
entry mode decision-making.
Keywords: Foreign market entry mode choice, international experience, firm size, multinational
experience, moderating effect
1 Part of this work was carried out while the author was visiting Vienna University of Economics and Business. I am thankful for the kind hospitality of this institution during my visit. I would like to thank Desislava Dikova and Benjamin Schönung for their careful reading and constructive comments on an earlier version of this paper. I am indebted to my advisor Niels Peter Mols and Anders Ryom Villadsen for valuable comments. A shorter version of this paper is undergoing a revision in Industrial Marketing Management.

CH. 3. Entry Mode Choice and Performance of Nordic Firms
72
1. Introduction
International experience is a core concept in the international entry mode literature. It is a central
construct in Johanson and Vahlne’s (1977) Uppsala-model, in transaction cost theory it is
commonly used to gauge internal uncertainty (Zhao, Luo, & Taewon Suh, 2004), in the OLI-
model it proxies ownership-based advantages, and in the resource-based view it is proposed to
give rise to firm-specific advantages (Eriksson, Johanson, Majkgard, & Sharma, 1997) as well as
dynamic learning capabilities (K. D. Brouthers, Brouthers, & Werner, 2008b). Thus, it is no
coincidence that international experience has received a tremendous amount of attention in the
empirical literature.
However, previous research has found conflicting results when linking international
experience to entry mode choice. Some studies find support for a positive relationship with
higher equity modes (e.g. Ji & Dimitratos, 2013). The explanation is that generating firm-specific
advantages (FSAs) makes the firm capable of bearing and handling the risk and control associated
with a higher control mode of entry (MOE), thus increasing the likelihood of an equity entry (K.
D. Brouthers et al., 2008b; Padmanabhan & Cho, 1996). On the other hand, a few studies find
evidence to suggest a negative association between equity modes and experience length (e.g.
Wilkinson, Peng, Brouthers, & Beamish, 2008). A negative relationship is usually explained
through an ethnocentric argument stating that less experienced foreign market entrants prefer to
have their own nationals running their foreign ventures (Anderson & Gatignon, 1986), which is
often most feasible in equity-entries. Over time, when firms grow internationally experienced
they develop a more polycentric perspective, and thus have more confidence in exploiting local
management capabilities (Erramilli, 1991; Shetty, 1979). Finally, other studies have found no
reliable relationship, leading some scholars to question the link between experience and entry
mode choice (e.g. Kogut & Singh, 1988).
In this study, I follow in the footsteps of recent empirical studies investigating whether the
effect of international experience is contingent on other factors (Ji & Dimitratos, 2013;
Maekelburger, Schwens, & Kabst, 2012; Schwens, Eiche, & Kabst, 2011). Specifically, I propose
that the effect of international experience on entry mode choice diminishes in the presence of
firm-specific advantages (FSA) obtained through firm size or multinational experience, defined as
a high foreign sales to total sales ratio. I also posit that firms, whose entry mode can be predicted
by a model where the effect of international experience is moderated, yield higher performance.
Thus, the adjustment results in a normatively superior explanation of MOE.
That the effect of international experience should diminish under these circumstances has an
appealing logic to it: Through risk-seeking behavior and cost-absorption abilities, large firms have
a very high probability of entering through an equity-based mode. Thus, building additional FSAs
through accumulating additional experience should mean little for these firms’ probability of
making an equity entry. In other words, I suggest that even though international experience may
be positively related to equity entries as joint ventures (JV) or wholly owned subsidiaries (WOS),
its effect on entry mode choice is negatively moderated by firm size and multinational experience.
An analysis of 250 Nordic entries into foreign markets shows empirical evidence to suggest a
moderating effect of firm size on the effect of international experience. Surprisingly, the
relationship between international experience and equity mode choice is negative for firms with
higher levels of multinational experience. Thus, when firms with a high foreign to total sales ratio
CH. 3. Entry Mode Choice and Performance of Nordic Firms
73
enter more markets or gain experience abroad, they are increasingly more likely to enter foreign
markets through non-equity arrangements such as independent exports.
This study moves beyond explaining mode choice to examining performance-implications.
Analyses suggest that firms whose entry mode is based on a model where the effect of
international experience diminishes in the presence of other FSAs, on average, have higher
performance than firms whose entry is not. In sum, this study contributes to the relationship
between international experience and both entry mode choice and performance.
2. Background
Entry mode types include exporting, contractual agreements, JVs and WOSs. The equity vs. non-
equity conceptualization is used in recent studies hypothesizing about interaction effects
involving international experience (Ji & Dimitratos, 2013; Maekelburger et al., 2012; Schwens et
al., 2011) and is one of the most commonly used mode differentiations. Equity modes include
JVs and WOSs while non-equity modes correspond to licensing, franchising and independent
exporting. This is the outcome variable used to conceptualize MOE in this study.
2.1. International experience and firm-specific advantages
At the firm-level, a firm’s behavior in international market investment situations is attributed to
its possession of firm-specific advantages (FSAs). FSAs are knowledge bundles (Rugman &
Verbeke, 2001; 2003) tightly tied to proprietary knowledge (Collinson & Rugman, 2008) and
(im)materialized through intangible assets, learning and organizational capabilities (Collinson &
Rugman, 2008; Rugman & Verbeke, 2003). Using this definition, FSAs apply to the firm’s
capabilities or know-how (Rugman & Verbeke, 2001). In this study, the focus lies on two
commonly used proxies for FSAs: International experience and firm size.
International experience leads to the generation of FSAs in several firms. When firms conduct
business transactions in foreign markets over time, they increase their level of general
international experience (Cho & Padmanabhan, 2005). This leads to growth in knowledge
(Eriksson et al., 1997) and capabilities (K. D. Brouthers et al., 2008b; Delios & Beamish, 2001)
thus generating FSAs. Furthermore, increases in international experience facilitate FSAs by
obtaining economics of scale faster, learning faster than rivals and more effectively capitalizing on
arbitrate opportunities (J. F. Hennart, 2007). This makes international experience represent an
FSA providing the potential for further international expansion (Kirca, Hult, Deligonul, Perryy,
& Cavusgil, 2012).
Because of the multidimensionality of international experience as a construct, the literature
differentiates between four different types of experience: length, scope, diversity and intensity
(Clarke, Tamaschke, & Liesch, 2013). Further, scholars distinguish between location- and non-
location bound FSAs obtained through international experience. Generally, if an FSA loses value
across space it is in the location-bound part of the scale (Rugman & Verbeke, 2008).
International experience length is accumulated when the firm operates internationally (Luo,
1999). The longer the time the firm has been in the international arena, the higher the likelihood
that it has developed routines and acquired knowledge. Country-specific experience can also be
both location- and non-location bound and considers the scope or geographical diversity of
experience (Erramilli, 1991). A greater experience scope means a higher likelihood that the firm

CH. 3. Entry Mode Choice and Performance of Nordic Firms
74
has developed its experience across different country contexts. When the firm has experience
with different products or services and diverse buyers, it is referred to as diversity of international
experience (Luo & Peng, 1999). With greater diversity the firm’s experience is bound to a broader
range of activities. Finally, international experience intensity is the amount of experience the firm
acquires per time unit. Whether this type is location-bound depends on the generic nature of the
knowledge obtained (Clarke et al., 2013).
This study focuses on the non-location bound type of experience obtained through the length
and scope of international experience. Due to the mixed evidence on the direct association
between experience and MOE, scholars have become interested in the existence of possible
moderating effects. Using a sample of Chinese firms, Ji and Dimitratos (2013) did not find
evidence to suggest that their Confucian dynamism variable moderated the effect of experience
length on equity mode choice. Kuo, Kao, Chang, and Chiu (2012) found evidence supporting
that experienced family firms are more likely to choose WOS over JV compared to non-family
firms. Maekelburger, Schwens and Kabst (2012) found support for their hypothesis that
international experience, incl. the experience of management, weakens the effect of asset
specificity on equity mode choice. Taking an institutional theory approach, Schwens, Eice and
Kabst (2011) did not find any support that informal and formal institutional risk should
strengthen the positive relationship between experience length and equity-based entry mode. In
contrast, Brouthers, Brouthers and Werner (2008b) found that some types of institutional
distance had less of an effect on firms possessing dynamic learning capabilities measured through
length and scope of international experience. Similar studies focusing on cultural distance found a
diminishing effect on control in more experienced subsidiaries (Cho & Padmanabhan, 2005;
Wilkinson et al., 2008) and occasionally no change in association (Dow & Larimo, 2009).
2.2. Firm size and multinational experience
Two other important sources for FSAs are firm size and multinational experience (Kirca et al.,
2012; Lu & Beamish, 2004). Larger firms may act as dominating market players capable of cutting
off later entrants’ access to scarce assets, suppliers, markets etc. (Kobrin, 1991). This is achievable
not only through first-mover advantages, but also through vertical integration. Higher resource
availability may also explain why larger firms tend to be more risk seeking (Brewer, 1993). In a
resource-based context, firm size has been an indicator for a firm’s ability to absorb the high
costs of equity ownership (Buckley & Casson, 1976). Indeed, larger firms may be more willing to
risk equity entries because they can reduce risk through broad portfolios and enjoy stronger
bargaining power towards local governments and institutions. There is some empirical evidence
to support this view as studies have found that larger firms are more likely to integrate through
equity entry modes when entering foreign markets (Ji & Dimitratos, 2013; Liang, Musteen, &
Datta, 2009).
Multinational experience, also referred to as international diversification, can also been linked
to FSAs (Tallman & Li, 1996). It refers to the shares of foreign operations within the firm’s
business portfolio (Tihanyi, Griffith, & Russell, 2005). Similarly to large firms, firms with
increased commitment to foreign markets can exploit market power, spread market risk and take
advantage of less expensive inputs from international markets characterized by less price-
sensitivity (Kim, Hwang, & Burgers, 1989). Their market power may further be leveraged to
reduce input costs and take control of output markets (Kogut, 1985). International diversification
CH. 3. Entry Mode Choice and Performance of Nordic Firms
75
may lead to the firm obtaining both non-location- and location-bound FSAs depending on the
scope of their operations (Clarke et al., 2013).
This study contributes to the literature by focusing on the moderating influence of firm size
and multinational experience on the relationship between international experience and equity
mode choice. As yet, very few studies have suggested moderating influence of FSA-variables on
international experience. Taking a transaction cost approach, Maekelburger, Schwens and Kabst
(2012) investigated the interaction between FSAs in the form of specific assets and international
experience finding empirical evidence to suggest a negative moderation. Brouthers, Brouthers
and Werner (2008b) found evidence to suggest a moderating influence of institutional factors on
FSAs and international experience (dynamic learning capabilities), respectively, but did not
further investigate the relationship between FSAs and international experience. This study
complements findings from previous studies by focusing on firm size as a moderating variable on
different types of international experience. In addition, it expands the traditional focus on entry
mode choice by also including analyses of performance implications.
3. Hypotheses
As argued above, smaller firms are less likely to accumulate greater resources and possess less
flexibility in managerial and financial resources making them more likely to choose less resource
intensive, non-equity modes (Cavusgil & Naor, 1987). When small and medium-sized firms
(SMEs) enter foreign markets, they start accumulating experiential knowledge about
administrative resources (Blomstermo, Sharma, & Sallis, 2006), economic, political and legal
systems (Elango & Chen, 2012), as well as informal and formal institutional distances (Schwens et
al., 2011). Thus, the SME becomes more resourceful and skilled in applying internal knowledge in
the internalization process turning the experience into an FSA (Goerzen & Beamish, 2005; Kirca
et al., 2012). Following the points discussed above, this gain in experience leads to a higher
probability of entering through equity-based modes.
A larger firm, on the other hand, already has a strong preference for an equity-mode.
Increasing international experience may build additional advantage-providing capabilities, but as
the firm already has sufficient FSAs to warrant an equity entry, the marginal effect of additional
experience on the probability of equity-based entry is likely to be small. In fact, for very large
firms there is unlikely to be any effect of international experience at all due to an already very
strong preference for equity modes. The same may be the case for firms with a high level of
multinational experience. With a high ratio of foreign to total sales the entrant has a high
probability of establishing an equity-based mode due to the generation of FSAs (Clarke et al.,
2013). In other words, firm size and multinational experience should moderate the relationship
between international experience and equity-based entry mode choice such that the positive
relationship diminishes as the firm grows larger.
While the evidence is sparse when it comes to multinational experience, there may already be
some evidence in the empirical literature supporting a contingent effect of firm size. To date,
several studies have shown a positive relationship between international experience and equity
mode choice when studying SMEs. Pinho (2007) found that firm international experience was
significantly positively related to SMEs choosing equity over non-equity modes of entry. This
finding was equivalent to the one found in Schwens, Eiche and Kabst’s (2011) investigation of

CH. 3. Entry Mode Choice and Performance of Nordic Firms
76
the equity-based entry mode of German SMEs as well as in Brouthers and Nakos’ (2004) study
of Greek and Dutch SMEs’ entries into Central Eastern Europe.
Conversely, studies not focusing on SMEs have returned relatively mixed results. Using
several different measures of international experience, Kuo et al. (2012) did not find any evidence
to support a direct relationship between experience and entry mode choice while showing a
significantly negative relationship between firm size and modes with higher equity degree.
Sampling Spanish firms of various sizes, Claver, Rienda and Quer (2009) did not find a significant
relationship between international experience and choice of higher equity mode as it was the case
in López-Duarte and Vidal-Suárez’ (2013) study. Finally, Wilkinson et al.(2008) found that
ownership level was negatively related to international experience (length), while finding no
evidence of its relationship to another type of experience (scope).
Lastly, research has already shown that international experience weakens the effect of one
FSA-generating variable (asset specificity) on equity mode choice (Maekelburger et al., 2012)
thereby generating interest in possible interactions between other FSA proxies such as firm size
and multinational experience. Thus, I offer the following hypotheses about the moderating effect
of firm size and multinational experience, respectively, on the relationship between international
experience and equity-mode choice:
H1a: The positive relationship between international experience (length and scope) and equity-
based entry choice decreases with larger firm size.
H1b: The positive relationship between international experience (length and scope) and equity-
based entry choice decreases with higher levels of multinational experience.
Firm size and international and multinational experience are expected to be related to higher
performance. Large firms have access to a much larger resource pool and are thus less restricted
from investing in potential upside-creating innovation projects (Cohen, 1996). Furthermore, large
firms often enjoy scale and scope economies and may gain monopolistic advantages through
control of scarce assets and supply channels (Gaba, Pan, & Ungson, 2002; Kobrin, 1991).
Similarly, internationally experienced MNEs achieve scale economies faster, acquire superior and
more flexible resources and capabilities, have steeper learning curves due to experiential learning
and can more effectively reap the benefits from arbitrage opportunities (K. D. Brouthers et al.,
2008b; J. F. Hennart, 2007; Kirca et al., 2012). Finally, a higher level of multinational experience
provides the firm with better opportunities to leverage strategic resources as well as diversify
market risks leading to superior performance (Kim et al., 1989).
Performance hypotheses have rarely been tested with regard to the choice between equity and
non-equity modes. In the general entry mode literature, the empirical evidence shows surprisingly
conflicting results. Siripaisalpipat and Hoshino (2000) did not find statistical evidence for a
relationship between experience, neither length nor scope, and the performance of Japanese
firms in Thailand. Concordantly, Dikova (2009) did not establish a significant link between
neither the international experience nor firm size of West European MNE-entries in Central and
Eastern Europe and their performance. Furthermore, Delios and Beamish’s (2001) analysis of the
profitability of 3080 Japanese subsidiaries did not show a significant performance-association for
neither parent firm size nor host-country experience. Similar non-results have been found with
regard to business-to-business performance (Rhee, Kim, & Lee, 2014), export performance of

CH. 3. Entry Mode Choice and Performance of Nordic Firms
77
British and U.S. private SMEs (Nakos, Brouthers, & Dimitratos, 2014) and subsidiary
performance of Norwegian MNEs (Thomassen & Benito, 2009).
Contrary to the above, Jung, Beamish and Goerzen (2008) studied equity entries by Japanese
firms and found a significant positive relation between firm size and performance, while finding
host country experience to be negatively related and experience length to be not related at all. On
the other hand, Brouthers et al. (2008b) found firm size to be significantly negatively related to
the performance. Finding the opposite, Ogasavara and Hoshino’s (2007) results suggest that
Japanese subsidiaries in Brazil have higher performance if they are large or have longer
experience, but show poorer performance if they have higher host country experience. Finally,
Brouthers and Nakos (2004) found significant associations between firm size and both financial
and non-financial performance of SMEs’ equity and non-equity entries, but without controlling
for international experience, and Rasheed (2005) found a non-significant relationship between
firm size and entry performance for SMEs, but without controlling for international experience.
Results thus far are not aligning with theoretical predictions. I propose that firms whose
market entry can be predicted by a model where the effect of international experience is
contingent on other sources of FSAs, on average, perform better than firms whose entry cannot
be predicted. This correction may explain why previous studies so far have not found a
relationship between FSAs and performance; it may result from not taking into account the
diminishing effect of FSAs in the presence of other FSAs. Furthermore, scholars have rarely
tested entry mode performance in relation to equity-based mode choice. Thus, I hypothesize:
H2a: Firms whose MOE can be predicted by a model where the relationship between MOE
and international experience depends on firm size, on average, have better performing MOEs
than firms whose MOE is not predicted by this model.
H2b: Firms whose MOE can be predicted by a model where the relationship between MOE
and international experience depends on the level of multinational experience, on average,
have better performing MOEs than firms whose MOE is not predicted by this model.
4. Method
I collected my data from a survey answered by executives from Danish, Swedish and Norwegian
firms and from secondary sources (specified below) focusing on the entry mode choice
(exporting/contractual agreements/JV/WOS) made by these companies. Danish, Swedish and
Norwegian firm are interesting because most research in entry mode (Canabal & White, 2008)
and foreign direct investment (Larimo, 2003b) has focused on leading OECD countries such as
USA, UK, Japan and Germany. According to Larimo (2003a) and Ronen and Shenkar (1985)
Nordic firms are very similar in many aspects. For instance, the market size in their home
countries is small; they are developed countries with high living standards, and are culturally
similar.
The sample was drawn from the Userneeds database, which mainly consists of Scandinavian
firms. Userneeds is approved by the Danish Data Protection Agency to handle sensitive personal
and firm data. The firms in the database have been carefully selected to be representative of firms
in Denmark, Sweden and Norway, respectively.
A questionnaire was used to collect most of the data. The questionnaire was originally written
in English after which it was translated into Danish, Swedish and Norwegian and back translated

CH. 3. Entry Mode Choice and Performance of Nordic Firms
78
to ensure the reliability of the translation. A pilot test of 10 firms (6 Danish, 2 Swedish, 2
Norwegian) was performed. This was done to ensure that the questions were understood in
accordance with the theoretical constructs and to verify that the captured information was
consistent among countries.
The firms were asked for their most recent foreign entry. As such, about 90% of all entries in
the sample were within the time span from 2007 - 20122. This ensured that institutional
environmental changes that happen over time were relatively fixed (K. D. Brouthers et al.,
2008b). Moreover, potential problems caused by recall bias were minimized by only asking with
regard to the most recent entry (K. D. Brouthers & Brouthers, 2003).
A random sample was drawn from the database and online questionnaires were sent to
managers at the corporate level. 876 Danish (DK), 1014 Swedish (S) and 1739 Norwegian (N)
firms were contacted yielding a total of 3629 firms. After follow-up rounds, 2107 or 58% (656
from DK, 609 from S, and 842 from N) had responded to the survey. 1420 indicated that they
had no international activity and 332 selected not to participate. Due to missing data3, the final
sample used in my analysis included 250 firms (81 Danish, 87 Swedish and 82 Norwegian). 95%
of respondents were CEO, managing director, CFO or manager. In the sample, ca. 42% of the
entries were WOS, 14.8% were JVs, 4% were contractual agreements, and 39.2% were exporting.
The firms in the sample had a median of 113 employees, an average of 17 entered foreign
markets and 28 years of international experience. The majority was service firms (72% of the
sample) and the firms made their latest entries in 91 different countries of which the most
commonly entered were Sweden (19), China (18), Germany (14) and USA (12).
Because the data on both the dependent and several independent variables come from the
questionnaire, my results may be subject to common method bias4. However, I see several
reasons to why this is unlikely. First, although most variables were obtained through the
questionnaire, I followed Podsakoff et al. (2003) by creating temporal separations through non-
consecutive inclusion of the items of primary interest (entry mode type, experience length,
experience scope, multinational experience and firm size). This decreased the likelihood that firm
managers would remember prior responses when responding to key items (J. Hennart & Slangen,
2008). Second, interaction effects are unlikely to be affected by common method bias because it
is improbable that respondents theorize about moderated relationships when filling out a survey
(Brockner, Siegel, Tyler, & Martin, 1997; Kotabe, Martin, & Domoto, 2003). This is further
enforced by the psychological separation created by not informing respondents about the goal of
the survey reducing the risk of common method bias (J. Hennart & Slangen, 2008; Podsakoff et
al., 2003). Third, a principal components factor analysis on the items revealed seven factors with
2 To make sure that the results in the study were robust to time-lags between entries, I reran the analysis including dummy variables for each year of entry. Results were robust and did not change substantially. 3 As my data contained missing data, I followed Allison (2002) and performed comparison tests finding no significant differences between early and late responders. Further, I followed Rogelberg and Stanton (2007) and performed wave and archival analysis finding no evidence to suggest issues with nonresponse. Finally, I tested for mean differences in firm size and experience length between the firms in my sample and Larimo’s (2003a) sample of Nordic firms, finding no significant differences. 4 Given budget constraints, there was a clear trade-off between sample size and number of informants within each firm. As in previous studies (K. D. Brouthers et al., 2008b; Erramilli & Rao, 1990; Leiblein, 2003) I chose to have only one key informant per firm in turn for a larger sample size as preceding studies show that estimates remain accurate (K. D. Brouthers & Bamossy, 2006).

CH. 3. Entry Mode Choice and Performance of Nordic Firms
79
an eigenvalue above 1 with the largest factor accounting for around 18% of the variance, which
suggested that common method bias was absent (Harman, 1967; Kotabe et al., 2003; Podsakoff
& Organ, 1986). Finally, previous studies (K. D. Brouthers, 2002; Dikova, 2009) do not give
reason to suspect that having a single informant would make entry mode data subject to common
method bias.
4.1. Variables
4.1.1. Dependent variables
This study uses two different outcome variables: Non-equity vs. equity and performance.
Non-equity vs. equity was obtained from respondent firms. The respondents were asked which
entry mode was chosen in their most recent foreign market entry. In the questionnaire,
respondents could choose between greenfield, acquisition, joint venture, contractual agreements
and independent exporting. Independent exporting modes are defined as non-equity market
based modes where the firm uses entities in the host country to provide their product or service.
JVs are modes where the entrant shares the equity ownership of the host country operations with
a local partner. WOS are operations where the investing firms hold an equity-share of 95% or
more (K. D. Brouthers, Brouthers, & Werner, 2008a). I followed similar studies (Ji & Dimitratos,
2013; Maekelburger et al., 2012; Schwens et al., 2011) and conceptualized the mode of entry as a
categorical variable: Non-equity entries, notably exporting and contractual agreements, were
coded ‘0’, while equity entries, notably joint venture and wholly owned subsidiary (including
greenfield and acquisition), were coded ‘1’.
As in previous studies, Performance was measured in the questionnaire because of the
unavailability and cross-country non-comparability of accounting data (J. Hennart & Slangen,
2008). I asked respondents to rate on eight 10-point Likert-type scales aspects of non-financial
(market share and marketing) and financial (sales growth and profitability) performance. The
lowest item-item correlation was around 0.6 while the rest exceeded 0.7 forming a reliable scale
(Cronbach’s alpha = 0.88). The scores were averaged into a composite index5. Previous studies
have used similar items to measure performance in an entry mode context (K. D. Brouthers &
Nakos, 2004; K. D. Brouthers et al., 2008a; Luo & Peng, 1999; Nakos et al., 2014) and shown
that the items show good correlations with archival performance data (Venkatraman &
Ramanujam, 1987).
4.1.2. Explanatory variables
Following Clarke et al. (2013), two types of non-location bound international experience were
included in this study in the form of one composite variable: International experience. The measure
was composed by the length and the scope of the firm’s experience. The length of experience was
5 I analyzed the specification of my measurement model including the three latent constructs: Performance, International experience, and External uncertainty. Factor analysis confirmed that the indicators had very high standardized loadings on their respective factors (convergent validity); that at least 50% of the variance of every item is explained by the model (convergent validity) and that inter-factor correlations were relatively low (discriminant validity). RMSEA was 0.039 (CI: 0.000:0.069, pclose = 0.698), CFI was 0.995, TLI 0.992, and ratio of χ2 to d.f. was 1.37 showing very good model fit. An exploratory factor analysis formed three factors with eigenvalues above 1 as suggested by theory with the rotated factor solution showing no cross-loadings above |0.2| and very high indicator loadings of the items on their respective factors with the lowest being 0.7.

CH. 3. Entry Mode Choice and Performance of Nordic Firms
80
operationalized by asking the respondent about the number of years that the firm has been
operating internationally (K. D. Brouthers, Brouthers, & Werner, 2003; L. E. Brouthers,
Mukhopadhyay, Wilkinson, & Brouthers, 2009) while the experience scope was gauged by asking
about the total number of foreign countries in which the firm had made foreign entries (K. D.
Brouthers et al., 2008a; Magnusson, Westjohn, & Boggs, 2009). Especially the length component
has been central to differentiating non-location bound international experience from
multinational experience (Clarke et al., 2013). The log-transformed scores showed a correlation of
0.91, were standardized and then averaged into a composite index (Cronbach’s alpha = 0.95)
following Dow and Ferencikova (2010), and Wu (2011).
The two moderators were Multinational experience and Firm size. Multinational experience is defined
as the share of foreign operations within the firm’s business portfolio and was measured by
asking the respondent about the proportion of the firm’s sales derived from operations outside
the home country to total sales (K. D. Brouthers & Dikova, 2010; Tallman & Li, 1996). The
measure provides a reasonable relative proxy of multinational experience even though it includes
resale of intermediate goods (Geringer, Beamish, & daCosta, 1989; Grant, Jammine, & Thomas,
1988). Firm size was measured as the log of the number of employees worldwide (L. E. Brouthers,
Brouthers, & Werner, 2000; Nakos & Brouthers, 2002).
4.1.3. Control variables
Several control variables were included. I controlled for industry differences (Erramilli & Rao,
1990) by creating a dummy variable, Service, based on the respondents’ answers to whether the
organization had established a manufacturing (value of 0) or a service operation (value of 1) (K.
D. Brouthers & Nakos, 2004; K. D. Brouthers, 2002; K. D. Brouthers & Brouthers, 2003). I
controlled for potential home country differences (K. D. Brouthers et al., 2008b) by including a
Danish and a Norwegian dummy variable coded one (1) if the respondent was from the specified
home country and zero (0) if otherwise. I controlled for the influence of other possible FSA-
generating variables by including transaction costs controls. Following Dikova & van
Witteloostuijn (2007), asset specificity was measured by asking respondents how much money as
a percentage of annual sales was spent on R&D (Technological intensity). Internal uncertainty was
measured through Kogut & Singh’s (1988) cultural distance index and External uncertainty was
measured using a set of three 7-point scale Likert type questions asking about the instability of
political, social and economic factors in the host country (K. D. Brouthers et al., 2003; Kim &
Hwang, 1992). I also controlled for the possible positive (or negative) effects of location-specific
drivers that may aid (or hinder) entrants in taking advantage of location-specific skills and
knowledge (Ji & Dimitratos, 2013; Pearce & Papanastassiou, 1996) such as the host country
market potential (Agarwal & Ramaswami, 1992) and legal restrictions (Gatignon & Anderson,
1988; Tsang, 1997). Market potential was measured using two seven-point Likert-type items from
Brouthers, Brouthers and Werner (2001) asking about the market and growth potential in the
host country. In addition, I included Family business as a dummy variable (family businesses coded
as 1) to control for the ownership status of the entrant similar to practice in recent studies of
interactions involving international experience (Kuo et al., 2012; Schwens et al., 2011).

CH. 3. Entry Mode Choice and Performance of Nordic Firms
81
4.2. Analysis
First, I estimated a binary probit model of the predictors of the choice between non-equity and
equity mode. To test the moderating hypotheses H1a and H1b, I computed and interpreted the
interaction effects using Stata’s command inteff according to Ai and Norton (2003) and Norton,
Wang and Ai (2004). Standard errors were calculated using the Delta-method. The full graphical
output is available in Appendix (A.1.). After graphically interpreting the interaction effects and
their statistical significance, directionality of the moderating effect is assessed through predicted
probabilities and marginal effects calculated using the margins command (Wiersema & Bowen,
2009). First, the predicted probabilities for an equity entry incl. their 90% confidence intervals are
plotted. The predicted probabilities are calculated across the range of International experience for a
low (5th percentile) and high (95th percentile) value of the moderator. Second, marginal effects of
International experience are calculated. Because marginal effects are non-linear and change
depending on values of all model variables, I compute the marginal effects of the main variable
International experience for each unit and average these into average marginal effects (AMEs). The
AMEs are computed across the range of the moderating variable, either Firm size or Multinational
experience, and graphically plotted against the moderator. By graphically plotting the AMEs, we
may observe the true nature of the marginal effect (Wiersema & Bowen, 2009).
Because managers choose the entry mode they consider to be the best-performing one, I
followed Shaver (1998) and applied a two-step procedure to control for endogenous treatment
effects. In the first step, I identified whether a firm chose the entry mode predicted by theory. I
followed Brouthers et al. (2008a) and generated a predicted fit variable based on the first-stage
probit regression. Model fit took the value ‘1’ if a firm had employed the entry mode predicted by
the model (either model 1, 2, 3, 4, or 5) and the value ‘0’ if a firm had chosen otherwise. This
binary endogenous regressor can be viewed as a treatment indicator. In this first stage, a
correction term (λ) was generated.
In the second step, λ and the model variables incl. Model fit are regressed on Performance using
OLS-regression. Following similar studies, I control for additional factors potentially affecting
entry mode performance (K. D. Brouthers et al., 2003; K. D. Brouthers et al., 2008a; J. Hennart
& Slangen, 2008). First, I control for Host country risk through the Hermes Country Risk Rating
(Schwens et al., 2011). The index includes economic imbalances, the quality of the business
climate, the likelihood of political hazards, short-term financing risks, and short-term disruptions
in demand. The higher the country risk, the higher the score on the index. To compose the index,
Hermes draws its data from e.g. IMF, the World Bank, and OECD. Second, I followed Shaver
(1998) and controlled for post entry market growth. Post entry growth was measured through a 7-
point scale Likert-type question asking respondents about the growth rate in the host country
after entry. Before the analysis, continuous explanatory variables were standardized to make their
scales comparable except for Firm size because of its readily interpretable metric.
5. Empirical Results
The correlation matrices for entry mode choice and performance, respectively, along with
summary statistics are available in Appendix (A3, A4, A5). The probit regression results
investigating the proposed moderators are provided in Table I. Model 1 including only the
control variables was significant (p < 0.05, R2 = 0.088). The country dummies (p < 0.1), external

CH. 3. Entry Mode Choice and Performance of Nordic Firms
82
uncertainty (p < 0.05) and family ownership (p < 0.05) were significant. Model 2 added the main
effects of the FSA-variables. The model showed significant improvement over Model 1 in terms
of χ2 (p < 0.001, R2 = 0.316). AIC was lower and the difference in BIC (33.5) indicated a very
strong support for Model 2 over Model 1. In accordance with previous studies, firm size was
significantly (p < 0.001) positively related to choosing an equity entry. International experience
was significantly (p < 0.05) negatively related to choosing an equity entry.
5.1. Interaction effects
Model 3 adds the interaction between international experience and firm size. The model fit is
improved over Model 1, but not over Model 2. When adding the interaction term, the direct
effect of international experience becomes non-significant. This is interesting in the light of the
disparate results in the literature discussed above. The coefficient of the interaction term is
negative but unreliable. Computing the true interaction effect reveals that it ranges from around
-0.02 in the lowest percentile and 0.02 in the highest percentile (Appendix A.1.). The interaction
effect is significantly negative for firms with a predicted probability of an equity entry in the range
from 0.1 to 0.5. These are characterized as the small firms in the sample. As firms’ probability of
an equity entry increase to above 0.5, the interaction effect is non-significant although it is
positive for firms with a very high probability of an equity entry (above 0.9). This shows some
evidence of an interaction effect.
To gain an understanding of the directionality of the moderating effect, I direct the attention
of the reader to Figure 1. In Figure 1 (A) we observe a slight negative relationship for small firms
while larger firms tend to have a more exponential decrease in the probability of an equity entry
as international experience increases. In Figure 1 (B), we observe that the marginal effect of
international experience is very close to zero and unreliable for small firms. For instance, firms
with below 20 employees have an average marginal effect of international experience of -0.03. In
other words, when these firms’ size increases by 1%, their probability of making an equity entry
drops by -0.03 when they gain more international experience. This is a trivial effect, which is also
non-significant. For larger firms, the marginal effect becomes apparent. Mean-sized firms have a
significantly negative marginal effect of international experience about -0.1, a clear indication of a
negative moderating effect of firm size. However, for firms with a size above the mean the
marginal effect, albeit still being significantly negative, starts to approach zero again.
The results above are surprising. The relationship proposed in H1a suggested a negative
moderating effect but not that the effect of international experience would grow negative. In
addition, the results suggest a more complicated relationship than the one suggested in H1a; even
though some negative moderation seems to be going on, this is clearly strongest for mean-sized
firms.
In sum, the results show partial support for H1a. Although a negative moderating effect of
firm size can be observed, the interaction effects plot in Appendix A.1 shows some ambiguity;
the interaction effect is non-significant for a large portion of the sample, notably the firms with a
predicted probability above 0.5. This suggests a moderating relationship that may be more
complicated than the one suggested in H1a. Finally, the model fit statistics did not show
convincing support for the model as a whole.
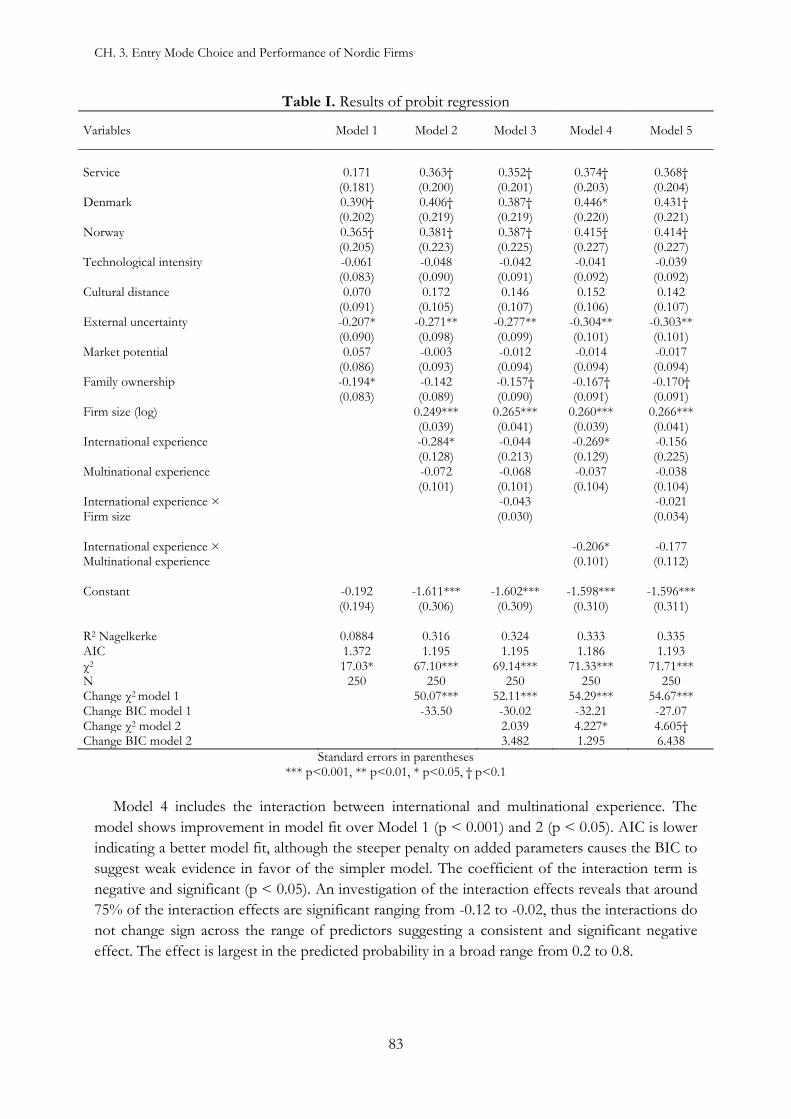
CH. 3. Entry Mode Choice and Performance of Nordic Firms
83
Table I. Results of probit regression
Variables Model 1 Model 2 Model 3 Model 4 Model 5
Service 0.171 0.363† 0.352† 0.374† 0.368† (0.181) (0.200) (0.201) (0.203) (0.204) Denmark 0.390† 0.406† 0.387† 0.446* 0.431† (0.202) (0.219) (0.219) (0.220) (0.221) Norway 0.365† 0.381† 0.387† 0.415† 0.414† (0.205) (0.223) (0.225) (0.227) (0.227) Technological intensity -0.061 -0.048 -0.042 -0.041 -0.039 (0.083) (0.090) (0.091) (0.092) (0.092) Cultural distance 0.070 0.172 0.146 0.152 0.142 (0.091) (0.105) (0.107) (0.106) (0.107) External uncertainty -0.207* -0.271** -0.277** -0.304** -0.303** (0.090) (0.098) (0.099) (0.101) (0.101) Market potential 0.057 -0.003 -0.012 -0.014 -0.017 (0.086) (0.093) (0.094) (0.094) (0.094) Family ownership -0.194* -0.142 -0.157† -0.167† -0.170† (0.083) (0.089) (0.090) (0.091) (0.091) Firm size (log) 0.249*** 0.265*** 0.260*** 0.266*** (0.039) (0.041) (0.039) (0.041) International experience -0.284* -0.044 -0.269* -0.156 (0.128) (0.213) (0.129) (0.225) Multinational experience -0.072 -0.068 -0.037 -0.038 (0.101) (0.101) (0.104) (0.104) International experience × -0.043 -0.021 Firm size (0.030) (0.034) International experience × -0.206* -0.177 Multinational experience (0.101) (0.112) Constant -0.192 -1.611*** -1.602*** -1.598*** -1.596*** (0.194) (0.306) (0.309) (0.310) (0.311) R2 Nagelkerke 0.0884 0.316 0.324 0.333 0.335 AIC 1.372 1.195 1.195 1.186 1.193 χ2 17.03* 67.10*** 69.14*** 71.33*** 71.71*** N 250 250 250 250 250 Change χ2 model 1 50.07*** 52.11*** 54.29*** 54.67*** Change BIC model 1 -33.50 -30.02 -32.21 -27.07 Change χ2 model 2 2.039 4.227* 4.605† Change BIC model 2 3.482 1.295 6.438
Standard errors in parentheses *** p<0.001, ** p<0.01, * p<0.05, † p<0.1
Model 4 includes the interaction between international and multinational experience. The
model shows improvement in model fit over Model 1 (p < 0.001) and 2 (p < 0.05). AIC is lower
indicating a better model fit, although the steeper penalty on added parameters causes the BIC to
suggest weak evidence in favor of the simpler model. The coefficient of the interaction term is
negative and significant (p < 0.05). An investigation of the interaction effects reveals that around
75% of the interaction effects are significant ranging from -0.12 to -0.02, thus the interactions do
not change sign across the range of predictors suggesting a consistent and significant negative
effect. The effect is largest in the predicted probability in a broad range from 0.2 to 0.8.

CH. 3. Entry Mode Choice and Performance of Nordic Firms
84
Figure 1. Interaction plots: International experience and firm size. (A) Predicted probabilities for high and low firm size; (B) Marginal effects plot of international experience across values of firm size.
Figure 2. Interaction plots: International experience and multinational experience. (A) Predicted probabilities for high and low multinational experience; (B) Average marginal effects (AME) plot of international experience across values of Multinational experience.
The directionality of the moderating effects is further investigated in Figure 2. The predicted
probabilities graph in Figure 2 (A) shows a clear difference between high and low levels of
multinational experience. While the predicted probabilities do not change across the range of
international experience for firms with low multinational experience, there is a substantial
difference for firms with high multinational experience. While these firms have above 0.8
predicted probability for an equity entry if they have very little international experience, the
probability drops to 0.25 for firms with very high levels of international experience. This
difference is apparent in the marginal effects graph in Figure 2 (B): While international experience
has a non-significant marginal effect around zero for a firm with very little multinational
experience, international experience has a significant negative marginal effect on firms with high
levels of multinational experience. For instance, firms with an international to total sales ratio of

CH. 3. Entry Mode Choice and Performance of Nordic Firms
85
0.14 have a non-significant average marginal effect of international experience of -0.015 (p <
0.763). For comparison, firms with a ratio of 0.78 have a significant average marginal effect of
-0.15 (p < 0.001). In other words, increasing international experience by one standard deviation
for the multinational firms is associated with a drop in the probability of them making an equity
entry of 0.15. These latter mentioned firms have a negative effect of gaining additional
international experience that is ten times higher than for the former. This is a substantial
difference.
Again, the results turn out surprising. Even though evidence of a negative moderating effect is
found, the relationship between international experience and equity entries grows ever more
negative as multinational experience increases. For Nordic firms with a higher foreign to total
sales ratio, there is a substantial negative association between growing more internationally
experienced and choosing an equity entry.
In sum, the results showed support for H1b. A mostly significant negative effect that did not
change sign across the range of the predicted probabilities was indicative of a negative
moderating effect of multinational experience. Further analysis showed that there was a
substantial negative effect of multinational experience on the marginal effect of international
experience. This ever growing negative relationship was surprising as the background for
proposing H1b was that a positive effect would grow weaker, not negative. Thus, I find sufficient
evidence to indicate a negative moderating effect of multinational experience on the relationship
between international experience and equity mode choice.
5.2. Performance
I also examined firm performance in relation to the moderating effects of firm size and
multinational experience, respectively. I suggested that firms applying equity mode choice based
on interactions of firms and multinational experience, respectively, would, on average, show
superior performance than firms using other modes. I ran five models all of which were
significant (p < 0.001). Model 1 in Table III contained the control variables and model fit based
on Model 1 in Table I, Model 2 in Table II the main effects of the FSA-variables and the model
fit variables based on Model 2 in Table I etc.
In performance Model 2, many of the control variables were significantly related to
performance incl. the main variable multinational experience. The direction of most of the
relations is behaving as expected. For instance, cultural distance is significantly (p < 0.01)
negatively related to performance, while market potential was significantly (p < 0.001) positively
related. In addition, Danish (p < 0.05) and Norwegian (p < 0.01) firms tended to perform worse
than Swedish firms, and manufacturing firms tended to be significantly (p < 0.001) associated
with higher performance. Firms with higher multinational experience were also associated with
significantly (p < 0.01) higher performance. Note, however, that the practical significance of
most of these controls was low. For instance, firms entering riskier markets, both in terms of the
host country risk- and external uncertainty-measure, were associated with about 0.2 higher
performance. Considering that the performance-index runs from 1 to 10, this is a small practical
difference. On the other hand, the model fit variable in the main effects model had a
considerable effect size of 0.945, but was unreliable at an alpha of 10%.

CH. 3. Entry Mode Choice and Performance of Nordic Firms
86
Table II. Second-stage OLS regression on Performance
Variables Model 1 Model 2 Model 3 Model 4 Model 5
Service -0.626† -0.832** -0.962*** -0.812*** -0.802*** (0.328) (0.260) (0.264) (0.239) (0.239) Denmark -0.137 -0.629* -0.713* -0.685* -0.654* (0.665) (0.282) (0.280) (0.292) (0.292) Norway -0.064 -0.489† -0.625* -0.484† -0.496† (0.584) (0.296) (0.292) (0.270) (0.270) Technological intensity 0.092 0.145 0.183 0.155 0.161 (0.109) (0.111) (0.111) (0.105) (0.105) Cultural distance -0.256 -0.413** -0.508** -0.455** -0.429** (0.181) (0.149) (0.155) (0.140) (0.138) External uncertainty 0.072 0.250† 0.343* 0.276* 0.270* (0.297) (0.131) (0.138) (0.137) (0.137) Market potential 0.709*** 0.619*** 0.629*** 0.615*** 0.620*** (0.129) (0.114) (0.119) (0.115) (0.115) Family ownership -0.155 0.075 0.146 0.103 0.116 (0.354) (0.109) (0.117) (0.117) (0.118) Host country risk 0.216* 0.258* 0.260* 0.258* 0.252* (0.104) (0.104) (0.103) (0.103) (0.102) Post entry growth 0.181 0.175 0.156 0.196† 0.188† (0.114) (0.113) (0.113) (0.113) (0.113) International experience -0.055 -0.199 -0.023 -0.303 (0.188) (0.248) (0.174) (0.263) Multinational experience 0.328** 0.406** 0.389** 0.399** (0.124) (0.133) (0.126) (0.127) Firm size (log) -0.052 -0.189 -0.088 -0.104 (0.115) (0.119) (0.109) (0.110) International experience × 0.042 0.048 Firm size (log) (0.034) (0.034) International experience × -0.052 -0.107 Multinational experience (0.136) (0.141) Model fit (Control) -1.033 (2.035) Model fit (Main) 0.945 (0.903) Model fit (H2a) 2.041* (0.923) Model fit (H2b) 1.309 (0.850) Model fit (Full) 1.391 (0.851) λ 0.901 -0.315 -0.955† -0.549 -0.596 (1.218) (0.537) (0.546) (0.507) (0.506)
Standard errors in parentheses *** p<0.001, ** p<0.01, * p<0.05, † p<0.1

CH. 3. Entry Mode Choice and Performance of Nordic Firms
87
Table II. Second-stage OLS regression on Performance (Cont.)
Variables Model 1 Model 2 Model 3 Model 4 Model 5
Constant 6.280*** 6.045*** 6.382*** 6.095*** 6.084*** (0.517) (0.503) (0.489) (0.437) (0.437) Wald χ2 134.6*** 185*** 176.7*** 186.8*** 188.9*** N 250 250 250 250 250 Change χ2 model 1 50.35*** 42.07*** 52.21*** 54.32*** Change χ2 model 2 -8.287** 1.853 3.970
Standard errors in parentheses *** p<0.001, ** p<0.01, * p<0.05, † p<0.1
In performance model 3, I tested H2a to investigate whether firms adopting their entry mode in
accordance to the model including firm size as a moderator yielded higher performance. Indeed,
the model fit variable was significant (p < 0.05) and the size of its coefficient was substantial.
Because we correct for endogeneity, we may interpret this effect size as the average treatment
effect. Nordic firms whose entry mode could be predicted by the FSA-model, where the effect of
international experience had been moderated by firm size, on average, experienced 2.041 higher
performance than other Nordic firms. The 95% confidence interval spanned from 0.2322 to
3.8506. These results are evidence supporting H2a. Notably, λ was significant (p < 0.1) indicating
that the model was being corrected for unobservable characteristics related to mode choice and
performance.
In H2b, I suggested that firms whose entry mode could be predicted based on a model where
multinational experience was moderating the relationship between international experience and
equity mode choice would yield higher performance than the ones whose entry could not be
predicted. In performance model 4, I found some evidence to support this hypothesis. Even
though the effect size was considerable (1.3), the exact p-value was 0.124 signifying that there was
about a 12.4% chance that we had observed a treatment effect as large as this one by chance. The
95% confidence interval ranged from -0.35 to 2.97. Considering the size of the effect, I argue that
this provides some evidence for H2b.
5.3. Robustness
I assessed the robustness of my results in several ways. First, I followed Slangen and Hennart
(2008) and ran the performance models with each item separately showing results not
conceptually different from those reported in Table II. In addition, I used a principal component
factor analysis to compute factor scores, but results were very similar to the index scale used in
Table II.
A common issue when performing the two-step procedure without an extra exclusion
restriction is collinearity issues. The VIF-score for firm size (VIF = 13.55) and λ (VIF = 12.85)
showed signs of severe multicollinearity in the performance models. Because dropping firm size
may result in serious misspecification and biased results (Studenmund, 2010), I chose to keep the
variable in the model. Thus, one should not put too much faith into the standard errors and
therefore p-values for firm size in the performance-models as these might be inflated due to
collinearity. More important to the research questions, the model fit variables showed no

CH. 3. Entry Mode Choice and Performance of Nordic Firms
88
indication of severe multicollinearity (VIF < 2) and nor did any other model variables (VIF <
5.0).
I checked the performance models for linearity between performance and the main variables
of interest, normality of the error term, constant variance and influential observations. Residual
plots against the main variables showed no signs of violation of linearity. A kernel density
estimate based on the residuals and the Shapiro-Wilk W test (p = 0.58) showed no indications
that the normality assumption was violated and a Breusch-Pagan test could not reject the H0 of
constant variance (p = 0.87). Computing Cook’s D revealed 16 observations with d-values larger
than 4 divided by the number of observations. Inspection of these observations revealed no
obvious pattern in terms of the model variables. I reran the performance analysis excluding the
observations one by one while searching for changes in the estimated coefficients and p-values.
The largest change for the model fit variable happened in model 3 in the third decimal of the
standard errors, thus having no impact on the conclusions drawn above.
Checking for influential observations is a little more complicated in a probit model than in a
linear one. I followed Sarkar, Midi and Rana (2011) and plotted the predicted probabilities against
the computed deviance residuals and the change in χ2 when omitting an observation, respectively.
The deviance residuals revealed no potential outliers. When excluding sample observations one
by one, 95% of the changes in χ2 fell in the range -1.74 to 1.4. The most influential observation
was excluded and the models were rerun showing no reason to change the conclusions about the
hypothesized relationships. Examples of the plotted deviance residuals and change in χ2 from
model 3 Table I are available in Appendix (A.2.).
6. Conclusion and Limitations
The relationship between international experience and mode choice is among the most tested in
the international entry mode literature. Still, empirical tests have yet to produce consistent results
about how international experience is linked to the choice between equity and non-equity modes.
In this study, I suggest that the relationship between international experience and equity mode
choice is contingent on the size of the firm and the level of multinational experience, respectively.
Studying the entries of 250 Danish, Norwegian and Swedish firms, the empirical results suggest a
negative moderating effect of multinational experience while the evidence for a negative
moderating effect of firm size is somewhat weaker. Further, I find that entry mode models
adjusting for the moderating effect of firm size and multinational experience, respectively, are
associated with higher performance after firm entry.
These results provide interesting contributions and implications. First, the suggested
moderating effects provide one possible explanation for the inconsistent findings with regard to
the effect of international experience. These findings suggest that building FSAs through
multinational experience may shift the direct relationship between international experience and
equity mode choice from positive to negative. Maekelburger, Schwens and Kabst (2012) have
already provided evidence to suggest a negative interaction effect between international
experience and asset specificity, which is another source of obtaining FSAs (Collinson &
Rugman, 2008). In their study, Maekelburger, Schwens and Kabst (2012) found that the
relationship between having specific assets and equity mode choice changes from being positive
for low levels of asset specificity to negative for high levels of asset specificity. The results found

CH. 3. Entry Mode Choice and Performance of Nordic Firms
89
in this study are in line with this finding: When sources of FSAs through firm size and
multinational experience increase, the effect of international experience is negatively moderated.
Second, the findings in this study suggest sizable differences in average performance
depending on whether the Nordic firms adopt the adjusted FSA-models. Especially adjusting for
the moderating effect of firm size shows statistically and practically significant evidence for
positive effect on how the firms rated their performance. These findings shed light on the
surprisingly conflicting results in linking international experience and firm size to firm
performance. When adjusting the entry mode model for moderating effects, the treatment effect
of entry mode fit becomes substantial. This may explain why previous studies have found
difficulties empirically linking performance to experience- and firm size-based FSAs.
Third, the findings have practical implications for international Danish, Norwegian and
Swedish firms. For such firms, adopting an entry mode where the effect of international
experience is contingent on firm size and multinational experience may mean higher post-entry
performance. This suggests that managers should keep a keen focus on their FSAs built through
size and multinational experience when evaluating the impact the length and scope of their
international experience should have on their entry mode decision. In fact, the results suggest
that when large Nordic firms grow more internationally experienced they should to an increasing
degree adopt non-equity entry modes.
My study has some limitations that may form the basis for future studies. First, I only
investigated non-locational international experience. Researchers may want to dig deeper into
possible moderating effects concerning location-bound and mode experience. In this regard, it
may also be interesting to examine if it matters whether the experience accumulated through a
high foreign to total sales ratio is location, non-location-bound or a mixture of both. Second, this
study may suffer from some temporal issues with regard to the main variables. In reality, some
firms are likely to grow internationally experienced while they grow larger, possibly creating much
more complicated loop-effects between variables. This study found that the interaction between
international experience and firm size on equity mode choice was more complicated than a
negative moderating effect of firm size. Future studies may account for this in several ways. One
way would be to focus the sample frame on born global firms. These firms are likely to be small
in size, but many are likely to derive large parts of their foreign sales from foreign markets within
a short period of time without having accumulated much international experience (Clarke et al.,
2013). This approach may be accompanied by a longitudinal research design to help account for
the temporal ordering issue. Third, I followed previous research and adopted a dichotomous
equity mode conceptualization. Future research might benefit from expanding on the ideas in this
paper to other modes, e.g. by differentiating between JVs and WOSs. Last, my sample contained
only Danish, Norwegian and Swedish firms. I urge researchers to investigate the extent to which
my findings can be generalized to entries of non-Nordic firms.

CH. 3. Entry Mode Choice and Performance of Nordic Firms
90
References
Agarwal, S., & Ramaswami, S. N. (1992). Choice of foreign-market entry mode - impact of
ownership, location and internalization factors. Journal of International Business Studies, 23(1), 1-
27.
Ai, C. R., & Norton, E. C. (2003). Interaction terms in logit and probit models. Economics Letters,
80(1), 123-129.
Allison, P. D. (2002). Missing data. Thousand Oaks, CA: Sage.
Anderson, E., & Gatignon, H. (1986). Modes of foreign entry: A transaction cost analysis and
propositions. Journal of International Business Studies, 17(3), 1-26.
Blomstermo, A., Sharma, D. D., & Sallis, J. (2006). Choice of foreign market entry mode in
service firms. International Marketing Review, 23(2-3), 211-229.
Brewer, T. L. (1993). Government policies, market imperfections, and foreign direct investment.
Journal of International Business Studies, 24(1), 101-120.
Brockner, J. P., Siegel, J. P., Tyler, D. T., & Martin, C. (1997). When trust matters: The
moderating effect of outcome favorability. Administrative Science Quarterly, 42(3), 558-583.
Brouthers, K. D., & Bamossy, G. J. (2006). Post-formation processes in eastern and western
european joint ventures. Journal of Management Studies, 43(2), 203-229.
Brouthers, K. D., & Nakos, G. (2004). SME entry mode choice and performance: A transaction
cost perspective. Entrepreneurship-Theory and Practice, 28(3), 229-247.
Brouthers, K., Brouthers, L., & Werner, S. (2001). R&D mode choices in central and eastern
europe. Journal of Business Research, 52(1), 83-91.
Brouthers, K. D. (2002). Institutional, cultural and transaction cost influences on entry mode
choice and performance. Journal of International Business Studies, 33(2), 203-221.
Brouthers, K. D., & Brouthers, L. E. (2003). Why service and manufacturing entry mode choices
differ: The influence of transaction cost factors, risk and trust*. Journal of Management Studies,
40(5), 1179-1204.
Brouthers, K. D., Brouthers, L. E., & Werner, S. (2003). Transaction cost-enhanced entry mode
choices and firm performance. Strategic Management Journal, 24(12), 1239-1248.
Brouthers, K. D., Brouthers, L. E., & Werner, S. (2008a). Real options, international entry mode
choice and performance. Journal of Management Studies, 45(5), 936-960.

CH. 3. Entry Mode Choice and Performance of Nordic Firms
91
Brouthers, K. D., Brouthers, L. E., & Werner, S. (2008b). Resource-based advantages in an
international context. Journal of Management, 34(2), 189-217.
Brouthers, K. D., & Dikova, D. (2010). Acquisitions and real options: The greenfield alternative.
Journal of Management Studies, 47(6), 1048-1071.
Brouthers, L. E., Brouthers, K. D., & Werner, S. (2000). Perceived environmental uncertainty,
entry mode choice and satisfaction with EC-MNC performance. British Journal of Management,
11(3), 183-195.
Brouthers, L. E., Mukhopadhyay, S., Wilkinson, T. J., & Brouthers, K. D. (2009). International
market selection and subsidiary performance: A neural network approach. Journal of World
Business, 44(3), 262-273.
Buckley, P. J., & Casson, M. C. (1976). The future of multinational enterprise (1st ed.). New York:
Holmer & Meier Publishers.
Canabal, A., & White, G. O. (2008). Entry mode research: Past and future. International Business
Review, 17(3), 267-284.
Cavusgil, S. T., & Naor, J. (1987). Firm and management characteristics as discriminators of
export marketing activity. Journal of Business Research, 15(3), 221-235.
Cho, K. R., & Padmanabhan, P. (2005). Revisiting the role of cultural distance in MNC's foreign
ownership mode choice: The moderating effect of experience attributes. International Business
Review, 14(3), 307-324.
Clarke, J. E., Tamaschke, R., & Liesch, P. W. (2013). International experience in international
business research: A conceptualization and exploration of key themes. International Journal of
Management Reviews, 15(3), 1468-2370.
Claver, E., Rienda, L., & Quer, D. (2009). Family firms' international commitment the influence
of family-related factors. Family Business Review, 22(2), 125-135.
Cohen, W. M. (1996). Firm size and the nature of innovation within industries: The case of
process and products. Rand Review of Economics and Statistics, 78(2), 232-243.
Collinson, S., & Rugman, A. M. (2008). The regional nature of japanese multinational business.
Journal of International Business Studies, 39(2), 215-230.
Delios, A., & Beamish, P. W. (2001). Survival and profitability: The roles of experience and
intangible assets in foreign subsidiary performance. The Academy of Management Journal, 44(5),
1028-1038.

CH. 3. Entry Mode Choice and Performance of Nordic Firms
92
Dikova, D., & van Witteloostuijn, A. (2007). Foreign direct investment mode choice: Entry and
establishment modes in transition economies. Journal of International Business Studies, 38(6),
1013-1033.
Dikova, D. (2009). Performance of foreign subsidiaries: Does psychic distance matter?
International Business Review, 18(1), 38-49.
Dow, D., & Ferencikova, S. (2010). More than just national cultural distance: Testing new
distance scales on FDI in slovakia. International Business Review, 19(1), 46-58.
Dow, D., & Larimo, J. (2009). Challenging the conceptualization and measurement of distance
and international experience in entry mode choice research. Journal of International Marketing,
17(2), 74-98.
Elango, B., & Chen, S. (2012). Learning to manage risks in international R&D joint ventures
through ownership decisions. Management Decision, 50(7-8), 1425-1444.
Eriksson, K., Johanson, J., Majkgard, A., & Sharma, D. (1997). Experiential knowledge and cost
in the internationalization process. Journal of International Business Studies, 28(2), 337-360.
Erramilli, M. K., & Rao, C. P. (1990). Choice of foreign market entry modes by service firms:
Role of market knowledge. Management International Review, 30(2), 135-150.
Erramilli, M. K. (1991). The experience factor in foreign market entry behavior of service firms.
Journal of International Business Studies, 22(3), 479-501.
Gaba, V., Pan, Y., & Ungson, G. (2002). Timing of entry in international market: An empirical
study of U.S. Fortune 500 firms in china. Journal of International Business Studies, 33(1), 39-55.
Gatignon, H., & Anderson, E. (1988). The multinational corporation's degree of control over
foreign subsidiaries: An empirical test of a transaction cost explanation. Journal of Law,
Economics, & Organization, 4(2), 305-336.
Geringer, J. M., Beamish, P. W., & daCosta, R. C. (1989). Diversification strategy and
internationalization: Implications for MNE performance. Strategic Management Journal, 10(2),
109-119.
Goerzen, A., & Beamish, P. W. (2005). The effect of alliance network diversity on multinational
performance. Strategic Management Journal, 26(4), 333-354.
Grant, R. M., Jammine, A. P., & Thomas, H. (1988). Diversity, diversification, and profitability
among british manufacturing companies. Academy of Management Journal, 31(4), 771-801.
Harman, H. H. (1967). Modern factor analysis (1st ed.). Chicago: University of Chacago Press.
CH. 3. Entry Mode Choice and Performance of Nordic Firms
93
Hennart, J. F. (2007). The theoretical rationale for a multinationality-performance relationship.
Management International Review, 47(3), 423-452.
Hennart, J., & Slangen, A. H. L. (2008). Do foreign greenfields outperform foreign acquisitions
or vice-versa? an institutional perspective. Journal of Management Studies, 45(7), 1301-1328.
Ji, J., & Dimitratos, P. (2013). Confucian dynamism and dunning's framework: Direct and
moderation associations in internationalized chinese private firms. Journal of Business Research,
66(12), 2375-2382.
Johanson, J., & Vahlne, J. (1977). The internationalization process of the firm-A model of
knowledge development and increasing foreign market commitments. Journal of International
Business Studies, 8(1), 23-32.
Jung, J., Beamish, P. W., & Goerzen, A. (2008). FDI ownership strategy: A japanese-US MNE
comparison. Management International Review, 48(5), 491-524.
Kim, W. C., & Hwang, P. (1992). Global strategy and multinationals' entry mode choice. Journal of
International Business Studies, 23(1), 29-53.
Kim, W. C., Hwang, P., & Burgers, W. P. (1989). Multinationals' diversification and the risk-
return trade-off. Strategic Management Journal, 10(1), 45-57.
Kirca, A. H., Hult, G. T. M., Deligonul, S., Perryy, M. Z., & Cavusgil, S. T. (2012). A multilevel
examination of the drivers of firm multinationality: A meta-analysis. Journal of Management,
38(2), 502-530.
Kobrin, S. J. (1991). An empirical analysis of the determinants of global integration. Strategic
Management Journal, 12(1), 17-31.
Kogut, B. (1985). Designing global strategies: Profiting from operation flexibility. Sloan
Management Review, 27(1), 27-38.
Kogut, B., & Singh, H. (1988). The effect of national culture on the choice of entry mode. Journal
of International Business Studies, 19(3)
Kotabe, M., Martin, X., & Domoto, H. (2003). Gaining from vertical relationships: Knowledge
transfer, relationship duration, and supplier performance in the U.S. and japanese
automotive industries. Strategic Management Journal, 24(4), 293-316.
Kuo, A., Kao, M., Chang, Y., & Chiu, C. (2012). The influence of international experience on
entry mode choice: Difference between family and non-family firms. European Management
Journal, 30(3), 248-263.

CH. 3. Entry Mode Choice and Performance of Nordic Firms
94
Larimo, J. (2003a). Form of investment by nordic firms in world markets. Journal of Business
Research, 56(10), 791-803.
Larimo, J. (2003b). Form of investment by nordic firms in world markets. Journal of Business
Research, 56(10), 791-803.
Leiblein, M. J. (2003). The choice of organizational governance form and performance:
Predictions from transaction cost, resource-based, and real options theories. Journal of
Management, 29(6), 937-961.
Liang, X., Musteen, M., & Datta, D. K. (2009). Strategic orientation and the choice of foreign
market entry mode an empirical examination. Management International Review, 49(3), 269-290.
Lopez-Duarte, C., & Vidal-Suarez, M. M. (2013). Cultural distance and the choice between
wholly owned subsidiaries and joint ventures. Journal of Business Research, 66(11), 2252-2261.
Lu, J., & Beamish, P. W. (2004). International diversification and firm performance: The S-curve
hypothesis. Academy of Management Journal, 47(4), 598-609.
Luo, Y. (1999). Time-base experience and international expansion: The case of an emerging
economy. Journal of Management Studies, 36(4), 505-534.
Luo, Y., & Peng, M. W. (1999). Learning to compete in a transition economy: Experience,
environment and performance. Journal of International Business Studies, 30(2), 269-295.
Maekelburger, B., Schwens, C., & Kabst, R. (2012). Asset specificity and foreign market entry
mode choice of small and medium-sized enterprises: The moderating influence of
knowledge safeguards and institutional safeguards. Journal of International Business Studies,
43(5), 458-476.
Magnusson, P., Westjohn, S. A., & Boggs, D. J. (2009). Order-of-entry effects for service firms in
developing markets: An examination of multinational advertising agencies. Journal of
International Marketing, 17(2), 23-41.
Nakos, G., Brouthers, K. D., & Dimitratos, P. (2014). International alliances with competitors
and non-competitors: The disparate impact on SME international performance. Strategic
Entrepreneurship Journal, 8(2), 167-182.
Nakos, G., & Brouthers, K. D. (2002). Entry mode choice of SMEs in central and eastern
europe. Entrepreneurship Theory and Practice, 27(1), 47-63.
Norton, E. C., Wang, H., & Ai, C. (2004). Computing interaction effects and standard errors in
logit and probit models. Stata Journal, 4(2), 154-167.

CH. 3. Entry Mode Choice and Performance of Nordic Firms
95
Ogasavara, M. H., & Hoshino, Y. (2007). The impact of ownership, internalization, and entry
mode on japanese subsidiaries' performance in brazil. Japan and the World Economy, 19(1), 1-
25.
Padmanabhan, P., & Cho, K. R. (1996). Ownership strategy for a foreign affiliate: An empirical
investigation of japanese firms. Management International Review, 36(1), 45-65.
Pearce, R., & Papanastassiou, M. (1996). R&D networks and innovation: Decentralized product
development in multinational enterprises. R&D, 26(4), 315-333.
Pinho, J. C. (2007). The impact of ownership - location-specific advantages and managerial
characteristics on SME foreign entry mode choices. International Marketing Review, 24(6), 715-
734.
Podsakoff, P. M., MacKenzie, S. B., Lee, J. Y., & Podsakoff, N. P. (2003). Common method
biases in behavioral research: A critical review of the literature and recommended remedies.
Journal of Applied Psychology, 88(5), 879-903.
Podsakoff, P. M., & Organ, D. W. (1986). Self-reports in organizational research: Problems and
prospects. Journal of Management, 12(4), 531-544.
Rasheed, H. (2005). Foreign entry mode and performance: The moderating effects of
environment. Journal of Small Business Management, 43(1), 41-54..x
Rhee, J. H., Kim, J. W., & Lee, J. -. (2014). Interaction effects of formal and social controls on
business-to-business performance. Journal of Business Research, 67(10), 2123-2131.
Rogelberg, S. G., & Stanton, J. M. (2007). Introduction: Understanding and dealing with
organizational survey nonresponse. Organizational Research Methods, 10(2), 195-209.
Ronen, S., & Shenkar, O. (1985). Clustering countries on the attitudinal dimensions: A review
and synthesis. Academy of Management Review, 10(3), 435-454.
Rugman, A. M., & Verbeke, A. (2001). Subsidiary-specific advantages in multinational enterprises.
Strategic Management Journal, 22(3), 237-250.
Rugman, A. M., & Verbeke, A. (2003). Extending the theory of the multinational enterprise:
Internalization and strategic management perspectives. Journal of International Business Studies,
34(2), 125-137.
Rugman, A. M., & Verbeke, A. (2008). The theory and practice of regional strategy: A response
to osegowitsch and sammartino. Journal of International Business Studies, 39(2), 326-332.
Sarkar, S. H., Midi, H., & Rana, S. (2011). Detection of outliers and influential observations in
binary logistic regression: An empirical study. Journal of Applied Sciences, 11(1), 26-35.

CH. 3. Entry Mode Choice and Performance of Nordic Firms
96
Schwens, C., Eiche, J., & Kabst, R. (2011). The moderating impact of informal institutional
distance and formal institutional risk on SME entry mode choice. Journal of Management
Studies, 48(2), 330-351.
Shaver, J. M. (1998). Accounting for endogeneity when assessing strategy performance: Does
entry mode choice affect FDI survival? Management Science, 44(4), pp. 571-585.
Shetty, Y. K. (1979). Managing the multinational corporation: European and american styles.
Management International Review, 19(3), 39-48.
Siripaisalpipat, P., & Hoshino, Y. (2000). Firm-specific advantages, entry modes, and
performance of japanese FDI in thailand. Japan and the World Economy, 12(1), 33-48.
Studenmund, A. H. (2010). Using econometrics: A practical guide (6th ed.). Lebanon, Indiana: Prentice
Hall.
Tallman, S., & Li, J. (1996). Effects of international diversity and product diversity on the
performance of multinational firms. The Academy of Management Journal, 39(1), 179-196.
Thomassen, S., & Benito, G. (2009). The costs of governance in international companies.
International Business Review, 18(3), 292-304.
Tihanyi, L., Griffith, D. A., & Russell, C. J. (2005). The effect of cultural distance on entry mode
choice, international diversification, and MNE performance: A meta-analysis. Journal of
International Business Studies, 36(3), 270-283.
Tsang, E. (1997). Choice of international technology transfer mode: A resource-based view.
Management International Review, 37(2), 151-68.
Venkatraman, N., & Ramanujam, V. (1987). Measurement of business economic performance:
An examination of method convergence. Journal of Management, 13(1), 14-30.
Wiersema, M. F., & Bowen, H. P. (2009). The use of limited dependent variable techniques in
strategy research: Issues and methods. Strategic Management Journal, 30(6), 679-692.
Wilkinson, T. J., Peng, G. Z., Brouthers, L. E., & Beamish, P. W. (2008). The diminishing effect
of cultural distance on subsidiary control. Journal of International Management, 14(2), 93-107.
Wu, C. -. (2011). Global marketing strategy modeling of high tech products. Journal of Business
Research, 64(11), 1229-1233.
Zhao, H., Luo, Y., & Taewon Suh. (2004). Transaction cost determinants and ownership-based
entry mode choice: A meta-analytical review. Journal of International Business Studies, 35(6), 524-
544.

CH. 3. Entry Mode Choice and Performance of Nordic Firms
97
Appendix
A1. Interaction plots
A2. Outlier plots

CH. 3. Entry Mode Choice and Performance of Nordic Firms
98
A3. Correlation table –Entry mode choice 1 2 3 4 5 6 7 8 9 10 11
1. Non-equity vs
equity
2. International experience
0.13*
3. Firm size 0.10 0.47***
4. Multinational experience
-0.01 0.38*** 0.20**
5. Service 0.04 -0.15* -0.04 -0.10
6. Denmark 0.07 0.06 -0.09 0.10 0.05
7. Norway 0.04 0.01 0.05 -0.09 -0.08 -0.48***
8. Technological
intensity
-0.04 -0.10 -0.03 -0.03 0.03 -0.04 0.07
9. Cultural distance -0.02 0.18** -0.07 0.20** -0.09 0.08 -0.20** -0.08
10. External
uncertainty
-0.14* 0.18** 0.00 0.19** 0.04 0.06 0.03 -0.05 0.31***
11. Market potential 0.13* 0.15* 0.12† 0.19** -0.05 -0.06 0.02 -0.03 0.00 -0.11†
12. Family ownership -0.16* -0.09 -0.07 -0.02 -0.01 0.00 0.01 0.01 0.03 0.02 -0.11†
† p<0.1, * p<0.05, ** p<0.01, *** p<0.001

CH. 3. Entry Mode Choice and Performance of Nordic Firms
99
A4. Correlation table - Performance 1 2 3 4 5 6 7 8 9 10 11
1. Performance
2. Model fit (Control) 0.08
3. Model fit (Main) 0.10 0.71***
4. Model fit (H2a) 0.11† 0.72*** 0.98***
5. Model fit (H2b) 0.11† 0.73*** 0.93*** 0.95***
6. Model fit 5 0.11† 0.73*** 0.94*** 0.97*** 0.98***
7. Host country risk 0.05 0.02 -0.02 0.01 0.03 0.00
8. Post entry growth 0.29*** 0.04 0.07 0.09 0.04 0.06 -0.10
9. International experience
0.08 0.07 0.13* 0.15* 0.13* 0.12* 0.12* 0.15*
10. Multinational
experience
0.18** -0.00 -0.04 -0.04 -0.07 -0.07 0.03 0.09 0.38***
11. Firm size 0.06 0.07 0.15* 0.15* 0.15* 0.15* -0.02 0.06 0.47*** 0.20**
12. Service -0.20** 0.08 0.06 0.05 0.03 0.03 0.02 -0.19** -0.15* -0.10 -0.04
13. Denmark -0.18** 0.16* 0.05 0.05 0.09 0.06 0.01 -0.21*** 0.06 0.10 -0.09
14. Norway 0.06 0.06 0.10 0.07 0.04 0.06 -0.01 0.04 0.01 -0.09 0.05
15. Technological
intensity
0.04 -0.01 -0.10 -0.09 -0.09 -0.09 -0.06 -0.07 -0.10 -0.03 -0.03
16. Cultural distance -0.10 0.00 0.02 0.05 0.03 0.02 0.28*** 0.05 0.18** 0.20** -0.07
17. External
uncertainty
-0.02 -0.22*** -0.12† -0.12† -0.13* -0.14* 0.17** -0.08 0.18** 0.19** 0.00
18. Market potential 0.42*** 0.11† 0.11† 0.11† 0.09 0.09 -0.08 0.45*** 0.09 0.13* 0.11†
19. Family ownership -0.06 -0.34*** -0.20** -0.21*** -0.22*** -0.23*** 0.00 -0.08 -0.09 -0.02 -0.07
† p<0.1, * p<0.05, ** p<0.01, *** p<0.001

CH. 3. Entry Mode Choice and Performance of Nordic Firms
100
A4. Correlation table – Performance (Cont.)
12 13 14 15 16 17 18
12. Service 13. Denmark 0.05 14. Norway -0.08 -0.48*** 15. Technological intensity
0.03 -0.04 0.07
16. Cultural distance -0.09 0.08 -0.20** -0.08 17. External uncertainty
0.04 0.06 0.03 -0.05 0.31***
18. Market potential -0.06 -0.19** 0.08 0.00 -0.05 -0.21*** 19. Family ownership
-0.01 0.00 0.01 0.01 0.03 0.02 -0.16*
† p<0.1, * p<0.05, ** p<0.01, *** p<0.001

CH. 3. Entry Mode Choice and Performance of Nordic Firms
101
A5. Summary statistics Mean Standard
deviation Lower bound
CI (95%) Upper bound
CI (95%)
Performance 5.671 .11478 5.444934 5.897066
Non-equity vs equity .568 .03139 .5061727 .6298273
Model fit (Control) .456 .03156 .3938349 .5181651
Model fit (Main) .432 .03139 .3701727 .4938273
Model fit (H2a) .436 .03143 .3741062 .4978938
Model fit (H2b) .444 .03149 .3819855 .5060145
Model fit 5 .436 .03143 .3741062 .4978938
Host country risk 1.72 .06291 1.596088 1.843912
Post entry growth 4.58 .07843 4.425532 4.734468
International experience 22.626 1.42469 19.82002 25.43198
Multinational experience .46596 .02073 .4251328 .5067872
Firm size 12295.09 3728.27 4959.677 19630.51
Service .708 .02881 .6512491 .7647509
Denmark .324 .02966 .2655869 .3824131
Norway .328 .02975 .2694016 .3865984
Technological intensity .15164 .01286 .126319 .176961
Cultural distance 2.786253 .12091 2.548117 3.024389
External uncertainty 3.888 .10185 3.687402 4.088598
Market potential 4.858 .09181 4.677177 5.038823
Family ownership .332 .02984 .2732211 .3907789
DEPARTMENT OF ECONOMICS AND BUSINESS AARHUS UNIVERSITY
SCHOOL OF BUSINESS AND SOCIAL SCIENCES www.econ.au.dk
PhD Theses since 1 July 2011 2011-4 Anders Bredahl Kock: Forecasting and Oracle Efficient Econometrics 2011-5 Christian Bach: The Game of Risk 2011-6 Stefan Holst Bache: Quantile Regression: Three Econometric Studies 2011:12 Bisheng Du: Essays on Advance Demand Information, Prioritization and Real Options
in Inventory Management 2011:13 Christian Gormsen Schmidt: Exploring the Barriers to Globalization 2011:16 Dewi Fitriasari: Analyses of Social and Environmental Reporting as a Practice of
Accountability to Stakeholders 2011:22 Sanne Hiller: Essays on International Trade and Migration: Firm Behavior, Networks
and Barriers to Trade 2012-1 Johannes Tang Kristensen: From Determinants of Low Birthweight to Factor-Based
Macroeconomic Forecasting 2012-2 Karina Hjortshøj Kjeldsen: Routing and Scheduling in Liner Shipping 2012-3 Soheil Abginehchi: Essays on Inventory Control in Presence of Multiple Sourcing 2012-4 Zhenjiang Qin: Essays on Heterogeneous Beliefs, Public Information, and Asset
Pricing 2012-5 Lasse Frisgaard Gunnersen: Income Redistribution Policies 2012-6 Miriam Wüst: Essays on early investments in child health 2012-7 Yukai Yang: Modelling Nonlinear Vector Economic Time Series 2012-8 Lene Kjærsgaard: Empirical Essays of Active Labor Market Policy on Employment 2012-9 Henrik Nørholm: Structured Retail Products and Return Predictability 2012-10 Signe Frederiksen: Empirical Essays on Placements in Outside Home Care

2012-11 Mateusz P. Dziubinski: Essays on Financial Econometrics and Derivatives Pricing 2012-12 Jens Riis Andersen: Option Games under Incomplete Information 2012-13 Margit Malmmose: The Role of Management Accounting in New Public Management Reforms: Implications in a Socio-Political Health Care Context 2012-14 Laurent Callot: Large Panels and High-dimensional VAR 2012-15 Christian Rix-Nielsen: Strategic Investment 2013-1 Kenneth Lykke Sørensen: Essays on Wage Determination 2013-2 Tue Rauff Lind Christensen: Network Design Problems with Piecewise Linear Cost
Functions
2013-3 Dominyka Sakalauskaite: A Challenge for Experts: Auditors, Forensic Specialists and the Detection of Fraud 2013-4 Rune Bysted: Essays on Innovative Work Behavior 2013-5 Mikkel Nørlem Hermansen: Longer Human Lifespan and the Retirement Decision 2013-6 Jannie H.G. Kristoffersen: Empirical Essays on Economics of Education 2013-7 Mark Strøm Kristoffersen: Essays on Economic Policies over the Business Cycle 2013-8 Philipp Meinen: Essays on Firms in International Trade 2013-9 Cédric Gorinas: Essays on Marginalization and Integration of Immigrants and Young Criminals – A Labour Economics Perspective 2013-10 Ina Charlotte Jäkel: Product Quality, Trade Policy, and Voter Preferences: Essays on
International Trade 2013-11 Anna Gerstrøm: World Disruption - How Bankers Reconstruct the Financial Crisis: Essays on Interpretation 2013-12 Paola Andrea Barrientos Quiroga: Essays on Development Economics 2013-13 Peter Bodnar: Essays on Warehouse Operations 2013-14 Rune Vammen Lesner: Essays on Determinants of Inequality 2013-15 Peter Arendorf Bache: Firms and International Trade 2013-16 Anders Laugesen: On Complementarities, Heterogeneous Firms, and International Trade
2013-17 Anders Bruun Jonassen: Regression Discontinuity Analyses of the Disincentive Effects of Increasing Social Assistance 2014-1 David Sloth Pedersen: A Journey into the Dark Arts of Quantitative Finance 2014-2 Martin Schultz-Nielsen: Optimal Corporate Investments and Capital Structure 2014-3 Lukas Bach: Routing and Scheduling Problems - Optimization using Exact and Heuristic Methods 2014-4 Tanja Groth: Regulatory impacts in relation to a renewable fuel CHP technology:
A financial and socioeconomic analysis 2014-5 Niels Strange Hansen: Forecasting Based on Unobserved Variables 2014-6 Ritwik Banerjee: Economics of Misbehavior 2014-7 Christina Annette Gravert: Giving and Taking – Essays in Experimental Economics 2014-8 Astrid Hanghøj: Papers in purchasing and supply management: A capability-based perspective 2014-9 Nima Nonejad: Essays in Applied Bayesian Particle and Markov Chain Monte Carlo Techniques in Time Series Econometrics 2014-10 Tine L. Mundbjerg Eriksen: Essays on Bullying: an Economist’s Perspective 2014-11 Sashka Dimova: Essays on Job Search Assistance 2014-12 Rasmus Tangsgaard Varneskov: Econometric Analysis of Volatility in Financial Additive Noise Models 2015-1 Anne Floor Brix: Estimation of Continuous Time Models Driven by Lévy Processes 2015-2 Kasper Vinther Olesen: Realizing Conditional Distributions and Coherence Across Financial Asset Classes 2015-3 Manuel Sebastian Lukas: Estimation and Model Specification for Econometric Forecasting 2015-4 Sofie Theilade Nyland Brodersen: Essays on Job Search Assistance and Labor Market Outcomes 2015-5 Jesper Nydam Wulff: Empirical Research in Foreign Market Entry Mode

ISBN: 9788793195134