Embed Size (px)
Citation preview

Empirical Evaluation
Susanne Eklund
IS247 Presentation
22 March 2002

What is Empirical Evaluation?
Why do it? Be sure we’re improving on current methods
Be sure a new vis actually helps people complete tasks and doesn’t just look pretty
Empirical:
based on observation or experience (M-W.com)

Why Do It, Continued
Learn what works about particular systems• Pull together best parts of different systems
• Or, figure out when to use one system over another
• A step back from building entirely new systems
• (CS system-syndrome)
Is it the same as “usability evaluation”?
• Partly…need both usability and good Vis packaged together
• Hidden problems: usability does not always equal accuracy/effectiveness, and vice versa

How do we judge value of a Vis?*
Different measures• Impact on community as a whole, influential ideas• Assistance to people in the tasks they care about
Strong View:• Unless a new technique or tool helps people in some kind of problem or task,
it doesn’t have any value
Broaden Thinking:• Sometimes the chain of influence can be long and drawn out• System X influences System Y influences System Z which is incorporated
into a practical tool that is of true value to people• This is what research is all about (typically)
*From slides by John Stasko, Prof at GeorgiaTech

Evaluation of InfoVis v. GUIs
Techniques seem similar• Measure usability of UI
• Harder to measure success of a vis without actual real use? Often, knowledge of domain is needed.
• InfoVis can be “usable” but not “successful” – example in Bullseye search study
Graham et al Methodology seems sound• Articulating methodology assures all steps are
followed

Evaluation Techniques
Control Field Experiment - Taxonomy?
Field Observation - Hypertext
Authenticity
Formal Lab Experiment - XML3D
Lab Observation - Metadata?

Spectrum of Measures
Lots of ways to measure effectiveness of system. Does a variety of measures = better test?
Quantitative Qualitative
ClickStream Analysis Observation
Think Aloud
Measures of Task Success
Task Timing
Satisfaction Surveys
System Adoption Rate

Which technique is best?
Arguments for quantitative: Observers aren’t biased Results based, easier to compare You can gather a lot of very rich data
Arguments for qualitative: Gauge thought processes Understand why users do what they do Avoid small sample problem
IMHO, the best studies use a combination of both. Qualitative to understand “why”, and quantitative to confirm observations.

The Studies
Papers Required for This Week Ease of use for 2D and 3D information visualizations of web content -
Risden et al
Examining the usability of web site search - SIMS
Toward a methodology for developing visualizations - Graham et al
Additional Studies in Reader Evaluating the effectiveness of visual user interfaces for information
retrieval - Sutcliffe et al
Hypertext authoring and visualization -Pohl and Purgathofer

Risden et al – XML3D
An initial examination of ease of use for 2D and 3D information visualizations of web content. • Risden, Czerwinski, Munzner, and Cook. International
Journal of Human Computer Studies, Special Issue on Empirical evaluation of information visualizations, Vol. 53, No. 5, November 1, 2000.

Study Design
Target Users Webmasters and web content producers
Males (according to their participant demographics…)
Task Domain Adding content to a directory scheme
Searching for appropriate existing categories
Browsing for places to put new categories
Some categories have multiple parents

The Interfaces
XML3D Hyperbolic space Focus+Context
Handles multiple-inheritance hierarchies
Selected node moves to focus point at center
Accompanied by 2D lists of parents, children, sibling nodes
High visibility of location in hierarchy

XML3D

The Interfaces
Snap.com Category directory similar to Yahoo!
Limited visibility of hierarchy
Multiple parents indicated but not explained
Collapsible Tree Browser Similar to Windows Explorer
Can only show one parent at a time

Procedure
Controlled for learning effects
Participants received “a small amount of training” for each interface
Had participants complete a set of four types of tasks
Didn’t appear to use observation data. • Did they even have people present?
Relied on system log data to answer questions about how people used system.

Variables
Independent Variables: Interface used
Task type
Dependent Variables: Time to complete task
Consistency (correctness?) of answers
Frequency of use of XML3D elements
“Satisfaction survey”

Results
Speed Analysis Snap and Tree lumped into “2D” and compared to
XML3D (was this a good decision?)
XML3D faster than 2D overall
Existing category faster than new one overall
XML3D only significantly faster on existing category tasks
No speed/”accuracy” tradeoff
Can we think of a better metric than speed?

Results, con’t
Use of 2D list on 3DXML System 2D list was used frequently for new category tasks (and these
weren’t significantly faster with XML3D)
Existing category tasks used either 3D or 2D list
Because they didn’t use “think aloud” protocol, they don’t know why participants used one or the other.

What they mean
When we’re looking for something specific in a sea of related items…
This 3D vis seemed to be effective.
When we’re looking for a place to put the new item…
2D lists may work better….OR people use lists for harder task b/c they’re familiar
The best solution may be to have both methods available.

+/- of Study
+ Focused on a specific domain and user group
Used skilled users to minimize individual skill differences
- Did not isolate effect of 3D visualization
Felt like it was comparing apples and oranges
Relied on time, “accuracy”, and behavior measurements only. Did not effectively answer “why”. Ineffective post-test survey.

The SIMS Search Study
English, Hearst, Sinha, Swearingen, and Yee Examining the Usability of Web Site Search, submitted
for publication, 2002.
Goals of Study: Find out how people use different search interfaces for
different tasks
See how people use metadata
Use this information to improve website navigation and search

Improving the Middlegame
Good “scent”
Help user explore
Get sense of collection
Narrow or broaden results
Revise query as needed
Opening: Enter query
MidGame: Revise, filter
EndGame: Review results

Study Design – 3 Searches
Basic Search Keyword-based
Results in laundry list
No way to refine
Try it out

Enhanced Search
User selects facet values High degree of control
Easy to get 0 results
Results appear in laundry list
Try it

Browse
Yahoo-like category browsing
Preview of number of recipes in each child category
Can refine by different facets – causes query preview to update
Breadcrumb allows easy backtrack

The Study
9 participants
Controlled for:• Interest (all like to cook, personal goals)
• Motivation (recipe booklet)
• Stress (site preview)
• Learning effect (random order)

Tasks
Find a dish 3x, once with each method• Using personal scenarios
Structured search tasks• Find specific items using specific interfaces
Hypothetical tasks• To see which interface they would pick

Results Perception of keywords v. metadata is off Enhanced search requires more constraints and often
produced 0 results (27%) Satisfaction was high for all methods, but especially so
for Browse and Enhanced Users prefer Enhanced for high-constraint tasks, Browse
for low-constraint tasks Basic search is good entry point, but doesn’t offer mid-
game Enhanced would benefit from dynamic results count…as
well as ability to refine Browse has strong middle-game

Contributions
Users recognize that different search interfaces are better for certain tasks
Metadata search can be a valuable way to improve searching and results management

+/- of Study
+ Novel procedure controls for many factors (learning,
motivation, training)
“Think-aloud” and probing questions get at WHY people do things
-
No cons (it’s a SIMS paper!)
BUT it might benefit from repetition of study with different subject matter and/or hierarchical facets to see if conclusions hold
AND would be interesting to measure recall/precision with a dataset where there is more of a “right answer” concept?
Taxonomy System
Graham, Kennedy, and Benyon. Towards a methodology for developing visualizations.
International Journal of Human Computer Studies, Special Issue on Empirical evaluation of information visualizations, Vol. 53, No. 5, November 1, 2000.

Problem
No single methodology for developing a good visualization. We have HCI methods for interfaces but no set method for InfoVis systems.
We design for the way people work, yet tech usually changes work habits.
Therefore we must have *more than 1* round of testing and redesign
Requirements
Artifacts
Possibilities
Work

Development Methodology
1. Get requirements from users. Make task storyboard.
2. Show storyboard to users and confirm correct interpretation.
3. Test visualization to be sure it gives users what they need. Identify needed functionality.
4. Test extra functionality and general interface usability.
5. Test overall interface usability.
6. Test whole product in a statistically rigorous manner to obtain satisfaction ratings, error rates, etc.
This is not so different from regular UI design practice. *But it clearly separates Vis testing from UI testing.

Domain: Taxonomy
Landscape What is a taxonomy?
All published taxonomies are “right”
Work requires looking at multiple taxonomies and comparing categorizations

System Goals
Manage accumulation of old taxonomies
Identify relationships between different taxonomies
Perform new tasks that weren’t possible with paper system

About the tests
Highly qualitative
Lots of interaction with actual end users
Informal interviews for requirements
“Budget”
Iterative
Accuracy and discovery rather than speed

Procedures
Step 1: Requirements• Informal interview with taxonomy experts.
Step 2: Storyboarding• Confirm that concepts behind vis are right
Step 3: Test of vis • Exploration of two different visualizations with a
given set of tasks

Set Model

Graph Model

Procedures, con’t
Result of 1st test: • Users prefer mental model over the data model (!!)
Step 4: Usability Test• Test new functionality and UI usability
• Scenarios instead of tasks
• Accuracy of vis and whether UI got in way
• Bigger scale
Step 5/6: Further refined usability tests

Results / Conclusions
Fixed several usability bugs Found model that best suits users Functionality requirements change as
users see possibilities (Don’t use low-fi videocameras in test)
Would be nice to see how product worked in real world.

Pros/Cons of Paper
+ I had a good feel about methodology
Involvement of users from start to end
Product evolved
-
? Suggestions for any cons?

Optional Reading: Bullseye
Sutcliffe, Ennis, and Hu: Evaluating the effectiveness of visual user interfaces for information retrieval.
Evaluation of “Integrated Thesaurus-Results Browsing System” with Bullseye visualization of clusters
Questions:• How effective is this system for retrieval?
• How effectively do visual metaphors represent system model or search functionality to user?

Everything on ONE SCREEN
QUERY ENTRYFORM
CONFUSINGTHESAURUS TREE
ARTICLE ABSTRACTIn very tiny print
SEMI-CONFUSINGBULLSEYE OPTION SETTINGS
BULLSEYE DISPLAYWITH AUTO-CLUSTERING
MORE SETTINGS
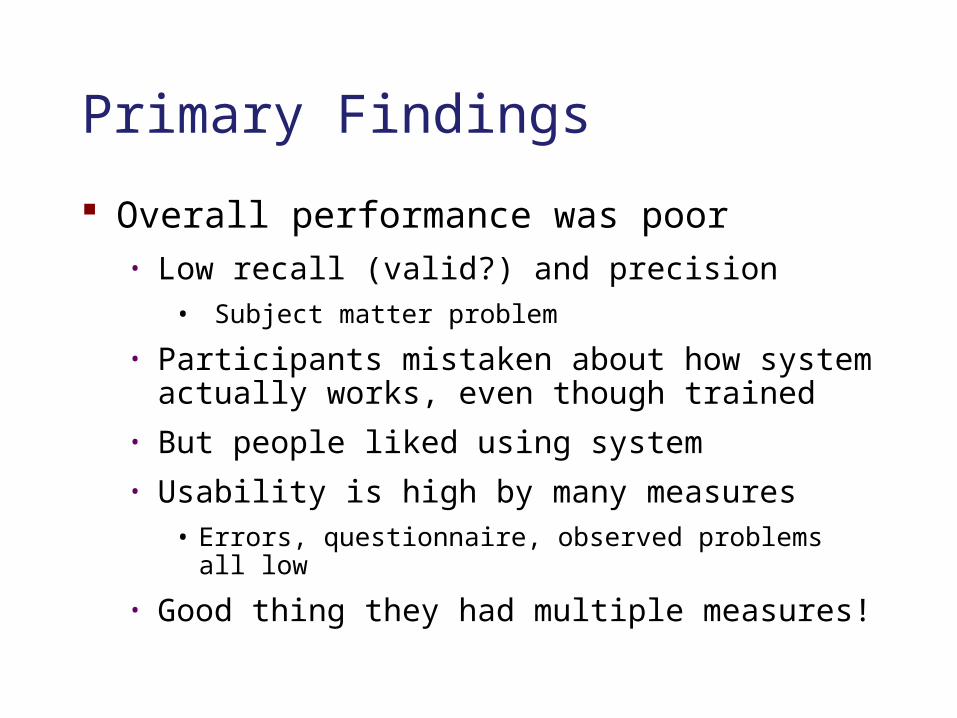
Primary Findings
Overall performance was poor• Low recall (valid?) and precision
• Subject matter problem
• Participants mistaken about how system actually works, even though trained
• But people liked using system• Usability is high by many measures
• Errors, questionnaire, observed problems all low
• Good thing they had multiple measures!
Conclusions
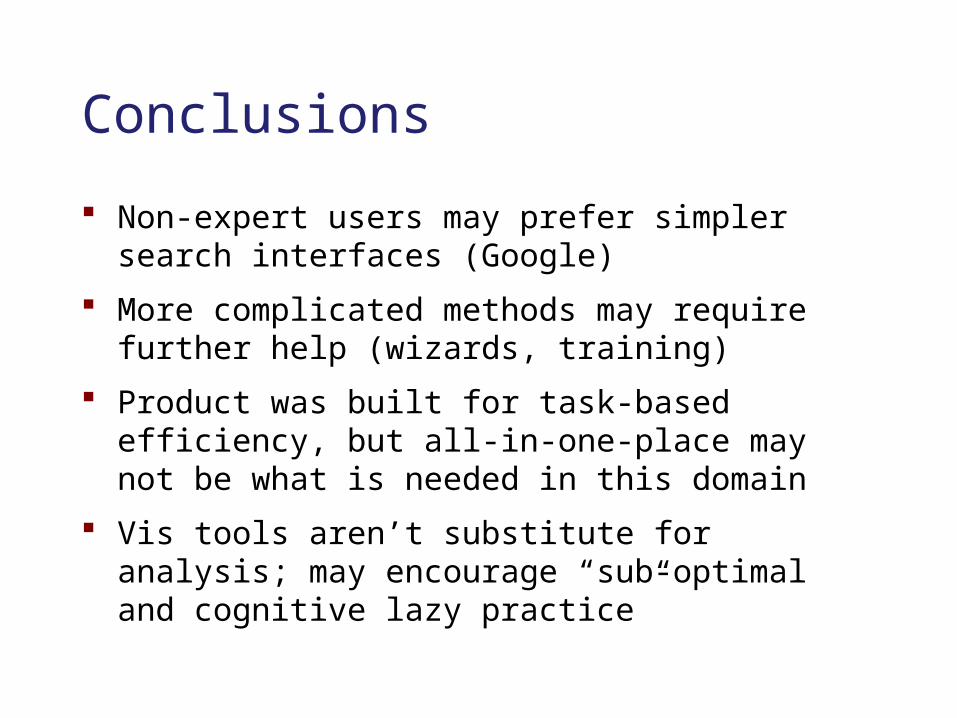
Non-expert users may prefer simpler search interfaces (Google)
More complicated methods may require further help (wizards, training)
Product was built for task-based efficiency, but all-in-one-place may not be what is needed in this domain
Vis tools aren’t substitute for analysis; may encourage “sub-optimal and cognitive lazy practice”
Things to learn from this paper
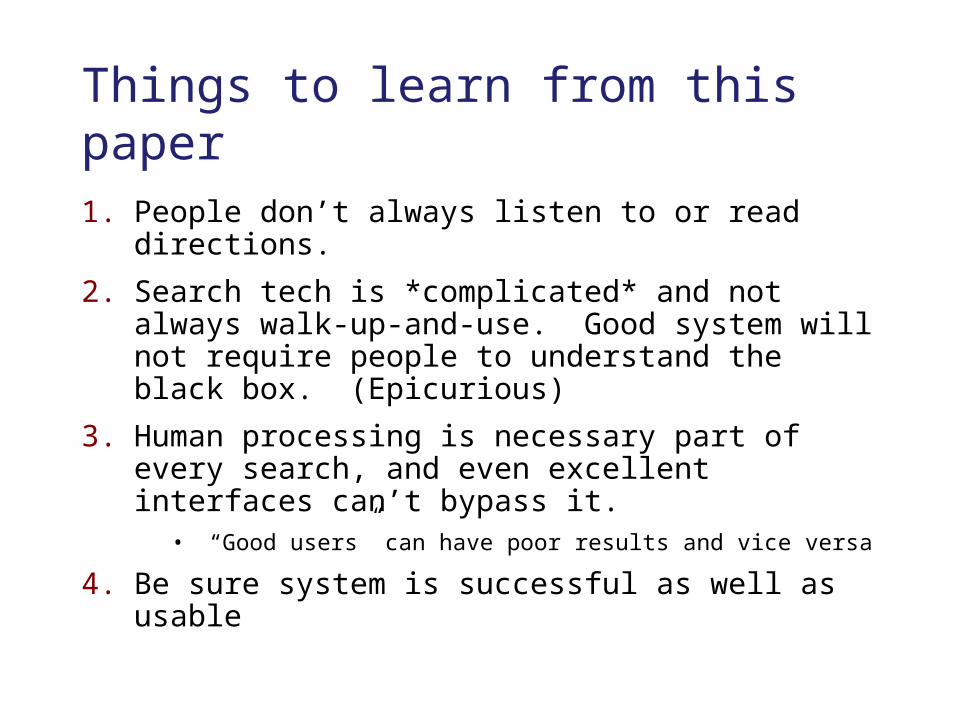
1. People don’t always listen to or read directions.
2. Search tech is *complicated* and not always walk-up-and-use. Good system will not require people to understand the black box. (Epicurious)
3. Human processing is necessary part of every search, and even excellent interfaces can’t bypass it.
• “Good users” can have poor results and vice versa
4. Be sure system is successful as well as usable

Optional Reading: Hypertext
Hypertext = HyperCard-based system Does the writing process change with use of hypertext
tools? Does vis of info structures play a role in authoring? Field Study– gathered data from students who used
system to write papers
Text here, much like a regular text editor, except you can add links to
other nodes.
Node Editor View Overview Map

Findings
“Windowing” technique shows major blocks of activity • Nice technique?
Individual variation of activity distribution is high (edit, make node, move, delete, other) • No single pattern
Resulting overview maps—and documents—vary greatly in structure and organization
Overall writers prefer hierarchy

Their Conclusions Conclusions are weak, partly b/c study had no
comparative elements• Also because analysis of resulting documents sounded
subjective and vague• “Students used this feature a lot, therefore it is
important”• “Results indicate that visualizing information structure
is one of the most important new features of hyptertext systems”
Study would benefit from:• Analysis of hypertext authoring *without* map• Structured comparison of docs written with and
without maps
What To Remember From Today’s Class
Evaluate early and often?
Test both value of Vis and ease of use, separately if possible. Don’t forget accuracy.
Be creative with test methodology.
Gather both qualitative and quantitative data, and use them to confirm each other.
Control for as much as you can.
Match measures to purpose of system.
Remember that even systems that don’t seem to work may have something to offer to research!

Thanks!
Questions? Comments?