Embed Size (px)
Citation preview

Empirical Analysis of the Nature of Competition in a Laundry-Cleaning Additive Market
MARZIA FREO and GIORGIO TASSINARI
Department of Statistical Sciences University of Bologna
Via Belle Arti 41 – 40126 Bologna ITALY
[email protected] [email protected]
Abstract: - This study examines the nature of competition between the two leading brands of a national small size market by estimating short- and long-term competitive reactions via a Structural VAR (SVAR) model. The primary findings indicate how the two competitors react, which marketing instruments are used, and when competitive reactions affect cross- and own-sales. The empirical results suggest that competitive reactions are either simple or complex, whether through advertising or through promotions, but the reactions exhibit dynamic patterns that are quite symmetric across brands. The results further suggest that the follower weakly reacts to a leader’s assault and that the nature of competition in this market deviates from symmetric behaviours toward a dominant-fringe pattern in which the leader firm is retaliatory, and the follower is accommodating or passive. Key-Words: - SVAR model, nature of competition, competitive reactions, market response, small market, impulse response functions.
1 Introduction Analysis of competition between firms, including the spectrum of their actions and reactions within the market, is central to understanding the origin of competitive advantage and its relevant consequences on strategy, performance, and industry development. Much empirical literature has addressed these reactions and the reasons why they differ across firms and/or markets. There is strong interest in the direction and intensity of the response of a defender brand that is competing with an attacker brand that initiates a move via impulsive use of marketing instruments (either promotions or advertising). The reaction is deemed “simple” if the defender uses the same instrument as the attacker and “multiple” if the defender uses a different instrument. In regard to the sign, a reaction is retaliatory (i.e., competitive) if the defender increases its marketing effort in response to an attack and is accommodating (i.e., cooperative) if the defender decreases its marketing effort in response to an attack. Alternatively, the reaction is passive (i.e., independent) if no response occurs.
This topic, as outlined by Leeflang [11], has been investigated in recent years using different models with focus on different types of application area. Regarding the direction of model types, competitive behaviour may be examined in the area of dynamic games and within the framework of new empirical
industrial organisation literature [7, 23, 1]; alternatively, this may be achieved by employing econometric approaches of variable levels of complexity to model, either single-handedly or jointly, competitive reactions and demand functions [10, 18, 8]. On the direction of applications types, a strand of empirical studies on competitive responsiveness analyses the competition between brands in a specific category, usually for globalised markets [9, 19, 15, 7, 5, 16]. The alternative strand offers additional studies that extensively investigate a large number of served markets to make empirical generalisations [13, 12, 18].
In this paper, we seek to analyse the nature of competition between two leading brands of a laundry-cleaning additive in a national market from an econometric standpoint. This paper contributes to the understanding of the dynamics of competition between firms from multiple perspectives. First, we intentionally analyse a market of limited geographical size, rather than a globalised market, to contribute a small market case-study to the literature. Second, we analyse competitive actions by specifying a Structural Vector-Auto-Regressive (SVAR) model [2], which extends the standard econometric specification of the VAR model. Through estimation via the SVAR, and the derived Impulse Response Functions (IRFs), we analyse the short- and long-term competition between the two
WSEAS TRANSACTIONS on BUSINESS and ECONOMICS Marzia Freo, Giorgio Tassinari
E-ISSN: 2224-2899 209 Volume 11, 2014

major brands. Third, we examine whether reactions are symmetric (i.e., whether both firms respond to the actions of its rival in a similar fashion) or asymmetric. In the case of asymmetry, if one firm reacts while the other does not, a leader-follower (Stackelberg) pattern occurs. Conversely, a dominant-fringe pattern occurs if one firm is retaliatory and the other is accommodating [17].
The main research questions addressed in this work are summarised below:
1. What marketing efforts does the defender use to react to assaults by the attacker?
2. Does the use of promotions instead of advertising affect the sign and the intensity of such reactions?
3. Are the follower’s reactions as strong as those of the leader? In other words, is the competitive conduct of the two competitors symmetric or asymmetric?
4. What is the nature of competition between the two competitors? To answer these questions, the paper is structured as follows. Section 2 reviews previous research on competitive interactions and summarises the primary empirical findings. Section 3 provides an overview of the SVAR model. Section 4 presents the data and estimation results, and section 5 concludes the paper.
2 Brief review of the literature on competitive interactions Competition dynamics is an area of intensive research in marketing and business strategy literature. This topic has been investigated in many studies, which may be categorised into two main approaches: game-theoretical and/or econometric models. The interested reader may refer to Leeflang [11] for a historical review of models that specify competitive reaction effects according to an evolutionary model building perspective. Concerning the theoretical-game field, competitive interdependencies are investigated through descriptive game theory using the structure-conduct-performance paradigm of the New Empirical Industrial Organization (NEIO) theory [7, 23, 1]. Alternatively, from an econometric perspective, more recent contributions either provide matrices, which describe a variety of reactions and help management diagnose competition by combining demand equations and competitive reaction functions [10], or they simultaneously model demand equations and competitive reactions through VAR specifications [18, 8] that explicitly
account for dynamic interactions. Both approaches have both drawbacks and advantages. Studies derived from game-theoretic modelling suffer from ‘context dependence’ [20, 21] because they are “rather specific in that the behaviour that emerges in equilibrium depends on the precise state of the environment” [14, p.132]. At the same time, the success of game-theoretic modelling is recognised as far as explaining how a firm strategically interacts with its rivals [22]. The problem of context dependence is overcome by using long time-series data and econometric specifications of the firms involved [4]. At the same time, from the econometric standpoint, “each manager treats the competitor’s strategies as given and computes his or her best own response” [11, p.137], while all the managers simultaneously move and competitor’s strategies may never be considered as given in the marketplace.
Empirical studies on competitive responsiveness may be further classified according to categories or markets of application. Several studies have focused on competition in specific markets. Among others, Kadyali [9] and Sudhir et al. [19] address the conduct of two major players in the U.S. photographic film industry. Shankar et al. [15] examines competition in the computer printer market, which includes the market leader, Hewlett Packard, and its followers, Epson, Canon, and Lexmark. Gasmi et al. [7] investigated the conduct of Coke and Pepsi, while Dahr et al. [5] investigated market structure and strategic pricing for leading brands sold by Coca-Cola Company and PepsiCo. Shin et al. [16] examined the asymmetric conduct of Intel and AMD in the microprocessor industry. It is worth noting that all of these contributions produced empirical evidence on the nature of competition between brands with a globalised market. Some other studies performed extensive investigations of a large number of served markets to make empirical generalisations [13, 12, 18]. By investigating over 90 industrial businesses, Ramaswamy et al. [13] observed a variety of patterns of competitive marketing and used a multinomial logit model to determine the reasons for these differences. Empirical results outline the main roles played by the served market characteristics and brand relative power. Putsis and Dahr [12] categorise competitive interactions of brands in 58 categories and found that the pattern of competition is complex and heavily influenced by the characteristics of the category. Steenkamp et al. [18] performed a large scale study covering 1200 brands of more than 400 frequently purchased consumer goods categories; by using models of time-series analysis, they examined
WSEAS TRANSACTIONS on BUSINESS and ECONOMICS Marzia Freo, Giorgio Tassinari
E-ISSN: 2224-2899 210 Volume 11, 2014

the primary factors affecting the intensity of competitive reactions. By analysing short- and long-term reactions, they found that the most common response was a lack of reaction. When reactions did occur, there were usually more reactions to promotion than to advertising. Simple reactions were usually retaliatory, whilst multiple reactions were either retaliatory or accommodating. The reaction responses were stronger when the attacker brand is more powerful, when the power asymmetry between attacker and defender was lower, or when the category was less concentrated and the inter-purchase time was higher.
As the purpose of the present study is to describe the nature of competition in the market, rather than to provide managers an instrument to plan marketing strategies, we chose to examine the nature of competition along the econometric approach by jointly examining competitive reactions and market responses.
3 Overview of the SVAR model Multiple time-series models can be used when the researcher wish to account for the dynamic effects of marketing instruments on sales and competitive reactions to distinguish between simultaneous, delayed and cumulated effects. As these models accommodate sequences of interrelated moves, they require the availability of long data series. To account for all dynamic interactions, a VAR model, which is a multivariate model for which each series is regressed on its lags and lags of all the series jointly considered, may be specified. Let y� be the k-dimensional vector of time series y� ��y��, y��, … , y�′ according to a VAR(p) and it is modelled as follows: �� � Φ � � ������ � � � ������ � �� (1) where ��, ..., �� are � � � parameters matrices of lagged values of y, � is a � � 1 vector of the deterministic components, Φ is the � � � matrix of the deterministic components parameters and �� is the error components vector with ���� � 0, ������
′ � � Σ, ������′ � � 0 if � !. An alternative
representation is given by ��"�� � Φ � � �� (2)
where ��" � #$ % ��" % � % ��"� is the matrix polynomial in the lag operator L.
Supposing the variables are jointly covariance stationary, the process �� has a dual Vector Moving Average (VMA) representation given by �� � ��"��
Φ � � ��"���� �Ψ�" � � C�"�� (3) where '�" � #$ � ∑ ')")∞
)*+ and Ψ�" � #$ �∑ Ψ)")∞
)*+ are matrix polynomial in the lag operator L, Ψ) are � � � m matrices of the parameters of deterministic components, C) are � � � contains the parameters ,-.), which are called impulse response functions because they describe the effect on variable l of a one-time unit increase (impulse) in the innovation of variable i after j times if everything else is held constant.
Because no a priori assumptions are imposed, fitting a VAR allows the data to speak for themselves in regard to their dynamic interactions. In this setting, the matrix Σ contains all information about contemporaneous correlations When Σ is diagonal, as it implies that the instantaneous correlations among the elements of �� are zero, the VMA representation enables the response of each variable to be measured as an impulse arising from a prior input variable. For example, the response �-�/) of the l-th element of ��/), at time t+j, to a unitary stochastic impulse in the i-th element of ��/), is measured by the coefficient ,-.) of the C) matrix of the VMA specification. Whenever Σ is not diagonal, we cannot make causal interpretations of the results without imposing restrictions on Σ to re-formulate the VAR with uncorrelated shocks (i.e., with a diagonal variance-covariance matrix).
An answer to this aim is given by specifying SVAR models, which imposes restrictions on the VAR specification. Restrictions may be short- or long-run, whether they are imposed on Σ or on cumulated impulse response functions. Amisano and Giannini [2] present an extensive overview on the different ways of imposing such restrictions. SVAR have been applied many times in economics but notably few in marketing [6, 3, 16].
Short-run restrictions work as follows. Let A and B represent two squared, non-singular matrices, such that ��� � 01� (4) where 1�~3�0, #4 ��1�1�
′ � � 0 if � !. Thus the (1b) may be rewritten
WSEAS TRANSACTIONS on BUSINESS and ECONOMICS Marzia Freo, Giorgio Tassinari
E-ISSN: 2224-2899 211 Volume 11, 2014
���"�� % �Φ � � 01� (5) and the VMA representation becomes �� � ��"��
Φ � � ��"�����01� (6) �� � Ψ�" � � ∑ C5)
∞
)*+ 1��) (7) where C5) contains the coefficients ,̃-.), which are the new impulse response functions.
This specification induces a transformation on the �� disturbance vector in the (4), which can be conceived as being generated by linear combination of independent (ortho-normal) disturbances 1�.
Thus, the specification enables us to explicitly model the instantaneous relations between endogenous variables. In fact, the matrix A in (4) explains the instantaneous interactions. The impulse response functions, given by estimating the effect of these ortho-normal shocks at each time, trace the combined results over a chain of reactions initiated by a single shock. The cumulative responses are given by accumulating effects of these ortho-normal shocks protracted in time. SVAR models are therefore suitable to measure immediate simultaneous market responses and competitive reactions, as well as for assessing the implications of complex feedback.
4 Data and estimations Data for the two brands with the highest market shares in the Italian laundry-cleaning additive market are considered. Data provided by Zenith Optimedia were collected weekly from June 2004 to May 2011 (362 observations).
Within the laundry-cleaning additive category, the eight largest national brands for the Italian market were monitored. The first two brands collectively represent 60% of the sales in this category, which represents a concentrated oligopoly. We will assign leader and follower labels to brand 1 and 2, respectively. In Table 1, variable sales, advertising pressures and promotional efforts are summarised.
Sales are measured by weekly sales in deflated values, and advertising pressures are measured in Gross Rating Points (GRPs), which are given by the sum of percents of the target audience reached by advertisements during a specified period. Promotional pressure is approximated by the percent of promotional sales, which may be considered an indirect measure of the effort spent on promotions.
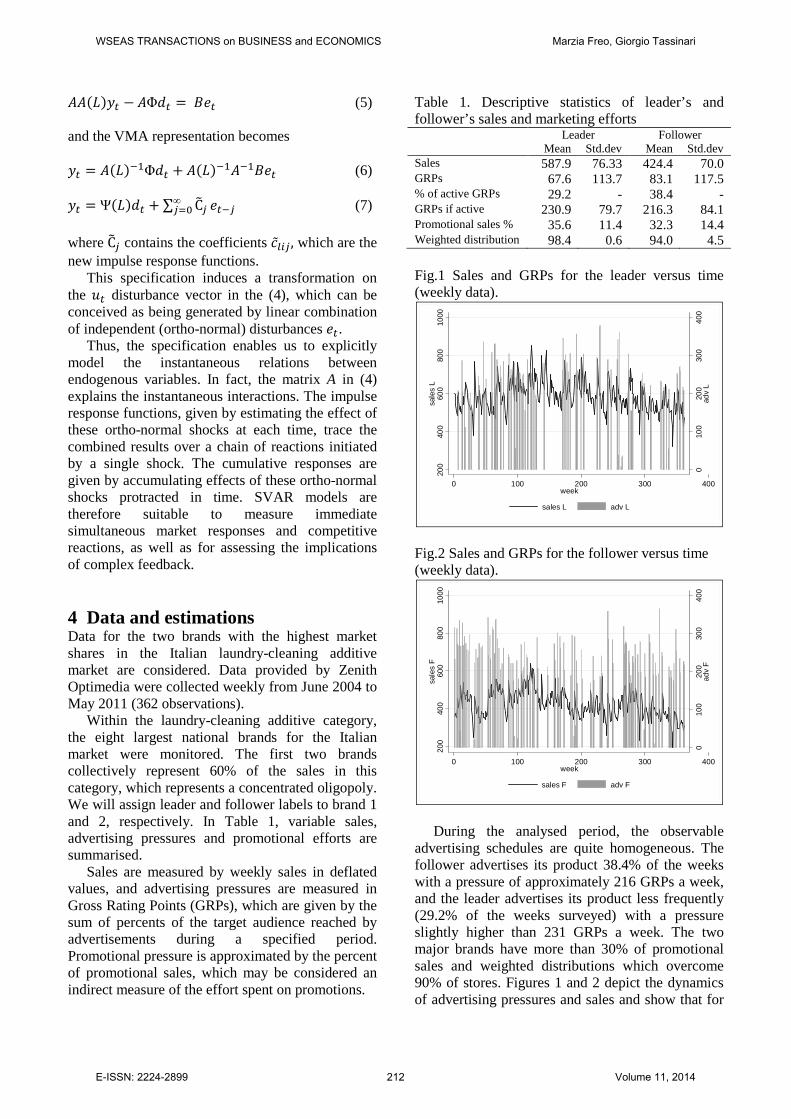
Table 1. Descriptive statistics of leader’s and follower’s sales and marketing efforts Leader Follower Mean Std.dev Mean Std.dev Sales 587.9 76.33 424.4 70.0 GRPs 67.6 113.7 83.1 117.5 % of active GRPs 29.2 - 38.4 - GRPs if active 230.9 79.7 216.3 84.1 Promotional sales % 35.6 11.4 32.3 14.4 Weighted distribution 98.4 0.6 94.0 4.5 Fig.1 Sales and GRPs for the leader versus time (weekly data).
Fig.2 Sales and GRPs for the follower versus time (weekly data).
During the analysed period, the observable advertising schedules are quite homogeneous. The follower advertises its product 38.4% of the weeks with a pressure of approximately 216 GRPs a week, and the leader advertises its product less frequently (29.2% of the weeks surveyed) with a pressure slightly higher than 231 GRPs a week. The two major brands have more than 30% of promotional sales and weighted distributions which overcome 90% of stores. Figures 1 and 2 depict the dynamics of advertising pressures and sales and show that for
010
020
030
040
0ad
v L
200
400
600
800
1000
sale
s L
0 100 200 300 400week
sales L adv L
010
020
030
040
0ad
v F
200
400
600
800
1000
sale
s F
0 100 200 300 400week
sales F adv F
WSEAS TRANSACTIONS on BUSINESS and ECONOMICS Marzia Freo, Giorgio Tassinari
E-ISSN: 2224-2899 212 Volume 11, 2014

each brand the advertising pressure is followed by increases of sales levels, which decays over time.
We estimate that, for the dataset in question with maximum likelihood, a six equation VAR model where the endogenous variables are sales, the percent share of promotional sales and advertising GRPs of leader and follower brands. The specification also includes intercepts and monthly dummies as exogenous variables. The choice of lag specification is jointly guided in light of informative criteria and of the standard residual-based misspecification analysis. After estimating many specifications, we selected a VAR(12) specification. Table 2 Wald test on lag exclusion. lag χ2 Prob > χ2 lag χ2 Prob > χ2 1 767.1 0.000 8 62.2 0.004 2 168.5 0.000 10 74.6 0.000 3 85.8 0.000 11 75.2 0.000 4 63.0 0.004 12 56.5 0.016 7 68.2 0.001
Table 3 Tests of Normality, skewness and kurtosis. (p-values) Variable Normality Skewness Kurtosis L# sales 0.008 0.022 0.037 F§ sales 0.619 0.527 0.455 L advertising 0.000 0.000 0.182 F advertising 0.015 0.019 0.090 L promotional sales 0.136 0.093 0.278 F promotional sales 0.161 0.943 0.056 All series 0.000
#L:=leader §F:=follower *significant at 95%
The lag order choice of a VAR with p=12 means that autocorrelations have been retrieved at 3 months lags, which makes sense if we consider that the analysed product may be stockpiled and is characterised by a long inter-purchase time. To gain degrees of freedom for estimation, some lags have been excluded on the basis of results of the Wald tests for lag exclusion. We may exclude from the specification lags 5, 6 and 9, while all the other lags are all significant (Tab. 2). The chosen specification satisfies the stability condition, as all the eigenvalues lie inside the unit circle. The residuals are not auto-correlated, according to the Lagrange Multiplier test until the lag of order 12, and are not jointly normally distributed (Tab. 3). In fact, the normality hypothesis over residuals was not rejected for three out of six series, whereas normality hypotheses were rejected for advertisings series and leader sales. As a whole, the proposed model overcomes the specification analysis.
Afterwards, the structural relations of (4) to (6) are identified by imposing restrictions on matrices A and B. Matrix B is specified as diagonal because, in the present framework, disturbances are simply assumed as idiosyncratic shocks, not having any a priori knowledge about their interactions. In matrix A, the variables are ordered in the system to account for the cascade of transmission mechanisms of the impulse and to impose regular sales last in the sequence, as a priori knowledge of endogeneity makes intuitive sense and are the analysed elements. Thus, first within marketing instruments, and then within sales, the variables are ordered from less to more caused series in terms of Granger-exogeneity test statistics (Tab. 4). The imposed order is: follower’s advertising and promotional sales, leader’s promotional sales and advertising, and then leader’s sales followed by follower’s sales.
The SVAR parameters of matrices A and B are estimated by FIML, assuming the innovations are multivariate normal. The log-likelihood is maximised by the method of scoring, where the gradient and expected information matrix are evaluated analytically. See Amisano and Giannini [2] for the analytical expressions of derivatives. The final structure of matrix A (Table 5) has been obtained by starting from the specification of A as a lower triangular matrix and successively deleting coefficients not significantly different from zero. The LR test does not reject the identification restrictions. Table 4 Granger-causality tests (H0: variable in column does not Granger-cause variable in row)
Sales L#
Sales F§
Adv. L
Adv. F
Prom L
Prom F
Sales L - 55.0* 16.9* 5.7* 25.2* 15.2 Sales F 23.5* - 14.9 6.3 19.4* 23.1* Adv. L 19.7* 44.0* - 9.9 9.8 21.1* Adv. F 13.6 9.1 23.9* - 18.7* 9.7 Pro. L 23.0* 32.5* 21.7* 9.8 - 12.5* Pro. F 14.6 41.9* 12.1 2.9 14.4 - ALL 128.6* 171.3* 92.2* 47.1 92.2* 74.9* #L:=leader §F:=follower *significant at 95%
Table 5 Instantaneous coefficients (Matrix A) from to
Adv. F§ Prom. F Prom. L# Adv. L Sales L
Adv. F 1 0 0 0 0 Prom. F 0 1 0 0 0 Prom. L -0.007* 0 1 0 0 Adv. L 0 0 0 1 0 Sales L 0.032* 0 3.912* 0.072* 1 Sales F 0.118* 1.886* -1.986* -0.036* -0.427* #L:=leader §F:=follower * significant at 95% LR test for over-identification: χ2(6)= 8.1 Probability:0.230
WSEAS TRANSACTIONS on BUSINESS and ECONOMICS Marzia Freo, Giorgio Tassinari
E-ISSN: 2224-2899 213 Volume 11, 2014

We find (Tab. 5) that all coefficients of competitive reactions are not significant with the exclusion of a significant decrease in promotional sales of leader in response to an advertising pressure by the follower, while sales simultaneously react to both own- and cross-marketing efforts. Promotional effects at time 0, impressed either by the leader or by the follower, show the expected signs: positive own sales and negative competitor sales. Instead, asymmetric responses may be retrieved with respect to advertising. In fact, adverting pressure on the follower’s product has significant positive effects on follower’s sales, but significant and negative effects on leader’s sales. Furthermore, advertising pressure on the leader’s product significantly and positively affects both the leader’s and follower’s sales. Finally, shocks to the leader’s sales improve even the follower’s sales.
The initial feedbacks, which are described by impulse response functions at the first four lags, are presented in Table 6. Among competitive reactions,
only the follower’s advertising implies significant negative reactions, whereas the leader, acting as defender, accommodates for these changes by reacting through promotional sales during the following month. In fact, when the leader defends itself through advertising, it switches off the advertising pressure in the first weeks and then switches advertising on again in the third week (even if it produces no significant effect). In regard to the market responses in the first weeks, when promotion sales of one brand are shocked, it is initially observed the expected promotional bump that is followed by a diminishing carryover effect that results from the stockpiling of product. The opposite pattern interferes with the sales of the competitor as an initial decrease is followed by a recovery of sales. Advertising implies a positive impact on the sales of advertised brand and a temporary negative impact on sales of the competitor’s brand.
Table 6 Impulse response functions of competitive reactions (standard errors in parentheses).. Reactions of leader via Reactions of follower via advertising promotions advertising promotions to attacks of follower via to attacks of leader via
advertising promotions advertising promotions advertising promotions advertising promotions 1 0.000 0.000 -0.83 0.000 0.000 0.000 0.000 0.000 (0.00) (0.00) (0.42) (0.00) (0.00) (0.00) (0.00) (0.00)
2 -18.25 -4.969 -1.191 0.302 -0.112 -3.725 -0.557 -0.57 (5.90) (5.75) (0.54) (0.45) (6.56) (6.68) (0.38) (0.39)
3 2.599 -1.348 -0.928 0.602 -2.477 -3.637 -0.456 0.067 (6.09) (5.89) (0.55) (0.54) (6.48) (6.35) (0.50) (0.50)
4 2.525 -6.652 -0.867 0.658 4.082 -3.842 -0.555 0.259 (6.24) (5.84) (0.57) (0.54) (6.64) (6.23) (0.52) (0.49)
Table 7 Impulse response functions of market responses (standard errors in parentheses). Responses of follower’s sales Responses of leader’s sales to own to competitor’s to own to competitor’s advertising promotions advertising promotions advertising promotions advertising promotions
1 15.455 12.562 -2.450 -0.465 30.330 7.185 0.443 0.000 (1.50) (1.25) (1.38) (1.38) (2.10) (1.78) (2.39) (0.00)
2 10.566 10.733 0.074 -1.608 19.718 10.216 -5.925 2.362 (2.09) (2.06) (2.02) (1.99) (2.79) (2.67) (2.94) (2.63)
3 2.646 -2.562 1.369 4.401 -0.564 8.287 -7.100 1.695 (2.26) (2.21) (2.13) (2.16) (2.87) (2.93) (3.06) (2.98)
4 0.964 -5.683 -0.159 4.783 -4.170 5.540 -1.853 0.117 (2.35) (2.23) (2.10) (2.23) (2.85) (3.03) (3.18) (3.00)
The accumulated competitive reactions to promotional sales and advertising impulses are shown in Figure 3. The accumulated responses are plotted without confidence intervals, which are usually very large and often include zero such that
the results are often not significant yet interesting in term of qualitative findings. The competitive reactions to promotions are symmetric across brands and either simple (i.e., promotion itself in response to an attack via promotion itself), or complex (i.e.,
WSEAS TRANSACTIONS on BUSINESS and ECONOMICS Marzia Freo, Giorgio Tassinari
E-ISSN: 2224-2899 214 Volume 11, 2014

providing a response to an attack via another instrument) (Fig. 3: Panel C and B, respectively). Simple reactions are retaliatory, in that defenders respond to promotional attacks by increasing promotions. Complex reactions are accommodating, in that defenders respond to promotional attacks by decreasing advertising pressure. A lower level of symmetry may be observed when looking at competitive reactions to pressures on advertising. Simple reactions to advertising are symmetric (Fig. 3: Panel A). When the attacker increases advertising expenditure, reactions of the defender are absent or negative during the first weeks and become positive thereafter. Over the long-term, reactions to advertising may be classified as accommodating. Complex reactions of promotional sales to advertising pressure are always negative, and therefore accommodating, when the leader acts as the defender. When the follower acts as defender, its
responses to advertising pressures are initially negative and become positive in the following weeks and are therefore retaliatory (Fig. 3: panel D).
In summary, simple reactions are found to be symmetric and accommodating to advertising whilst they are symmetric and retaliatory to promotions. Complex reactions tend to be of the accommodating type. In fact, complex reactions to both advertising and promotions are all accommodating unless the assault is driven by the leader through advertising. Moreover, in three out of four cases (Fig. 3: panel A, C, D), reactions driven by the leader to assaults of the follower are more intense than reactions by the follower to leader’s assaults. Conversely, the follower reacts weakly to the leader’s assault with the exception of the strong decrease of advertising pressure in response to a promotional attack by the leader.
Fig.3 Accumulated competitive reactions. (Accumulated impulse response functions).
As a whole, competitive reactions (either simple
or complex, either accommodating or retaliatory) show dynamic patterns that are symmetric across brands. The follower nearly always exhibits
reactions weaker than the leader, and the main deviation from these homogeneous behaviours is determined by the way the follower uses advertising. On one side, the follower strongly
Panel A
-30
-20
-10
010
2030
0 5 10 15lead
adv F -> adv L adv L -> adv F
-60
-50
-40
-30
-20
-10
0
0 5 10 15lead
ps F -> adv L ps L -> adv F
Panel B
Panel C
-50
510
15
0 5 10 15lead
ps F -> ps L ps L -> ps F
Panel D
-15
-10
-50
5
0 5 10 15lead
adv F -> ps L adv L -> ps F
WSEAS TRANSACTIONS on BUSINESS and ECONOMICS Marzia Freo, Giorgio Tassinari
E-ISSN: 2224-2899 215 Volume 11, 2014

decreases its advertising pressure when attacked through promotions; conversely when the follower moves an assault through advertising, the leader reacts by significantly decreasing its marketing efforts. In Figure 4, the accumulated impulse response functions of sales are traced. Advertising effects are confirmed as positive when accumulated responses are considered. Leader’s advertising induces positive responses from its own sales as well as sales of the competitor. Advertising by the follower produces increases only its own sales, so we surmise that advertising by the leader primarily affects the sales of the whole category (Fig. 4: panel A and B). The leader’s promotions induce positive responses from its own sales and negative impacts on the competitor’s sales, while the follower’s promotions induce a positive initial response of its own sales, which in a second time decreases to negative cumulated values (Fig. C: panel C and D). It is worth noting that one impulse in the follower’s
promotions does not cut the leader’s sales. Additionally, the competitive cross-effects of sales show asymmetric behaviours as the follower’s sales increase with the leader’s sales, while the opposite is not true.
By accounting for all the dynamic feedbacks across series, we observed a large variety of reactions and responses even for this small-size category. We found evidence for simple retaliatory reactions through promotions and simple accommodating reactions through advertising. Complex reactions were more retaliatory than accommodating. In most cases, reactions are symmetric and the stronger reactions are the ones opposed by the leading brand. In regard to market responses, advertising and promotions by the leader induce positive accumulated responses of the followers’ sales. Moreover, the more growth of the leader’s sales, the more the follower’s sales grow with a positive effect on the demand-category.
Fig.4 Accumulated market responses. (Accumulated impulse response functions).
These findings leads us to consider that the leader drives the markets and that the nature of competition
of this market deviates from a symmetric behaviours towards a dominant-fringe pattern where the leader
Panel A
-20
020
4060
80
0 5 10 15lead
adv L to s L adv F to s F
-20
020
4060
80
0 5 10 15lead
adv L to s F adv F to s L
Panel B
-20
020
4060
80
0 5 10 15lead
ps L to s L ps F to s F
Panel C Panel D
-20
020
4060
80
0 5 10 15lead
ps F to s L ps L to s F
WSEAS TRANSACTIONS on BUSINESS and ECONOMICS Marzia Freo, Giorgio Tassinari
E-ISSN: 2224-2899 216 Volume 11, 2014

firm is retaliatory and the follower is accommodating or passive.
5 Conclusions In this paper, we examine the nature of competition between two leading brands within the Italian laundry-cleaning additive market from an econometric viewpoint. We first analyse competitive conducts by specifying a SVAR model [2]. The outcome of the investigation adds to case-studies of the literature on competitive dynamics in small markets. By accounting for all the complex feedbacks of actions and reactions, we may examine which is the nature of reactions from each firm. Furthermore, we identify whether coupled reactions to a single instrument are symmetric or asymmetric and thus identify the type of competition that occurs in the market.
This study offers the following insights. Within this market, defenders usually rejoin to assaults through simple instruments. Simple reactions are symmetrical, retaliatory to promotional sales and accommodating to advertising. Complex reactions tend to be of the accommodating type. Reactions driven by the leader to the assaults of the follower are more intense than reactions of the follower to assaults by the leader. Conversely, the follower rarely reacts to the leader’s assault, with the exclusions of a strong decrease of its advertising pressure in response to a promotional attack by the leader. Further, we find that the brand with the biggest market share is the true effective leader, as both own and competitor sales are positively affected by its own advertising. Moreover, impulses in the leader’s sales increase sales for itself and its competitor with a positive effect on primary demand of category. These findings collectively suggest that the leader drives the markets and that the nature of competition in said market deviates from symmetric behaviours towards a dominant-fringe pattern where the leader firm is retaliatory and the follower is accommodating or passive.
This study examined the competitive dynamics of only one particular market; however, the study contributes to the literature on marketing dynamics in that it shows the utility of the econometric approach for describing competitive dynamics. Specifically, the SVAR approach provides insight into the complex exchange of feedback between firms, helps managers to understand the complexity of competitive dynamics, and provides a method to project ways to specify firms’ competitive conduct to derive sustainable advantages.
References: [1] Ailawadi, K.L., P.K. Kopalle, and S.A. Neslin,
Predicting competitive response to a major policy change: combining game-theoretic and empirical analysis, Marketing Science, Vol. 24, 2005, pp. 12-24.
[2] Amisano, G., and C. Giannini, Topics in structural VAR econometrics, 2nd ed., Springer, 2007
[3] Brasini, S., M. Freo, and G. Tassinari, Short- and long-run effects of promotions on retailers performance, Statistica applicata, Vol. 18, 2006, pp. 297-309.
[4] Camerer, C.F., Does strategy research need game theory? Strategic Management Journal, Vol.12, No. 2, 1991, pp. 137–152.
[5] Dhar, T., J-P. Chavas, R. Cotterill, and B.W. Gould, An Econometric Analysis of Brand-Level Strategic Pricing Between Coca-Cola Company and PepsiCo., Journal of Economics & Management Strategy, Vol.14, No.4, 2005, pp. 905-931
[6] Freo, M., The impact of sales promotions on store performance, Statistical Methods and Applications, Vol. 14, No.2, 2005, pp. 271-281.
[7] Gasmi, F., J.J. Laffont, and Q. Vuong, Econometric analysis of collusive behavior in a soft-drink market, Journal of Economics and Management Strategy, Vol.1 , 1922, pp. 277-311.
[8] Horvath, C., P.S.H. Leeflang, J.E. Wieringa, and D.R. Wittink, Competitive reaction and feedback effects based on VARX models of pooled store data, International Journal of Research in Marketing, Vol. 222, 2005, pp. 415-426.
[9] Kadyali, V., Entry, its deterrence, and its accommodation: a study of the U.S. photographic film industry, Rand Journal of Economics, Vol. 27, 1996, pp. 452-478.
[10] Leeflang, P.S.H., and D.R. Wittink, Competitive reaction versus consumer response: do managers overreact? International Journal of Research in Marketing, Vol. 13, 1996, pp.103-119.
[11] Leeflang, P.S.H. Modeling competitive responsiveness, in B. Wieringa Ed., Handbook of marketing decision model, 2008, pp.211-251, Springer.
[12] Putsis, W.P., R. Dahr, The many faces of competition, Marketing Letters, Vol. 9 no. 3, 1998; pp.269-284.
[13] Ramaswamy, V., H. Gatignon, and D.J. Reibstein, Competitive marketing behavior in
WSEAS TRANSACTIONS on BUSINESS and ECONOMICS Marzia Freo, Giorgio Tassinari
E-ISSN: 2224-2899 217 Volume 11, 2014

industrial markets, Journal of Marketing, Vol. 58, No. 2, 1994, pp. 45-55.
[14] Saloner, G., Modeling, game theory, and strategic management, Strategic Management Journal, Vol.12, No. 2, 1991, pp. 119–136.
[15] Shankar, V., Proactive and Reactive Product Line Strategies: Asymmetries between Market Leaders and Followers, Management Science, Vol. 5, No. 2, 2006, pp. 276-292.
[16] Shin, H.S., M. Sakakibara, and D. M. Hanssens, Marketing and R&D Investment of Leader vs. Follower, 2008.
[17] Spiller, P.T., and E. Favaro, The effects of entry regulation on oligopolistic interaction: the Uruguayan banking sector, Rand journal of Economics, Vol. 15, No. 2, 1984, pp.244-254.
[18] Steenkamp, J.B.E.M., V.R. Nijs, D.M. Hanssesns, and M.D. Dekimpe, competitive reactions to advertising and promotions attacks, Marketing Science, Vol. 24, No. 1, 2005, pp.35-54.
[19] Sudhir, K., P.K. Chintagunta, and V. Kadyali, Time-varying competition, Marketing Science, Vol. 24, 2005, pp. 96-109.
[20] Sutton, J. Implementing game theoretical models in industrial economics. A. Del Monte, Eds, Recent Developments in the Theory of Industrial Organization. University of Michigan Press pp.19-33.
[21] Sutton, J., Technology and market structure: theory and history, 1998, MIT Press.
[22] Teece, D, G. Pisano, and A. Shuen, Dynamic capabilities and strategic management, Strategic Management Journal, Vol. 18, No.7, 1997, pp. 509–533.
[23] Vilcassim, NJ., V. Kadiyali, and P.K. Chintagunta, Investigating dynamic multifirm market interactions in price and advertising, Journal of Marketing Research, Vol. 45, 1999, pp. 499-418
WSEAS TRANSACTIONS on BUSINESS and ECONOMICS Marzia Freo, Giorgio Tassinari
E-ISSN: 2224-2899 218 Volume 11, 2014