Embed Size (px)
Citation preview

Page 1 of 18
Empire Oil & Gas Ltd (EGO)
Conven
tiona
l O
il &
Gas: P
rodu
ce
r / E
xplo
rer
Brief Business Description:
Hartleys Brief Investment Conclusion
Chairman & CEO:
Antonino (Tony) Iannello Chairman
Ken Aitken CEO
Substantial Shareholders:
ERM Power 19%
Philip Garrat 6%
Company Address:
Valuation: $0.753
Issued Capital: 10,205
- fully diluted 10,377
Market Cap: $40.8m
- fully diluted $41.5m
Current Debt
Current Cash
FY14 FY15F FY16F
Prod (TJ) 1,855 2,876 3,060
Op Cash Flw -$6m $0m $13m
Free Cash Flw -$9m -$21m -$2m
NPAT* (A$m) -$2m $4m $5m
EPS ($, bas)* -0.02x 0.04x 0.05x
P/E (basic)* -18.3x 10.2x 7.6x
EV / EBIT -20.1x 11.0x 7.0x
EV / EBITDA 24.9x 4.0x 3.1x
N.D. / equity 2% 4% 7%
Net Cash End $1.9m -$1.6m -$3.8m
*normalised
Source: Hartleys Research
Authors:
Simon Andrew
Oil and Gas Analyst
Ph: +61 8 9268 3020
$14.4m
$12.9m
EGO is a gas producer and explorer with a core
focus on the Perth Basin. Key asset is the Red
Gully Gas plant
EGO should start generating cash flow from gas
sales for the first time since the start-up of the Red
Gully Gas plant. The drilling of the Red Gully North-
1 exploration well, expected before the end of
CY15, is the most significant near term catalyst for
the stock price.
229 Stirling Highway
Claremont
12mth Price Target: $0.0075
EGO.asxSpeculative Buy
16 Sep 2015
Share Price: $0.0040
EMPIRE OIL & GAS NL (EGO)
Ego is not a dirty word….. We initiate coverage of Empire Oil and Gas Ltd (EGO) with a Speculative
Buy recommendation and a 12-month target price of 0.75cps, 50% upside
from the current share price. EGO has started generating cash flow from
gas sales for the first time since the start-up of the Red Gully Gas plant. A
recent reserve upgrade ensures that EGO can deliver Tranche-2 of the
Alcoa GSA plus have an additional 2PJ of gas for sale. The drilling of the
Red Gully North-1 exploration well, expected before the end of CY15, is the
most significant near term catalyst for the stock price.
About to move from a producer to a cash generator EGO management has provided FY16 revenue guidance of A$23m. The
significant increase in net revenue will be generated by EGO entering
Tranche 2 of the Alcoa GSA. Tranche 2 of the GSA requires delivery of
10PJ of gas to Alcoa, for which EGO will receive a previously negotiated
gas price. The price has not been disclosed to the market however we
assume it to be A$6.5/Gj. We estimate that EGO will generate A$13m in
operating cash flow in FY16. During Tranche 1, EGO delivered circa 5PJ of
gas that had been prepaid (therefore EGO did not receive any cash flow).
Red Gully-1 reserve upgrade EGO recently announced a 64% increase in 1P reserves from the Red
Gully-1 B Sand to 12.2PJ. Upgraded reserves are now sufficient to cover
Tranche-2 of the Alcoa GSA (10 PJ) plus an additional 2PJ of uncontracted
gas. EGO has already identified potential customers for the excess gas.
Drilling the Red Gully North prospect in 4Q CY15 The Red Gully North prospect is expected to be drilled in 4Q CY15. The well
cost is estimated at A$10m (dry hole cost) with an additional A$2m required
to test and complete. We regard the well as relatively low risk, as it is testing
up-dip of a known gas discovery (Gingin-1), off modern seismic and using
modern drilling and completion techniques. EGO estimates that a successful
outcome from Red Gully North could add an additional 5TJ/d of production.
This would require the plant capacity to be increased above the current
10TJ/d.
Debt refinancing We expect EGO to refinance the A$15.1m in debt, currently outstanding
with ERM Power, before the end of this year. The current debt facility is
interest free and due in August 2016, but carries significant escalation
clause should the EGO share price appreciate above 0.8cps.
Valuation and recommendation We value EGO at 0.75cps. At the core of our valuation is the Red Gully gas
operation, valued at A$43m or 0.42cps. The remainder of our 0.75cps
valuation is made op from Red Gully North (0.11cps), Gin-Gin East and
other exploration (0.23cps). EGO’s net debt at the end of FY15 was
estimated to be A$2m. EGO management has indicated an intention to
consolidate the current shares on issue. The history of share consolidations
on the ASX suggests that there may be a period of share price weakness
immediately after the consolidation. In our view, consolidation is required if
the EGO share register is to mature. The major risk to our recommendation
is disappointing results from the Red-Gully North exploration well. EGO
does have commodity price exposure via condensate prices.
Hartleys Limited ABN 33 104 195 057 (AFSL 230052) 141 St Georges Terrace, Perth, Western Australia, 6000
Hartleys does and seeks to do business with companies covered in its research reports. As a result, investors should be aware that the
firm may have a conflict of interest that could affect the objectivity of this report. Investors should consider this report as only a single
factor in making their investment decision. Further information concerning Hartleys’ regulatory disclosures can be found on Hartleys
website www.hartleys.com.au
0.00
0.001
0.002
0.003
0.004
0.005
0.006
0.007
0.008
0.009
.
20.
40.
60.
80.
100.
120.
140.
Sep-15May-15Jan-15Oct-14
Volume - RHS
EGO Shareprice - LHS
Sector (S&P/ASX SMALL RESOURCES) - LHS
A$ M
Empire Oil & Gas
Source: IRESS
Hartleys Limited Empire Oil & Gas Ltd (EGO) 16 September 2015
Page 2 of 18
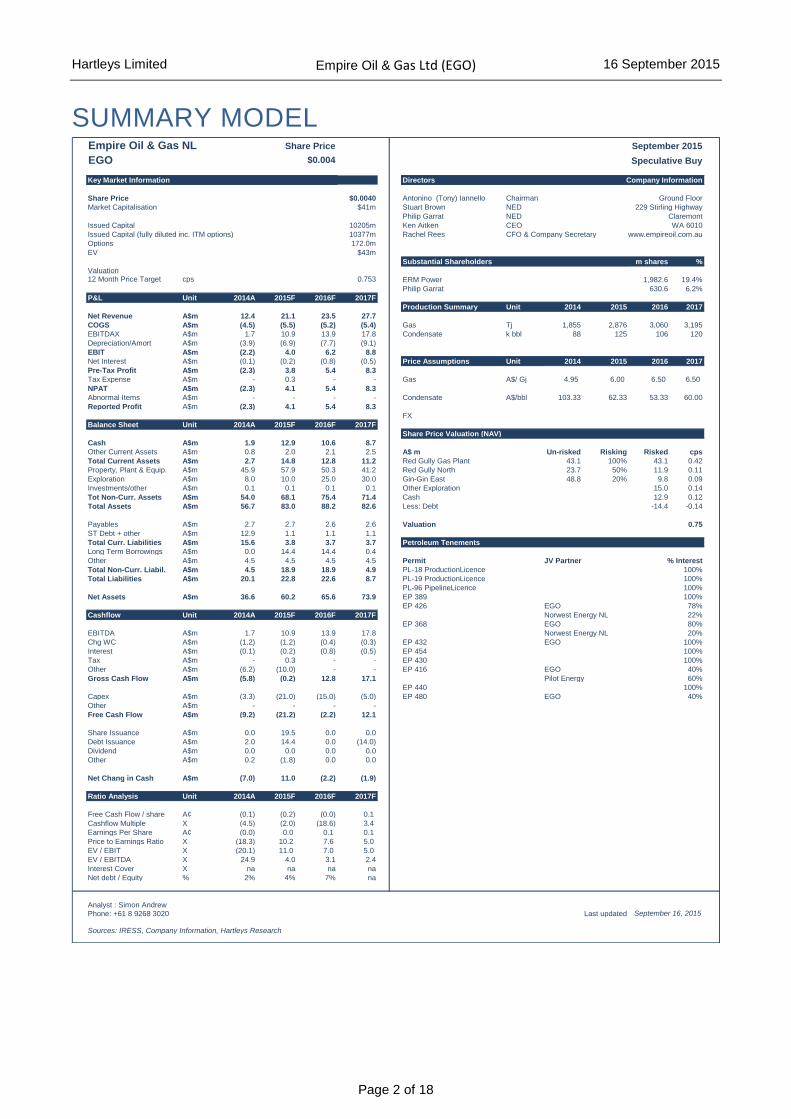
SUMMARY MODEL
Empire Oil & Gas NL Share Price
EGO $0.004 Speculative Buy
Key Market Information Directors Company Information
Share Price $0.0040 Antonino (Tony) Iannello Chairman Ground Floor
Market Capitalisation $41m Stuart Brown NED 229 Stirling Highway
Philip Garrat NED Claremont
Issued Capital 10205m Ken Aitken CEO WA 6010
Issued Capital (fully diluted inc. ITM options) 10377m Rachel Rees CFO & Company Secretary www.empireoil.com.au
Options 172.0m
EV $43m
Substantial Shareholders m shares %
Valuation 212 Month Price Target cps 0.753 3 ERM Power 1,982.6 19.4%
5 Philip Garrat 630.6 6.2%
P&L Unit 2014A 2015F 2016F 2017F 6
7 Production Summary Unit 2014 2015 2016 2017
Net Revenue A$m 12.4 21.1 23.5 27.7 8
COGS A$m (4.5) (5.5) (5.2) (5.4) 9 Gas Tj 1,855 2,876 3,060 3,195
EBITDAX A$m 1.7 10.9 13.9 17.8 10 Condensate k bbl 88 125 106 120
Depreciation/Amort A$m (3.9) (6.9) (7.7) (9.1)
EBIT A$m (2.2) 4.0 6.2 8.8
Net Interest A$m (0.1) (0.2) (0.8) (0.5) Price Assumptions Unit 2014 2015 2016 2017
Pre-Tax Profit A$m (2.3) 3.8 5.4 8.3
Tax Expense A$m - 0.3 - - Gas A$/ Gj 4.95 6.00 6.50 6.50
NPAT A$m (2.3) 4.1 5.4 8.3
Abnormal Items A$m - - - - Condensate A$/bbl 103.33 62.33 53.33 60.00
Reported Profit A$m (2.3) 4.1 5.4 8.3
FX
Balance Sheet Unit 2014A 2015F 2016F 2017F
Share Price Valuation (NAV)
Cash A$m 1.9 12.9 10.6 8.7
Other Current Assets A$m 0.8 2.0 2.1 2.5 A$ m Un-risked Risking Risked cps
Total Current Assets A$m 2.7 14.8 12.8 11.2 Red Gully Gas Plant 43.1 100% 43.1 0.42
Property, Plant & Equip. A$m 45.9 57.9 50.3 41.2 Red Gully North 23.7 50% 11.9 0.11
Exploration A$m 8.0 10.0 25.0 30.0 Gin-Gin East 48.8 20% 9.8 0.09
Investments/other A$m 0.1 0.1 0.1 0.1 Other Exploration 15.0 0.14
Tot Non-Curr. Assets A$m 54.0 68.1 75.4 71.4 Cash 12.9 0.12
Total Assets A$m 56.7 83.0 88.2 82.6 Less: Debt -14.4 -0.14
Payables A$m 2.7 2.7 2.6 2.6 Valuation 0.75
ST Debt + other A$m 12.9 1.1 1.1 1.1
Total Curr. Liabilities A$m 15.6 3.8 3.7 3.7 Petroleum Tenements
Long Term Borrowings A$m 0.0 14.4 14.4 0.4
Other A$m 4.5 4.5 4.5 4.5 Permit JV Partner % Interest
Total Non-Curr. Liabil. A$m 4.5 18.9 18.9 4.9 PL-18 Production Licence 100%
Total Liabilities A$m 20.1 22.8 22.6 8.7 PL-19 Production Licence 100%
PL-96 Pipeline Licence 100%
Net Assets A$m 36.6 60.2 65.6 73.9 EP 389 100%
EP 426 EGO 78%
Cashflow Unit 2014A 2015F 2016F 2017F Norwest Energy NL 22%
EP 368 EGO 80%
EBITDA A$m 1.7 10.9 13.9 17.8 Norwest Energy NL 20%
Chg WC A$m (1.2) (1.2) (0.4) (0.3) EP 432 EGO 100%
Interest A$m (0.1) (0.2) (0.8) (0.5) EP 454 100%
Tax A$m - 0.3 - - EP 430 100%
Other A$m (6.2) (10.0) - - EP 416 EGO 40%
Gross Cash Flow A$m (5.8) (0.2) 12.8 17.1 Pilot Energy 60%
EP 440 100%
Capex A$m (3.3) (21.0) (15.0) (5.0) EP 480 EGO 40%
Other A$m - - - -
Free Cash Flow A$m (9.2) (21.2) (2.2) 12.1
Share Issuance A$m 0.0 19.5 0.0 0.0
Debt Issuance A$m 2.0 14.4 0.0 (14.0)
Dividend A$m 0.0 0.0 0.0 0.0
Other A$m 0.2 (1.8) 0.0 0.0
Net Chang in Cash A$m (7.0) 11.0 (2.2) (1.9)
Ratio Analysis Unit 2014A 2015F 2016F 2017F
Free Cash Flow / share A¢ (0.1) (0.2) (0.0) 0.1
Cashflow Multiple X (4.5) (2.0) (18.6) 3.4
Earnings Per Share A¢ (0.0) 0.0 0.1 0.1
Price to Earnings Ratio X (18.3) 10.2 7.6 5.0
EV / EBIT X (20.1) 11.0 7.0 5.0
EV / EBITDA X 24.9 4.0 3.1 2.4
Interest Cover X na na na na
Net debt / Equity % 2% 4% 7% na
Analyst : Simon Andrew
Phone: +61 8 9268 3020 Last updated
Sources: IRESS, Company Information, Hartleys Research
September 2015
September 16, 2015

Hartleys Limited Empire Oil & Gas Ltd (EGO) 16 September 2015
Page 3 of 18
INVESTMENT THESIS We initiate coverage of Empire Oil and Gas Ltd (EGO) with a Speculative Buy
recommendation and a 12-month target price of 0.75cps, 50% upside from the
current share price. EGO has started generating cash flow from gas sales for the
first time since the start-up of the Red Gully Gas plant. A recent reserve upgrade
ensures that EGO can deliver Tranche-2 of the Alcoa GSA plus have an additional
2PJ of gas for sale. The drilling of the Red Gully North-1 exploration well, expected
before the end of CY15, is the most significant near term catalyst for the stock
price.
Significant increase in cash generation expected in FY16 and beyond. EGO
management has provided FY16 revenue guidance of A$23m. The significant
increase in net revenue will be generated by EGO entering Tranche 2 of the Alcoa
GSA. Tranche 2 of the GSA requires delivery of 10PJ of gas to Alcoa, for which
EGO will receive a previously negotiated gas price. The price has not been
disclosed to the market however we assume it to be A$6.5/Gj. We estimate that
EGO will generate A$13m in operating cash flow in FY16. During Tranche 1, EGO
delivered 5PJ of gas that had been prepaid (therefore EGO did not receive
associated cash flow).
EGO expects to drill the Red Gully North prospect in 4Q CY15. EGO expect
the well to cost A$10m (dry hole cost), with an additional estimate of A$2m to test
and complete. The well is regarded as low risk as it is testing the up-dip of a
known gas discovery (Gingin-1) using modern seismic and will employ modern
drilling and completion techniques. EGO estimates that a successful outcome from
Red Gully North could add an additional 5TJ/d of production, which would require
the plant capacity to be increased above the current 10TJ/d.
AWE – recent success in the Perth Basin. AWE’s recent exploration and
appraisal success has helped the market refocus on the Perth Basin. In 2014 AWE
discovered the Waitsia gas field located on permits L1/L2 (AWE 50% and operator
/ Origin 50%). Permits L1/L2 lie immediately the west of Block EP 368 and EP
426, both operated by EGO. Following completion of the Waitsia-1 and Waitsia-2
appraisal wells AWE was able to increase their estimate of total gross recoverable
gas (P50) from 290 Bcf to 484 Bcf.
Other events and catalysts
Debt refinancing. We expect EGO to refinance the A$15.1m in debt currently
outstanding with ERM Power (ERM). The current debt facility is interest free
and due in August 2016 but carries an escalation clause should the EGO share
price appreciate above 0.8cps (see page 17).
Share consolidation. EGO management has indicated an intention to
consolidate the current shares on issue. The history of share consolidations on
the ASX suggests that there may be a period of share price weakness
immediately after the consolidation. In our view, consolidation is required if the
EGO share register is to mature.
Valuation and Target Price. We value EGO at 0.75cps. At the core of our
valuation is the Red Gully gas operation, valued at A$43m or 0.42cps. The
remainder of our 0.75cps valuation is made op from Red Gully North (0.11cps),
Gin-Gin East and other exploration (0.23cps). EGO’s net debt at the end of FY15
was estimated to be A$2m.. EGO management has indicated an intention to
Init iate coverage of
EGO with a
Speculative Buy and
12-month target price
of 0.8cps – 60%
upside from the
current share pr ice
Dril l ing of Red Gul ly -
North prospect
expected before the
end of FY15
AWE’s recent success
has drawn at tent ion
back to the Perth
Basin

Hartleys Limited Empire Oil & Gas Ltd (EGO) 16 September 2015
Page 4 of 18
consolidate the current shares on issue. The history of share consolidations on the
ASX suggests that there may be a period of share price weakness immediately
after the consolidation. In our view, consolidation is required if the EGO share
register is to mature.
The major risk to our recommendation is disappointing results from the Red-Gully
North exploration well. Whilst EGO’s gas sales price is largely fixed, the Company
does have commodity price exposure via condensate prices.
Hartleys Limited Empire Oil & Gas Ltd (EGO) 16 September 2015
Page 5 of 18
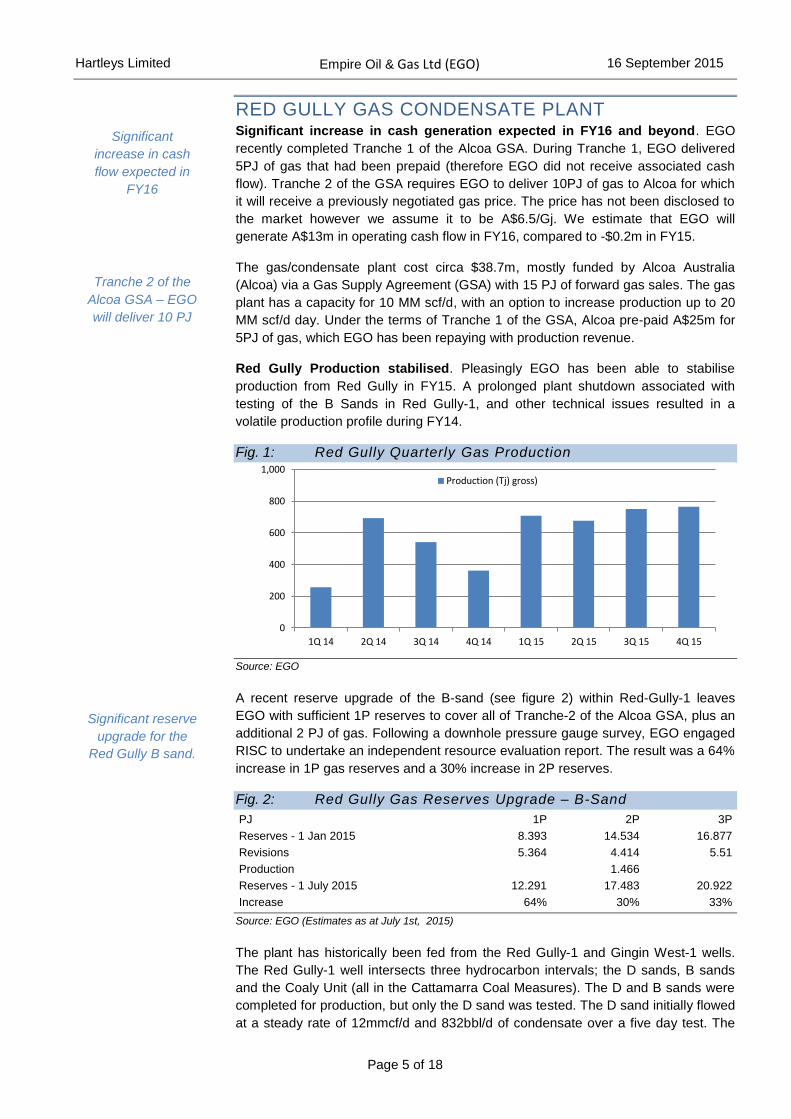
RED GULLY GAS CONDENSATE PLANT Significant increase in cash generation expected in FY16 and beyond. EGO
recently completed Tranche 1 of the Alcoa GSA. During Tranche 1, EGO delivered
5PJ of gas that had been prepaid (therefore EGO did not receive associated cash
flow). Tranche 2 of the GSA requires EGO to deliver 10PJ of gas to Alcoa for which
it will receive a previously negotiated gas price. The price has not been disclosed to
the market however we assume it to be A$6.5/Gj. We estimate that EGO will
generate A$13m in operating cash flow in FY16, compared to -$0.2m in FY15.
The gas/condensate plant cost circa $38.7m, mostly funded by Alcoa Australia
(Alcoa) via a Gas Supply Agreement (GSA) with 15 PJ of forward gas sales. The gas
plant has a capacity for 10 MM scf/d, with an option to increase production up to 20
MM scf/d day. Under the terms of Tranche 1 of the GSA, Alcoa pre-paid A$25m for
5PJ of gas, which EGO has been repaying with production revenue.
Red Gully Production stabilised. Pleasingly EGO has been able to stabilise
production from Red Gully in FY15. A prolonged plant shutdown associated with
testing of the B Sands in Red Gully-1, and other technical issues resulted in a
volatile production profile during FY14.
Fig. 1: Red Gully Quarterly Gas Production
Source: EGO
A recent reserve upgrade of the B-sand (see figure 2) within Red-Gully-1 leaves
EGO with sufficient 1P reserves to cover all of Tranche-2 of the Alcoa GSA, plus an
additional 2 PJ of gas. Following a downhole pressure gauge survey, EGO engaged
RISC to undertake an independent resource evaluation report. The result was a 64%
increase in 1P gas reserves and a 30% increase in 2P reserves.
Fig. 2: Red Gully Gas Reserves Upgrade – B-Sand
Source: EGO (Estimates as at July 1st, 2015)
The plant has historically been fed from the Red Gully-1 and Gingin West-1 wells.
The Red Gully-1 well intersects three hydrocarbon intervals; the D sands, B sands
and the Coaly Unit (all in the Cattamarra Coal Measures). The D and B sands were
completed for production, but only the D sand was tested. The D sand initially flowed
at a steady rate of 12mmcf/d and 832bbl/d of condensate over a five day test. The
0
200
400
600
800
1,000
1Q 14 2Q 14 3Q 14 4Q 14 1Q 15 2Q 15 3Q 15 4Q 15
Production (Tj) gross)
PJ 1P 2P 3P
Reserves - 1 Jan 2015 8.393 14.534 16.877
Revisions 5.364 4.414 5.51
Production 1.466
Reserves - 1 July 2015 12.291 17.483 20.922
Increase 64% 30% 33%
Significant
increase in cash
flow expected in
FY16
Tranche 2 of the
Alcoa GSA – EGO
will deliver 10 PJ
Significant reserve
upgrade for the
Red Gully B sand.

Hartleys Limited Empire Oil & Gas Ltd (EGO) 16 September 2015
Page 6 of 18
Gingin West-1 well tested the top D sand and flowed at a steady rate of 7.5mmcf/d
and 375bbl/d of condensate over a four day test.
The Company has also identified additional local potential of 205bcf of gas and
9.2mmbbl of condensate. This includes the gas/condensate discovered in the Gingin
field.
Fig. 3: EP389 Prospects
Source: Empire Oil and Gas Ltd
Historic exploration in the area includes the Gingin-1 and 2 wells and the Bootine
well. Gingin-1 was drilled in 1964 and initially flowed at a peak rate of 3.8mmcf/d.
Following a frac in 1971, the well was put onto production at a rate of 5mmcf/d.
However, the well declined quickly and production ceased after approximately 10
months. The well was brought back into production in 1975 at a lesser rate but only
produced for six months. Total production from Gingin-1 was 1.7bcf. Poor
permeability is blamed for the rapid decline. Gingin-2 and Bootine-1 both flowed
hydrocarbons in excess of 2mmcf/d, however, neither well was considered
commercial.
EGO commissioned RPS Energy Services Pty Ltd (RPS) to prepare a study on the
unconventional gas potential within EP389. The study found the potential for
undiscovered gas in place of 40 – 140Bcf per square kilometre. EGO has interpreted
the results to indicate approximately 24Tcf of gas in place within the permit.
Previous wells
in the area
produced
strongly but
declined rapidly

Hartleys Limited Empire Oil & Gas Ltd (EGO) 16 September 2015
Page 7 of 18
DRILLING OF RED GULLY NORTH EGO expects to drill the Red Gully North prospect in 4Q CY15. Together with
the start of Tranche 2 of the Alcoa GSA, this is the most significant catalyst
over the next 6 months. The well cost is estimated at A$10m (dry hole cost) with
an additional estimate of A$2m to test and complete. The well is regarded as low risk
as it is testing up-dip of a known gas discovery (Gingin-1) off modern seismic and
using modern drilling and completion techniques. EGO estimate that a successful
outcome from Red Gully North could add an additional 3TJ/d from the Red Gully
processing plant. The Gingin field is estimated to contain 2C Contingent Resource of
7.9PJ and Best Estimate Prospective Resource of 4.9PJ
The Red Gully North prospect lies within EP389 (EGO 100%) with the well location
sitting 470m from the Gingin-1 discovery. Importantly the well location is only
4km from the Red Gully processing plant. In March EGO signed a drilling contract
with Enderdrill. In addition to the Red Gully North well the drilling contract gives EGO
the option to drill a further four wells.
Gingin-1 discovery. The Gingin-1 well was drilled by WAPET in 1964-5 to test the
northerly trending Gingin anticline. Encouraging gas shows led to the drilling of
Gingin-2 by WAPET in 1965-66. Gingin-1 and Gingin-2 were drilled to depth of
4544m and 4482m respectively.
The results of Gingin-1 were encouraging enough for the operator to flow test the
well. The 6 most productive zones all occurred within the Cattamarra Coal Measures
(Early Jurassic). The most productive interval flowed 3.85 MMcf/d and small volumes
of 460API condensate. In 1971 the 3 most productive intervals flowed a
combined 13MMcf/d for a short period (GSWA Report 43, A. Crostella, 1995). A
longer term flow test in 1972 produced 5 MMcf/d, which was fed into the Dongara-
Perth pipeline. Gingin-2 was also flow tested but did not produce commercial
quantities of hydrocarbons.
Fig. 4: Red Gully North and Gingin East
Source: EGO
EGO expects to
drill the Red Gully
North prospect in
4Q CY15
Importantly the
well location is
only 4km from the
Red Gully
processing plant.
3 most productive
intervals were
fractured and
flowed a
combined 13
MMcf/d for a short
period
Hartleys Limited Empire Oil & Gas Ltd (EGO) 16 September 2015
Page 8 of 18
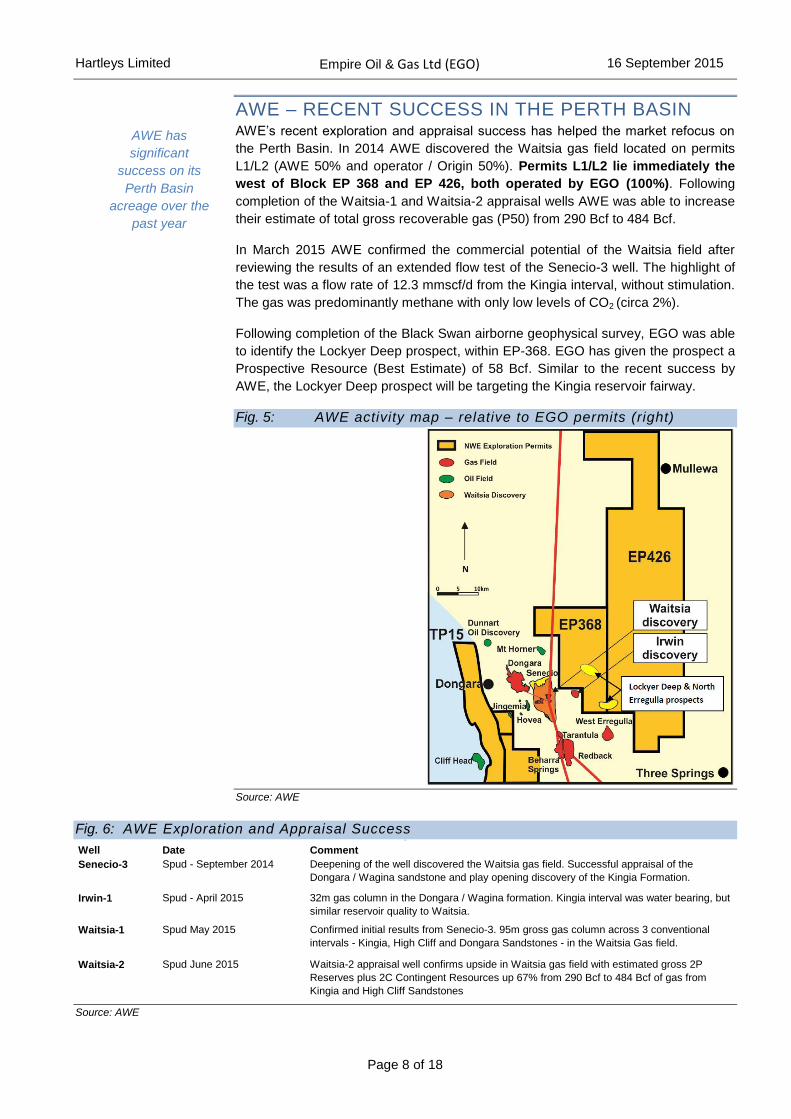
AWE – RECENT SUCCESS IN THE PERTH BASIN AWE’s recent exploration and appraisal success has helped the market refocus on
the Perth Basin. In 2014 AWE discovered the Waitsia gas field located on permits
L1/L2 (AWE 50% and operator / Origin 50%). Permits L1/L2 lie immediately the
west of Block EP 368 and EP 426, both operated by EGO (100%). Following
completion of the Waitsia-1 and Waitsia-2 appraisal wells AWE was able to increase
their estimate of total gross recoverable gas (P50) from 290 Bcf to 484 Bcf.
In March 2015 AWE confirmed the commercial potential of the Waitsia field after
reviewing the results of an extended flow test of the Senecio-3 well. The highlight of
the test was a flow rate of 12.3 mmscf/d from the Kingia interval, without stimulation.
The gas was predominantly methane with only low levels of CO2 (circa 2%).
Following completion of the Black Swan airborne geophysical survey, EGO was able
to identify the Lockyer Deep prospect, within EP-368. EGO has given the prospect a
Prospective Resource (Best Estimate) of 58 Bcf. Similar to the recent success by
AWE, the Lockyer Deep prospect will be targeting the Kingia reservoir fairway.
Fig. 5: AWE activity map – relative to EGO permits (right)
Source: AWE
Fig. 6: AWE Exploration and Appraisal Success xxx
Source: AWE
Well Date Comment
Senecio-3 Spud - September 2014 Deepening of the well discovered the Waitsia gas field. Successful appraisal of the
Dongara / Wagina sandstone and play opening discovery of the Kingia Formation.
Irwin-1 Spud - April 2015 32m gas column in the Dongara / Wagina formation. Kingia interval was water bearing, but
similar reservoir quality to Waitsia.
Waitsia-1 Spud May 2015 Confirmed initial results from Senecio-3. 95m gross gas column across 3 conventional
intervals - Kingia, High Cliff and Dongara Sandstones - in the Waitsia Gas field.
Waitsia-2 Spud June 2015 Waitsia-2 appraisal well confirms upside in Waitsia gas field with estimated gross 2P
Reserves plus 2C Contingent Resources up 67% from 290 Bcf to 484 Bcf of gas from
Kingia and High Cliff Sandstones
AWE has
significant
success on its
Perth Basin
acreage over the
past year

Hartleys Limited Empire Oil & Gas Ltd (EGO) 16 September 2015
Page 9 of 18
ASSET OVERVIEW EGO holds a large acreage position in the Perth Basin. Following the divestment by
ERM of their interest in joint ventured assets, EGO now has high equity interest in all
of its Perth basin acreage (see Figure 5). In 2014 ERM agreed to sell its interest in
EP389, including the Red Gully Gas plant plus other tenements to EGO for
A$15.1m. Part of this transaction included EGO raising $7.5m via a placement of
share to ERM after which ERM holds a 19.4% stake in EGO.
The Red Gully North and Gingin East prospects both sit within EP 389 (100% EGO).
Fig. 7: EGO – Perth Basin asset overview
Source: EGO
NORTH PERTH BASIN EXPLORATION
EP368 (80%), Operator & EP426 (78%), Operator The North Erregulla prospect straddles EP426 and EP368.
In early 2012, Origin Energy Ltd (ORG) agreed to farm into EP368 and EP426 for
40% by free carrying all parties, except Norwest Energy NL, on a 100km2 3D seismic
survey program over the North Erregulla prospect. However, Origin has since
terminated the farm-in agreement.
The North Erregulla prospect was originally drilled in 1967. Wireline logs and drill
stem tests proved there was a 3 metre column of live oil in the Wagina formation.
The prospect was drilled as a tilted fault block target following oil shows at the
Erregulla-1 well which encountered a seven metre oil column that showed a small
amount of oil in the Cockleshell Gully Formation.
West Erregulla-1 was drilled in 1990 as a follow up to North Erregulla-1. No oil was
encountered but a small flow of gas was measured in the Basal Triassic Sandstone.
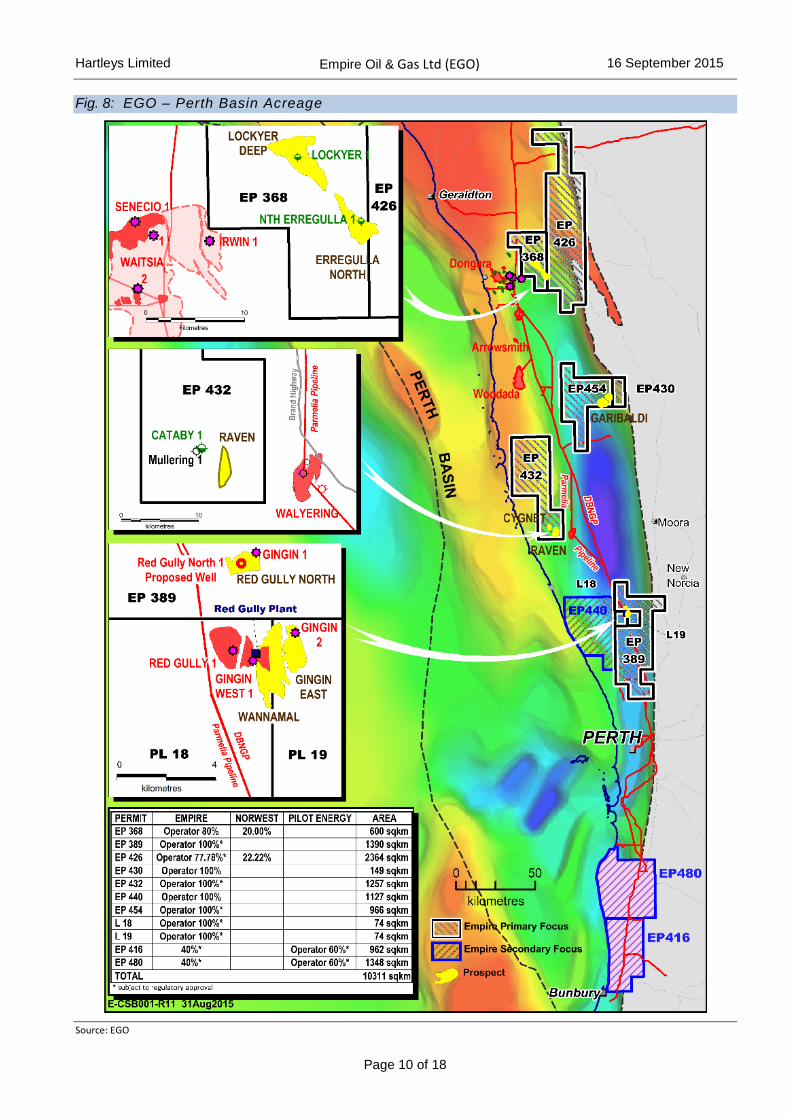
Permit JV Partner % Interest
PL-18 Production Licence 100%
PL-19 Production Licence 100%
PL-96 Pipeline Licence 100%
EP 389 100%
EP 426 EGO 78%
Norwest Energy NL 22%
EP 368 EGO 80%
Norwest Energy NL 20%
EP 432 EGO 100%
EP 454 100%
EP 430 100%
EP 416 EGO 40%
Pilot Energy 60%
EP 440 100%
EP 480 EGO 40%
Pilot Energy 60%
Key focus on
Perth Basin
production and
exploration
Origin Energy
recently pulled
out of a farmin
agreement to
acquire 3D
seismic
EP368 and
EP426 also
prospective for
Kockatea and
Carynginia
shale
Hartleys Limited Empire Oil & Gas Ltd (EGO) 16 September 2015
Page 10 of 18
Fig. 8: EGO – Perth Basin Acreage
Source: EGO

Hartleys Limited Empire Oil & Gas Ltd (EGO) 16 September 2015
Page 11 of 18
In 2008 the Moriary-1 well was drilled approximately 4km south east of North
Erregulla-1. The target was a tilted fault block. The well was plugged and abandoned
after formation water was encountered along with non-commercial residual
hydrocarbons.
EGO believes North Erregulla-1 was drilled down dip from the crest of the reservoir.
The seismic will provide more clarity on the prospect and, if EGO’s interpretation is
correct, then EGO estimates the prospect could hold 22 million barrels of
recoverable oil in the Dongara Sandstone and 3 million barrels of recoverable oil in
the Arranoo Member. In addition to this, the HCSS could hold 100 billion cubic feet
of gas.
All of EP368 and the southern half of EP426 could be prospective for Kockatea and
Carynginia shale gas. In EP426, North Erregulla-1 intersected 35 metres of the
Kockatea Shale. The combined acreage of the two permits is 731,505 acres and we
estimate that approximately 400,000 (80,000 net) of these acres are prospective. By
our estimates, the permits contain the potential for 1.7Tcf of net recoverable gas.
EP432 (100%) Operator The Black Arrow prospect is another tilted fault block and will evaluate the potential
of the Arranoo Sandstone. The well is subject to approval from the DMP. There been
a number of dry wells in Block A and no discoveries. However, Gairdner-1 was
drilled in the permit immediately north of EP432 in 1990 and had oil shows but was
plugged and abandoned. EGO believes the Black Arrow prospect is an extension of
the Gairdner prospect.
Block B is the Southern portion of the EP and contains the Cataby-1 well, which had
oil shows, and the Mullering-1 well which was dry. EGO plans to drill a well to further
test the Cataby-1 discovery.
EP454 (100%) & EP430 (100%), Operator The permit contains the Charger prospect, which is a shallow anticlinal target. EGO
intends to drill Charger-1 after Black Arrow-1 in EP432 and is seeking a farminee
fund all or part of the well. EP454 has not had an exploration well drilled within its
boundaries.
EP430 contains two prospects, Launer and Winchester, each targeting the
Cattamarra Coal Measures. 2D seismic was acquired over the permit in August 2011
but further seismic will be required over the Winchester prospect before it could be
considered drill ready. No exploration wells have been drilled in EP430, though a
stratigraphic well was drilled on the eastern boundary.
SOUTH PERTH BASIN EXPLORATION
EP480 (100%) and EP416 (90%), Operator In order to focus on the core northern Perth Basin tenements, EGO recently farmed
down equity in the southern Perth Basin tenements. Under the terms of the farm-in
agreement Pilot Energy (PGY) will pay EGO $450,000 to earn a 60% interest in both
permits and become the operator. Payment will be made in two stages. $150,000
initially and a further $350,000 upon renegotiation of the permit terms with the
regulator (expected in early 2016). PGY will also free carry EGO on 24 months of
permit expenses, excluding seismic and drilling.
EP368 and
EP426 also
prospective for
Kockatea and
Carynginia
shale
Charger and
Black Arrow
prospects will
be drilled in
2013
No exploration
wells have been
drilled in EP454
or EP430

Hartleys Limited Empire Oil & Gas Ltd (EGO) 16 September 2015
Page 12 of 18
PERTH BASIN The historic exploration success rate in the northern part of the Basin was about one
in ten. Since then, improvements in seismic quality, including the application of
three-dimensional seismic surveys, have led to a higher success rate. Major play
types include Permian, Triassic and Jurassic anticlines as well as Permian and
Triassic tilted fault blocks and stratigraphic traps.
Although exploration activity in the Perth Basin commenced in 1935, the first wildcat
well wasn’t drilled until 1961. The majority of early stage exploration and drilling was
performed by WAPET (now Chevron). Exploration has concentrated on the North
Perth Basin around the Geraldton/Dongara area (and Norwest’s permits). Seismic
surveys have been acquired across all major areas of the Perth Basin.
Fig. 9: Perth Basin Stratigraphy
Source: Department of Mineral and Energy WA, Atlas of Petroleum Fields, Onshore Perth
Basin
Since the first well (Eneabba 1), more than 250 onshore wells and 40 offshore wells
have been drilled. Of the wells drilled, approximately 30 have produced oil and
approximately 40 have produced gas for a total of 13 commercial fields. Three-
quarters of wells drilled and the majority of accumulations are located in the northern
part of the Basin. The gas in the north of the Basin is mainly dry, with minimal
condensate production, and the oil is highly paraffinic. Whilst the southern Perth
Basin has proved prospective (Whicher Range), there have been no commercial
discoveries. It is a common belief that the southern region has poor sealing potential
and limited source rock.
Conventional oil
and gas explorer
and soon to be
producer
North Perth Basin
is considered most
prospective

Hartleys Limited Empire Oil & Gas Ltd (EGO) 16 September 2015
Page 13 of 18
LOCATION, LOCATION, LOCATION
When considering the prospects and economics of a gas field, location is crucial and
the Perth Basin is ideal.
There are two pipelines (the Dampier to Bunbury Natural Gas Pipeline and
the Parmelia Pipeline) running through the Basin.
There have been numerous discoveries and commercial fields in the Basin.
Total reserves produced to date are in excess of 30mmbbls oil and
condensate and 625 Bcf gas from 10 fields, all of which are located in the
northern part of the Basin.
The unconventional potential of the Basin has recently been improved by
exploration activities carried out by AWE, and NWE. In particular, the
program undertaken by the two companies targeted the tight sands of the
High Cliff Sandstone, the Irwin River Coal Measures, the Carrynginia Shale
and the Kockatea Shale. The program proved that each zone can be fracced
and will produce gas to surface. It is important to note that the Kockatea also
produced oil to surface.
Given the proximity to Perth and the level of historic exploration in the basin,
there are a number of oil and gas services companies close to the region.
However, there is an inadequate amount of companies to provide a
seamless and timely service. As such, exploring for oil and gas in the Perth
Basin can be expensive (due to long distance mobilisation and
demobilisation costs) and require careful planning to ensure all equipment is
available at the same time.
Fig. 10: EGO ’s Northern Perth Basin Acreage
Source: Hartleys
Perth Basin
accommodates a
number of existing
fields and is close
to market,
pipelines, services
and equipment

Hartleys Limited Empire Oil & Gas Ltd (EGO) 16 September 2015
Page 14 of 18
MANAGEMENT AND DIRECTORS From the EGO website
Antonino Mario (Tony) Iannello - Chairman
(Interest in 13.888m shares as at 26th March 2015)
Tony was appointed as a director on 22 November 2013 bringing to the business
more than 30 years of banking and energy experience. He is a director of the listed
companies shown below. He is the Non-Executive Chairman of HBF Health Ltd, MG
Kailis Group, and D’Orsogna Ltd. He is a director of the St Baker Wilkes Indigenous
Educational Foundation Limited, Water Corporation of Western Australia, and a
member of The Murdoch University Senate. Prior to embarking on a career as a
non-executive director, Tony was the Managing Director of Western Power
Corporation until its separation into four separate businesses.
Stuart Anthony Brown - Non-Executive Director
Mr Brown is a petroleum geologist with over 30 years experience in Australia and
internationally at the technical, managerial, executive and board levels. Mr Brown
held the position of Vice-President Strategic Planning at Woodside from 2007 until
2012. In this role he was responsible for the management of Woodside’s corporate
strategic planning, including the overview of the company’s investment decisions
and investment reviews and reported to the CEO and Board. Mr Brown is currently
Managing Director of his own privately-owned petroleum consultancy, International
Oil & Gas Strategies Pty Ltd.
Philip Garratt - Non-Executive Director
(Interest in 596.587m shares and 122.312m options as at 5th May 2015)
Phil was appointed as a director on 5 May 2015 bringing more than 30 years of
senior management experience in a range of industries including oil exploration,
development and distribution, mineral resource exploration and telecommunications.
Phil has worked extensively at a global level to help grow and develop businesses in
these fields in his capacity as a principal and investor. He offers skills with a
particular focus on business development and corporate governance.
Ken Aitken - Chief Executive Officer
Mr Aitken has extensive knowledge of WA’s oil and gas industry through his senior
roles with Origin, Mitsui, Apache and New Standard Energy as well as international
experience in Norway, UK and Indonesia. Mr Aitken was General Manager
Operations and Engineering with ASX-listed petroleum company New Standard
Energy with responsibility for managing all operated asset activities with joint venture
partners Conoco Phillips and Petrochina. Prior to this, Mr Aitken held the position of
WA Business Unit Manager/Asset Manager with Origin Energy for a total of seven
years, during which time he managed production of approximately three million
barrels of oil and 20PJ of gas. During his tenure, Origin discovered and developed
the significant Redback gas field, located in the onshore Perth Basin.
Hartleys Limited Empire Oil & Gas Ltd (EGO) 16 September 2015
Page 15 of 18
HARTLEYS FORECASTS
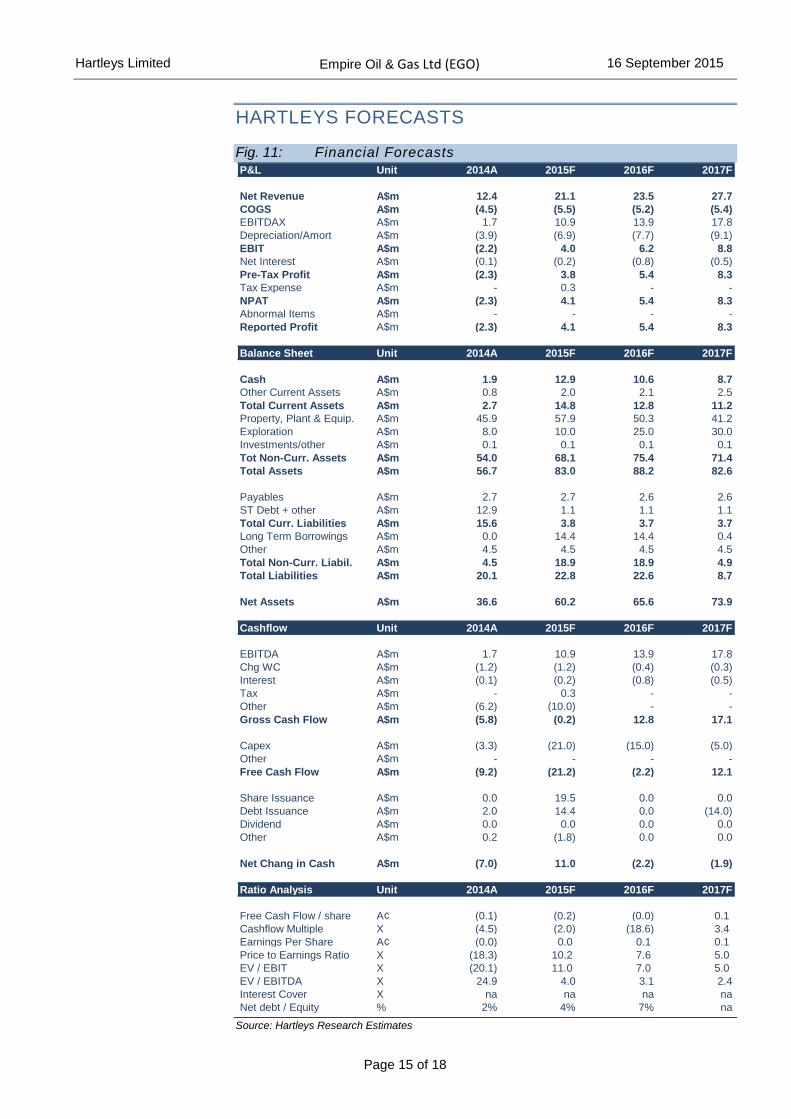
Fig. 11: Financial Forecasts
x
Source: Hartleys Research Estimates
P&L Unit 2014A 2015F 2016F 2017F
Net Revenue A$m 12.4 21.1 23.5 27.7
COGS A$m (4.5) (5.5) (5.2) (5.4)
EBITDAX A$m 1.7 10.9 13.9 17.8
Depreciation/Amort A$m (3.9) (6.9) (7.7) (9.1)
EBIT A$m (2.2) 4.0 6.2 8.8
Net Interest A$m (0.1) (0.2) (0.8) (0.5)
Pre-Tax Profit A$m (2.3) 3.8 5.4 8.3
Tax Expense A$m - 0.3 - -
NPAT A$m (2.3) 4.1 5.4 8.3
Abnormal Items A$m - - - -
Reported Profit A$m (2.3) 4.1 5.4 8.3
Balance Sheet Unit 2014A 2015F 2016F 2017F
Cash A$m 1.9 12.9 10.6 8.7
Other Current Assets A$m 0.8 2.0 2.1 2.5
Total Current Assets A$m 2.7 14.8 12.8 11.2
Property, Plant & Equip. A$m 45.9 57.9 50.3 41.2
Exploration A$m 8.0 10.0 25.0 30.0
Investments/other A$m 0.1 0.1 0.1 0.1
Tot Non-Curr. Assets A$m 54.0 68.1 75.4 71.4
Total Assets A$m 56.7 83.0 88.2 82.6
Payables A$m 2.7 2.7 2.6 2.6
ST Debt + other A$m 12.9 1.1 1.1 1.1
Total Curr. Liabilities A$m 15.6 3.8 3.7 3.7
Long Term Borrowings A$m 0.0 14.4 14.4 0.4
Other A$m 4.5 4.5 4.5 4.5
Total Non-Curr. Liabil. A$m 4.5 18.9 18.9 4.9
Total Liabilities A$m 20.1 22.8 22.6 8.7
Net Assets A$m 36.6 60.2 65.6 73.9
Cashflow Unit 2014A 2015F 2016F 2017F
EBITDA A$m 1.7 10.9 13.9 17.8
Chg WC A$m (1.2) (1.2) (0.4) (0.3)
Interest A$m (0.1) (0.2) (0.8) (0.5)
Tax A$m - 0.3 - -
Other A$m (6.2) (10.0) - -
Gross Cash Flow A$m (5.8) (0.2) 12.8 17.1
Capex A$m (3.3) (21.0) (15.0) (5.0)
Other A$m - - - -
Free Cash Flow A$m (9.2) (21.2) (2.2) 12.1
Share Issuance A$m 0.0 19.5 0.0 0.0
Debt Issuance A$m 2.0 14.4 0.0 (14.0)
Dividend A$m 0.0 0.0 0.0 0.0
Other A$m 0.2 (1.8) 0.0 0.0
Net Chang in Cash A$m (7.0) 11.0 (2.2) (1.9)
Ratio Analysis Unit 2014A 2015F 2016F 2017F
Free Cash Flow / share A¢ (0.1) (0.2) (0.0) 0.1
Cashflow Multiple X (4.5) (2.0) (18.6) 3.4
Earnings Per Share A¢ (0.0) 0.0 0.1 0.1
Price to Earnings Ratio X (18.3) 10.2 7.6 5.0
EV / EBIT X (20.1) 11.0 7.0 5.0
EV / EBITDA X 24.9 4.0 3.1 2.4
Interest Cover X na na na na
Net debt / Equity % 2% 4% 7% na

Hartleys Limited Empire Oil & Gas Ltd (EGO) 16 September 2015
Page 16 of 18
VALUATION We value EGO at 0.75cps. At the core of our valuation is the Red Gully gas
operations, worth A$43m or 0.42cps. The remainder of our 0.75cps valuation is
made op from Red Gully North (0.11cps), Gin-Gin East and other exploration
(0.23cps). EGO’s net debt at the end of FY15 was estimated to be A$2m.
EGO management has indicated an intention to consolidate the current shares on
issue. The history of share consolidations on the ASX suggests that there may be a
period of share price weakness immediately after the consolidation. We are however
of the view that a consolidation is required if the EGO share register is to mature.
Fig. 12: EGO valuation summary
Source: Hartleys Research
We expect EGO to refinance the A$15.1m in debt currently outstanding with ERM
Power (ERM). The current debt facility is interest free and due in August 2016 but
carries an escalation clause should the EGO share price appreciate above 0.8cps
“Under this mechanism, EGO will increase the amount it pays to ERM on top of the
$15.1 million by a percentage equal to 70 per cent of the percentage increase in
EGO’s share price. For example, if EGO’s share price increases by 50 per cent,
EGO will increase the amount it pays to ERM by 70 per cent of 50 per cent, or 35
per cent. This would result in an additional payment to ERM of $5.7 million. This
means that the final amount ERM receives from EGO for these assets is closely
aligned to EGO’s success.”
A$ m Un-risked Risking Risked cps
Red Gully Gas Plant 43.1 100% 43.1 0.42
Red Gully North 23.7 50% 11.9 0.11
Gin-Gin East 48.8 20% 9.8 0.09
Other Exploration 15.0 0.14
Cash 12.9 0.12
Less: Debt -14.4 -0.14
Valuation 0.75
We value EGO at
0.8cps - the Red
Gully gas
operation accounts
for 0.48cps
Fig. 1: \

Hartleys Limited Empire Oil & Gas Ltd (EGO) 16 September 2015
Page 17 of 18
RISKS Investment in the oil and gas sector should be considered high risk. There is no
guarantee of exploration success. Further to this, producing assets typically decline
without further exploration and development. Specific risks include exploration risk,
development risk and production risk.
Our exploration valuation includes a risked metric based on prospect size for permits or
wells held by the Company. In essence, exploration values assume that the market will
recognise a portion of potential value before the results of a well are known. In most
cases, we include just 10% of potential prospect value in our valuations. However, this
may increase or decrease depending on the type of well being drilled and confidence in
the prospect.
SIMPLE S.W.O.T. TABLE Strengths Experienced management team
Long history in Perth Basin Numerous prospects Near term cashflow Strong domestic gas market
Weaknesses Balance sheet debt Relatively short reserves life
Opportunities Red Gully gas plant improves commercial potential of any nearby discovery Other exploration success Continuing exploration and operational success could improve Company reputation
Threats Production issues Exploration failure Environmental concerns Board/shareholder disputes
Source: Hartleys Research
Perth Basin is very
prospective and
about to
commence
production

Page 18 of 18
HARTLEYS CORPORATE DIRECTORY Research Trent Barnett Head of Research +61 8 9268 3052
Mike Millikan Resources Analyst +61 8 9268 2805
Scott Williamson Resources Analyst +61 8 9268 3045
Simon Andrew Energy Analyst +61 8 9268 3020
Janine Bell Research Assistant +61 8 9268 2831
Corporate Finance Grey Egerton-
Warburton
Director & Head of
Corp Fin.
+61 8 9268 2851
Richard Simpson Director +61 8 9268 2824
Paul Fryer Director +61 8 9268 2819
Dale Bryan Director +61 8 9268 2829
Ben Wale Associate Director +61 8 9268 3055
Ben Crossing Associate Director +61 8 9268 3047
Stephen Kite Associate Director +61 8 9268 3050
Scott Weir Associate Director +61 8 9268 2821
Registered Office
Level 6, 141 St Georges TcePostal Address:
PerthWA 6000 GPO Box 2777
Australia Perth WA 6001
PH:+61 8 9268 2888 FX: +61 8 9268 2800
www.hartleys.com.au [email protected]
Note: personal email addresses of company employees are
structured in the following
manner:[email protected]
Hartleys Recommendation Categories
Buy Share price appreciation anticipated.
Accumulate Share price appreciation anticipated but the risk/reward is
not as attractive as a “Buy”. Alternatively, for the share
price to rise it may be contingent on the outcome of an
uncertain or distant event. Analyst will often indicate a
price level at which it may become a “Buy”.
Neutral Take no action. Upside & downside risk/reward is evenly
balanced.
Reduce /
Take profits
It is anticipated to be unlikely that there will be gains over
the investment time horizon but there is a possibility of
some price weakness over that period.
Sell Significant price depreciation anticipated.
No Rating No recommendation.
Speculative
Buy
Share price could be volatile. While it is anticipated that,
on a risk/reward basis, an investment is attractive, there
is at least one identifiable risk that has a meaningful
possibility of occurring, which, if it did occur, could lead to
significant share price reduction. Consequently, the
investment is considered high risk.
Institutional Sales Carrick Ryan +61 8 9268 2864
Justin Stewart +61 8 9268 3062
Simon van den Berg +61 8 9268 2867
Chris Chong +61 8 9268 2817
Digby Gilmour +61 8 9268 2814
Veronika Tkacova +61 8 9268 3053
Wealth Management Nicola Bond +61 8 9268 2840
Bradley Booth +61 8 9268 2873
Adrian Brant +61 8 9268 3065
Nathan Bray +61 8 9268 2874
Sven Burrell +61 8 9268 2847
Simon Casey +61 8 9268 2875
Tony Chien +61 8 9268 2850
Tim Cottee +61 8 9268 3064
David Cross +61 8 9268 2860
Nicholas Draper +61 8 9268 2883
John Featherby +61 8 9268 2811
Ben Fleay +61 8 9268 2844
James Gatti +61 8 9268 3025
John Goodlad +61 8 9268 2890
Andrew Gribble +61 8 9268 2842
David Hainsworth +61 8 9268 3040
Neil Inglis +61 8 9268 2894
Murray Jacob +61 8 9268 2892
Gavin Lehmann +61 8 9268 2895
Shane Lehmann +61 8 9268 2897
Steven Loxley +61 8 9268 2857
Andrew Macnaughtan +61 8 9268 2898
Scott Metcalf +61 8 9268 2807
David Michael +61 8 9268 2835
Jamie Moullin +61 8 9268 2856
Chris Munro +61 8 9268 2858
Michael Munro +61 8 9268 2820
Ian Parker +61 8 9268 2810
Charlie Ransom
(CEO)
+61 8 9268 2868
Brenton Reynolds +61 8 9268 2866
Conlie Salvemini +61 8 9268 2833
David Smyth +61 8 9268 2839
Greg Soudure +61 8 9268 2834
Sonya Soudure +61 8 9268 2865
Dirk Vanderstruyf +61 8 9268 2855
Jayme Walsh +61 8 9268 2828
Samuel Williams +61 8 9268 3041
Disclaimer/Disclosure
The author of this publication, Hartleys Limited ABN 33 104 195 057 (“Hartleys”), its Directors and their Associates from time to time may hold
shares in the security/securities mentioned in this Research document and therefore may benefit from any increase in the price of those
securities. Hartleys and its Advisers may earn brokerage, fees, commissions, other benefits or advantages as a result of a transaction arising
from any advice mentioned in publications to clients.
This report was prepared solely by Hartleys Ltd. ASX did not prepare any part of the report and has not contributed in any way to its content.
The role of ASX in relation to the preparation of the research reports is limited to funding their preparation, by Hartleys Ltd, in accordance with
the ASX Equity Research Scheme. ASX does not provide financial product advice. The views express in this research may not necessarily
reflect the views necessarily reflect the views of ASX. To the maximum extent permitted by law, no representation, warranty or undertaking,
express or implied, is made and no responsibility or liability is accepted by ASX as to the adequacy, accuracy, completeness or reasonableness
of the research reports.
Any financial product advice contained in this document is unsolicited general information only. Do not act on this advice without first consulting
your investment adviser to determine whether the advice is appropriate for your investment objectives, financial situation and particular needs.
Hartleys believes that any information or advice (including any financial product advice) contained in this document is accurate when issued.
Hartleys however, does not warrant its accuracy or reliability. Hartleys, its officers, agents and employees exclude all liability whatsoever, in
negligence or otherwise, for any loss or damage relating to this document to the full extent permitted by law.


![Corrigés du manuel - Dossier 0 et 1 [Alter Ego +]](https://img.dokumen.tips/doc/110x75/55cf91f1550346f57b91fd8e/corriges-du-manuel-dossier-0-et-1-alter-ego-.jpg)