Embed Size (px)
Citation preview

Emotiv Epoc EEG Based Brain-Computer Interface
Lóska Ádám
2011.05.28.
Consultant: Mészáros Tamás

Overview........................................................................................................................................................ 2
ElectroEncephalography................................................................................................................................ 3
Brief history of EEG .................................................................................................................................... 3
EEG studies ................................................................................................................................................ 3
Area of interest ...................................................................................................................................... 4
Source of EEG activities ............................................................................................................................. 4
Clinical and research use ........................................................................................................................... 4
The method of measurement ................................................................................................................... 5
Bipolar montage .................................................................................................................................... 6
Referential montage .............................................................................................................................. 6
Average reference montage .................................................................................................................. 6
Laplacian montage ................................................................................................................................ 6
Wave patterns ........................................................................................................................................... 7
Area of interest ...................................................................................................................................... 9
Projects using the Emotiv EPOC .................................................................................................................. 10
BSC thesis of Onur Valor at the Istanbul Technical University ................................................................ 10
Implicit Detection of Relevance Decisions and Affect in Web Search - Google Research Award 2011 .. 10
Brain controlled car - Free University of Berlin ....................................................................................... 11
NeuroPhone - Dartmouth College, Hanover, NH, USA ........................................................................... 11
5 axis robot arm - Alex Blainey ................................................................................................................ 12
BrainTalk - Louizos Alexander Louizos..................................................................................................... 12
Summary ................................................................................................................................................. 12

Overview
In this document first I will describe my research about Electroencephalography, its brief history, basic
neurological background and the method of measurement. After that there are some projects using the
Emotiv EPOC brain-computer interface. I will discuss the goals of these projects and how they utilize the
features of the interface. Some personal notes are also attached to each of these projects, about how
relevant they are to my area of interest.

ElectroEncephalography
Brief history of EEG
The phenomenon was first discovered by Richard Caton (1842–1926), a physician practicing in Liverpool,
who presented his findings about electrical phenomena of the exposed cerebral hemispheres of rabbits
and monkeys in the British Medical Journal in 1875. Later, in 1890, a Polish physiologist Adolf Beck
published an investigation of spontaneous electrical activity of the brain of rabbits and dogs that
included rhythmic oscillations altered by light.
The first EEG recorded was in 1912, when Russian physiologist, Vladimir Vladimirovich Pravdich-
Neminsky published the first animal EEG and the evoked potential of a dog. Later, in 1914, Napoleon
Cybulski and Jelenska-Macieszyna photographed EEG-recordings of experimentally induced seizures.
The history of human EEG starts in 1924, when german physiologist and psychiatrist Hans Berger (1873–
1941) recorded the first human EEG. He invented and named the device electroencephalogram,
described as "one of the most surprising, remarkable, and momentous developments in the history of
clinical neurology". His discoveries were first confirmed by British scientists Edgar Douglas Adrian and B.
H. C. Matthews in 1934.
From 1934, the use of electroencephalography started to spread, as it proved useful in the research of
seizures and epilepsy. The first EEG laboratory opened in 1936 at Massachusetts General Hospital. In
1947, The American EEG Society was founded and the first International EEG congress was held.
EEG studies
When talking about electroencephalography, we are talking about three fields of interests.
Spontaneous activity is measured on the scalp or on the brain and is called the
electroencephalogram. The amplitude of the EEG is about 10 to 100 µV when measured on the
scalp, and about 1-2 mV when measured on the surface of the brain. The bandwidth of this
signal range from under 1 Hz to about 50 Hz. This activity goes on continuously in the living
individual, so absence of these indicates brain death.
Evoked potentials are responses to a stimulus (which may be electric, auditory, visual, etc.).
These are usually below the noise level, so it is important to improve the signal-to-noise ratio
when measuring these.
Single-neuron behavior can be examined by microelectrodes impaling the given cell. These
studies are to build models of cellular neural-networks that will reflect the actual properties of a
brain.

Area of interest
Naturally, my own area of interest is the evoked potentials (EPs or ERPs – Event Related Potentials),
because the spontaneous activity is mainly used in the medical field of diagnosis and the single neuron
behaviors are out not observable by simple EEG nor does it carry relevant data.
Source of EEG activities
The electrical charge in the brain is generated by the billions of neurons. They are electrically charged by
so called membrane transport proteins that pump ions through their membranes. If a neuron receives a
signal from its neighbors, it releases ions into the space outside the cell. This short-lasting event is called
the action potential. Ions of the same charge repel each other, so when many neurons push out many
ions at the same time, the ions push their neighbors, and so on, in a wave. This is the volume conduction.
When the wave of ions reaches the electrodes placed on the scalp, they become polarized. The voltage
between any two electrodes (or in some cases between an electrode and the average value of all of
them) can be measured by a voltmeter. The record of these voltages over time is the EEG.
Because the electric potentials generated by single neurons are far too small to be detected, EEG activity
always reflects the summation of the synchronous activity of lots of neurons that have similar spatial
orientation. The similar spatial orientation is the key, without it, the ions do not line up and create waves
to be detected. Especially easily detectable is the signals produced by the pyramidal neurons of the
cortex as they are well-aligned and fire together. Naturally, activity from deep sources is more difficult to
detect, as voltage fields fall off with the square of the distance.
Clinical and research use
A routine clinical EEG recording typically lasts 20–30 minutes (plus preparation time) and usually involves
recording from scalp electrodes place accordingly to the 10-20 system or its intermediate variation
(described later).
Non-complete list of clinical uses
To distinguish epileptic seizures from other types, such as psychogenic non-epileptic seizures,
fainting, sub-cortical movement disorders and migraine variants
To differentiate "organic" encephalopathy or delirium from primary psychiatric syndromes such
as catatonia
To detect brain death
To make prognosis on patients with coma
In fields of research, such as in neuroscience, cognitive science, cognitive psychology, and
psychophysiology EEGs are used extensively, but many of these techniques are not standardized enough
to be used in the clinical context.
The use of EEGs has some benefits compared to fMRI, another method of brain-study:

Hardware costs are significantly lower
More mobile
Higher temporal resolution, on the order of milliseconds, rather than seconds
More tolerant of subject movement
EEG is silent, which allows for better study of the responses to auditory stimuli
Does not aggravate claustrophobia
Of course, there are limitations compared with fMRI like the significantly lower spatial resolution. The
main problem is that it is mathematically impossible the reconstruct the waves in the deep parts of the
brain.
The method of measurement
In conventional scalp EEG, the recording is obtained by placing electrodes on the scalp with a conductive
gel or paste, after preparing the skin surface. Many systems use electrodes, each of which is attached to
an individual wire, but some use caps or nets with embedded electrodes; this is common when high-
density electrode arrays are needed.
Electrode locations and names are specified by the International 10–20 system for most clinical and
research applications (except when high-density arrays are used, but the 10-20 system has an
intermediate variation with more electrodes). In most clinical applications, 19 recording electrodes (plus
ground and system reference) are used. Additional electrodes can be added to the standard set-up when
there is need for increased spatial resolution for a particular area of the brain. These high-density arrays
can contain up to 256 electrodes more-or-less evenly spaced around the scalp.
Figure 1. The standard 10-20 system

Each electrode is connected to a differential amplifier with a common system reference electrode
connected to the other input (this may vary, see montages). This way the voltage between the active
electrode and the reference is amplified (typically 1,000–100,000 times, or 60–100 dB of voltage gain). In
analog EEG, the signal is then filtered, and the EEG signal is printed on paper. However, most EEG
systems these days are digital; the amplified signal is digitized via an A/D converter, after an anti-aliasing
filter. Analog-to-digital sampling rate is typically 256–512 Hz in clinical scalp EEG; however up to 20 kHz
may be used in some advanced research applications.
Typically, a high-pass and a low-pass filter are used when analyzing EEGs. The high-pass filter are set to
0.5-1 Hz, to filter out electrogalvanic signals, movement artifact and other low-frequency components;
the low-pass filter is set to 35-70 Hz to filter out electromyographic and other high-frequency signals.
Additionally the signal of the electrical power lines is filtered out (usually 60 or 50 Hz).
Sometimes it may be necessary to insert electrodes near the surface of the brain, under the surface of
the dura mater. This is referred to variously as "electrocorticography (ECoG)", "intracranial EEG (I-EEG)"
or "subdural EEG (SD-EEG)". ECoG is typically recorded at higher sampling rates than scalp EEG, because
the subdural signal is composed of a higher predominance of higher frequency components. Additionally
some artifacts do not influence ECoG, therefore display filtering is often not needed.
Because an EEG voltage signal represents a difference between the voltages at two electrodes, the
display of the EEG may be set up in several ways. These representations of the EEG channels are called
montage.
Bipolar montage
Each channel represents the difference between two adjacent electrodes. The entire montage consists of
a collection of these channels. For example, the channel "Fp1-F3" represents the difference in voltage
between the Fp1 electrode and the F3 electrode.
Referential montage
Each channel represents the difference between a certain electrode and a designated reference
electrode. There is no standard position for this reference; only it has to be at a different position than
the recording electrodes. Midline positions and "linked ears" (which is a physical or mathematical
average of electrodes attached to both earlobes or mastoids) are a common placement.
Average reference montage
The outputs of all of the amplifiers are summed and averaged, and this averaged signal is used as the
common reference for each channel.
Laplacian montage
Each channel represents the difference between an electrode and a weighted average of the
surrounding electrodes.
Note that, with digital EEGs, each montage can be calculated from another after the recording has been
stored.

Wave patterns
Basically there are five main wave patterns that are distinguished. In increasing frequency they are Delta,
Theta, Alpha, Beta and Gamma waves.
Delta is the frequency range up to 4 Hz. It tends to be the highest in amplitude and the slowest waves. It
is seen normally in adults in slow wave sleep. It is also seen normally in babies. It may occur focally with
subcortical lesions and in general distribution with diffuse lesions, metabolic encephalopathy
hydrocephalus or deep midline lesions.
Figure 2. Delta waves
Theta is the frequency range from 4 Hz to 7 Hz. Theta is seen normally in young children. It may be seen
in drowsiness or arousal in older children and adults; it can also be seen in meditation. Excess theta for
age represents abnormal activity. This range also has been associated with reports of relaxed,
meditative, and creative states.
Figure 3. Theta waves
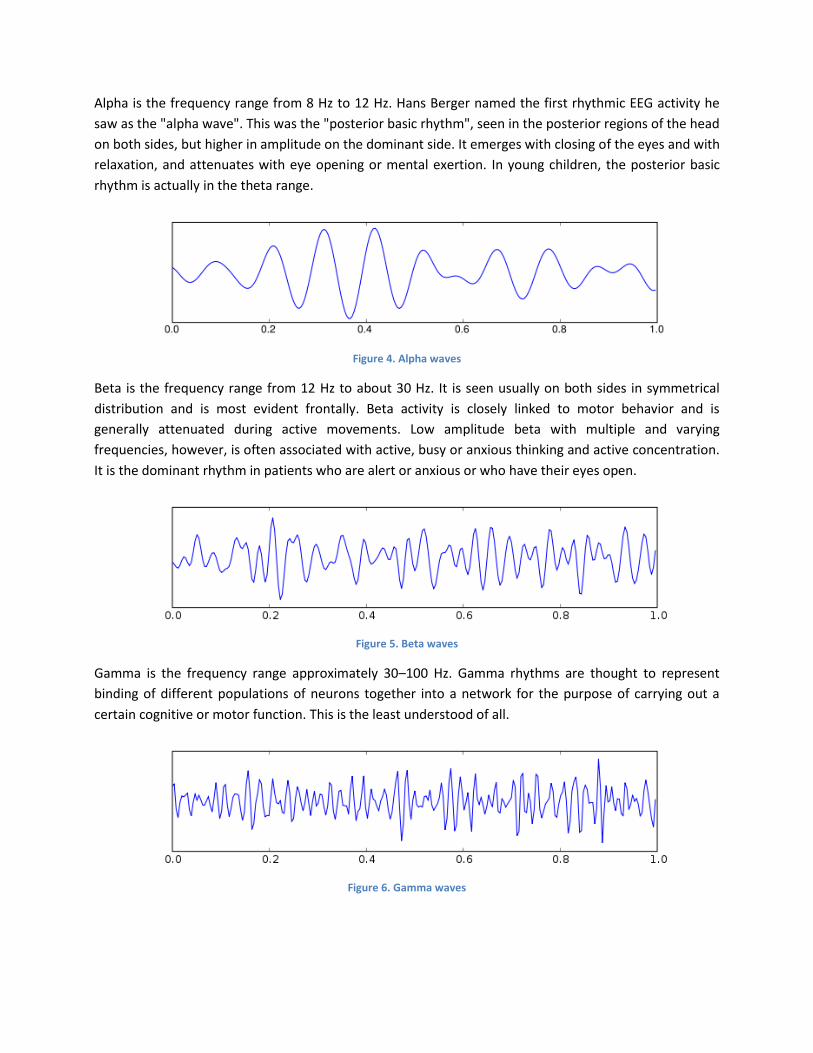
Alpha is the frequency range from 8 Hz to 12 Hz. Hans Berger named the first rhythmic EEG activity he
saw as the "alpha wave". This was the "posterior basic rhythm", seen in the posterior regions of the head
on both sides, but higher in amplitude on the dominant side. It emerges with closing of the eyes and with
relaxation, and attenuates with eye opening or mental exertion. In young children, the posterior basic
rhythm is actually in the theta range.
Figure 4. Alpha waves
Beta is the frequency range from 12 Hz to about 30 Hz. It is seen usually on both sides in symmetrical
distribution and is most evident frontally. Beta activity is closely linked to motor behavior and is
generally attenuated during active movements. Low amplitude beta with multiple and varying
frequencies, however, is often associated with active, busy or anxious thinking and active concentration.
It is the dominant rhythm in patients who are alert or anxious or who have their eyes open.
Figure 5. Beta waves
Gamma is the frequency range approximately 30–100 Hz. Gamma rhythms are thought to represent
binding of different populations of neurons together into a network for the purpose of carrying out a
certain cognitive or motor function. This is the least understood of all.
Figure 6. Gamma waves

Area of interest
My area of interest in these patterns are the beta and gamma waves, as these are attenuated during
movement or cognitive thinking, the two fields I would like to do my research.

Projects using the Emotiv EPOC
BSC thesis of Onur Valor at the Istanbul Technical University
He uses the Emotiv Epoc for mouse emulation and control of a LEGO NTX robot.
For the mouse emulator two different methods have been tried. First one was not efficient because of
the resolution of the gyro sensors and screen was not equal. Each 1 degree of gyro correspond 10px in
the screen so it had to be interpolated. Second method was working Gyro's acceleration directly to
control mouse. This method worked properly and the mouse glided on the screen continuously.
The gyro sensors of the Emotiv Epoc are not connected to brain waves, so this approach is not available
for me. However, the methods used for controlling the LEGO robot are all about the EEG signals, and it
worked quite well for three basic cognitive actions.
See more at http://eeg.vypro.org/
Implicit Detection of Relevance Decisions and Affect in Web Search - Google
Research Award 2011
LIS Professor Jacek Gwizdka and PhD student Michael Cole have received Google Research Award
($71,579) for the project. Knowledge of a user’s relevance decisions enables a better understanding of a
person's search intent. Non-intrusive detection of these decisions will enable improvement of search
engine algorithms, personalization of search results and has a potential of a wide impact on information
society. In this project researchers will use physiological signals (eye-movement and pupil size, galvanic-
skin response, and electroencephalography – using the Emotiv EPOC) to investigate implicit detection of
information relevance decisions and how these decisions are influenced by affect. The use of
physiological signals to detect relevance decisions and affect is a novel approach to study information
seeking.
This project may be relevant to my interest, but as it is in the early stage only basic information is
available about the methods, and about the fact, that how much weight has the EEG against the more
easily detectable eye-movement and skin response.

Brain controlled car - Free
University of Berlin
The EPOC is used by the autonomous labs to
drive their "MadeInGermany"-car. This is a
semi-automatic system, the car is equipped
with lots of different sensors, and can
navigate to an intersection automatically.
Once there, the user can choose the next
direction using the Emotiv Epoc.
This project is fairly simple, even with the
extended control possibilities it only uses 4 actions (accelerate, decelerate, turn left and right).
Additionally, there is a noticeable lag time, which is problematic ion real life usage.
Video on youtube: http://www.youtube.com/watch?v=iDV_62QoHjY&fmt=37
Original german article: http://www.zeit.de/auto/2011-02/autofahren-gedankenkraft
NeuroPhone - Dartmouth College, Hanover, NH, USA
It is a brain-controlled address book dialing app for iPhone,
which works on similar principles to P300-speller brain-
computer interfaces.
The P300 signal is the name of a task specific signal, what
can be measured more or less everywhere on the scalp. Is
someone focuses on a task, and it is stimulated somehow
(for example the desired picture flashes), the P300 signal is
elicited.
The phone flashes a sequence of photos of contacts from
the address book and a P300 brain potential is elicited
when the flashed photo matches the person whom the
user wishes to dial.
Although the application works properly, it is quite simple: only one dimension of choice. The advantage
of this is it runs perfectly on limited hardware such as a smartphone.

5 axis robot arm - Alex Blainey
This is an ongoing independent project with the aim of controlling a 5 axis robot arm. Currently mostly
using the Epoc’s built in patterns, meaning the different commands are mapped to the default
commands (push, pull, etc.).
This project is really interesting, as it is using 8
different cognitive patterns. (and 2 other –
eyebrow and teeth movement). Additionally, as
the developer states, if two axes are required at
the same time, sometimes he can trigger them
together. This happens more and more as the
brain learns the trigger states.
Original thread: http://emotiv.com/forum/messages/forum13/topic175/message979/#message979
Video on youtube: http://www.youtube.com/watch?v=4Cq35VbRpTY
BrainTalk - Louizos Alexander Louizos
The core of this project is a virtual keyboard that will allow
people to type on a computer screen by triggering from
specific EEG events. The Virtual Keyboard’s buttons flash in a
horizontal and then vertical fashion, the user only has to stop
over the appropriate key.
Another relatively simple but useful application. I have not found direct data on this, but I presume this
also works based on the P300 signal. I would like to do some research on character input, but in a very
different way – recognition of the characters from brain waves. If my approach fails, this method is an
acceptable plan B.
Link to project: http://www.nanotechgalaxy.com/braintalk/
Summary
As I see, the device has been used in various different projects, and day-by-day new projects start and
new awards are won. The main problem with these is that most of them use the built in channels –
predefined patterns that the headset can detect easily. Additionally, distinguishing several patterns can
prove to be very difficult, but in my research I have not found any evidence to exclude it.

References
[1] Wikipedia article on Electroencephalograpy, cited 2011 May, available HTTP:
http://en.wikipedia.org/wiki/Electroencephalography
[2] Bioelectromagnetism portal, online book, chapter 13: Electroencephalography, cited 2011 May,
available HTTP: http://www.bem.fi/book/index.htm
[3] Emotiv EPOC BCI headset home page, cited 2011 Feb, available HTTP:
http://www.emotiv.com/store/hardware/epoc-bci/epoc-neuroheadset/
[4] O. Varol, Raw EEG Data Classification and Applications Using SVM, Istanbul Technical University,
2010, available HTTP: http://eeg.vypro.org/
[5] Emotiv EPOC developers forum, cited 2011 May, available HTTP:
http://www.emotiv.com/forum/