Embed Size (px)
Citation preview

WellBeing International WellBeing International
WBI Studies Repository WBI Studies Repository
1-2015
Emotions in Goats: Mapping Physiological, Behavioural and Vocal Emotions in Goats: Mapping Physiological, Behavioural and Vocal
Profiles Profiles
Elodie F. Briefer Queen Mary University of London
Federico Tettamanti Queen Mary University of London
Alan G. McElligott Queen Mary University of London
Follow this and additional works at: https://www.wellbeingintlstudiesrepository.org/acwp_asie
Part of the Animal Studies Commons, Comparative Psychology Commons, and the Other Animal
Sciences Commons
Recommended Citation Recommended Citation Briefer, E. F., Tettamanti, F., & McElligott, A. G. (2015). Emotions in goats: mapping physiological, behavioural and vocal profiles. Animal Behaviour, 99, 131-143.
This material is brought to you for free and open access by WellBeing International. It has been accepted for inclusion by an authorized administrator of the WBI Studies Repository. For more information, please contact [email protected].

Emotions in Goats: Mapping Physiological, Behavioural and Vocal Profiles
Elodie F. Briefer, Federico Tettamanti, Alan G. McElligott Queen Mary University of London
KEYWORDS
acoustic communication, arousal, Capra hircus, positive emotions, ungulates, valence, vocal analysis
ABSTRACT
Emotions are important because they enable the selection of appropriate behavioural decisions in response to external or internal events. Techniques for understanding and assessing animal emotions, and particularly positive ones, are lacking. Emotions can be characterized by two dimensions: their arousal (bodily excitation) and their valence (negative or positive). Both dimensions can affect emotions in different ways. It is thus crucial to assess their effects on biological parameters simultaneously, so that accurate indicators of arousal and valence can be identified. To find convenient and noninvasive tools to assess emotions in goats, Capra hircus, we measured physiological, behavioural and vocal responses of goats in four situations: (1) control (no external stimulus, neutral); (2) anticipation of a food reward (positive); (3) food-related frustration (negative); (4) isolation away from conspecifics (negative). These situations were characterized by different levels of arousal, assessed a posteriori by heart rates measured during the tests. We found several clear, reliable indicators of arousal and valence. During situations of higher arousal, goats had lower heart rate variability and higher respiration rates. They displayed more head movements, moved more, had their ears pointed forwards more often and on the side (horizontal) less often and produced more calls. They also produced calls with higher fundamental frequencies and higher energy distribution. In positive situations, goats had their ears oriented backwards less often and spent more time with their tails up than in negative situations. Furthermore, they produced calls in which the fundamental frequencies were less variable. Our methods for assessing the effects of emotional arousal and valence on biological parameters could lead to more effective monitoring and understanding of animal emotions, as well as to a better understanding of the evolution of emotions through cross-species comparisons.

Although the existence of animal emotions has been suggested since Darwin (1872), techniques for understanding and assessing these affective states, and particularly positive ones, are still lacking. The discovery of clear emotional indicators is crucial for many disciplines, including animal behaviour, neuroscience, psychopharmacology and animal welfare (Mendl, Burman, & Paul, 2010). Emotions are composed of four components: neurophysiological, behavioural, cognitive and subjective (Keltner & Lerner, 2010). While there is evidence for a subjective, conscious component of emotions only in humans, the other components can potentially be used as indicators in nonhuman animals (Mendl et al., 2010).
Unlike the ‘discrete emotion approach’, which suggests the existence of a small number of fundamental emotions, the ‘dimensional approach’ proposes to characterize emotions according to their two main dimensions: arousal (bodily activation or excitation; e.g. calm versus excited) and valence (negative or positive; e.g. sad versus happy; Russell, 1980). This approach is very promising for the study of animal emotions (Mendl et al., 2010). Its recent use has allowed substantial progress to be made in identifying behavioural (e.g. pigs, Sus scrofa, Imfeld-Mueller, Van Wezemael, Stauffacher, Gygax, & Hillmann, 2011; review, Murphy, Nordquist, & van der Staay, 2014; sheep, Ovis aries, Reefmann, Bütikofer Kaszas, Wechsler, & Gygax, 2009a), physiological (e.g. hens, Gallus domesticus, Davies, Radford, & Nicol, 2014; sheep, Reefmann, Bütikofer Kaszas, Wechsler, & Gygax, 2009b) and cognitive indicators of emotional arousal and valence (goats, Capra hircus, Briefer & McElligott, 2013; rats, Rattus norvegicus, Burman, Parker, Paul, & Mendl, 2008; review, Mendl, Burman, Parker, & Paul, 2009). In addition, the relationship between an individual's inner state and the vocalizations it produces suggests that vocalizations are promising indicators of emotions (Briefer, 2012; Manteuffel, Puppe, & Schon, 2004).
Indicators of emotional arousal have been extensively studied in negative situations (e.g. stress, fear in farm animals, Forkman, Boissy, Meunier-Salaün, Canali, & Jones, 2007). Conversely, studies of arousal indicators during situations of positive valence are rare. Indicators that could allow us to differentiate between negative and positive situations (i.e. valence indicators) have also been poorly studied. Finding indicators of valence requires comparing animals that are exposed to negative versus positive situations. Yet, changes in parameter values between neutral and negative situations are often easier to detect than between neutral and positive situations, because negative emotions often trigger higher arousal levels than positive ones (Boissy et al., 2007). Another concern regarding research on indicators of emotions is that very few studies have investigated both arousal and valence in a given species (but see for example Gogoleva et al., 2010; Soltis, Blowers, & Savage, 2011). Additionally, the emotional situations that are used often differ in both dimensions simultaneously, or may differ in more than simply the emotions they trigger (e.g. comparing the effect of pain as a negative situation versus food reward as a positive one). This results in confusion about which dimension affects the measured parameters. More precise arousal indicators could assist in identifying and thus minimizing stress during negative situations, while more accurate valence indicators could allow us to distinguish between negative and positive situations. This would then lead to enhanced animal wellbeing by promoting situations that trigger positive emotions (Boissy et al., 2007).
In this study, we investigated indicators of both emotional arousal and valence in domestic goats. Goats are highly social and vocal animals that, in the wild (feral goats), live in complex fissionefusion societies (Stanley & Dunbar, 2013). This species should benefit from behavioural or vocal expression of emotions, as a mean to regulate social interactions within groups (Panksepp, 2009). Goats have good cognitive abilities, such as perspective taking (Kaminski, Call, & Tomasello, 2006) and conspecific gaze following (Kaminski, Riedel, Call, & Tomasello, 2005). They have the ability to use indirect information (i.e. the absence of food; Nawroth, von Borell, & Langbein, 2014b) and human pointing and touching cues (Nawroth, von Borell, & Langbein, 2014a) to find a reward. They also have good visual discrimination

learning abilities (e.g. Langbein, Nürnberg, & Manteuffel, 2004) and long-term memory (Briefer, Haque, Baciadonna, & McElligott, 2014; Briefer, Padilla de la Torre, & McElligott, 2012). The most common goat vocalization is the contact call, which is used to maintain contact at relatively close distance (Briefer & McElligott, 2011a). Goats produce two kinds of contact calls: closed-mouth and openmouth (Ruiz-Miranda, Szymanski, & Ingals, 1993). Contact calls contain information about individuality (Briefer & McElligott, 2011a), age, sex and body size (Briefer & McElligott, 2011b), kinship and even group membership of the producer (Briefer & McElligott, 2012). Playback experiments have shown that these vocalizations allow mothers and kids to recognize each other from at least 1 week postpartum (Briefer & McElligott, 2011a), and that mother goats remember the calls of their kids for up to 1 year after separation (Briefer et al., 2012). Goat behaviour and vocalizations have been shown to be affected by the degree of social isolation (complete or partial), suggesting the existence of indicators of negative arousal (Siebert, Langbein, Schon, Tuchscherer, & Puppe, 2011). In terms of potential indicators of valence, patterns of behaviour, sympathetic reactions and brain activity in goats have been shown to differ between positive and negative situations (i.e. different valence; Gygax, Reefmann, Wolf, & Langbein, 2013). In this study, we assessed physiological, behavioural and vocal profiles linked to both arousal and valence, by testing which dimension was most responsible for changes in the measured parameters.
We combined new frameworks recently adapted from humans to animals to analyse vocalizations (sourceefilter theory; Taylor & Reby, 2010) and emotions (Mendl et al., 2010), to find noninvasive indicators of emotions in goats. We placed goats in four situations likely to induce different emotional arousal and valence: control (neutral), anticipation of food reward (positive), food frustration (negative) and social isolation (negative). Physiological stress (nonspecific response of the body to any demand made upon it), and thus heart rate, increase with arousal, whether the situation is positive or negative (Seyle, 1976). For this reason, we assessed the arousal triggered by our experimental emotional situations by comparing the heart rates of goats in response to the tests. In the absence of well-established valence indicators in the literature, we inferred the valence of our situations based on knowledge of the function of emotions and on goat behaviour. We tested the hypothesis that emotional arousal and valence in goats are indicated by particular physiological, behavioural and vocal profiles. For instance, we expected physiological parameters linked to the autonomic nervous system (e.g. heart rate variability and respiration rate) to be affected by arousal, while behavioural and vocal parameters could indicate both dimensions (Briefer, 2012; ImfeldMueller et al., 2011; Reefmann, Wechsler, & Gygax, 2009). We defined the parameters that changed according to increased arousal levels as reliable indicators of arousal. Similarly, we defined the parameters that changed consistently from negative to positive valence as reliable indicators of valence.
METHODS
Subjects and Management Conditions
The study was carried out at a goat sanctuary (Buttercups Sanctuary for Goats, http://www.buttercups.org.uk), Kent, U.K. We tested 22 adult goats (11 females and 11 castrated males), which were fully habituated to human presence and could be led around using a lead rope (Baciadonna, McElligott, & Briefer, 2013; Briefer & McElligott, 2013), between May and June 2011. They were aged 3e17 years and of various breeds (Table 1). They had been at the sanctuary for at least 2 years (range 2e11 years). Five of these goats (three females and two males) had been rescued and brought to the sanctuary because of poor welfare conditions (three goats) or because they had been found abandoned (two goats). These five goats had been at the sanctuary for at least 4 years in 2011. The other goats had been housed in good conditions and were brought to the sanctuary because their owners could no longer keep them.

All goats at our study site are released into a large field during the day. At night, they are kept indoors in individual or shared pens (two or three goats, average size ¼ 3.5 m2 ) with straw bedding, within a larger stable complex. Routine care of the animals is provided by sanctuary employees and volunteers. Goats have ad libitum access to hay, grass (during the day) and water, and are also fed with a commercial concentrate in quantities according to their state and age. Every stable is cleaned on a daily basis. All goats are inspected each day by the sanctuary employees and volunteers, and are checked regularly by a vet and given medication when appropriate.
Table 1: Characteristics of the goats used: sex, age, breed and the number of calls analyzed for each goat
Goat Sex Age (Years) Breed Number of Calls
1 Female 11 Anglo Nubian 8
2 Female 16 British Toggenburg 0
3 Female 8 Pygmy goat 6
4 Female 11 Golden Guernsey 12
5 Female 7 British Alpine 2
6 Female 5 British Alpine 8
7 Female 14 British Toggenburg 10
8 Female 7 British Saanen 19
9 Female 7 British Toggenburg 3
10 Female 13 British Toggenburg 20
11 Female 17 British Saanen 0
12 Male 11 Pygmy goat 5
13 Male 10 Golden Guernsey 17
14 Male 8 Pygmy goat 0
15 Male 10 British Toggenburg 2
16 Male 7 British Toggenburg 11
17 Male 9 British Saanen 8
18 Male 4 Boer 12
19 Male 7 British Toggenburg 10
20 Male 3 Boer 9
21 Male 9 Mixed breed 6
22 Male 6 Golden Guernsey 2
Situations Inducing Emotional States
We designed three brief situations (5 min) of various arousal and valence, which were likely to elicit vocalizations by the goats (anticipation of food reward (positive), food frustration (negative) and social isolation (negative)). In addition, these situations were compared to a neutral, control situation. To avoid stress linked to isolation, goats were tested in familiar pairs (identical during the whole experiment) during the control, anticipation of food reward and food frustration situations, but not during the isolation situation. When tested in a pair, the two goats were located in adjacent pens. They could thus hear and see each other, but not physically interact.

We introduce the experimental situations here and give more details about the procedure in the section Experimental Procedure. (1) During the control situation, goats were left unmanipulated in a pen with hay (‘Control’). This situation did not elicit any calls, but allowed us to obtain baseline values for physiological and behavioural data. (2) The positive situation was the anticipation of an attractive food reward that the goats had been trained to receive during 3 days of habituation (‘Feeding’). (3) After goats had been tested with the Feeding situation, they were tested with a food frustration situation. This consisted of giving food to only one of the goats in the pair and not to the subject (‘Frustration’). (4) The second negative situation was brief isolation, out of sight from conspecifics behind a hedge. For this situation, goats were tested alone and not in a pair (‘Isolation’).
Determination of Arousal Levels and Valence of the Situations
The relative level of activity of the autonomic nervous system is determined to a great extent by current emotions (von Borell et al., 2007). Heart rate is a well-recognized indicator of physiological stress (e.g. Forkman et al., 2007), which is linked to emotional arousal during situations of both positive and negative valence (Seyle, 1976). Therefore, to determine arousal levels, we assessed between-situation differences in heart rate. By contrast, no clearly established indicator of emotional valence exists for goats or related mammals in the literature, because few studies have investigated both emotional arousal and valence simultaneously (in order to highlight clear indicators of valence that are not influenced by arousal). The valence of our situation was thus inferred from knowledge of the function of emotions and of goat behaviour.
Positive emotions result from encounters with rewarding stimuli that enhance fitness. They trigger approach behaviour towards the reward (Mendl et al., 2010). Negative emotions result from encounters with punishing stimuli that threaten fitness, and they trigger avoidance behaviour (Mendl et al., 2010). Accordingly, situations that involve a stimulus that can enhance fitness (e.g. food reward) and that an animal would want to approach can be assumed to be positive. By contrast, situations that involve a stimulus that somehow threatens fitness and that an animal would try to avoid can be assumed to be negative.
The Control situation was assumed to be neutral (i.e. intermediate between positive and negative valence). There is some evidence suggesting that appetitive anticipation of a reward induces positive emotional states (e.g. satisfaction/contentment; Boissy et al., 2007; Moe et al., 2009; Spruijt, van den Bos, & Pijlman, 2001). We thus assumed the Feeding (anticipation of food reward) situation as positive for goats, because this situation would enhance fitness through the acquisition of a food reward. However, failure to obtain expected food is likely to lead to a high arousal negative state (Mendl et al., 2010; Rolls, 2005). The Frustration situation was therefore considered as negative for the goats, because this situation would (in the wild at least) threaten fitness through the lack of food intake. Finally, isolation (even during a short period) for social herd-living animals such as goats can be stressful (Price & Thos, 1980; Siebert et al., 2011). Consequently, we considered the Isolation situation to be also negative for goats, because it could potentially threaten fitness through greater exposure to predators.
Techniques Used for Data Collection
We collected physiological data using a small wireless noninvasive monitor, fixed to a belt placed around the goat's chest (MLE120X BioHarness Telemetry System, Zephyr Technology Corporation, Annapolis, MD, U.S.A.). For detailed behavioural analyses, all tests were video-recorded using a Sony DCR-SX50E camcorder. Finally, vocalizations were continuously recorded during the tests at distances of 3e5 m from the vocalizing animal using a Sennheiser MKH-70 directional microphone (frequency response 50e20

000 Hz; max SPL 124 dB at 1 kHz), connected to a Marantz PMD-660 numeric recorder (sampling rate: 44.1 kHz).
Experimental Procedure
During the Control, Feeding and Frustration situations, goat pairs were tested in two indoor adjacent pens, 3 m2 each, within a familiar larger stable complex. During the Isolation situation, they were tested individually in a 3.4 m2 and 2.10 m high outdoor pen made of gaited hurdles, in a familiar field (usual daytime range) out of sight from other goats. To minimize stress linked to novelty, the emotional tests were preceded by 3 days of habituation. During these 3 days, goats were gradually habituated to the set-up, to the measurement equipment (i.e. wireless noninvasive monitor) and to the Feeding and Isolation situations (both repeated once per day, during the 3 habituation days). They were not habituated to the Control situation (everyday situation), nor to the Frustration situation, to ensure that food was always expected during the Feeding situation. Goats were then tested over 3 days with one test per day (i.e. Feeding, Frustration and Isolation situations).
(1) The Control situation (no habituation) was carried out on 2 consecutive days. On each of these 2 days, we placed the pair of goats in adjacent pens for 5 min, with hay in the feeders, and left them undisturbed. (2) For the Feeding situation, each pair of goats was placed in the indoor pens for a 5 min pretest with hay in the feeders. At the end of the 5 min pretest, on the first habituation day, an experimenter (same person throughout the experiment) presented two buckets with food (commercial concentrate for goats with fresh chestnut tree leaves) simultaneously to the two goats for 1 min, before giving them the food. On the second and third habituation days, and on the test day, the hay was removed for 2 min before the food presentation, in order to increase food motivation. Then, the experimenter presented the food simultaneously to the two goats for 20 s, walked outside the stable complex for 1 min, and walked back towards the goats while shaking the food bucket to make it obvious, and presented the food again for 20 s. Then, he walked away a second time for 1 min, walked back and gave them the food. This allowed us to obtain three events (before the first and second 20 s presentation and before giving them food), when the experimenter approached the goats with food, resulting in the production of vocalizations. (3) The Frustration situation (no habituation) started in the same way as the Feeding situation, with a 5 min pretest (with hay), followed by 2 min during which the hay had been removed. Then, the experimenter presented the food buckets (similar buckets and food as during the Feeding situation) during 20 s simultaneously to the two goats and gave food to only one of the goats in the pair, while the subject did not receive food. This lasted for 4 min, after which the experimenter also gave food to the subject. (4) To habituate the goats to the Isolation situation, goats were placed in pairs on the first 2 habituation days, in two identical and adjacent pens, out of sight of the other goats, for 5 min. On the last habituation day, the adjacent pen was removed and each goat was placed in the test pen alone. On the test day, the Isolation situation started with a 5 min pretest, during which the subject was placed in the indoor pen used for the other situations, with hay and with the paired goat in the adjacent pen. This allowed the subject to settle down after it was equipped with the heart rate monitor. Then, the subject was placed alone in the outdoor isolation pen and left there for 5 min. At the end of the 5 min, it was returned to the other goats.
The 22 goats were tested in every situation (repeated measure design). On habituation days, goats were placed in both the Feeding and Isolation situations each day in a random order. During the 3 test days (one test per day), the order of the emotional situations was pseudorandom. The only constraint was that, for each individual, the Feeding situation always preceded the Frustration situation (1e6 days before), to ensure a positive state during the Feeding situation. Within a pair, both goats were tested with the Control and Feeding situations at the same time. This prevented food frustration if one of the goats was not simultaneously tested. They were tested with the two other tests (Frustration and Isolation) on different

days for each goat in the pair. The Control situation was carried out on different days to the emotional situations.
Response Measures
Physiological measures
We measured heart rate and respiration rate, which are likely to be affected by emotions (Reefmann et al., 2009b; von Borell et al., 2007), and are part of the stress response of the sympatho-adreno-medullary axis (SAM; i.e. neuronal or ‘fight-or- flight’ response), as opposed to the stress response of the second main stress axis, the hypothalamo-pituitary-adrenocortical axis (HPA; i.e. humoral response). Because vocalizations are affected by the autonomic nervous system (ANS; Scherer, 1986, 2003), vocal parameters are more likely to be correlated with the SAM response indicators than the HPA response indicators (e.g. cortisol), at least over short timescales (Schrader & Todt, 1998). Before the experiment, we quickly clipped a small patch of hair below the heart rate monitor, to improve the contact between the electrodes and the body. Goats were equipped with the monitor before each situation, on both the habituation and test days. This technology was also removed immediately after each test. ECG gel was applied on the parts of the belt containing the electrodes before each use. The data (continuous ECG trace and breathing wave, i.e. inhalation/ exhalation cycle) were then transmitted and stored in real time to a laptop using LabChart software v.7.2 (ADInstrument, Oxford, U.K.) for later analyses. During the tests, one experimenter, who was concealed in a pen close to the subjects, quietly recorded comments into the software indicating important events (e.g. when the other experimenter was presenting food to the goats, leaving or coming back during the Feeding situation, or when the paired goat was given food and finished eating during the Frustration experiment). This allowed us to measure physiological parameters at the exact times when these events occurred.
When possible (i.e. good-quality signal; clearly visible heart beats on the ECG trace and respiration on the breathing wave), we analysed data for each situation over three 10 s sections, in which the software could track the heart beats (ECG trace) and the inspirationeexhalation cycles (breathing wave) accurately (Reefmann, Wechsler, & Gygax, 2009: mean ± SD for each of the three sections: Control: 10.03 ± 0.03 s; Feeding: 9.26 ± 0.19 s; Frustration: 9.83 ± 0.10 s; Isolation: 9.69 ± 0.14 s). For the Control situation, the three sections were collected at the beginning, middle and end of the time starting 1 min after the tested pair of goats was placed in the adjacent pens with hay in the feeder. This allowed the goats to settle down before we started data collection. For the Feeding situation, the first section corresponded to the time just before the first food presentation, the second section to the time when the experimenter came back with the food for the first time (i.e. after opening the door to enter the stable complex), and the third section to the time when the experimenter came back with the food for the second time (i.e. after opening the door to enter the stable complex and just before giving the food). The data were thus collected only when the subject could hear/see the experimenter coming towards them with food, and was likely to be experiencing a positive state. This also ensured that our data would reflect an anticipatory state, as opposed to a consummatory state while feeding or a postconsummatory state after feeding, which are likely to be of different arousal (Spruijt et al., 2001). For the Frustration situation, the three sections were collected at the beginning, middle and end of the time starting when the other goat in the pair received food, until this goat finished eating. This ensured that the data were collected while the subject could see and hear the paired goat eating. The subject was thus likely to be experiencing a negative state of frustration throughout data collection. By contrast, the situation in which both goats were not eating (after the pair goat finished) or the situation in which the subject was itself eating are likely to trigger different arousal and valence and were thus not considered for analyses. Finally, for the Isolation situation, the three sections were collected at the beginning, middle and end of the time starting 1 min after the subject was placed in the isolation pen, until the end of the Isolation situation 4 min later (isolation duration ¼ 5
min). This allowed the goat to settle in the isolation pen and to be likely to be experiencing a negative state of isolation, before we started data collection.
From the ECG trace and breathing wave, we analysed the following parameters: heart rate, heart rate variability (root mean square of successive interbeat interval differences, ‘RMSSD’) and respiration rate. The heart rate (beats/min) and respiration rate (breaths/s) averages were obtained automatically from the software. Individual intervals between heart beats (ms) were also extracted, to calculate RMSSD (ms; Table 2).
Behavioural measures
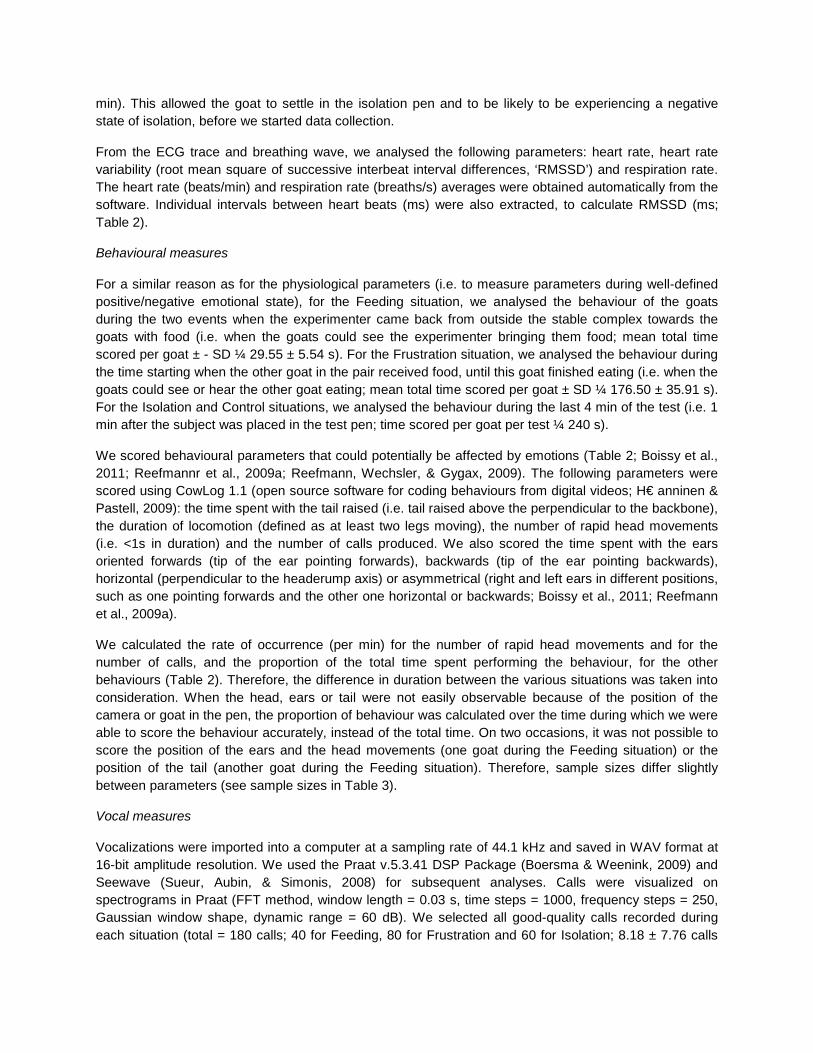
For a similar reason as for the physiological parameters (i.e. to measure parameters during well-defined positive/negative emotional state), for the Feeding situation, we analysed the behaviour of the goats during the two events when the experimenter came back from outside the stable complex towards the goats with food (i.e. when the goats could see the experimenter bringing them food; mean total time scored per goat ± - SD ¼ 29.55 ± 5.54 s). For the Frustration situation, we analysed the behaviour during the time starting when the other goat in the pair received food, until this goat finished eating (i.e. when the goats could see or hear the other goat eating; mean total time scored per goat ± SD ¼ 176.50 ± 35.91 s). For the Isolation and Control situations, we analysed the behaviour during the last 4 min of the test (i.e. 1 min after the subject was placed in the test pen; time scored per goat per test ¼ 240 s).
We scored behavioural parameters that could potentially be affected by emotions (Table 2; Boissy et al., 2011; Reefmannr et al., 2009a; Reefmann, Wechsler, & Gygax, 2009). The following parameters were scored using CowLog 1.1 (open source software for coding behaviours from digital videos; H€ anninen & Pastell, 2009): the time spent with the tail raised (i.e. tail raised above the perpendicular to the backbone), the duration of locomotion (defined as at least two legs moving), the number of rapid head movements (i.e. <1s in duration) and the number of calls produced. We also scored the time spent with the ears oriented forwards (tip of the ear pointing forwards), backwards (tip of the ear pointing backwards), horizontal (perpendicular to the headerump axis) or asymmetrical (right and left ears in different positions, such as one pointing forwards and the other one horizontal or backwards; Boissy et al., 2011; Reefmann et al., 2009a).
We calculated the rate of occurrence (per min) for the number of rapid head movements and for the number of calls, and the proportion of the total time spent performing the behaviour, for the other behaviours (Table 2). Therefore, the difference in duration between the various situations was taken into consideration. When the head, ears or tail were not easily observable because of the position of the camera or goat in the pen, the proportion of behaviour was calculated over the time during which we were able to score the behaviour accurately, instead of the total time. On two occasions, it was not possible to score the position of the ears and the head movements (one goat during the Feeding situation) or the position of the tail (another goat during the Feeding situation). Therefore, sample sizes differ slightly between parameters (see sample sizes in Table 3).
Vocal measures
Vocalizations were imported into a computer at a sampling rate of 44.1 kHz and saved in WAV format at 16-bit amplitude resolution. We used the Praat v.5.3.41 DSP Package (Boersma & Weenink, 2009) and Seewave (Sueur, Aubin, & Simonis, 2008) for subsequent analyses. Calls were visualized on spectrograms in Praat (FFT method, window length = 0.03 s, time steps = 1000, frequency steps = 250, Gaussian window shape, dynamic range = 60 dB). We selected all good-quality calls recorded during each situation (total = 180 calls; 40 for Feeding, 80 for Frustration and 60 for Isolation; 8.18 ± 7.76 calls

per goat; range 0 (three goats)--30; Table 1). Because calls were produced intermittently by the goats (unlike physiological and behavioural data which could be acquired continuously), we used a more opportunistic approach in order to obtain adequate sample sizes of vocalizations. During the Feeding situation, we analysed calls produced between the time when the experimenter approached the goats for the first time with the food, until they were rewarded. During the Frustration situation, we analysed calls produced between the time when the other goat received food and the time preceding the return of the experimenter towards the subject to give it food. During the Isolation situation, we analysed all the calls produced while the subject was in the isolation pen. Calls were never produced in bouts. Because consecutive calls produced in bouts are more likely to be homogeneous, we avoided pseudoreplication (Reby, Joachim, Lauga, Lek, & Aulagnier, 1998).
Table 2: Abbreviations, definition and correlations for the physiological, behavioural and vocal parameters
Abbreviation Correlated with Parameter
Physiology RMSSD (ms) HR Root mean square of successive interbeat interval differences
RespRate (breaths/s) HR Respiration rate
Behaviour HeadMov (per min) EarsHoriz Number of rapid head movements/min
Locomotion EarsForw, EarsAsym, TailUp Proportion of time spent moving
EarsForw Locomotion, EarsHoriz EarsBack, EarsAsym, TailUp
Proportion of time spent with the ears oriented forwards
EarsHoriz HeadMov, EarsForw, TailUp Proportion of time spent with the ears oriented horizontally
EarsBack EarsForw, EarsAsym Proportion of time spent with the ears oriented backwards
EarsAsym Locomotion, EarsForw, EarsBack Proportion of time spent with the ears asymmetrical (different orientation for the right and left ears)
TailUp Locomotion, EarsForw, EarsHoriz Proportion of time spent with the tail up
Calls (per min) None Number of calls/min
Vocalizations Dur (s) None Duration of the call
F0mean (Hz) F0end, F0range, FMextent, AMextent, Q25%, Q50% Mean F0 frequency value across the call
F0end (Hz) F0mean, F0range, Q50%, Q75% Frequency value of F0 at the end of the call
F0range (Hz) F0mean, F0end, FMextent Difference between the maximum and minimum F0 frequency values measured across the call
FMextent (Hz) F0mean, F0range Mean peak-to-peak variation of each F0 modulation
AMextent (dB) F0mean Mean peak-to-peak variation of each amplitude modulation
Q25% (Hz) F0mean, Q50%, Q75% Frequency value at the upper limit of the first quartile of energy
Q50% (Hz) F0mean, F0end, Q25%, Q75% Frequency value at the upper limit of the second quartile of energy
Q75% (Hz) F0end, Q25%, Q50% Frequency value at the upper limit of the third quartile of energy
F1mean (Hz) F2mean Mean frequency value of the first formant
F2mean (Hz) F1mean, F3mean, F4mean Mean frequency value of the second formant
F3mean (Hz) F2mean, F4mean Mean frequency value of the third formant
F4mean (Hz) F2mean, F3mean Mean frequency value of the fourth formant
Correlations across individuals between a given parameter and others within its category (physiological, behavioural or vocal) are indicated when significant (Spearman rank correlation: P < 0.05).

Table 3: Effect of arousal and valence on physiological and behavioural parameters
Residuals of the models controlled for locomotion (physiology only), sex and age of the goats, individual identity, test air and breed (mean ± SD; raw values are listed in Appendix Table A2), along with statistical results (c2 values, sample size (N) and P values). The direction of the effect is indicated (‘<’ indicates an increase with arousal level or from negative to positive valence, whereas ‘>’ indicates a decrease; NC indicates that the effect was not consistent, i.e. increase followed by decrease or vice versa). Significant results are shown in bold.
Table 4: Results of AIC comparisons for behavioural parameters significantly affected by both arousal and valence
Parameter Arousal/valence AICC ∆AICC ɷi
HeadMov A 215.47 0.00 1.00
V 234.49 19.01 0.00
EarsBack A 115.60 26.94 0.00
V 88.66 0.00 1.00
EarsAsym A 125.39 10.19 0.01
V 115.20 0.00 0.99
TailUp A 109.17 5.14 0.07
V 104.03 0.00 0.93
The best fit (arousal or valence based on lowest AICC) for a given response variable (set of models) is indicated in bold. The fit of the models is assessed by Akaike's information criterion corrected for small sample sizes (AICC). DAICC gives the difference in AICC between each model and the best model. The Akaike's weights (ui) assess the relative support that a given model has from the data, compared to other candidate model in the set.
Parameter Arousal Valence
0 1 x21 (N) P Negative Neutral Positive x2
1 (N) P
Mean SD Mean SD Mean SD Mean SD Mean SD
RMSSD .05 .42 -.07 0.40 7.05(311) .008 > .01 .42 .03 .41 -.10 .41 1.58(311) .21
RespRate -.10 .28 .17 0.26 76.69(311) <.0001 < .05 .32 -.12 .25 .18 .23 .75(311) .39
HeadMov -.56 .76 .54 0.80 35.59(85) <.0001 < -.23 .70 -.41 .99 .86 .86 16.58(85) <.0001 NC
Locomotion -.18 .44 .18 0.58 9.39(88) .002 < .05 .55 -.17 .42 .08 .61 .00(88) .96
EarsForw -.03 .09 .03 0.08 11.36(83) .0008 < .01 .07 -.10 .07 .06 .06 2.14(83) .14
EarsHoriz .29 1.21 -.57 0.63 15.43(83) <.0001 > -.52 .71 1.42 .77 -.74 .04 .21(83) .65
EarsBack .37 .99 -.15 1.20 4.56(83) .033 > .63 .77 -.01 1.16 -.91 1.03 31.50(83) <.0001 >
EarsAsym .30 1.11 -.24 1.17 4.56(83) .033 > .32 1.11 .34 1.10 -.89 .84 14.75(83) .0001 NC
TailUp -.20 .97 .27 0.78 5.64(85) .018 < -.25 .92 .16 .90 .50 .68 10.78(85) .001 <
Calls -.46 1.03 .36 1.11 11.61(85) .0007 < .23 1.13 -1.09 .15 .52 1.09 .03(85) .87

According to the sourceefilter theory of voice production (Fant, 1960), mammal vocalizations are generated by vibrations of the vocal folds (source, determining the fundamental frequency, ‘F0’), and are subsequently filtered by the supralaryngeal vocal tract (filter, producing amplified frequencies called ‘formants’, Titze, 1994; Taylor & Reby, 2010). We extracted source- and filter-related vocal parameters as well as intensity and duration measures using a custom-built program in Praat. This program batch processed the analyses and exporting of output data (Charlton, Zhihe, & Snyder, 2009a; Reby & McComb, 2003). The vocal parameters measured are listed in Table 2 and the analyses are detailed in the Appendix.
The settings for the analyses were adapted from Briefer and McElligott (2011a). Goat contact calls vary between individuals, particularly at the level of F0-related parameters, formant-related parameters and energy quartiles (see Table 2 for definitions; Briefer & McElligott, 2011a). Therefore, the most appropriate settings to accurately detect F0 (i.e. pitch floor and pitch ceiling) and formants (i.e. maximum number of formants and maximum formant value; see Appendix for details) with Praat differed between individuals. To prevent biases linked to the settings used for the analyses, the same settings were used for all calls (i.e. produced during all situations) of a given individual. We included 13 vocal parameters in our analyses. Some parameters (formants) could not be measured in every call, resulting in a small proportion of missing values. Therefore, the sample size (number of calls) differs between the vocal parameters (see sample size in Table 5).
Statistical Analysis
First, to investigate which physiological, behavioural or vocal parameters would be more useful as indicators of emotions (as opposed to which ones were correlated and therefore redundant), we tested for potential correlations between the mean parameter values for each individual using Spearman rank correlation. Then, to test for differences in heart rate between situations and determine arousal levels, we carried out a linear mixed-effects model (LMM; lmer function, lme4 library; Pinheiro & Bates, 2000) in R 3.0.2 (R Development Core Team, 2013). This model included heart rate as a response variable, and the sex and age of the goats as fixed factors to control for their effects. The situation (Control, Feeding, Frustration and Isolation) was included as a fixed factor. Finally, the identity of the goats nested within the test pair was included along with the breed as crossed random factors, to control for repeated measurements of the same subjects, for the impact of the goats within a pair on each other, and for breed differences (Table 1). Then, two-by-two comparisons between the four emotional situations were carried out using LMMs including the same control, fixed and random factors. We applied a Bonferroni correction at a ¼ 0.017 (0.05/3 comparisons) for these post hoc tests. Based on these results, we ranked the situations according to the heart rate values they triggered; we attributed the highest arousal level to the situation triggering the highest heart rate and the lowest arousal level to the one triggering the lowest heart rate. Situations that did not differ in heart rate were considered to be of the same arousal level.
We ran further models to test the effects of arousal and valence on the other physiological, behavioural and vocal parameters measured (Table 2). Separate LMMs were set up for each parameter. All of these models included the parameter as a response variable and the same control and random factors as listed above for heart rate (sex and age of the goats as control factors; identity of the goats nested within the test pair along with breed as crossed random factors). The proportion of time spent moving (Locomotion) was also included as a fixed factor for the physiological parameters, to control for its effect. The extent of mouth opening influences the resonant properties of the vocal tract (Titze, 1994). Several vocal parameters thus typically differ between closed- and open-mouth calls (Sebe, Duboscq, Aubin, Ligout, & Poindron, 2010). For this reason, we added the type of call (open-mouth, closed-mouth or mixed, referring to calls containing both open-mouth and closed-mouth parts) as a fixed factor in the models
carried out on the vocal parameters to control for the potential differences between call types (see Appendix Table A1 for the results of the control factors).
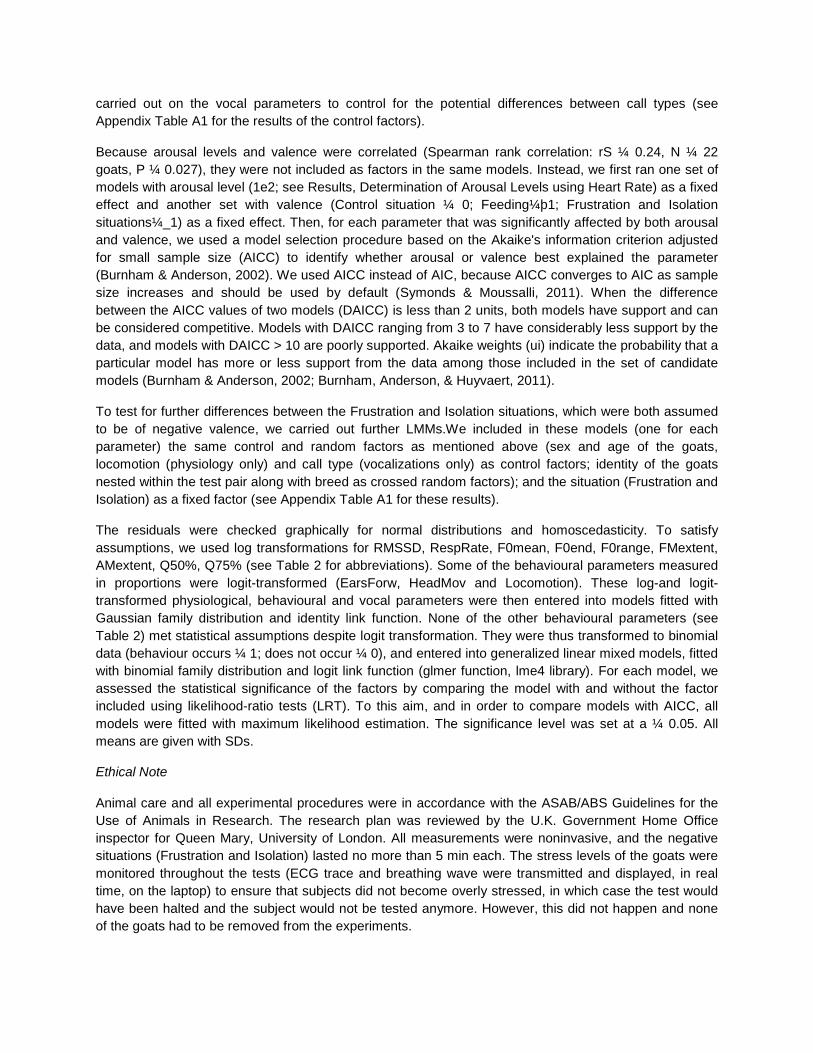
Because arousal levels and valence were correlated (Spearman rank correlation: rS ¼ 0.24, N ¼ 22 goats, P ¼ 0.027), they were not included as factors in the same models. Instead, we first ran one set of models with arousal level (1e2; see Results, Determination of Arousal Levels using Heart Rate) as a fixed effect and another set with valence (Control situation ¼ 0; Feeding¼þ1; Frustration and Isolation situations¼_1) as a fixed effect. Then, for each parameter that was significantly affected by both arousal and valence, we used a model selection procedure based on the Akaike's information criterion adjusted for small sample size (AICC) to identify whether arousal or valence best explained the parameter (Burnham & Anderson, 2002). We used AICC instead of AIC, because AICC converges to AIC as sample size increases and should be used by default (Symonds & Moussalli, 2011). When the difference between the AICC values of two models (DAICC) is less than 2 units, both models have support and can be considered competitive. Models with DAICC ranging from 3 to 7 have considerably less support by the data, and models with DAICC > 10 are poorly supported. Akaike weights (ui) indicate the probability that a particular model has more or less support from the data among those included in the set of candidate models (Burnham & Anderson, 2002; Burnham, Anderson, & Huyvaert, 2011).
To test for further differences between the Frustration and Isolation situations, which were both assumed to be of negative valence, we carried out further LMMs.We included in these models (one for each parameter) the same control and random factors as mentioned above (sex and age of the goats, locomotion (physiology only) and call type (vocalizations only) as control factors; identity of the goats nested within the test pair along with breed as crossed random factors); and the situation (Frustration and Isolation) as a fixed factor (see Appendix Table A1 for these results).
The residuals were checked graphically for normal distributions and homoscedasticity. To satisfy assumptions, we used log transformations for RMSSD, RespRate, F0mean, F0end, F0range, FMextent, AMextent, Q50%, Q75% (see Table 2 for abbreviations). Some of the behavioural parameters measured in proportions were logit-transformed (EarsForw, HeadMov and Locomotion). These log-and logit-transformed physiological, behavioural and vocal parameters were then entered into models fitted with Gaussian family distribution and identity link function. None of the other behavioural parameters (see Table 2) met statistical assumptions despite logit transformation. They were thus transformed to binomial data (behaviour occurs ¼ 1; does not occur ¼ 0), and entered into generalized linear mixed models, fitted with binomial family distribution and logit link function (glmer function, lme4 library). For each model, we assessed the statistical significance of the factors by comparing the model with and without the factor included using likelihood-ratio tests (LRT). To this aim, and in order to compare models with AICC, all models were fitted with maximum likelihood estimation. The significance level was set at a ¼ 0.05. All means are given with SDs.
Ethical Note
Animal care and all experimental procedures were in accordance with the ASAB/ABS Guidelines for the Use of Animals in Research. The research plan was reviewed by the U.K. Government Home Office inspector for Queen Mary, University of London. All measurements were noninvasive, and the negative situations (Frustration and Isolation) lasted no more than 5 min each. The stress levels of the goats were monitored throughout the tests (ECG trace and breathing wave were transmitted and displayed, in real time, on the laptop) to ensure that subjects did not become overly stressed, in which case the test would have been halted and the subject would not be tested anymore. However, this did not happen and none of the goats had to be removed from the experiments.

Table 5: Effect of arousal and valence on vocal parameters
Residuals of the models controlled for call type, sex and age of the goats, individual identity, test pair and breed (mean ± SD; raw values are listed in Appendix Table A2), along with statistical results (c2 values, sample size (N) and P values). The direction is indicated for the significant and marginally significant (0.06 _ P _ 0.05) effects (‘<’ indicates an increase with arousal level or from negative to positive valence, whereas ‘>’ indicates a decrease). Significant and marginally significant results are shown in bold.
RESULTS
Determination of Arousal Levels Using Heart Rate
The analysis of heart rate as a function of the emotional situations revealed two arousal levels (1 and 2; Fig. 1). Heart rates differed according to the situation (LMM: c23 ¼ 53:03, P < 0.0001), with the lowest values occurring during the Control situation. These heart rates were not different from those obtained for the Isolation situation (Control versus Isolation; LMM: c21 ¼ 0:69, P ¼ 0.41). Therefore, we attributed an arousal level of 1 (lowest) to the Control and Isolation situations. The heart rates measured during the Isolation situation were significantly lower than those measured during the Frustration situation (Isolation versus Frustration; LMM: c21 ¼ 12:24, P ¼ 0.0005). Finally, the rates for the Frustration situation were not significantly different from those obtained for the Feeding situation, after Bonferroni correction (Frustration versus Feeding; LMM: c21 ¼ 4:36, P ¼ 0.037; Bonferroni, a ¼ 0.017). Frustration and Feeding situations thus received an arousal level of 2. To summarize, the arousal levels based on heart rate were 1 for the Control and Isolation situations (mean ± - SD ¼ 108.75 ± 15.38 beats/min) and 2 for the Frustration and Feeding situations (mean ± SD ¼ 123.00 ± 23.52 beats/min).
Physiological Responses
Correlation analyses between the mean physiological parameters of each goat showed no associations between RMSSD and RespRate (Spearman rank correlation: rS¼_0.09, N ¼ 22 goats, P ¼ 0.69). The
Parameter Arousal Valence
0 1 x21 (N) P Negative Positive x2
1 (N) P
Mean SD Mean SD Mean SD Mean SD
Duration -.01 .13 .00 .11 .35(158) .55 .00 .12 -.001 .11 .63(158) .43
F0mean -.02 .10 .01 .10 4.67(158) .031 < .00 .11 .01 .10 .23(158) .63
F0end -.05 .19 .03 .15 13.36(158) .0003 < -.01 .17 .04 .15 3.43(159) .06
F0range .04 .38 -.02 -.47 1.20(158) .27 .05 .43 -.16 .43 6.88(158) .009 >
FMextent .09 .44 -.04 .59 3.20(158) .07 .05 .52 -.17 .58 5.26(158) .022 >
AMextent .01 .43 .00 .31 .03(158) .85 -.02 .36 .07 .31 2.06(158) .15
Q25% -20.02 88.36 10.01 73.00 7.10(158) .008 < -2.39 77.25 8.36 87.38 .57(158) .45
Q50% -.10 .37 .05 .28 12.50(158) .0004 < -.01 .33 .05 .29 1.25(158) .26
Q75% -.08 .50 .04 .32 5.84(158) .016 < -.01 .40 .04 .35 .68(158) .41
F1mean 40.15 106.75 -17.27 81.65 16.56(112) <.0001 > -4.37 94.77 15.69 87.77 1.07(112) .30
F2mean 11.58 152.13 -3.05 101.45 .46(95) .50 .72 122.46 -2.35 77.90 .02(95) .90
F3mean -6.08 102.16 1.80 118.64 .14(98) .71 3.46 120.46 -11.11 94.95 .36(98) .55
F4mean -36.93 90.44 11.04 146.92 3.68(92) .055 < 5.44 136.34 -19.16 141.12 .68(92) .41

models investigating the link between physiological parameters and emotional arousal and valence of the situations revealed that the two measured parameters (RMSSD and RespRate) were influenced by arousal but not by valence (Table 3, Appendix Table A2). RMSSD decreased and RespRate increased with arousal (Table 3). To summarize, RMSSD and RespRatewere good indicators of arousal, as they were affected by arousal levels and not by valence. During higher arousal situations, goats had lower heart rate variability (RMSSD) and higher respiration rates. There were no clear physiological indicators of valence.
Behavioural Responses
Correlation analyses between the mean behavioural parameters of each goat showed several associations between most of the ear positions (EarsForw, EarsHoriz and EarsAsym) and some of the other behavioural parameters (HeadMov, Locomotion and TailUp; Table 2). EarsBack was only correlated with other ear position parameters (EarsForw and EarsAsym). Finally, the number of calls per min (Calls) was not correlated with any of the other behavioural parameters.
The analyses of behavioural parameters in relation to the emotional arousal and valence of the situations revealed that all measured parameters were affected by arousal (Table 3, Appendix Table A2). HeadMov, Locomotion, EarsForw, TailUp and Calls increased with arousal, whereas EarsHoriz, EarsBack and EarsAsym decreased. Four of the parameters were also affected by valence (HeadMov, EarsBack, EarsAsym and TailUp; Table 3, Appendix Table A2). EarsBack decreased and TailUp increased from negative to positive valence. HeadMov and EarsAsym were not affected consistently by valence (level: HeadMov,e > 0 < þ; EarsAsym, e < 0 > þ). AICC comparison revealed that the variation in HeadMov was better explained by arousal (100% chance to be the best model) than valence, whereas the variation in EarsBack and EarsAsym was better explained by valence (100% and 99% chance, respectively, to be the best model) than arousal. For TailUp, the DAICC was 5.14, indicating that the model including valence had considerably more support by the data than the model including arousal. The model including valence had 93% chance to be the best model (chance level ¼ 50%; Table 4).
To summarize, HeadMov, Locomotion, EarsForw, EarsHoriz and Calls were good indicators of arousal, as they were clearly more affected by arousal levels than valence. During high arousal situations, goats displayed more head movements, moved more, had their ears pointed forwards more often and to the side (horizontal) less often and produced more calls. By contrast, EarsBack and TailUp were good indicators of valence, as they changed consistently from negative to positive valence (unlike EarsAsym), and were more affected by valence levels than arousal (DAICC > 5). In positive situations, as opposed to negative ones, goats had their ears oriented backwards less often and spent more time with the tail up.
Vocal Responses
Correlation analyses between the mean vocal parameters of each goat showed several associations between most of the F0-related parameters (F0mean, F0end, F0range and FMextent; Table 2). Some of these F0-related parameters (F0mean and F0end) were also correlated with energy quartiles (Q25%, Q50%, and Q75%), which were all correlated with each other. AMextent was only correlated with F0mean. F1mean was correlated with F2mean. Finally, F2mean, F3mean and F4mean were all related to each other.
Our analyses of vocal parameters as a function of the arousal levels and valence of the situations revealed six parameters that were significantly influenced by arousal (Table 5, Appendix Table A2). F0mean and F0end (which characterize F0 contour over time), as well as Q25%, Q50%, and Q75%

(energy quartiles), increased with arousal, whereas F1mean decreased. F4mean also tended to increase, but the effect of arousal on this parameter was only marginally significant (P ¼ 0.055). Two parameters were influenced by valence (Table 5, Appendix Table A2). F0range and FMextent (which characterize F0 variation within the call) both decreased from negative to positive valence. The other parameters were not affected by arousal or by valence (Table 5).
To summarize, F0mean, F0End, Q25%, Q50%, Q75% and F1mean were good indicators of arousal, as they were affected by arousal and not by valence. With an increase in arousal, goats produced calls with higher F0 and higher energy distribution (i.e. energy quartiles). Furthermore, the first formant frequency decreased, whereas the fourth formant tended to increase. By contrast, F0range and FMextent were good indicators of valence, as they were affected by valence and not by arousal. In positive situations, as opposed to negative ones, goats produced calls with a lower fundamental frequency range and smaller frequency modulations (Fig. 2 and see the Supplementary audio files).
Figure 1. Heart rate as a function of emotional situations. Model residuals of heart rate controlled for sex and age of the goats, individual identity, test pair and breed for each of the experimental situations (Control, Feeding, Frustration and Isolation situations; box plot: the horizontal line shows the median, the box extends from the lower to the upper quartile and the whiskers to 1.5 times the interquartile range above the upper quartile or below the lower quartile; circles indicate outliers). The black squares indicate the mean. Same letters (a, b) indicate that situations did not differ significantly. Based on these results, situations marked with an ‘a’ received an arousal level of 1; situations marked with a ‘b’ received an arousal level of 2. Arousal levels (1 or 2) and valence (Neutral, Positive and Negative) corresponding to the situations are also indicated under the box plot (arousal/valence).

Figure 2. Spectrograms of negative and positive calls. (a) Call produced during the negative situation; (b) call produced during the positive situations by the same goat. Positive calls have a lower fundamental frequency (F0) range and smaller frequency modulations than negative calls. The first four formants (F1-F4) are also indicated on the right of the spectrogram. These calls are available as audio files in the Supplementary Material.
DISCUSSION
We investigated changes in physiological, behavioural and vocal parameters between situations potentially triggering different arousal and valence, to identify noninvasive indicators of emotions in goats. We found physiological, behavioural and vocal indicators of arousal. All these parameters changed consistently with increasing arousal and were clearly more affected by arousal than valence. We also found behavioural and vocal indicators of valence that changed consistently from negative to positive valence, and were clearly more affected by valence than arousal. Arousal indicators could help to identify and therefore minimize stress during negative situations. By contrast, valence indicators could help to differentiate between negative and positive situations, to reduce negative emotions and increase positive ones. In particular, the behavioural indicators that we found are relatively easy to observe. The potential to more effectively monitor animal emotions (and therefore also moods) is critical to our overall understanding of animal behaviour and wellbeing in general (Boissy et al., 2007; Mendl et al., 2010; Nettle & Bateson, 2012), as well as our understanding of the evolution of emotions.
Physiological Indicators
We used heart rates in this study to determine arousal levels triggered by the various situations. We found that this parameter was higher during the food frustration and anticipation of food reward situations than during the isolation and control situations. Isolation in social species normally induces high stress levels and an increase in heart rates (e.g. in ungulates; cattle, Bos taurus, Boissy & Le Neindre, 1997; sheep, Reefmann, Wechsler, & Gygax, 2009; goats, Aschwanden, Gygax, Wechsler, & Keil, 2008). Therefore, it is surprising that our social isolation situation induced heart rate values that were similar to the control situation. Our tests were preceded by 3 days of habituation, to minimize stress linked to novelty. Goats seemed to decrease stress-related behaviours over the days of habituation (E.F. Briefer, personal observation), suggesting that they could have fully habituated to the isolation situation after 3 days. This differs from Siebert et al. (2011), which did not find clear evidence for habituation to repeated

isolation sessions in the behavioural and vocal responses of goats. This could be due to the much longer isolation sessions used by Siebert et al. (2011; 30 min) compared to ours (5 min).
The physiological measures that we collected (heart rate, heart rate variability and respiration rate) are involved in the sympathoadrenomedullary axis (SAM) stress response, which prepares the animal to react to a stressor (Cannon, 1929; Seyle, 1976). Stress has been defined as a nonspecific response of the body to any demand made upon it, whether positive or negative (Seyle, 1976). An increase in both negative and positive arousal is thus normally accompanied by (among other parameter changes) an increase in heart rate (used in our study to determine the levels of arousal triggered by the various situations) and an increase in respiration rate (von Holst, 1998). Accordingly, we found that respiration rate increased with increasing arousal (heart rate), independently of the valence of the situation.
Heart rate represents the interaction between sympathetic (increases heart rate) and vagal (reduces heart rate) regulation. By contrast, heart rate variability mainly depends on vagal influences and thus indicates when the vagal branch of the autonomic nervous system is activated (von Borell et al., 2007). This parameter increases (i.e. more variable heart rate due to an increase in successive interbeat interval differences) when the parasympathetic system is activated. In our study, heart rate variability (RMSSD; root mean square of successive interbeat interval differences) increased with decreasing arousal levels (heart rate), indicating that the parasympathetic system was activated during our low arousal situations. According to our criterion, RMSSD was thus also an accurate indicator of arousal. Our two physiological parameters (RespRate and RMSSD) were not correlated and therefore are both good, independent indicators of arousal.
We did not find any good physiological indicator of valence. High vagal tone and vagal activation have been suggested to indicate efficient autonomic regulatory activity and be associated with positive emotions, thus implying that RMSSD could be a good indicator of valence, notably in pigs (Zebunke, Langbein, Manteuffel, & Puppe, 2011) and sheep (Reefmann, Wechsler, & Gygax, 2009). However, these studies did not control for the effect of arousal, as they compared situations of opposite valence, but also of different arousal (e.g. grooming as positive versus isolation as negative). In our study, RMSSD was not influenced by valence, despite controlling for the degree of movement (Locomotion). Similarly, Gygax et al. (2013) did not find any difference in RMSSD between two situations of different valence and probably similar arousal in goats. We suggest that heart rate variability, in a similar manner to most physiological parameters, is affected by arousal more than valence and thus constitutes an indicator of arousal.
Behavioural Indicators
The stress response prepares an animal to be more alert and vigilant, and to behave appropriately when faced with a stressor (e.g. Cannon, 1929). When the stimulus triggering the change in arousal enhances fitness (e.g. food reward), the animal should approach it, whereas when the stimulus threatens fitness (e.g. predator), the animal should avoid it (e.g. flight; Mendl et al., 2010). Accordingly, in our study, goats displayed more head movements and moved more during high arousal than low arousal situations, independently of the valence. Similarly, in Siebert et al. (2011), goat locomotion increased with arousal between complete isolation and partial isolation (supposedly higher arousal than complete isolation, because of the permanent sensory feedback from adjacent pen mates). In our study, goats also had their ears pointed forwards more often and to the side (horizontal) less often, which could indicate vigilance. Call rate generally increases with arousal in most species (Briefer, 2012). Accordingly, our results showed an increase in the number of calls per min (Calls) with arousal, independently of valence (i.e. in both negative and positive situations).

We identified two promising behavioural indicators of valence. Goats had their ears orientated backwards less often and spent more time with the tail up in positive situations than in negative ones. Ear and tail positions were also suggested as indicators of emotions notably in sheep (Boissy et al., 2011; Reefmann et al., 2009a; Reefmann, Wechsler, & Gygax, 2009) and pigs (Reimert, Bolhuis, Kemp, & Rodenburg, 2013). Reefmann et al. (2009a) and Reefmann,Wechsler, & Gygax, (2009) showed that horizontal ears are associated with positive situations in sheep. However, in these studies, some of the positive situations (e.g. feeding on fresh hay or grooming) and negative situations (e.g. separation from group members) might have differed also in arousal levels. In a similar manner to our study, pigs in negative situations (anticipation of an aversive event) had their tails in a low position more often and ears backwards more often than in positive situations (anticipation of a rewarding event; Reimert et al., 2013). By contrast, sheep tails were held up during separation from group members (negative), but not during rumination (intermediate) or when feeding on fresh hay (positive; Reefmann et al., 2009a). Alternative techniques for measuring ear and tail movements (e.g. noninvasive electromyography measuring ear and tail muscle activity) could help to obtain more precise results and allow accurate cross-species comparisons. Because ear position in our study was correlated with other behavioural parameters and clearly indicated both arousal (EarsForw and EarsHoriz) and valence (Ears-Back), we suggest that the observation of ear positions is a promising tool to assess emotions.
Vocal Indicators
We found that parameters describing F0-contour (source-related parameters; F0mean and F0end) increased with arousal levels. This could have resulted from an increase in the tension of the vocal folds after contraction of the cricothyroid muscles, or from stronger subglottal air pressure (Fant, 1960; Titze, 1994). We also found that higher arousal levels were characterized by higher energy quartiles (Q25%, Q50%, Q75%). Filter-related parameters (i.e. formants and the energy distribution) mostly depend on the shape and length of the vocal tract, and can be modified by laryngeal retraction (e.g. goats, dogs, Canis familiaris, pigs and cottontop tamarins, Sagunius oedipus; Fitch, 2000; fallow deer, Dama dama; McElligott, Birrer, & Vannoni, 2006). Mammals could also potentially constrict their pharynx (i.e. increase the tension of the vocal tract walls), which results in a shift in energy distribution towards higher frequencies, but this phenomenon has, to our knowledge, until now, only been studied in humans (Scherer, 1986) and birds (Riede, Beckers, Blevins, & Suthers, 2004). The shift in the energy distribution towards higher frequencies that we observed could thus be caused by a less pronounced retraction of the larynx or/and an increase in pharyngeal constriction with an increase in arousal. Although the energy distribution mainly depends on the filter process, our correlations between vocal parameters showed that this parameter is correlated with F0 (and therefore with its harmonics). As a result, the increase in energy quartiles with arousal could also have been a side-effect of the increase in F0. Similar increases in F0 and energy quartiles with arousal are commonly found in humans (Scherer, 2003), other mammals (Altenmüller, Schmidt, & Zimmermann, 2013; Briefer, 2012; Lingle, Wyman, Kotrba, Teichroeb, & Romanow, 2012) and even birds (zebra finch, Taeniopygia guttata, Perez et al., 2012), suggesting highly conserved vocal indicators of arousal throughout evolution.
Surprisingly, the increase in energy quartiles with arousal was only accompanied by a marginally significant increase in the fourth formant (F4; P ¼ 0.055). By contrast, the first formant (F1) decreased. These discrepancies were confirmed by a lack of correlation between energy quartiles and formants. Higher formants (e.g. F3, F4) depend mainly on the length of the vocal tract (Fant, 1960; Fitch & Hauser, 1995), whereas lower formants (e.g. F1, F2) depend more on the shape of the vocal tract. Our results could be explained by a less pronounced retraction of the larynx, which shortens the vocal tract and induces a higher F4, with an increase in arousal (Fant, 1960; Titze, 1994). The decrease in F1 might require more subtle changes in the configuration of the pharyngeal regions and oral and nasal cavities,

and opening of the mouth. Indeed, mouth opening/closing and lip protrusion/retraction or lip rounding/spreading can also be used to modify formant frequencies, at least in primates (Hauser, Evans, & Marler, 1993; Hauser & Ybarra, 1994; Riede, Bronson, Hatzikirou, & Zuberbühler, 2005). However, this suggestion requires further analysis of goat behaviour while vocalizing (Riede et al., 2005). Several of our vocal parameters indicating arousal (F0mean, F0end, Q25eQ75% and F1mean) were correlated with each other. Energy quartiles (Q25eQ75%) are easier to measure than F0 or formants and could constitute ideal indicators of arousal in goats and maybe other ungulates as well.
We found that during positive situations, goats produced calls with a lower fundamental frequency range (F0range) and smaller frequency modulations (FMextent) than during negative situations. The fundamental frequency thus varied less during positive than negative emotions. These measures characterizing F0 variation (F0range and FMextent) were correlated. F0range was more clearly affected by valence than FMextent. This parameter, which is also easier to measure than FMextent, could thus be selected as a clear valence indicator in goats. A decrease in F0range from negative to positive situations has also been observed in humans (Hammerschmidt & Jürgens, 2007) and elephants, Loxodonta Africana (Soltis et al., 2011). Similarly, lower variation in F0 (cumulative variation of F0) in positive than in negative situation has been found in dogs (Taylor, Reby, & McComb, 2009). During positive emotions, it thus seems that vocal folds vibrate at a more stable rate than in negative emotions, resulting in more stable F0 over time. However, very few studies have been carried out on vocal indicators of valence and it is thus difficult to make general conclusions on the evolution of vocal correlates of valence.
Conclusion
By merging recent frameworks developed to measure animal vocalizations (sourceefilter theory; Taylor & Reby, 2010) and emotions (Mendl et al., 2010), we have identified several noninvasive, promising indicators of arousal and valence. These physiological, behavioural and vocal indicators could be very useful to differentiate situations eliciting negative emotions from those eliciting positive ones, to promote the implementation of positive animal states (Boissy et al., 2007). Further experiments validating these indicators using different emotional situations (e.g. partial versus total isolation; Siebert et al., 2011) could allow us to determine the extent to which these indicators can be used across contexts. We believe that our approach, which simultaneously measures the effects of emotional arousal and valence, could lead to more accurate monitoring of animal emotions and a more comprehensive understanding of the evolution of emotions.
Acknowledgments
We are grateful to Luigi Baciadonna, Livio Favaro and two anonymous referees for helpful comments on the manuscript, and Lorenz Gygax for advice. We are very grateful to Switzerland for funding this study in the U.K. This was achieved through a Swiss Federal Veterinary Office grant (Project No. 2.11.03) to A.G.M. and E.F.B. and a Swiss National Science Foundation fellowship (Grants No. PA00P3_131485 and PZ00P3_148200) to E.F.B. We thank Bob Hitch, Natalie Comfort and all the volunteers of Buttercups Sanctuary for Goats (http://www.buttercups.org.uk) for their help and free access to the animals.
References
Altenmüller, E., Schmidt, S., & Zimmermann, E. (2013). Evolution of emotional communication: From sound from sounds in nonhuman mammals to speech and music in man. Oxford, U.K: Oxford University Press.
Aschwanden, J., Gygax, L.,Wechsler, B., & Keil, N. M. (2008). Cardiac activity in dairy goats whilst feeding side-by-side at two different distances and during social separation. Physiology & Behavior, 95, 641e648.
Baciadonna, L., McElligott, A. G., & Briefer, E. F. (2013). Goats favour personal over social information in an experimental foraging task. PeerJ, 1, e172.
Boersma, P., & Weenink, D. (2009). Praat: doing phonetics by computer. Retrieved from http://www.praat.org/.

Boissy, A., Aubert, A., D_esir_e, L., Greiveldinger, L., Delval, E., & Veissier, I. (2011). Cognitive sciences to relate ear postures to emotions in sheep. Animal Welfare, 20, 47e56.
Boissy, A., & Le Neindre, P. (1997). Behavioral, cardiac and cortisol responses to brief peer separation and reunion in cattle. Physiology & Behavior, 61, 693e699. Boissy, A., Manteuffel, G., Jensen, M. B., Moe, R. O., Spruijt, B., Keeling, L. J., et al. (2007). Assessment of positive emotions in animals to improve their welfare. Physiology & Behavior, 92, 375e397.
von Borell, E., Langbein, J., Despr_es, G., Hansen, S., Leterrier, C., Marchant-Forde, J., et al. (2007). Heart rate variability as a measure of autonomic regulation of cardiac activity for assessing stress and welfare in farm animals e a review. Physiology & Behavior, 92, 293e316.
Briefer, E. F. (2012). Vocal expression of emotions in mammals: mechanisms of production and evidence. Journal of Zoology, 288, 1e20.
Briefer, E. F., Haque, S., Baciadonna, L., & McElligott, A. (2014). Goats excel at learning and remembering a highly novel cognitive task. Frontiers in Zoology, 11, 20.
Briefer, E., & McElligott, A. G. (2011a). Mutual mother-offspring vocal recognition in an ungulate hider species (Capra hircus). Animal Cognition, 14, 585e598.
Briefer, E., & McElligott, A. G. (2011b). Indicators of age, body size and sex in goat kid calls revealed using the source-filter theory. Applied Animal Behaviour Science, 133, 175e185.
Briefer, E. F., & McElligott, A. G. (2012). Social effects on vocal ontogeny in an ungulate, the goat (Capra hircus). Animal Behaviour, 83, 991e1000.
Briefer, E. F., & McElligott, A. G. (2013). Rescued goats at a sanctuary display positive mood after former neglect. Applied Animal Behaviour Science, 146, 45e55.
Briefer, E. F., Padilla de la Torre, M., & McElligott, A. G. (2012). Mother goats do not forget their kids' calls. Proceedings of the Royal Society B, 279, 3749e3755.
Burman, O. H. P., Parker, R., Paul, E. S., & Mendl, M. (2008). A spatial judgement task to determine background emotional state in laboratory rats, Rattus norvegicus. Animal Behaviour, 76, 801e809.
Burnham, K. P., & Anderson, D. R. (2002). Model selection and multimodel inference: a practical information-theoretic approach. New York, NY: Springer.
Burnham, K. P., Anderson, D. R., & Huyvaert, K. P. (2011). AIC model selection and multimodel inference in behavioral ecology: some background, observations, and comparisons. Behavioral Ecology and Sociobiology, 65, 23e35.
Cannon, W. B. (1929). Bodily changes in pain, hunger, fear and rage. Boston, MA: Branford.
Charlton, B. D., Zhihe, Z., & Snyder, R. J. (2009a). The information content of giant panda, Ailuropoda melanoleuca, bleats: acoustic cues to sex, age and size. Animal Behaviour, 78, 893e898.
Charlton, B. D., Zhihe, Z., & Snyder, R. J. (2009b). Vocal cues to identity and relatedness in giant pandas (Ailuropoda melanoleuca). Journal of the Acoustical Society of America, 126, 2721e2732.
Darwin, C. (1872). The expressions of emotions in man and animals. London, U.K: John Murray.
Davies, A. C., Radford, A. N., & Nicol, C. J. (2014). Behavioural and physiological expression of arousal during decision-making in laying hens. Physiology & Behavior, 123, 93e99.
Fant, G. (1960). Acoustic theory of speech production. The Hague, The Netherlands: Mouton.

Fitch, W. T. (2000). The phonetic potential of nonhuman vocal tracts: comparative cineradiographic observations of vocalizing animals. Phonetica, 57, 205e218.
Fitch, W. T., & Hauser, M. D. (1995). Vocal production in nonhuman primates: acoustics, physiology, and functional constraints on honest advertisement. American Journal of Primatology, 37, 191e219.
Forkman, B., Boissy, A., Meunier-Salaün, M.-C., Canali, E., & Jones, R. B. (2007). A critical review of fear tests used on cattle, pigs, sheep, poultry and horses. Physiology & Behavior, 92, 340e374.
Gogoleva, S., Svetlana, S., Volodin, I., Volodina, E., Kharlamova, A., & Trut, L. N. (2010). Sign and strength of emotional arousal: vocal correlates of positive and negative attitudes to humans in silver foxes (Vulpes vulpes). Behaviour, 147, 1713e1736.
Gygax, L., Reefmann, N., Wolf, M., & Langbein, J. (2013). Prefrontal cortex activity, sympatho-vagal reaction and behaviour distinguish between situations of feed reward and frustration in dwarf goats. Behavioural Brain Research, 239, 104e114.
Hammerschmidt, K., & Jürgens, U. (2007). Acoustical correlates of affective prosody. Journal of Voice, 21, 531e540.
H€anninen, L., & Pastell, M. (2009). CowLog: open source software for coding behaviors from digital video. Behavior Research Methods, 41, 472e476.
Hauser, M. D., Evans, C. S., & Marler, P. (1993). The role of articulation in the production of rhesus monkey, Macaca mulatta, vocalizations. Animal Behaviour, 45, 423e433.
Hauser, M. D., & Ybarra, M. S. (1994). The role of lip configuration in monkey vocalizations: experiments using xylocaine as a nerve block. Brain and Language, 46, 232e244.
von Holst, D. (1998). The concept of stress and its relevance for animal behavior. Advances in the Study of Behavior, 27, 1e131.
Imfeld-Mueller, S., Van Wezemael, L., Stauffacher, M., Gygax, L., & Hillmann, E. (2011). Do pigs distinguish between situations of different emotional valences during anticipation? Applied Animal Behaviour Science, 131, 86e93.
Kaminski, J., Call, J., & Tomasello, M. (2006). Goats' behaviour in a competitive food paradigm: evidence for perspective taking? Behaviour, 143, 1341e1356.
Kaminski, J., Riedel, J., Call, J., & Tomasello, M. (2005). Domestic goats, Capra hircus, follow gaze direction and use social cues in an object choice task. Animal Behaviour, 69, 11e18.
Keltner, D., & Lerner, J. S. (2010). Emotion. In D. T. Gilbert, S. T. Fiske, & G. Lindsay (Eds.), Handbook of social psychology (pp. 317e352). London, U.K.: J. Wiley.
Langbein, J., Nürnberg, G., & Manteuffel, G. (2004). Visual discrimination learning in dwarf goats and associated changes in heart rate and heart rate variability. Physiology & Behavior, 82, 601e609.
Lingle, S., Wyman, M. T., Kotrba, R., Teichroeb, L. J., & Romanow, C. A. (2012). What makes a cry a cry? A review of infant distress vocalizations. Current Zoology, 58, 698e726.
Manteuffel, G., Puppe, B., & Sch€on, P.-C. (2004). Vocalization of farm animals as a measure of welfare. Applied Animal Behaviour Science, 88, 163e182.
McElligott, A. G., Birrer, M., & Vannoni, E. (2006). Retraction of the mobile descended larynx during groaning enables fallow bucks (Dama dama) to lower their formant frequencies. Journal of Zoology, 270, 340e345.
Mendl, M., Burman, O. H. P., Parker, R. M. A., & Paul, E. S. (2009). Cognitive bias as an indicator of animal emotion and welfare: emerging evidence and underlying mechanisms. Applied Animal Behaviour Science, 118, 161e181.

Mendl, M., Burman, O. H. P., & Paul, E. S. (2010). An integrative and functional framework for the study of animal emotion and mood. Proceedings of the Royal Society B, 277, 2895e2904.
Moe, R. O., Nordgreen, J., Janczak, A. M., Spruijt, B. M., Zanella, A. J., & Bakken, M. (2009). Trace classical conditioning as an approach to the study of reward-related behaviour in laying hens: a methodological study. Proceedings of the Royal Society B, 121, 171e178.
Murphy, E., Nordquist, R. E., & van der Staay, F. J. (2014). A review of behavioural methods to study emotion and mood in pigs, Sus scrofa. Applied Animal Behaviour Science, 159, 9e28.
Nawroth, C., von Borell, E., & Langbein, J. (2014a). Goats that stare at men: dwarf goats alter their behaviour in response to human head orientation, but do not spontaneously use head direction as a cue in a food-related context. Animal Cognition, 1e9.
Nawroth, C., von Borell, E., & Langbein, J. (2014b). Exclusion performance in dwarf goats (Capra aegagrus hircus) and sheep (Ovis orientalis aries). PLoS One, 9, e93534.
Nettle, D., & Bateson, M. (2012). The evolutionary origins of mood and its disorders. Current Biology, 22, R712eR721.
Panksepp, J. (2009). Emotional causes and consequences of social-affective vocalization. In M. Brudzynski (Ed.), Handbook of mammalian vocalization -- An integrative neuroscience approach (pp. 201e208). London, U.K: Academic Press.
Perez, E. C., Elie, J. E., Soulage, C. O., Soula, H. A., Mathevon, N., & Vignal, C. (2012). The acoustic expression of stress in a songbird: does corticosterone drive isolation-induced modifications of zebra finch calls? Hormones and Behavior, 61, 573e581.
Pinheiro, J. C., & Bates, D. M. (2000). Mixed-effects models in S and S-PLUS. NewYork, NY: Springer-Verlag.
Price, E. O., & Thos, J. (1980). Behavioral responses to short-term social isolation in sheep and goats. Applied Animal Ethology, 6, 331e339.
R Development Core Team. (2013). R Foundation for Statistical Computing. Vienna: Austria. Retrieved from http://www.R-project.org.
Reby, D., Joachim, J., Lauga, J., Lek, S., & Aulagnier, S. (1998). Individuality in the groans of fallow deer (Dama dama) bucks. Journal of Zoology, 245, 79e84.
Reby, D., & McComb, K. (2003). Anatomical constraints generate honesty: acoustic cues to age and weight in the roars of red deer stags. Animal Behaviour, 65, 519e530.
Reefmann, N., Bütikofer Kasz_as, F., Wechsler, B., & Gygax, L. (2009a). Ear and tail postures as indicators of emotional valence in sheep. Applied Animal Behaviour Science, 118, 199e207.
Reefmann, N., Bütikofer Kasz_as, F., Wechsler, B., & Gygax, L. (2009b). Physiological expression of emotional reactions in sheep. Physiology & Behavior, 98, 235e241.
Reefmann, N., Wechsler, B., & Gygax, L. (2009). Behavioural and physiological assessment of positive and negative emotion in sheep. Animal Behaviour, 78, 651e659.
Reimert, I., Bolhuis, J. E., Kemp, B., & Rodenburg, T. B. (2013). Indicators of positive and negative emotions and emotional contagion in pigs. Physiology & Behavior, 109, 42e50.
Riede, T., Beckers, G. J. L., Blevins, W., & Suthers, R. A. (2004). Inflation of the esophagus and vocal tract filtering in ring doves. Journal of Experimental Biology, 207, 4025e4036.

Riede, T., Bronson, E., Hatzikirou, H., & Zuberbühler, K. (2005). Vocal production mechanisms in a non-human primate: morphological data and a model. Journal of Human Evolution, 48, 85e96.
Rolls, E. T. (2005). Emotion explained. Oxford, U.K.: Oxford University Press.
Ruiz-Miranda, C. R., Szymanski, M. D., & Ingals, J. W. (1993). Physical characteristics of the vocalizations of domestic goat does Capra hircus in response to their offspring's cries. Bioacoustics, 5, 99e116.
Russell, J. (1980). A circumplex model of affect. Journal of Personality and Social Psychology, 39, 1161e1178.
Scherer, K. R. (1986). Vocal affect expression: a review and a model for future research. Psychological Bulletin, 99, 143e165.
Scherer, K. R. (2003). Vocal communication of emotion: a review of research paradigms. Speech Communication, 40, 227e256.
Schrader, L., & Todt, D. (1998). Vocal quality is correlated with levels of stress hormones in domestic pigs. Ethology, 104, 859e876.
S_ebe, F., Duboscq, J., Aubin, T., Ligout, S., & Poindron, P. (2010). Early vocal recognition of mother by lambs: contribution of low- and high-frequency vocalizations. Animal Behaviour, 79, 1055e1066.
Seyle, H. (1976). The stress of life. New York, NY: McGraw-Hill.
Siebert, K., Langbein, J., Sch€on, P.-C., Tuchscherer, A., & Puppe, B. (2011). Degree of social isolation affects behavioural and vocal response patterns in dwarf goats (Capra hircus). Applied Animal Behaviour Science, 131, 53e62.
Soltis, J., Blowers, T. E., & Savage, A. (2011). Measuring positive and negative affect in the voiced sounds of African elephants (Loxodonta africana). Journal of the Acoustical Society of America, 129, 1059e1066.
Spruijt, B. M., van den Bos, R., & Pijlman, F. T. A. (2001). A concept of welfare based on reward evaluating mechanisms in the brain: anticipatory behaviour as an indicator for the state of reward systems. Applied Animal Behaviour Science, 72, 145e171.
Stanley, C. R., & Dunbar, R. I. M. (2013). Consistent social structure and optimal clique size revealed by social network analysis of feral goats, Capra hircus. Animal Behaviour, 85, 771e779.
Sueur, J., Aubin, T., & Simonis, C. (2008). Equipment review: Seewave, a free modular tool for sound analysis and synthesis. Bioacoustics, 18, 213e226.
Symonds, M. R. E., & Moussalli, A. (2011). A brief guide to model selection, multi-model inference and model averaging in behavioural ecology using Akaike's information criterion. Behavioral Ecology and Sociobiology, 65, 13e21.
Taylor, A. M., & Reby, D. (2010). The contribution of sourceefilter theory to mammal vocal communication research. Journal of Zoology, 280, 221e236.
Taylor, A. M., Reby, D., & McComb, K. (2009). Context-related variation in the vocal growling behaviour of the domestic dog (Canis familiaris). Ethology, 115, 905e915.
Titze, I. R. (1994). Principles of voice production. Englewood Cliffs, NJ: Prentice Hall.
Zebunke, M., Langbein, J., Manteuffel, G., & Puppe, B. (2011). Autonomic reactions indicating positive affect during acoustic reward learning in domestic pigs. Animal Behaviour, 81, 481e489.

Appendix
Here, we provide a detailed description of the acoustic analysis. The source-related acoustic features (fundamental frequency, F0), filter-related acoustic features (formants and energy quartiles) and intensity features that we measured (13 parameters) are detailed below (Praat commands are indicated in brackets).
Source-related acoustic features were measured by extracting the F0 contour of each call using a cross-correlation method ([Sound: To Pitch (cc) command], time step ¼ 0.01 s, pitch floor ¼ 100e150 Hz, pitch ceiling ¼ 300e600 Hz). For each extracted F0 contour, we measured the following vocal parameters: the mean F0 frequency values across the call (F0mean), the frequency value of F0 at the end of the call (F0end), and the F0 frequency range (F0range). To characterize F0 variation along the call, we measured the mean peak-to-peak variation of each F0 modulation (FMextent, Charlton et al., 2009a; Charlton, Zhihe, & Snyder, 2009b).
Filter-related (formants) acoustic features were measured by extracting the contour of the first four formants of each call using linear predictive coding analysis (LPC; [Sound: To Formant (burg) command]: time step ¼ 0.01 s, maximum number of formants ¼ 4e5, maximum formant ¼ 3000e5500 Hz, window length ¼ 0.05 s). To check whether Praat software accurately tracked the formants, the outputs of the LPC analysis of each call were visually inspected together with the spectrograms. Spurious values were deleted and we corrected for octave jumps when necessary. For each call we collected the mean (F1e4mean) values of the formants. Finally, we measured the frequency values at the upper limit of the first (Q25%), second (Q50%) and third (Q75%) quartiles of energy, using a linear amplitude spectrum applied to the whole call.
We measured intensity characteristics by extracting the intensity contour of each call [Sound: To Intensity command]. We then included the mean peak-to-peak variation of each amplitude modulation in our analyses (AMextent; see Charlton et al. 2009b for details of these parameters).We also included the total duration of each call (Dur).

Table A1: Control factors and differences between Frustration and Isolation situations
Effects of the control factors (sex, age and call type), as well as difference between the Frustration and Isolation situations (both assumed of negative valence), for physiological, behavioural and vocal parameters (linear mixed-effects models and generalized linear mixed models, compared with likelihood-ratio tests). Bold font indicates significant (P < 0.05) and marginally significant (0.06 < P _ 0.05) effects. The direction of the significant changes was assessed from residuals of the models. Sex (female, ‘F’; male, ‘M’) affected RespRate (F > M), Locomotion (F < M) and Q25 (F > M). Age tended to affect RespRate (marginally significant decrease with age). The type of call (closed mouth ‘CM’, open mouth ‘OM’; mixed call ‘Mi’) affected F0-related parameters (F0mean: Mi > OM > CM), the variation in F0 (F0range and FMextent: Mi > OM > CM), the energy quartiles (Q25% and Q50%: Mi > OM > CM) and F1mean (CM > Mi > OM). The difference between the Frustration (‘Fr’) and the Isolation situations (‘I’) was marginally significant for RMSSD (Fr < I), and significant for RespRate (Fr > I), HeadMov (Fr > I), Locomotion (Fr > I), EarsBack (Fr < I) and TailUp (Fr > I). Concerning vocal parameters, this difference was significant for F0-related parameters (F0mean: Fr > I), the energy quartiles (Q25-Q75%: Fr > I), F1mean (Fr < I) and F4mean (Fr > I). In addition, the time spent moving (Locomotion) was included as a control factor for the physiological indicators. It had a significant effect on RespRate (LMM: c21 ¼ 6:03, P ¼ 0.014), but not on RMSSD (LMM: c21 ¼ 0:09, P ¼ 0.77).
Parameter Sex Age Call Type Frustration versus Isolation
x𝟐𝟏 (N) P x𝟐
𝟏 (N) P x𝟐
𝟏 (N) P x𝟐
𝟏 (N) P
Physiology RMSSD .17 .68 .12 .73 -- -- 3.60 .058
RespRate 8.15 .004 3.79 .052 -- -- 27.44 <.0001
Behaviour HeadMov .00 .96 3.06 .08 -- -- 26.53 <.0001
Locomotion 4.35 .037 .94 .33 -- -- 8.07 .005
EarsForw 3.07 .08 .05 .82 -- -- .70 .40
EarsHoriz .20 .65 .02 .89 -- -- 1.15 .28
EarsBack .17 .68 .77 .38 -- -- 4.64 .031
EarsAsym .00 .95 .20 .66 -- -- .12 .73
TailUp .19 .66 1.23 .27 -- -- 4.61 .032
Calls .64 .42 2.27 .13 -- -- .03 .86
Vocalizations Dur 3.60 .06 1.96 .16 1.11 .57 .41 .52
F0mean 1.79 .18 .03 .85 8.17 .017 5.74 .017
F0end 3.10 .08 .39 .53 2.09 .35 8.44 .004
F0range .06 .80 .78 .38 9.74 .008 .22 .64
FMextent .10 .76 .61 .44 7.84 .020 .53 .47
AMextent .13 .72 .34 .56 .40 .82 .33 .56
Q25% 9.33 .002 3.53 .06 37.87 <.0001 6.37 .012
Q50% 3.47 .06 .02 .89 18.98 <.0001 8.64 .003
Q75% 1.43 .23 .03 .87 3.64 .16 4.55 .033
F1mean .16 .69 .27 .60 18.55 <.0001 21.71 <.0001
F2mean .08 .77 .08 .78 2.13 .35 .52 .47
F3mean .37 .54 .20 .65 4.21 .12 .08 .78
F4mean .34 .56 .12 .73 2.80 .25 4.02 .045

Table A2: Raw values of the physiological, behavioural and vocal parameters measured for each arousal level and valence of the situations (mean ± SD)
Parameter Arousal Valence
0 1 Negative Neutral Positive
Mean SD Mean SD Mean SD Mean SD Mean SD
Physiology Heart rate (beats/min)
108.75 15.38 123.00 23.52 115.74 21.94 107.79 12.25 126.37 24.71
RMSSD (ms) 31.66 19.65 26.83 15.21 29.90 18.53 31.21 19.49 26.15 13.34
RespRate (breaths/s)
.32 .10 .42 .11 .38 .13 .31 .08 .42 .09
Behaviour HeadMov (per min)
7.16 10.61 22.02 26.08 9.73 13.48 9.68 14.95 29.80 31.17
Locomotion (%) 3.78 3.57 7.69 8.60 5.87 5.49 3.49 2.38 7.71 10.81
EarsForw (%) 61.57 29.80 82.02 27.04 74.80 25.97 41.93 26.79 92.54 19.14
EarsHoriz (%) 16.25 25.08 .21 1.11 .25 1.14 35.99 26.32 .00 .00
EarsBack (%) 12.63 14.18 15.37 21.04 19.72 17.74 9.13 14.88 6.39 17.62
EarsAsym (%) 8.61 15.10 2.58 5.57 2.84 3.10 16.16 20.07 1.86 7.26
TailUp (%) 33.56 42.01 57.07 46.23 35.15 45.67 46.34 42.25 64.54 43.58
Calls (per min) .45 1.59 3.36 4.40 1.55 2.74 0.00 0.00 4.67 5.16
Vocalizations Dur (s) .84 .21 .78 .16 .81 .19 -- -- .78 .15
F0mean (Hz) 253.40 105.98 228.30 56.56 240.42 81.58 -- -- 223.51 58.76
F0end (Hz) 189.30 62.83 190.49 51.26 189.88 56.23 -- -- 190.83 52.14
F0range (Hz) 115.75 84.85 91.29 52.63 106.75 69.21 -- -- 73.85 44.95
FMexten t (Hz) 71.16 42.52 75.37 105.98 79.99 99.20 -- -- 52.87 36.92
AMextent (dB) 11.76 7.46 11.96 5.52 11.68 6.49 -- -- 12.63 5.14
Q25% (Hz) 241.83 135.94 255.42 109.55 251.98 120.39 -- -- 247.09 114.39
Q50% (Hz) 437.61 263.19 453.05 209.33 446.91 226.02 -- -- 451.38 238.04
Q75% (Hz) 1020.65 814.46 997.37 659.22 998.30 689.43 -- -- 1029.04 797.02
F1mean (Hz) 694.97 163.87 655.17 113.25 659.00 132.24 -- -- 696.33 125.15
F2mean (Hz) 1651.64 369.82 1596.72 289.56 1621.11 307.98 -- -- 1566.03 305.97
F3mean (Hz) 2544.34 419.27 2549.80 368.42 2573.22 370.67 -- -- 2469.27 400.37
F4mean (Hz) 3283.72 471.22 3423.91 521.30 3420.27 497.53 -- -- 3290.92 557.30


![Physiological, physical and behavioural changes in …...stress response systems – the hypothalamic-pituitary-adrenal (HPA) axis – [8], was found in significantly higher concentrations](https://img.dokumen.tips/doc/110x75/5f1adda51d7b86300d6e7fa3/physiological-physical-and-behavioural-changes-in-stress-response-systems-a.jpg)