Embed Size (px)
Citation preview
CEWG / Linux Foundation Open Projects
eMMC/SSD Filesystem Tuning Methodology
Rev. 1.0
May 13, 2013

Abstract
This document describes methods of file system performance measurement and tuning for eMMC/SSD storage media, including open source tools and file system options. It also covers longevity aspects of eMMC/SSD media with certain file systems and file system power-fail tolerance in the presence of performance-tuning options.
Audience
Audience of this document is people optimizing I/O performance of embedded systems with managed FLASH storage devices.
Document Status
Draft
Contact Information
Send your comments, questions and report any other issues related to this document to: [email protected] and [email protected].
Cogent Embedded, Inc. contact information is available at http://cogentembedded.com
COGENT EMBEDDED 2
May 13, 2013 eMMC/SSD Filesystem Tuning Methodology
Revision History
Rev. Date Author Changes
0.1 October 15, 2012 M. Filippov Initial Revision
0.2 November 1, 2012 M. Filippov Add preliminary results and benchmark scripts overview
0.3 November 12, 2012 M. Filippov More results, more scripts details
0.4 January 12, 2013 M. Filippov Add IO schedulers results
1.0 May 13, 2013 M. Filippov Update results section and clean up
Issues
None
COGENT EMBEDDED 3
May 13, 2013 eMMC/SSD Filesystem Tuning Methodology
Table of Contents
1 Introduction...................................................................................................................................51.1 Overview................................................................................................................................51.2 Acronyms and abbreviations.................................................................................................5
2 Setup.............................................................................................................................................62.1 Hardware setup......................................................................................................................62.2 Software setup........................................................................................................................6
3 Performance benchmarking and optimization..............................................................................73.1 Approach................................................................................................................................73.2 Measured performance parameters........................................................................................73.3 Result comparison..................................................................................................................83.4 Benchmarking tools and workload generators.......................................................................8
3.4.1 Flashbench......................................................................................................................83.4.2 FIO..................................................................................................................................9
3.5 File systems and their performance tuning options.............................................................103.5.1 Ext3/Ext4......................................................................................................................103.5.2 BTRFS..........................................................................................................................113.5.3 F2FS..............................................................................................................................11
3.6 I/O schedulers......................................................................................................................113.7 Expected results...................................................................................................................12
4 SSD wear intensity......................................................................................................................134.1 Approach..............................................................................................................................134.2 Results..................................................................................................................................13
5 Power-fail tolerance....................................................................................................................145.1 Approach..............................................................................................................................14
6 Results.........................................................................................................................................166.1 Linear and random direct reading........................................................................................166.2 Linear and random direct writing........................................................................................186.3 Linear reading from multiple files (grep)............................................................................216.4 Linear writing to multiple files (untar)................................................................................226.5 Linear reading and writing multiple files (compile)............................................................236.6 Random reading and writing multiple files (fileserver).......................................................256.7 Random reading and writing multiple memory-mapped files (database)............................266.8 Conclusion...........................................................................................................................27
7 Benchmarking scripts.................................................................................................................287.1 Tree structure.......................................................................................................................287.2 Configuration.......................................................................................................................287.3 Execution.............................................................................................................................297.4 Sample usage.......................................................................................................................29
COGENT EMBEDDED 4
May 13, 2013 eMMC/SSD Filesystem Tuning Methodology
1 Introduction
1.1 Overview
This document provides a methodology for performance tuning of a file system operating on a managed FLASH device, like SSD/SD/eMMC. It focuses on ext3/ext4, BTRFS and f2fs open source file systems (list can be extended). A set of performance characteristics is defined and tools for workload simulation / performance measurement are proposed. Procedures for wear intensity estimation of tuned file systems and power-fail tolerance are described.
The document is accompanied with a set of scripts that allow conducting performance testing and tuning for exact target/storage configuration in accordance with methodology.
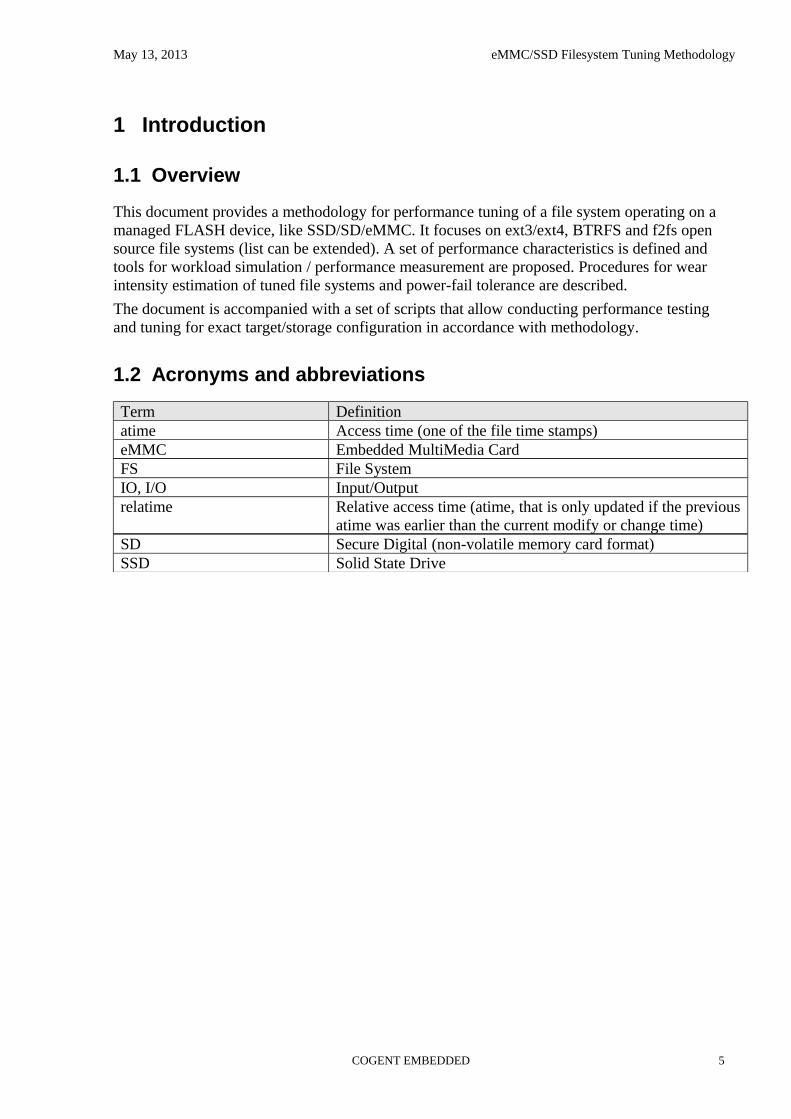
1.2 Acronyms and abbreviations
Term Definitionatime Access time (one of the file time stamps)eMMC Embedded MultiMedia CardFS File SystemIO, I/O Input/Outputrelatime Relative access time (atime, that is only updated if the previous
atime was earlier than the current modify or change time)SD Secure Digital (non-volatile memory card format)SSD Solid State Drive
COGENT EMBEDDED 5
May 13, 2013 eMMC/SSD Filesystem Tuning Methodology
2 Setup
2.1 Hardware setup
No specific requirements for test hardware are provided, though it is expected to have CPU performance high enough to keep IO benchmarking IO-bound rather than CPU-bound. ARM/Cortex-A9 platform is one of most popular choices for hardware configuration (additional platforms – e.g. Intel) can be added later.
The first phase of testing/experiments is performed using following evaluation boards:
• TI OMAP 4460-based PandaBoard ES (with external SD cards)
• Exynos 4412-based ODROID-X board (with swappable Toshiba eMMC)
2.2 Software setup
The following software configuration will be used for the initial testing:
• kernel: mainline linux-3.8;
• userland: Ubuntu 12.04 for ARM;
• rootfs: NFS, common for both PandaBoard and ODROID-X. This allows to minimize interference of system activities with benchmarking and minimize setup time for new media;
• additional tools: btrfs-progs (git tip: v0.20-rc1-37-g91d9eec), f2fs-tools-1.1.0, fio (2.0.10);
• host tools: gnuplot (graphical result comparison).
COGENT EMBEDDED 6
May 13, 2013 eMMC/SSD Filesystem Tuning Methodology
3 Performance benchmarking and optimization
A number of factors influence file system performance, some of them (like file system cache size or file data predictability) do not depend on underlying media, others (like media access pattern) do. In order to tune file system performance for specific media it needs to be put into an environment where media-dependent factors would prevail. The following methods are proposed to achieve that:
• use direct IO. This should be used only in cases when IO pattern is to be controlled by the benchmark;
• pin down memory with mlock. This method is proposed for workloads that would use FS cache in real life. Memory available for FS cache should be limited to 1/2...2 times total file size used by the benchmark; -- this proved to be very fragile: task is either unable to mlock 1/2 of the free memory or it is being killed by the oom-killer once it could;
• limit available machine memory at boot time;
• use random data for file IO. This would mitigate data compression and de-duplication at file system and device levels.
3.1 Approach
The following iterative approach for file system tuning is proposed:
1. file system without any tuning is set up and its performance parameters are measured;
2. each of the remaining tuning options is applied to the current file system setup and performance parameters of the new setup are measured;
3. parameter difference is evaluated and the option that gives the biggest performance gain is added to the current file system setup, step 2 is repeated until there are no more options or no option gives performance gain.
Each benchmark provides a method for visual performance parameters comparison. Benchmarking script also provides hints about optimal filesystem parameters/IO scheduler for each workload and generally for a file system based on either cumulative throughput or worst latency.
3.2 Measured performance parameters
The following parameters are chosen for FS performance evaluation:
1. aggregated throughput. This parameter is important for all tasks as it directly determines available IO bandwidth and thus time needed to complete the task;
2. access latency. This parameter is important for interactive tasks.
The following benchmarks are chosen for FS performance evaluation:
1. linear read/write single-threaded throughput with a range of fixed IO block sizes;
2. random read/write single-threaded throughput and access latency with a range of fixed IO block sizes;
3. aggregated throughput of multithreaded workloads. This parameter shows FS performance that may be expected by real tasks. The following workload types are chosen:
3.1. linear read from multiple files (grep, archiving);COGENT EMBEDDED 7
May 13, 2013 eMMC/SSD Filesystem Tuning Methodology
3.2. linear read + linear write to multiple files (unarchiving);
3.3. multithereaded linear read from multiple files + linear write (compilation);
3.4. multithreaded random read from multiple files + random write to multiple files (file server);
3.5. multithreaded random read/write to memory-mapped file (simple database).
3.3 Result comparison
Benchmarking tools produce result vectors that may be plotted together or compared numerically.
Numerical comparison is performed by calculation of merit value for each combination of benchmark + filesystem options + IO scheduler and ordering them accordingly. Merit value may be calculated either with respect to aggregated throughput or to worst latency:
mthroughput=(Σlog(throughputi))/n
mlatency=1/max(latencyi)
Each benchmarking run yields several data points (for different IO block size or IO size to cache size ratio), summation and maximum are performed for all these points. Winning filesystem options + IO scheduler combination for each benchmark is the one with the highest merit. Winning filesystem options + IO scheduler combination for the medium is the one with the highest sum of merit for each benchmark.
3.4 Benchmarking tools and workload generators
The following tools are chosen for the benchmarking:
• flashbench;
• FIO.
The following candidates were also evaluated for the benchmarking:
1. IOZone: not flexible enough, functionality is superseded by FIO;
2. bonnie++: predictable test data, functionality is superseded by FIO;
3. filebench: not very stable, functionality is superseded by FIO.
3.4.1 Flashbench
Although not file system benchmarking tool, flashbench allows to measure FLASH media characteristics such as erase block/segment size which in turn allow to tune file system geometry accordingly. It will not be used after initial media parameters evaluation.
The following approach for FLASH media geometry determination is proposed in the flashbench README:
“This is a simple read-only test doing small reads across boundaries of various sizes. Example:
$ sudo ./flashbench a /dev/mmcblk0 blocksize=1024
align 134217728 pre 735µs on 1.08ms post 780µs diff 324µs
align 67108864 pre 736µs on 1.05ms post 763µs diff 300µs
align 33554432 pre 722µs on 1.04ms post 763µs diff 294µs
align 16777216 pre 727µs on 1.05ms post 772µs diff 302µs
COGENT EMBEDDED 8
May 13, 2013 eMMC/SSD Filesystem Tuning Methodology
align 8388608 pre 724µs on 1.04ms post 768µs diff 299µs
align 4194304 pre 741µs on 1.08ms post 788µs diff 317µs
align 2097152 pre 745µs on 950µs post 811µs diff 171µs
align 1048576 pre 745µs on 945µs post 807µs diff 169µs
align 524288 pre 743µs on 936µs post 799µs diff 165µs
align 262144 pre 746µs on 948µs post 809µs diff 171µs
align 131072 pre 737µs on 935µs post 804µs diff 165µs
align 65536 pre 735µs on 925µs post 796µs diff 159µs
align 32768 pre 735µs on 925µs post 800µs diff 157µs
align 16384 pre 745µs on 911µs post 781µs diff 148µs
align 8192 pre 785µs on 808µs post 725µs diff 53.3µs
align 4096 pre 784µs on 788µs post 779µs diff 5.85µs
align 2048 pre 787µs on 793µs post 789µs diff 4.65µs
This shows the access times to do two 1024 byte reads around the boundaries of power-of-two aligned blocks. Reading at the end of a 128 MB unit takes around 735 microseconds, reading the last block of this unit together with the first block of the next one takes about 1080 microseconds and reading the first two blocks in a 128 MB unit takes around 780 microseconds.
The most interesting number here is the last one, the difference between the second number and the average of the first and the third is 324 microseconds. These numbers all stay roughly the same for all units between 4 MB and 128 MB.
However, from 2 MB down to 16 KB, the last column has a much lower value. This indicates that whatever the memory card does on a 4 MB boundary does not happen at other boundaries. The educated guess here is that 4 MB is the erase block size, also called the segment or allocation unit size. This erase blocksize will need to be used in other tests following this one.
Similarly, both 16 KB and 8 KB boundaries are special. The logical explanation for this is that the card has 8 KB pages, but can use multi-plane accesses to read two 8 KB pages
simultaneously.”
Benchmarking scripts automate FLASH geometry guessing with the described method by finding two rows in the 'flashbench -a' output with the biggest (Drow+1-Drow)/Drow, where Di is the value of the last output column, and printing corresponding block sizes.
3.4.2 FIO
FIO is described as a tool that “would be able to simulate a given io workload without resorting to writing a tailored test case”. It is highly configurable: there can be any number of processes or threads involved, and they can each be using their own way of generating IO.
FIO is driven by job files. A job file may contain any number of threads and/or files - the typical contents of the job file is a global section defining shared parameters, and one or more job sections describing the jobs involved. When run, fio parses this file and sets everything up as described. If we break down a job from top to bottom, it contains the following basic parameters:
COGENT EMBEDDED 9
May 13, 2013 eMMC/SSD Filesystem Tuning Methodology
1. IO type: defines the io pattern issued to the file(s). We may only be reading sequentially from this file(s), or we may be writing randomly. Or even mixing reads and writes, sequentially or randomly;
2. block size: in how large chunks we are issuing IO. This may be a single value, or it may describe a range of block sizes;
3. IO size: how much data we are going to be reading/writing;
4. IO engine: how we issue IO. We could be memory mapping the file, we could be using regular read/write, we could be using splice, async io, syslet, or even SG (SCSI generic sg);
5. IO depth: if the IO engine is async, how deep queue we maintain;
6. IO type: should we be doing buffered IO, or direct/raw IO;
7. num files: how many files we are spreading the workload over;
8. num threads: how many threads or processes we should spread this workload over.
FIO measures a lot of job parameters, most interesting for us are:
1. the distribution of IO completion latencies;
2. average bandwidth.
FIO has the following shortcomings that limit the range of useful workloads:
1. it cannot measure read and write throughput of readwrite job separately: for jobs with equal read and write data amount reported throughput numbers are also equal;
2. it cannot generate metadata intensive activity.
3.5 File systems and their performance tuning options
The following common file system tuning options are chosen:
• noatime (mount -o noatime)
o historically, when a file is read, the access time (atime) for that file must be updated in the inode metadata, which involves additional write I/O. If accurate atime metadata is not required, file system may be mounted with the noatime option to eliminate these metadata updates. In most cases, however, atime is not a large overhead due to the default relative atime (or relatime) behavior. The relatime behavior only updates atime if the previous atime is older than the modification time (mtime) or status change time (ctime);
• discard (ext4, BTRFS, F2FS; mount -o discard)
o this option controls whether file system should issue discard/TRIM commands to the underlying block device when blocks are freed. Time spent issuing TRIM commands may be compensated by lower write operation delays if media is able to take advantage of bigger free blocks pool.
File system specific options are listed for each evaluated file system.
3.5.1 Ext3/Ext4
• no journal (tune2fs -O ^has_journal)
COGENT EMBEDDED 10
May 13, 2013 eMMC/SSD Filesystem Tuning Methodology
o this option turns off file system journal. It should be safe to do so on battery-backed device with a stable kernel;
• data=writeback (mount -o data=writeback)
o this option specifies the following journalling mode for file data: data may be written into the main filesystem after its metadata has been committed to the journal. This is rumoured to be the highest-throughput option. It guarantees internal filesystem integrity, however it can allow old data to appear in files after a crash and journal recovery;
• nobarrier (mount -o nobarrier)
o next to “no journal” option, should be tried in case “no journal” is not acceptable; may be skipped if “no journal” is selected;
o this option disables the use of write barriers in the jbd code. Write barriers enforce proper on-disk ordering of journal commits, making volatile disk write caches safe to use, at some performance penalty. In case of battery-backed media disabling barriers may safely improve performance;
• fs geometry (mount -o stripe=, mkfs -E stripe-width=)
o this option controls the number of filesystem blocks that mballoc will try to use for allocation size and alignment. As in RAID5/6 case proper IO block size and alignment may speed up FLASH write operations. Hint for the stripe width may be deduced from the flashbench tool output.
3.5.2 BTRFS
• fs geometry (mkfs –leafsize=)
o this option controls the leaf size, the least data item in which btrfs stores data. As in RAID5/6 case proper IO block size and alignment may speed up FLASH write operations. Hint for the leaf size may be deduced from the flashbench tool output;
• SSD mode (mount -o ssd, mount -o ssd_spread)
o these options enable SSD-optimized allocation schemes.
3.5.3 F2FS
• fs geometry (mkfs -s -z):
o these options control number of segments per section and number of sections per zone. Sizes that match chip parameters may speed up FLASH write operations. Hint for the segment and zone sizes may be deduced from the flashbench tool output;
3.6 I/O schedulers
The following schedulers are proposed to be tested:
• noop, as basic configuration;
• deadline, as it provides I/O request merging opportunity with guaranteed latency;
• cfq, as it is probably best suited for multithreaded workloads;
• row, as it prioritizes read requests (usually synchronous and latency-critical) over write requests.
COGENT EMBEDDED 11
May 13, 2013 eMMC/SSD Filesystem Tuning Methodology
3.7 Expected results
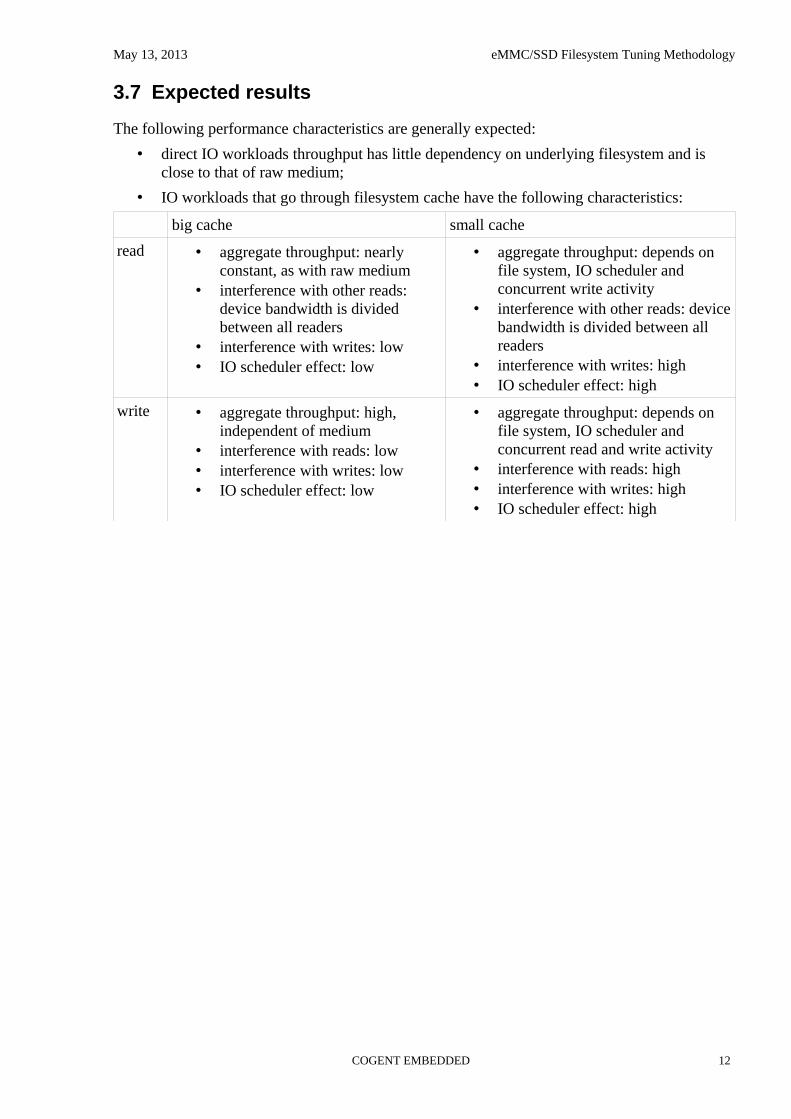
The following performance characteristics are generally expected:
• direct IO workloads throughput has little dependency on underlying filesystem and is close to that of raw medium;
• IO workloads that go through filesystem cache have the following characteristics:
big cache small cache
read • aggregate throughput: nearly constant, as with raw medium
• interference with other reads: device bandwidth is divided between all readers
• interference with writes: low• IO scheduler effect: low
• aggregate throughput: depends on file system, IO scheduler and concurrent write activity
• interference with other reads: device bandwidth is divided between all readers
• interference with writes: high• IO scheduler effect: high
write • aggregate throughput: high, independent of medium
• interference with reads: low• interference with writes: low• IO scheduler effect: low
• aggregate throughput: depends on file system, IO scheduler and concurrent read and write activity
• interference with reads: high• interference with writes: high• IO scheduler effect: high
COGENT EMBEDDED 12

May 13, 2013 eMMC/SSD Filesystem Tuning Methodology
4 SSD wear intensity
The physical media has a limited resource of operation in terms of, at least, maximal amount of block erase/write cycles. In case of SSD media a range of S.M.A.R.T. attributes describe device health, most notable are erase/program cycles counter (the total count of erase/program cycles for entire flash memory in its entire lifetime), and worst case erase counter (the maximum number of erase operations performed on a single flash memory block). When erase counter of particular block reaches the safety threshold (e.g. 100000 erase operations), the block cannot be used for writing any longer, so it should be either marked as read-only (if it contains valid data) or marked as non-available (cannot be selected by flash controller for writing new data, and therefore effective storage capacity lowers). Particularities of flash management algorithm are unknown to external observer and constitute the know-how of flash device manufacturer. However we can (safely) choose the following comparison criterion: we will say that of two file system configurations the one that gives slower ascending of total erase counter estimation is "better". In other words, we believe that any “decent” flash management algorithm will distribute the workload (almost) uniformly across all blocks in the storage, and reducing of total erase counter will proportionally increase expected device lifetime.
4.1 Approach
Straightforward comparison procedure is to retrieve total-erase-counter parameter before and after performance tests run, and to use relative growth of the counter serves as a score (to achieve the certain level of confidence the simulation may be repeated multiple times and received score is averaged). Of two file system configurations (different file systems or different configuration parameters of single file system) the one with lower averaged score observed in such way is considered as a preferred.In practice, system designer is interested in expected lifetime duration of device that naturally varies with regard to intended usage scenario. The workload which is not specific to device may easily kill its storage quickly (e.g. tablet used as mail-server). Therefore it is clear that benchmark used for estimation of wear intensity shall be chosen to reflect “typical” usage. Such typical usage can be modeled roughly as number of primitive operations performed daily / weekly / monthly, so there is known relation between single benchmark cycle and “modeled” device run time (e.g. one cycle corresponds to 3 months of “normal” device usage). Basing on observed wear intensity and characteristics of underlying physical storage it is possible to derive expected device lifetime for given file system configuration, and that information may be used by system designer to make a decision on what file system to use. For example, if two configurations yield expected lifetime duration 10 and 100 years respectfully, probably the parameter is not so important and system designer should base his/her decision on file system performance characteristics; in contrast, if it is 1 and 3 years, probably importance of that parameter becomes quite high.
4.2 Results
Unfortunately, none of the tested samples supports S.M.A.R.T. diagnostic interface, and described comparison method in not applicable. As there is no way to execute flash controller firmware in simulated environment (for instance, nandsim used as underlying flash media), the only way to compare two file system configurations is to wear off the device completely and to compare the time-until- failure. Such brute-force comparison procedure is too costly (in all senses) to perform, and it was not performed therefore.
COGENT EMBEDDED 13
May 13, 2013 eMMC/SSD Filesystem Tuning Methodology
5 Power-fail tolerance
The aim of power-failure tests is to verify that file-system and data integrity is preserved after unexpected power outages (or in some cases, unexpected system reset, e.g. watchdog reset). It is expected outcome that data which existed only in operating system caches will get lost; more important is what happens to data that has been previously committed to persistent storage. Corruption of data that was successfully flushed on disk, or corruption of data that was not accessed at all, or even corruption of entire file system (i.e. inability to mount disk on next boot) are major faults that may forbid usage of file system in question unless hardware modifications are added that (practically) guarantee absence of power-failures.From hardware perspective certain operations are expected to be atomic. For instance, block erase operation or page writing operation all should be atomic. If operation is not completed for some reason, the state of flash cell array is, strictly speaking, unknown – block may be erased just partially, or page programming may be incomplete. It is known that abnormal termination of such atomic operations may put flash array in internally unstable state (subsequent reading of the “partially-written” bits may get different values, and writing into “partially-erased” pages is not guaranteed to be correct), and suggested resolution is to repeat aborted procedure. As operating system is not managing flash (the task is performed by flash controller firmware), there is no real control over such “low-level” errors from file system standpoint, and consequently it is entire responsibility of the firmware to assure proper handling of events like these. File system, in turn, is responsible for consistency of its metadata and data (in other words, it shall recover from errors if underlying flash management layer is “reliable”), and it is expected that different configurations may show different behavior under power-failures. There is a number of parameters that may get affected by power-failure. For instance, file system recovery procedure may get triggered on next boot resulting in significantly longer start-up time; or first file access time after power-failure may be longer. All such aspects may be important from general system operation standpoint, however in this section we will concentrate only on file system metadata and data integrity – something that we can assess relatively easily.
5.1 Approach
Power-failure test script performs unattended simulation of power failures and analyzes file system and data integrity check results. Detailed execution log is saved for further examination. Power-fail test server residing on host manages the execution of various remote tests on target with particular file system configuration set up, and controls power source to initiate power outages at random time instants during remote test execution. Test server connects to the target and retrieves logging and diagnostic information.
The following steps are executed in a loop for each remote test and file system:
1. connect to the target;
2. perform mandatory file system check;
3. perform data integrity check if applicable;
4. mount current file system configuration;
5. start background test;
6. initiate power outage after random interval.
The following file system workloads are proposed:
• fsstress, that would stress file system metadata;
COGENT EMBEDDED 14
May 13, 2013 eMMC/SSD Filesystem Tuning Methodology
• SQLite test suite, that would reveal occasional file data corruption.
COGENT EMBEDDED 15
May 13, 2013 eMMC/SSD Filesystem Tuning Methodology
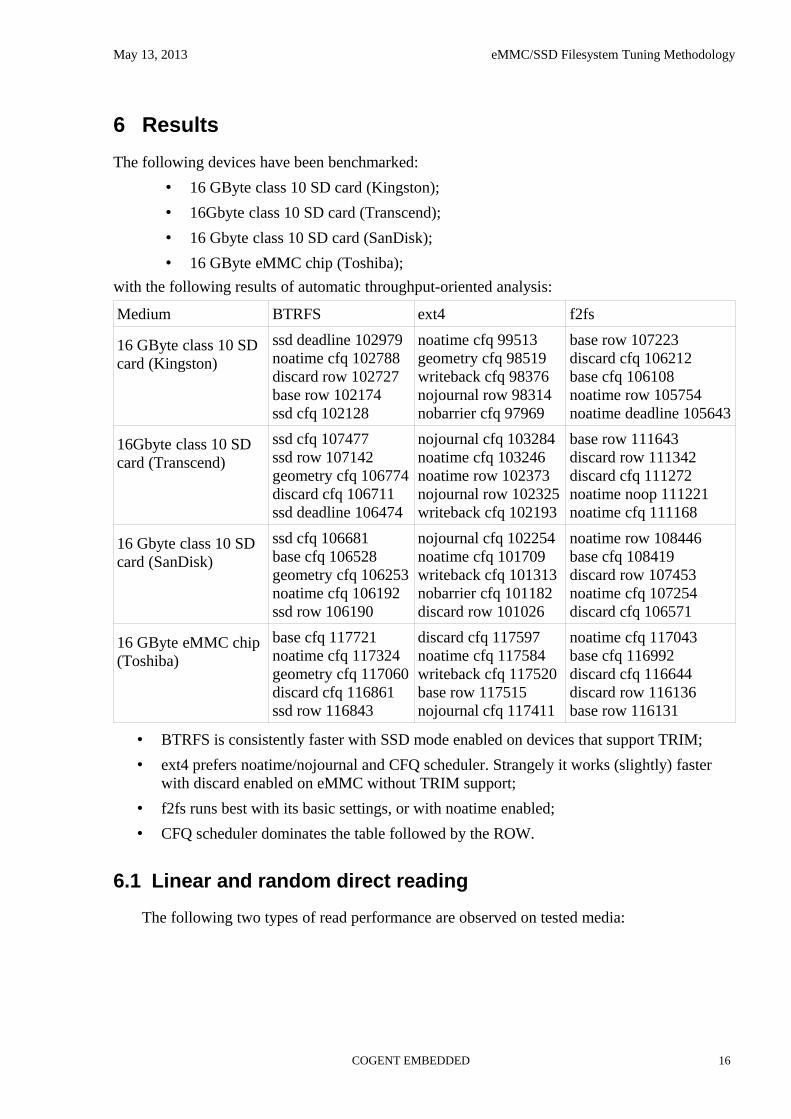
6 Results
The following devices have been benchmarked:
• 16 GByte class 10 SD card (Kingston);
• 16Gbyte class 10 SD card (Transcend);
• 16 Gbyte class 10 SD card (SanDisk);
• 16 GByte eMMC chip (Toshiba);
with the following results of automatic throughput-oriented analysis:
Medium BTRFS ext4 f2fs
16 GByte class 10 SD card (Kingston)
ssd deadline 102979noatime cfq 102788discard row 102727base row 102174ssd cfq 102128
noatime cfq 99513geometry cfq 98519writeback cfq 98376nojournal row 98314nobarrier cfq 97969
base row 107223discard cfq 106212base cfq 106108noatime row 105754noatime deadline 105643
16Gbyte class 10 SD card (Transcend)
ssd cfq 107477ssd row 107142geometry cfq 106774discard cfq 106711ssd deadline 106474
nojournal cfq 103284noatime cfq 103246noatime row 102373nojournal row 102325writeback cfq 102193
base row 111643discard row 111342discard cfq 111272noatime noop 111221noatime cfq 111168
16 Gbyte class 10 SD card (SanDisk)
ssd cfq 106681base cfq 106528geometry cfq 106253noatime cfq 106192ssd row 106190
nojournal cfq 102254noatime cfq 101709writeback cfq 101313nobarrier cfq 101182discard row 101026
noatime row 108446base cfq 108419discard row 107453noatime cfq 107254discard cfq 106571
16 GByte eMMC chip (Toshiba)
base cfq 117721noatime cfq 117324geometry cfq 117060discard cfq 116861ssd row 116843
discard cfq 117597noatime cfq 117584writeback cfq 117520base row 117515nojournal cfq 117411
noatime cfq 117043base cfq 116992discard cfq 116644discard row 116136base row 116131
• BTRFS is consistently faster with SSD mode enabled on devices that support TRIM;
• ext4 prefers noatime/nojournal and CFQ scheduler. Strangely it works (slightly) faster with discard enabled on eMMC without TRIM support;
• f2fs runs best with its basic settings, or with noatime enabled;
• CFQ scheduler dominates the table followed by the ROW.
6.1 Linear and random direct reading
The following two types of read performance are observed on tested media:
COGENT EMBEDDED 16

May 13, 2013 eMMC/SSD Filesystem Tuning Methodology
first type, where random reads are as fast as sequential reads, on all file systems,
and the second type, where random reads are slower than sequential reads for small block sizes, but the difference gets lower as block size grows. In both cases performance is very little affected by file system options or IO scheduler selection, but is different for different file systems:
COGENT EMBEDDED 17

May 13, 2013 eMMC/SSD Filesystem Tuning Methodology
Optimal settings for linear direct reading:
Medium BTRFS ext4 f2fs
16 GByte class 10 SD card (Kingston)
noatime row 9313noatime noop 9311noatime deadline 9311noatime cfq 9310ssd deadline 9306
discard noop 9397discard deadline 9397noatime noop 9396geometry noop 9395geometry row 9394
noatime noop 9395noatime deadline 9395base noop 9395base deadline 9395discard noop 9394
16Gbyte class 10 SD card (Transcend)
noatime noop 9427geometry noop 9424geometry cfq 9423base noop 9423base deadline 9423
noatime noop 9531base noop 9531writeback noop 9530writeback deadline 9530nojournal noop 9530
base noop 9529base deadline 9529discard noop 9528discard deadline 9528discard cfq 9527
16 Gbyte class 10 SD card (SanDisk)
noatime noop 9513ssd noop 9509ssd deadline 9507ssd cfq 9507noatime deadline 9507
nobarrier noop 9625noatime noop 9625noatime deadline 9625writeback noop 9624nojournal noop 9624
noatime noop 9625base noop 9625base deadline 9625discard deadline 9624noatime row 9623
16 GByte eMMC chip (Toshiba)
ssd noop 9849ssd deadline 9846geometry noop 9846discard noop 9846ssd cfq 9845
geometry deadline 10050base deadline 10050writeback deadline 10049nojournal deadline 10049noatime deadline 10047
noatime deadline 10056discard noop 10056noatime row 10055noatime cfq 10055base noop 10055
6.2 Linear and random direct writing
The following two types of write performance are observed on tested media:
COGENT EMBEDDED 18

May 13, 2013 eMMC/SSD Filesystem Tuning Methodology
first type, where random write is significantly slower than sequential write and grows linearly with IO block size. However it depends on the file system type, and even on such medium f2fs performs significantly better than btrfs or ext4, keeping random writes on par with sequential writes for IO block sizes up to 64KiB:
and the second type, where random writes with small and large IO block size are fast, but with medium IO block size are slow:
COGENT EMBEDDED 19

May 13, 2013 eMMC/SSD Filesystem Tuning Methodology
On such media f2fs also performs well with medium IO block size:
Optimal settings for linear direct writing:
Medium BTRFS ext4 f2fs
16 GByte class 10 SD card (Kingston)
ssd noop 8768ssd row 8766ssd deadline 8766geometry row 8755noatime row 8751
writeback row 8967writeback noop 8966writeback deadline 8966writeback cfq 8961noatime row 8957
noatime noop 8864discard noop 8809base row 8799base noop 8589noatime deadline 8588
16Gbyte class 10 SD card (Transcend)
discard deadline 8906ssd cfq 8877discard cfq 8873ssd noop 8870ssd deadline 8868
geometry deadline 9139nobarrier row 9126noatime noop 9122geometry cfq 9118geometry noop 9116
discard cfq 9035base cfq 9032base noop 9023discard noop 8951discard row 8931
16 Gbyte class 10 discard cfq 8250ssd cfq 8246
base noop 8315base deadline 8314
noatime noop 8263noatime cfq 8201
COGENT EMBEDDED 20
May 13, 2013 eMMC/SSD Filesystem Tuning Methodology
SD card (SanDisk) discard deadline 8244base row 8244discard noop 8242
discard noop 8303base row 8302geometry deadline 8301
noatime deadline 8199noatime row 8193base deadline 8148
16 GByte eMMC chip (Toshiba)
geometry row 9188geometry deadline 9186ssd row 9184noatime row 9184noatime deadline 9183
writeback cfq 9160nojournal cfq 9155base cfq 9152discard cfq 9147geometry cfq 9144
discard noop 9226noatime noop 9225base deadline 9225discard cfq 9224noatime row 9222
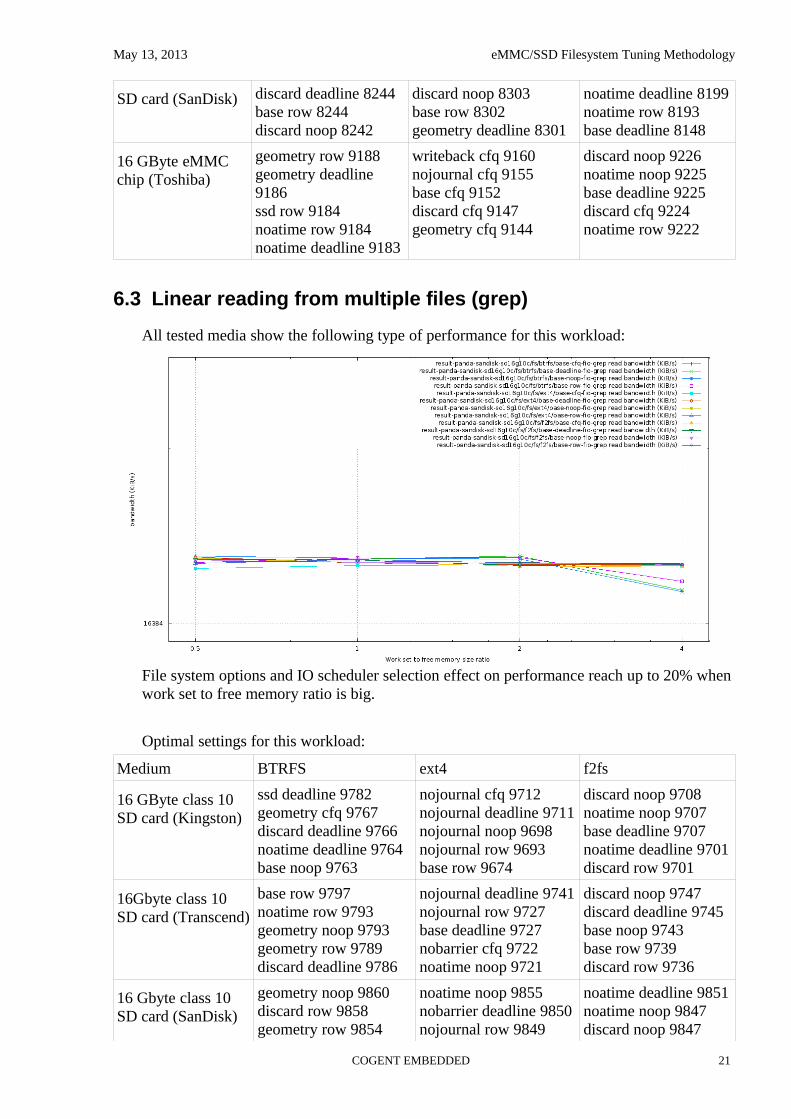
6.3 Linear reading from multiple files (grep)
All tested media show the following type of performance for this workload:
File system options and IO scheduler selection effect on performance reach up to 20% when work set to free memory ratio is big.
Optimal settings for this workload:
Medium BTRFS ext4 f2fs
16 GByte class 10 SD card (Kingston)
ssd deadline 9782geometry cfq 9767discard deadline 9766noatime deadline 9764base noop 9763
nojournal cfq 9712nojournal deadline 9711nojournal noop 9698nojournal row 9693base row 9674
discard noop 9708noatime noop 9707base deadline 9707noatime deadline 9701discard row 9701
16Gbyte class 10 SD card (Transcend)
base row 9797noatime row 9793geometry noop 9793geometry row 9789discard deadline 9786
nojournal deadline 9741nojournal row 9727base deadline 9727nobarrier cfq 9722noatime noop 9721
discard noop 9747discard deadline 9745base noop 9743base row 9739discard row 9736
16 Gbyte class 10 SD card (SanDisk)
geometry noop 9860discard row 9858geometry row 9854
noatime noop 9855nobarrier deadline 9850nojournal row 9849
noatime deadline 9851noatime noop 9847discard noop 9847
COGENT EMBEDDED 21
May 13, 2013 eMMC/SSD Filesystem Tuning Methodology
geometry deadline 9854geometry cfq 9853
nobarrier noop 9848discard row 9848
discard deadline 9847base row 9846
16 GByte eMMC chip (Toshiba)
ssd cfq 10407base cfq 10407discard row 10401discard cfq 10401geometry row 10398
nojournal cfq 10397nobarrier noop 10394base deadline 10394geometry cfq 10389discard row 10384
discard noop 10422base noop 10417discard cfq 10416noatime noop 10415discard deadline 10414
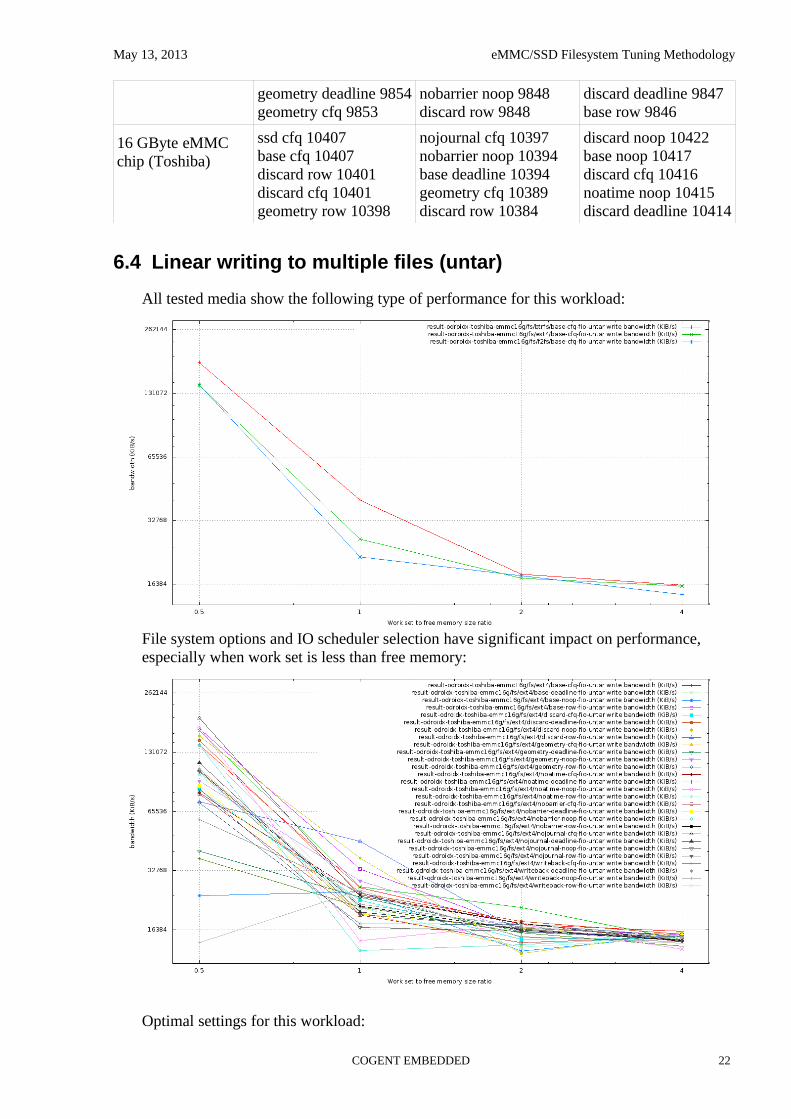
6.4 Linear writing to multiple files (untar)
All tested media show the following type of performance for this workload:
File system options and IO scheduler selection have significant impact on performance, especially when work set is less than free memory:
Optimal settings for this workload:
COGENT EMBEDDED 22
May 13, 2013 eMMC/SSD Filesystem Tuning Methodology
Medium BTRFS ext4 f2fs
16 GByte class 10 SD card (Kingston)
base row 10203discard cfq 10088base cfq 10075base noop 9793ssd deadline 9752
discard deadline 9592writeback cfq 9406nobarrier deadline 9381noatime deadline 9335nojournal noop 9308
base noop 9867discard noop 9743discard deadline 9735base deadline 9627noatime deadline 9614
16Gbyte class 10 SD card (Transcend)
ssd cfq 10148noatime cfq 10143base cfq 10130geometry cfq 10127ssd row 10091
nobarrier row 9865discard row 9848base noop 9848writeback cfq 9800noatime noop 9790
base noop 10200discard noop 10154base deadline 10044discard deadline 9919base row 9863
16 Gbyte class 10 SD card (SanDisk)
geometry noop 9375geometry deadline 9375discard deadline 9359ssd row 9341noatime deadline 9340
base row 9435noatime row 9297discard cfq 9281base noop 9274nojournal noop 9265
noatime deadline 9261discard noop 9250noatime row 9071discard deadline 9002base cfq 8998
16 GByte eMMC chip (Toshiba)
base cfq 10561ssd noop 10440noatime cfq 10440discard noop 10439noatime deadline 10436
base row 10461base deadline 10451nojournal cfq 10412discard noop 10406base cfq 10380
base cfq 10318noatime cfq 10207discard deadline 10205noatime deadline 10194base deadline 10153
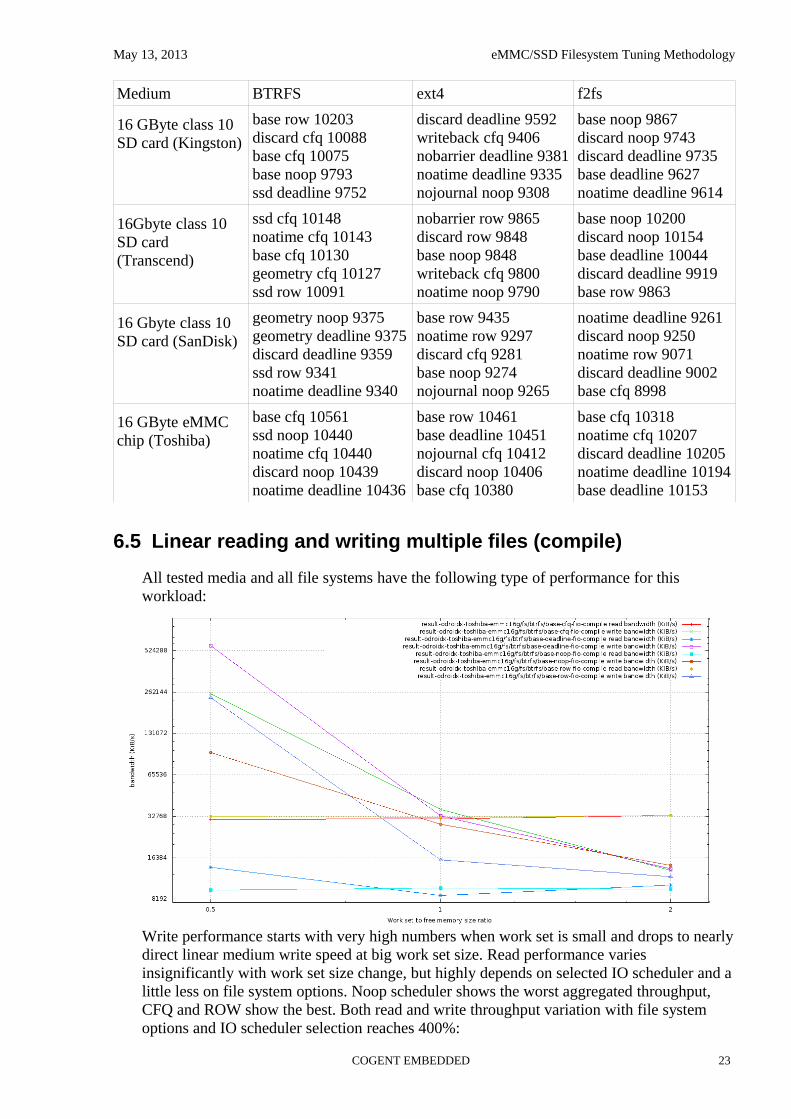
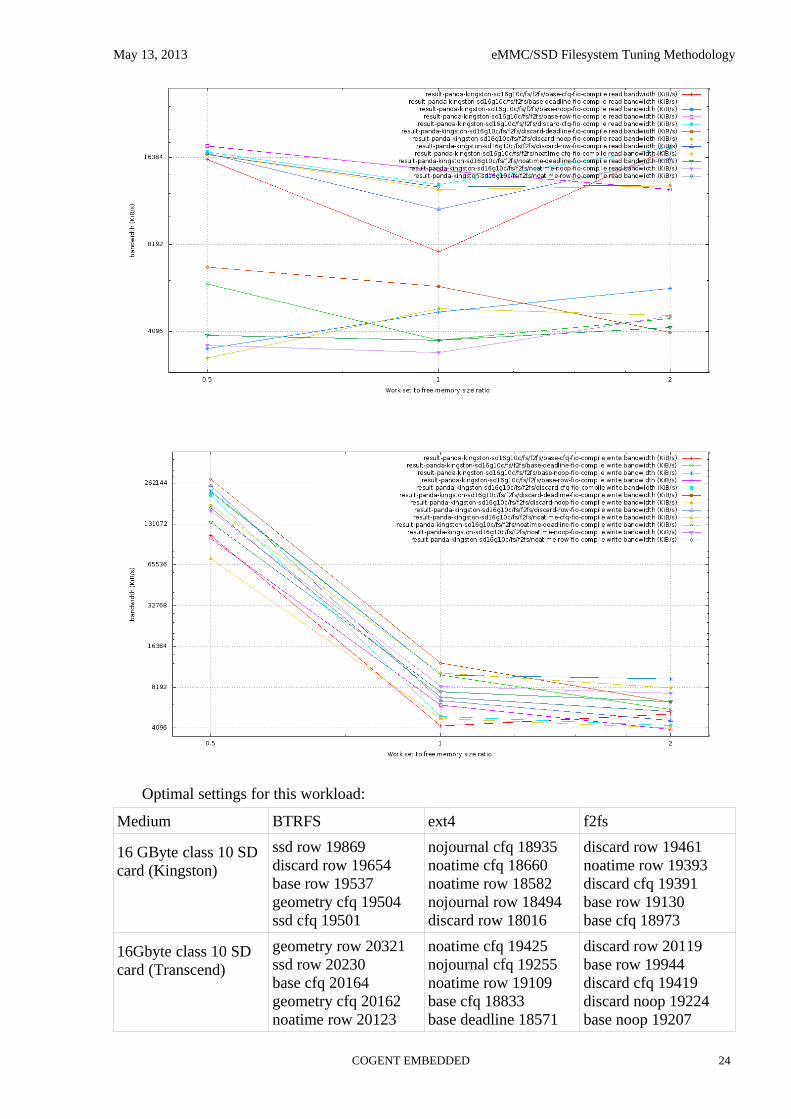
6.5 Linear reading and writing multiple files (compile)
All tested media and all file systems have the following type of performance for this workload:
Write performance starts with very high numbers when work set is small and drops to nearly direct linear medium write speed at big work set size. Read performance varies insignificantly with work set size change, but highly depends on selected IO scheduler and a little less on file system options. Noop scheduler shows the worst aggregated throughput, CFQ and ROW show the best. Both read and write throughput variation with file system options and IO scheduler selection reaches 400%:
COGENT EMBEDDED 23
May 13, 2013 eMMC/SSD Filesystem Tuning Methodology
Optimal settings for this workload:
Medium BTRFS ext4 f2fs
16 GByte class 10 SD card (Kingston)
ssd row 19869discard row 19654base row 19537geometry cfq 19504ssd cfq 19501
nojournal cfq 18935noatime cfq 18660noatime row 18582nojournal row 18494discard row 18016
discard row 19461noatime row 19393discard cfq 19391base row 19130base cfq 18973
16Gbyte class 10 SD card (Transcend)
geometry row 20321ssd row 20230base cfq 20164geometry cfq 20162noatime row 20123
noatime cfq 19425nojournal cfq 19255noatime row 19109base cfq 18833base deadline 18571
discard row 20119base row 19944discard cfq 19419discard noop 19224base noop 19207
COGENT EMBEDDED 24
May 13, 2013 eMMC/SSD Filesystem Tuning Methodology
16 Gbyte class 10 SD card (SanDisk)
base cfq 20033ssd row 19977geometry row 19951geometry cfq 19948discard row 19884
nojournal cfq 19410noatime cfq 19161noatime row 19099nojournal row 18957writeback row 18780
noatime row 20069base row 19995base cfq 19983discard cfq 19964noatime cfq 19797
16 GByte eMMC chip (Toshiba)
base cfq 21189ssd cfq 21133noatime cfq 21008ssd row 20972discard row 20895
writeback cfq 21492base noop 21447noatime cfq 21330base deadline 21296discard cfq 21246
noatime cfq 20891base cfq 20885discard row 20879base row 20801discard cfq 20781
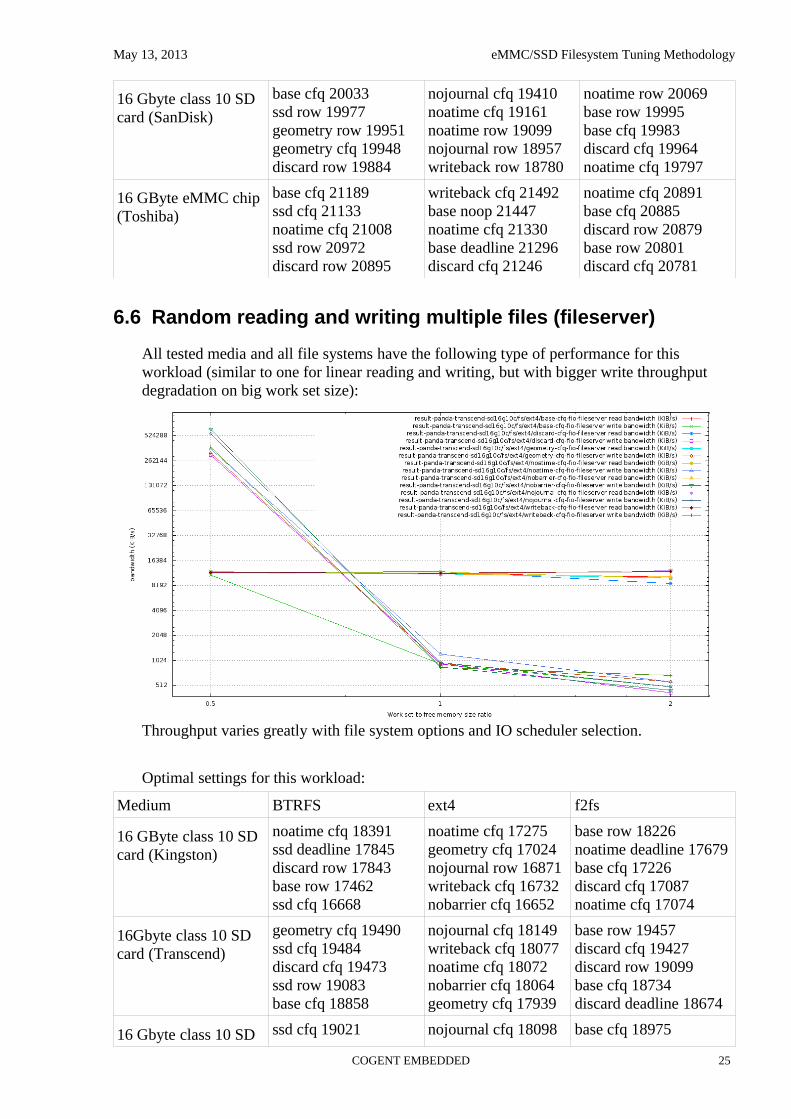
6.6 Random reading and writing multiple files (fileserver)
All tested media and all file systems have the following type of performance for this workload (similar to one for linear reading and writing, but with bigger write throughput degradation on big work set size):
Throughput varies greatly with file system options and IO scheduler selection.
Optimal settings for this workload:
Medium BTRFS ext4 f2fs
16 GByte class 10 SD card (Kingston)
noatime cfq 18391ssd deadline 17845discard row 17843base row 17462ssd cfq 16668
noatime cfq 17275geometry cfq 17024nojournal row 16871writeback cfq 16732nobarrier cfq 16652
base row 18226noatime deadline 17679base cfq 17226discard cfq 17087noatime cfq 17074
16Gbyte class 10 SD card (Transcend)
geometry cfq 19490ssd cfq 19484discard cfq 19473ssd row 19083base cfq 18858
nojournal cfq 18149writeback cfq 18077noatime cfq 18072nobarrier cfq 18064geometry cfq 17939
base row 19457discard cfq 19427discard row 19099base cfq 18734discard deadline 18674
16 Gbyte class 10 SD ssd cfq 19021 nojournal cfq 18098 base cfq 18975
COGENT EMBEDDED 25
May 13, 2013 eMMC/SSD Filesystem Tuning Methodology
card (SanDisk) base cfq 18923discard cfq 18858noatime cfq 18761geometry cfq 18640
discard row 17915writeback cfq 17846nobarrier cfq 17769noatime cfq 17764
noatime row 18969discard row 18729base deadline 17862noatime noop 17859
16 GByte eMMC chip (Toshiba)
base cfq 20468noatime cfq 20417geometry cfq 20336discard cfq 20271ssd row 20240
base cfq 20392discard cfq 20383geometry row 20284noatime cfq 20265writeback row 20116
noatime cfq 19232base cfq 19165discard cfq 19129base row 19074noatime row 19040
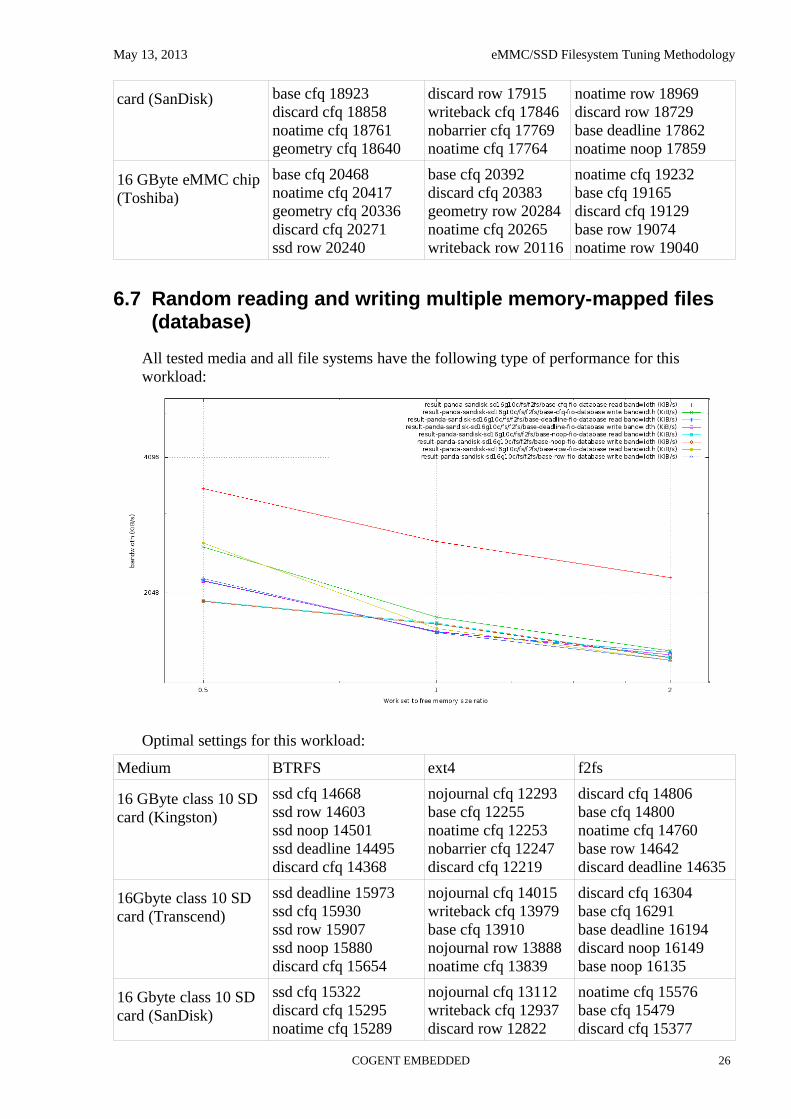
6.7 Random reading and writing multiple memory-mapped files (database)
All tested media and all file systems have the following type of performance for this workload:
Optimal settings for this workload:
Medium BTRFS ext4 f2fs
16 GByte class 10 SD card (Kingston)
ssd cfq 14668ssd row 14603ssd noop 14501ssd deadline 14495discard cfq 14368
nojournal cfq 12293base cfq 12255noatime cfq 12253nobarrier cfq 12247discard cfq 12219
discard cfq 14806base cfq 14800noatime cfq 14760base row 14642discard deadline 14635
16Gbyte class 10 SD card (Transcend)
ssd deadline 15973ssd cfq 15930ssd row 15907ssd noop 15880discard cfq 15654
nojournal cfq 14015writeback cfq 13979base cfq 13910nojournal row 13888noatime cfq 13839
discard cfq 16304base cfq 16291base deadline 16194discard noop 16149base noop 16135
16 Gbyte class 10 SD card (SanDisk)
ssd cfq 15322discard cfq 15295noatime cfq 15289
nojournal cfq 13112writeback cfq 12937discard row 12822
noatime cfq 15576base cfq 15479discard cfq 15377
COGENT EMBEDDED 26
May 13, 2013 eMMC/SSD Filesystem Tuning Methodology
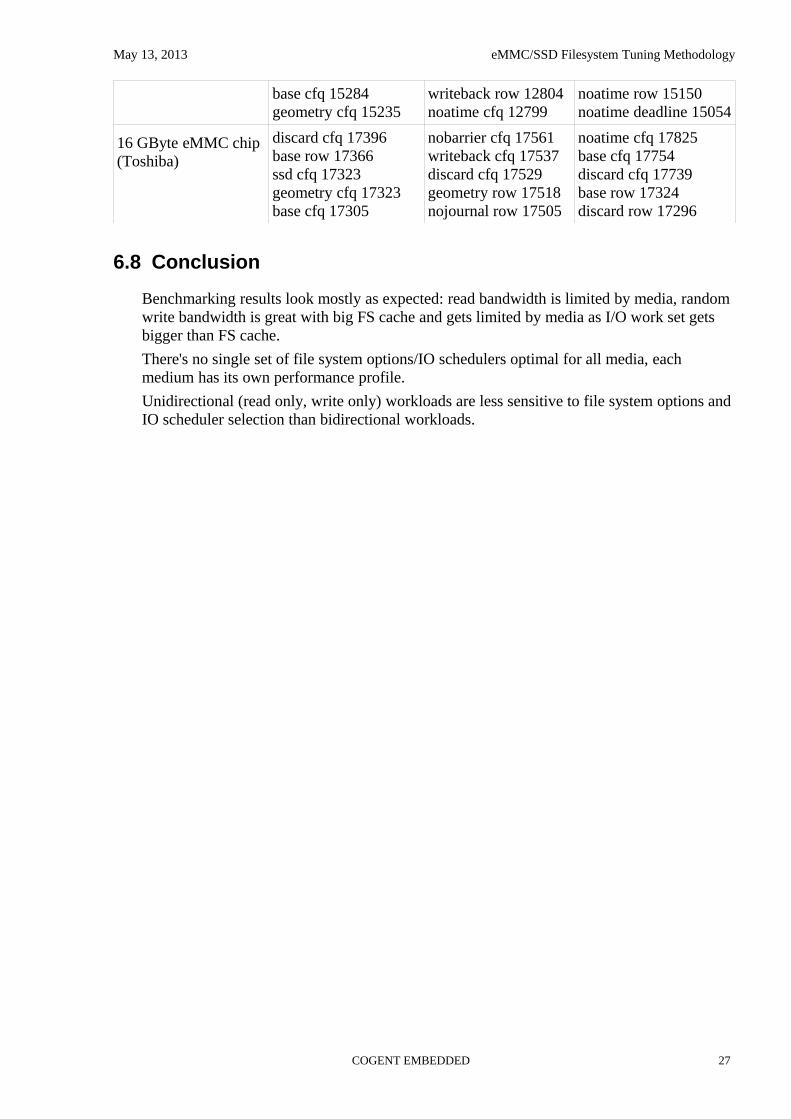
base cfq 15284geometry cfq 15235
writeback row 12804noatime cfq 12799
noatime row 15150noatime deadline 15054
16 GByte eMMC chip (Toshiba)
discard cfq 17396base row 17366ssd cfq 17323geometry cfq 17323base cfq 17305
nobarrier cfq 17561writeback cfq 17537discard cfq 17529geometry row 17518nojournal row 17505
noatime cfq 17825base cfq 17754discard cfq 17739base row 17324discard row 17296
6.8 Conclusion
Benchmarking results look mostly as expected: read bandwidth is limited by media, random write bandwidth is great with big FS cache and gets limited by media as I/O work set gets bigger than FS cache.
There's no single set of file system options/IO schedulers optimal for all media, each medium has its own performance profile.
Unidirectional (read only, write only) workloads are less sensitive to file system options and IO scheduler selection than bidirectional workloads.
COGENT EMBEDDED 27

May 13, 2013 eMMC/SSD Filesystem Tuning Methodology
7 Benchmarking scripts
Git tree with benchmarking scripts is available at git://git.cogentembedded.com/pub/celf/flashopt
7.1 Tree structure
./
├── benchmark/ # benchmarks directory
│ ├── common # common parts of benchmark scripts
│ ├── benchmark-script # script instance
│ ├── benchmark-script.config # instance configuration
│ ├── benchmark-script.job # FIO job definition (for fio scripts)
│ └── ...
├── fs/ # file systems directory
│ ├── btrfs/ # file system instance
│ │ ├── config # common parts of configuration scripts
│ │ ├── fs-configuration-script # fs configuration script instance
│ │ ├── fs-configuration-script.config # instance configuration
│ │ └── ...
│ ├── ...
│ └── common # common parts of all file system scripts
├── iosched/ # IO schedulers directory
│ ├── config # common parts of configuration scripts
│ ├── ioscheduler-script # IO scheduler configuration script instance
│ └── ...
├── result-xxx/ # results directory
│ └── fs/
│ ├── <fs>/ # results for the file system <fs>
│ │ ├── <fs-config>-<benchmark> # result for <benchmark> in <fs-config>
│ │ └── ...
│ └── ...
├── config # common configuration parameters
└── run* # topmost run wrapper
All scripts in the tree are bash scripts, configuration files are sourced.
7.2 Configuration
./config file is the main configuration file, it defines parameters of the used media and file system options:
COGENT EMBEDDED 28

May 13, 2013 eMMC/SSD Filesystem Tuning Methodology
device=/dev/mmcblk0p3 # device used for testing
mount_dir=/media/mmc # test mount point
result_dir=result-kingston-sd8g4c # result directory location
media_page_size=16384 # media page size
media_erase_block_size=4194304 # media erase block size
ext4_default="nobarrier" # current configuration for ext4
ext4_exclude="geometry" # list of excluded configurations for ext4
btrfs_default="noatime ssd" # current configuration for btrfs
btrfs_exclude="geometry" # list of excluded configurations for btrfs
f2fs_default="noatime" # current configuration for f2fs
f2fs_exclude="geometry" # list of excluded configurations for f2fs
A hint on the media geometry parameters may be obtained from ./run geometry.
7.3 Execution
Once ./config is filled ./run script may be started. For each missing file under ${result_dir} it invokes fs configuration scripts not mentioned in *_default variables to create and mount corresponding file system and then it invokes benchmarking scripts in turn and put their output into the ${result_dir}.
Once ./run is complete result comparison graphs may be built by running ./run gdiff.
Comparison graphs for arbitrary (but compatible) result sets may be built by calling benchmarking scripts with parameter 'gdiff' and a list of result files to compare.
7.4 Sample usage
1. fill in ./config for the test:
$ cat > configdevice=/dev/mmcblk0p3mount_dir=/media/mmcblk0p3result_dir=result-kingston-sd8g4cext4_default=""btrfs_default=""f2fs_default=""^D
2. Determine flash media parameters:
# ./run geometry | tee -a ./config## Guessed media geometry#media_page_size=16384media_erase_block_size=4194304
COGENT EMBEDDED 29
May 13, 2013 eMMC/SSD Filesystem Tuning Methodology
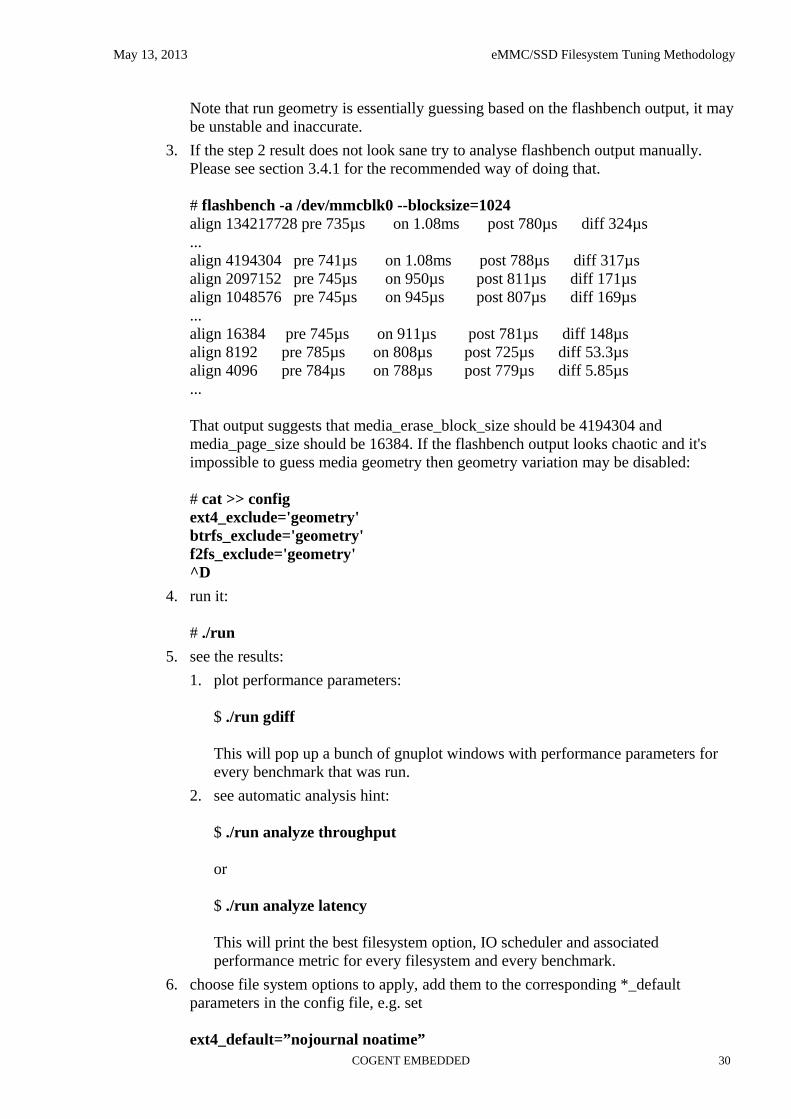
Note that run geometry is essentially guessing based on the flashbench output, it may be unstable and inaccurate.
3. If the step 2 result does not look sane try to analyse flashbench output manually.Please see section 3.4.1 for the recommended way of doing that.
# flashbench -a /dev/mmcblk0 --blocksize=1024align 134217728 pre 735µs on 1.08ms post 780µs diff 324µs...align 4194304 pre 741µs on 1.08ms post 788µs diff 317µsalign 2097152 pre 745µs on 950µs post 811µs diff 171µsalign 1048576 pre 745µs on 945µs post 807µs diff 169µs...align 16384 pre 745µs on 911µs post 781µs diff 148µsalign 8192 pre 785µs on 808µs post 725µs diff 53.3µsalign 4096 pre 784µs on 788µs post 779µs diff 5.85µs...
That output suggests that media_erase_block_size should be 4194304 and media_page_size should be 16384. If the flashbench output looks chaotic and it's impossible to guess media geometry then geometry variation may be disabled:
# cat >> configext4_exclude='geometry'btrfs_exclude='geometry'f2fs_exclude='geometry'^D
4. run it:
# ./run
5. see the results:
1. plot performance parameters:
$ ./run gdiff
This will pop up a bunch of gnuplot windows with performance parameters for every benchmark that was run.
2. see automatic analysis hint:
$ ./run analyze throughput
or
$ ./run analyze latency
This will print the best filesystem option, IO scheduler and associated performance metric for every filesystem and every benchmark.
6. choose file system options to apply, add them to the corresponding *_default parameters in the config file, e.g. set
ext4_default=”nojournal noatime”COGENT EMBEDDED 30
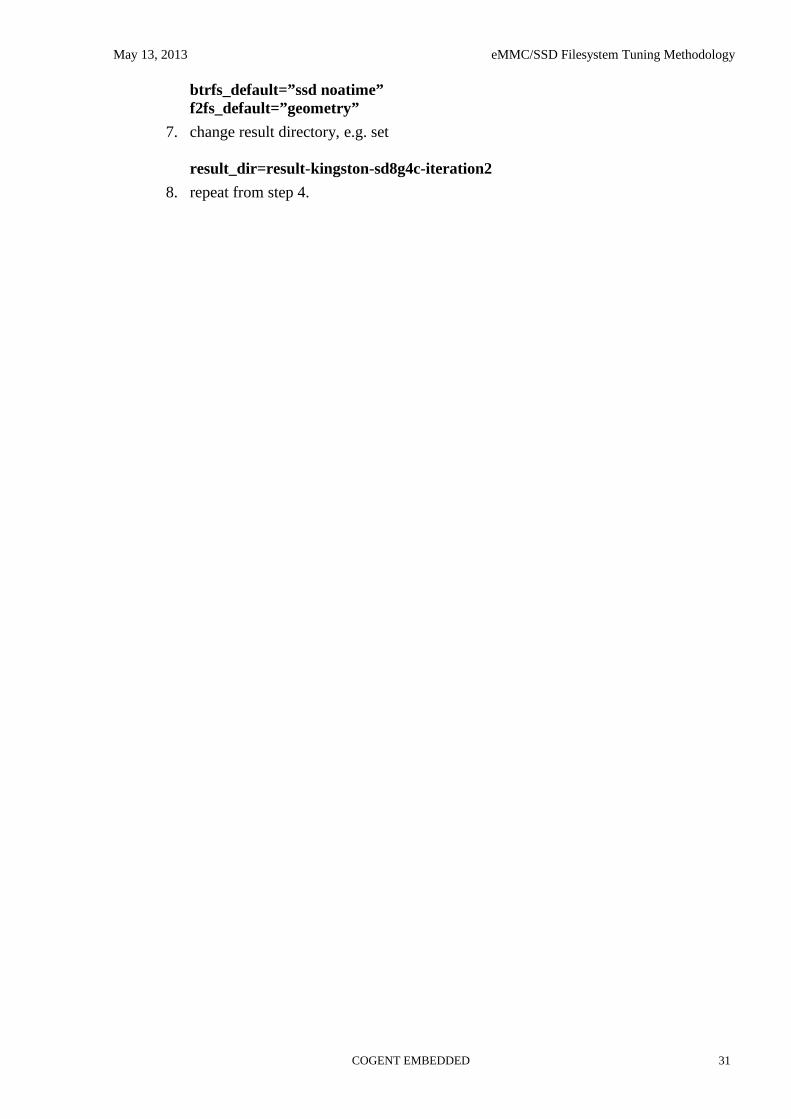
May 13, 2013 eMMC/SSD Filesystem Tuning Methodology
btrfs_default=”ssd noatime”f2fs_default=”geometry”
7. change result directory, e.g. set
result_dir=result-kingston-sd8g4c-iteration2
8. repeat from step 4.
COGENT EMBEDDED 31