Embed Size (px)
Citation preview
Emissions Trading Scheme
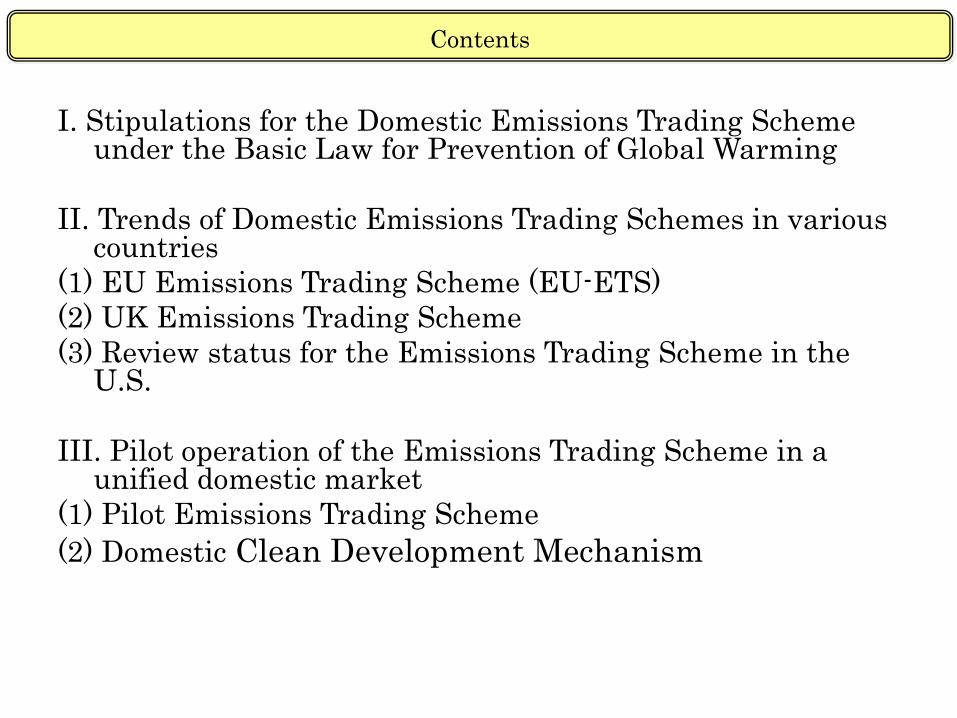
I. Stipulations for the Domestic Emissions Trading Scheme under the Basic Law for Prevention of Global Warming
II. Trends of Domestic Emissions Trading Schemes in various countries
(1) EU Emissions Trading Scheme (EU-ETS)(2) UK Emissions Trading Scheme(3) Review status for the Emissions Trading Scheme in the
U.S.
III. Pilot operation of the Emissions Trading Scheme in a unified domestic market
(1) Pilot Emissions Trading Scheme(2) Domestic Clean Development Mechanism
Contents
I. Stipulations for the Domestic Emissions Trading Scheme under the
Basic Law for Prevention of Global Warming
Stipulations for the Domestic Emissions Trading Scheme under the Basic Law for Prevention of Global Warming
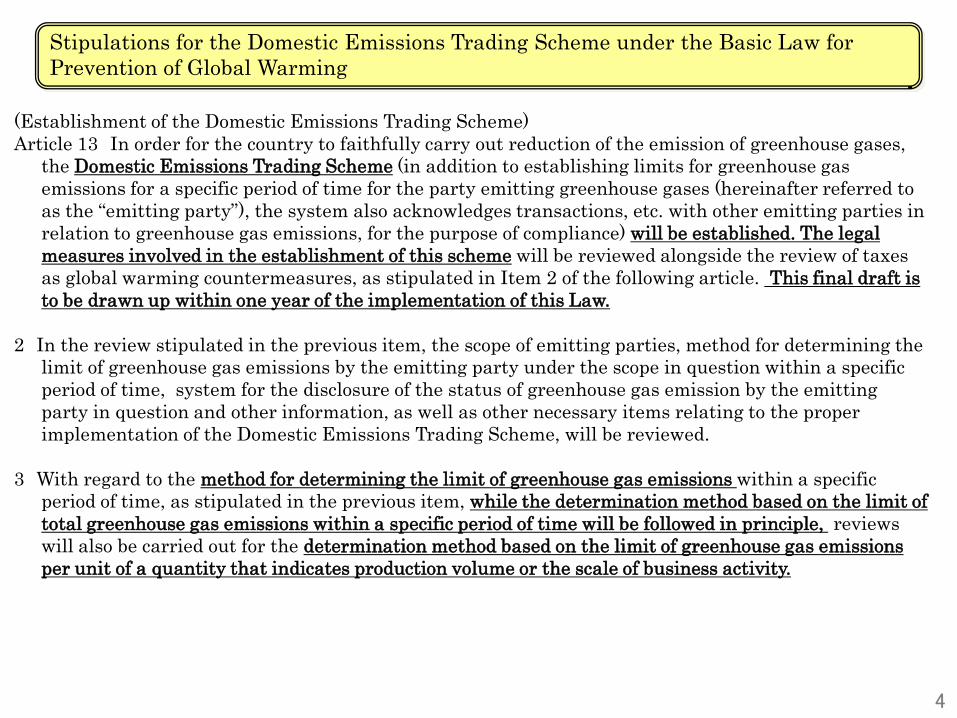
(Establishment of the Domestic Emissions Trading Scheme)Article 13 In order for the country to faithfully carry out reduction of the emission of greenhouse gases,
the Domestic Emissions Trading Scheme (in addition to establishing limits for greenhouse gas emissions for a specific period of time for the party emitting greenhouse gases (hereinafter referred to as the “emitting party”), the system also acknowledges transactions, etc. with other emitting parties in relation to greenhouse gas emissions, for the purpose of compliance) will be established. The legal measures involved in the establishment of this scheme will be reviewed alongside the review of taxes as global warming countermeasures, as stipulated in Item 2 of the following article. This final draft is to be drawn up within one year of the implementation of this Law.
2 In the review stipulated in the previous item, the scope of emitting parties, method for determining the limit of greenhouse gas emissions by the emitting party under the scope in question within a specific period of time, system for the disclosure of the status of greenhouse gas emission by the emitting party in question and other information, as well as other necessary items relating to the proper implementation of the Domestic Emissions Trading Scheme, will be reviewed.
3 With regard to the method for determining the limit of greenhouse gas emissions within a specific period of time, as stipulated in the previous item, while the determination method based on the limit of total greenhouse gas emissions within a specific period of time will be followed in principle, reviews will also be carried out for the determination method based on the limit of greenhouse gas emissions per unit of a quantity that indicates production volume or the scale of business activity.
4
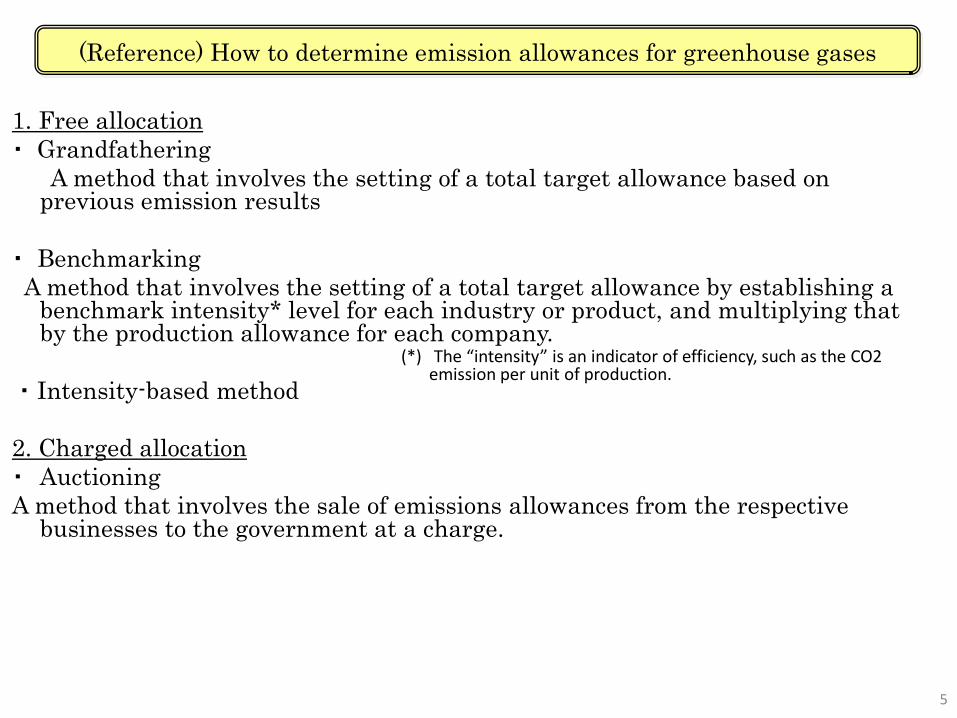
(Reference) How to determine emission allowances for greenhouse gases
1. Free allocation・ Grandfathering
A method that involves the setting of a total target allowance based on previous emission results
・ BenchmarkingA method that involves the setting of a total target allowance by establishing a
benchmark intensity* level for each industry or product, and multiplying that by the production allowance for each company.
・ Intensity-based method
2. Charged allocation・ AuctioningA method that involves the sale of emissions allowances from the respective
businesses to the government at a charge.
(*) The “intensity” is an indicator of efficiency, such as the CO2 emission per unit of production.
5
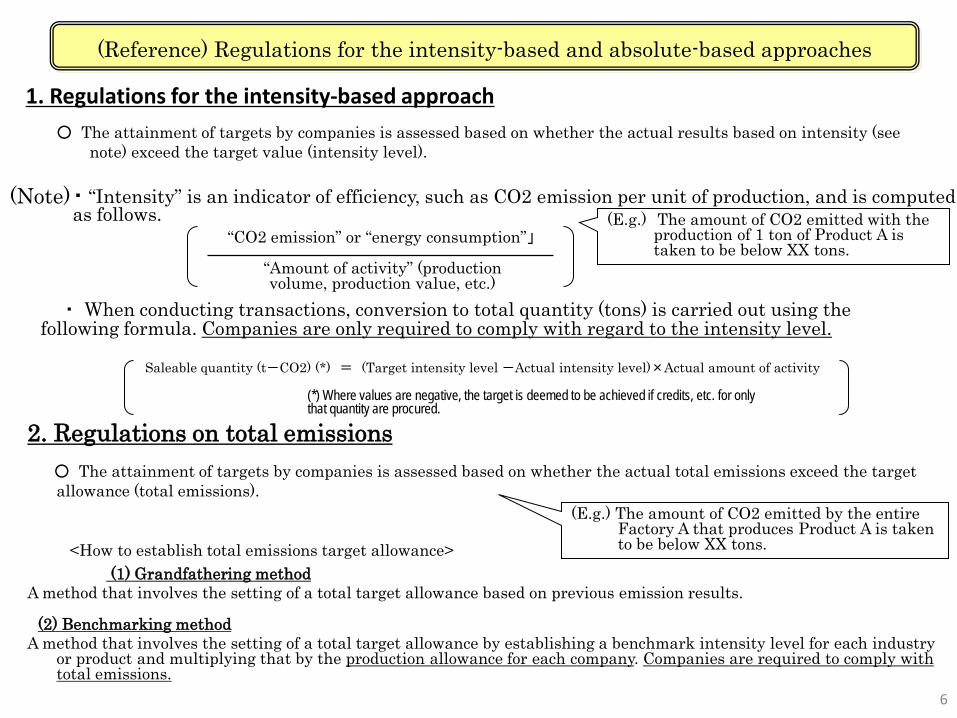
(Reference) Regulations for the intensity-based and absolute-based approaches
1. Regulations for the intensity-based approach
2. Regulations on total emissions○ The attainment of targets by companies is assessed based on whether the actual total emissions exceed the target allowance (total emissions).
<How to establish total emissions target allowance>(1) Grandfathering method
A method that involves the setting of a total target allowance based on previous emission results.
(2) Benchmarking methodA method that involves the setting of a total target allowance by establishing a benchmark intensity level for each industry
or product and multiplying that by the production allowance for each company. Companies are required to comply with total emissions.
○ The attainment of targets by companies is assessed based on whether the actual results based on intensity (see note) exceed the target value (intensity level).
Saleable quantity (t-CO2) (*) = (Target intensity level -Actual intensity level)×Actual amount of activity
“Amount of activity” (production volume, production value, etc.)
“CO2 emission” or “energy consumption”」
・ “Intensity” is an indicator of efficiency, such as CO2 emission per unit of production, and is computed as follows.
(*) Where values are negative, the target is deemed to be achieved if credits, etc. for only that quantity are procured.
(Note)
・ When conducting transactions, conversion to total quantity (tons) is carried out using the following formula. Companies are only required to comply with regard to the intensity level.
(E.g.) The amount of CO2 emitted with the production of 1 ton of Product A is taken to be below XX tons.
(E.g.) The amount of CO2 emitted by the entire Factory A that produces Product A is taken to be below XX tons.
6
II. Trends of Domestic Emissions Trading Schemes in various countries
(1) EU Emissions Trading Scheme (EU-ETS) (2) UK Emissions Trading Scheme
(3) Review status for the Emissions Trading Scheme in the U.S.
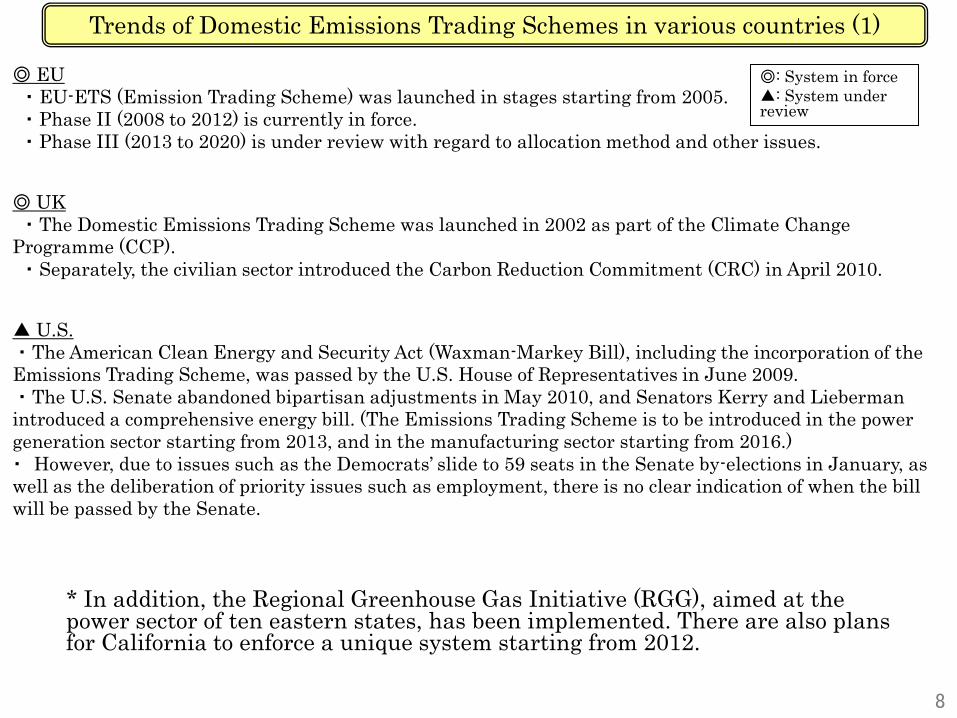
Trends of Domestic Emissions Trading Schemes in various countries (1)
◎ EU・ EU-ETS (Emission Trading Scheme) was launched in stages starting from 2005.・ Phase II (2008 to 2012) is currently in force.・ Phase III (2013 to 2020) is under review with regard to allocation method and other issues.
◎ UK・ The Domestic Emissions Trading Scheme was launched in 2002 as part of the Climate Change
Programme (CCP).・ Separately, the civilian sector introduced the Carbon Reduction Commitment (CRC) in April 2010.
▲ U.S.・ The American Clean Energy and Security Act (Waxman-Markey Bill), including the incorporation of the Emissions Trading Scheme, was passed by the U.S. House of Representatives in June 2009.・ The U.S. Senate abandoned bipartisan adjustments in May 2010, and Senators Kerry and Lieberman introduced a comprehensive energy bill. (The Emissions Trading Scheme is to be introduced in the power generation sector starting from 2013, and in the manufacturing sector starting from 2016.)・ However, due to issues such as the Democrats’ slide to 59 seats in the Senate by-elections in January, as well as the deliberation of priority issues such as employment, there is no clear indication of when the bill will be passed by the Senate.
◎: System in force▲: System under review
* In addition, the Regional Greenhouse Gas Initiative (RGG), aimed at the power sector of ten eastern states, has been implemented. There are also plans for California to enforce a unique system starting from 2012.
8
Trends of Domestic Emissions Trading Schemes in various countries (2)
▲ Canada
・ While a draft of an Emissions Trading Scheme based on the intensity-based method, targeting the power and industrial sectors, was released in 2007, no further progress was made thereafter. Currently, there are plans to introduce the system instages, corresponding with the status of development of the American system.
▲ Australia・ Although the Carbon Pollution Reduction Scheme Bill (CPRS Bill), including the introduction of an Emissions Trading Scheme, was introduced to the congress, the bill was rejected twice in the Senate despite having been passed by the House of Representatives in mid-2009.・ In April this year, it was decided that introduction of the system would be postponed till 2013 as the opposition had taken up an opposing stance to the legislature, and because implementation had also been delayed in other countries.
▲ New Zealand・ An Emissions Trading Scheme targeted at the forestry sector is currently in force. While there have been plans to expand the scheme to the energy conversion, industrial, and transportation sectors from January this year, the plans were postponed to July 2010 in November last year. In addition, it was decided that transitional measures would be put in place till 2013 to help reduce the burden. ・ As the main trading partner countries have not made progress in the implementation of the Emissions Trading Scheme, the Climate Change Minister announced in April this year that full implementation of the scheme would be delayed.
◎: System in force▲: System under review
*In January 2009, the European Commission called for the establishment of an OECD-wide international carbon market by 2015. However, in January 2010, Director of Climate Change in the European Commission, Runge-Metzger, declared that it would be difficult to bring about a global carbon market, and that it would not be easy to link different markets.
9
*
(1) EU Emissions Trading Scheme (EU-ETS) 1) Overview
10
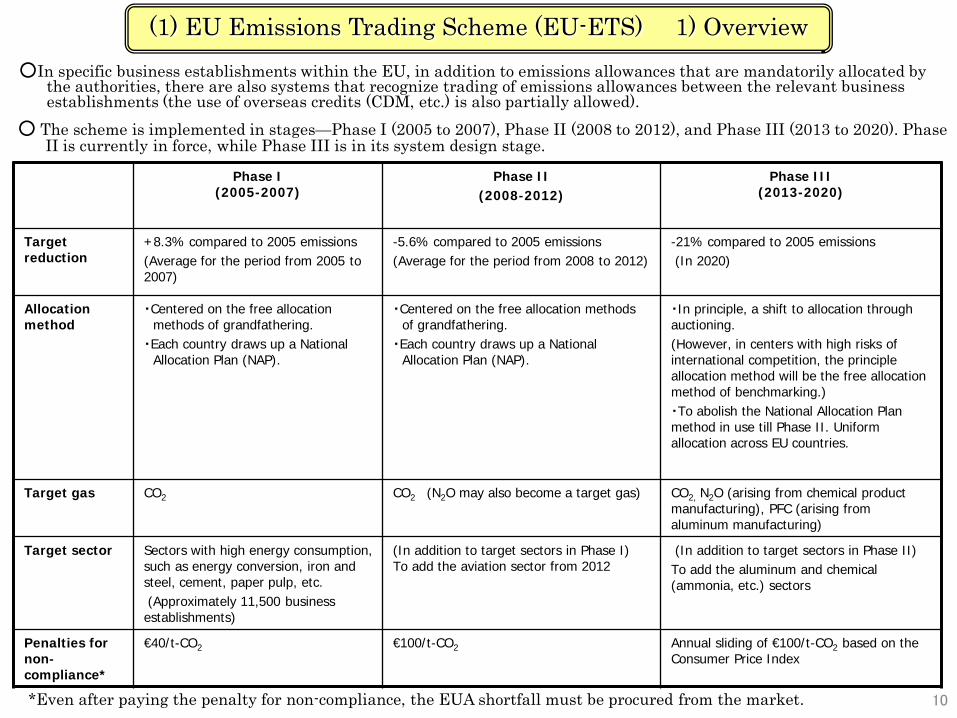
○In specific business establishments within the EU, in addition to emissions allowances that are mandatorily allocated by the authorities, there are also systems that recognize trading of emissions allowances between the relevant business establishments (the use of overseas credits (CDM, etc.) is also partially allowed).
Phase I(2005-2007)
Phase II(2008-2012)
Phase III(2013-2020)
Target reduction
+8.3% compared to 2005 emissions(Average for the period from 2005 to 2007)
-5.6% compared to 2005 emissions(Average for the period from 2008 to 2012)
-21% compared to 2005 emissions(In 2020)
Allocation method
・Centered on the free allocation methods of grandfathering.
・Each country draws up a National Allocation Plan (NAP).
・Centered on the free allocation methods of grandfathering.
・Each country draws up a National Allocation Plan (NAP).
・In principle, a shift to allocation through auctioning.(However, in centers with high risks of international competition, the principle allocation method will be the free allocation method of benchmarking.)・To abolish the National Allocation Plan method in use till Phase II. Uniform allocation across EU countries.
Target gas CO2 CO2 (N2O may also become a target gas) CO2, N2O (arising from chemical product manufacturing), PFC (arising from aluminum manufacturing)
Target sector Sectors with high energy consumption, such as energy conversion, iron and steel, cement, paper pulp, etc.(Approximately 11,500 business establishments)
(In addition to target sectors in Phase I)To add the aviation sector from 2012
(In addition to target sectors in Phase II)To add the aluminum and chemical (ammonia, etc.) sectors
Penalties for non-compliance*
€40/t-CO2 €100/t-CO2 Annual sliding of €100/t-CO2 based on the Consumer Price Index
*Even after paying the penalty for non-compliance, the EUA shortfall must be procured from the market.
○ The scheme is implemented in stages—Phase I (2005 to 2007), Phase II (2008 to 2012), and Phase III (2013 to 2020). Phase II is currently in force, while Phase III is in its system design stage.
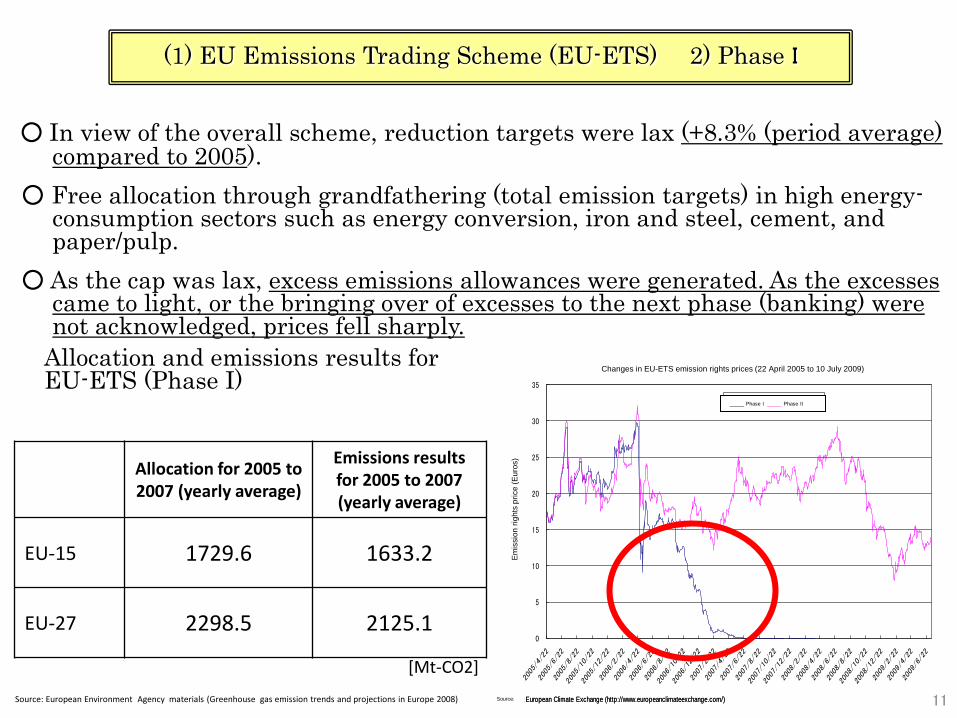
○ In view of the overall scheme, reduction targets were lax (+8.3% (period average) compared to 2005).
○ Free allocation through grandfathering (total emission targets) in high energy-consumption sectors such as energy conversion, iron and steel, cement, and paper/pulp.
○ As the cap was lax, excess emissions allowances were generated. As the excesses came to light, or the bringing over of excesses to the next phase (banking) were not acknowledged, prices fell sharply.
(1) EU Emissions Trading Scheme (EU-ETS) 2) Phase I
0
5
10
15
20
25
30
35
排出権価格[ユーロ]
EUETSの排出権価格の推移 (2005年4月22日~2009年7月10日)
フェーズⅠ フェーズⅡ
出典:European Climate Exchange (http://www.europeanclimateexchange.com/)出典:European Climate Exchange (http://www.europeanclimateexchange.com/)
Allocation for 2005 to 2007 (yearly average)
Emissions results for 2005 to 2007 (yearly average)
EU-15 1729.6 1633.2
EU-27 2298.5 2125.1
Allocation and emissions results for EU-ETS (Phase I)
Source: European Environment Agency materials (Greenhouse gas emission trends and projections in Europe 2008)
[Mt-CO2]
11
Changes in EU-ETS emission rights prices (22 April 2005 to 10 July 2009)
_____ Phase I _____ Phase II
Emis
sion
righ
ts p
rice
(Eur
os)
Source:
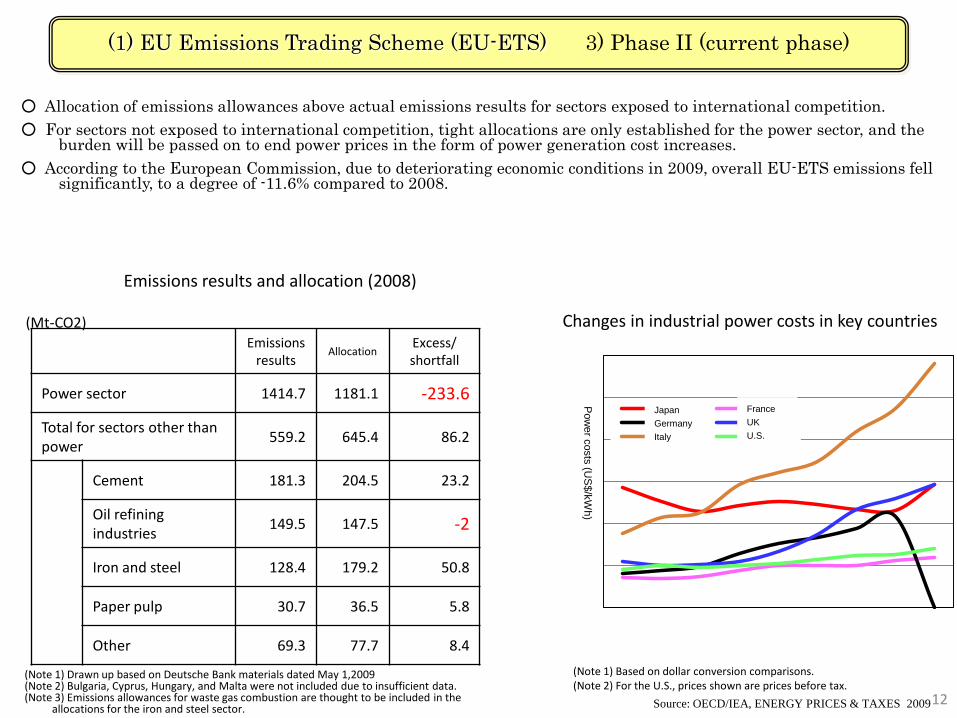
○ Allocation of emissions allowances above actual emissions results for sectors exposed to international competition.○ For sectors not exposed to international competition, tight allocations are only established for the power sector, and the
burden will be passed on to end power prices in the form of power generation cost increases.○ According to the European Commission, due to deteriorating economic conditions in 2009, overall EU-ETS emissions fell
significantly, to a degree of -11.6% compared to 2008.
Emissions results and allocation (2008)
(Note 1) Drawn up based on Deutsche Bank materials dated May 1,2009(Note 2) Bulgaria, Cyprus, Hungary, and Malta were not included due to insufficient data.(Note 3) Emissions allowances for waste gas combustion are thought to be included in the
allocations for the iron and steel sector.
Changes in industrial power costs in key countries(Mt-CO2)Emissions
resultsAllocation
Excess/shortfall
Power sector 1414.7 1181.1 -233.6
Total for sectors other than power
559.2 645.4 86.2
Cement 181.3 204.5 23.2
Oil refining industries
149.5 147.5 -2
Iron and steel 128.4 179.2 50.8
Paper pulp 30.7 36.5 5.8
Other 69.3 77.7 8.4
Source: OECD/IEA, ENERGY PRICES & TAXES 2009
(Note 1) Based on dollar conversion comparisons.(Note 2) For the U.S., prices shown are prices before tax.
電力料金(US
$/kW
h
)
日本 フランスドイツ イギリスイタリア アメリカ
FranceUKU.S.
(1) EU Emissions Trading Scheme (EU-ETS) 3) Phase II (current phase)
12
Pow
er costs (US
$/kWh)
JapanGermanyItaly
(1) EU Emissions Trading Scheme (EU-ETS) 4) Appraisal of results thus far
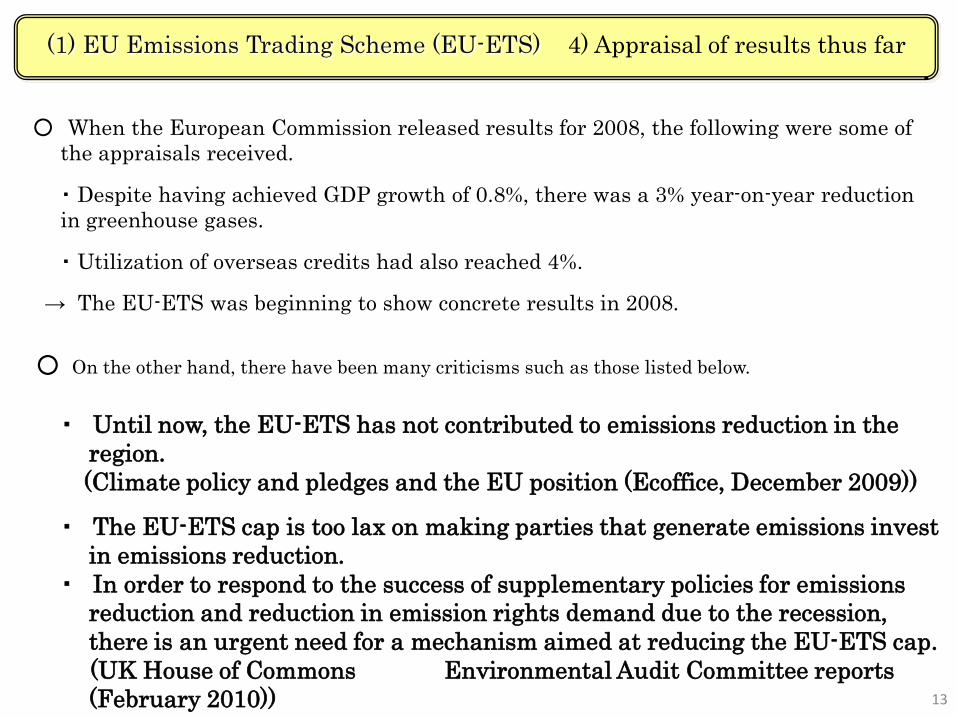
・ Until now, the EU-ETS has not contributed to emissions reduction in the region.(Climate policy and pledges and the EU position (Ecoffice, December 2009))
・ The EU-ETS cap is too lax on making parties that generate emissions invest in emissions reduction.
・ In order to respond to the success of supplementary policies for emissions reduction and reduction in emission rights demand due to the recession, there is an urgent need for a mechanism aimed at reducing the EU-ETS cap.(UK House of Commons Environmental Audit Committee reports (February 2010))
○ On the other hand, there have been many criticisms such as those listed below.
○ When the European Commission released results for 2008, the following were some of the appraisals received.
・ Despite having achieved GDP growth of 0.8%, there was a 3% year-on-year reduction in greenhouse gases.
・ Utilization of overseas credits had also reached 4%.
→ The EU-ETS was beginning to show concrete results in 2008.
13
(1) EU Emissions Trading Scheme (EU-ETS) 5) Review status of allocations in Phase III (2013 to -)
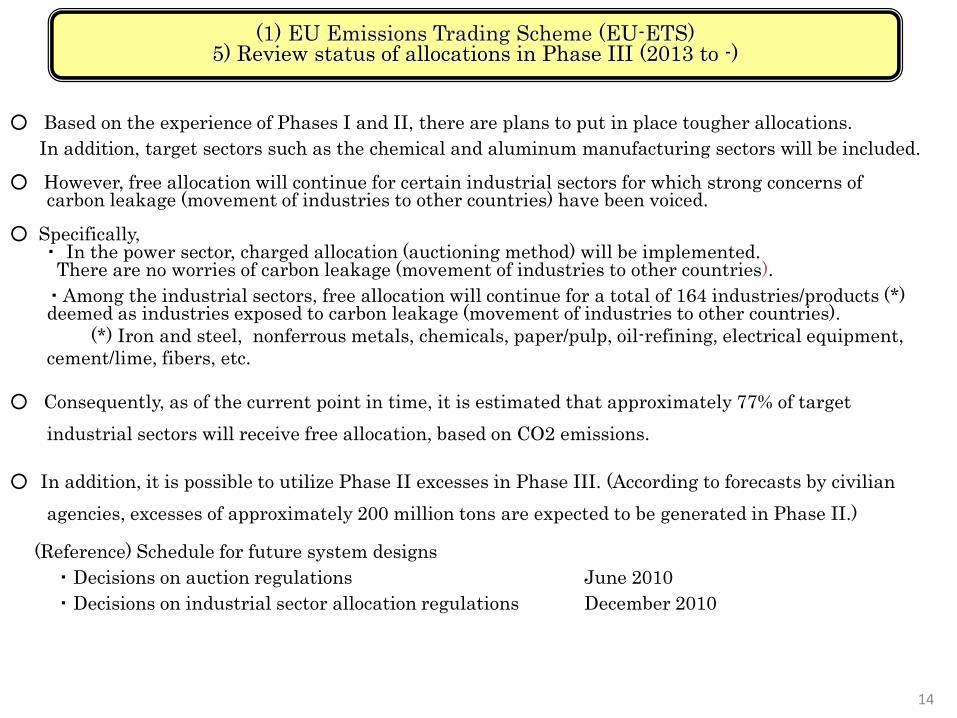
○ Based on the experience of Phases I and II, there are plans to put in place tougher allocations.In addition, target sectors such as the chemical and aluminum manufacturing sectors will be included.
○ However, free allocation will continue for certain industrial sectors for which strong concerns of carbon leakage (movement of industries to other countries) have been voiced.
○ Specifically, ・ In the power sector, charged allocation (auctioning method) will be implemented.
There are no worries of carbon leakage (movement of industries to other countries).・ Among the industrial sectors, free allocation will continue for a total of 164 industries/products (*) deemed as industries exposed to carbon leakage (movement of industries to other countries).
(*) Iron and steel, nonferrous metals, chemicals, paper/pulp, oil-refining, electrical equipment, cement/lime, fibers, etc.
○ Consequently, as of the current point in time, it is estimated that approximately 77% of target industrial sectors will receive free allocation, based on CO2 emissions.
○ In addition, it is possible to utilize Phase II excesses in Phase III. (According to forecasts by civilian agencies, excesses of approximately 200 million tons are expected to be generated in Phase II.)
(Reference) Schedule for future system designs ・ Decisions on auction regulations June 2010・ Decisions on industrial sector allocation regulations December 2010
14
15
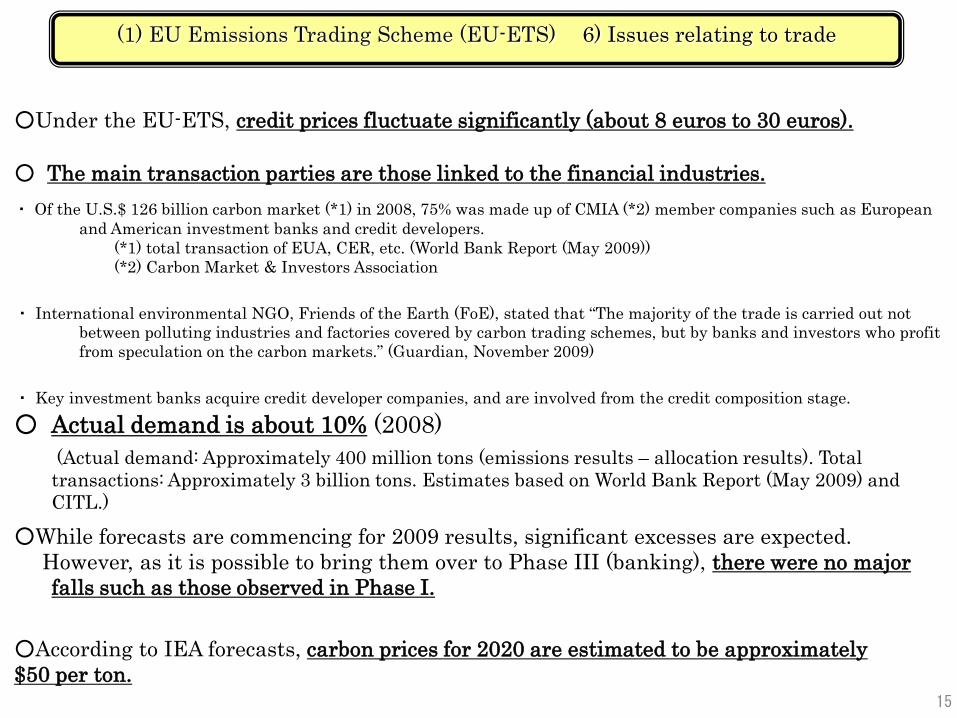
○While forecasts are commencing for 2009 results, significant excesses are expected.However, as it is possible to bring them over to Phase III (banking), there were no major falls such as those observed in Phase I.
・ Of the U.S.$ 126 billion carbon market (*1) in 2008, 75% was made up of CMIA (*2) member companies such as European and American investment banks and credit developers.
(*1) total transaction of EUA, CER, etc. (World Bank Report (May 2009))(*2) Carbon Market & Investors Association
・ International environmental NGO, Friends of the Earth (FoE), stated that “The majority of the trade is carried out not between polluting industries and factories covered by carbon trading schemes, but by banks and investors who profit from speculation on the carbon markets.” (Guardian, November 2009)
・ Key investment banks acquire credit developer companies, and are involved from the credit composition stage.
○ The main transaction parties are those linked to the financial industries.
○ Actual demand is about 10% (2008)(Actual demand: Approximately 400 million tons (emissions results – allocation results). Total transactions: Approximately 3 billion tons. Estimates based on World Bank Report (May 2009) and CITL.)
(1) EU Emissions Trading Scheme (EU-ETS) 6) Issues relating to trade
○Under the EU-ETS, credit prices fluctuate significantly (about 8 euros to 30 euros).
○According to IEA forecasts, carbon prices for 2020 are estimated to be approximately $50 per ton.
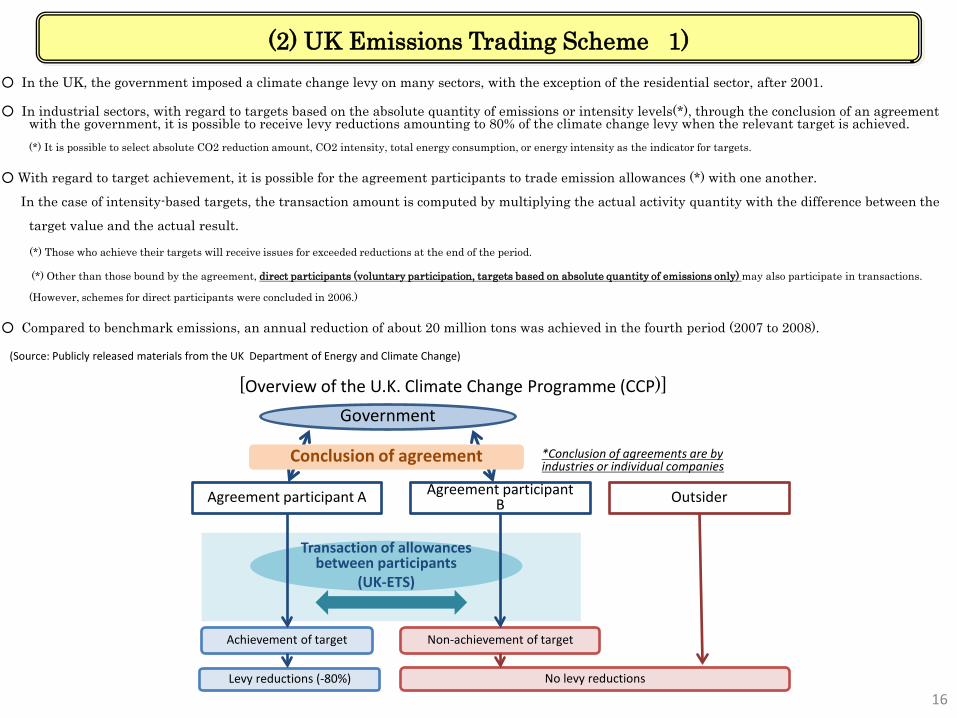
○ In the UK, the government imposed a climate change levy on many sectors, with the exception of the residential sector, after 2001.
○ In industrial sectors, with regard to targets based on the absolute quantity of emissions or intensity levels(*), through the conclusion of an agreement with the government, it is possible to receive levy reductions amounting to 80% of the climate change levy when the relevant target is achieved. (*) It is possible to select absolute CO2 reduction amount, CO2 intensity, total energy consumption, or energy intensity as the indicator for targets.
○ With regard to target achievement, it is possible for the agreement participants to trade emission allowances (*) with one another.
In the case of intensity-based targets, the transaction amount is computed by multiplying the actual activity quantity with the difference between the
target value and the actual result.
(*) Those who achieve their targets will receive issues for exceeded reductions at the end of the period.
(*) Other than those bound by the agreement, direct participants (voluntary participation, targets based on absolute quantity of emissions only) may also participate in transactions.
(However, schemes for direct participants were concluded in 2006.)
○ Compared to benchmark emissions, an annual reduction of about 20 million tons was achieved in the fourth period (2007 to 2008).
[Overview of the U.K. Climate Change Programme (CCP)]
(2) UK Emissions Trading Scheme 1)
Agreement participant A Agreement participant B Outsider
Transaction of allowances between participants
(UK-ETS)
Achievement of target Non-achievement of target
Levy reductions (-80%) No levy reductions
Government
*Conclusion of agreements are by industries or individual companies
Conclusion of agreement
16
(Source: Publicly released materials from the UK Department of Energy and Climate Change)
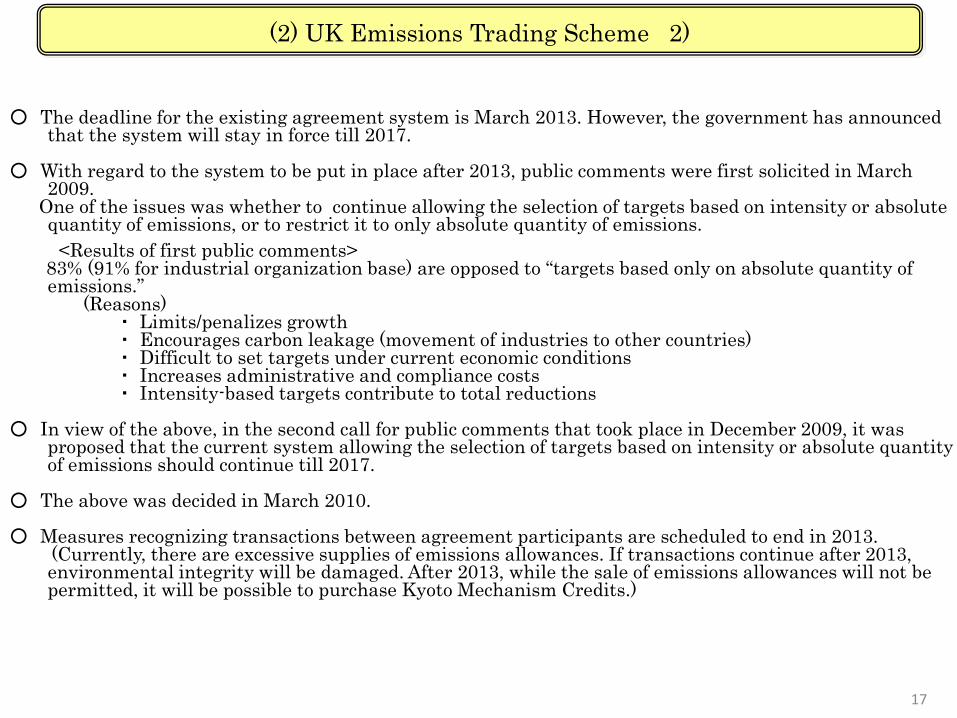
○ The deadline for the existing agreement system is March 2013. However, the government has announced that the system will stay in force till 2017.
○ With regard to the system to be put in place after 2013, public comments were first solicited in March 2009.
One of the issues was whether to continue allowing the selection of targets based on intensity or absolute quantity of emissions, or to restrict it to only absolute quantity of emissions.
<Results of first public comments>83% (91% for industrial organization base) are opposed to “targets based only on absolute quantity of emissions.”
(Reasons)・ Limits/penalizes growth・ Encourages carbon leakage (movement of industries to other countries)・ Difficult to set targets under current economic conditions・ Increases administrative and compliance costs・ Intensity-based targets contribute to total reductions
○ In view of the above, in the second call for public comments that took place in December 2009, it was proposed that the current system allowing the selection of targets based on intensity or absolute quantity of emissions should continue till 2017.
○ The above was decided in March 2010.
○ Measures recognizing transactions between agreement participants are scheduled to end in 2013.(Currently, there are excessive supplies of emissions allowances. If transactions continue after 2013, environmental integrity will be damaged. After 2013, while the sale of emissions allowances will not be permitted, it will be possible to purchase Kyoto Mechanism Credits.)
(2) UK Emissions Trading Scheme 2)
17
(3) Review status for the Emissions Trading Scheme in the U.S.
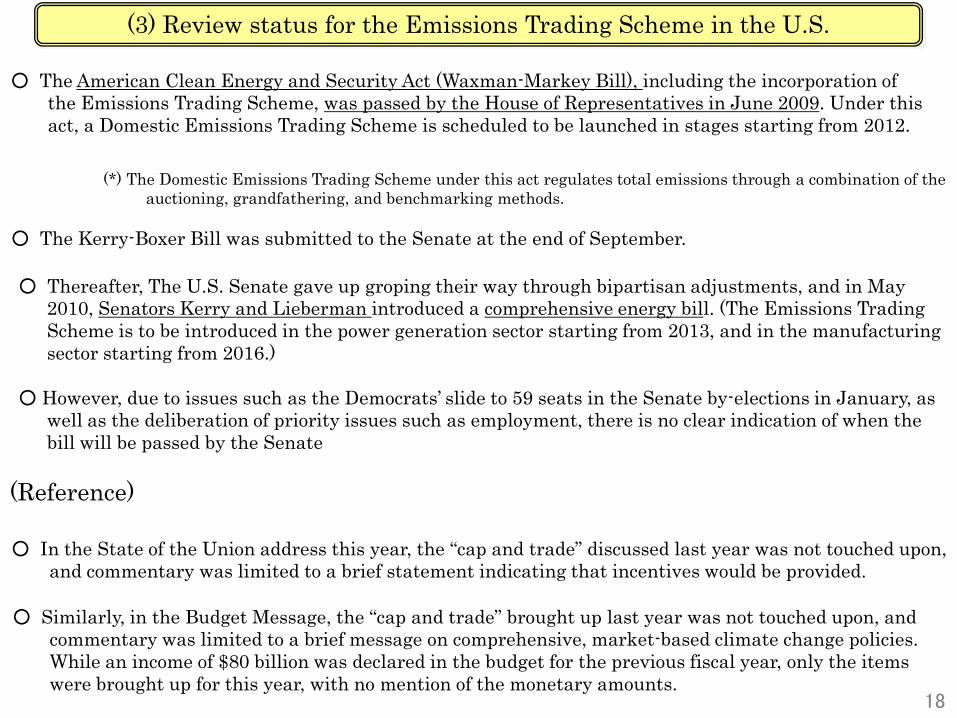
(*) The Domestic Emissions Trading Scheme under this act regulates total emissions through a combination of the auctioning, grandfathering, and benchmarking methods.
○ The American Clean Energy and Security Act (Waxman-Markey Bill), including the incorporation of the Emissions Trading Scheme, was passed by the House of Representatives in June 2009. Under this act, a Domestic Emissions Trading Scheme is scheduled to be launched in stages starting from 2012.
○ Thereafter, The U.S. Senate gave up groping their way through bipartisan adjustments, and in May 2010, Senators Kerry and Lieberman introduced a comprehensive energy bill. (The Emissions Trading Scheme is to be introduced in the power generation sector starting from 2013, and in the manufacturing sector starting from 2016.)
○ However, due to issues such as the Democrats’ slide to 59 seats in the Senate by-elections in January, as well as the deliberation of priority issues such as employment, there is no clear indication of when the bill will be passed by the Senate
18
○ In the State of the Union address this year, the “cap and trade” discussed last year was not touched upon, and commentary was limited to a brief statement indicating that incentives would be provided.
○ Similarly, in the Budget Message, the “cap and trade” brought up last year was not touched upon, and commentary was limited to a brief message on comprehensive, market-based climate change policies. While an income of $80 billion was declared in the budget for the previous fiscal year, only the items were brought up for this year, with no mention of the monetary amounts.
(Reference)
○ The Kerry-Boxer Bill was submitted to the Senate at the end of September.
III. Pilot operation of the Emissions Trading Scheme in a unified domestic market(1) Pilot Emissions Trading Scheme
(2) Domestic Clean Development Mechanism
Pilot operation of the Emissions Trading Scheme in a unified domestic market
Unified domestic market
(1) Pilot Trade Emissions Scheme
Target reduction
Company B
Actual
emissions
Company AA
ctual emissions
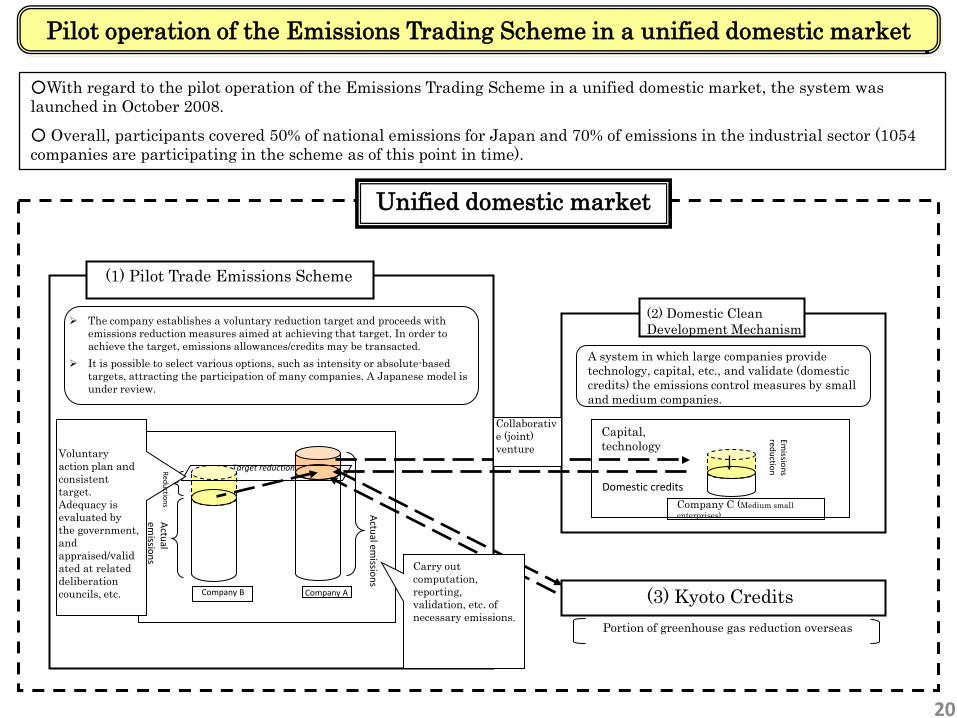
The company establishes a voluntary reduction target and proceeds with emissions reduction measures aimed at achieving that target. In order to achieve the target, emissions allowances/credits may be transacted.
It is possible to select various options, such as intensity or absolute-based targets, attracting the participation of many companies. A Japanese model is under review.
(3) Kyoto CreditsPortion of greenhouse gas reduction overseas
A system in which large companies provide technology, capital, etc., and validate (domestic credits) the emissions control measures by small and medium companies.
(2) Domestic Clean Development Mechanism
Company C (Medium small enterprises)
Capital, technology
Domestic credits
Emissions
reduction
Collaborative (joint) venture
Reductions
Voluntary action plan and consistent target. Adequacy is evaluated by the government, and appraised/validated at related deliberation councils, etc.
Carry out computation, reporting, validation, etc. of necessary emissions.
○With regard to the pilot operation of the Emissions Trading Scheme in a unified domestic market, the system was launched in October 2008.
○ Overall, participants covered 50% of national emissions for Japan and 70% of emissions in the industrial sector (1054 companies are participating in the scheme as of this point in time).
20
(1) Pilot Emissions Trading Scheme 1) Overview
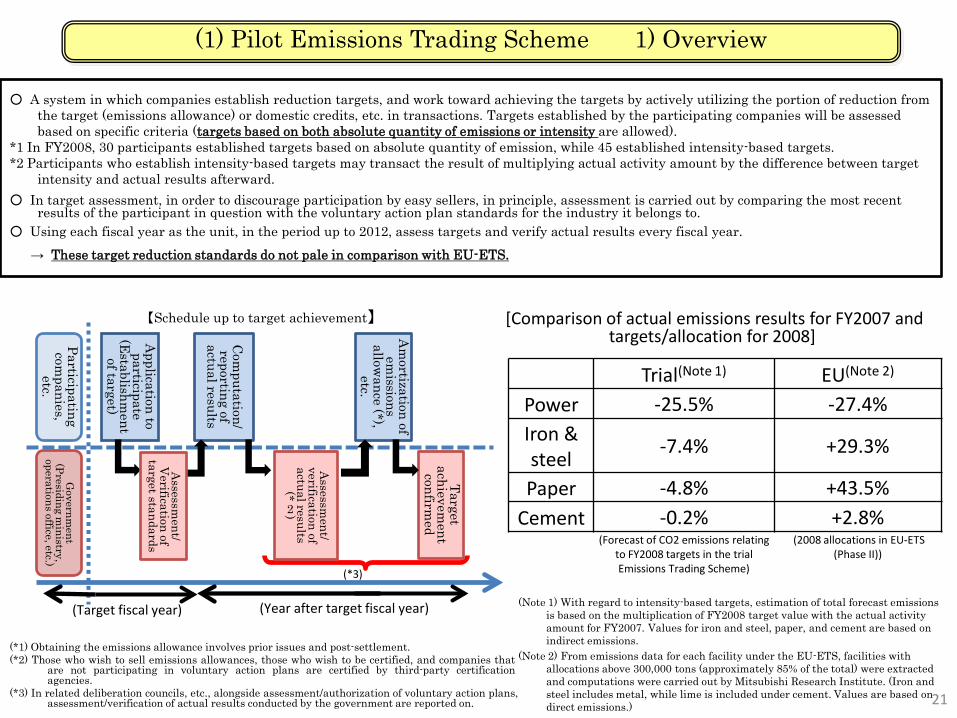
○ A system in which companies establish reduction targets, and work toward achieving the targets by actively utilizing the portion of reduction from the target (emissions allowance) or domestic credits, etc. in transactions. Targets established by the participating companies will be assessed based on specific criteria (targets based on both absolute quantity of emissions or intensity are allowed).
*1 In FY2008, 30 participants established targets based on absolute quantity of emission, while 45 established intensity-based targets.*2 Participants who establish intensity-based targets may transact the result of multiplying actual activity amount by the difference between target
intensity and actual results afterward.○ In target assessment, in order to discourage participation by easy sellers, in principle, assessment is carried out by comparing the most recent
results of the participant in question with the voluntary action plan standards for the industry it belongs to. ○ Using each fiscal year as the unit, in the period up to 2012, assess targets and verify actual results every fiscal year.
→ These target reduction standards do not pale in comparison with EU-ETS.
(*1) Obtaining the emissions allowance involves prior issues and post-settlement.(*2) Those who wish to sell emissions allowances, those who wish to be certified, and companies that
are not participating in voluntary action plans are certified by third-party certificationagencies.
(*3) In related deliberation councils, etc., alongside assessment/authorization of voluntary action plans,assessment/verification of actual results conducted by the government are reported on.
【Schedule up to target achievement】
Participating com
panies, etc.
Governm
ent(Presiding m
inistry, operations office, etc.)
Application to participate
(Establishm
ent of target)
Com
putation/ reporting of
actual results
Am
ortization of em
issions allow
ance (*), etc.
Target achievem
ent confirm
ed
Assessment/
verification of actual results
(*
2)
Assessment/
Verification of target standards
(*3)
(Target fiscal year) (Year after target fiscal year)
Trial(Note 1) EU(Note 2)
Power -25.5% -27.4%Iron & steel
-7.4% +29.3%
Paper -4.8% +43.5%Cement -0.2% +2.8%
(Forecast of CO2 emissions relating to FY2008 targets in the trial Emissions Trading Scheme)
(2008 allocations in EU-ETS (Phase II))
[Comparison of actual emissions results for FY2007 and targets/allocation for 2008]
(Note 1) With regard to intensity-based targets, estimation of total forecast emissions is based on the multiplication of FY2008 target value with the actual activity amount for FY2007. Values for iron and steel, paper, and cement are based on indirect emissions.
(Note 2) From emissions data for each facility under the EU-ETS, facilities with allocations above 300,000 tons (approximately 85% of the total) were extracted and computations were carried out by Mitsubishi Research Institute. (Iron and steel includes metal, while lime is included under cement. Values are based on direct emissions.) 21
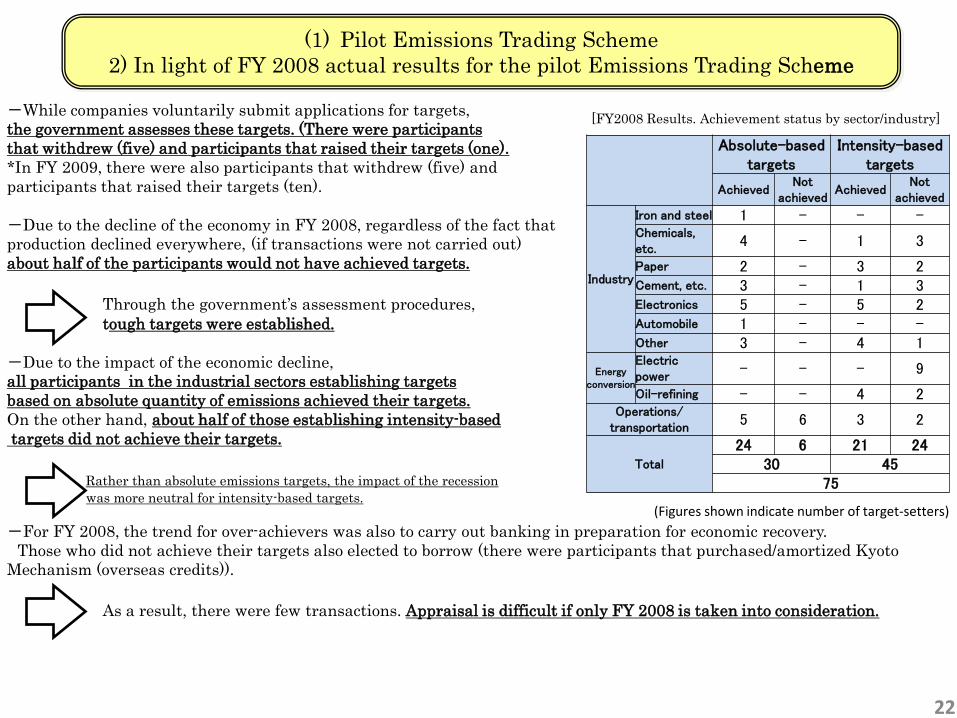
Absolute-based targets
Intensity-based targets
AchievedNot
achievedAchieved
Not achieved
Industry
Iron and steel 1 - - -Chemicals, etc.
4 - 1 3
Paper 2 - 3 2Cement, etc. 3 - 1 3Electronics 5 - 5 2Automobile 1 - - -Other 3 - 4 1
Energy conversion
Electric power
- - - 9
Oil-refining - - 4 2Operations/
transportation5 6 3 2
Total
24 6 21 2430 45
75
[FY2008 Results. Achievement status by sector/industry]
(1) Pilot Emissions Trading Scheme2) In light of FY 2008 actual results for the pilot Emissions Trading Scheme
(Figures shown indicate number of target-setters)
22
-While companies voluntarily submit applications for targets, the government assesses these targets. (There were participants that withdrew (five) and participants that raised their targets (one).*In FY 2009, there were also participants that withdrew (five) and participants that raised their targets (ten).
-Due to the decline of the economy in FY 2008, regardless of the fact that production declined everywhere, (if transactions were not carried out) about half of the participants would not have achieved targets.
Through the government’s assessment procedures,tough targets were established.
-Due to the impact of the economic decline,all participants in the industrial sectors establishing targets based on absolute quantity of emissions achieved their targets.On the other hand, about half of those establishing intensity-basedtargets did not achieve their targets.
Rather than absolute emissions targets, the impact of the recession was more neutral for intensity-based targets.
-For FY 2008, the trend for over-achievers was also to carry out banking in preparation for economic recovery. Those who did not achieve their targets also elected to borrow (there were participants that purchased/amortized Kyoto
Mechanism (overseas credits)).
As a result, there were few transactions. Appraisal is difficult if only FY 2008 is taken into consideration.
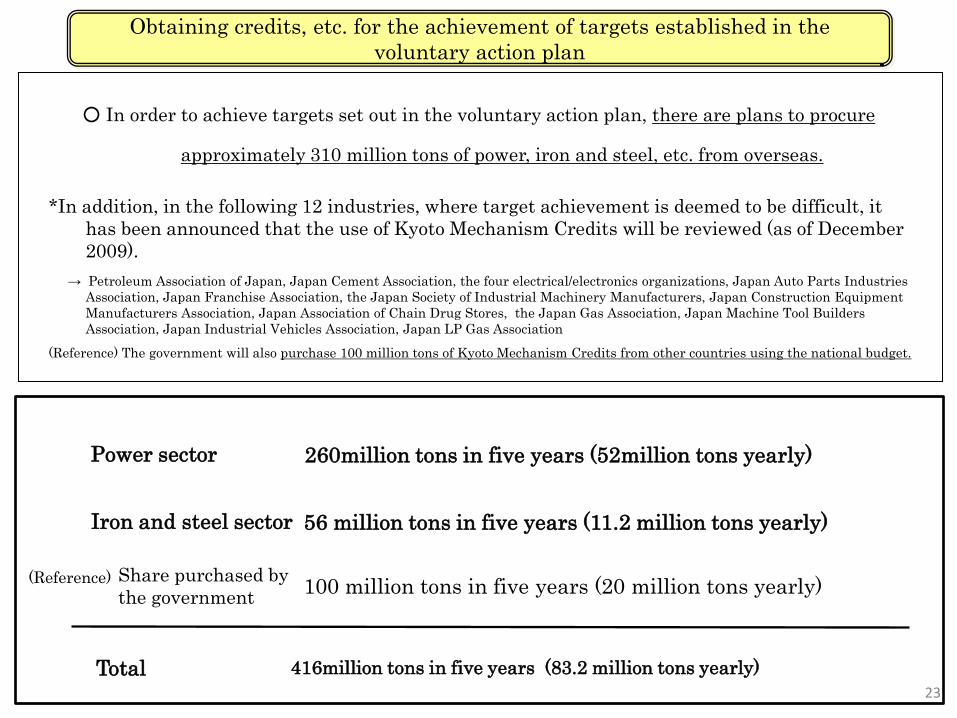
○ In order to achieve targets set out in the voluntary action plan, there are plans to procure
approximately 310 million tons of power, iron and steel, etc. from overseas.
Obtaining credits, etc. for the achievement of targets established in the voluntary action plan
Share purchased by the government 100 million tons in five years (20 million tons yearly)
Power sector 260million tons in five years (52million tons yearly)
Iron and steel sector 56 million tons in five years (11.2 million tons yearly)
Total 416million tons in five years (83.2 million tons yearly)
*In addition, in the following 12 industries, where target achievement is deemed to be difficult, it has been announced that the use of Kyoto Mechanism Credits will be reviewed (as of December 2009).
→ Petroleum Association of Japan, Japan Cement Association, the four electrical/electronics organizations, Japan Auto Parts Industries Association, Japan Franchise Association, the Japan Society of Industrial Machinery Manufacturers, Japan Construction Equipment Manufacturers Association, Japan Association of Chain Drug Stores, the Japan Gas Association, Japan Machine Tool Builders Association, Japan Industrial Vehicles Association, Japan LP Gas Association
(Reference) The government will also purchase 100 million tons of Kyoto Mechanism Credits from other countries using the national budget.
(Reference)
23
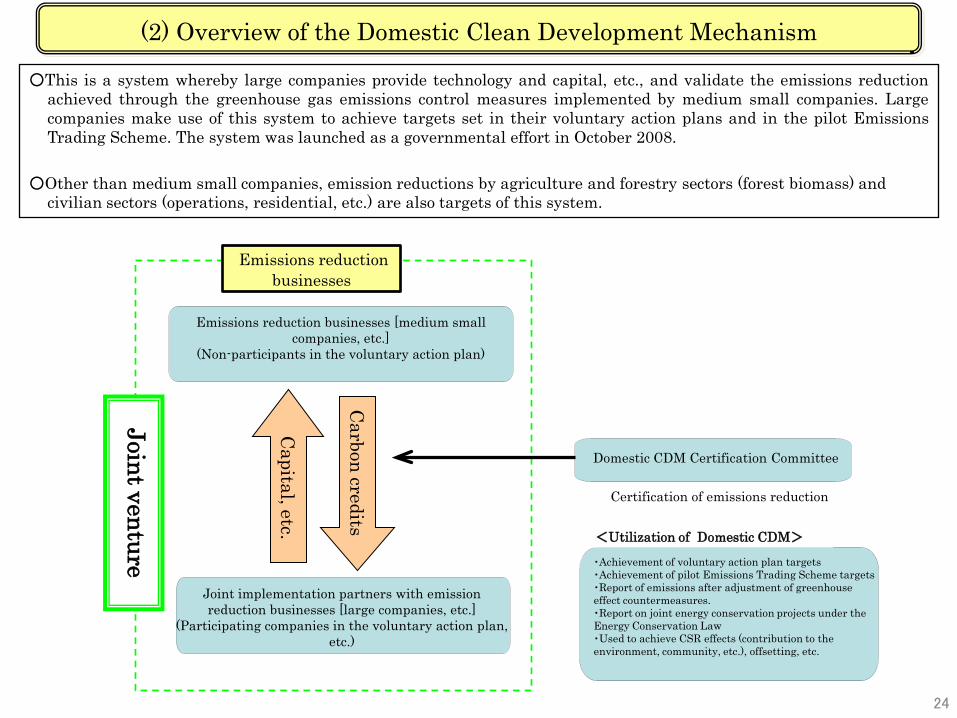
○This is a system whereby large companies provide technology and capital, etc., and validate the emissions reductionachieved through the greenhouse gas emissions control measures implemented by medium small companies. Largecompanies make use of this system to achieve targets set in their voluntary action plans and in the pilot EmissionsTrading Scheme. The system was launched as a governmental effort in October 2008.
○Other than medium small companies, emission reductions by agriculture and forestry sectors (forest biomass) and civilian sectors (operations, residential, etc.) are also targets of this system.
(2) Overview of the Domestic Clean Development Mechanism
自主行動計画の
Emissions reduction businesses [medium small companies, etc.]
(Non-participants in the voluntary action plan)
Domestic CDM Certification Committee
Carbon credits
Capital, etc.
Joint venture
Certification of emissions reduction
Joint implementation partners with emission reduction businesses [large companies, etc.]
(Participating companies in the voluntary action plan, etc.)
Emissions reduction businesses
24
・Achievement of voluntary action plan targets・Achievement of pilot Emissions Trading Scheme targets・Report of emissions after adjustment of greenhouse effect countermeasures.・Report on joint energy conservation projects under the Energy Conservation Law・Used to achieve CSR effects (contribution to the environment, community, etc.), offsetting, etc.
<Utilization of Domestic CDM>

(2) Domestic Clean Development Mechanism Status of business applications and authorization, etc.
(Reference) Procedures for the Domestic Credit SchemeProposed plans/certification relating to emission reduction businesses,changes in the accumulated total of Domestic Credit Certifications
Other than medium small companies, business plans are also widely accepted from farms, families, hospitals, schools, local governments, etc.
As of the current point in time, the domestic credits that have been certified are at an accumulated total of 146 cases, approximately 80,000 tons – CO2.
25
The number of emission reduction business plans is at an accumulated total of 518 cases (of which seven are program-style plans). Projected yearly reductions are approximately 260,000 tons – CO2.Total emissions reduction projected up to the end of FY2012 are approximately 1,080,000 tons – CO2. Capital investment is estimated to be about 33 billion yen.
累計:449件
累計:346件
累計:138件
事業者国内クレジット認証委員会
事業計画案の作成・提出
審査機関等による審査・事業計画承認申請
事業計画の承認
審査機関等による実績確認・国内クレジット認証申請
国内クレジットの認証
国内クレジットの償却
Business operator Domestic CDM
Certification Committee
Drafting/submitting business plan
Accumulated total: 518 cases
Accumulated total: 378cases
Business plan authorization
Accumulated total: 146cases
Carbon credit certification
Assessment by assessment agencies, etc.Application for business plan authorization
Verification of actual results by assessment agencies, etc.Application for domestic credit certification
Amortization of domestic credits
5 12 23
100118 125 125
147
248
332
398 403 414449
518
10 1937 52 56
75
129
200
297318
334 346378
3 8 8 11 13 26
92108 123 138 146
0
100
200
300
400
500
600
計画受付
事業承認
クレジット認証
Acceptance of business plan
Authorization of business plan
Certification of carbon credit
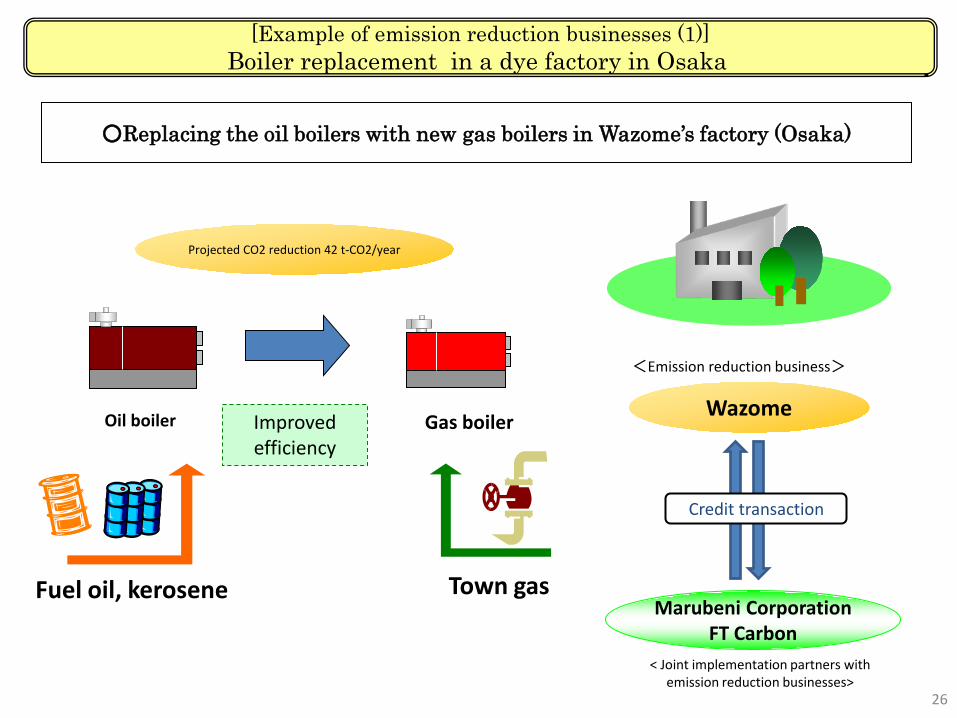
[Example of emission reduction businesses (1)]Boiler replacement in a dye factory in Osaka
○Replacing the oil boilers with new gas boilers in Wazome’s factory (Osaka)
Oil boiler Gas boiler
Fuel oil, kerosene Town gas
Improved efficiency
Projected CO2 reduction 42 t-CO2/year
Wazome
Marubeni CorporationFT Carbon
<Emission reduction business>
< Joint implementation partners with emission reduction businesses>
Credit transaction
26
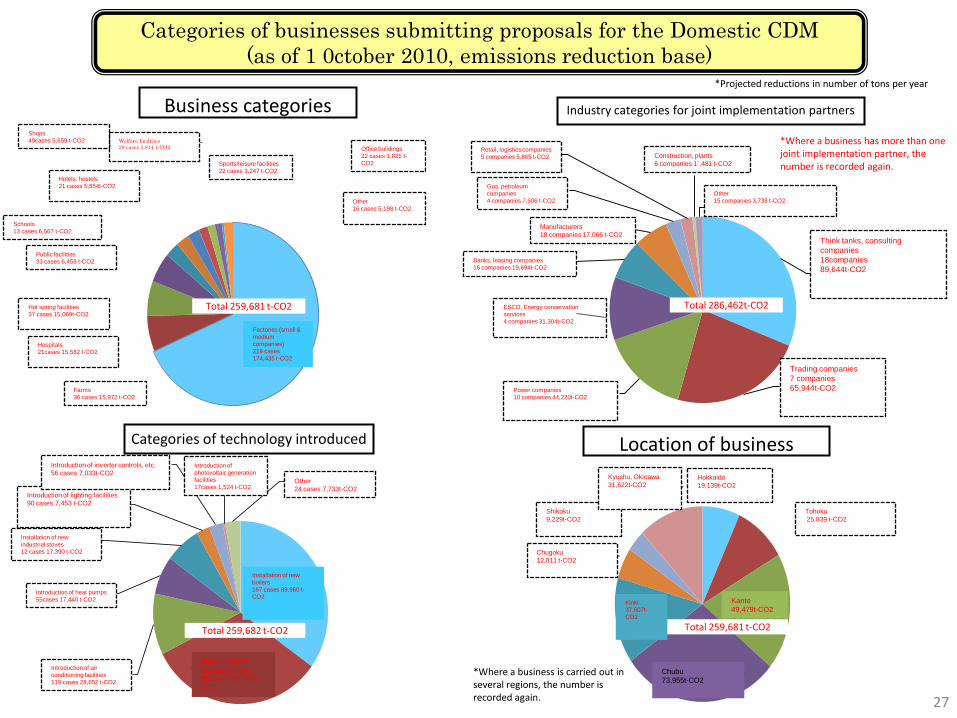
Business categories
Categories of businesses submitting proposals for the Domestic CDM(as of 1 0ctober 2010, emissions reduction base)
Industry categories for joint implementation partners
Location of businessCategories of technology introduced
*Projected reductions in number of tons per year
工場(中小企業)
201件 168,386 t-CO2
農場34件 15,455 t-CO2
病院19件 15,221 t-CO2
温泉施設29件 12,969 t-CO2
公共施設32件 6,586 t-CO2
学校 11件 6,018 t-CO2
ホテル・旅館18件5,541 t-CO2
店舗33件 4,198 t-CO2 福祉施設25件 3,521 t-CO2
スポーツ・レジャー施
設20件 3,109 t-CO2
事務所ビル16件950 t-CO2
その他 11件 4,357 t-CO2
*Where a business has more than one joint implementation partner, the number is recorded again.
ボイラー更新152件86,117 t-CO2
バイオマスボイラー
導入88件 80,237 t-CO2
空調設備導入106件 26,599 t-CO2
ヒートポンプ導入49件 16,599 t-CO2
工業炉更新10件16,249 t-CO2
インバーター制御等
導入46件 6,131 t-CO2
照明設備導入70件6,181 t-CO2
太陽光発電設備導
入13件 1,077 t-CO2 その他19件 7,122 t-CO2
Total 259,681 t-CO2Total 286,462t-CO2
Total 259,682 t-CO2
北海道46件17,022 t-CO2
東北41件 23,966 t-CO2
関東95件47,675 t-CO2
中部98件 71,887 t-CO2
近畿55件34,796 t-
CO2
中国36件 12,657 t-CO2
四国25件8,630 t-CO2
九州・沖縄54件29,678 t-CO2
*Where a business is carried out in several regions, the number is recorded again. 27
Sports/leisure facilities 22 cases 3,247 t-CO2
Welfare facilities 29 cases 3,814 t-CO2
Shops49cases 5,659 t-CO2
Hotels, hostels21 cases 5,854t-CO2
Schools13 cases 6,567 t-CO2
Public facilities33 cases 6,459 t-CO2
Hot spring facilities37 cases 15,069t-CO2
Hospitals21cases 15,582 t-CO2
Farms36 cases 15,972 t-CO2
Other16 cases 5,198 t-CO2
Factories (small & medium companies)219 cases 174,435 t-CO2
Other24 cases 7,733t-CO2
Introduction of photovoltaic generation facilities 17cases 1,524 t-CO2
Introduction of lighting facilities90 cases 7,453 t-CO2
Introduction of inverter controls, etc.56 cases 7,033t-CO2
Installation of new industrial stoves12 cases 17,390 t-CO2
Introduction of heat pumps55cases 17,440 t-CO2
Introduction of air conditioning facilities119 cases 28,652 t-CO2
Installation of new boilers167 cases 89,960 t-CO2
Introduction of biomass boilers95 cases 82,498 t-CO2
Gas, petroleum companies4 companies 7,506 t-CO2
Manufacturers18 companies 17,066 t-CO2
Banks, leasing companies16 companies 19,694t-CO2
Offset providers4 companies 28,568 t-CO2
ESCO, Energy conservation services4 companies 31,304t-CO2
Retail, logistics companies5 companies 5,865 t-CO2
Construction, plants6 companies 1`,481 t-CO2
Other15 companies 3,738 t-CO2
Trading companies7 companies 65,944t-CO2
Power companies10 companies 44,220t-CO2
Think tanks, consulting companies18companies 89,644t-CO2
Hokkaido19,139t-CO2
Shikoku9,229t-CO2
Chugoku12,811 t-CO2
Tohoku 25,839 t-CO2
Kinki37,607t-CO2
Chubu73,955t-CO2
Kanto49,479t-CO2
Office buildings22 cases 1,825 t-CO2
シンクタンク・コンサル
ティング会社
・オフセットプロバイダー
18社 89,644 t-CO2
商社7社 65,944 t-CO2電力会社10社44,220 t-CO2
ESCO・省エネサービス
事業者4社 31,304 t-CO2
銀行・リース16社19,694 t-CO2
メーカー18社17,066 t-CO2
ガス・石油会社4社7,506 t-CO2
小売・流通業者5社5,865 t-CO2
建設・プラント6社1,481 t-CO2
その他15社 3,738 t-CO2
*Where a business has more than one joint implementation partner, the number is recorded again.
Total 286,462t-CO2
Gas, petroleum companies4 companies 7,506 t-CO2
Manufacturers18 companies 17,066 t-CO2
Banks, leasing companies16 companies 19,694t-CO2
ESCO, Energy conservation services4 companies 31,304t-CO2
Retail, logistics companies5 companies 5,865 t-CO2 Construction, plants
6 companies 1`,481 t-CO2
Other15 companies 3,738 t-CO2
Trading companies7 companies 65,944t-CO2Power companies
10 companies 44,220t-CO2
Think tanks, consulting companies18companies 89,644t-CO2
Total 259,681 t-CO2
Kyushu, Okinawa31,622t-CO2