Embed Size (px)
Citation preview

EMISSION FACTORS FOR SLCP EMISSIONS FROM RESIDENTIAL WOOD COMBUSTION IN THE NORDIC COUNTRIES
Improved emission inventories of Short Lived Climate Pollutants (SLCP)


Emission factors for SLCP emissions from residential wood combustion in the Nordic countries
Improved emission inventories of Short Lived Climate Pollu-tants (SLCP)
Karin Kindbom, Ingrid Mawdsley, Ole-Kenneth Nielsen, Kristina Saarinen, Kári Jónsson and Kristin Aasestad
TemaNord 2017:570
IVL-rapport: C292

Emission factors for SLCP emissions from residential wood combustion in the Nordic countries Improved emission inventories of Short Lived Climate Pollutants (SLCP) Karin Kindbom, Ingrid Mawdsley, Ole-Kenneth Nielsen, Kristina Saarinen, Kári Jónsson and Kristin Aasestad
ISBN 978-92-893-5283-3 (PRINT) ISBN 978-92-893-5284-0 (PDF) ISBN 978-92-893-5285-7 (EPUB) http://dx.doi.org/10.6027/TN2017-570
TemaNord 2017:570 ISSN 0908-6692
Standard: PDF/UA-1 ISO 14289-1
The report has number C292 in the report series of IVL Swedish Environmental Research Institute
© Nordic Council of Ministers 2018 Cover photo: unsplash.com
Print: Rosendahls Printed in Denmark
Disclaimer This publication was funded by the Nordic Council of Ministers. However, the content does not necessarily reflect the Nordic Council of Ministers’ views, opinions, attitudes or recommendations.
Rights and permissions
This work is made available under the Creative Commons Attribution 4.0 International license (CC BY 4.0) https://creativecommons.org/licenses/by/4.0
Translations: If you translate this work, please include the following disclaimer: This translation was not pro-duced by the Nordic Council of Ministers and should not be construed as official. The Nordic Council of Ministers cannot be held responsible for the translation or any errors in it.
Adaptations: If you adapt this work, please include the following disclaimer along with the attribution: This is an adaptation of an original work by the Nordic Council of Ministers. Responsibility for the views and opinions expressed in the adaptation rests solely with its author(s). The views and opinions in this adaptation have not been approved by the Nordic Council of Ministers.

Third-party content: The Nordic Council of Ministers does not necessarily own every single part of this work. The Nordic Council of Ministers cannot, therefore, guarantee that the reuse of third-party content does not in-fringe the copyright of the third party. If you wish to reuse any third-party content, you bear the risks associ-ated with any such rights violations. You are responsible for determining whether there is a need to obtain per-mission for the use of third-party content, and if so, for obtaining the relevant permission from the copyright holder. Examples of third-party content may include, but are not limited to, tables, figures or images.
Photo rights (further permission required for reuse): Any queries regarding rights and licences should be addressed to:
Nordic Council of Ministers/Publication Unit Ved Stranden 18 DK-1061 Copenhagen K Denmark Phone +45 3396 0200 [email protected]
Nordic co-operation Nordic co-operation is one of the world’s most extensive forms of regional collaboration, involving Denmark, Finland, Iceland, Norway, Sweden, and the Faroe Islands, Greenland and Åland.
Nordic co-operation has firm traditions in politics, economics and culture and plays an important role in European and international forums. The Nordic community strives for a strong Nordic Region in a strong Europe.
Nordic co-operation promotes regional interests and values in a global world. The values shared by the Nordic countries help make the region one of the most innovative and competitive in the world.
The Nordic Council of Ministers Nordens Hus Ved Stranden 18 DK-1061 Copenhagen K, Denmark Tel.: +45 3396 0200 www.norden.org
Download Nordic publications at www.norden.org/nordpub


Contents
Preface ...................................................................................................................................... 7
Summary ................................................................................................................................. 9
1. Background ....................................................................................................................... 11
2. Measurements................................................................................................................... 132.1 Test methods, sampling and analysis ...................................................................... 132.2 Test cycles and sampling periods ............................................................................142.3 Test program .......................................................................................................... 15
3. Measurement results ......................................................................................................... 213.1 Measurement results for boilers .............................................................................. 213.2 Measurement results for stoves.............................................................................. 253.3 Impact of measurement standard, stoves ................................................................303.4 Impact of ignition, boilers and stoves ......................................................................323.5 Impact of operation: loading small fuel batches at part load firing,
boilers and stoves ................................................................................................... 353.6 EC and OC as fraction of PM2.5 ................................................................................ 373.7 Uncertainties ......................................................................................................... 39
4. Emission measurement results by technology group ..........................................................434.1 Grouping of technologies ........................................................................................434.2 Technology groups, boilers .................................................................................... 444.3 Measurement results by boiler technology group ................................................... 454.4 Technology groups, stoves ..................................................................................... 494.5 Measurement results by stove technology group .................................................... 504.6 How to take the ignition phase into consideration ................................................... 53
5. Emission factors ................................................................................................................ 555.1 Emission factors and ratios for bad combustion conditions ...................................... 555.2 How to take bad combustion conditions into consideration in the emission factors 585.3 Comparison with literature and current national emission factors ........................... 605.4 Factors affecting combustion conditions ................................................................ 65
Conclusions ............................................................................................................................. 67
References ............................................................................................................................. 69
Sammanfattning ..................................................................................................................... 71
Annex ...................................................................................................................................... 73Factors affecting combustion conditions ............................................................................ 73


Preface
This project, Improved Nordic emission inventories of Short-Lived Climate Pollutants - SLCP, was proposed by the Swedish presidency of the Nordic Council of Ministers in 2013 and was approved in June 2013. It is planned for a four year period and all five Nordic countries participate and contribute actively in the work. The project is financed by the Nordic Council of Ministers.
The overall objective of the project is to improve the Nordic emission inventories of Short Lived Climate Pollutants (SLCP). This is in line with the Svalbard Declaration on Short-lived Climate Forcers1 from 2012, where the the Nordic environment ministers, among other things, declared that they will actively strive to:
act as a driving force and work more closely together in international fora toadvocate more ambitious international regulation of emissions of greenhousegases and SLCFs
develop national measures to reduce emissions from transport and from theinefficient use of woodburning as a source of heating, which will also have positiveregional effects on health and the climate
further develop and strengthen national emissions accounts for SLCFs, alongsideseparate accounts for black carbon.
The first phase of the project presented an analysis of the status of knowledge (TN2015:523). This report presents the results from the second phase of the project, the implementation of an emission measurement program, where the objective is to expand the knowledge and develop well documented emission factors for SLCP and PM2.5 from residential wood combustion.
1 http://www.norden.org/en/nordic-council-of-ministers/council-of-ministers/the-nordic-council-of-ministers-for-the-environment-mr-m/declarations-and-statements/svalbard-declaration-on-short-lived-climate-forcers-27.03.-2012

8 Emission factors for SLCP emissions from residential wood combustion
The work has been excellently guided by a project steering group with participants from the Nordic countries as well as from the Nordic Council of Ministers.
Göteborg, 14 November 2017
Karin Kindbom, Ingrid Mawdsley, IVL Swedish Environmental Research Institute,Sweden
Ole-Kenneth Nielsen, Morten Winther, DMU, Denmark
Kristina Saarinen, SYKE, Finland
Kári Jónsson, Umhverfisstofnun, Iceland
Kristin Aasestad, SSB, Norway

Summary
The overall objective of this project is to improve the Nordic air emission inventories of Short Lived Climate Pollutants (SLCP). As a first step a Background analysis was performed (Kindbom et al., 2015). That report assesses and summarises current Nordic knowledge, emission inventories and emission levels, and lays the basis for the emission measurement program which was performed in this second phase of the project.
In order to improve the national emission inventories of SLCP, and reduce uncertainties, a better understanding of the emission factors for residential wood combustion is essential. Apart from emission factors, also national activity data on wood combustion technologies, fuel consumption and combustion conditions are important.
This project contributes to a better knowledge base for emission factors for PM2.5, EC, OC, CH4, NMVOC and CO from residential wood combustion, as well as ratios for increased emissions at “bad combustion conditions” which can be weighted into the national emission factors, depending on national circumstances.
Emission measurements were conducted on residential wood burning appliances, boilers and stoves, representative for the Nordic countries. There are substantial differences in the stock of residential wood burning technologies between the five Nordic countries, but the common technologies in all countries were covered.
Measurements were made using EN standards for boilers and for stoves, and also the Norwegian standard for stoves. Sampling for PM2.5, EC and OC were in all cases done in a dilution tunnel (i.e. sample including condensables) and not in hot flue gases.
The technologies tested were grouped according to similarities in technology and emission levels when developing the emission factors. In a national emission inventory, lack of very detailed activity data on technologies is the common situation, why the emission factor results were adapted accordingly.
Generally the older technologies exhibited higher emission levels than more modern types of equipment. For example, the traditional log wood boilers had emission levels that were in the order of 5–10 times higher (depending on pollutant) than for the modern log wood boilers or pellet boilers. Among the stoves the difference was not as large, with up to 2 times higher emission levels from the traditional tiled and masonry stoves, and an older type iron stove, compared to the modern wood stoves.
Several test conditions in addition to those prescribed by the EN standards were investigated. This was done in order to capture some of the variation in emission levels arising from various user practices impacting the quality of combustion and resulting emission levels. The standard conditions, nominal heat load and standard fuel moisture, were thus extended to include tests using moist fuel or part heat load conditions on most of the tested appliances. A few tests were also made with drier fuel, higher heat loads, or entering smaller batches of wood than prescribed in the standards.

10 Emission factors for SLCP emissions from residential wood combustion
Part load combustion conditions in the boilers increased the emissions between 2–6 times, while moist fuel generally increased the emission levels by a factor of 1.5–2. The modern stoves were sensitive to moist fuel, where emissions of for example PM2.5 and OC increased in the order of 5–8 times compared to when fired with standard fuel. The older technologies, tiled and masonry stoves, were on the other hand hardly affected by moist fuel, and the emission levels were comparable to the standard fuel test cases. The higher impact from moist fuel in the modern stoves is likely due to limited capacity of the air systems in many modern stoves. For the stoves, part load conditions generally increased the emission levels by 1.5–3.5 times.
To improve the national emission inventories of SLCPs the large sensitivity to operational conditions (moist fuel and part load) needs to be taken into consideration in national emission inventories, where “real life” emissions are estimated. Country-specific assessments on shares of “bad combustion conditions” are essential to properly weigh bad combustion into the national emission factors.
It was found that the EC emission factors did not correlate with the PM2.5 emission factors, and that the EC emissions were less affected by moist fuel and part load conditions than most of the other pollutants. In many cases in the literature, EC emission factors are given as percentage of PM2.5, which according to the results in this project does not necessarily reflect reality very well.
When comparing currently used national emission factors in the Nordic countries with those developed from the measurement program in this project, it is obvious that there are sometimes large differences, both between countries and in relation to the measurement results. There are examples of individual national emission factors that are both considerably higher, or considerably lower, than the measurement results.
The comparison highlights discrepancies in the emission factors between the Nordic countries. One of the reasons for differences between current national factors is that they are based on measurement results derived using different measurement standards (e.g. hot flue gases/diluted sampling, or EN standards/Norwegian standard). In order for national emission inventory results to be comparable, a harmonisation of emission factor levels is needed, unless there are real differences between the countries. The results from this project provides a foundation for developing emission inventories that are more comparable between the Nordic countries.
The measurement results and the emission factors developed in this work increases the knowledge base for estimating emissions of SLCPs (and PM2.5) with less uncertainties in the future. However, the measurement program also showed that there can be quite a large variabilty when repeating identical test cases, why additional well designed measurements would add information that can be used for refining the emission factors to reflect reality with higher certainty.

1. Background
The overall objective of the current project is to improve the Nordic emission inventories of Short Lived Climate Pollutants (SLCP). As a first step a Background analysis was performed (Kindbom et al., 2015). That report assesses and summarises current Nordic knowledge, emission inventories and emission levels, and lays the basis for the emission measurement program which was performed in this second phase of the project.
As described in the Background analysis (Kindbom et al., 2015), residential biomass combustion is identified as a major emission source for SLCPs in the Nordic countries.2 It was concluded that emission inventories currently reported are not comparable between the countries. This applies especially to particulate matter (PM2.5, BC) where different measurement standards are used for the emission measurements to derive national emission factors. Furthermore, it was concluded that there are differences between the Nordic countries in the stock of technologies and in the user practices for residential biomass combustion. Currently used emission factors for BC include rather high uncertainties since they are based on comparatively few measurements, which imply that the reported emission inventories include large uncertainties.
SLCP is the acronyme for Short Lived Climate Pollutants, which is a group of substances comprising black carbon (BC) or soot, tropospheric ozone (O3), methane (CH4), and hydrofluorocarbons. O3 is formed in atmospheric chemical reactions involving CH4, nitrogen oxides (NOx), carbon monoxide (CO), non-methane volatile organic compounds (NMVOC) and sunlight. The SLCPs have, in comparison to the long lived greenhouse gases e.g. carbon dioxide (CO2) and nitrous oxide (N2O), a short residence time in the atmosphere.
Elemental Carbon (EC) is often used interchangeably with Black Carbon (BC) in development of emission factors. EC and BC are defined by their method of analysis, where EC is analysed thermally, while BC is analysed optically. Theoretically EC comprises only carbon, while BC can also include other dark and optically detectable compounds. In practice, when used in national emission inventories with their general level of uncertainties, these differences can most likely be disregarded. In the measurement program presented in this report EC was analysed and reported. Another component of particulate matter, Organic Carbon (OC) was also analysed. OC is considered to have a cooling impact on the climate.
2 In Iceland, emissions from residential biomass combustion have not been estimated as of today. In contrast to other Nordic countries, the great majority of residences uses either (geothermal) district- or electric heating, suggesting a much lower impact of residential combustion of biomass on total national SLCP emissions than in the other Nordic countries. In addition, the small population of Iceland compared to other Nordic countries suggests, overall, a very small impact of the Icelandic residential combustion of biomass on total Nordic SLCP emissions.

12 Emission factors for SLCP emissions from residential wood combustion
Both Elemental Carbon (EC) and Organic Carbon (OC) are thus components in the particulate matter fraction, which is smaller than 2.5 µm in diameter (PM2.5). The accuracy of PM2.5 emission inventories is regarded as key for estimating emissions of BC/EC and OC. Therefore PM2.5 emissions were also analysed in this project.
For residential wood combustion in general, information on emission factors for BC is internationally scarce, with some exceptions (e.g. recent results from measurements on Norwegian stoves, under Norwegian conditions, and some measurements in Finland). In the Finnish and Norwegian emission inventories national emission factors for BC are used where available, while the Danish and Swedish BC emission inventories, at present, rely on information on BC as a fraction of emitted PM2.5 from the EMEP/EEA Air Pollutant Emission Inventory Guidebook (EMEP/EEA, 2016). In this report, a comparison is made between the information presented in the Guidebook and the results from measurements carried out as part of this project.
Presently there is no defined measurement standard prescribed as a basis for PM2.5 emission factor development within the CLRTAP convention (or EU). It is stated in the EMEP/EEA Guidebook (EMEP/EEA, 2016) that recent international studies based on diluted flue gas sampling were prioritised when updating the Guidebook. In addition, emission data that includes the whole combustion cycle were prioritised as the emission during ignition, part load and burnout are much higher than at full load conditions.
Emission factors for PM based on different emission measurement standards (hot flue gases or diluted) may give significantly different results. A comparative study of the sampling methods showed that the emission factors found when using a dilution tunnel are between 2.5 and 10 times higher than when only taking into account the solid particles measured directly in the chimney (Nussbaumer et al., 2008). A similar range is also reported by Bäfver (2008). For comparability and compliance purposes, the important issue is to base the estimates on comparable measurement standards, irrespective of the standard. For modelling purposes and in assessment of health effects, it seems that results from diluted sampling would be favored, since those data are considered to better reflect real conditions in the atmosphere after an emission has occurred.
As residential biomass combustion is such a dominating source of PM2.5 and BC emissions in the Nordic countries, the present uncertainties and knowledge gaps need to be reduced in order to be able to use the inventory results as a sufficiently reliable basis for policy development and actions. The results from the measurement program in this project aims to provide information to improve the reliability of reported emission levels of SLCP and PM2.5 from residential wood combustion in the Nordic conditions.

2. Measurements
Particulate matter (PM2.5), Elemental Carbon (EC), Organic Carbon (OC), Black Carbon (BC), methane (CH4), non-methane volatile organic compounds (NMVOC) and carbon monoxide (CO) emissions were measured from residential biomass combustion appliances that are widely used in the Nordic countries. The measurement program and the methods to use were developed based on the conclusions from the Background analysis from the previous stage of the project (Kindbom et al., 2015).
Both boilers and room heaters (stoves) were tested. The test objects, operating conditions, test methods, sampling and analysis, as well as results of the measurement program are presented in detail in Carlsson et al., 2016. In this report information from Carlsson et al., 2016, is presented at a general level to enable understanding of the reasoning and interpretation of the results in relation to the emission factors proposed in Chapter 5. The measurements were performed in cooperation between SP Technical Research Institute of Sweden (boilers) and DTI, Danish Technological Institute (stoves).
2.1 Test methods, sampling and analysis
Most of the firing cycles were performed according to EN standards (EN 303–5 for boilers and EN 16510-series for room heaters). Sampling during the ignition phase is not included in EN standards, but was added in this measurement program. A few tests using firing schemes according to Norwegian standards, NS 3058, were performed for stoves to enable comparison of differences in particle emission levels (PM2.5, EC and OC) due to the measurement standard followed.
In the EN standard series valid during 2015 for residential appliances, no test on part load for log-wood fired conventional room heaters is provided. Therefore, tests for part loads available in the revision of EN 16510 (endorsed in March 2016) were used.
All sampling for particulates (PM2.5, EC, OC, BC) was done in a full flow dilution tunnel according to specifications in NS3058. Samples were collected on quartz filters for subsequent analysis. Analysis of PM2.5 was made gravimetrically, while EC/OC were analysed thermo-optically according to NIOSH protocol 870. BC was analysed optically (using an OT21 aethalometer) on the filter samples before they were analysed for EC and OC.
The results for BC from the aethalometer analyses show a weak correlation with the EC results, and BC results were considerably lower than the EC results, generally about one third (Carlsson et al., 2016). This was regarded as questionable results, since in theory BC should be on the same level or higher than the EC results. Due to that the NIOSH protocol 870 for analysis of EC is a more established method than the

14 Emission factors for SLCP emissions from residential wood combustion
aethalometer analysis (including the calculation algorithm) for BC, the BC results were not further taken into consideration in the analysis of the measurement results.
Sampling for gaseous compounds, total organic gaseous carbon (TOC) and CH4, was done in undiluted flue gases in the chimney. Measurements were made with continuous FID-analysers with a “methane cutter”. NMVOC was calculated as the difference between TOC and CH4. CO in the flue gases was determined by CO infrared analysers.
2.1.1 Conversion from C to NMVOC and CH4
Total organic gaseous carbon (TOC) was measured as well as methane (CH4). NMVOC is calculated as the difference between TOC and CH4, all based on their carbon content. Results for CH4 and NMVOC are given from the measurements as mg Carbon/MJ. CH4 is easily converted from the weight of carbon to the weight of the molecule CH4 to get emission factors in the unit mg CH4/MJ. NMVOC, however, is a mixture of carbon containing organic compounds. A conversion factor from the amount of carbon to the amount of NMVOC was calculated based on profiles of organic gaseous compounds measured in emissions from residential wood and pellet stoves in Sweden (Pettersson et al., 2011).3
The weighted fraction of carbon in the mixture was found to be 0.88. To convert the results from amount carbon (mg C/MJ) to mg NMVOC/MJ the results were multiplied by 1/0.88, or 1.13.
2.2 Test cycles and sampling periods
Both for boilers and for stoves, the standard test methods include a start-up and pre-test period to establish stable thermal conditions, but during which the emissions are not measured according to the test procedures. As the start-up phase is expected to result in higher emissions, PM sampling was carried out on separate filters during this period to facilitate determination of EC/OC and PM2.5 emissions to distinguish them from emissions during stable periods.
For wood log boilers, a test cycle of one ignition and pre-test period was followed by two consecutive test periods with one fuel batch each. The ignition and pre-test period included loading of two batches of wood. The first (smaller batch) is for lighting up the fire, and the second is added after three minutes when the first sampling for 30 minutes starts.
During the ignition and pre-test periods one sample was taken, and during the two following fuel batches, three samples were taken during each batch. In summary, seven samples were taken during one test cycle (in most cases). Sampling of emissions was
3 The data actually used in the calculations is compiled in the data base Speciate, v. 4.5. (https://www.epa.gov/air-emissions-modeling/speciate-version-45-through-32, accessed, 11 November 2016).

Emission factors for SLCP emissions from residential wood combustion 15
made during periods of 30 min, the first one (ignition and pre-test period) beginning 3 minutes after fuel loading.
For stoves, in principle the same procedures were applied, apart from that extra sampling during the ignition phase was only included in a few test cycles. Each test cycle, apart from tests at reduced heat output, consisted of three test periods with one fuel batch and one sample during each fuel batch. Test cycles at reduced heat output (part load) consisted of two test periods with one fuel batch and one sample in each test period. The test according to NS3058 consisted of three or four test periods as prescribed by the Norwegian standard. The number of test periods depended on the capacity of combustion air inlets, as the highest prescribed rate was not possible to achieve for one stove.
2.3 Test program
The boilers and stoves tested in the program are described with some short technical characteristics in Table 1 The boilers and stoves tested were chosen to each represent a typical technology. The objective of the test program was to obtain results that can be useful in national emission inventory work. In inventory work very detailed information on the residential combustion equipment is generally not available. The technical characteristics of the types of boilers and stove in Table 1 allows for grouping and weighing test results according to available national information on residential combustion technologies.
Table 1: Types of boilers and room heaters (stoves) in the test program
Notation Type of boiler/stove
Boilers
P1 Log wood boiler with inverse combustion and λ-probe. Ceramic grate. P2 Log wood boiler I with inverse combustion and flue gas fan. Ceramic grate. P3 Log wood boiler II with inverse combustion and flue gas fan. Ceramic grate. Different manufacturer than P2 P4 Log wood boiler with inverse combustion and natural draught. Ceramic grate. P5 “Simple” log wood boiler made from cast iron, natural draught and upward combustion P6 Old combination boiler (oil + wood), upward combustion P7 Traditional pellet burner in an combination boiler P8 Advanced pellet burner with λ-probe in boiler designed for pellet firing P9 Pellet boiler with integrated grate burner with λ-probe, pilot flame P10 Wood chip boiler with λ-probe, pilot flame
Stoves
A0 Modern medium class wood stove A1 Traditional simple stove (DIY stove) A2 Modern popular wood stove A3 State-of-the-art room heater A4 Traditional Nordic cast iron stove A5 Traditional Nordic tiled stove A6 Traditional Nordic slow heat release appliance (masonry stove) A7 Swedish type pellets stove (now obsolete) A8 European type pellets stove A9 Traditional Nordic sauna stove

16 Emission factors for SLCP emissions from residential wood combustion
The measurement program includes tests at nominal load, but also at part load (reduced heat output) and at high load to simulate user practices that are expected to lead to higher emissions. Part load tests were carried out at 30% of nominal heat load, a level relevant both from a heat load point of view as well as being somewhat of the lowest possible heat load. The part load tests are assumed to lead to inefficient combustion conditions. This happens when the air supply is intentionally reduced in order to allow combustion to proceed unattended during a considerable amount of time. This leads to inefficient combustion conditions, which is expected to increase SLCP emission levels.
High load tests were performed on a few stoves. The nominal heat load is not necessarily the maximum heat load for stoves used in a living area. The maximum heat load would, however, be obtained e.g. if the fuel batch is large, the combustion air inlets are fully open and the fuel is dry. Entering more firewood than the stove is optimized for leads to shortage of combustion air, which in turn leads to higher emissions during quite short time periods. Therefore such high load tests were made for two stoves.
Furthermore, a few tests were made investigating variations of ignition practice for stoves (top-down ignition vs bottom-up ignition). For boilers the influence on emission levels of entering small batches of wood at part load firing instead of one larger batch was also tested.
To further simulate high-emission user practices, tests with moist and moderately dry log wood were performed in addition to using log wood with standard moisture content. The use of moist log wood is expected to increase emissions due to inefficient combustion during evaporation of the moisture in the fuel. Too dry fuel may also lead to increased emissions. Moderately over-dried firewood (8–12%) may not have significant adverse influence on the emissions, but it is generally recognized that extremely dry firewood (0–5%), e.g. waste wood from industrial manufacture of windows or floors, is too dry to burn properly and is likely to cause excessive emissions of soot. Extremely dry firewood was not tested in this test program, only moderately over-dried.
Fuel characteristics for the standard, moist and dry test fuels are presented in Table 2.
Table 2: Fuel moisture content for the standard fuel, moist fuel and dry fuel tests
Fuel type Moisture content (%)
Standard log wood (SLW) 16–20 Moist log wood (MLW) 25–30 Dry log wood (DLW) 10–14 Wood pellets (WP) < 12 Standard wood chips (SWC) 20–30 Moist wood chips (MWC) 40–50
An overview of the test program for boilers is presented in Table 3 and for stoves in Table 4.
Emission factors for SLCP emissions from residential wood combustion 17
2.3.1 Boilers
For modern boilers designed to be connected to an accumulator tank, only tests at nominal load were included (P1–P4) (Table 3). A log-wood boiler which is connected to an accumulator tank is normally only operated at its nominal output, loading the accumulator. Part load operation is not expected.
For log-wood boilers which are not generally connected to an accumulator tank (P5 and P6), operation at part loads is expected to occur frequently. This happens as the operator fires according to the momentary heat need of the house. Therefore, such boilers were tested at both its nominal heat output as well as at a part load of 30%.
Pellets and wood chips boilers (P7–P10) are normally designed to operate within a heat output range of at least 30–100%. Therefore, pellet and wood chip boilers were tested at both their nominal heat output as well as at a part load of 30%.
Both standard, moist and dry fuels were tested in the boilers, as outlined in Table 3.
Table 3: Test cases for boilers
Appliance Test designation Heat load Test fuel
P1 P1NomSLW Nominal Standard log wood P1NomMLW Nominal Moist log wood
P2 P2NomSLW Nominal Standard log wood P2NomMLW Nominal Moist log wood P2NomDLW Nominal Dry log wood
P3 P3NomSLW Nominal Standard log wood
P4 P4NomSLW Nominal Standard log wood P4NomMLW Nominal Moist log wood P4NomDLW Nominal Dry log wood
P5 P5NomSLW Nominal Standard log wood P5NomMLW Nominal Moist log wood P5PartSLW Part Standard log wood
P6 P6NomSLW Nominal Standard log wood P6PartSLW Part Standard log wood
P7 P7NomWP Nominal Wood pellets P7PartWP Part Wood pellets
P8 P8NomWP Nominal Wood pellets P8PartWP Part Wood pellets
P9 P9NomWP Nominal Wood pellets P9PartWP Part Wood pellets
P10 P10NomSWC Nominal Wood chips P10NomMWC Nominal Moist wood chips P10PartSWC Part Wood chips P10PartMWC Nominal Moist wood chips

18 Emission factors for SLCP emissions from residential wood combustion
2.3.2 Stoves
The stoves tested are shown in Figure 1 and an overview of the test cases is presented in Table 4.
Figure 1: The stoves (room heaters) tested
All stoves were tested at their nominal heat output, and tests at part load were performed for most of the stoves (A0–A5, A8) (Table 4). Residential appliances are normally heating the air in the living area through heat radiation and operation of the stove at part loads is a common situation.

Emission factors for SLCP emissions from residential wood combustion 19
Slow heat release appliances are designed to be fully heated up during combustion of one or two fuel batches at high intensity, after which the accumulated heat is discharged to the surrounding air during a long time period, up to two days. This means that only testing at high intensity (nominal load) combustion is relevant for the masonry stove (A6). This reasoning is also valid for sauna stoves (A9).
The nominal heat load is not necessarily the maximum heat load for stoves used in a living area. Therefore a few tests with high load were performed for two stoves (A1 and A2).
The relation between particle emissions (PM2.5, EC and OC) when tested according to the EN-related scheme and according to the Norwegian Standard (NS3058) was achieved conducting measurements according to NS3058 for two residential appliances (A1–A2). Emissions measured according to NS3058 provides emission figures that are directly related to the test method. The NS requires four tests at four different burn rates, which means that the stoves are tested also under less favorable combustion conditions with reduced burning rates. Emissions according to NS3058 are higher than emissions figures from EN16510, and the differences is primarily due to the testing on low load. This leads to much higher emissions than what the stove is optimized for. The results from the four loads are weighted together to form a “mean value” with some emphasis on low load operation.
As for boilers, tests with the different fuel qualitites (standard, moist and dry) were also made (Table 4). Tests according to the Norwegian standard were made using fuel as specified in NS3058.

20 Emission factors for SLCP emissions from residential wood combustion
Table 4: Test cases for stoves
Appliance Test designation Heat load Test fuel
A0 A0NomSLW Nominal Standard log wood A0PartSLW Part Standard log wood
A1 A1NomSLW Nominal Standard log wood A1NomMLW Nominal Moist log wood A1PartSLW Part Standard log wood A1HighSLW High Standard log wood A1NomDLW Nominal Dry log wood A1HighDLW High Dry log wood A1NS3058* NS3058* NS3058*
A2 A2NomSLW Nominal Standard log wood A2NomMLW Nominal Moist log wood A2PartSLW Part Standard log wood A2HighSLW High Standard log wood A2NomDLW Nominal Dry log wood A2NS3058* NS3058* NS3058*
A3 A3NomSLW Nominal Standard log wood A3NomMLW Nominal Moist log wood A3PartSLW Part Standard log wood
A4 A4NomSLW Nominal Standard log wood A4PartSLW Part Standard log wood
A5 A5NomSLW Nominal Standard log wood A5PartSLW Part Standard log wood
A6 A6NomSLW Nominal Standard log wood A6NomMLW Nominal Moist log wood
A8 A8NomWP Nominal Wood pellets A8PartWP Part Wood pellets
A9 A9NomSLW Nominal Standard log wood A9NomMLW Nominal Moist log wood
Note: * NS3058= Norwegian standard.

3. Measurement results
3.1 Measurement results for boilers
An overview of the measurement results from the boiler tests are shown in Table 5 and Figure 2. The test case P2NomSLW (modern boiler, nominal heat load and standard log wood) was repated three times. This was done as part of exploratory tests performed to examine and decide on test conditions before the ordinary test programme was started. All the other tests were performed once, in most cases including seven samples during the combustion test cycle.
Table 5: Emission results for boilers as mean values over all sampling periods in each test (from Carlsson et al., 2016)
Test designation* PM2,5 mg/MJ
EC mg/MJ
OC mg/MJ
CO mg/MJ
CH4 mg/MJ6
NMVOC mg/MJ7
P1NomSLW 24 2 12 233 4 32 P1NomMLW 46 2 8 178 2 13 P2NomSLW 1 29 3 10 1054 10 64 P2NomMLW 50 4 13 1335 18 145 P2NomDLW 32 3 12 754 8 56 P3NomSLW 45 8 19 2036 32 141 P4NomSLW 36 15 14 1516 23 >1355 P4NomMLW 32 5 14 1894 35 212 P4NomDLW 89 9 36 3160 62 279 P5NomSLW 320 19 >962 3578 103 477 P5NomMLW 524 >312 >1432 4748 >282 >2722 P5PartSLW 1138 15 >4262 8978 >352 >5512 P5PartMLW 3 n.a. n.a. n.a. n.a. n.a. n.a. P6NomSLW 317 27 138 2963 47 >4625
P6PartSLW 1975 35 776 6408 259 >13325 P6PartSLW small batches 373 21 181 3437 74 932 P7NomWP 57 14 11 631 4 22 P7PartWP 182 17 54 1225 6 57 P8NomWP 38 2 12 134 1 9 P8PartWP >145 7 16 250 1 10 P9NomWP 15 1 6 120 1 15 P9PartWP 88 6 49 2273 26 218 P10NomSWC 48 1 20 366 4 47 P10NomMWC 4 61 6 25 1894 11 94 P10PartSWC 227 7 98 4479 64 627 P10PartMWC 4 718 14 >3675 5839 81 950
Note: *Nom=Nominal load, Part=Part load, SLW=Standard log wood, MLW=Moist log wood, DLW=Dry log wood, WP=Wood pellets, SWC=Standard wood chips, MWC=Moist wood chips. 1 Mean value from all samples of the three exploatory tests. 2 Measurement only part of time. Actual value higher. 3 Test not performed due to bad combustion already during P5PartSLW. 4 Not possible to ignite on moist wood chips. Values from ignition taken from P10PartSWC. 5 Some samples above measurement range. Actual value higher. n.a= not available 6 Measured values (mgC/MJ) are converted to mg CH4 using a conversion factor of 16/12=1.33. 7 Measured values (mgC/MJ) are converted to mg NMVOC using a conversion factor of 1.13.

22 Emission factors for SLCP emissions from residential wood combustion
Figure 2: Average emissions from boilers, standard fuel (SLW, WP or SWC) and moist fuel (MLW or MWC) and nominal and part load
Note: *=actual value higher.
3.1.1 Boiler types and general emission levels
The overall result from the test program show clearly higher emission levels from the two old technology boilers (P5 and P6) than from the other tested boilers, when comparing results from tests at nominal heat load using standard fuel (blue bars in Figure 2). For EC the difference is not as pronounced as for the other substances.

Emission factors for SLCP emissions from residential wood combustion 23
The modern boilers P1–P4 are equipped with modern combustion technology. i.e. inverse combustion and ceramic insulated combustion chamber. In three cases a flue gas fan is installed (P1–P3) and in one case also a λ-probe (P1) for excess air control. When tested at nominal load and standard fuel these boilers show emission results that are very low when comparing all boiler types within the test program. The data for modern log wood boilers (nominal load and standard fuel) reflects to a quite large extent the common use of these boilers; i.e. operating connected to an accumulator tank and using wood that has been dried outside but under cover.
Boiler P5 represents a simple combustion technology, and boiler P6 is an old combination boiler intended for both wood and fuel oil firing. None of these two boilers have any of the features listed for the modern boilers above. These two older technology boilers showed the highest emissions.
All three pellet fired boilers (P7–P9) show emissions that are comparable to, or slightly lower than the four modern log wood boilers (P1–P4). P7 is an old combination boiler, not designed for pellet firing, but where a separate pellet burner is installed. This type of pellet boiler installation is the most common in Sweden. P8 and P9, on the other hand, are designed for pellet firing. P8 has a separate advanced pellet burner installed and P9 has an integrated grate designed for pellet combustion.
The wood chip boiler (P10) also showed emission levels (nominal load, standard fuel) comparable to the modern log wood boilers and the pellet boilers.
3.1.2 Impact of fuel quality, boilers
The measurements show that the impact of moist fuel (red bars in Figure 2) is towards higher emission levels, about 1.5 times, compared to when firing with standard fuel (blue bars in Figure 2). In several cases, however, the levels are similar. For the old technology boiler (P5) the actual emission levels for CH4 and NMVOC using moist fuel are higher than shown in Figure 2. During the measurements the instruments were disconnected since the measurement range was exceeded.
For the modern type boilers tested with moist fuel (P1, P2 and P4) the influence of using moist fuel instead of standard fuel is rather weak for PM2.5, EC and OC, and emission levels are low. A somewhat higher influence can be seen for NMVOC and CH4.
For the old technology boiler, P5, the emission level of PM2.5 when using moist fuel is about 1.5 times that from standard fuel firing. Also EC and OC emission levels are clearly higher. Since the measurement instruments for CH4 and NMVOC had to be disconnected from sampling, the level of the influence of moist fuel on those substances is not known from the results, other than that it is most likely significant.
The larger impact on emission levels from moist fuel in older technology boilers (P5) compared to in modern boilers (P1–P4) seem reasonable when looking at the combustion conditions in the different boiler types. In a modern log wood boiler only a small part of the fuel load is taking part in the combustion at any given time; the rest gradually approaching the combustion zone by gravity. During this process, the fuel is continuously dried and then volatilized. The conditions are held almost constant at feasible temperatures in the primary combustion zone; thereby generating reasonably

24 Emission factors for SLCP emissions from residential wood combustion
low emissions even with moist fuel. On the other hand, in a traditional boiler as P5, the full fuel load is burning at the same time, meaning that in the beginning of the combustion cycle the total amount of fuel must be dried, then volatilized and finally the char is combusted. This in turn means that combustion temperatures and combustion conditions are varying widely over the combustion cycle. Significantly higher emissions at least during parts of the cycle is the natural result.
No tests were made with moist fuel for the pellet boilers while the wood chip boiler (P10) was tested with moist fuel, both at nominal and at part load. The combination of moist fuel and part load results in very much higher emissions for all substances, except for EC (Figure 3). This test case may not be that common in reality, as it was impossible to ignite using the moist wood chips. Ignition had to be made with standard wood chips, while the subsequent loadings of fuel during the test cycle were done with moist wood chips.
Figure 3: Emission levels at all test cases for the wood chip boiler (P10)
Note: Nom=nominal load, Part= part load, SWC=standard wood chips, MWC=moist wood chips.
A few test cases on modern log wood boilers (P2 and P4) using dry log wood indicate somewhat higher emissions than when using standard wood (except for EC), but the effect is rather weak. The dry wood tests produced emissions that were slightly higher than, or on comparable levels to the moist wood tests (Figure 4). The tests indicated a better performance, irrespective of fuel moisture, for the boiler with a flue gas fan (P2) while emissions from the boiler with natural draught (P4) were somewhat more affected. All measured emissions from the two modern boilers are however considerably lower than the old technology boiler (P5) and the old combi boiler (P6).
0
100
200
300
400
500
600
700
800
900
1000
PM2.5 EC OC CH4 NMVOC
mg/
MJ
Wood chip boiler
NomSWC
NomMWC
PartSWC
PartMWC

Emission factors for SLCP emissions from residential wood combustion 25
Figure 4: Average results from tests of different fuel qualities on the modern log wood boilers (P2 with flue gas fan and P4 with natural draught). Nominal heat load and standard fuel (SLW), moist fuel (MLW) and dry fuel (DLW)
3.1.3 Impact of heat load, boilers
The impact of heat load was tested comparing standard fuel at nominal heat load and at part heat load. The modern log wood boilers were not tested at part load since they are expected to be connected to an accumulator tank, and therefore fired at nominal heat load.
In almost all cases, emissions are much higher at part load (inefficient combustion conditions) than at nominal heat load (blue bars in Figure 2. The differences are generally between 2–6 times, and even higher for NMVOC, CH4 and CO for the wood chip boiler.
The EC emissions for the old technologies (P5, P6 and P7) are an exception in that they do not differ much between part load and nominal load.
For the advanced pellet boilers and for the wood chips boiler, all emissions were significantly higher at part load than at nominal heat load, though at low absolute levels. Both pellet fired boilers and wood chip boilers are normally not connected to an accumulator tank and are therefore operated directly against the momentary heat demand of the house. This means that the “real-life emissions” for these boiler types might be closer to the part load values than to the nominal load numbers.
3.2 Measurement results for stoves
An overview of the measurement results from the stove tests are shown in Table 6 and in Figure 5. Two or three repeated identical tests were made in the exploratory phase for stove A0, A1 and A2 at nominal load using standard log wood (NomSLW). Repeated tests were also made for part heat load and standard log wood (PartSLW) using stove
020406080
100120140160180200
PM2,5 EC OC CH4 NMVOC
mg/
MJ
Average, P2 and P4
Standard fuel, nominal load
Moist fuel, nominal load
Dry fuel, nominal load

26 Emission factors for SLCP emissions from residential wood combustion
A0 and A2. All the other tests were performed once, in most cases including three samples during the combustion cycle.
Table 6: Stoves/residential heaters. Summary of emission data as mean values over all sampling periods in each test (from Carlsson et al., 2016)
Test designation* PM2,5 mg/MJ
EC mg/MJ
OC mg/MJ
CO mg/MJ
CH4 mg/MJ3
NMVOC mg/MJ4
A0NomSLW1 78 9 39 2287 153 144 A0PartSLW1 81 19 46 2730 193 120 A1NomSLW2 93 42 11 1107 52 19 A1NomMLW 821 18 441 3839 368 772 A1PartSLW 94 6 14 1777 67 7 A1NomDLW 150 19 8 931 59 14 A1HighDLW 287 104 44 2223 91 98 A1HighSLW 208 n.a. n.a. 785 35 5 A1NS3058 347 31 167 n.a. n.a n.a. A2NomSLW2 53 18 21 1077 35 40 A2NomSLW+TD** 62 14 23 1043 45 47 A2NomMLW 348 9 91 3078 160 267 A2PartSLW+BU** 137 27 43 1838 120 105 A2PartSLW+SB *** 458 12 191 3084 245 495 A2NomDLW 72 10 23 656 37 21 A2HighSLW 131 44 49 1628 72 127 A2NS3058 430 120 149 n.a n.a n.a. A3NomSLW 106 3 6 919 31 28 A3NomMLW 100 4 25 1490 80 71 A3PartSLW 74 4 7 1386 11 1 A4NomSLW 147 13 48 1165 65 132 A4PartSLW 330 15 127 2194 187 322 A5NomSLW 198 122 70 3145 167 229 A5PartSLW 285 110 75 2751 272 154 A6NomSLW 82 22 31 1585 61 133 A6NomMLW 78 7 22 1175 65 76 A8NomWP 100 10 11 189 1 3 A8PartWP 153 7 24 447 4 14 A9NomSLW 104 18 52 1405 56 85 A9NomMLW 120 28 51 2030 107 180
Note: 1 Average of 3 exploratory tests. 2 Average of 2 exploratory tests. 3 Measured values (mgC/MJ) are converted to mg CH4 using a conversion factor of 16/12=1.33. 4 Measured values (mgC/MJ) are converted to mg NMVOC using a conversion factor of 1.13. *Nom=Nominal load, Part=Part load, High=High load, SLW=Standard log wood, MLW=Moist log wood, DLW=Dry log wood, WP=Wood pellets, NS3058=Test according to Norwegian standard 3058 (PM2.5, EC, OC). ** TD= Top-Down ignition, BU= Bottom-Up ignition. Ignition data are included in average values in table, but not in figures below. *** SB= Small Batches. n.a= not available.

Emission factors for SLCP emissions from residential wood combustion 27
Figure 5: Average emissions from stoves/residential heaters, standard fuel (SLW or WP) and moist fuel (MLW) and nominal and part load
3.2.1 Types of stoves and general emission levels
The measurements at nominal load and standard fuel (blue bars in Figure 5) show that the difference in emission levels between older and more modern technologies in general are not as pronounced for stoves as they are for boilers.
The highest emission levels at nominal load and standard fuel were measured from the old tiled stove (A5). Emissions were generally on the higher side also from the other older type technology stoves (i.e. the masonry stove (A6) and cast iron stove (A4)), but also for some of the modern stoves (e.g. A0 and A1).
The state-of-the-art stove (A3) and the pellet stove (A8) generally performed well, showing the lowest emission levels for most substances.

28 Emission factors for SLCP emissions from residential wood combustion
The tiled stove (A5) and the sauna stove (A9) work solely or predominantly on primary air supply. They both display significantly higher EC emissions than the remaining stoves. This is most likely due to their very basic air systems where most or all of the combustion air enters as primary air, leading to substantial soot formation. In terms of emission levels, all stoves, except for the tiled stove (A5) and the sauna stove (A9) and to some extent the simple modern stove (A1), display fairly low EC emissions.
The newer stoves A0-A3 display on average lower levels of particle emissions (PM2.5 and OC) than the older stoves A4 and A5. This is due to enhanced start-up properties in general among the newer stoves.
3.2.2 Impact of fuel quality, stoves
The impact of using moist fuel wood (red bars in Figure 5) instead of fuel with standard moisture (blue bars in Figure 5) seems to vary a lot between technologies.
For the modern stoves (A1 and A2) moist fuel resulted in much higher emissions than when using standard fuel quality (except for EC). The state-of-the-art stove (A3), the masonry stove (A5) and the sauna stove (A9) seem much more robust against moist firewood and emission levels are more similar to those measured from standard fuel firing. There are reasons to believe that the higher impact from moist fuel in the modern stoves is mainly due to limited capacity of the air systems among many modern stoves.
Two tests using moderately dry log wood was performed on stoves A1 and A2. In Figure 6 the average results from all the different test cases for A1 and A2 are shown, including those already presented in Figure 5.
The firing of moderately dry log wood at nominal heat load (NOM DLW) did not have as large impact on emission levels compared to the moist fuel wood (NOM MLW), and levels were closer to the standard log wood results. In fact, for all substances, except for PM2.5, firing with moderately dry log wood gave somewhat lower emissions than when using standard log wood.

Emission factors for SLCP emissions from residential wood combustion 29
Figure 6: Average results from all test cases performed on stoves A1 and A2. Nom=Nominal load
Note: High=high load, Part=part load, SLW=Standard log wood, DLW=dry log wood, MLW=moist log
wood.
According to the measurement results emissions of EC react differently to firewood moisture than PM2.5 and OC emissions. Among the modern stoves A1 and A2, where all three firewood qualities were tested, EC emissions from both the moist and the dry firewood are lower than from the standard log wood at nominal load (Figure 5). This is also the case for the masonry stove (A6). For the state-of-the-art stove (A3) and the sauna stove (A9), EC emissions are of similar magnitude, independent of whether the firing is done with standard fuel or with moist fuel (Figure 5).
3.2.3 Impact of heat load, stoves
The impact of firing with part heat load (grey bars in Figure 5) instead of nominal heat load (blue bars) generally results in emission levels that are in the order of at least twice as high for a modern popular stove (A2) and a traditional cast iron stove (A4). For two of the modern stoves (A0 and A1) the firing with part load did not have any large effect on emission levels compared to the firing at nominal load. This may be due to variabilities in measurements (see chapter 3.7).
For the tiled stove (A5) part heat load firing resulted in higher emissions than at nominal load, but the difference is not as pronounced as for the stoves A2 and A4. The clearly lowest emission levels at part load firing were measured from the state-of-the-art stove (A3) and the pellets stove (A8) for most substances. Emissions from the state-of-the-art stove (A3) at part load were for most substances lower than at nominal load. This may be due to the fact that it is difficult to steer an automatically controlled stove like the A3 into reduced heat output because the valve is beyond manual control.
0
100
200
300
400
500
600
PM2,5(mg/MJ)
EC (mg/MJ) OC(mg/MJ)
CH4(mg/MJ)
NMVOC(mg/MJ)
NOM SLW
NOM DWL
HIGH SLW
PART SLW
HIGH DLW
NOM MLW

30 Emission factors for SLCP emissions from residential wood combustion
There is no clear dependency between heat load and the magnitude of the EC emissions. For about half of the stoves, the part load and nominal load EC emissions are of the same magnitude.
A few tests were also performed firing with high heat load on the modern stoves A1 and A2. The results show that overloading modern stoves with firewood (high load) leads to higher emission levels than when firing at nominal load (HIGH SLW compared to NOM SLW in Figure 6). On average the emission doubled for most substances (except for CH4) when stoves A1 and A2 were fired at high load instead of at nominal load. The modern stoves are prone to react to firewood overload because of their optimized air systems. In order to reduce the heat output to the room, many modern stoves have downsized air capacity, when comparing to 10–15 year old stoves.
As was also the case for the boilers, EC emissions show no general apparent dependence on heat load or fuel moisture.
3.3 Impact of measurement standard, stoves
Presently, the emission factors used in the Nordic countries are based on tests using different standards. Only in Norway the Norwegian standard (NS3058) is the basis for emission factors for particulate matter. Since there are reasons to suspect differences in measured emission levels due to measurement standards, a few tests were performed to be able to compare PM2.5, EC and OC emissions using the NS3058 firing scheme and the EN 16510 firing scheme. The tests were made on stoves A1 and A2, a traditional simple stove and a modern popular stove. In all cases sampling was done in a dilution tunnel. Calculations and weighing of results where done according to the standards.
Average resuts from all tests cases on stoves A1 and A2, including the NS3058-tests, are presented in Figure 7.
Figure 7: Results from testing according to Norwegian standard (NS3058) compared to all other test combinations using EN16510 for stoves A1 and A2
0
100
200
300
400
500
600
PM2,5 EC OC
mg/
MJ
NOM SLW
NOM DWL
HIGH SLW
PART SLW
HIGH DLW
NS3058
NOM MLW

Emission factors for SLCP emissions from residential wood combustion 31
Combining the results for the stoves A1 and A2, NS3058 weighted average PM2.5 emission is 5 times the ordinary nominal load (NOM) standard log wood (SLW) emission, but only 66% of the moist log wood (MLW) emission. Also for EC and OC the NS3058 results are much higher than nominal load and standard fuel tests, about 3 times for EC and >10 times for OC.
3.3.1 Comparison of NS3058 test results and Norwegian emission factors
The current emission factors for Norway are based on Norwegian standard measurements. In Table 7 the factors currently used in Norway for stoves produced after 1998 (comparable to “modern stoves”) are presented, together with the NS3058 test results for the modern stoves A1 and A2 presented above. In Norway there are also national emission factors (higher) for stoves older than 1998 (see table 26 in chapter 5.3). Revised emission factors have recently been proposed by Seljeskog et al., (2016), but have so far not been adopted as national factors. These are also presented in the table below. The recently evaluated and proposed emission factors are lower than those presently used in the Norwegian national inventory.
The NS3058 test results for PM2.5 from new stoves are about half of those used as national emission factors in the Norwegian national emission inventory. Measured factors for EC are on the other hand about 30% higher while OC factors are about one fourth of the Norwegian currently used emission factors (Table 7).
One contributing reason for the differences between the test results and the Norwegian emission factors may be the variability of measurements (see chapter 3.7 for discussion on uncertainty). The recently proposed emission factors by Seljeskog et al., (2016) are closer to the ones measured in this project.
Weighted Norwegian emission factors are calculated based on the amount of wood used in the different wood stove categories. The current weighting procedure involves separating open fireplace and stoves produced before and after 1998, and using reduced emission factors for large cities, where less part load operation is assumed.
The weighting according to the current method is for the emission inventory 2015 based on the following categories: stoves produced before 1998, 40.1%, stoves produced after 1998, 55.1% and fireplaces 4.9%. The assumed amount of wood used in large cities is 6.1% and the rest of the country, 93.9%.
Seljeskog et al. also proposes a revised weighting procedure. As before, a distinction of fireplaces and stoves produced before and after 1998 is suggested, but then stoves are again divided into two categories, part load and nominal load operated. Seljeskog et al. suggests this to be a more realistic distinction than the current assumption of different emission factors for large cities and the rest of the country.
The weighting according to the proposed revised method is as follows:
old stoves (before 1998), 65% part load and 35% nominal load
new stoves (after 1998), 70% part load and 30% nominal load.

32 Emission factors for SLCP emissions from residential wood combustion
Table 7: Results from two tests using the Norwegian standard (NS3058 ) on modern stoves in this project, compared to current Norwegian emission factors for stoves produced after 1998, and recent evaluations by Seljeskog et al. 2016 (mg/MJ)
This project
Current Norwegian emission factors for stoves produced
after 1998 (mg/MJ)
Recent evaluation by Seljeskog et al. 2016
Modern stoves Modern stoves,
NS3058
Norway, includes
night firing
Norway, larger cities,
no night firing
Norway, part load firing
Norway, nominal load
firing
Emission factors assuming 70% part
load and 30% nominal load
PM2.5 388 (347–430)
758 690 619 113 467
EC 76 (31–120)
51 54 40 35 39
OC 159 (149–167)
623 551 346 84 267
3.4 Impact of ignition, boilers and stoves
The first sample in each test cycle for the boilers represents the ignition (and pre-test) phase. In the boiler tests two batches of wood were added in the beginning of the test. The first (smaller batch) is for lighting up the fire, and the second is added after three minutes when the first sampling for 30 minutes starts.
The ignition phase has commonly been thought to result in higher emissions than the following burn period. However, the results showed that emissions are not higher during ignition in all cases, and that for some boilers and pollutants the ignition phase results in lower or approximately the same level of emissions as during the following sampling periods of the test cycle.
In Figure 8 and Figure 9 results for the ignition and pre-test period are shown separately from the following sampling periods in the test cycles, for modern log wood boilers and for traditional boilers. For the modern log wood boilers the values during the ignition and pre-test periods are higher than during the following sampling periods. For the traditional wood log boilers, the emissions during the ignition and pre-test periods are instead lower than during the following sampling periodes (except for EC).

Emission factors for SLCP emissions from residential wood combustion 33
Figure 8: Modern log wood boilers (P1–P4). Average of ignition and pretest sampling periods (ign) compared to the average for the follwing sampling periods, and the average for all sampling periods (average)
Figure 9: Traditional log wood boilers (P5–P6). Average of ignition and pretest sampling periods (ign) compared to the average for the follwing sampling periods, and the average for all sampling periods (average)
The somewhat unexpected results showing lower emissions during the ignition and pre-test periods for traditional boilers show that the ignition phase does not necessarily result in higher emissions than the actual combustion phase.
In absolute numbers, the tests show that the emissions at ignition in traditional wood log boilers (Figure 9) are around three times higher than the ignition phase in the modern boilers (Figure 8).
For the stoves, sampling during the ignition phase was only made during two special tests on stove A2. In both cases standard log wood was used. In Figure 10 the average of the emissions at ignition is compared with emissions during the following
0
50
100
150
200
PM2.5 EC OC CH4 NMVOC
mg/
MJ
Modern log wood boilers
Nominal:SLW-ign
Nominal:SLW
Nominal:SLW-average
0
100
200
300
400
500
PM2.5 EC OC CH4 NMVOC
mg/
MJ
Traditional log wood boiler
Nominal:SLW-ign
Nominal:SLW
Nominal:SLW-average

34 Emission factors for SLCP emissions from residential wood combustion
sampling periods. The tests indicate that emissions at ignition are approximately twice as high as during the subsequent repeated combustion periods for all substances except for methane where the difference is much smaller.
Figure 10: Stove A2. Average of ignition and pre-test sampling periods (ignition) compared to the average for the following sampling periods during the test cycles, and the average of all sampling periods
As expected, the emissions are higher during the ignition period for stove A2 than during the subsequent repeated burn cycles. Earlier it was a general assumption that the PM ratio was even higher. Technological development among wood stoves in recent years has led to stoves having better firebox insulation and better air systems, both effective in allowing a rapid start-up sequence, yielding a robust fire and higher firebox temperatures sooner for the benefit of lower emissions.
For the A2 stove, which is the average stove widespread in Sweden, tests were carried out using the traditional bottom-up ignition and the top-down ignition, which in recent years has been recommended by environmental agencies in Scandinavia since it is assumed to result in lower emissions. In Figure 11 the emissions sampled at the bottom-up ignition and the top-down ignition periods are compared.
0
20
40
60
80
100
120
PM2,5 EC OC CH4 NMVOC
mg/
MJ A2 NOM SLW-Ign
A2 NOM SLW
A2 NOM SLW average

Emission factors for SLCP emissions from residential wood combustion 35
Figure 11: Test of bottom-up ignition and top-down ignition on stove A2
It’s clearly seen that all emissions are of approximately the same order of magnitude when ignition is carried out by a skilled operator in a well-controlled test lab environment. However, it is the general assumption that, among average stove users, the top-down ignition method leads to lower emissions because the fire is never excessively roared up, meaning that the pyrolysis gases can be burnt in the order they are released from the firewood. For example, recent tests in Denmark have shown reducions of emissions between 0–75%, with an average reduction of particle emissions of 23% at ignition, if the top-down method is used instead of bottom-up ignition (Andersen & Hvidberg, 2017). The conclusion in the report is that top-down ignition is preferred, but that the effect varies between stoves.
3.5 Impact of operation: loading small fuel batches at part load firing, boilers and stoves
To investigate the impact of operation when firing at part load conditions, test cases adding the fuel more often and in smaller batches were performed. The tests were conducted using the old combination boiler, P6, and one of the modern stoves, A2.
The emissions measured at nominal heat load, at part heat load and at part heat load with small fuel batches are presented in Figure 12 for boiler P6. Standard log wood was used in all three cases.
0
20
40
60
80
100
120
PM2,5 EC OC CH4 NMVOC
mg/
MJ
Test of ignition method, stove A2
Top-down ign
Bottom-up ign

36 Emission factors for SLCP emissions from residential wood combustion
Figure 12: Emissions at nominal and part heat load, and at part heat load with fuel feeding in small batches. Boiler P6, standard fuel (SLW)
Note: * Actual values are higher.
The results show that operating the boiler with small fuel batches at part load (i.e. shorter time between fuel loadings) causes the emissions to decrease quite dramatically compared to the case at part heat load with fewer, but larger, fuel loadings. The “small batches” way of firing approaches more constant, and favourable, combustion conditions. This type of operation, however, requires the presence of the user during firing.
A corresponding test with small fuel batches was carried out in one test case using stove A2. In Figure 13 the results show that, for the A2 stove, the small batches part load case actually produced higher emissions than the part load with fewer but larger batches (except for EC). Both part load test cases resulted in higher emissions than the case with nominal heat load. This is not the expected outcome, but might be a result of a higher sensitivity to variations in combustion conditions in modern stoves with limited capacities of the air system.
0
500
1000
1500
2000
PM2.5 EC OC CH4 NMVOC
mg/
MJ
P6NomSLW
P6PartSLWsmallbatches
P6PartSLW
*
*

Emission factors for SLCP emissions from residential wood combustion 37
Figure 13: Results for stove A2, impact of small batches at part load
3.6 EC and OC as fraction of PM2.5
EC and also OC emission factors are sometimes expressed as a fraction of PM2.5 emission factors, a convenient way of estimating emissions (EEA, 2016). However, the results shown in Figure 14 indicate that EC emissions do not correlate with PM2.5 emissions over the burn cycle for the tests carried out in this study. For OC, on the other hand, the variation in measured emissions seem to correlate much better with PM2.5. The fact that EC reacts differently from other pollutants is also obvious in the sections above where the measurement results for the individual boilers and stoves are presented.
This is in accordance with e.g. Savolahti et al., (2016) where it is stated that typically the share of BC increases along with combustion efficiency. A simplified explanation is that at inefficient combustion, condensable organic substances which contribute to the amount of PM2.5 (and OC) are produced. Thus, at inefficent combustion PM2.5 increases, resulting in a lower share of EC in PM2.5.
0
50
100
150
200
250
300
350
400
450
500
PM2,5 EC OC CH4 NMVOC
mg/
MJ A2NomSLW
A2PartSLW SmallBatches
A2 PartSLW

38 Emission factors for SLCP emissions from residential wood combustion
Figure 14: Average of emissions from individual samples during the test cycles for traditional wood log boilers (P5–P6)
Figure 15 below shows results from individual samples from the traditional wood log boilers. The figure shows that there is no correlation between EC and PM2.5.
Figure 15: Traditional log wood boilers. X=PM2.5, (mg/MJ), Y=EC (mg/MJ). All values are for nominal load and standard log wood
Similarly, there is no strong correlation between averaged values for EC and PM2.5 emission factors between technologies, and between different operational conditions (Table 8). Calculated shares of EC/PM2.5 are between 2% and 52%. Thus, expressing EC as a fraction of PM2.5 emissions may not reflect the reality very well.
0
5
10
15
20
25
30
35
0
200
400
600
800
1000
1200
1st 2nd 3rd 4th 5th 6th 7th
EC
PM2.
5an
d O
C
PM2.5 (mg/MJ)
OC (mg/MJ)
EC (mg/MJ)

Emission factors for SLCP emissions from residential wood combustion 39
Table 8: EC as percentage of PM2.5 for boilers and stoves by technology and test conditions. Calculated from measurement result
EC/PM2.5 Nominal load: Standard fuel Nominal load: Moist fuel Part load: Standard fuel
Modern log wood boilers 18% 8% - Traditional log wood boilers 7% 6% 2% Pellet-fired boilers 17% - 11% Wood chip boilers 2% - 3% Modern stove 28% 2% 12% State-of-the-art 3% 4% 5% Older stove 9% - 4% Tiled and masonry stove 52% 9% 39% Pellet stove 10% - 5% Sauna stove 50% 43% -
3.7 Uncertainties
3.7.1 Overall variation between identical tests
Measurement data shows that the overall variation of emissions can be quite large even when firing takes place in a controlled environment and is carried out by experienced people. The variation in test results from three test cycles (of seven samples each) that were performed using the same combustion conditions and the same boiler (standard fuel moisture, nominal load and modern boiler P2) is presented in Figure 16.
Results for repeated, identical, test cycles (of three samples each) for the modern stoves A0 and A1 are presented in Figure 17 and Figure 18 (three tests for A0 and two tests for A1, nominal heat load, standard log wood).
It is obvious from the results that in most cases the results are rather similar, but also that the same lab can produce results with substantial variability when repeating the “same” measurement (e.g. NMVOC for boiler P2 and PM2.5 for stove A0). This variation needs to be taken into consideration when using the measurement results in developing emission factors (i.e. not draw extensive conclusions from individual results).

40 Emission factors for SLCP emissions from residential wood combustion
Figure 16: Results from three repeated test cycles of seven samples each, and calculated averages. Boiler P2, nominal heat load and standard fuel (SLW)
Figure 17: Results from three repeated test cycles of three samples each, and calculated averages. Stove A0, nominal heat load and standard fuel (SLW)
0
20
40
60
80
100
120
PM2.5 EC OC CH4 NMVOC
mg/
MJ
Test 1
Test 2
Test 3
Average
020406080
100120140160180200
PM2.5 EC OC CH4 NMVOC
mg/
MJ
A0:Test 1
A0:Test 3
A0:Test 5
A0 average

Emission factors for SLCP emissions from residential wood combustion 41
Figure 18: Two repeated test cycles of three samples each, and calculated average. Stove A1, nominal heat load and standard fuel (SLW)
From the results of the repeated identical tests presented in the figures above, the percentage differences to the calculated average is given in Table 9. The variation ranges from + 5% up to as much as 70%. The numbers should be interpreted as an indication of possible uncertainties in the results from individual tests.
Table 9: Percentage difference in results from repeated identical tests to the average result. Number in parenthesis is the number of tests
PM2.5 EC OC CH4 NMVOC
Boiler P2 (3) +18%/-12% +10%/-9% +16%/-20 +48%/-44% +66%/-55% Stove A0 (3) +72%/-40%/ +/-4% +/-38% +17%/-21% +10%/-8% Stove A1 (2) +/-5% +/-5% +/-10% +/-25% +/-17%
As an example for general comparison; in a study to evaluate the total emissions and uncertainties of PM2.5 from domestic wood combustion in Finland, Karvosenoja et al. (2008) estimated the PM2.5 emission factor uncertainties to be in the range -54% to +88% (95% confidence interval). These uncertinty values were estimated primarilybased on several sets of measurement data on stoves. The uncertainty range given byKarvosenoja et al., apart from variation in individual tests, also include uncertiantiesdue to different stoves tested, varying maintenance, installation errors etc.
3.7.2 Uncertainties for PM2.5
In the measurement program PM2.5 was analysed by weighing the same quarts filters that were sampled for later analysis of EC and OC. Quarts filters are fragile and loss of filter material is difficult to avoid in the necessary handling during sampling and
0
10
20
30
40
50
60
70
80
90
100
PM2.5 EC OC CH4 NMVOC
mg/
MJ A1:test 7
A1:test 9
A1 average
42 Emission factors for SLCP emissions from residential wood combustion
analysis. Furthermore, the sampling was optimised for subsequent EC/OC analysis. In several tests this led to too low loads of PM2.5 on the filters for accurate determination by weighing. PM2.5 emission levels of approximately 100 mg/MJ are reported in in Carlsson et al. (2016) to be somewhat of a lower limit for accurate results, when a stict uncertainty evaluation is made. Several of the results regarding PM2.5 from the measurement program are lower than this value, which needs to be taken into consideration in developing emission factors for PM2.5 based on these measurements.
On the other hand, the results regarding PM2.5 are considered by the experienced labs performing the measurements to be well in line with previous measurements on comparable appliances of similar technologies. Thus, we choose to present the actual PM2.5 results from the measurements, even if they are lower than 100 mg/MJ.
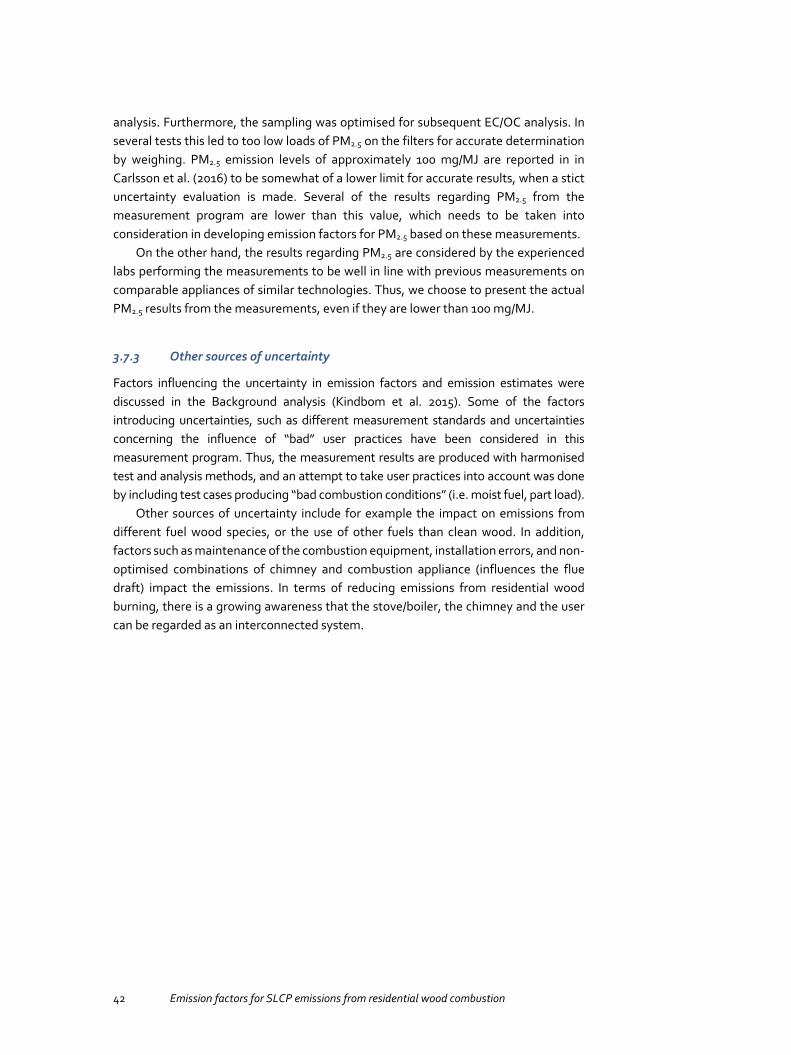
3.7.3 Other sources of uncertainty
Factors influencing the uncertainty in emission factors and emission estimates were discussed in the Background analysis (Kindbom et al. 2015). Some of the factors introducing uncertainties, such as different measurement standards and uncertainties concerning the influence of “bad” user practices have been considered in this measurement program. Thus, the measurement results are produced with harmonised test and analysis methods, and an attempt to take user practices into account was done by including test cases producing “bad combustion conditions” (i.e. moist fuel, part load).
Other sources of uncertainty include for example the impact on emissions from different fuel wood species, or the use of other fuels than clean wood. In addition, factors such as maintenance of the combustion equipment, installation errors, and non-optimised combinations of chimney and combustion appliance (influences the flue draft) impact the emissions. In terms of reducing emissions from residential wood burning, there is a growing awareness that the stove/boiler, the chimney and the user can be regarded as an interconnected system.

4. Emission measurement results bytechnology group
4.1 Grouping of technologies
In the work of preparing emission factors to be used in the national air emission inventories it is necessary to be able to match the emission factors to available activity data (technologies and fuels). The grouping proposed below is made based on similarities in technologies and emission levels measured in connection to this project, but also taking the variablility in measurement results for identical tests into account. The proposed technology groups for boilers are presented in Table 10 and for stoves in Table 11. In the tables the technologies included in each group are given, along with the number of tests performed for each group and test designation.
Table 10: Proposed technology groups and number of tests and samples for each group of boilers
Group Load Fuel quality Number of tests
Number of samples/test
Boilers tested
Modern log wood boilers Nominal standard 6 7 P1x1, P2x3, P3x1, P4x1 Modern log wood boilers Nominal moist 3 7 P1, P2, P4 Modern log wood boilers Nominal dry 2 7 P2, P4 Traditional log wood boilers Nominal standard 2 7 P5, P6 Traditional log wood boilers Nominal moist 1 6 P5 Traditional log wood boilers Part standard 2 7 P5, P6 Traditional log wood boilers Part standard, small batches 1 7 P6 Pellet-fired boilers Nominal pellets 3 5 P7, P8, P9 Pellet-fired boilers Part pellets 3 5 P7, P8, P9 Wood chip boilers Nominal standard 1 5 P10 Wood chip boilers Nominal moist 1 4 P10 Wood chip boilers Part standard 1 6 P10 Wood chip boilers Part moist 1 4 P10

44 Emission factors for SLCP emissions from residential wood combustion
Table 11: Proposed technology groups and number of tests and samples for each group of stoves
Group Load Fuel quality Number of tests
Number of samples/test
Room heaters tested
Modern stoves Nominal standard 7 3 A0x3, A1x2, A2x2 Modern stoves Nominal moist 2 3 A1, A2 Modern stoves Nominal dry 2 3 A1, A2 Modern stoves Part standard 6 2, 3 A0x3, A1, A2x2 Modern stoves High standard 2 3 A1, A2 Modern stoves High dry 1 3 A1 Modern stoves NS3058 NS3058 2 3 A1, A2 State-of-the-art Nominal standard 1 3 A3 State-of-the-art Nominal moist 1 3 A3 State-of-the-art Part standard 1 2 A3 Older stove Nominal standard 1 3 A4 Older stove Part standard 1 2 A4 Tiled and masonry stove Nominal standard 2 3 A5, A6 Tiled and masonry stove Nominal moist 1 3 A6 (Masonry stove) Tiled and masonry stove Part standard 1 2 A5 (Tiled stove) Pellet stoves Nominal standard 1 3 A8 Pellet stoves Part standard 1 3 A8 Sauna stove Nominal standard 1 3 A9 Sauna stove Nominal moist 1 3 A9
4.2 Technology groups, boilers
For boilers the following technology groups are proposed in Carlsson et al. 2016:
Modern log wood boilers (P1–P4)
Traditional log wood boilers (P5, P6)
Pellet fired boilers (P7–P9)
Wood chip boiler (P10)
The reasoning behind the suggested practical grouping of technologies for national emission inventory purposes is given in Carlsson et al. 2016, and is as follows:
The modern log wood boilers P1–P4 are all boilers with modern combustion technology. i.e. with inverse combustion, ceramic insulated combustion chamber, in three cases a flue gas fan (P1, P2 and P3) and in one case also a λ-probe (P1) for excess air control. A flue gas fan leads to more stable combustion process. The boiler P4 has no flue gas fan but operates by natural draught.
Among the traditional wood log boilers, P5 is a boiler with simple combustion technology, and boiler P6 is an old combination boiler, i.e. a boiler intended for both wood and fuel oil firing. None of these two boilers have any of the features listed above.
For the pellet fired boilers a distinction could be made between P8 and P9 on the one hand, and P7, which is an old combination boiler in which a separate pellet burner is installed. P7 is originally not designed for pellet firing. This type of pellet boiler installation is the most common in Sweden. P8 and P9 on the other hand are boilers which are designed for pellet firing, where P8 has a separate advanced pellet burner

Emission factors for SLCP emissions from residential wood combustion 45
installed and P9 has an integrated grate designed for pellet combustion. P10 is the only wood chip boiler.
The overall results from the individual boilers fired at nominal heat load and with standard log wood are presented in Figure 19 as an overview of the emission levels from the different technologies.
Figure 19: Emissions of PM2.5, EC, OC, CH4 and NMVOC for individual boilers, nominal heat load and standard fuel
Note: Modern boilers (P1–P4), Traditional boilers (P5–P6), Pellet boilers (P7–P9), Wood chip boiler (P10).
From Figure 19 it is evident that the traditional older technology boilers, P5 and P6, generally have the highest emission levels, why having them in one separate group is reasonable. The modern wood log boilers (P1–P4) show significantly lower emission levels than the old technologies. A separation of older technologies from modern technologies should be possible to obtain as activity data in a national inventory.
One group comprising pellet boilers is relevant. Pellet firing is possible to separate from other technologies in the national inventories since fuel statistics separating pellets from wood logs is usually available.
4.3 Measurement results by boiler technology group
The measured emissions for the technology groups for boilers are presented in Table 12 and in Figure 20. Results are given separately for the different test combinations of heat loads and fuel quality. This enables estimation of the degree of impact compared to the standard test case (nominal heat load and standard fuel). In Table 12 the ratio compared to nominal load and standard fuel (N:S) is calculated. In the table the number of test cycle results used for the reported data are indicated. Data for some groups are based on averages from several test cycles, while for some combinations of technology group and combustion condition there is only one test cycle making up the emission factor. The
0
50
100
150
200
250
300
350
400
450
500
PM2.5 EC OC CH4 NMVOC
mg/
MJ
P1 λ-probe
P2 flue gas fan
P3 flue gas fan
P4 natural draught
P5 old tech
P6 old combi
P7 "old" pellet burner
P8 adv pellet burner
P9 pellet boiler
P10 wood chip

46 Emission factors for SLCP emissions from residential wood combustion
uncertainty in the results is of course higher if only one test cycle is available than if several test cycles are used as a basis for developing an emission factor.
Table 12: Emissions for boilers by technology group, and calculated ratio between test types. Numbers in parenthesis are the number test cycles. Interval, min–max given for the data. Ignition and pretest period are included in the data
Nominal load: Standard fuel
(N:S)
Nominal load: Moist fuel (N:M)
Nominal load: Dry fuel (N:D)
Part load: Standard fuel (P:S)
Part load: Moist fuel
(P:M)
Ratio N:M/N:S
Ratio N:D/N:S
Ratio P:S/N:S
Modern log wood boilers (6) (3) (2) PM2.5 (mg/MJ) 32 (24–45) 43 (32–50) 61 (32–89) 1.3 1.9 EC (mg/MJ) 6 (2–15) 4 (2–5) 6 (3–9) 0.6 1.1 OC (mg/MJ) 12 (10–19) 12 (8–14) 24 (12–36) 0.9 1.9 CH4 (mg/MJ) 15 (4–32) 18 (2–35) 35 (8–62) 1.2 2.4 NMVOC (mg/MJ) 86 (32–141) 124 (13–212) 168 (56–279) 1.4 2.0 CO (mg/MJ) 1160 (233–2036) 1136 (178–1894) 1957 (754–3160) 1.0 1.7
Traditional log wood boilers (2) (1)
(3)
PM2.5 (mg/MJ) 318 (317–320) 524 1162 (373–1975) 1.6 3.7 EC (mg/MJ) 23 (19–27) >31 24 (15–35) >1.3 1.0 OC (mg/MJ) 117 (96–138) >143 461 (181–776) >1.2 3.9 CH4 (mg/MJ) 75 (47–103) >28 158 (35–259) >0.4 2.1 NMVOC (mg/MJ) 470 (462–477) >272 >1059 (551–>1332) >0.6 >2.3 CO (mg/MJ) 3271 (2963–3578) 4748 6274 (3437–8978) 1.5 1.9
Pellet-fired boilers (3)
(3)
PM2.5 (mg/MJ) 36 (15–57) 96 (14–182) 2.6 EC (mg/MJ) 6 (1–14) 10 (6–17) 1.6 OC (mg/MJ) 10 (6–11) 34 (16–54) 3.5 CH4 (mg/MJ) 2 (1–4) 11 (1–26) 5.1 NMVOC (mg/MJ) 15 (9–22) 95 (10–218) 6.2 CO (mg/MJ) 295 (120–631) 1249 (250–2273) 4.2
Wood chip boilers (1) (1) (1) (1) PM2.5 (mg/MJ) 48 61 227 883 1.3 4.7 EC (mg/MJ) 1 6 7 16 4.8 6.0 OC (mg/MJ) 20 25 98 367 1.2 4.8 CH4 (mg/MJ) 4 11 64 97 2.7 16.0 NMVOC (mg/MJ) 47 94 627 1160 2.0 13.3 CO (mg/MJ) 366 1894 4479 6780 5.2 12.2
For the modern log wood boilers the ratio of measured emissions between moist fuel and standard fuel roughly varies between 1–1.5. If fired with dry log wood emissions are generally twice as high as when fired with standard fuel (except for EC, where the ratio is close to 1.0). Thus, a factor for modern log wood boilers of 1.5–2 to take bad combustion conditions (unsuitable fuel quality) into consideration would be reasonable.

Emission factors for SLCP emissions from residential wood combustion 47
For the traditional log wood boilers several of the measurement results for moist fuel and part load firing were above the measurement range, and reported as “larger than” the given values. Moist fuel resulted in at least 1.5 times higher emissions than when using standard fuel. Comparing part heat load firing to nominal heat load firing gives a factor of 2–4 or higher emissions at part load conditions (except for EC).
Part heat load conditions in the pellet boilers resulted in emissions that were roughly 3–6 times higher than at nominal load (again, except for EC where the difference is smaller, ~1.5). The ratios were around 3 for PM2.5 and OC, and the higher ratios (up to 6) for CH4, NMVOC and CO.
The wood chip boiler seems very sensitive to part load firing, since the calculated ratio to nominal load firing is around 5 for the particulate matter compounds (PM2.5, EC and OC), and as high as 12–16 for CH4, NMVOC and CO.
Generally for the boilers, part load firing seem to have a larger impact on emission levels than using moist fuel.

48 Emission factors for SLCP emissions from residential wood combustion
Figure 20: Average emissions for boilers by technology group. Nominal and part heat load, standard (SLW/SWC) and moist fuel (MLW/MWC)
Note: *=actual value higher. Number in parenthesis=number of samples, number of test cycles.

Emission factors for SLCP emissions from residential wood combustion 49
4.4 Technology groups, stoves
For the stoves the following technology groups are proposed in Carlsson et al. 2016:
Modern stoves (A0, A1, A2)
State-of-the-art stove (A3)
Older stove (A4)
Tiled and masonry stove (A5–A6)
Pellet stove (A8)
Sauna stove (A9)
The reasoning behind the suggested grouping of technologies is given in Carlsson et al. 2016, and is as follows:
Among the tested stoves, A0, A1 and A2 all are modern stoves, basically having the same kind of air system with primary, secondary and tertiary air supply, and they can be regarded as a group in terms of expected emission levels. The A3 stove having automatic valve control and downdraft combustion in a dual firebox is a class of its own. The A4 stove is an older stove made of cast iron, so it is also a class of its own. The A5 and A6 stoves share quite a few characteristics, even though in age there are centuries between them. Both are masonry/tiled type of stoves having a comparatively basic air system and a long flue way before exit of the stove. They can be regarded as a group. Being a continuously fed pellet stove, the A8 stove is a class of its own, as is also the sauna stove A9 having a small firebox and a very basic air system.
The emission levels measured from the individual stoves at nominal load using standard fuel are presented for comparison in Figure 21. It is evident that the emission level differences are not as clear cut between the stoves as they were between different technology boilers.
It has been quite common to distinguish and to categorize stoves by age alone, but it is not as simple as that. Many other parameters like insulation of the firebox and the nature of the air system also influence expected emission levels, on which also the user has an impact.

50 Emission factors for SLCP emissions from residential wood combustion
Figure 21: Emissions of PM2.5, EC, OC, CH4 and NMVOC for stoves, nominal load and standard fuel. Modern stoves (A0–A2), State-of-the-art stove (A3), Older stove (A4), Tiled and masonry stove (A5–A6), Pellets stove (A8), Sauna stove (A9)
4.5 Measurement results by stove technology group
The measured emissions for the technology group modern stoves are presented in Table 13 and for all stove technology groups in Table 14 and in Figure 22. Results are given separately for the different test combinations of heat loads and fuel quality. This enables estimation of the degree of impact compared to the standard test case (nominal heat load and standard fuel). In the tables the ratio compared to Nominal load:Standard fuel (N:S) is calculated.
In the tables the number of test cycle results used for the reported data are indicated. Data for some groups are based on averages from several test cycles, while for some combinations of technology group and combustion condition there is only one test cycle making up the emission factor. The uncertainty in the results is of course higher if only one test cycle is available than if several test cycles are used as a basis for developing an emission factor.
The modern stoves were tested for the most combinations of combustion conditions. The sensitivity of stove performance to “bad combustion conditions”, as represented by the part heat load and high heat load test cases, as well as moist fuel and dry fuel firing are presented for the group of modern stoves in Table 13.
0
50
100
150
200
250
PM2.5 EC OC CH4 NMVOC
mg/
MJ
A0 Modern medium class
A1 Simple
A2 Modern popular
A3 State-of-the-art
A4 Cast iron
A5 Tiled
A6 Masonry
A8 Pellets
A9 Sauna

Emission factors for SLCP emissions from residential wood combustion 51
Table 13: Emissions and ratios between test cases for the technology group Modern stoves (A0, A1 and A2). Numbers in parenthesis are the number of test cycles. Min–max given for the data
Nominal load:
Standard fuel (N:S)
Nominal load: Moist
fuel (N:M)
Part load: Standard
fuel (P:S)
Nominal load:
Dry fuel (N:D)
High load: Standard
fuel (H:S)
High load: Dry fuel
(H:D)
NS3058
Modern stoves (A0,A1,A2)
(7) (2) (4) (2) (2) (1) (2)
PM2.5 (mg/MJ) 74 (53–93)
584 (348–821)
154 (81–458)
111 (72–150)
171 (131–208)
287 388 (347–430)
EC (mg/MJ) 20 (9–42)
13 (9–18)
19 (6–27)
15 (10–19)
44 (n.a–44)
105 76 (31–120)
OC (mg/MJ) 26 (11–39)
263 (91–441)
62 (14–191)
16 (8–23)
49 (n.a.–49)
50 158 (149–167)
CH4 (mg/MJ) 88 (35–153)
264 (160–368)
124 (67–245)
48 (37–59)
54 (35–72)
68
NMVOC (mg/MJ) 77 (19–144)
519 (267–772)
158 (7–495)
16 (14–21)
66 (5–127)
87
CO (mg/MJ) 1574 (1057–2287)
3458 (3078–3839)
2432 (1838–2730)
794 (656–931)
1206 (785–1628)
2223
Modern stoves, ratio to N:S
Ratio N:M/N:S
Ratio P:S/N:S
Ratio N:D/N:S
Ratio H:S/N:S
Ratio H:D/N:S
Ratio NS3058/
N:S
PM2.5 (mg/MJ) 7.9 2.1 1.5 2.3 3.9 5.2
EC (mg/MJ) 0.6 0.9 0.7 2.2 5.1 3.7
OC (mg/MJ) 10.2 2.4 0.2 2.0 1.9 6.1
CH4 (mg/MJ) 3.0 1.4 0.4 0.6 0.8 -
NMVOC (mg/MJ) 6.8 2.1 0.2 0.9 1.1 -
CO (mg/MJ) 2.2 1.5 0.5 0.8 1.4 -
The modern stoves show high sensitivity to moist fuel (except for EC), where the ratio to standard fuel firing is 8–10 times for PM2.5 and OC. NMVOC was around 7 times higher while CH4 and CO were doubled. Notable though, is that especially one test cycle on one of the stoves produced very high emissions.
The high load test case with dry fuel produced high emissions of PM2.5 and EC, around 4–5 times higher than nominal load and standard fuel. OC was doubled while the remaining pollutants were much less affected, resulting in emissions roughly on the same level as the standard case.
Part load and high load conditions, using standard fuel, both resulted in PM2.5 emissions 2–2.5 times higher than nominal load (except for EC at part load). Emissions of CH4, NMVOC and CO were increased by 1.5–2 times at part load, but were

52 Emission factors for SLCP emissions from residential wood combustion
unaffected (or lower) at high load firing. Dry fuel at nominal heat load did not have a great effect on emissions.
In Table 14 emission factors for all groups of stoves are presented, including ratios of moist fuel to standard fuel, and of part heat load to nominal heat load. Here the state-of-the-art stove (A3) is included in the group of modern stoves. The reason for this is that the results for the state-of-the-art stove are based on only one test cycle. In addition, it is not reasonable to assume that this technology can be distinguished in national activity data collection.
Table 14: Emission factors and test case ratios for stove groups by technology. Numbers in parenthesis are the number of test cycles. Interval, min–max given for the data
Nominal load: Standard fuel (N:S)
Nominal load: Moist fuel (N:M)
Part load: Standard fuel (P:S)
Ratio N:M/N:S
Ratio P:S/N:S
Modern stoves (incl. state-of-the-art) (8) (3) (5) PM2.5 (mg/MJ) 84 (53–106) 423 (100–821) 145 (74–458) 5.0 1.7 EC (mg/MJ) 20 (3–42) 10 (4–18) 14 (4–27) 0.5 0.7 OC (mg/MJ) 24 (6–39) 202 (25–441) 62 (7–191) 8.4 2.5 CH4 (mg/MJ) 90 (31–153) 152 (80–368) 113 (11–245) 1.7 1.3 NMVOC (mg/MJ) 76 (19–144) 370 (71–772) 148 (1–495) 4.8 1.9 CO (mg/MJ) 1582 (919–2287) 2802 (1490–3839) 2406 (1386–3084) 1.8 1.5
Older stove (1)
(1)
PM2.5 (mg/MJ) 147 330 2.2 EC (mg/MJ) 13 15 1.1 OC (mg/MJ) 47 155 3.3 CH4 (mg/MJ) 49 140 2.9 NMVOC (mg/MJ) 132 322 2.4 CO (mg/MJ) 1165 2194 1.9
Tiled and masonry stove* (2) (1) (1)
PM2.5 (mg/MJ) 140 (82–198) 78 285 0.6 2.0 EC (mg/MJ) 72 (22–122) 7 110 0.1 1.5 OC (mg/MJ) 51 (31–70) 24 100 0.5 2.0 CH4 (mg/MJ) 114 (61–167) 49 204 0.4 1.8 NMVOC (mg/MJ) 181 (133–229) 75 154 0.4 0.9 CO (mg/MJ) 2365 (1585–3145) 1175 2751 0.5 1.2
Pellet stove (1)
(1)
PM2.5 (mg/MJ) 100 153 1.5 EC (mg/MJ) 10 7 0.7 OC (mg/MJ) 6 3 0.4 CH4 (mg/MJ) 1 3 2.6 NMVOC (mg/MJ) 4 14 3.3 CO (mg/MJ) 189 447 2.4
Sauna stove (1) (1) PM2.5 (mg/MJ) 104 120 1.2 EC (mg/MJ) 52 51 1.0 OC (mg/MJ) 15 32 2.1 CH4 (mg/MJ) 43 80 1.9 NMVOC (mg/MJ) 85 180 2.1 CO (mg/MJ) 1405 2030 1.4
Note: * Moist fuel was tested in the masonry stove, part load was tested in the tiled stove.
Part heat load firing in the older technology stove resulted in emissions that were 2–3 times that of nominal load firing (except for EC).
For the tiled stove part heat load increased the emissions up to two times, while moist fuel firing in the masonry stove did not.

Emission factors for SLCP emissions from residential wood combustion 53
The pellet stove showed PM2.5, EC and OC emissions of rather similar levels as at nominal heat load firing, 1–1.5 times higher at part load, while CH4, NMVOC and CO were 2.5–3 times higher.
The sauna stove when fired with moist fuel wood emitted PM2.5 and EC of the same level as when using standard fuel wood, while emission levels of OC, CH4 and NMVOC were approximately doubled.
The measurement results as averages for the defined groups of stoves are presented by technology group in Figure 22.
Figure 22: Average emissions by technology group of stoves. Emissions at nominal and part heat load, standard (SLW, WP) and moist fuel (MLW). Number in parenthesis=number of samples, number of test cycles
4.6 How to take the ignition phase into consideration
In the measurement program the ignition and start-up phase was sampled in all boiler tests and is included in the average emissions presented.
For the stoves only a few tests were done on the ignition phase. The results showed emissions that were higher than during the following test periods of normal firing, as presented in chapter 3.4 and in Table 15 below. The ratio of ignition to normal firing is
54 Emission factors for SLCP emissions from residential wood combustion
in this case around 2 for PM2.5, EC and NMVOC. For CH4 and for CO the values are on the same level while the difference for OC is larger, almost 4 times higher at ignition.
Table 15: Emissions measured during the ignition phase (stove A2), at normal firing and calculated average for the whole test cycle. Ratio between emissions at ignition and at normal firing
PM2,5 (mg/MJ)
EC (mg/MJ)
OC (mg/MJ)
CH4 (mg/MJ)
NMVOC (mg/MJ)
CO (mg/MJ)
Ignition 108 33 45 38 80 1082 Normal firing 53 16 12 34 32 1059 Average for whole test cycle 67 20 20 35 44 1065 Ratio, Ignition/normal firing 2.0 2.1 3.7 1.1 2.5 1.0
The test cycles for stoves in the test program normally consisted of three samples, excluding the ignition phase. The average emissions for a test cycle including ignition could thus be calculated assuming that the ignition contributes to one fourth of the time for the average of a total test cycle.
EF = (EFign+3*EFnorm)/4
where EFign = ratioign/norm*EFnorm
If ignition is to be included in the emission factors, the example of PM2.5 from the table above (using the ratio of 2 between ignition and normal firing) would be:
EF = (2*53+3*53)/4=66
Emission factors calculated by the above method for modern stoves are presented in Table 16 for all pollutants except CH4 and CO where the measured ratios were close to 1.0.
Table 16: Modern stoves: Calculated average emission factors without the ignition phase, and with ignition phase included. Based on ignition tests on one modern stove (stove A2)
Nominal load: Standard fuel (N:S) N:S including ignition
Modern stoves (incl state-of-the-art) (8) PM2.5 (mg/MJ) 84 105 EC (mg/MJ) 20 25 OC (mg/MJ) 24 41 NMVOC (mg/MJ) 76 96
The ignition and pre-test phase was not tested for the other stove technologies, but there is a general understanding that the ignition in most cases results in increased emission levels.
5. Emission factors
5.1 Emission factors and ratios for bad combustion conditions
Emission factors based on the results from the measurement program, including max and min test cycle values, are presented in Table 17 for boilers and in Table 18 for stoves. A more detailed discussion and evaluation of the results underlying the proposed emission factors and ratios for ”bad” combustion conditions is available in chapter 4.
The proposed emission factors are derived from test cases with nominal heat load conditions and standard fuel moisture. The tables also show the ratios derived for non-optimal combustion conditions. One ratio compares moist fuel to standard fuel at nominal heat load (N:M/N:S) for each technology group and pollutant, and the other compares part heat load to nominal heat load using standard fuel (P:S/N:S). The emission factors and ratios presented in Table 17 and table 18 are adjusted by rounding compared to the data presented in chapter 4. This was done in order to present the technology-specific levels of emission factors and ratios, and at the same time acknowledge measurement (and “real world”) variability.
The results indicate that boilers are more sensitive to part load conditions than to moist fuel (Table 17). For the technologies tested for both conditions (traditional log wood boilers and wood chip boiler) moist fuel increased e.g. the PM2.5 emissions by 1.5 times, while part load increased the emissions by a factor of 4 and 5, respectively.
In general part load conditions increased the emissions from stoves by a factor of around 2 (Table 18). The modern stoves showed a high sensitivity to moist fuel, where e.g. the PM2.5 emissions increased by a factor of 5, while part load doubled theemissions. The tiled and masonry stoves (air systems with larger capacity) were notsensitive to moist fuel, while also in this case, part load conditions increased theemissions of PM2.5 by a factor of 2.
A brief comparison of the ratios found in the measurement program can be made with Finnish data used in the national emission inventory. The Finnish ratios are based on measurements. For PM2.5 emissions a factor of 3 is used for moist fuel and a factor of 2 for part load. These ratios are applied for all wood log burning technologies in Finland, both boilers and stoves (UEF 2005, PUPO database).

56 Emission factors for SLCP emissions from residential wood combustion
Table 17: Emission factors for boilers (mg/MJ). Maximum and minimum values from measurements are given for nominal heat load and standard fuel
Nominal load: Standard fuel
(N:S)
N:S min
N:S max
Ratio moist fuel to
standard fuel N:M/N:S
Ratio part load to
nominal load P:S/N:S
Modern log wood boilers (6) PM2.5 (mg/MJ) 35 24 45 1.5 EC (mg/MJ) 6 2 15 1.0 OC (mg/MJ) 15 10 19 1.0 CH4 (mg/MJ) 15 4 32 1.5 NMVOC (mg/MJ) 85 32 141 1.5 CO (mg/MJ) 1160 233 2037 1.0
Traditional log wood boilers (2)
PM2.5 (mg/MJ) 320 317 320 1.5 4.0 EC (mg/MJ) 25 19 27 >1.5 1.0 OC (mg/MJ) 120 96 138 >1.5 >4.0 CH4 (mg/MJ) 75 47 103 >1.5 >3.0 NMVOC (mg/MJ) 470 462 477 >1.5 >3.0 CO (mg/MJ) 3270 2963 3578 1.5 2.0
Pellet-fired boilers (3)
PM2.5 (mg/MJ) 35 15 57 3.0 EC (mg/MJ) 6 1 14 1.5 OC (mg/MJ) 10 6 11 3.5 CH4 (mg/MJ) 2 1 4 5.0 NMVOC (mg/MJ) 15 9 22 6.0 CO (mg/MJ) 295 120 631 4.0
Wood chip boiler* (1)
PM2.5 (mg/MJ) 50 1.5 5.0 EC (mg/MJ) 2 5.0 6.0 OC (mg/MJ) 20 1.5 5.0 CH4 (mg/MJ) 5 3.0 15.0 NMVOC (mg/MJ) 50 2.0 15.0 CO (mg/MJ) 366 5.0 12.0
Note: The last two columns show the ratio of moist fuel to standard fuel at nominal heat load (N:M/N:S) and the ratio of part load to nominal load using standard fuel (P:S/N:S). Numbers in parenthesis are number of test cycles.
* Data based on only one test cycle.

Emission factors for SLCP emissions from residential wood combustion 57
Table 18: Emission factors for stoves (mg/MJ). Maximum and minimum values from measurements are given for nominal heat load and standard fuel. One column shows the emission factors taking ignition into consideration for modern stoves
Nominal load:
Standard fuel
N:S min
N:S max
N:S including
ignition
N:M/N:S P:S/N:S
Modern stoves (incl state-of-the-art) (8) PM2.5 (mg/MJ) 84 53 106 105 5.0 2.0 EC (mg/MJ) 20 3 42 25 1.0 1.0 OC (mg/MJ) 24 6 39 41 8.0 2.5 CH4 (mg/MJ) 90 31 153 90 2.0 1.5 NMVOC (mg/MJ) 76 19 144 96 5.0 2.0 CO (mg/MJ) 1582 919 2287 1582 2.0 1.5
Older stove* (1)
PM2.5 (mg/MJ) 147 2.5 EC (mg/MJ) 13 1.0 OC (mg/MJ) 47 3.5 CH4 (mg/MJ) 49 3.0 NMVOC (mg/MJ) 132 2.5 CO (mg/MJ) 1165 2.0
Tiled and masonry stove** (2)
PM2.5 (mg/MJ) 140 82 198 1.0 2.0 EC (mg/MJ) 72 22 122 1.0 1.5 OC (mg/MJ) 51 31 70 1.0 2.0 CH4 (mg/MJ) 114 61 167 1.0 2.0 NMVOC (mg/MJ) 181 133 229 1.0 1.0 CO (mg/MJ) 2365 1585 3145 1.0 1.0
Pellet stove* (1)
PM2.5 (mg/MJ) 100 1.5 EC (mg/MJ) 10 1.0 OC (mg/MJ) 6 1.0 CH4 (mg/MJ) 1 2.5 NMVOC (mg/MJ) 4 3.5 CO (mg/MJ) 189 2.5
Sauna stove* (1) PM2.5 (mg/MJ) 104 1.5 EC (mg/MJ) 52 1.0 OC (mg/MJ) 15 2.0 CH4 (mg/MJ) 43 2.0 NMVOC (mg/MJ) 85 2.0 CO (mg/MJ) 1405 1.5
Note: The last two columns show the ratio of moist fuel to standard fuel at nominal heat load (N:M/N:S) and the ratio of part load to nominal load using standard fuel (P:S/N:S). Numbers in parenthesis are number of test cycles.
* Data based on only one test cycle.
** Moist fuel was tested in the masonry stove, while part load was tested in the tiled stove see Table 6.

58 Emission factors for SLCP emissions from residential wood combustion
5.2 How to take bad combustion conditions into consideration in the emission factors
To estimate emissions from a specific source, the following simple equation is used:
Emissions = AD * EF
where:
AD = fuel use in the specific technology or technology group (MJ)
EF = emission factor for a pollutant (mg/MJ)
If bad combustion conditions are to be taken into consideration in the emission factor (EF), the equation below can be used (Savolahti et al., 2016):
EF = EFNormal * SNormal + RatioBad/Good * EFNormal * SBad
where:
EFNormal = Emissions under normal combustion conditions;
SNormal = Share of fuel used in the specific technology burned under normal combustion conditions. For example, if normal combustion conditions is assumed to occur for 80% of the total fuel use in the technology, the share would be 0.8;
RatioBadGood = Factor telling how many times the emissions are higher under bad combustion conditions than under normal combustion conditions. For instance, ifthe emissions are three times higher during bad combustion conditions the ratiowould be 3;
SBad = Share of fuel used in the specific technology burned under bad combustionconditions (SBad = 1- SNormal), e.g if the normal combustion share is 0.8, the bad combustion share will be 0.2 (1–0.8 = 0.2).
Ratios between normal and bad combustion conditions can be derived from the measurement program results (Table 17 for boilers and Table 18 for stoves). From the measurement program there are separate factors for the two different “bad combustion conditions” of part load firing and use of moist fuel. The emission factor, taking moist fuel and part load into account separately would be calculated as follows:
EF=(EFNormal*SNormal)+(RatioMoist/Standard*EFNormal*SMoist)+(RatioPart/Nominal*EFNormal*S
Part)
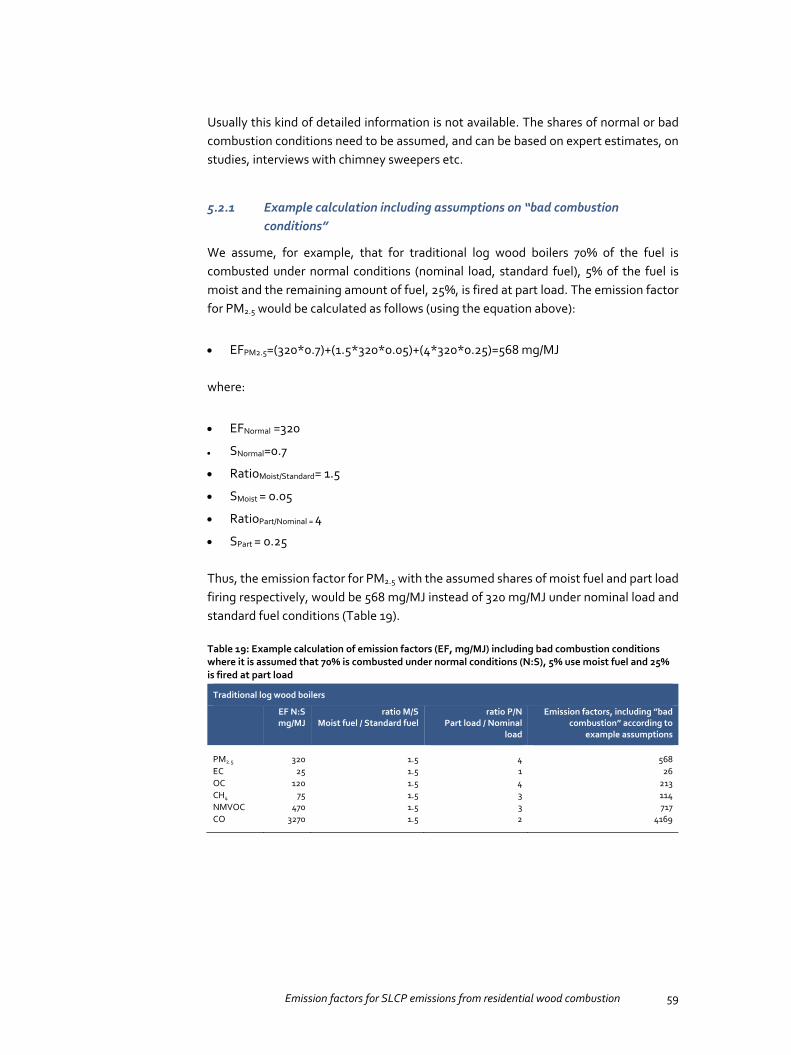
Emission factors for SLCP emissions from residential wood combustion 59
Usually this kind of detailed information is not available. The shares of normal or bad combustion conditions need to be assumed, and can be based on expert estimates, on studies, interviews with chimney sweepers etc.
5.2.1 Example calculation including assumptions on “bad combustion conditions”
We assume, for example, that for traditional log wood boilers 70% of the fuel is combusted under normal conditions (nominal load, standard fuel), 5% of the fuel is moist and the remaining amount of fuel, 25%, is fired at part load. The emission factor for PM2.5 would be calculated as follows (using the equation above):
EFPM2.5=(320*0.7)+(1.5*320*0.05)+(4*320*0.25)=568 mg/MJ
where:
EFNormal =320
SNormal=0.7
RatioMoist/Standard= 1.5
SMoist = 0.05
RatioPart/Nominal = 4
SPart = 0.25
Thus, the emission factor for PM2.5 with the assumed shares of moist fuel and part load firing respectively, would be 568 mg/MJ instead of 320 mg/MJ under nominal load and standard fuel conditions (Table 19).
Table 19: Example calculation of emission factors (EF, mg/MJ) including bad combustion conditions where it is assumed that 70% is combusted under normal conditions (N:S), 5% use moist fuel and 25% is fired at part load
Traditional log wood boilers
EF N:S mg/MJ
ratio M/S Moist fuel / Standard fuel
ratio P/N Part load / Nominal
load
Emission factors, including ”bad combustion” according to
example assumptions
PM2.5 320 1.5 4 568 EC 25 1.5 1 26 OC 120 1.5 4 213 CH4 75 1.5 3 114 NMVOC 470 1.5 3 717 CO 3270 1.5 2 4169

60 Emission factors for SLCP emissions from residential wood combustion
5.3 Comparison with literature and current national emission factors
The EMEP/EEA Air Pollutant Emission Inventory Guidebook (2016) includes default emission factors for a number of different residential wood burning technologies. The technology groups in the EMEP/EEA Guidebook are not always directly comparable to the ones in this project. Comparisons in Table 20 – Table 27 are between the technology groups from the Guidebook and from this project that are judged to be the most similar. The emission factors for advanced/eco-labelled stoves and boilers in the EMEP/EEA Guidebook are listed together and are hence identical.
In the tables the default emission factors from the EMEP/EEA Guidebook and current ranges of region-and technology specific emission factors for PM2.5, BC and OC in the GAINS model (Klimont et al., 2016) are compared to the proposed emission factors for nominal load and standard fuel conditions from this project. Also the current emission factors used in the Nordic countries are listed in the tables. The emission factors in the Nordic countries have different levels of technology differentiation (Kindbom et al. 2015), from a few technologies to very detailed differentiation.
In Iceland, emissions from residential biomass combustion have not been estimated as of today and no emission factors have therefore been used. In contrast to other Nordic countries, the great majority of residences uses either (geothermal) district- or electric heating (around 90% geothermal and 10% electricity), suggesting a much lower impact of residential combustion of biomass on total national SLCP emissions than in the other Nordic countries. Use of wood stoves in residences in Iceland is not common and usually only fired up for pleasure and coziness. A small part of summerhouses in Iceland use biomass as the main source for heating only for a few weeks per year. In addition, the small population of Iceland compared to other Nordic countries suggests, overall, a very small impact of the Icelandic residential combustion of biomass on total Nordic SLCP emissions.
Even though the emission factors compared in the tables below do not always refer to exactly the same technology, it is obvious that there are sometimes large differences. This applies both when comparing the default factors from the EMEP/EEA Guidebook to the emission factors developed in this project, as well as in relation to the national emission factors. In general, the emission factors developed in this project (nominal load and standard fuel, N:S) tend to be on the lower side compared to the default factors in the EMEP/EEA Guidebook, with the exception of pellet fired boilers and stoves. If “bad combustion condition” ratios measured in this project (Table 17 and Table 18) would be weighted into the emission factors, they would be higher. How much higher depends on the extent of “bad combustion”. Most of the emission factors developed in this project, however, lie within the 95% confidence intervals given in the EMEP/EEA Guidebook (Table 20 – Table 27).

Emission factors for SLCP emissions from residential wood combustion 61
Table 20 – Table 27: Comparison of default emission factors from EMEP/EEA Guidebook (mg/MJ, and lower and upper 95% confidence interval, for BC also % of PM2.5 is given), GAINS current ranges of region- and technology specific emission factors (Klimont et al., 2016), results from this project (nominal load and standard fuel, N:S min–max), and national emission factors for comparable technologies (mg/MJ). NA=not available.
Table 20: EMEP/EEA: Advanced/ecolabelled boilers. This project:Modern boilers
EMEP/EEA GAINS$ This project N:S Denmark Finland** Norway* Sweden#
PM2.5 93 (19–233) 80–520 / 40–260 35 (24–45) 206–413 17/115 146 150 BC/EC 26 32-50 / 13-37 6 (2-15) 58–116 0.5/24 24 24 BC, % of PM2.5 28% (11-39%) OC NA 22–230 / 12–100 15 (10–19) NA NA 15 NA CH4 NA 15 (4–32) 50 50/200 11 254 NMVOC 250 (20–500) 85 (32–141) 175 49 75 300
Note: *Norway and Sweden, same as conventional boiler. ** Finland: Manually fed modern/manually fed with accumulator tank. $ Improved/new modern. # Swedish emission factors are based on hot flue gas measuerements.
Table 21: EMEP/EEA: Conventional boilers. This project: Traditional boilers
EMEP/EEA GAINS** This project N:S Denmark Finland Norway Sweden
PM2.5 470 (235–940) 230–1300 320 (317–320) 900–1800 135–700 146 150 BC/EC 75 75–200 25 (19-27) 144–288* 24–210 24 24 BC, % of PM2.55 16% (5–30%) OC NA 75–600 120 (96–138) NA NA 15 NA CH4 NA 75 (47–103) 211–256 50–200 11 254 NMVOC 350 (100–2000) 470 (>462–477) 350 49–402 75 300
Note: * BC calculated as % of PM2.5 as given in the EMEP/EEA Guidebook (2016). ** Old uncontrolled boiler.
Table 22: EMEP/EEA and This project: Pellet boilers
EMEP/EEA GAINS This project N:S
Denmark Finland Norway* SINTEF 2016**
Sweden
PM2.5 29 (9–47) 20–68 35 (15–57) 29 20 146 150 30 BC/EC 4.4 5 6 (1–14) 4.4 0.5 24 4.5 BC, % of PM2.5 15% (6–39%) OC NA 2.5–10 10 (6–11) NA NA 15 NA CH4 NA 2 (1–4) 3 50–200 11 15 3 NMVOC 10 (1–30) 15 (9–22) 10 3 75 77 6
Note: * Norway, same as conventional boiler. **Suggested new emission factors for Norway.

62 Emission factors for SLCP emissions from residential wood combustion
Table 23: This project: Wood chip boiler
EMEP/EEA This project N:S Finland (automatic)
Norway (briquets)
Sweden
PM2.5 NA 50 16 146 100 BC/EC NA 5 0.5 24 16 OC NA 20 NA 15 NA CH4 NA 5 50–200 11 203 NMVOC NA 50 3 75 150
Table 24: EMEP/EEA: Advanced/ecolabelled stoves. This project: Modern stoves
EMEP/EEA GAINS$ This project,
N:S
Denmark Finland Norway part load*
Norway nominal
load*
Sweden**
PM2.5 93 (19–233) 30–186 84 (53–106) 155 72 758 690 100 BC/EC 26 9–30 20 (3–42) 43 17 51 54 10 BC, % of PM2.5 28% (11–39%) OC NA 8–67 24 (6–39) NA NA 623 551 NA CH4 NA 90 (31–153) 2 50–200 732 732 430 NMVOC 250 (20–500) 76 (19–144) 175 82 417 417 150
Note: * Norway, stove produced after 1998. Emission factors for PM2.5, EC and OC derived using NS3058. ** Sweden, same as for conventional stove. $ New wood stove.
Table 25: EMEP/EEA: Energy efficient stoves. This project: Tiled and masonry stoves
EMEP/EEA GAINS$ This project N:S Denmark Finland$$ Norway* Sweden**
PM2.5 370 (285–740) 55–372 140 (82–198) 257 33–138 100 BC/EC 59 30–95 72 (22–122) 41 15–47 10 BC, % of PM2.5 16% (5–30%) OC NA 11–133 51 (31–70) NA 7–25 NA CH4 NA 114 (61–167) 125 45–200 430 NMVOC 350 (100–2000) 181 (133–229) 350 106–209 150
Note: *Norway, emission factor is based on the age of the stove. **Sweden, same as for conventional stove. $ Improved wood stove. $$ Finnish masonry stoves.
Table 26: EMEP/EEA: Conventional stoves. This project: Older stove
EMEP/EEA GAINS This project N:S
Denmark Finland Norway part load*
Norway nominal
load*
Sweden
PM2.5 740 (370–1480)
150–930 147 740 113 1284 984 100
BC/EC 74 32–100 13 74 27 57 60 10 BC, % of PM2.5 10% (2–20%) OC NA 60–435 47 NA NA 996 767 NA CH4 NA 49 430 50–200 732 732 430 NMVOC 600 (20–3000) 132 600 92–3984 417 417 150
Note: *Norway, stove produced before 1998. Emission factors for PM2.5, EC and OC derived using Norwegian standard (NS3058).

Emission factors for SLCP emissions from residential wood combustion 63
Table 27: EMEP/EEA and This project: Pellet stoves
EMEP/EEA GAINS This project N:S
Denmark Finland Norway SINTEF 2016* Sweden
PM2.5 29 (9–47) 10–47 100 29 NA 64 150 30 BC/EC 4.4 1.3–4 10 4 NA 2 4.5 BC, % of PM2.5 15% (6–39%) OC NA 2–7 6 NA NA 11 NA CH4 NA 1 3 NA 300 15 7 NMVOC 10 (1–30) 4 10 NA 376 77 6
Note: * Suggested new emission factors for Norway.
The national emission factors show large variations for similar technologies. For example, for several log wood burning technologies (both boilers and stoves) the emission factors for PM2.5 and EC are considerably higher in Denmark than in Finland or Sweden. The Swedish emission factors are based on hot flue gas measurements while for Norway, the high emission factors for PM2.5, EC and OC for stoves are derived using the Norwegian standard. These factors are thus not directly comparable to other data (e.g. the emission factors developed in this project), but are the ones used in the national Swedish and Norwegian emission inventories. In the Swedish inventory there is also no differentiation between modern and older technology wood boilers or wood stoves.
In the current national inventories, specific assumptions on bad combustion conditions are only used in Norway and Finland. In Norway different emission factors are used for wood burnt in stoves in urban areas compared to in the rest of the country, while in Finland emission factors are weighted taking “bad combustion” into consideration. The Finnish method is very similar to the one proposed in this report, but using country specific shares and factors for “bad combustion”.
In Denmark and Sweden, the national emission factors are assumed to be weighted to include “bad combustion” and represent the national conditions, but no specific shares are currently used in the inventory calculations.
In Table 28 emission measurement results from this project are briefly compared to published data in Klimont et al. (2016), Savolahti et al. (2016) and in Andersen & Hvidberg (2017). The ranges in the table may represent different types of combustion conditions, from nominal conditions to various types of “bad” combustion conditions.
In Klimont et al. (2016) a literature review and summary of published emission factors for particulate matter is available. Savolahti et al. (2016) present emission factors for PM2.5 and BC for residential wood combustion appliances common in Finland. Most of the emission factors are equal to or very similar to those presented as Finnish national emission factors in Table 20 – Table 27, but there is a higher technology differentiation and more appliance types are included in Savolahti et al. There is for example information for conventional and for modern masonry heaters, as well as for conventional and modern sauna stoves (see Table 28). In a recent measurement campaign in Denmark (Andersen & Hvidberg, 2017) four different modern stoves (from 2010–2014) were fired under different operational conditions. Two of the tested parameters were the influence on PM emission levels from fuel moisture and from using too much wood and at the same time reducing the air supply.

64 Emission factors for SLCP emissions from residential wood combustion
The comparison of measurement results from this project and literature data in Table 28 show that the ranges may be rather wide, and that combustion conditions certainly influence emissions. The emission factors and ranges summarised in Klimont et al. (2016), in Savolahti et al. (2016) and in Andersen & Hvidberg (2017) are largely comparable to the results in this project.
Table 28: Comparison of emissions measurement results in this project and literature (mg/MJ). When ranges are given, they may include different types of combustion conditions, both normal and ”bad” conditions
Technology Pollutant This project*
Literature Reference
Older/traditional wood boilers
PM2.5 317–1975 95–1300 (73–2200)** Klimont et al. 2016
Moder wood boilers PM2.5 24–89 44 (11–450)** Klimont et al. 2016
Conventional/traditional wood stove
PM2.5 78–330 90 – 3000 Klimont et al. 2016
-”- BC/EC 7–122 20–72 Klimont et al. 2016
-”- OC 22–127 70–623 Klimont et al. 2016
Modern wood stoves PM2.5 / PM 53–821 36–798 Andersen & Hvidberg, 2017
New/improved/modern wood stove
PM2.5 53–821 22–350 Klimont et al. 2016
-”- BC/EC 3–104 9–88 Klimont et al. 2016
-”- OC 6–441 11–67 Klimont et al. 2016
Masonry heater PM2.5 78–82 93 (19–311) conventional. 33 (23–67) modern
Savolahti et al. 2016
-”- EC / BC 7–22 38 (6–96) conventional 15 (8–55) modern
Savolahti et al. 2016
Sauna stove PM2.5 104–120 (modern)
389 (35–1567) conventional Modern, 50% of conventional
Savolahti et al. 2016
-”- EC / BC 18–28 (modern)
173 (7–330) conventional Modern, 50% of conventional
Savolahti et al. 2016
Note: *Min and max, including all combustion conditions tested. ** Min and max in parenthesis.
In Savolahti et al. (2016) and in Andersen & Hvidberg, (2017) separate factors for “bad combustion” in wood stoves are presented. Savolahti et al. present factors for smoldering combustion conditions in stoves, where the factors are between 2 to approximately 5 times higher than at normal combustion depending on combustion technology. According to Andersen & Hvidberg, (2017) moist wood increases emissions, and also that the emissions of particles could increase by a factor of 2–3 if the stove is loaded with too much wood and with a reduced air supply. These factors are in line with the factors for “bad combustion” derived from measurements in this project (Table 18).

Emission factors for SLCP emissions from residential wood combustion 65
5.4 Factors affecting combustion conditions
The emission factors presented in chapter 5.1 are a basis for developing “real life” factors by assessing and weighing the degree of bad combustion conditions into the basic emission factor derived from nominal heat load and standard fuel conditions. The ratios for “bad combustion” presented in chapter 5.1 are derived from measurements using moist fuel, and from firing at part load (underloading). These are some typical “user mistakes” that increases emissions, but there are also other factors that should be contemplated on when developing national emission factors.
There is no single condition such as “real life operating conditions”. On the contrary there are a number of combinations impacting emission levels, including properties of the stove, properties of the house and its chimney, variation in climatic conditions (even within Scandinavia), variation in stove type, variable quality of the firewood used and perhaps most important of all, the knowlegde of the user. Several of those variables have been taken into consideration in this project, such as the quality of the firewood (dry, standard or moist fuel), overloading (high load) or underloading (part load) the stove/boiler, various valve settings (the tests according to Norwegian standard). Therefore these results are deemed adequately diverse, to allow composition of emission factors for national air emission inventories.
Some factors that are influenced by the user and have an impact on emissions from residential wood combustion are summarised in Table 29.
Table 29: Summary of user influenced factors and their general impact on emissions from residential wood burning, compared to cases with nominal load and standard fuel
Factor General influence on emissions
Moist firewood Increases Overloading by 150% or more Increases Underloading (part load) Increases Smoldering combustion Increases Poor maintenance of equipment Increases Installation error Increases Moderately dry firewood Neutral Efficienct combustion, proper control of air supply Neutral Increased flue draft Decreases Small log size Decreases Upright arrangement of wood logs Decreases Ignition from the top Decreases
In the annex, impacts on emissions arising from operation and the status of maintenance of equipment, from the fuel quality, from user influence during firing, and from the variations in air supply during combustion are discussed in more detail.


Conclusions
In order to improve the national emission inventories of SLCP, and reduce uncertainties, a better understanding of emission factors is essential. Apart from emission factors, also national activity data on technologies, fuel consumption and combustion conditions are important. This project contributes to a better knowledge base for emission factors for PM2.5, EC, OC, CH4, NMVOC and CO from residential wood burning, as well as ratios for increased emissions at “bad combustion conditions”. Bad combustion conditions can be weighted into the national emission factors, depending on national circumstances.
Among the tested boilers, the traditional wood log boilers exhibited the highest emission factors, generally in the order of 5–10 times higher (depending on pollutant) than the modern boilers, the pellet boilers and the wood chip boiler, which were rather comparable. Part load combustion conditions increased the emissions between 2–6 times (or even higher), depending on pollutant and technology, while moist fuel generally increased emissions approximately by a factor of 1.5–2.
Among the stoves the difference in emission factors between technologies were not as pronounced as for the boilers. The highest emission factors were measured from the tiled stoves, followed by the older stove. In comparison to the modern stoves and the sauna stove the emission factors were generally in the order of 1.5–2 times higher from the older/traditional technologies. The pellet stove showed very low emission factors for most pollutants.
Moist fuel had a large effect on PM2.5 and OC emission levels for the modern stoves, 5–8 times, while the emission levels were in principle unaffected by moist fuel combustion in the tiled and masonry stoves. The higher impact from moist fuel in the modern stoves is probably mainly due to limited capacity of the air systems among many modern stoves compared to the older technologies. For the stoves, part load combustion generally increased emissions by 1.5 up to 3.5 times.
Both for the boilers and the stoves the EC emission factors did not correlate with the emission factors for PM2.5. Also, the EC emissions were less affected by moist fuel and part load conditions than most of the other pollutants.
To improve the national emission inventories of SLCPs the large sensitivity to operational conditions (moist fuel and part load) needs to be taken into consideration in national emission inventories, where “real life” emissions are estimated. Country-specific assessments on shares of “bad combustion conditions” are essential to properly weigh bad combustion into the national emission factors.
The measurement results from this project provides a comparison to the default emission factors in the EMEP/EEA Air Emission Inventory Guidebook. The emission factors developed for the wood log boilers (both modern and traditional), as well as for the older technology stoves (older stove, tiled and masonry stoves), are lower than the

68 Emission factors for SLCP emissions from residential wood combustion
default emission factors given in the EMEP/EEA Air Emission Inventory Guidebook. This refers to the emission factors derived from standard operational conditions (nominal load and standard fuel), not taking into account “bad combustion conditions”, which would normally increase the emission factor levels. For the other technologies, the levels are in general more comparable, given that the definitions of technologies do not always match.
When comparing currently used national emission factors in the Nordic countries with those developed from the measurement program in this project, it is obvious that there are sometimes large differences, both between countries and in relation to the measurement results. Individual national emission factors are both considerably higher, or considerably lower, than the measurement results.
The comparison highlights discrepancies in the emission factors between the Nordic countries. Some of the differences between current national factors are due to that they are based on measurement results derived using different measurement standards (e.g. hot flue gases/diluted sampling, or EN standards/Norwegian standard). In order for national emission inventory results to be comparable, a harmonisation of emission factor levels is needed, unless there are real differences between the countries. The results from this project provides additional knowledge for developing emission inventories that are more comparable between the Nordic countries.
The measurement results and the emission factors developed in this work increases the knowledge base for estimating emissions of SLCPs (and PM2.5) with less uncertainties in the future. However, the measurement program also showed that there can be quite a large variabilty when repeating identical test cases, why additional well designed measurements would add information that can be used for refining the emission factors to reflect reality with higher certainty.

References
Andersen, J. S., Hvidberg, R. L. (2017). Laboratoriemålinger af emissioner fra brændeovne ved forskellige fyringsteknikker (In Danish). Miljøprojekt 1969, 2017. http://mst.dk/service/publikationer/publikationsarkiv/2017/dec/laboratoriemaalinger-af-emissioner-fra-braendeovne-ved-forskellige-fyringsteknikker/
Carlsson, S., Gustavsson, L., Johansson, M., Persson, H., Andersen, J. S., Bjerrum, M., Andersen, K. S., Hvidberg, R. B. (2016). Measurements of Elemental Carbon (EC), Organic Carbon (OC) and other pollutant emissions from residential biomass combustion representative of the Nordic countries. SP Report 2016:06.
EMEP/EEA air pollutant emission inventory guidebook (2016). EEA Report No 21/2016. https://www.eea.europa.eu/publications/emep-eea-guidebook-2016
Jokiniemi et al., (2008). Biomass combustion in residential heating: Particulate measurements, sampling and physiochemical and toxicological characterization. 93 pages. Fine Particle and Aerosol Technology Laboratory, Department of Environmental Science, University of Kuopio.
Karvosenoja, N., Tainio, M., Kupiainen, K., Tuomisto, J. T., Kukkonen, J., Johansson, M. (2008). Evaluation of the emissions and uncertainties of PM2.5 originated from vehicular traffic and domestic wood combustion in Finland. Boreal Environment Research 13: 008 ISSN 1239–6095 (print) ISSN 1797–2469 (online).
Kindbom, K., Fridell, E., Skårman, T., Nielsen, O.-K., Winther, M., Saarinen, K., Lappi, M., Lamberg, H., Kolka Jonsson, P. V., Aasestad, K. (2015). Improved emission inventories of SLCP. Background report. TemaNord 2015:523. Copenhagen: Nordic Council of Ministers. https://doi.org/10.6027/TN2015-523
Klimont, Z., Kupiainen, K., Heyes, C., Purohit, P., Cofala, J., Rafaj, P., Borken-Kleefeld, J., Schöpp, W. (2016). Global anthropogenic emissions of particulate matter including black carbon. Atmos. Chem. Phys. Discuss., https://doi.org/10.5194/acp-2016-880
Pettersson, E., Boman, C., Westerholm, R., Boström, D., Nordin, A. (2011). Stove Performance and Emission Characteristics in Residential Wood Log and Pellet Combustion, Part 2: Wood Stove. Energy Fuels, 2011, 25 (1), pp 315–323. https://doi.org/10.1021/ef1007787
Pietilä, Kai (2005) Batch combustion and adjustment in fireplaces. Oulu University. 130 pages. (In Finnish).
Rakentaja (2016). Article 7489 on website Rakentaja.fi (In Finnish) https://www.rakentaja.fi/artikkelit/7489/puiden_poltto_alkaa.htm
Savolahti M., Karvosenoja N., Tissari J., Kupiainen K., Sippula O. & Jokiniemi J. (2016). Black carbon and fine particle emissions in Finnish residential wood combustion: Emission projections, reduction measures and the impact of combustion practices. Atmospheric Environment 140 (2016) 495–505. https://doi.org/10.1016/j.atmosenv.2016.06.023
Seljeskog, M., Goile, F., Skreiberg, Ø. (2016). Recommended revisions of Norwegian emission factors for wood stoves. The 8th Invernational Conference on Applied Energy – ICAE2016. Energy Procedia 00 (2016) 000–000.
SPECIATE. https://www.epa.gov/air-emissions-modeling/speciate-version-45-through-32 , accessed, 11 October 2016.
Tissari J. et al. (2005). Particle emissions from combustion of wood. Final report 2/2005. University of Kuopio (In Finnish).
UEF, University of Eastern Finland. Measurement results in PUPO database https://www.uef.fi/web/fine/pupo-database
UEF (2005) University of Eastern Finland, Information on emissions from wood combustion http://www.oppi.uef.fi/wanda/pupo/info.html (In Finnish).

70 Emission factors for SLCP emissions from residential wood combustion
Valvira (2008) – Puun poltto-opas. Puun pienpolttoa koskevat terveydelliset ohjeet. Valvira Oppaita 6/2008. 30 p. In Finnish.

Sammanfattning
Den övergripande målsättningen för detta projekt är att förbättra de nordiska ländernas emissionsinventeringarna av kortlivade klimatpåverkande luftföroreningar (Short-Lived Climate Pollutants, SLCP). Som ett första steg i projektet genomfördes och rapporterades en bakgrundsanalys (Kindbom m.fl., 2015). Där summeras nuvarande rapporterade emissionsnivåer och status för de nordiska emissionsinventeringarna. Rapporten lägger också grunden för det mätprogram som genomförts och rapporteras i detta andra steg av projektet.
För att minska osäkerheterna och förbättra de nationella nordiska emissionsinventeringarna av SLCP är det viktigt med en bättre förståelse för emissionsfaktorer vid utsläpp till luft från småskalig biomassaförbränning. Förutom emissionsfaktorer är även förbättrad kunskap om aktivitetsdata viktigt, d.v.s. vilka teknologier som används, deras bränsleförbrukning och vilka förbränningsförhållanden som råder. Förbättring av aktivitesdata har inte studerats i projektet..
De genomförda emissionsmätningarna bidrar till en bättre kunskap om emissionsfaktorer till luft för PM2.5, EC, OC, CH4, NMVOC och CO från småskalig biomassaförbränning. Genom att även mäta vid icke optimala förbränningsförhållanden har faktorer för ökade emissioner vid ”dålig förbränning” tagits fram. Dessa faktorer kan anpassas till nationella förhållanden genom att vägas in i de nationella emissionsfaktorerena.
Emissionsmätningar genomfördes på kaminer och pannor som är representativa och förekommer i bostadshus i de nordiska länderna. Det är stor skillnad på vilka teknologier som är allmänt förekommande i de olika nordiska länderna, men de vanligaste teknologierna ingick i mätprogrammet.
Mätningar gjordes enligt EN-standarder för pannor och kaminer. Några kaminer testades även enligt Norsk standard. Provtagning av PM2.5, EC och OC gjordes i spädtunnel och inte i varma rökgaser (d.v.s. i proverna ingår kondenserbara ämnen).
I de nationella inventeringarna saknas oftast detaljerad kunskap om beståndet av teknologier. De teknologier som testades grupperades därför efter likheter i teknologi och emissionsnivå, i syftet att ta fram emissionsfaktorer som är anpassade för tillgängliga aktivitetsdata.
De äldre typerna av teknologier visade generellt högre emissionsnivåer än modernare utrustning. Till exempel mättes emissionsnivåer som var 5–10 gånger högre (beroende på ämne) från en traditionell vedpanna än från moderna ved- eller pelletspannor. Bland kaminerna var skillnaden generellt inte lika stor, med upp till 2 gånger högre emissionsnivåer från äldre teknologier (kakelugn, äldre järnkamin) jämfört med moderna vedkaminer.
Förutom de testförhållanden som föreskrivs i EN-standarder undersöktes även emissionsnivåer vid icke optimala förbränningsförhållanden. Detta gjordes för att

72 Emission factors for SLCP emissions from residential wood combustion
fånga variationer i emissioner som beror på olika sätt att elda. Standardförhållandena, d.v.s. nominell last och bränsle med föreskriven fukthalt (standardbränsle), utökades mätprogrammet och inbegrep även tester med fuktig ved eller vid del-last (för litet bränsleinlägg för att få optimal förbränning). Ett fåtal tester gjordes även med torrareved eller med för stora vedinlägg.
Förbränning med för lite ved i pannorna (del-last) medförde mellan 2–6 gånger högre emissioner, medan fuktig ved gav emissionsnivåer som var 1.5–2 gånger högre än vid standardförhållanden. De moderna kaminerna var känsliga för fuktig ved, där emissioner av t.ex. PM2.5 och OC var i storleksordningen 5–8 gånger högre än då standardbränsle användes. De äldre teknologierna, kakelugn och murad ugn (masonry stove), var å andra sidan knappt påverkade av fuktig ved och nivåerna på emissioner var jämförbara med förbränning med standardbränsle. Den högre inverkan av fuktig ved i moderna kaminer beror troligtvis på begränsad kapacitet i luftsystemen i många moderna kaminer. För kaminerna innebar förbränning med för lite bränsle generellt 1.5–3.5 gånger högre emissioner. Den påtagliga känsligheten för förbränningsförhållanden (fuktig ved, icke optimal bränslemängd) betyder att detta behöver tas hänsyn till i nationella emissionsinventeringar där ”verkliga” emissioner ska beräknas. Andelen ”dålig förbränning” behöver uppskattas i varje land för att kunna väga in dessa förhållanden i de nationella emissionsfaktorerna.
I testresultaten var det tydligt att emissioner av EC inte korrelerar med emissioner av PM2.5, och även att emissioner av EC påverkades i mindre utsträckning av ”dålig förbränning” än de flesta andra ämnen som mättes. I litteraturen anges i många fall emissionsfaktorer för EC som en andel av emissionsfaktorn för PM2.5. Resultaten från mätningarna visar att detta inte stämmer med verkligheten.
En jämförelse mellan nationella emissionsfaktorer och resultaten från mätningarna visar att det ibland är stora skillnader. Det finns exempel på nationella emissionsfaktorer som är betydligt högre eller betydligt lägre än mätningarnas resultat.
Jämförelsen visar också stora skillander i nuvarande emissionsfaktorer mellen de nordiska länderna. En av anledningarna är att de nationella faktorerna är baserade på resultat från mätningar som gjorts med olika (godkända) mätstandarder (t.ex. i varma rökgaser eller i spädtunnel, enligt EN-standard eller Norsk standard). Om det inte är så att det föreligger verkliga skillnader mellan länderna behöver nivån på emissionsfaktorer harmoniseras för att resultaten från de nationella inventeringarna ska vara jämförbara. Resultaten från de redovisade mätningarna bidrar med kunskap för att kunna utveckla emissionsinventeringar som är mer jämförbara mellan de nordiska länderna.
Mätresultaten och de emissionsfaktorer som tagits fram i detta projekt ökar kunskapsbasen för att minska osäkerheten vid beräkning av emissioner av SLCP (och PM2.5) i framtiden. Mätprogrammet visade dock också att det kan vara ganska stor variation när identiska tester upprepas. Det innebär att fler, väl designade, mätningar skulle bidra med ytterligare information som kan användas för att förbättra emissionsfaktorerna så att de reflekterar verkligheten med ännu högre säkerhet.

Annex
Factors affecting combustion conditions
Operation and maintenance of equipment
Even an advanced equipment can be operated in a way to release high emissions. In general, modern equipment is easier to operate due to better air systems, firebox insulation and easier valve control. In addition, modern stoves/boilers have various degrees of automation onboard, which enables them to adapt to and to control the combustion parameters depending on the conditions of the combustion at any time.
The equipment should always be used according to the specific instructions. This ensures efficient and optimised combustion conditions. Efficient combustion decreases emissions and also keeps the equipment cleaner as less soot is generated on the surfaces of the combustion chamber and channels. Ash in the combustion chamber impacts the air circulation of combustion air and flue gases and increases particle emissions. When the combustion efficiency is low, the heat content of the fuel is not fully utilized causing higher emissions per energy unit and thus also extra fuel costs.
To maintain an even efficiency, regular sweeping of the surfaces is needed. In some modern pellet boilers, automatic sweeping is arranged in the convection space of the boiler. In stoves and fire places, regular removal of ashes from the grate is necessary to ensure air flow from below and to minimize particle emissions. Chimney sweeping should in all cases be carried out regularly.
Over time the equipment may be worn and in need of repair in order to maintain efficient combustion conditions. In some types of stoves gaskets and firebox insulation material deteriorate over time and have to be replaced regularly (depending on the intensity of the use of the stove). Broken or missing firebox insulation bricks leads to colder combustion, which in turn lead to higher emissions. For boilers where air supply is optimized through automatization, for example a leaking door will allow plenty of air to unintentionally enter into the firebox and counteract the control of the combustion with the valve system.
Fuel quality
The fuel log size, its density, moisture and chemical properties4 impact emissions. To maximize the energy output from wood and to minimize emission levels, only dry and clean wood should be combusted, and not contaminated wood or waste.
4 Ash content and composition.

74 Emission factors for SLCP emissions from residential wood combustion
The moisture content of wood has been identified as the most important factor related to the efficiency of burning, i.e. production of heat. For optimal conditions the wood fuel moisture should be within a range of typically 12–20%. Firewood having higher moisture content is hard to ignite. As long as the wood is moist some of the produced heat during combustion is used to evaporate the moisture and the pyrolysis will not be strong enough to enable the temperature to rise sufficiently high to ensure complete combustion and thus some non-carbonized wood remains. An increase of moisture content of wood from 9% to 25% decreases the efficiency of burning by 7% (Pietilä, 2005). The measured particle emissions when burning moist wood compared to dry wood are 2–3 fold (Tissari et al., 2005, UEF, and current measurement campaign).
Results of the current measurement campaign show strong indications that old stoves that have a higher capacity in the air system are better able of burning moist firewood than modern stoves with limited capacity. Both the amount of air and the ability to supply plenty of primary air seems beneficial to burning moist firewood. According to UEF (2005) if moist wood is combusted, it should be combusted during the last batch.
It was also noted in the current measurement campaign that moderately over-dried firewood (8–12%) does not have any significant adverse influence on the emissions. It is generally recognized that extremely dry firewood (0–5%), e.g. waste wood from industrial manufacture of windows or floors, is too dry to burn properly and is likely to cause excessive emissions of soot (Carlsson et al., 2016).
The user can influence the moisture content of wood by ensuring suitable storage conditions for long enough time before use. Storage facilities outdoors should be protected from rain and excess moisture, allowing for air circulation in the wood pile. When freshly cut the moisture content of wood is around 50% which should be decreased to below 20% before combustion. Wood should be taken indoors some days before it is used to decrease moisture and to adjust the temperature of the wood. (VALVIRA, 2008)
User influence during firing
Ignition Manually fed wood boilers are best ignited using a small amount of small size dry logs, while creating good draught (to quickly raise the temperature) by opening the bypass damper and keeping the lid partly open until the fire has properly lit up (Rakentaja, 2016).
In stoves, ovens and fireplaces ignition from the top has been identified to create 15% less emissions than ignition from the bottom (UEF).
Fuel batch sizes and quantity of fuel Modern stoves are optimized for moderate to low heat generation. Typically, a modern stove is tested to 5 kW nominal heat output, corresponding to a burn rate of approximately 1 kg firewood per hour. In modern, well insulated dwellings this is sufficient to maintain comfort temperature. In the modern stove the capacity of the air system is downsized compared to older technologies. At the NS3058 particle test,

Emission factors for SLCP emissions from residential wood combustion 75
earlier most stoves were able to enter the higher burn rates 3 (>1,9 kg firewood/h) and 4 (> 2,8 kg/h). Nowadays, in modern stoves, it is quite common that the uppermost burn rate attainable is burn rate 2 (>1,25 kg/h).
The optimal batch size depends on the appliance used. As a rule-of-thumb, 1 kg of wood per 100 kg of equipment mass can be burned in a heat storing stove. For instance, for masonry stoves, typical fuel loads are 10 kg wood/1000 kg of stove mass (UEF 2005, VALVIRA 2008). Overloading a stove leads to shortage of combustion air, which in turn leads to higher emissions.
Small batch sizes seem to lead to lower efficiency due to non-optimal air supply. The small combustion area does not cover the grate completely and therefore primary air flow passes the batch without reaction and cools the batch. Also, high carbon monoxide levels have been measured while carbon dioxide levels are low (Pietilä 2005).
Wood log size The optimal log size of the wood depends on the appliance used, however, smaller log size generally leads to lower emissions. The optimal diameter of wood logs has been identified to be around 10 cm.
Compared to larger log size ( > 50 cm length), combustion of small size wood logs contributes to more complete combustion in higher temperature, giving shorter burning times. The greater surface area of small logs increases heat transfer velocity and thus leads to increased pyrolysis. Small log size is also beneficial when burning moist wood because it promotes strong enough combustion for complete burning of the logs.
Using smaller batches and larger log sizes tends to lead to unburnt wood remaining in case other factors affecting the combustion are not optimized to meet those conditions.
Arrangement of logs in manually fed appliances The gasification of wood can be optimized using compact or loose arrangement of logs in the combustion chamber. Compact arrangement decreases the velocity of gasification while a loose setting increases the velocity. During the last batch in a burn cycle, there may be a need to restrict gasification by closing the air inlet and by using a compact arrangement and larger log sizes. The leading principle is that the wood logs should not be placed tightly against the wall, which will prevent air circulation. Upright arrangements of wood logs has been identified to decrease emissions by approximately 10% compared to horizontal arrangement in most stoves (UEF 2005).
Optimizing the air supply
The combustion process is not steady and conditions vary largely during the different phases of a burn cycle. Optimal air demand in wood combustion appliances varies depending on the appliance technology, the stage of combustion and the quality and quantity of the fuel. A feed of secondary air helps to control carbon monoxide and gas phase hydrocarbons. Optimization of the air supply can be done automatically, through in-built constructions, or by the user.

76 Emission factors for SLCP emissions from residential wood combustion
Automatic optimization of air supply can be mechanisms that measure e.g. carbon monoxide or carbon dioxide concentrations and temperature throughout the combustion process, and optimize the air flow to ensure conditions as favorable as possible for complete combustion.
Inbuilt constructions in the combustion equipment are used to improve the air feed and to optimize draught. Natural draught is impacted by the pressure difference of the combustion chamber and the chimney, therefore the height of the chimney needs to be optimized for the building and the combustion equipment (Jokiniemi et al., 2008). At tests carried out as part of a Finnish project (Jokiniemi et al., 2008) the measurements were made at a fixed (low) flue draft of -12 Pa to mimic worst case draught conditions. Most chimneys build up higher flue draft, 20 Pa or more, if only the chimney is 3–4 m high.
Leaks in the system (e.g. at the entry of the connecting fluepipe into the chimney) may arise due to installation errors. In such a case fluedraft is impacted, leading to potentially reduced combustion quality.
The colour of the flue gas indicates if the natural draught is sufficient, where light or transparent flue gas contains only evaporated moisture and hydrocarbons. In case of bad draught or too moist wood the colour is dark grey or black and contains unburnt material.
The combination of moist firewood and a non-optimal-height (too low) chimney increases emissions. If instead the draught of the chimney is improved, this increases air supply which is beneficial for combustion of moist wood.
In case the flue draft is too high the burn rate is often accelerated towards higher heat output. If excessively high flue draft is a permanent problem, it can be dealt with by installing a flue draft regulator in the chimney. Conversely, if the flue draft is generally too low, it can be dealt with by installing an flue gas fan on top of the chimney.
The user can manually (a) improve combustion conditions by increasing or decreasing the air flow to the combustion chamber and (b) improve draught by adjusting the ventilation in the room by e.g. turning room ventilation device into “fireplace mode”, when such a mode is available, shutting off kitchen hoods and opening windows in the room where the combustion appliance is.
Smoldering combustion above all occurs if the air valve is throttled while there is still unburnt firewood. This might happen if the user attempts to control heat output by throttling the valve rather than reducing the fuel load.
The amber phase air supply arrangements have the second largest impact on combustion efficiency after wood moisture content (Pietilä, 2005). The amber remaining towards the end of a firing cycle burns slowly. In the amber the combustion reaction occurs in the solid coal and not between gaseous components as in the earlier combustion phases. The amber phase should be minimized to minimize heat losses through the chimney. Secondary air inlets and the lid can be closed, to allow only the flow of primary air. When the amber is almost finished, air flow to the chimney can be closed, however, the remaining amber may not include any unburnt wood in order to avoid incomplete combustion.

EMISSION FACTORS FOR SLCP EMISSIONS FROM RESIDENTIAL WOOD COMBUSTION IN THE NORDIC COUNTRIES
Emission inventories of Short Lived Climate Pollutants (SLCP), and especially of Black Carbon are uncertain and not always comparable between countries. Comparable and reliable emission inventories are essential when aiming for efficient strategies and policies for reduced emissions.
The overall objective of this project is to improve the Nordic emission inventories of SLCPs. This report presents the results from the second phase of the project, emission measurements of SLCP and particulate matter from residential wood combustion. Measurements were done on residential biomass combustion appliances representative for the Nordic countries, covering elemental carbon (EC), organic carbon (OC), particulate matter (PM2.5), methane (CH4) and non-methane volatile organic compounds (NMVOC). Emission factors were developed for standard combustion conditions, as well as for poor combustion conditions.
Nordic Council of MinistersNordens HusVed Stranden 18DK-1061 Copenhagen Kwww.norden.org
EMISSION FACTORS FOR SLCP EMISSIONS FROM RESIDENTIAL WOOD COMBUSTION IN THE NORDIC COUNTRIES
Improved emission inventories of Short Lived Climate Pollutants (SLCP)
TemaN
ord 2017:570 Em
ission factors for SLC
P emissions from
residential wood com
bustion in the Nordic countries