Embed Size (px)
Citation preview

Presentation Title 1
Emirates NBDQ1 2020 Results Presentation
20 April 2020 2019

2
Important Information
Disclaimer
The material in this presentation is general background information about Emirates NBD's activities current at the date of the
presentation. It is information given in summary form and does not purport to be complete. It is not intended to be relied upon as
advice to investors or potential investors and does not take in to account the investment objectives, financial situation or needs of any
particular investor. These should be considered, with or without professional advice when deciding if an investment is appropriate.
The information contained here in has been prepared by Emirates NBD. Some of the information relied on by Emirates NBD is
obtained from sources believed to be reliable but does not guarantee its accuracy or completeness.
Forward Looking Statements
It is possible that this presentation could or may contain forward-looking statements that are based on current expectations or beliefs,
as well as assumptions about future events. These forward-looking statements can be identified by the fact that they do not relate only
to historical or current facts. Forward-looking statements often use words such as anticipate, target, expect, estimate, intend, plan,
goal, believe, will, may, should, would, could or other words of similar meaning. Undue reliance should not be placed on any such
statements because, by their very nature, they are subject to known and unknown risks and uncertainties and can be affected by
other factors that could cause actual results, and the Group’s plans and objectives, to differ materially from those expressed or implied
in the forward-looking statements.
There are several factors which could cause actual results to differ materially from those expressed or implied in forward looking
statements. Among the factors that could cause actual results to differ materially from those described in the forward-looking
statements are changes in the global, political, economic, business, competitive, market and regulatory forces, future exchange and
interest rates, changes in tax rates and future business combinations or dispositions.
Emirates NBD undertakes no obligation to revise or update any forward looking statement contained within this presentation,
regardless of whether those statements are affected as a result of new information, future events or otherwise.

3
Emirates NBD maintains strong balance sheet and good profitability despite increased impairments in Q1-20
Key Metrics 2020 Macro themes
Financial & Operating Performance
Q1 20202020
Guidance
Profit
Net ProfitAED 2.1 Bn+3% q-o-q -24% y-o-y
NIM 3.02% 2.55-2.65%
Cost to income 29.8% 33%
Credit QualityNPL Ratio 5.5% Increasing
Coverage Ratio 120.5% Strong
Capital
CET 1 14.8%
Tier 1 16.8%
CAR 17.9%
LiquidityLCR 149.7%
ADR 94.8% Increasing
Assets Loan Growth 1%mid-single
digit
Regional Global
• Strong regulatory and government support to mitigate effects of COVID-19
• Strong measures byGovernments and Central Banks to provide additional liquidity and supportfor businesses affected by COVID-19
• Unprecedented economic impact expected due to COVID-19
• Prolonged low oil price and contraction in non-oil private sector
• Sharp GDP contraction expected in 2020
• Financial market volatility and slowing global trade

4
Q1 2020 Financial results highlights
Highlights Key performance indicators
• Net profit of AED 2,081 Mn was down 24% y-o-y, or 43% excluding
DenizBank, mainly due to higher provisions. Net profit up 3% q-o-q
• Results include DenizBank revenue of AED 2,255 Mn and net profit
of AED 504 Mn
• Net interest income improved 45% y-o-y on loan growth and higher
NIMs from DenizBank and declined 3% q-o-q as lower interest rates
fed through to the loan book
• Excluding DenizBank net interest income declined 1% y-o-y on
lower interest rates in Q1-20 partially offset by 6% loan growth
• NIMs of 3.02% improved 19 bps y-o-y helped by the positive impact
from DenizBank and declined 9 bps q-o-q
• Non-interest income improved 48% y-o-y and 8% q-o-q on account
of higher core fee income
• Excluding DenizBank non-interest income declined 4% y-o-y due to
lower fee, commission and investment securities related income
• Costs increased 47% y-o-y due to the DenizBank acquisition, or
increased 2% excluding DenizBank
• Costs improved 18% q-o-q on lower staff and marketing expenses
and improved cost management by DenizBank
• Impairment allowance of AED 2,558 Mn increased 349% y-o-y and
24% q-o-q due to higher stage 1 and 2 ECL allowances. Excluding
DenizBank impairment allowances increased 177% y-o-y
• NPL ratio settled at 5.5% in Q1-20
• LCR of 149.7% and AD ratio of 94.8% demonstrate the Group’s
healthy liquidity position
• Net cost of risk increased to 210 bps in recognition of the potential
deterioration in credit quality in subsequent quarters related to the
COVID-19 pandemic
AED Bn 31-Mar-20 31-Mar-19 % 31-Dec-19 %
Total assets 691.7 525.8 32% 683.3 1%
Loans 443.0 337.7 31% 437.4 1%
Deposits 467.2 359.4 30% 472.2 (1)%
LCR (%) 149.7% 198.8% (49.1)% 160.0% (10.3)%
ADR (%) 94.8% 94.0% (0.8)% 92.6% (2.2)%
NPL ratio (%) 5.5% 5.9% 0.4% 5.6% 0.1%
AED Mn Q1-20 Q1-19Better /
(Worse)Q4-19
Better /
(Worse)
Net interest income 4,936 3,400 45% 5,065 (3)%
Non-interest income 1,948 1,317 48% 1,812 8%
Total income 6,885 4,717 46% 6,877 0%
Operating expenses (2,049) (1,397) (47)% (2,501) 18%
Pre-impairment operating
profit 4,836 3,320 46% 4,377 10%
Impairment allowances (2,558) (570) (349)% (2,064) (24)%
Operating profit 2,278 2,750 (17)% 2,313 (2)%
Share of profits from
associates0.1 27 (100)% 2 (94)%
Gain on bargain purchase - - n/a (50) n/a
Taxation charge (197) (34) (479)% (245) 20%
Net profit 2,081 2,743 (24)% 2,020 3%
Cost: income ratio 29.8% 29.6% (0.2)% 36.4% 6.6%
Net interest margin 3.02% 2.83% 0.19% 3.11% (0.09)%
Financial & Operating Performance

5
Net interest income
• Q1-20 NIM of 3.02% increased 19 bps y-o-y as higher margins from
DenizBank coupled with improved deposit and funding costs offset the
reduction in loan yields
• Excluding DenizBank, Q1-20 NIM of 2.56% declined 27 bps y-o-y as
lower loan yields offset the benefit from lower deposit cost
• NIM declined 9 bps q-o-q as the reduction in loan yields and DenizBank
margins offset the impact of lower deposit cost
• Loan yields declined 70 bps y-o-y and 22 bps q-o-q which offset the
improved deposit cost of 28 bps y-o-y and 15 bps q-o-q
• NIM guidance revised down to 2.55-2.65% as recent decline in interest
rates start to flow through to the loan book in subsequent quarters and
DenizBank assets reprice
Q1-20 vs. Q1-19 Q1-20 vs. Q4-19
Net Interest Margin (%)
Net Interest Margin Drivers (%)
Highlights
0.15(0.22)
3.11
0.01
Q4 19 Loan Yield Deposit
Cost
Treasury
& Other
(0.03)
DenizBank Q1 20
3.02
2.782.68
Q1 18
2.87
2.81
Q4 19
2.82
Q2 18 Q3 18
2.72
2.85
2.82
3.02
Q4 18
2.83
Q1 19
2.77
Q2 19
2.892.83
2.82
Q3 19
3.023.11
Q1 20
Qtrly NIM YTD NIM
Financial & Operating Performance
0.28
0.15
0.46
Q1 19
(0.70)
Loan Yield Deposit
Cost
Treasury
& Other
ENBD Ex-
DenizBank
DenizBank Q1 20
2.83
2.56
3.02

6
Funding and liquidity
• Q1-20 LCR of 149.7% and AD ratio of 94.8% demonstrate the Group’s
continuing healthy liquidity
• Liquid assets* of AED 112 Bn as at Q1-20 (18% of total liabilities and
24% of total deposits)
• During Q1-20, AED 9.1 Bn of term debt issued in five currencies
through two public issues and private placements with maturities out
to 20 years
• 78% of the term liabilities maturing in 2020 re-financed during Q1-20
covering maturities through to July; Only AED 2.6 Bn remaining to be
re-financed
Highlights Advances to Deposit and Liquidity Coverage Ratio (%)
Maturity Profile of Debt Issued (AED Bn)Composition of Liabilities/Debt Issued (%)
*Including cash and deposits with Central Banks but excluding interbank balances and
liquid investment securities
6.28.5
9.8
2.6 2.3
4.0
6.0
7.22.1
7.3
2020 2026 -
- 2035
202520242021 2022 2023 Beyond
2035
8.4
15.8 DenizBank
Club Deal
Public & Private Placement
Maturity Profile of Debt/ Sukuk Issued AED 56.0 Bn
Financial & Operating Performance
152.9 158.7
196.5 195.3 198.8188.8
149.3160.0
149.7
0
50
100
150
200
250
Q4 19Q1 18 Q2 18 Q1 19Q4 18Q3 18 Q2 19 Q3 19 Q1 20
Customer deposits
76%
Banks9%
Others6%
EMTNs7%
Syn bank borrow.
1%
Loan secur.0.1%
Sukuk1%
Debt/Sukuk9%
Liabilities (AED 612.4 Bn) Debt/Sukuk (AED 56.0 Bn)
LCR (Min. limit 100)
93.8 94.495.2
94.3 94.0
92.1 91.892.6
94.8
90
95
100
AD Ratio
LCR (%) AD Ratio (%)

7
Loan and deposit trends
Highlights Trend in Gross Loans by Type (AED Bn)
• Gross loans grew 2% since start of the year with growth across
operating segments
• Corporate lending grew 3% from end 2019 due to growth in financial
institutions sectors
• Consumer lending down 5% from end 2019 due to decline in credit
cards and private banking activity
• Islamic financing grew 3% from end 2019 due to growth across a
range of sectors
• CASA deposits represent 46% of total Group level deposits
• Domestic CASA engine remains strong at 54% (including Islamic)
Trend in Deposits by Type (AED Bn)
* Gross Islamic Financing Net of Deferred Income
53 54 55 55 56 57 57 58 60
36 37 37 41 42 41 42 43 41
86 87 86
Q4 19Q2 19
355
Q3 19
364
Q1 19 Q1 20
259267 273 279 288
351
252
467 474
Q2 18
343
Q3 18Q1 18
258
Q4 18
365337
266
249
458
+30%
+2%DenizBank
Corporate
Consumer
Islamic*
188 182 176 176 183 183 180 180 190
137 146 159 165 170 177 182 188 178
99 98 93
Q2 18 Q4 18
6
Q3 18
7
472
7
Q1 19
7 7335
Q3 19
6
Q4 19
6
Q1 20
367
Q1 18
467
Q2 19
7 7
468
332 341 348 359
+30%
-1%CASA
DenizBank
Other
Time
Financial & Operating Performance

8
Loan composition
Net Loans by Geography Q1-20
Financial & Operating Performance
2%
23%
75%
UAE
GCC
International
93%
5%
UAE 2%
International
GCC
42%
32%
15%
11%
Sovereign
Corporate
Islamic
Retail
34%
37%
16%
Sovereign
Corporate
13%Islamic
Retail
Note: Gross loans include Islamic financing gross of deferred income
**Others include Mining & quarrying (and Agriculture for Islamic Loans)
5%
4%
4%
3%
18%
11%4%
34%
7%Fin Institutions2%
3%
Personal
4%
Services Real estate
AgricultureConstruction
Hotels and restaurants
Manufacturing
Mgmt of Cos
Others **
Sovereign
Trade
2%
Trans. & com.
5%
4%
4%
18%
13%
42%
7% 0%
Agriculture
1%2%
3%
Trans. & com.Construction
Fin InstitutionsHotels and restaurants
ManufacturingSovereign Mgmt of Cos
Others **
Personal
Real estate1%
Services
Trade
1%
Gross Loans by Segment Q1-20 Gross Loans by Sector Q1-20
Net Loans by Geography Q1-19 Gross Loans by Segment Q1-19 Gross Loans by Sector Q1-19

9
• During Q1-20 NPL ratio stable at 5.5%
• Coverage ratio improved significantly by 8.2% to 120.5% on higher expected
credit loss overlay related to COVID-19
• Net cost of risk increased to 210 bps (430 bps for DenizBank and 161 bps
Emirates NBD only) on higher net impairment charge of AED 2,558 Mn
• AED 356 Mn of write backs & recoveries in Q1-20 compared to AED 331 Mn
during same period last year
• Stage 1 & 2 ECL allowances amount to AED 10 Bn or 2.6% of CRWA
• Provisions will be reviewed regularly as the impact of COVID-19 becomesmore apparent
Impaired Loans* Impairment Allowances
Highlights Impaired Loan & Coverage Ratios (%)
Impaired Loans and Impairment Allowances (AED Bn)
6.0 6.0 5.8 5.9 5.9 5.94.8 5.6 5.5
Q2 18
127.9
Q1 18
127.3
Q3 18
126.6
Q4 18
128.4127.4
123.9
Q1 19
125.8
Q2 19 Q3 19
112.3
Q4 19
120.5
Q1 20
NPL ratio
Coverage ratio
15.2
Q3 19
0.85.4 5.4
0.9
Q1 19
15.2
0.2
16.115.5
0.8
5.5
4.2 4.3
16.1
0.74.9
26.0
Q1 20
0.9
4.9
26.1
Q2 19 Q4 19
22.021.4 21.5
+0%
+22%
DenizBank Core Corporate IslamicRetail
26.5
20.2
1.25.7
0.5
1.2
20.6
1.25.7
Q3 19
1.3
Q1 19
21.2
5.4
Q4 19
22.4
2.1
1.25.7
19.8
Q1 20
1.2
Q2 19
5.5
31.5
27.128.0 29.2
+8%
+19%
Credit quality
Financial & Operating Performance*Includes purchase originated credit impaired loans of AED 2.5 bn (Dec-19: AED 3 bn) acquired at fair value

10
Highlights Impairment allowances and Coverage %
Impairment allowances and Stage 1, 2 and 3 Coverage
Financial & Operating Performance
• Stage 1 coverage ratio improved to 1.2% from 1.1% in Q1-20 as Stage 1
impairment allowances increased to AED 5.2 bn from AED 4.7 bn
• Stage 2 coverage ratio improved to 19.3% from 15% in Q1-20 as Stage 2
impairment allowances increased to AED 4.8 bn from AED 3.6 bn
• Continued strong Stage 3 coverage ratio at 89.3%
• Customers continue to be assessed closely for stage migrations on a
case by case basis under the COVID-19 situation
• The Group has re-assessed scenario weighting to reflect the impact of
current uncertainty in measuring ECLs across portfolios and also applied
additional adjustments for retail exposures to employees of specific
industries most impacted due to COVID-19 such as airlines, hospitality,
retail and tourism
• The increase in the downside weighting of the macro-economic scenario
and the management overlays have resulted in an additional ECL of
AED 878 million for the Group
• The Group has used expert judgement where required to assess the
overlays and will continue to reassess the position and related impact on
a regular basis.
Total Gross Loans (AED Bn)
Q1 2020
4.7
20.9
3.6
2019
4.8
5.2
21.5
29.231.5
Stage 1 Stage 2 Stage 3
*Stage 3 coverage adjusted for purchase originated credit impaired loans acquired at fair value
90.4 89.3
15.0 19.3
1.1 1.2
2019 Q1 2020
ECL Allowances (AED Bn) *ECL to Loan Coverage %
89%5%
6%
Stage 1 Stage 2 Stage 3
89%5%
6%
2019 Q1 2020

11
Non-interest income
• Core fee income up 46% y-o-y due to the DenizBank acquisition
• Investment securities income declined 36% y-o-y mainly due to
changing interest rates
• Non-interest income higher by 8% q-o-q mainly on account of
higher derivative income
• Excluding DenizBank, non-interest income declined 4% y-o-y
on account of lower fee, commission and investment securities
related income
Highlights Composition of Non Interest Income (AED Mn)
Trend in Core Gross Fee Income (AED Mn)
229 340 308
848 883
1,4171,596
1,425
590 575
583441 766
40
155
Q1 20
40
166
Q1 19 Q2 19
47
Q3 19
43
Q4 19
1,644 1,653
2,2762,420
2,551
52
+55%
+5%
Fee IncomeForex, Rates & Other
Trade financeBrokerage & AM fees
Financial & Operating Performance
AED Mn Q1-20 Q1-19Better /
(Worse)
Core gross fee income 2,551 1,644 55%
Fees & commission expense (604) (314) (92)%
Core fee income 1,947 1,330 46%
Property income / (loss) (41) (80) 48%
Investment securities & other income 42 67 (36)%
Total Non Interest Income 1,948 1,317 48%

12
• Q1-20 costs increased 47% y-o-y due to the DenizBank acquisition
• Excluding DenizBank, costs increased 2% y-o-y mainly due to higher
depreciation charges and information technology related costs
• Costs improved 18% q-o-q due to lower staff and marketing expenses
and improved cost management by DenizBank
• The cost to income ratio at 29.8% is within 2020 guidance but is
expected to increase during the year on lower expected income
partially offset by further cost management
Highlights Cost to Income Ratio (%)
Cost Composition (AED Mn)
305 322 473834
510140 145
212
293
254
891 903
1,117
1,286
1,209
78
2,501
59
Q1 19
61
Q1 20Q2 19
1,430
Q3 19
87
Q4 19
76
1,397
1,8802,049
-18%
+47%
Staff Occupancy OtherDepreciation & Amortization
Target
31.331.9
32.329.7 30.3
32.1
31.1 31.5
32.933.5
29.6
31.3
36.4
29.8
Q1 18 Q3 19Q2 18 Q1 19Q3 18 Q4 18 Q2 19 Q4 19 Q1 20
CI Ratio (YTD) CI Ratio
Operating costs and efficiency
Financial & Operating Performance
13
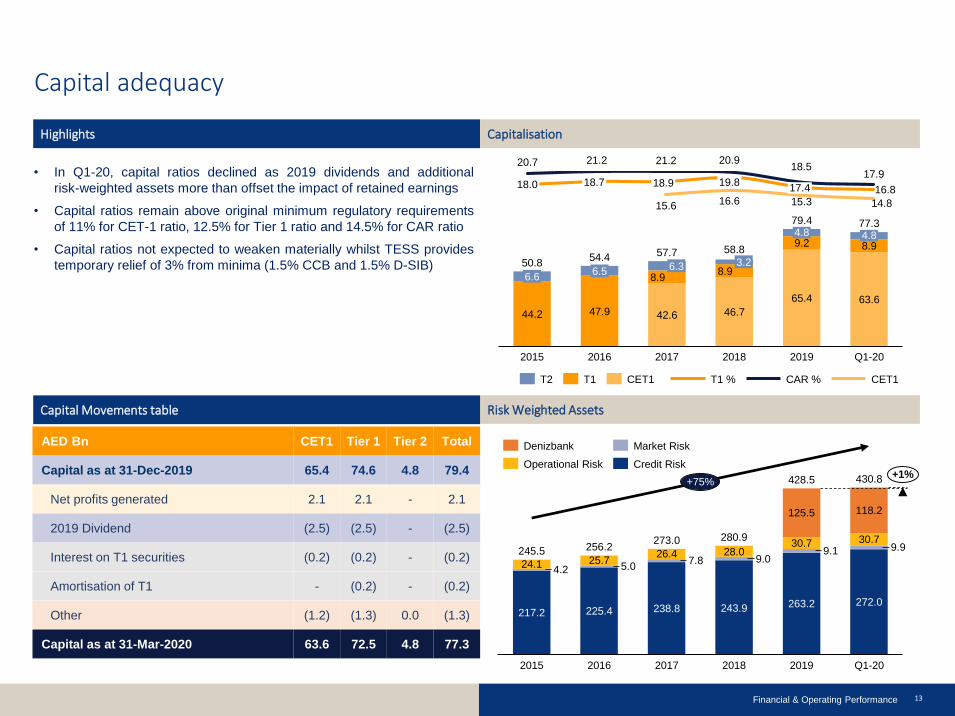
Capital adequacy
• In Q1-20, capital ratios declined as 2019 dividends and additional
risk-weighted assets more than offset the impact of retained earnings
• Capital ratios remain above original minimum regulatory requirements
of 11% for CET-1 ratio, 12.5% for Tier 1 ratio and 14.5% for CAR ratio
• Capital ratios not expected to weaken materially whilst TESS provides
temporary relief of 3% from minima (1.5% CCB and 1.5% D-SIB)
Highlights Capitalisation
Risk Weighted Assets Capital Movements table
AED Bn CET1 Tier 1 Tier 2 Total
Capital as at 31-Dec-2019 65.4 74.6 4.8 79.4
Net profits generated 2.1 2.1 - 2.1
2019 Dividend (2.5) (2.5) - (2.5)
Interest on T1 securities (0.2) (0.2) - (0.2)
Amortisation of T1 - (0.2) - (0.2)
Other (1.2) (1.3) 0.0 (1.3)
Capital as at 31-Mar-2020 63.6 72.5 4.8 77.3
Financial & Operating Performance
16.8
20.7 21.2 21.2 20.918.5
17.9
15.6 16.6 15.3 14.8
18.0 17.418.7 18.9 19.8
44.2 47.9 42.6 46.7
65.4 63.6
8.98.9
9.2 8.9
4.8
3.26.5
6.6
54.46.3
58.8
2015 2016 2017 2018 2019
4.8
Q1-20
50.857.7
79.4 77.3
T1T2 CET1 T1 % CAR % CET1
428.5
26.425.7 7.8
263.2217.2
2015
256.2 30.7
9.0
238.8
5.0
2017
118.2
28.0
2016
243.9
2018
125.5
225.4
2019
9.1
Q1-20
9.9
272.0
4.2
30.7
24.1
245.5273.0
430.8
280.9
+1%+75%
Credit RiskOperational Risk
Denizbank Market Risk

14
Divisional performance (Excluding DenizBank)
Retail Banking & Wealth Management
Emirates Islamic
• RBWM income grew 6% y-o-y due to higher net interest income
backed by increased volumes and higher core fee income
• Liabilities grew by 1% supported by customer campaigns and
customer advances were lower by 3% due to reduced activity
• Low cost CASA to deposit ratio increased to 77% from 75% in
previous quarter
• Cost to Income ratio improved to 24.9% from 27.4% y-o-y
• Relief measures rolled out for customers to minimize the impact
of ongoing COVID-19 pandemic
• EI total income was lower by 3% y-o-y due to a reduction in
non-funded and investment income partially offset by increase in
funded income supported by balance sheet growth
• Total assets reached AED 62.9 billion at the end of Q1-20
• Financing and Investing Receivables increased by 4% to AED 39
billion from end 2019
• Customer deposits at AED 44.8 billion broadly flat from end 2019
• CASA balances represented 66% of total customer accounts
compared with 63% at the end of 2019
• EI’s headline Financing to Deposit ratio stood at 87% and is
comfortably within the management’s target range
Balance Sheet Trends AED Bn Income Trends AED Mn
Balance Sheet Trends AED Bn Income Trends AED Mn
37.5 39.045.3 44.8
Q4 19 Q1 20
+4%
-1%
Financing receivables
Customer accounts
663 691 671
1,320 1,410 1,430
Q4 19Q1 19 Q1 20
1,983 2,100 2,101 0%
+6%
NII NFI
220125 173
444495 468
Q1 19 Q4 19 Q1 20
663620 641 +3%
-3%
NII NFI
Divisional Performance
45.4 43.8
153.2 155.0
Q1 20Q4 19
-3%
+1%
Loans Deposits

15
1,2641,283
Corporate and Institutional Banking
Global Markets & Treasury
• CIB income up 2% y-o-y due to a 7% increase in net interest income mainly
due to growth in lending activity
• Fee income declined 12% y-o-y due to lower lending fee, trade commissions
and treasury sales, partially off-set by increased investment banking activity
• The division continued to spend on digitization programs and technology to
enhance the Transaction Banking Services product offering
• Loans grew 3% during the year with stable momentum in lending activity
• Deposits grew 11% with continued focus on growing CASA balances
reflecting the Group’s aim to reduce the average cost of funding while
maintaining liquidity at an optimum level
• GM&T income declined 95% y-o-y primarily due to the decrease in net
interest income on account of lower interest rates. NFI declined 11% y-o-y
• Trading and Sales desks continued to deliver a solid performance despite
significant market volatility
• During Q1-20, AED 9.1 Bn of term debt issued in five currencies through two
public issues and private placements with maturities out to 20 years
• 78% of the term liabilities maturing in 2020 re-financed during Q1-20
covering maturities through to July; Only AED 2.6 Bn remaining to be re-
financed
Income Trends AED Mn
Income Trends AED MnBalance Sheet Trends AED Bn
269.4 276.6
147.2 163.5
Q4 19 Q1 20
+3%
+11%
DepositsLoans
422 351 373
1,184 1,199 1,271
Q1 19 Q4 19 Q1 20
1,5501,606 1,643 +6%
+2%
NII NFI
98 87
203
-72 -74
Q1 19
8
Q4 19 Q1 20
301
-65
14
-95%
-121%
NII NFI
Divisional performance (Excluding DenizBank)
Divisional Performance

16
7.6 7.8
92.7 96.4
DenizBank Business Overview
Business Overview Financial Highlights
Financial & Operating Performance
AED Mn** Q1-20 Q4-19Better /
(Worse)
Net interest income 1,571 1,665 (6)%
Non-interest income 684 722 (5)%
Total income 2,255 2,387 (6)%
Operating expenses (627) (833) 25%
Pre-impairment operating profit 1,628 1,553 5%
Impairment allowances (981) (924) (6)%
Operating profit 647 630 3%
Taxation charge (143) (218) 35%
Net profit 504 411 23%
Cost: income ratio 27.8% 34.9% 7.1%
Net interest margin 4.92% 5.06% (0.14)%
Segment breakdown
• DenizBank contributed total income of AED 2,255 million and net profit
of AED 504 million to the Bank for the first three months in 2020
• Operating expenses and impairment allowances amounted to AED 627
million and AED 981 million respectively for the same period
• Total assets of AED 128 billion, net loans of AED 84 billion and deposits
of AED 93 billion at the end of Q1-20
• DenizBank is the fifth largest private bank in Turkey with wide presence
through a network of 752 branches and 3,000+ ATMs
• Operates with 708 branches in Turkey and 44 in other territories
(Austria, Germany, Bahrain)
• Full service commercial banking platform of Corporate banking, Retail
banking and Treasury
• Servicing around 14 million customers, through 14,000+ employees
Net Loans as at 31-Mar-20
134.1 127.7
85.5 84.098.2 92.8
Q4-19 Q1-20
Financial Highlights (AED Bn**)
0,08%
59%
41%
All financial numbers post acquisition (1-Aug-19) include the fair value adjustments, unless otherwise stated.
**Metrics converted to AED using spot / average exchange rate for balance sheet / income statement
Corporate Banking
Consumer Banking
Net LoansAssets Deposits AD Ratio(Unadjusted)
NPL Ratio (Unadjusted)

17
Get in touch.
I N V E S T O R R E L A T I O N S
Emirates NBD Head Office I 4th Floor
PO Box 777 I Dubai, UAE
Tel: +971 4 609 3046