Embed Size (px)
Citation preview
8/2/2019 EMG Signals Detection and Processing for on-line Control of Functional Electrical Stimulation
http://slidepdf.com/reader/full/emg-signals-detection-and-processing-for-on-line-control-of-functional-electrical 1/10
Journal of Electromyography and Kinesiology 10 (2000) 351–360
www.elsevier.com/locate/jelekin
EMG signals detection and processing for on-line control of functional electrical stimulation
C. Frigo a,*, M. Ferrarin a, W. Frasson a, E. Pavan a, R. Thorsen b
a Centro di Bioingegneria, Fnd. Don Gnocchi I.R.C.C.S.—Politecnico di Milano, Milan, Italyb Medical Physics and Bioengineering, University College London, London, UK
Abstract
The surface EMG signal detected from voluntarily activated muscles can be used as a control signal for functional neuromuscularelectrical stimulation. A proper positioning of the recording electrodes in relation to the stimulation electrodes, and a proper pro-cessing of the recorded signals is required to reduce the stimulus artefact and the non-voluntary contribution (M-wave). Six orien-tations and six locations of the recording electrodes were investigated in the present work. A comb filter (with and without ablanking windowing) was applied to remove the signal components synchronously correlated to the stimulus. An operative definitionof the signal to noise ratio and an efficiency index were implemented. It resulted that when the recording electrodes were locatedwithin the two stimulation electrodes the best orientation was perpendicular to the longitudinal line. However the best absoluteindexes were obtained when the recording electrodes were located externally of the stimulation electrodes, and in that case the bestorientation was longitudinal. Concerning the filtering procedure, the use of a blanking window before the application of the combfilter, gave the best performance. © 2000 Elsevier Science Ltd. All rights reserved.
Keywords: Surface EMG; FES control; Electrode placement; EMG signal processing
1. Introduction
Surface Electromyogram (EMG) may be aimed atmany different objectives. For example the extraction of features related to patterns of movement [6,15–17,21,22]; the analysis of the force–EMG relationship inparticular conditions [1,3,9]; the co-ordination of muscles activity in a particular motor task [3,15,21]. Inother cases the objective is to identify signs of muscledegeneration or abnormal behaviour [6,11]. Musclefatigue and changes in the Motor Unit Action Potential(MUAPT) propagation mechanism can also be analysedthrough proper modelling and use of statistical indi-cators [8,12].
In most of these applications the signal recording con-ditions can be (and must be) controlled quite carefully.Isometric–isotonic conditions are in general required toavoid motion artefacts, to insure that recording is madefrom a pre-defined portion of the muscle, to guarantee
* Corresponding author. Tel.: +39-02-40308305; fax: +39-02-
4048919.
E-mail address: [email protected] (C. Frigo).
1050-6411/00/$ - see front matter © 2000 Elsevier Science Ltd. All rights reserved.
PII: S1 0 5 0 - 6 4 1 1 ( 0 0 ) 0 0 0 2 6 - 2
signal stationarity, to avoid non linearities connected tochanges in muscle geometry and to movements. Whenmuscle co-ordination is the objective of the study, andthe surface EMG signal is detected in dynamic con-ditions, all the above sources of artefact and non lin-earities are likely to affect the signal. Electrode size andarrangement, signal conditioning, and processing algor-ithms have to be properly selected and optimised in anattempt to reduce these detrimental effects and toimprove the quality of the signal [2,12].
Detection of surface EMG signals in the presence of electrical stimulation presents additional difficultiesbecause the signals delivered by the stimulation elec-trodes can be much higher than the signals generated bythe muscles, and thus can saturate the amplifiers for aconsiderable time. Many examples can be found inliterature [4,5,7,10,18] where different approaches havebeen used to reject stimulation artefacts. However it’srelatively recent [13,14,19] that these techniques havebeen applied in a control scheme for Functional Electri-cal Stimulation (FES). One of the projects our group isworking on concerns the use of volitional EMG signalsto modulate the stimulation strength delivered to para-lysed muscles. A particular application (here named

8/2/2019 EMG Signals Detection and Processing for on-line Control of Functional Electrical Stimulation
http://slidepdf.com/reader/full/emg-signals-detection-and-processing-for-on-line-control-of-functional-electrical 2/10
352 C. Frigo et al. / Journal of Electromyography and Kinesiology 10 (2000) 351–360
‘homologous stimulation’) is that of detecting theresidual activity of a partially paralysed muscle andusing it to control the stimulation of the muscle itself.This is the worst operative condition since the stimu-lation artefact is the dominant component in therecorded signal.
One of the authors of this paper originally designedthe first prototype of a portable device (MeCFES—Myoelectrically Controlled Functional ElectricalStimulator) that included one channel of EMG recording,one channel of stimulation, and a Digital Signal Pro-cessor (DSP). It was designed for the recovery of handgrasping [19]. A new prototype (MuMeCS—Multichan-nel Myoelectrically Controlled Stimulator) has been sub-sequently designed for the application of surface FES tolower limbs, with the purpose of recovering standing up,sitting down, and walking with external support. Sometechniques of stimulation artefact reduction have beenincorporated in the hardware design, and a special fil-tering procedure has been implemented in the DSP.Further enhancement of the signal to noise ratio can beobtained through proper positioning of the recordingelectrodes in relation to the stimulation electrodes. Thispaper presents the effects of different electrodes arrange-ments and filtering procedures on the capability of thesystem to extract the volitional component from the arte-facted EMG signal. The aim of the study was to definethe criteria for an optimal compromise between artefactrejection and voluntary muscle activity detection.
2. Methods
2.1. The multichannel myoelectrically controlled
stimulator (MuMeCS) device description
Fig. 1(A) shows the scheme of the MuMeCS portabledevice. It consisted of two integrated parts: the 4 chan-nels EMG recording unit (differential amplifiers, gain5000, input impedance 10 G) and the 4 channels stimu-lation unit (bi-phasic wave shapes with neutral inter-pulse interval, total duration in the range 20–900 µs, 5–100 Hz frequency range, 0–100 mA current range). Fouranalogic signals (0–3 V) could also be collected fromadditional sensor (foot switches, electrogoniometres) andused in the stimulation control strategy. All the inputsignals were sampled at 1 kHz, converted into a digitalform by an analog to digital (A/D) 12 bits converter, andsent to the Digital Signal Processor (DSP). A digital toanalog (D/A) 10 bits converter provided the signal tothe stimulation unit which in turn controlled the currentdelivered to the isolation unit (electric transformer). Dueto this control scheme the current delivered to the subjectwas load independent. The electric transformer alsoguarantees that no net electrical charge was injected intothe patient.
The stimulation artefacts reduction relied on the fol-lowing features:
(a) fast recovery from input overloads, presented bythe instrumentation amplifiers [20](b) automatic compensation of DC-offset fluctuations
by a non-linear feedback loop [20](c) low stimulator output impedance, by means of theelectric transformer, at a value that is one dimensionorder less than patient’s skin impedance
When the recording electrodes are relatively close to thestimulation electrodes the above features are not suf-ficient for a complete rejection of the stimulus artefact.Fig. 2 shows some examples of signals recorded fromdifferent muscles in the absence of voluntary contractionand during electrical stimulation of the rectus femorismuscle. The stimulation pattern consisted of a positiveand a negative pulse of 0.3 ms duration each, separatedby a neutral inter-pulse interval of 0.3 ms. Pulse ampli-tude was 40 mA and stimulation frequency was 16.67Hz. The surface stimulation electrodes (5×9 cm) werealigned longitudinally to the muscle at an inter-electrodedistance of 16 cm. The recording surface electrodes (0.8cm ) were positioned on the muscle bellies, slightlydisplaced towards the tendon extremity, 3 cm apart, andaligned with the muscle fibres. In this experiment theground electrode was positioned, according to usualpractice, on the wrist. A high pass filter (10 Hz, to avoidbase line oscillations) and the anti-aliasing low-passactive filter shown in Fig. 1 (500 Hz, Bessel, 2nd order)
were applied on the EMG signals before data sampling.It clearly appears that the stimulus artefact is stronglydetected by the electrodes closer to the stimulation site.In addition, the muscle response to the stimulus (M-wave) is present on the stimulated muscle and on thesynergistic ones (vastus lateralis).
2.2. The experimental conditions
The effect of different orientations and locations of the recording electrodes on the signal recorded in thepresence of homologous electrical stimulation wasinvestigated systematically on a healthy subject. Theelectrical stimulation was delivered onto the rectus fem-oris muscle of the left leg, with stimulation electrodespositioned as described above.
The subject seated on a bench with the back supportedby a backrest at 60°. The hip was thus flexed by 60°.The ankle of the testing leg was fastened to a rigid struc-ture that maintained the knee flexed at about 45° andallowed measuring the force (through a strain gauge cell)generated at the ankle by the knee extensor muscles. Thetests were conducted as follows (see Fig. 3):
1. The subject was asked to perform a Maximum Volun-

8/2/2019 EMG Signals Detection and Processing for on-line Control of Functional Electrical Stimulation
http://slidepdf.com/reader/full/emg-signals-detection-and-processing-for-on-line-control-of-functional-electrical 3/10
353C. Frigo et al. / Journal of Electromyography and Kinesiology 10 (2000) 351–360
Fig. 1. (A) Schematic representation of the MuMeCS device. The Digital Signal Processor (DSP) receives the differentially amplified and pre-
filtered signals from the analog to digital (A/D) converter, processes the data on line and sends a stimulation control signal to the digital to analog
(D/A) converter. A personal computer (PC) can interact with the DSP during the testing and set up phases. The stimulation unit is galvanically
isolated from the patient through a low impedance transformer. (B) Recording electrodes arrangement on a hexagonal plate. (C) Schematic view
of the considered placements of the recording electrodes in relation to the stimulation electrodes on the left thigh.
tary Contraction (MVC) for about 4 s, and then, undervisual feedback of the force produced at the ankle, toreduce the contraction to 40% MVC for 4 s and thento relax.
2. An electrical stimulation producing 40% MVC wasthen applied for 6 s. After 2 s from the stimulationonset the subject was asked to increase the force at theankle by an additional 40% MVC through a voluntaryactivation of the knee extensor muscles. Therefore, inthis phase a total of about 80% MVC was achieved.After 4 s the electrical stimulation was switched off while the subject maintained the voluntary contractionfor additional 4 s at 40% MVC.
Stimulation parameters were the same as in the experi-ment described previously apart from stimulation inten-sity that was adjusted to obtain the desired level of mus-cle contraction. In this experiment two stimulation
frequencies were considered: 16.67 and 25 Hz. Thesevalues were chosen because they fall in the range thatis usually adopted for neuromuscular stimulation, andare submultiples of the power line frequency (in Europe50 Hz). This allowed us to reduce the stimulationcomponent and all its multiple frequencies, including thepower line frequency, by applying a single comb filter(see below). At 16.67 Hz stimulation frequency the 40%of MVC was obtained with a current of about 60 mA,while at 25 Hz only 50 mA were required.
The recording electrodes were arranged in threebipolar couples and mounted on a hexagonal plate. Therelative orientation was spaced by 60° [Fig. 1(B)]. Thisallowed us to test the following orientations with respectto the stimulation electrodes: 90°, +30°, 30°. The dis-tance between the two electrodes in each couple was 5cm to allow the ground reference electrode to be locatedin the centre of the plate.

8/2/2019 EMG Signals Detection and Processing for on-line Control of Functional Electrical Stimulation
http://slidepdf.com/reader/full/emg-signals-detection-and-processing-for-on-line-control-of-functional-electrical 4/10
354 C. Frigo et al. / Journal of Electromyography and Kinesiology 10 (2000) 351–360
Fig. 2. Signals recorded on different muscle locations during electrical stimulation of rectus femoris ( I =40 mA, f =16.67 Hz). In (A) the signal
was recorded on the triceps brachialis muscle, in (B) on the erector spinae; in (C) on the gluteus medius; in (D) on the medial hamstrings; in (E)
on the vastus lateralis, and in (F) it was on the same stimulated muscle (rectus femoris). The amplitude scale is in mV. Note that the graphs on
the left side are 10× magnified with respect to those on the right. Signals were only pre-processed by the adaptive gain amplifiers and Bessel anti-
aliasing filter.
The electrodes mounting plate was placed in the fol-lowing locations [see Fig. 1(C)]:
1. in the middle between the two stimulation electrodes2. proximal to the stimulation electrodes (still in line
with them)3. in between the two stimulation electrodes but 4 cm
medially4. as in (3) but 4 cm laterally5. distal–medial to the stimulation electrodes
6. distal–lateral to the stimulation electrodes
For location 1 and 2 the hexagonal plate was also rotatedby 30°, in order to analyse the following three additionalorientations: +60°, 0°, 60°.
2.3. Signal processing and performance indexes
The technique adopted for extracting the voluntaryEMG component from the raw artefacted signal wasbased on the use of a ‘comb’ filter.

8/2/2019 EMG Signals Detection and Processing for on-line Control of Functional Electrical Stimulation
http://slidepdf.com/reader/full/emg-signals-detection-and-processing-for-on-line-control-of-functional-electrical 5/10
355C. Frigo et al. / Journal of Electromyography and Kinesiology 10 (2000) 351–360
Fig. 3. Example of a recording trial on a healthy subject. In (A) the raw EMG signal is reported as detected from the rectus femoris by electrodes
located proximally to the stimulation electrodes (placement 2), and rotated 30° in relation to the longitudinal line. Voluntary contraction about
100% and 40% MVC was produced in a first phase (see the force pattern in D). At time 13 s the electrical stimulation started and lasted 6 s
(heavy horizontal bar in section AD). The force produced was approximately 40% MVC. At time 15 s a voluntary activation was elicited and this
produced an additional force of 40% MVC. At time 19 s the electrical stimulation was switched off, while the subject exerted the same voluntary
force as before (40% MVC). At time 24 s the voluntary force was also terminated. In (B) the signal extracted by the comb filter applied to the
EMG signal of (A) is reported; in (C) the RMS of signal (B) for each inter-stimulus interval is shown.
This filter is a finite impulse response (FIR) filter hav-ing the following expression:
y(n) x(n)− x(n− N Tstm)
2(1)
where:
x(n) is the raw EMG signal at sampling time n
N Tstim is the inter-stimulus time expressed in numberof samples
y(n) is the filtered EMG signal√2 is a scale factor required to keep the same power
in the signal before and after filtering
Two cases were tested and compared:
(a) the above comb filter was applied to the whole
recorded signal(b) a blanking window of 20 ms (during which thesignal was zeroed) was applied after each stimulationpulse, and then the comb filter was applied to theresidual time window. The blanking window wasaimed at directly rejecting the portion of the signalwhere the stimulus artefact and the M-wave werelikely to occur.
The amplitude of the processed signal was quantifiedthrough its RMS value. The latter was computed forevery stimulus (i), by the following expression:

8/2/2019 EMG Signals Detection and Processing for on-line Control of Functional Electrical Stimulation
http://slidepdf.com/reader/full/emg-signals-detection-and-processing-for-on-line-control-of-functional-electrical 6/10
356 C. Frigo et al. / Journal of Electromyography and Kinesiology 10 (2000) 351–360
RMS(i)1
N N
1
yi(n)2 (2)
where
yi(n) is the nth sample of the filtered EMG signal
within each post-stimulus interval (not consider-ing the blanking period)
N is the number of samples considered within thepost-stimulus interval.
Fig. 3(C) shows the time course of the RMS value incorrespondence with the different contraction phases.
In the stationary part of each phase the average RMSvalue was computed. Let’s call:
Y vol the average RMS value in the period (T 3) when
a 40% MVC was produced voluntarilyY stim the average RMS in the period (T 1) when the
same force level was obtained by the electricalstimulation alone
Y stim+vol the average RMS in the period (T 2) when a 40%of MVC was superimposed to an electricallyinduced contraction at a force level of 40%MVC.
Theoretically, Y stim should be zero since no voluntarycomponent is present in T 1, but, as matter of fact,residual noise and not completely removed artefacts canstill be present. Provided that the same stimulationstrength is delivered, we can assume that Y stim holds thesame value even in the presence of voluntary activity.Therefore, the contribution to Y stim+vol due to the volun-tary contraction can be estimated as the differencebetween Y stim+vol and Y stim. According to our objective,for a given level of voluntary contraction superimposedto the electrical stimulation, an optimal combination of electrodes arrangement and filtering procedure should beable to detect all the voluntary EMG component and toreject all the components associated to the stimulus arte-fact. We defined an Operative Signal to Noise Ratio
(OSNR) with the purpose of quantifying this capability:
OSNRY stim+vol−Y stim
Y stim(3)
A Virtual Signal to Noise Ratio can instead be definedby considering the voluntary EMG signal measured inphase T 3, when stimulation is not present:
VSNRY vol
Y stim(4)
Because of the interaction between voluntary and stimu-lation components, it is expected that OSNR is in general
lower than VSNR. To quantify the degradation of theperformance when stimulation is active, the followingEfficiency Index (EI) was therefore defined:
EIOSNR
VSNR
Y stim+vol−Y stim
Y vol(5)
This index represents the capability of a given recordingand processing condition to extract the voluntary com-mand from the EMG signal in presence of stimulation,relatively to the same condition without stimulation. EInormally ranges from 0 (no voluntary signal detection),to 1 (no degradation due to stimulation).
The results will focus mainly on OSNR, since itallows to compare different configurations and to findwhich of them one optimises the detection of a voluntarysignal in the presence of electrical stimulation.
3. Results
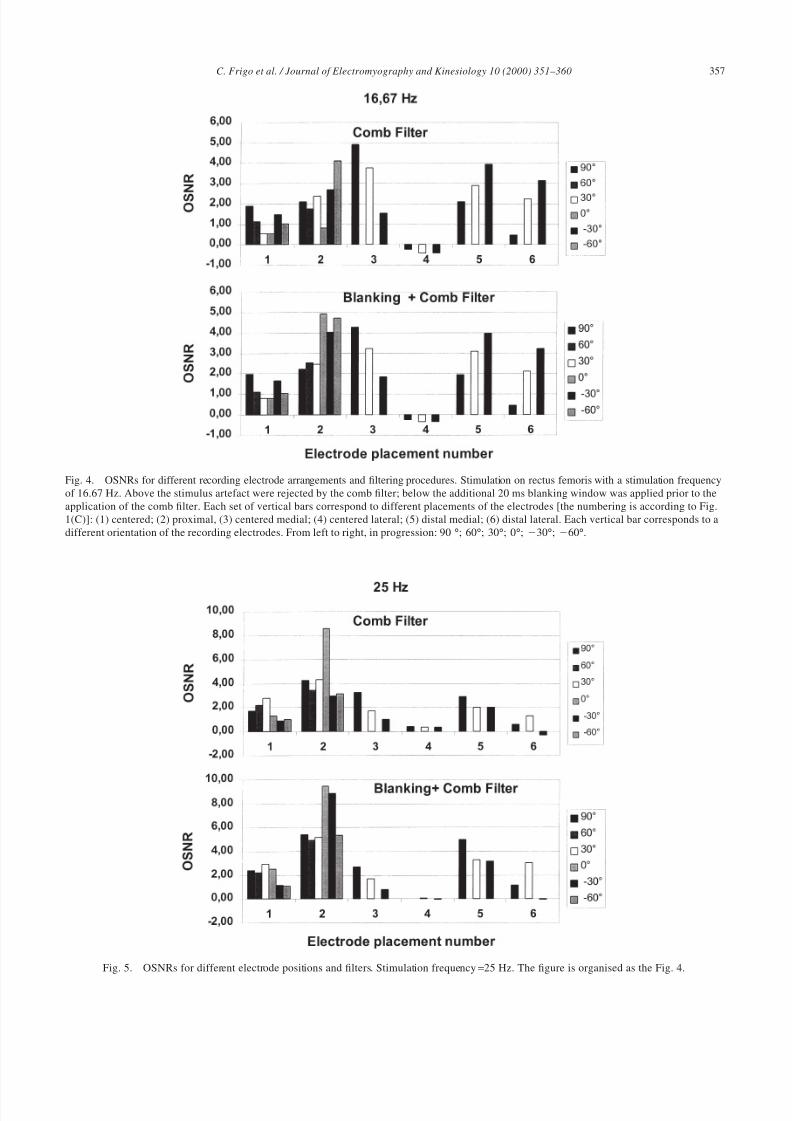
Figs. 4 and 5 report the Operative Signal to NoiseRatios (OSNR) obtained with different electrodes place-ments (1–6, see Fig. 1), electrodes orientations inrelation to the stimulating electrodes (90° to 60°), fil-tering procedures (comb filter alone and a 20 ms blank-ing in addition to the comb filter), and stimulation fre-quencies (16.67 and 25 Hz).
The effects of all these different conditions will beanalysed in the following.
3.1. Stimulation frequency
For almost all the recording and processing conditionsthe highest values of the OSNR were obtained at astimulation frequency of 25 Hz. In some cases the rela-tive amplitude of the OSNR among the different elec-trodes placements changed depending on the stimulationfrequency. For example the highest value was obtainedfor electrode placement 2, orientation 0° at 25 Hz. Thesame electrodes location and orientation yield the lowerOSNR at a stimulation frequency of 16.67 Hz. Also, theelectrode placement 1 proved to be sensitive to the dif-ferent stimulation frequencies, as the relative amplitude
obtained for the different electrodes orientationschanged.
3.2. Filtering procedure
The comb filter proved to be considerably efficient inreducing the stimulus artefact and enhancing the volun-tary component contribution. In fact the OSNR com-puted after filtering was in general more than one orderof magnitude higher than the OSNR computed on theraw signals. In some cases the improvement was dra-matic. For example, the OSNR computed on the raw sig-
8/2/2019 EMG Signals Detection and Processing for on-line Control of Functional Electrical Stimulation
http://slidepdf.com/reader/full/emg-signals-detection-and-processing-for-on-line-control-of-functional-electrical 7/10
357C. Frigo et al. / Journal of Electromyography and Kinesiology 10 (2000) 351–360
Fig. 4. OSNRs for different recording electrode arrangements and filtering procedures. Stimulation on rectus femoris with a stimulation frequency
of 16.67 Hz. Above the stimulus artefact were rejected by the comb filter; below the additional 20 ms blanking window was applied prior to the
application of the comb filter. Each set of vertical bars correspond to different placements of the electrodes [the numbering is according to Fig.
1(C)]: (1) centered; (2) proximal, (3) centered medial; (4) centered lateral; (5) distal medial; (6) distal lateral. Each vertical bar corresponds to a
different orientation of the recording electrodes. From left to right, in progression: 90°; 60°; 30°; 0°; 30°; 60°.
Fig. 5. OSNRs for different electrode positions and filters. Stimulation frequency=25 Hz. The figure is organised as the Fig. 4.

8/2/2019 EMG Signals Detection and Processing for on-line Control of Functional Electrical Stimulation
http://slidepdf.com/reader/full/emg-signals-detection-and-processing-for-on-line-control-of-functional-electrical 8/10
358 C. Frigo et al. / Journal of Electromyography and Kinesiology 10 (2000) 351–360
nals reported in Fig. 3 (electrode placement position 2,orientation 30°) was 0.15 at 16.67 Hz and 0.05 at 25Hz; after the comb filtering, it was respectively 2.7 and3.0. Considering all the electrode configurations, theOSNR increased on average by a factor of 10 due tofiltering. The use of the 20 ms blanking window, in
addition to the comb filter, further enhanced OSNR (forthe same example reported in Fig. 3 the OSNR obtainedwith blanking plus comb filter was 4 and 8.9 for 16.67and 25 Hz respectively).
3.3. Electrodes placement
Concerning the effect of the electrodes positioning,placement 2 produced the best OSNRs for most of thedifferent orientations analysed, particularly when thestimulation frequency was 25 Hz. At placement 2 thebest result was always exhibited by the electrodes orien-tation 0°, as to say when the electrodes were alignedlongitudinally. The VSNR was 15.85, that was about twotimes the OSNR. At 16.67 Hz position 3 showed com-parably high values of OSNR. Interestingly, themaximum was obtained with an electrodes orientation of 90°, as to say when the recording electrodes werearranged perpendicularly to the line of the stimulatingelectrodes. In this situation the VSNR was 7.92, as tosay about 1.5 times the OSNR (EI=0.66). Also, for thestimulation frequency 25 Hz, for electrodes placement3 the maximum OSNR was obtained for an orientationperpendicular to the line of the stimulating electrodes
even if in this case the OSNR was on average reduced.Placement 5 showed quite contradictory results. Actuallythe best OSNR for this location was obtained for anorientation of 30° at 16.67 Hz, and for an orientationof 90° at 25 Hz. Placement 6 exhibited similar resultsat 16.67 Hz, while at 25 Hz the OSNR of the 30°orientation dramatically dropped to zero (blanking pluscomb) and to a slightly negative value (comb filteralone). Electrodes placement 1 deserves interest from thepractical application point of view. Actually, this elec-trodes location yields relatively low OSNRs for all theorientations, even if the VSNR were comparable orhigher than in other locations (VSNR=8.17 for orien-tation 0°, VSNR=5.21 for orientation 90°). TheEfficiency Index was EI=0.2 for orientation 0° and 0.36for orientation 90°. Interestingly at 16.67 Hz themaximum OSNR was obtained, similarly with location3, with an orientation of the recording electrodes of 90°,as to say perpendicular to the line of the stimulation elec-trodes. In this situation the ratio between OSNR andVSNR was EI=0.62. At 25 Hz the maximum was insteadexhibited for an orientation of 30° (EI=0.42). Placement4 gave the worst results in all conditions. In particularit produced unrealistic negative values at a stimulationfrequency of 16.67 Hz.
4. Discussion
The considerable enhancement of the Operative Sig-nal to Noise Ratio (OSNR) due to comb filtering isencouraging for the applicability of the homologousstimulation. This means that it is possible to extract the
volitional EMG component from the artefacted signaland to use it in a stimulation control scheme. From thepractical implementation point of view it is also interest-ing to observe the further enhancement obtained by theaddition of a 20 ms blanking window to the comb filter.This is the result of an increased artefact rejection capa-bility. As the blanking window reduces the number of samples on which the comb filter is applied, the pro-cessing time can also take advantage of this procedure.
The OSNRs were always higher at 25 Hz stimulationfrequency than at 16.67 Hz. The result is consistent withthe observation that different stimulation amplitudes arerequired at different frequencies to obtain a given levelof force. In particular the stimulus amplitude was lowerat the higher frequencies. Therefore, the non-voluntarycontribution to the recorded signal (Y stim, at the denomi-nator in Eqs. (3) and (4)) was smaller at 25 Hz than at16.67 Hz, and the signal to noise ratios increased.
The analysis of the different electrodes locations andorientations revealed some interesting phenomena. Someof the results can be appreciated if we compare theOSNR to the VRSN, as to say the signal to noise ratioin the operative condition to the situation where the vol-untary contraction is not superimposed on the electri-cally induced contraction. It appears, for example, that
in both position 1 and 2, where the recording electrodeswere just on line with the rectus femoris muscle, thehighest VSNR were obtained with an orientation of 0°with respect to the longitudinal line. In operating con-ditions, when the voluntary contraction was superim-posed on to the electrically elicited contraction, theOSNR for placement 2 was still higher at orientation0°, while for placement 1, the OSNR resulted higher atorientation 90°. This can be explained by consideringthat with an orientation of 90° with respect to the lineof the stimulating electrodes the stimulus artefact has amuch higher common mode component and this can bemore easily rejected by the differential amplifiers. Thiseffect was extremely evident in position 3, that, for allstimulation frequencies and filtering procedures exhib-ited the maximum OSNR at orientation 90°. Also theelectrodes placement 5 showed the highest OSNR for anorientation of 90° at stimulation frequency 25 Hz. How-ever this result has to be connected to the relative contri-bution of the artefact component within the compoundsignal recorded. For example at 25 Hz stimulation fre-quency, when the stimulation amplitude to obtain agiven level of force is lower than with 16.67 Hz, theorientation of 30° yields a better result than the 90°orientation for the electrodes placement 1. For position

8/2/2019 EMG Signals Detection and Processing for on-line Control of Functional Electrical Stimulation
http://slidepdf.com/reader/full/emg-signals-detection-and-processing-for-on-line-control-of-functional-electrical 9/10
359C. Frigo et al. / Journal of Electromyography and Kinesiology 10 (2000) 351–360
5 the relative order of magnitude of OSNR was reversedbetween stimulation frequency 25 and 16.67 Hz. Here,as well as for position 6, the recording electrodes aredistally located and it is likely that a relatively low con-tribution of the rectus femoris activity is detected inrelation to the activity of the Vasti muscles (medial and
lateral respectively). Similar considerations can be madeto explain the surprising finding of a consistently low ornegative value of the OSNR for placement 4. The lowvalues could be explained by considering that since theelectrodes were relatively marginally located withrespect to the muscle, the signals detected for a voluntarycontraction were relatively small. The negative values of the OSNR represent a reduction of the compound signalwith respect to the stimulation signal recorded alone.This could appear paradoxical at a glance, but can beexplained by a swelling of the muscle belly, due to themuscle contraction, and a consequent displacement of the electrodes that in turn can reduce the signal recorded.
Following these observations it appears that definingthe optimal electrodes location and orientation is notstraightforward in all the conditions. However someindications have emerged from our systematic study. Itis suggsted however that for any practical application, acareful investigation of the performance and of the prosand cons of each solution is carried out on an individ-ual basis.
Acknowledgements
This work has been carried out with the partial supportof the Biomed II European projects SENIAM, SEN-SATIONS, and Neuros2.
References
[1] Bigland B, Lippold OCJ. The relation between force, velocity
and integrated electrical activity in human muscles. J Physiol
1954;123:214–24.
[2] De Luca CJ. The use of surface electromyography in biomechan-
ics. J Appl Biomech 1997;13:135–63.
[3] Dolan P, Adams MA. The relationship between EMG activity and
extensor moment generation in the erector spinae muscle duringbending and lifting activities. J Biomech 1993;26:513–22.
[4] Durfee WK, MacLean KE. Methods for estimating isometric
curves of electrically stimulated muscle. IEEE Trans BME
1989;36(7):654–67.
[5] Graupe D. EMG pattern analysis for patient-responsive control
of FES in paraplegics for walker-supported walking. IEEE Trans
BME 1989;36(7):711–9.
[6] Kadaba MP, Wootten ME, Gainey J, Cochran GVB. Repeatibility
of phasic muscle activity: performance of surface and intramuscu-
lar wire electrodes in gait analysis. J Orthop Res 1985;3:350–9.
[7] McGill KC, Cummings KL, Dorfman LJ, Berlizot BB, Luetkeme-
yer K, Nishimura DG, Widrow B. On the nature and elimination
of stimulus artifact in nerve signals evoked and recorded using
surface electrodes. IEEE Trans BME 1982;29(2):129–37.
[8] Merletti R, Knaflitz M, De Luca CJ. Myoelectric manifestation of
fatigue in voluntary and electrically elicited contractions. J Appl
Physiol 1990;69:1810–9.
[9] Moritani T, De Vries HE. Re-examination of the relationship
between the surface integrated electromyogram (IEMG) and the
force of isometric contraction. Am J Phys Med
1978;57(6):263–77.
[10] Park E, Meek S. Adaptive filtering of the electromyographic sig-nal for prosthetic control and force estimation. IEEE Trans BME
1995;42:1048–52.
[11] Perry J, Hoffer MN. Preoperative and postoperative dynamic
electromyography as an aid in planning tendon transfer in chil-
dren with cerebral palsy. J Bone Joint Surg 1977;59A:531–8.
[12] Roy S, De Luca CJ, Schneider J. Effects of electrode location on
myoelectric conduction velocity and median frequency estimates.
J Appl Physiol 1986;61:1510–7.
[13] Saxena S, Nikolic S, Popovic D. An EMG-controlled grasping
system for tetraplegics. J Rehab Res Dev 1995;32(1):17–24.
[14] Sennels S, Biering-Soresen F, Andersen OT, Hansen SD. Func-
tional neuromuscular stimulation controlled by surface electromy-
ographic signals produced by volitional activation of the same
muscle: adaptive removal of the muscle response from the
recorded EMG signal. IEEE Trans BME 1997;5(2):195–206.[15] Shiavi R, Bugle H, Limbird T. Electromyographic gait assess-
ment. Part 1—adult EMG profiles and walking speed. J Rehab
Res Dev 1987;24(2):13–23.
[16] Shiavi R, Frigo C, Pedotti A. Elecromyographic signals during
gait: criteria for envelope filtering and number of strides. Med
Biol Eng Comput 1998;35:171–8.
[17] Shiavi R, Green N. Ensemble averaging of locomotor electromy-
ographic patterns using interpolation. Med Biol Eng Comput
1983;21:573–8.
[18] Solomonow M, Baratta R, Shoji H, D’Ambrosia RD. The myoe-
lectric signal of electrically stimulated muscle during recruitment:
an inherent feedback parameter for a closed loop control scheme.
IEEE Trans BME 1986;33(8):735–44.
[19] Thorsen R, Ferrarin M, Spadone R, Frigo C. Functional control
of the hand in tetraplegics based on residual synergistic EMGactivity. Artif Organs 1999;23(5):470–3.
[20] Thorsen R. An artefact suppressing fast-recovery myoelectric
amplifier. IEEE Trans BME 1999;46:764–6.
[21] Winter DA, Yack HJ. EMG profiles during normal human walk-
ing: stride-to-stride and inter-subject variability. Electroenceph
Clin Neurophysiol 1987;67:402–11.
[22] Yang JF, Winter DA. Electromyographic amplitude normalis-
ation methods: improving their sensitivity as diagnostic tools in
gait analysis. Arch Phys Med Rehab 1984;65:517–21.
Carlo Albino Frigo was born in Cittiglio(Varese), Italy, on August 3, 1952. He graduatedin mechanical engineering (bioengineering–bio-logical control systems) at the Polytechnic of Milan, Italy in 1976. He was with the Depart-ment of Electronics, Polytechnic of Milan from1981 to 1989, then he became part of the newlyconstituted Department of Bioengineering of thePolytechnic of Milan. He is presently AssociatedProfessor in the Faculty of Engineering at thethe Polytechnic of Milan. His scientific researchinterests include: biomechanics of human move-
ment, modelling, motor control systems, methodologies for movementanalysis and clinical applications, prostheses, orthoses, Functional Electri-cal Stimulation and ergonomics. He is associated with the BioengineeringCentre of the ‘Don Carlos Gnocchi Foundation I.R.C.C.S.—Polytechnicof Milan’, where he has the responsibility of the Laboratory of Gait Analy-sis and related research. He has been responsible for national and Europeanresearch projects in the field of motor co-ordination and recovery of motor functions.

8/2/2019 EMG Signals Detection and Processing for on-line Control of Functional Electrical Stimulation
http://slidepdf.com/reader/full/emg-signals-detection-and-processing-for-on-line-control-of-functional-electrical 10/10
360 C. Frigo et al. / Journal of Electromyography and Kinesiology 10 (2000) 351–360
Maurizio Ferrrarin was born in Milan, Italy,in 1964. He received an M.Sc. in electronicengineering and an Ph.D. in bioengineeringfrom the Polytechnic of Milan in 1989 and 1993respectively. He is a researcher at the Bioengi-neering Centre (Fnd Don Carlo GnocchiI.R.C.C.S. ONLUS and Polytechnic of Milan),where he is responsible for the Laboratory for
the Study of Motor Recovery (LaRMo). He isalso temporary Professor of RehabilitationRobotics at the Polytechnic of Milan. His mainresearch interests include functional electrical
stimulation and innovative orthosis for motor recovery in paralysed per-sons, clinical gait analysis, biomechanics, spasticity evaluation, ergonom-ics of wheelchair propulsion and of seat cushions. Currently he is Scien-tific Responsible of a Ministry of Health research project onneuroprosthesis for the recovery of walking in SCI persons. Dr Ferrarin isa member of IEEE/EMBS, IFESS and SIAMoC (Italian Society of ClinicalMovement Analysis) Societies.
William Frasson was born in Sondalo, Italy, in1975. He is currently pursuing a masters degreein biomedical engineering at the Polytechnic of Milan, Italy, with a thesis on the EMG-con-trolled neuroprosthesis for restoring motor func-
tions of paretic muscles. His major researchinterests include neuroprostheses, electronicdesign and digital signal processing.
Esteban Enrique Pavan received an M.Sc. inelectronics (biomedical) engineering from thePolytechnic of Milan, Italy, in 1997 (topic:optimisation of a neuroprosthetic device for thetraining of paraplegics). He is currently a Ph.D.student in bioengineering (topic: advanced con-trol systems for FES-assisted neuroprosthesesfor paraplegics) and research fellow at the
Bioengineering Centre (Fnd Don Carlo Gnoc-chi—Polytechnic of Milan). His research inter-ests include control systems for paralysedhuman extremities, investigations of modelling
musculoskeletal dynamic behaviour by application of electrical stimulationand biomechanics of human movement.
Rune Thorsen, born in Denmark 1967, receivedhis M.Sc.e.e degree from the Technical Univer-sity of Denmark in 1994 and his Ph.D. inbioengineering in 1997. As a researcher in theDanish company, Asah Medico A/S, he carriedout research for the European project EPCES(1994–97), after which he started a three yearPost. Doc. position in the European projectNEUROS (under the TMR programme). In thefirst year he worked in Italy at Centro di Bioeng-
egneria, Milano and the second year was in TheNetherlands working at Universiteit Twente. He
is presently conducting experimental work in collaboration with SalisburyDistrict Hospital and University College London in England. His mainresearch interest is signal processing, electronics, functional electricalstimulation and use of EMG signals for control.