Embed Size (px)
Citation preview

Emerging MobilityTechnologies and TrendsAnd Their Role in Creating
“Mobility-As-A-System”For the 21st Century and Beyond

EMERGING MOBILITY TECHNOLOGIES AND TRENDSB
OWNERSHIP RIGHTSAll reports are owned by Energy Systems Network (ESN) and protected
by United States copyright and international copyright/intellectual
property laws under applicable treaties and/or conventions. User agrees
not to export any report into a country that does not have copyright/
intellectual property laws that will protect ESN’s rights therein.
GRANT OF LICENSE RIGHTSESN hereby grants user a non-exclusive, non-refundable, non-
transferable Enterprise License, which allows you to (i) distribute
the report within your organization across multiple locations to its
representatives, employees or agents who are authorized by the
organization to view the report in support of the organization’s internal
business purposes; and (ii) display the report within your organization’s
privately hosted internal intranet in support of your organization’s
internal business purposes. Your right to distribute the report under
an Enterprise License allows distribution among multiple locations or
facilities to Authorized Users within your organization.
ESN retains exclusive and sole ownership of this report. User agrees not
to permit any unauthorized use, reproduction, distribution, publication
or electronic transmission of any report or the information/forecasts
therein without the express written permission of ESN.
DISCLAIMER OF WARRANTY AND LIABILITYESN has used its best efforts in collecting and preparing each
report. ESN, its employees, affi liates, agents, and licensors do not
warrant the accuracy, completeness, correctness, non-infringement,
merchantability, or fitness for a particular purpose of any reports
covered by this agreement. ESN, its employees, affi liates, agents, or
licensors shall not be liable to user or any third party for losses or injury
caused in whole or part by our negligence or contingencies beyond
ESN’s control in compiling, preparing or disseminating any report or for
any decision made or action taken by user or any third party in reliance
on such information or for any consequential, special, indirect or
similar damages, even if ESN was advised of the possibility of the same.
User agrees that the liability of ESN, its employees, affi liates, agents
and licensors, if any, arising out of any kind of legal claim (whether in
contract, tort or otherwise) in connection with its goods/services under
this agreement shall not exceed the amount you paid to ESN for use of
the report in question..
© January 2019, Energy Systems Network

1ABOUT THE AUTHOR
MATT PEAK, DIRECTOR OF MOBILITY, ENERGY SYSTEMS NETWORK (ESN)Matt Peak is a business and policy strategist, facilitator, and investor with extensive
experience catalyzing emerging transportation and clean energy technologies.
Matt currently leads ESN’s efforts to advance clean, safe, and affordable transportation
technologies by collaborating with corporate and strategic partners, including Cummins, Duke
Energy, and Purdue University, among others. These efforts include: developing and deploying a
turnkey service- (rather than asset) oriented, multimodal, battery electric public transit operational
model; establishing a framework for integrated, multimodal mobility that enables first/last mile
connections by using automated shuttles and other technologies; helping solve automated vehicle
(AV) “edge cases” by employing tools that foster competition; building a venture finance model to
invest in promising clean energy and advanced transportation companies in underserved areas.
Previously, Matt provided strategic consulting services to C-level executives in the fields of
connected and automated vehicles and infrastructure, shared mobility, smart cities, big data,
advanced mobility, and clean energy technologies. While at CAVita and his own firm, Peak
Strategy Partners LLC, Matt worked with the nation’s largest transportation research agency
as its autonomous vehicle specialist, the world’s largest aggregator of solar fuels partners and
knowledge to commercialize innovative technologies, and has also assisted numerous laboratories
and startups commercialize their automotive and energy technologies.
Matt previously launched and led Prize Capital’s and Tri-State G&T’s efforts to discover, invest
in, and commercialize advanced energy technologies, and created what became the NRG COSIA
Carbon XPRIZE, a $20 million (USD) competition to spur technological innovation at power
plants. He was also the first employee of a venture-funded battery technology startup focused
on commercializing a new type of lithium battery for electric vehicles and other markets, and
led public policy, renewable fuel, and other collaborative efforts to develop and deploy advanced
transportation technologies at CALSTART and the Natural Resources Defense Council (NRDC).
Matt has a B.A. in economics from the University of California, Los Angeles (UCLA), an M.S.
in environmental policy from The London School of Economics, and an M.B.A. from the UCLA
Anderson School of Business.
A B O U T T H E AU T H O R

2 EMERGING MOBILITY TECHNOLOGIES AND TRENDS
ENERGY SYSTEMS NETWORKEnergy Systems Network (“ESN”), a branded initiative of the Central Indiana Corporate Partnership
(“CICP”), is a non-profit industry consortium of companies and institutions focused on the
development of the advanced energy technology sector. ESN is building an energy ecosystem
that integrates all aspects of the energy landscape: energy generation, distribution, the built
environment, and transportation.
ESN leverages its network of global thought leaders to develop integrated energy solutions to
increase quality of life for today and tomorrow. Its collective focus is to: reduce costs, emissions and
waste; influence policy; and advance technological innovation.
ESN uses a three-pronged approach to provide services for its partner organizations and clients:
• Multi-company Projects: Multi-company collaborations that accelerate new technology
commercialization through commercial-scale pilot projects;
• Consulting Services: Business services ranging from market studies to project development
and management; and
• Workshops, Strategic Planning and Research: Provide facilitation and lead strategic
planning and research efforts.
To date, ESN has launched a series of commercialization projects focused on dramatically reducing
emissions/fuel consumption of heavy trucks (Hoosier Heavy Hybrid Partnership); allowing for an
all-electric commute powered by a smart utility grid (Project Plug-IN); supplying our military bases
with reliable homegrown energy (MicroGreen); and creating a single point of access for battery
research, development, testing and commercialization (Battery Innovation Center).
A B O U T E N E RG Y S Y S T E M S N E T W O R K

3TABLE OF CONTENTS
5 List of Figures and Tables
7 Glossary of Terms
9 Executive Summary
12 Introduction 12 The Automobile, Roadways, and 20th Century Mobility
15 ‘More Change in the Next 10 Years Than in the Last 50’
16 ElectrifiedVehicles
22 ConnectedandAutomatedVehicles
22 Connected Vehicles
26 Automated Vehicles
34 Shared Mobility
37 Technologies + Travel Modes + Business Models = 21st Century Mobility
40 Public Transit: The Backbone of 21st Century Mobility 41 Declining Ridership
45 Modern Modes And Models to Revive Ridership
45 Electric Transit Buses
47 Dynamic Routing
48 Service-Based Pricing Models
49 Snapshot
49 Belleville Swaps Fixed Routes for On-Demand, Bus-Hailing
50 The First/Last Mile Challenge
51 Affordability, Accessibility, Intersectionality, and Mobility
54 The “Mobility Menu”: Domains, Modes, and Usage Models 56 Local Domain: Micromobility for < 5 Mile Journeys
57 Shared Scooters and Bicycles
62 AutomatedVehiclesandModesfortheLocalDomain
66 Snapshots
66 Portland, Ore. Scooter Pilot Shows Automobile Trip Displacement
67 Santa Monica’s Shared Mobility Pilot Program Addresses Array of Scooter and Bike Issues
68 Midrange Domain: Shared Ride Modes for 5–15 Mile Journeys
68 Microtransit, Ridesourcing, and Carpooling
74 Snapshots
74 Cities Subsidize Ridesourcing as a Cost-Effective Supplement to Transit
75 Transit Agencies and TNCs Launch Partnerships to Connect Riders to Transit Hubs
76 Waymo Focused on Automated Ridesourcing Service That Connects to Transit
TABLEOFCONTENTS

EMERGING MOBILITY TECHNOLOGIES AND TRENDS4
78 Long-Range Domain: On-Demand, Shared-Access Modes for > 15 Mile Journeys
79 Carsharing and Car Subscribing
83 Snapshots
83 Carsharing Becomes a Real Estate Perk
84 BlueIndy Deploys Popular European Electric Vehicle Carsharing Program to Become Largest
in the U.S.
86 Enabling Technologies and Market Drivers 86 “Big Data,” Modeling, and Predictive and Real-Time Analytics
88 Freight and Commerce
88 Long-HaulTrucking
89 Personal Delivery Devices (PDDs)
91 The “Center Console”
92 LightElectricFreightVehicles(LEFVs)
93 Intelligent Transportation Systems
95 LandUse,UrbanDesign,andTrafficCongestion
96 Prize Competitions
97 Public Policy and Regulations
98 Micromobility
100 ConnectedandAutomatedVehicles
102 Carsharing and TNCs
102 ElectrifiedVehicles
103 Safety
105 Smart Cities
107 Venture Capital
110 Realizing The Vision: Urban Mobility Independent of Car Ownership 110 The Essential Need: Systemic Integration and Dynamic Coordination Between Modes and Domains
113 Future Enablers and Market Drivers
113 AerialDronesandFlyingCars/Taxis
116 Automated Micromobility
117 Blockchain
119 Healthcare
120 “LandTrafficControl”
121 Ultra-FastElectricVehicleCharging
123 Vehicle-To-Grid(V2G)
126 Key Insights and Conclusions 126 Key Insight #1: Transportation Is Evolving from Products and Vehicles to Services and Mobility.
127 Key Insight #2: Sources and Targets of Federal, State, and Local Transportation Funding
ShouldBeDiversified.
127 Key Insight #3: Open Data Policies Can Expedite the Arrival of Socially-Desirable Mobility
Services, Modes, and Technologies.

5LIST OF FIGURES AND TABLES
LIST OF FIGURES 13 Figure 1: Planned “National System of Interstate Highways” (1955)
15 Figure 2: Percent Changes in Fleet Average Fuel Economy, Horsepower, and Weight Over Time
17 Figure 3: ESN Price Forecast for Full Battery Systems, 2010-2025
19 Figure 4: Comparison of Industry and ESN Battery Pack Price Forecasts, 2010-2025
20 Figure 5: EV Battery Tech and ICE Commercial Parity vs. EV Uptake Projections
23 Figure 6: Connected Vehicle (DSRC) Deployments Across The U.S. (2017)
27 Figure 7: Recent Rise in Deep Learning Research
28 Figure 8: Typical Automated Vehicle Sensor Placement and Functionality
33 Figure 9: Prospective Energy Impacts of Connectivity and Automation
34 Figure 10: Projected CAV Net Energy and Environmental Performance
38 Figure 11: The Classical Model of Disruptive Innovation Shows that Simpler Technologies
Overlooked by Incumbents Win Over Time
41 Figure 12: Metro Areas with More Public Transit Use Have Lower Traffic Fatality Rates (2016)
43 Figure 13: Public Transit Ridership Volumes by Quarter, 2013–2017
44 Figure 14: Self-Reinforcing Factors That Reduce Transit Ridership
46 Figure 15: Battery Electric Transit Bus Drivetrain Components
47 Figure 16: Hybrid and Fully Electric Buses as a Percent of Total Bus Unit Demand, 2006-2021
52 Figure 17: Household Expenditures, 2016
54 Figure 18: Energy Requirements for Combined City/Highway Driving
56 Figure 19: Number of Vehicle Trips by Trip Distance
LISTOFFIGURESANDTABLES

EMERGING MOBILITY TECHNOLOGIES AND TRENDS6
58 Figure 20: Days to Reach 10 Million Cumulative Rides
59 Figure 21: Dockless Bikes Represent A Small Portion Of Bikeshare’s Growth
61 Figure 22: Proportion of Uber Trips Represented by Bikeshare vs. Ridesourcing
72 Figure 23: Stated Modeshare if Ridesourcing Weren’t Available Indicates an Addition of
Vehicle Miles Traveled
77 Figure 24: Partnerships Between Transportation Network Companies and Public Agencies
82 Figure 25: Regional Carsharing Market Trends, 2006-2016
106 Figure 26: Ranking Methodology for 2018/19 Top 50 Smart Cities
108 Figure 27: Venture Capital Investments in Energy Technologies by Quarter
109 Figure 28: Global Venture Capital Scooter and Bikesharing Investments
111 Figure 29: The Interrelations Between Domains, Modes, and Transit That Establishes a
Mobility Framework Independent of Personal Car Ownership
123 Figure 30: Vehicle-to-Grid (V2G) Operation
LIST OF TABLES 22 Table 1: Quantities of Select CAV Interests
30 Table 2: SAE Levels of Vehicular Automation and Functionality
42 Table 3: Transit Ridership, 2017 vs. 2016
55 Table 4: Vehicle Trips By Distance (2017)

7GLOSSARY OF TERMS
GLOSSARYOFTERMS
AAMVA American Association of Motor Vehicle Administrators
ADS Automated Driving System
ASCT Adaptive Signal Control Technologies
AV Automated Vehicle
• Automated Vehicle: A vehicle that has one or several of a very wide range
of automated driving features and replaces certain aspects of driver
perception and control.
• Autonomous Vehicle: An automated vehicle that relies entirely on
its own onboard sensors for situation awareness in the roadway, and
therefore for exercising vehicle control functions.
CAV Connected and Automated Vehicle
CV Connected Vehicle
DSRC Dedicated Short Range Communication
EV Electric (or electrified) vehicle
FHWA Federal Highway Administration
HAV Highly automated vehicle, of SAE Level 3 or above
HEV Hybrid-electric vehicle
Lidar Light Detection and Ranging
MaaS Mobility as a Service
NPRM Notice of Proposed Rulemaking
OBD On-board diagnostics
OBU On-board unit

EMERGING MOBILITY TECHNOLOGIES AND TRENDS8
PHEV Plug-in hybrid electric vehicle
Platoon Comprising two or more freight trucks enabled for V2V communication as
well as automated longitudinal (and perhaps lateral) control functions.
RSU Road-side Unit
SM Shared Mobility
V2I Vehicle-to-Infrastructure aspect of CV
V2V Vehicle-to-Vehicle aspect of CV
V2X Includes V2V and V2I, and vehicle communication with road users such as
motorcyclists, cyclists and pedestrians.

9EXECUTIVE SUMMARY
EXECUTIVESUMMARY
F or the past 100 years, much of society in the
United States and many other parts of the
world has been organized around the personal
automobile. In many ways, it has come to define
what, where, and how we live. Yet change is
afoot. In fact, some have predicted that there
will be “more change in the next ten years than
in the last fifty.” This could very well be so, given
the onset and commercial advancement of core
automotive and related trends.
Batteries, once primitive and expensive, now
use energy-dense and increasingly cheaper
lithium ion that enables more affordable, longer
distance electric vehicles. This newfound
affordability and viability has spurred
cumulative global electric vehicle (EV) sales to
total more than 3 million as of February 2017, a
number that could climb to as high as 70 million
by 2025 as automakers are expected to invest
at least $90 billion to electrify their lineups.
Connected and automated vehicles (CAVs),
once the domain of science fiction, are quickly
becoming commercially viable. Initial use cases
are oriented around safety messages and
preemptive actions – such as collision avoidance
– while various companies are piloting advanced
use cases around broadly communicative,
highly automated vehicles. Issues need to be
resolved in order for CAVs’ full potential to
be realized. These issues include connected
vehicle regime standardization (i.e., “DSRC”
vs. “5G”), automation components’ capabilities
and affordability, and CAV deployment
scenarios that reduce rather than increase
congestion and pollution. Nonetheless, with
some projecting the CAV market will be worth
$7 trillion in 2050 and with major technology
developers and automakers deeply invested in
the technologies, CAVs’ arrival seems more a
matter of "when" and "how," rather than "if."
The same technologies that enable the
smartphone have combined with the “shared
economy,” in which strangers are comfortable
renting private property and services to each
other to establish “shared mobility.” Shared
mobility integrates an array of transport modes
and services – including but not limited to buses,
microtransit, taxis, rail and metro, shared and
pooled cars and rides, scooters, bicycles, and
others – into a single portal (e.g., smartphone
app) that is accessible on demand as needed,
and charges customers for mobility-as-a-
service (“MaaS”) rather than for the acquisition
of assets. The popularity of ridesourcing
services such as Uber and Lyft spurred shared
mobility, which some project could replace over
2.3 billion urban private car journeys annually in
2023 (compared with just 17.6 million globally
in 2018), while more recent efforts have
focused on the development of comprehensive
services and apps that enable full multimodal
journey planning and ticketing.
While each of these three trends engenders
innovation and may likely result in radical
change over the next decade, greater change
– the “disruptive innovation” – may be realized
in the seamless combination and integration
of each of these three trends while applying
them not only to passenger automobiles, but
to a wide array of vehicles and modes as well.
Multiple modes of electrified, connected, (at
least partially) automated, shared vehicles can

EMERGING MOBILITY TECHNOLOGIES AND TRENDS10
act as a system, with public transit serving as
the backbone of that system upon which the
broader architecture is layered.
A challenge with such an approach is that public
transit ridership has declined significantly,
particularly in recent years. Between 1945 and
1969, the number of U.S. transit passengers
dropped from 23 billion to 8 billion. Today,
increasingly fewer commuters across the
country are using public transit. Transit
ridership fell in 31 of 35 major metropolitan
areas between 2016 and 2017. Overall, 76.4
percent of Americans drive alone to work every
day; just 5.2 percent take public transit.
Modern modes and models are emerging that
can assist transit’s revival. Electric transit
buses provide not only more pleasant rides,
but can also reduce maintenance and operating
costs due to their relatively few drivetrain
components, greater efficiency, and use of
a cheaper fuel – all of which can leave more
money in transit agencies’ pockets to use to
increase service and frequency. Additionally,
some of the same technologies that enable
shared mobility are enabling new transit bus
services, such as dynamic routing, the provision
of real-time information, and service-based
pricing models.
Yet for the ridership revival to take hold,
transit has to overcome the “first/last mile
challenge,” which refers to the hurdle imposed
by pedestrian access to transit stations at
distances greater than one-half mile, and the
associated decline in ridership. The solution
to the first/last mile challenge isn’t simple, and
the application of any single challenge-solving
mode in isolation of the others can compromise
affordability and accessibility, and impose
issues pertaining to intersectionality and
overall mobility.
Instead, the solution to the first/last mile
challenge can be found in the establishment
of a “mobility menu” of domains, modes, and
usage models that, when integrated with
transit, can form a complete urban mobility
system. Designating domains based on
real-world usage patterns is essential in
order to match appropriate modes and usage
models and to establish a practical system.
Of primary importance is recognizing that
the overwhelming number of trips are short
distances: in 2017, over 85 percent of all trips
were 15 miles or less. Only 4.9 percent were
31 miles or more.
A further segmentation of trip data reveals
three primary travel domains. The “Local
Domain” is defined by trips up to five miles in
length, which comprise 59.5 percent of all trips,
and is served by “micromobility” modes such as
shared scooters, bikes, and automated shuttles.
The “Midrange Domain” is defined by trips
between five and 15 miles long, which comprise
25.7 percent of all trips, and is served by
models such as microtransit, ridesourcing, and
carpooling. The “Long-range Domain” is defined
by trips beyond 15 miles long, which comprise
14.8 percent of trips, and is served by models
such as carsharing and car subscriptions.
Within each of these domains, data on
user adoption rates and usage patterns are
demonstrating the feasibility and popularity
of various modes for specific use cases. This
feasibility and popularity is enabled by a
variety of adjacent technologies and market
drivers. Included among these are “big data”
computations that enable advanced modeling

11EXECUTIVE SUMMARY
and analytics, freight and commercial markets,
intelligent transportation systems (ITS), land
use and congestion, prize competitions, public
policy and regulations, safety, smart cities, and
venture capital, among others.
Altogether, the application of modes within
the framework of domains and the backbone
of transit yields the very real possibility that
“mobility-as-a-system” (MaaSys) may emerge
that affords much, if not all (or more), of the
movement provided by personal car ownership
yet without many (or all) of its downsides.
Fulfilling such potential will require full and
complete systemic integration of modes and
domains, as well as their optimized, dynamic
coordination. Various companies are already
advancing such efforts, mainly in the form
of smartphone applications that bring all
modes and technologies to bear to present
options, coordinate routing and timing, and
simplify payments for users. Beyond these
efforts, potential enablers and market drivers
currently advancing the system may include the
advancement of aerial drones and flying cars/
taxis, automated micromobility, blockchain,
“land traffic control” systems, ultra-fast
electric vehicle charging, and vehicle-to-grid
(V2G) deployments.
In the future, it may be that society no longer
associates mobility with personal automobiles,
but rather develops an association more
akin to the modern telecommunications
industry. Just as consumers can walk into a
telecommunication provider’s retail store and
be afforded one of many different smartphone
handsets, minutes of talk-time, and gigabytes
of data by subscribing to a package that best
meets their needs and desires, future travelers
might enter mobility hubs that afford the use
– rather than ownership – of a wide variety
of shared modes by subscribing to a package
based upon travel frequency, timeframes,
domains, and mileage.
Emerging mobility technologies are elevating
the potential for the creation of such a system
of services that enable full urban mobility
to a new high. Should such a system fully
materialize and scale, and should it do so in a
timeframe consistent with emerging mobility
technologies’ current rates of adoption, the
change to society as a whole will make the
predicted changes to any single industry, such
as that of the automobile over the next ten
years, pale in comparison.

EMERGING MOBILITY TECHNOLOGIES AND TRENDS12
I N T RO D U C T I O N
T he development and use of mobility
technologies and systems revolutionized
society. No longer did people need to live in
the immediate vicinity of jobs, families, and
recreational areas in order to access them.
Instead, they could leverage technologies
to conveniently travel to these and other
destinations while living in more affordable or
desirable areas.
In the early days, mobility was enabled by
horses, which in time gave way to streetcars,
trolleys, and personal automobiles. For the most
part, this system worked. Roads were built out,
vehicles became increasingly affordable, and
a culture of transnational freedom emerged
that was embodied by the romantic ideal
of personally owned automobiles traveling
anywhere at anytime on wide-open highways.
Yet over time, cultural norms, societal
investments, and public policies focused this
system on the personal automobile, to the
exclusion of others, and grew it to the breaking
point. Congestion, expense, inefficiency, and
mortality were more or less institutionalized. In
2014, urban commuters collectively wasted 6.9
billion hours and 3.1 billion gallons of fuel due to
traffic delays. Excess fuel and lost productivity
cost them $160 billion in 2014, up from $114
billion in 2000, and $42 billion in 1982.1 Drivers
are averaging 335 hours in the car each year,2
their search for parking alone costs them $73
billion per year3, and motor vehicle fatalities
totaled over 37,000 in 2017 alone.4
The urgent need to alleviate these and other
problems brought about by the current mobility
paradigm is prompting its rapid evolution.
This evolution, which some are saying will
yield “more change in the next 10 years than
in the last 50,” is driven by the advance of
technologies that enable electrified, connected
and automated vehicles of various shapes, sizes,
and functionalities. When combined with new
travel modes and business models – first and
foremost among them being shared mobility,
which orients users around the procurement of
services rather than the acquisition of assets –
these technologies have the potential to (and in
some cases are already delivering) the flexibility
and versatility offered by personally owned and
driven automobiles, yet at lower personal and
societal costs.
THE AUTOMOBILE, ROADWAYS, AND 20TH CENTURY MOBILITYFor the past 100 years, much of society in the
United States and many other parts of the
world has been organized around the personal
automobile. In many ways, it has come to define
what, where, and how we live. In its earliest days
it was transformative, reshaping lives, laws, and
the land as people embraced the “horseless
carriage” and its descendants.
Ironically, it was the popularity of bicycles – and,
specifically, the innovators behind them – that
first sparked the revolution in transportation in
the 20th century and led to the need for paved
roads and the interstate highway system.5 In
1893 in Springfield, Mass., bicycle mechanics
Charles and Frank Duryea built the first gasoline-
powered “motor wagon” to be operated in the
United States. They formed the first company
to manufacture and sell gasoline-powered
vehicles, although they sold very few. The same
year, the Office of Road Inquiry (ORI) within the

13INTRODUCTION
Department of Agriculture was established to
promote new rural road development, which at
that time were made mostly of dirt.6
The push to make and pave roads received a
shot of adrenaline in 1908 when Henry Ford
began mass-producing and selling the Model
T. His competitors followed shortly thereafter
and built cars for the broader public. The
increasing numbers of Americans behind the
wheel began lobbying for paved roads with
the slogan, “Get the farmers out of the mud!”
As a result, the Federal-Aid Road Act of 1916
created the Federal-Aid Highway Program,
which funded state highway agencies’ abilities
to make road improvements.7
After the end of World War I, the Federal
Highway Act of 1921 transformed the ORI
into the Bureau of Public Roads and provided
funding for state highway agencies to construct
paved two-lane interstate systems. These road
projects benefited from Depression-era job
creation programs during the 1930s, as well
as military needs and associated spending to
support the transport of troops and materials
during World War II.
Yet it wasn’t until President Dwight D.
Eisenhower signed the Federal-Aid Highway
Act of 1956 that the modern interstate system
was truly born. The bill authorized and provided
$26 billion (approximately $241 billion in 2018
dollars) for the construction of a 41,000-mile
“National System of Interstate and Defense
Highways” that would, according to Eisenhower,
eliminate unsafe roads, inefficient routes, traffic
jams and all of the other things that got in the
way of “speedy, safe transcontinental travel.” A
1955 Department of Commerce “yellow book”
outlined the vision for the Interstate Highway
System, including a national map of routes (see
Figure 1).8 All told, the Interstate Highway
System is approximately 48,000 miles long.9
Figure 1: Planned “National System of Interstate Highways” (1955)
Source: Public Roads Administration, Federal Works Agency

EMERGING MOBILITY TECHNOLOGIES AND TRENDS14
When the Interstate Highway Act was first
passed, most Americans supported it. At
its beginning, the interstate system offered
unprecedented access, freedom, and mobility.
Soon, however, the unpleasant consequences of
rapid, large-scale roadway construction began
to show. Most unpleasant of all was the damage
the roads inflicted on the city neighborhoods
in their path. They displaced people from their
homes, sliced communities in half, and led to
abandonment and decay.10
In fact, highways were intentionally divisive.
During the New Deal activities of the early
1930s, the federal government sought to use
new spending efforts to help alleviate a housing
shortage. Yet to secure this new funding,
compromises were made with segregationist
legislators that led to the codification of
segregation in housing policies. In 1934, the
Federal Housing Administration (FHA) was
established and undertook actions to further
segregation by refusing to insure mortgages
in and near African American neighborhoods.
It also published its Underwriting Manual,
which spelled out its segregationist principles
and recommendations. In stating that
“incompatible racial groups should not be
permitted to live in the same communities,”
the Underwriting Manual recommended using
highways to separate African American from
white neighborhoods.11 This recommendation
led to a long-standing – and wildly successful
– federal regulatory approach that divided
communities, fostered racial divisions, and
helped create ghettos and pockets of poverty
that have endured through the present day.
Beyond racism, key forces that pushed for the
buildout of the Interstate Highway System
included a mix of self-interested industry
groups, design choices made by people far
away, and a lack of municipal foresight.12 The
net result of the interstate’s buildout is that
it helped to cement the century’s framework
for mobility solely in terms of roadways and
vehicles. Across the country, cities scrapped
plans for rail and other fixed transit systems
in favor of roadways. For instance, while Los
Angeles had the country’s best public streetcar
system around the 1920s, a combination
of the automobile’s popularity; urban
gridlock that caused streetcars to miss their
schedules; artificially low fares;13 and actions
by a consortium of auto, oil, tire, and truck
companies14 prompted not just the shutdown
of the system by 1962, but the near complete
removal of its infrastructure.15 Instead urban,
and especially suburban, areas nationwide
were built around roadways and thus became
highly dependent on personal automobiles.
Over time, additional consequences of
roadway dependence emerged. The idyllic
picture that Eisenhower painted at the
system’s beginning has now become one that
contributes to a broader car-based ecosystem
that sees over 37,000 roadway fatalities
annually,16 more than 3 billion gallons of
wasted fuel, nearly 7 billion extra hours (42
hours per rush-hour commuter), and $160
billion spent ($960 per commuter) annually
due to traffic congestion.17
Additionally, increasing financial resources were
allocated to provide for car-based mobility that
dwarfs the Interstate Highway Act’s original
allocation. Such a statement doesn’t just take
into account direct expenditures, such as the
$165 billion spent in 2014 on highways, roads,
bridges and tunnels,18 but also the supporting
infrastructure, such as the $5,000 to $50,000
spent to construct each one of the 744 million
to more than 2 billion parking spaces in the U.S.,

15INTRODUCTION
more than $100 billion a year in what amounts
to subsidies for “free” parking,19 and between
$4 billion and $20 billion spent each year to
maintain this infrastructure.20
The modern amount spent on building and
maintaining reflects the fact that the mobility
paradigm in the United States hasn’t changed
much in the past hundred years. This isn’t to
say that technology hasn’t advanced. On the
contrary, vehicular technology is radically more
advanced than it was just a few decades ago,
not to mention at its origins. Figure 2 illustrates
this advancement by showing how automakers
have nearly doubled average fuel economy over
the past 30 years while maintaining vehicular
weight, and that this advancement of fuel
economy has come along with – rather than at a
cost to – similarly increased horsepower.
Yet the fact remains that, just like their
counterparts at the beginning of the 20th
century, automobiles today are for the most part
powered by internal combustion engines that
burn gasoline, are operated entirely by humans
who own the vehicle and are the vehicle’s only
occupant, and serve as the operator’s dominant
mode of travel.
‘MORE CHANGE IN THE NEXT 10 YEARS THAN IN THE LAST 50’Recently, and particularly over the past decade,
transportation technologies have advanced to
the point where companies and society are able
to consider and embrace forms of mobility at a
scale previously unimaginable in the U.S. These
technological advancements are occurring at
such a rapid pace that auto industry executives,
such as General Motors Chairman and CEO
1975 1980 1985 1990 1995 2000 2005 2010 2015 2020
100%
80%
60%
40%
20%
0
-20%
-40%
Model Year
Pe
rce
nta
ge o
f C
han
ge
Adjusted Fuel Economy
Horsepower
Weight
Figure 2: Percent Changes in Fleet Average Fuel Economy, Horsepower, and Weight Over Time
Source: U.S. Department of Energy

EMERGING MOBILITY TECHNOLOGIES AND TRENDS16
Mary Barra, are predicting “…the auto industry
will change more in the next five to 10 years
than it has in the last 50.”21 Already, more
than 50 percent of orders received by Tier 1
automotive supplier Valeo in 2018 were for
products that didn’t exist five years ago.22
Yet prospective change applies to factors and
issues beyond the auto industry itself, a reality
that isn’t included in predictions such as the
former. In fact, the advancement and large scale
adoption of emerging mobility technologies and
systems can help drive broader societal changes
that make the changes to the auto industry
pale in comparison. This might even include the
alleviation of the societal shortcomings imposed
by the large-scale roadway and interstate system
buildout that were discussed in the previous
section, for as the size and cost of modes
decrease, widespread mobility increases and
the need for large-scale roadways decreases.
Many are projecting that these transformations
will yield what are in many cases significant
economic benefits. As important, many of these
benefits won’t necessarily be localized to a
particular industry, but instead can be broadly
societal. For instance, the World Economic
Forum projects that the digital transformation
of the auto industry can deliver $670 billion of
value to automotive players and a further $3.1
trillion of overall societal benefits through 2025
by reducing the number of crashes, the impact of
carbon emissions and the cost of car ownership,
including maintenance, fuel and insurance.23
At its core, the advancement of mobility
technologies is occurring in three
separate categories:
1. Electrification
2. Connectivity and automation
3. Shared mobility
The disruption taking place in each of these
three categories is collectively creating
concurrent and converging trends that, once
fully scaled, might prompt changes in the 21st
century that dwarf those prompted by the
automobile in the 20th century.
ELECTRIFIEDVEHICLESThe term “electrified vehicles” refers to a
range of technologies that use electricity to
propel a vehicle:24
• Hybrid Electric Vehicles (HEVs) obtain all net
propulsion energy from petroleum but use an
electrical system to improve fuel efficiency.
• Plug-in Hybrid Electric Vehicles (PHEVs) store energy from the electric power grid
and can drive partly using electricity and
partly using petroleum. “Blended PHEVs”
use a mix of gasoline and electricity when
the battery is charged and then switch
entirely to gasoline when the battery is
depleted, while “Extended Range Electric
Vehicles” (EREVs) are PHEVs that use
only electricity when the battery is
charged and switch to gasoline when the
battery is discharged.
At its core, the advancement of
mobility technologies is occurring in
three separate categories:
1. Electrification
2. Connectivity and automation
3. Shared mobility

INTRODUCTION 17
• Battery Electric Vehicles (BEVs) have
larger battery packs to store more
energy from the electric power grid
for longer range. They have no backup
gasoline engine. BEVs are also referred
to by some as “pure-electric vehicles” or
“all-electric vehicles” (AEVs).
• Fuel Cell Electric Vehicles (FCEV) refuel
with hydrogen, methanol, or a carrier
of one or the other and use a fuel cell to
produce electricity to propel the vehicle.
FCEVs are also referred to as fuel cell
vehicles or FCVs.
While the automotive industry has been at
the forefront of energy storage technologies
for over a century (i.e., 1912 Cadillac with
electric starter and battery),25 and while the
1990s saw the first real attempts by OEMs
to market and sell BEVs in the U.S., it was the
last fifteen years that saw the bulk of public
acceptance and market growth.26 The Honda
Insight and Toyota Prius were the first HEVs
introduced to U.S. consumers in the late 1990s.
By 2012, the Prius had outsold all other new
cars in California, the country’s largest vehicle
market.27 Other HEVs followed, providing large
2,1502,100 2,100 2,050
1,950
1,550
1,450 1,450
1,3501,250
1,150
1,0501,000
900 900850
2,1502,100 2,100 2,050
1,950
1,550
1,450 1,450
1,3501,250
1,150
1,0501,000
900 900850
1,6001,550 1,550
1,500
1,350
1,000
900 900800
750
650550
500450
400 400
1,6001,550 1,550
1,500
1,350
1,000
900 900800
750
650550
500450
400 400
2010 2011 2012 2013 2014 2015 2016 2017 2018 2019 2020 2021 2022 2023 2024 20250
500
1,000
1,500
2,000
2,500
Year
$/k
Wh
Passive Thermal
Active Thermal
High Voltage
Connector & Bussing
MFG Costs & QC
Battery Pack Enclosures & Housing
BMS & Modules
NMC/NCA Chemistry
LFP Chemistry
LTO Chemistry
Trend Line - High
Trend Line - Mid
Trend Line - Low
Figure 3: ESN Price Forecast for Full Battery Systems, 2010-2025
Assumptions and Disclaimers:
1. Individual component costs (i.e., thermal, BMS, connector and bussing, etc.) are not precise estimates, but reflect an approximate percentage of the total system cost.
2. Pricing of raw materials for NCM and NCA chemistries is fairly similar, so their pricing is combined in this report.
Source: ESN Energy Storage Roadmap Report, 2017

EMERGING MOBILITY TECHNOLOGIES AND TRENDS18
subsets of motorists with their first experiences
driving electrified vehicles.
One of the major roadblocks to BEV
development and market acceptance was
limited vehicle range due to the use of lead
acid or nickel metal hydride (NiMH) batteries
in early BEVs and HEVs. Higher density,
affordable battery technologies that could offer
sufficient vehicular range weren’t commercially
available. That changed with the commercial
introduction of lithium-ion (Li-ion) batteries
less than 30 years ago, their widespread
market adoption in personal electronics
markets and (more recently) vehicular
markets, and their incremental yet continual
technological advancement – particularly over
the past decade.
With the advent of Li-ion technology, and the
increased electrification of the automobile
(from 400 Watts in 1912 to over 100 kW
today), the automotive industry collectively
has invested over $10 billion in the safety,
performance, durability, and warranty targets
of Li-ion technology. These factors prompted
the price of lithium-ion battery packs for
transportation applications to decline. A
September 2017 analysis by ESN of energy
storage technologies, economics and pricing
chronicled the rapid decline in full (primarily
automotive) battery system prices and
forecasted continued annual declines far into
the future, as illustrated in Figure 3.28
Comparing the ESN trend line to the average
trend line from eight other independent
research and market studies reveals a much
higher cost for a true energy storage system
then what is commonly reported in most
market studies. However, most market studies
only consider a battery pack to include the
lowest cost chemistries and a subset of the true
balance-of-system components. Furthermore,
battery pack pricing and estimates in the
automotive market often only include cells,
while other industries include modules and
battery management systems (BMS), but rarely
include enclosure costs and other balance-of-
system components. Therefore, ESN developed
a second trend line that represents more of an
“apples-to-apples” comparison, which is much
closer to the average trend line of the eight
industry reports, as shown in Figure 4.29
As battery pack prices come down, vehicle
demand goes up, for battery price is inversely
correlated with electric vehicle affordability
and consumer demand. Cumulative sales of
EVs, including battery electric vehicles and
plug-in hybrid electric vehicles, reached 1.2
million worldwide in 2015, surpassed 2 million
vehicles in 2016, and crossed over 3 million as
of February 2017.30 Accordingly, automakers
are expected to invest at least $90 billion over
the coming years to electrify their lineups,31
and Bloomberg projects that nearly eight out
of every 10 batteries sold will be in an electric
vehicle by 2030.32
To meet this added and projected demand,
battery manufacturing capacity is increasing.
As of February 2018, global battery
manufacturing capacity reached about 110
gigawatt hours (GWh) a year, mostly for
consumer electronics, electric vehicles and
electricity storage. Recently, China has
announced plans to add more than 150 GWh of
production by 2021 or 2022, tripling its current
capacity. Such an increase would dwarf Tesla’s
“gigafactory” in Nevada, which is often cited
as an extreme case of increased capacity, but
whose projected additions amount to 35 GWh
by 2020.33 Benchmark Mineral Intelligence

INTRODUCTION 19
forecasts a 399 percent increase in Li-ion
battery production capacity by 2028, which is
enough to surpass 1 TWh in total capacity.34
While this growth is meaningful, electric
vehicles still only represent less than 1 percent
of vehicles in use globally.35 The continual
reduction in battery prices will be one of the
primary drivers in prompting this number to
grow, given that analyses peg BEVs and PHEVs
as respectively costing almost $9,000 and
$5,700 more to build than conventional cars,36
with the battery accounting for 40 percent of
the cost of building a BEV.37 As battery prices
come down, electrified vehicles can become
as affordable as those powered by internal
combustion engines (ICEs) and/or increase
their battery capacities to increase vehicle
range and, in turn, consumer demand. Figure
5 illustrates how the price of vehicular battery
storage systems are rapidly approaching price
parity with ICEs and that, once this happens,
the sales volume of EVs are projected to
grow exponentially.
In addition to battery costs and performance,
some also cite infrastructure as a barrier to
electric vehicle uptake. There are a relatively low
number of charging stations for electric vehicles
as compared to gas stations for conventional
cars – 20,000 vs. 125,000, respectively.38 To
build out what it deems to be sufficient capacity,
McKinsey predicts that major economies (i.e.,
those of China, Europe, India, and the U.S.)
will need to invest $55 billion in charging
infrastructure by 2031 to support what it
Year
$/kW
h
20152014 2016 201720112010 2012 2013 2018 2019 2020 2021 2022 2023 2024 20250
200
400
600
800
1,200
1,800
1,400
1,600
1,000
327.38 279.56
900
650
450
350
Industy Trend
ESN (Full System)ESN Battery Packs*
Figure 4: Comparison of Industry and ESN Battery Pack Price Forecasts, 2010-2025
Assumptions and Disclaimers:
1. The Industry trend line represents an approximation of pricing trends averaged across all previously mentioned market studies.
2. "ESN Battery Packs" pricing includes approximate pricing (based on approximate percentage of total system cost) for cells (NMC/NCA chemistry), BMS and modules, battery pack enclosures and housing only.
3. "ESN Full System" trend line represents all system costs as represented in Figure 5.
Source: ESN Energy Storage Roadmap Report, 2017

EMERGING MOBILITY TECHNOLOGIES AND TRENDS20
predicts will be the 140 million electric vehicles
that will be on the road by then.39 Goldman
Sachs estimates that $6 trillion – or about 7.5
to 8 percent of the world’s gross domestic
product – is theoretically needed to fully build
out electric vehicle infrastructure.40 However,
these comparisons and calculations could be
misleading, for battery and ICE technologies’
respective refueling models are different.
There are three major categories of chargers,
based on the maximum amount of power the
charger provides to the battery from the grid:41
• Level 1: Provides charging through a
120V AC plug and does not require
installation of additional charging
equipment. It can deliver two to fi ve
miles of range per hour of charging,
is most often used in homes, and
sometimes at workplaces.
• Level 2: Provides charging through
a 240V (for residential) or 208V (for
commercial) plug. It may require
installation of additional charging
equipment, but could also be tapped by
plugging into washer/dryer power outlets
common in U.S. homes’ garages using
the power cords that come with most
electric vehicles. It can deliver 10 to 20
miles of range per hour of charging, and
is frequently used in homes, workplaces,
and in public locations.
• Level 3: Provides DC fast charging
through 480V (or more) AC input
and requires highly specialized, high-
powered equipment as well as special
equipment in the vehicle itself. It can
deliver 60 to 80 miles of range (or more)
in 20 minutes (or less) of charging, and
is used most often in public charging
stations, especially along heavy traffi c
Figure 5: EV Battery Tech and ICE Commercial Parity vs. EV Uptake Projections
2010 2011 2012 2014 2015 2016 2017 20192018 2020 2021 2022 2023 2024 2025 2026 2027 2028 2029 20302013
$1,200
$1,000
$800
$600
$400
$200
0 0
5%
10%
15%
20%
25%
30%
35%
40%
45%
Cost parity withinternal combustion
engines
Actual cost of battery energy storage
Estimated range of cost of future battery energy storage
Cost of internal combustion engines
CCC EV uptake projection (39% by 2030)
25% by 2030 EV uptake projection
BNEF EV uptake projection (7% by 2030)
Source: www.rolton.com/EV

INTRODUCTION 21
corridors. Current Level 3 standards
include CHAdeMO, which is favored by
Asian automakers; Combined Charging
System (CCS), which is favored
by U.S. and European OEMs; and
Tesla’s Supercharger.
Out of these three charging categories, the
recharging scenario implied by Level 3 is the
only one that comes close to resembling the
one embodied by refueling a conventional car.
The others – Levels 1 and 2 – afford drivers the
ability to charge at home overnight or during
other vehicular downtimes, thus enabling
them to hit the road and, in the most common
scenarios, drive throughout the day without
needing to recharge. Therefore, it may not be
that the number of public charging stations for
electric vehicles needs to meet or exceed the
number of gas stations for conventional cars.
Regardless of where they’re charged,
integration of EVs should play a sizeable role
in electric system planning, given the projected
load demands. Research from the California
Energy Commission estimates that EVs could
prompt peak demand to rise by 1 gigawatt (GW)
by 2025.42 Another analysis puts electricity use
from light duty vehicle transport in the 570–
1,140 terawatt hours (TWh) range, or between
13 and 26 percent, respectively, of total U.S.
electricity demand in 2050.43 According to
the National Renewable Energy Laboratory
(NREL), an electric vehicle market share of
up to 3 percent (about 7.5 million EVs) would
not significantly impact aggregate residential
power demand. But for some utilities, any
increase in projected load would be welcome
news; given sustained periods of flat or even
negative grid growth, new demand from EVs
could offset these historic declines. That said,
even having a couple of electric vehicles in the
same neighborhood could make delivering that
power a challenge. Distribution transformers
may need to be sized up and replaced more
frequently, and peak demand will be an issue in
some areas, NREL's report concluded. Managing
that demand will be essential, and is one of the
key capabilities EVs will bring to utilities.44
Such planning is important, given that the
transition to an electrified fleet seems well
underway. Ford Motor Company has committed
to spend $11 billion on product development
that includes a Mustang-inspired crossover EV
due in 2020, with plans to have 40 hybrids and
EVs on the market by 2022. General Motors
(GM) plans for more than 20 EVs globally by
2023, and Nissan plans to launch eight new
EVs by early 2023 and to electrify most of
Infiniti's lineup starting in 2021. Altogether,
automakers have announced plans to bring
more than 60 electric and plug-in hybrid
models to market through 2020, and 100
through 2022.45 Worldwide, established and
startup automakers are spending $255 billion
to develop more than 200 new electric models
that are expected to hit the market by 2022.46
With such plans in place, it could be that plug-
in electric vehicles sales account for as much
as 20 percent of the U.S. market in 203047 and
comprise 26 percent of the light-duty vehicle
stock in 2040.48 Another analysis indicates
a good chance that the electric car stock will
range between 9 million and 20 million by
2020, and between 40 million and 70 million
by 2025.49 Electric vehicles will account for
28 percent of global light-duty vehicle sales
sometime shortly after 2025, according to
Bloomberg New Energy Finance (BNEF),50
and Bank of America analysts forecast they
will account for 34 percent of global vehicle
sales by 2030.51

EMERGING MOBILITY TECHNOLOGIES AND TRENDS22
CONNECTEDANDAUTOMATEDVEHICLESWhile connected vehicles (CVs) and automated
vehicles (AVs) are often discussed separately,
their projected convergence over the coming
decade – as highly-automated vehicles (HAVs)
will depend on connectivity for full functionality
– leads us to cover connected and automated
vehicles (CAVs) as one unifying platform
comprised of two distinct components and
functionalities.
CAVs have received a fair amount of attention
in recent years, perhaps due to their departure
from the norms of automobile operation, the way
in which thoughts of pilotless cars roaming the
streets stoke the imagination, and the underlying
materialization of what was once science fiction
they represent. As important is the frenetic level
of activity undertaken by various parts of society
to explore and advance the technology. While not
that long ago, reference to self-driving cars would
often engender a response referencing Google’s
research and development activities, Table 1
notes the sheer volume of companies, vehicle
manufacturers, deployments, universities, and
investors that are actively working with CAVs.
Connected Vehicles
Virtually every aspect of society is becoming
connected via the Internet, Bluetooth, and/
or other protocols. From the ubiquity of the
smartphone – which affords fast and ever-
present Internet connectivity within one’s own
pocket – to home appliances, entertainment
systems, security systems, exercise equipment,
jewelry, and virtually every other component
that can be equipped with the sort of small
and cheap sensors and transceivers that have
become common over the past 10 years, the
trend towards connectivity is well established
and increasing. With connectivity comes
a plethora of features and services that
consumers are demanding.
In this regard, vehicles are no different. CVs
are those that are enabled for standardized
communication between vehicles or with
the roadside, to enable driver assistance
applications for the purposes of safety,
traffic efficiency, reduced fuel consumption
or reduced emissions. Wireless vehicular
communications include:
• Vehicle-to-Vehicle (V2V), which reflects
an ability to wirelessly exchange
information between vehicles about
each one’s speed and position in order
to avoid crashes, ease traffic congestion,
and improve the environment, among
other objectives;52
• Vehicle-to-Infrastructure (V2I), which wirelessly captures vehicle-
generated traffic data and provides
information such as advisories from
the infrastructure to the vehicle that
inform the driver of safety, mobility,
or environment-related conditions,
among others;53
Table 1: Quantities of Select CAV Interests
CAVInterests Quantities
Companies 722
Vehicle Manufacturers 114
Regional Efforts, Proving Grounds, and Demonstrations
210
Universities and Institutes 168
Investors 336
Source: Peak Strategy Partners, LLC

INTRODUCTION 23
• Vehicle-to-Everything (V2X), which
connects all road devices (motor vehicle,
non-motor-vehicle, bicycle, pedestrian,
etc.) and shares real-time information
(speed, accelerate, route, etc.) among
them for automatic piloting and
intelligent traffi c control.54
The move towards vehicular connectivity
began over a decade ago with a focus on
the development and advancement of the
5.9 gigahertz (GHz) dedicated short-range
communication (DSRC) wireless regime.
Comprised of on-board units (OBUs) that
reside within the vehicle and transmit and
receive a basic safety message (BSM), as well
as roadside units (RSUs) that are mounted
primarily on intersection infrastructure to
receive and transmit BSMs and signal phase
and timing (SPAT) data, DSRC establishes a
King County, WA
Chittenden County, VT
Long Island, NY (2)
Washoe County, NV
Denver, CO* Blacksburg, VA
Fairfax County, VA
Orlando, FL
I-80 Corridor, WY*
Houston, TX* Orlando, FLTampa, FL*
Minneapolis, MN
Tuscaloosa, AL
Greenville, SC
Miami International Airport, FL
I-580, NV
Los Angeles, CA (2)*
Maricopa County, AZ
Number of Vehicles72,556
Number of Devices(V2V and V2I)
65,665
Las Vegas, NV
Salt Lake City, UT
I-70 Mountain Corridor, CO
Eastern Idaho
San Francisco, CA*
Palo Alto, CA
Niagara, NY*
Buffalo, NY
Southeast Michigan
Ann Arbor, MI
Ypsilanti Township, MI
Lansing, MI
Sunnyvale, CA/UC Berkeley
San Jose, CA
Ann Arbor, MI
Oakland County, MI
Southwest Michigan
Lansing, MICleveland, OH
Columbus, OH
US 33, OH*
Pittsburgh, PA (2)*
Ross Township, PA
Harrisburg, PA
Penn DOT I-76
Manhattan, NY*
Brooklyn, NY*Brooklyn, NY
Manhattan, NY
Penn DOT I-76
Fairfax County, VAFairfax County, VAFairfax County, VAFairfax County, VA
Blacksburg, VABlacksburg, VA
Fairfax County, VA
Ypsilanti Township, MIYpsilanti Township, MIYpsilanti Township, MIYpsilanti Township, MI
Ann Arbor, MIAnn Arbor, MIAnn Arbor, MI
Ypsilanti Township, MIYpsilanti Township, MI
Ann Arbor, MI
Lansing, MILansing, MILansing, MILansing, MI
Minneapolis, MNMinneapolis, MNMinneapolis, MN
King County, WAKing County, WAKing County, WA
Eastern IdahoEastern Idaho
Washoe County, NVWashoe County, NV
King County, WA
Houston, TXHouston, TXHouston, TX
Orlando, FL
Miami International Airport, FLMiami International Airport, FL
Chittenden County, VTChittenden County, VTChittenden County, VTChittenden County, VTChittenden County, VT
Pittsburgh, PA
Ross Township, PARoss Township, PA
Harrisburg, PA
Pittsburgh, PA Pittsburgh, PA Pittsburgh, PA Pittsburgh, PA
Fairfax County, VAFairfax County, VAFairfax County, VAFairfax County, VAFairfax County, VAFairfax County, VA
Tuscaloosa, ALTuscaloosa, ALTuscaloosa, ALTuscaloosa, ALTuscaloosa, AL
Eastern Idaho
I-80 Corridor, WY
Salt Lake City, UTSalt Lake City, UT
Eastern Idaho
Maricopa County, AZ
I-70 Mountain Corridor, CO
Washoe County, NVWashoe County, NVWashoe County, NV
Blacksburg, VABlacksburg, VABlacksburg, VA
Greenville, SCGreenville, SC
Blacksburg, VA
Greenville, SC
Washoe County, NVWashoe County, NVWashoe County, NV
Los Angeles, CA
Las Vegas, NV
Los Angeles, CA
Las Vegas, NV
Los Angeles, CA
Washoe County, NVWashoe County, NVWashoe County, NV
Las Vegas, NV
Chittenden County, VTChittenden County, VTChittenden County, VTChittenden County, VT
Greenville, SCGreenville, SCGreenville, SCGreenville, SCGreenville, SC
Brooklyn, NYBrooklyn, NYBrooklyn, NY
Pittsburgh, PA Pittsburgh, PA
Ross Township, PA
Brooklyn, NY
Ross Township, PARoss Township, PA
Pittsburgh, PA
Ross Township, PA
Cleveland, OH
Columbus, OHColumbus, OH
US 33, OHUS 33, OHUS 33, OH
Cleveland, OHCleveland, OHCleveland, OH
Columbus, OH
US 33, OHUS 33, OH
Minneapolis, MNMinneapolis, MNMinneapolis, MN
King County, WAKing County, WAKing County, WA
Houston, TXHouston, TXHouston, TX
Tuscaloosa, ALTuscaloosa, ALTuscaloosa, ALTuscaloosa, ALTuscaloosa, ALTuscaloosa, AL
Houston, TX
Ross Township, PARoss Township, PA
Harrisburg, PA
Ross Township, PARoss Township, PARoss Township, PARoss Township, PARoss Township, PA
Harrisburg, PA
Ross Township, PARoss Township, PA
Harrisburg, PA
Cleveland, OH
Oakland County, MI
Cleveland, OH
Columbus, OHColumbus, OH
US 33, OHUS 33, OHUS 33, OHUS 33, OHUS 33, OHUS 33, OH
Cleveland, OH
Columbus, OH
US 33, OH
Oakland County, MI
Southwest Michigan
Blacksburg, VABlacksburg, VA
Greenville, SC
Blacksburg, VABlacksburg, VA
Greenville, SC
Blacksburg, VA
Greenville, SC
I-80 Corridor, WYI-80 Corridor, WY
Salt Lake City, UTSalt Lake City, UTSalt Lake City, UT
Las Vegas, NV
King County, WAKing County, WAKing County, WA
Chittenden County, VTChittenden County, VTChittenden County, VTChittenden County, VT
Greenville, SCGreenville, SCGreenville, SCGreenville, SCGreenville, SCGreenville, SCGreenville, SCGreenville, SCGreenville, SCGreenville, SCGreenville, SCGreenville, SC
Ann Arbor, MIAnn Arbor, MIAnn Arbor, MIAnn Arbor, MIAnn Arbor, MIAnn Arbor, MI
Oakland County, MI
Southwest MichiganSouthwest Michigan
Lansing, MILansing, MILansing, MILansing, MILansing, MILansing, MI
Oakland County, MI
Southwest MichiganSouthwest Michigan
Lansing, MISalt Lake City, UTSalt Lake City, UTSalt Lake City, UT
I-70 Mountain Corridor, COI-70 Mountain Corridor, CO
Salt Lake City, UTSalt Lake City, UTSalt Lake City, UTSan Francisco, CA
Palo Alto, CA
Sunnyvale, CA/UC Berkeley
San Jose, CA
Los Angeles, CA Los Angeles, CA
Sunnyvale, CA/
Los Angeles, CA Los Angeles, CA
Manhattan, NY
Brooklyn, NYBrooklyn, NYBrooklyn, NYBrooklyn, NYBrooklyn, NY
Manhattan, NY
Las Vegas, NVLas Vegas, NV
Los Angeles, CA Los Angeles, CA
Las Vegas, NVLas Vegas, NV
Maricopa County, AZMaricopa County, AZMaricopa County, AZ
Las Vegas, NV
Los Angeles, CA Los Angeles, CA Los Angeles, CA Los Angeles, CA
Las Vegas, NV
Los Angeles, CA
Cleveland, OHCleveland, OHCleveland, OHCleveland, OHCleveland, OHCleveland, OHCleveland, OHCleveland, OHCleveland, OH
Ann Arbor, MI
Oakland County, MI
Ann Arbor, MI
Oakland County, MIOakland County, MI
Southwest Michigan
Oakland County, MI
Southwest MichiganSouthwest MichiganSouthwest Michigan
Lansing, MILansing, MI
Oakland County, MI
Southwest Michigan
Oakland County, MI
Southwest Michigan
Lansing, MILansing, MI
Ross Township, PARoss Township, PARoss Township, PARoss Township, PARoss Township, PA
Harrisburg, PA
Penn DOT I-76Penn DOT I-76Penn DOT I-76Penn DOT I-76Penn DOT I-76
Harrisburg, PAHarrisburg, PA
Ross Township, PARoss Township, PA
Harrisburg, PA
Ross Township, PA
Penn DOT I-76Penn DOT I-76Penn DOT I-76
Manhattan, NYManhattan, NYManhattan, NYManhattan, NYManhattan, NYManhattan, NY
Ann Arbor, MI
Ypsilanti Township, MI
Lansing, MI
Ypsilanti Township, MI
Southeast Michigan
Ann Arbor, MI
Ypsilanti Township, MIYpsilanti Township, MIYpsilanti Township, MIYpsilanti Township, MIYpsilanti Township, MI
Southeast Michigan
Ann Arbor, MIAnn Arbor, MI
Southeast Michigan
Ann Arbor, MI
Ypsilanti Township, MI
USDOT Funded Projects
Non-DOT Funded Projects
2017 Planned Deployments*
Figure 6: Connected Vehicle (DSRC) Deployments Across The U.S. (2017)
Source: USDOT JPO
simple yet effective safety system that enables
vehicles to “see” each other even when
their human drivers can’t – and potentially
address up to 80 percent of serious crashes.55
Scenarios where DSRC can prove especially
effective include when vehicles are making
blind left turns at intersections and assistance
with avoiding red light violation accidents.
DSRC has signifi cant real-world experience,
with perhaps the most prominent pilot project
being the Ann Arbor Connected Vehicle Test
Environment (formerly Safety Pilot). The
University of Michigan (U-M) has operated
this pilot since 2012 with the world’s largest
contingent of DSRC-connected cars, trucks
and buses.56 Yet as Figure 6 illustrates, DSRC
pilot deployments are located throughout
the country, and involve over 70,000 total
vehicles (as of 2017):

EMERGING MOBILITY TECHNOLOGIES AND TRENDS24
and broadcasts pertinent information to 200
DSRC-equipped vehicles.60 It remains to be
seen whether individual OEMs’ efforts such
as these are sufficient to prompt broad-based
DSRC OBU and RSU deployments among
other OEMs and regions.
Meanwhile, alternate connected vehicle
regimes have advanced and are gaining
prominence. These alternate regimes, which
include cellular V2X (C-V2X) and the fifth
generation of cellular mobile communications
(5G), have an advantage over DSRC in that
their advancement is furthered by multiple
markets rather than exclusively by automotive
safety and management. The ubiquity of
cellular networks offering 4G (LTE/WiMax)
came about as a result of consumers’ growing
demand for bandwidth to better enable
smartphone features such as high-definition
video streaming, with the serendipitous
byproduct being the establishment of a
platform and infrastructure that has the
potential to fully achieve the V2X requirements
of and efficiently pave the way to connected
and automated driving.61
The same will be true, at least in part, for 5G,
which has the potential to enable consumers of
entertainment to reduce the amount of time it
takes to download a high-definition video from
ten minutes via the current 4G LTE network to
under a second.62 5G is comprised of a suite of
new technologies, including include millimeter
waves, small cells, massive MIMO, full duplex,
and beamforming.
5G is advancing not only because of
smartphone users’ needs to download larger
files faster, but also because of the forthcoming
commercialization of a broad array of connected
electronics, as previously discussed.
The challenge with DSRC is that it poses a
typical chicken-and-egg scenario, in that the
effectiveness of equipping any one vehicle with
an OBU depends on the widespread inclusion
of OBUs and RSUs within other vehicles and
intersections, respectively. While individual
OBUs and RSUs aren’t inordinately expensive
on their own, the aggregate cost to any single
manufacturer or municipality of equipping
entire fleets and intersections with equipment
can be significant. This, along with the fact that
benefits won’t be realized unless a sufficient
number of others follow suit, serves to dissuade
early adopters.
Some automakers have taken initiative by
announcing plans to advance DSRC. Toyota
Motor Corporation, with nearly 2.5 million
vehicle sales per year, is the third-largest seller
of vehicles in the U.S. and has announced plans
to include DSRC OBUs in vehicles sold in the
U.S. starting in 2021 with the goal of inclusion
across most of its lineup by the mid-2020s.57
The company already has more than 100,000
DSRC-equipped cars are on the road in Japan.58
Volkswagen is working with Siemens to deploy
DSRC in Volkswagen Group vehicles in Europe
starting in 2019. GM started deploying DSRC-
enabled vehicles in the U.S. with its 2017
Cadillac CTS sedans, and will build upon this
by equipping high-volume Cadillac crossover
vehicles with DSRC by 2023 and the entire
Cadillac portfolio following after that.59 In
October 2018, Honda partnered with the
city of Marysville, Ohio to demonstrate and
deploy a “Smart Intersection” whereby four
cameras mounted above the traffic lights
capture bird's-eye-view video of surrounding
vehicles and pedestrian traffic. Honda's
image processing software then creates a
360-degree image of the intersection that
classifies vehicles and other moving objects

INTRODUCTION 25
Counted among those drivers are automotive
uses that don’t pertain to safety or
management. For instance, in future scenarios
whereby highly-automated vehicles (HAVs)
chauffer passengers who have newfound
idle time as their requirement to control
the vehicles decreases, in-vehicle streaming
entertainment will become increasingly
prominent and diverse. With its ability to
deliver data with less than a millisecond of
delay (compared to about 70 ms on today’s 4G
networks) and bring peak download speeds of
20 GB/s (compared to 1 GB/s on 4G) to users,
5G has the potential to enable every vehicle
to become a rolling entertainment venue,
while also satisfying its broader V2X needs.
Researchers have already demonstrated the
ability to use a 5G frequency to send data at
speeds of up to 2.867 GB/s to a connected
vehicle, which is almost 40 times faster than
speeds achieved with fixed line broadband.64
AT&T began introducing 5G in 12 U.S. cities
in 2018. In August 2018, it announced that it
would equip a community in Texas with 5G to
enable pilot programs with the ultimate goal of
creating a synchronized urban transportation
network. Verizon has similar commercialization
efforts under way, focused on providing home
broadband via 5G. Both companies caution
that these initial deployments won’t include
V2X communication applications, and that
the network speeds consumers experience
will differ from what is theoretically possible,
given that the first iterations of 5G to reach
consumers likely won’t be “true 5G” but instead
be more of an expansion of 4G LTE.65
With such a market-driven advantage and
existing commercial pursuits, it’s easy to
conclude that 5G will be the “winner” in the
race to connect cars. Yet the challenges to
commercializing 5G are formidable, including
fully defining what 5G comprises, establishing
connections to billions of Internet of Things
(IoT) devices, distributing information over
millimeter-wave bands, and overcoming
geographical disparities in Internet access
that leaves a substantial portion of the
world unconnected.
Clarity on the federal government’s 5G policies
is also nascent. The Commerce Department
is developing a long-term comprehensive
national spectrum strategy that is expected
by July 2019 to prepare for the introduction
of next-generation 5G wireless networks.
While the goal is to ensure there is enough
spectrum to handle the growing amount of
Internet and wireless traffic and that future
faster 5G networks have adequate spectrum,
it’s unclear to what degree this strategy
will advance (or hinder) 5G beyond existing
commercial pursuits.66
peak data rates
latency for ultra-reliable
for massive machine-type
for the enhanced mobile
low-latency communication
communications (MMTC)
broadband (eMBB)
(URLLC)
standardasdefined by the International Telecommunication Union635G
<1ms
>1Mdevices/km2
>10GB/s

EMERGING MOBILITY TECHNOLOGIES AND TRENDS26
of automated vehicles in the future. Vehicle
automation is enabled by a combination of
software and hardware. Software tends to be
oriented around developing two categories of
artificial intelligence (AI) for vehicular control:
machine learning and deep learning. Machine
learning occurs when machine algorithms use
statistics to find patterns in large datasets. Deep
learning, which is a subset of machine learning
that has received increased interest in recent
years (see Figure 7), occurs when artificial neural
networks – algorithms inspired by the human
brain’s structure and function – learn from (and
in essence, write) their own programming based
on large amounts of data.72 Another primary
category of software development involves
localization, which determines a vehicle’s
location based upon high-definition mapping,
precision GPS, and other strategies.
Automated vehicle hardware, on the other
hand, is primarily comprised of an array of
sensors. Connectivity – whether it’s DSRC,
C-V2X, or 5G – could be viewed as one such
example that enables vehicles to “see” around
corners and otherwise coordinate in ways that
line-of-sight sensors cannot. Other examples
of automated vehicle sensors include:
Ultrasonic: Ultrasonic sensors determine
locations of objects by sending out sound
waves, then collecting and processing their
reverberations after they impact nearby
objects. Ultrasonic are perhaps the most refined
and commercial of the various sensors related
to automation, given their longstanding use in
numerous industries and current widespread
application in conventional automobiles to
enable features such as parking assist. They are
also perhaps the least crucial to the AV sensor
suite, for their short (i.e., ~2 meter) range means
they’re only used at low speeds.
Perhaps 5G’s biggest challenges are location
and cost. While 4G towers can deliver
service for up to 10 miles, true 5G waves
can only deliver service up to 1,000 feet. 5G
waves also can have difficulty penetrating
walls and windows, and could even be
hindered by leaves on trees. While carriers
say the solution to those problems is more
cell towers, overcoming these wavelength
challenges would require thousands of
new towers, which can be a very expensive
proposition.67 The wireless communications
industry forecasts that building nationwide
5G networks will require 300,000 new cell
sites to be erected by 2020. That is about
double the approximately 150,000 cell towers
in existence today, a number that took over
35 years to reach.68 The timing of such a large
investment could be daunting considering that
some, including the “ComSenTer” academic
research effort,69 are already considering and
preparing for 6G networks.
Thus, while the tendency is to position DSRC
and 5G as competing platforms, of which one
market winner will emerge, it could be that the
fully-realized future of connected vehicles sees
the two technologies working together, with
DSRC offering essential safety features – for
which some have argued it’s best suited70 – and
5G offering connectivity for entertainment and
services, as well as a degree of redundancy.
In fact, one model indicates that an approach
that synthesizes DSRC with C-V2X (and by
implication 5G, once it’s available) achieves
all V2X use cases today, is simpler, and
more affordable.71
Automated Vehicles
Connectivity matters not just in that it can
save lives and stream services today, but also
in that it can pave the way for higher levels

INTRODUCTION 27
classify and interpret their surroundings.
They’re widely available and significantly
cheaper than other types of sensors, such
as radar and lidar. Cameras’ challenges and
shortcomings include dealing with bad weather
and the algorithmically complex computing
required to process their data, thus potentially
driving up systematic costs elsewhere.
Lidar: Light Detection And Ranging, or lidar, is
comprised of a laser transmitter and a highly
sensitive receiver. Lidar systems transmit beams
of lights and then measure the returning signals
when the light reflects off of an object to establish
precise and detailed geospatial information
about a vehicle’s surroundings. Lidar is similar
to radar, but can have a higher resolution, since
the wavelength of light is about 100,000 times
smaller than radio wavelengths, and thereby
can establish detailed three-dimensional
Radar: Radio Detection And Ranging, or radar,
uses radio waves to detect and localize objects.
In wide use for decades in diverse industries
and applications ranging from meteorology
to air traffic control, radar sensors have
become common in vehicle applications in
recent years. Their prices have decreased and
vehicular features that rely on radar such as
Automatic Emergency Braking (AEB) and blind
spot detection have increased. A combination
of short-range radar (SRR) and mid/long-
range radar (MRR/LRR) sensors are placed
throughout a vehicle’s perimeter to gather
unfiltered information about surrounding
objects of various distances, all of which is fed
to the vehicle’s central computer for processing
and integration into its decision-making.
Optical: Cameras can be a very efficient and cost
effective tool for helping automated vehicles
1986 1988 1990 1992 1994 1996 1998 2000 2002 2004 2006 2008 2010 2012 2014 20182016
30K
25K
20K
15K
10K
5k
0
Year
Pu
bli
cati
on
sFigure 7: Recent Rise in Deep Learning Research
Source: Dimensions

EMERGING MOBILITY TECHNOLOGIES AND TRENDS28
navigation, and timing (PNT) services on a
global or regional basis. Automated vehicles use
GNSS to enable localization, or awareness of its
current location within the broader landscape.
While the Global Positioning System (GPS) is
the most prevalent GNSS, other nations are
fi elding, or have fi elded, their own systems to
provide complementary, independent PNT
capability.74 GPS is a U.S.-owned utility that
provides users with PNT services. This system
consists of three segments: the space segment,
the control segment, and the user segment. The
U.S. Air Force develops, maintains, and operates
the space and control segments.75
As efforts to overcome automated vehicles’
shortcomings advance, a new batch of sensors
might emerge to help with the effort. Time-of-
Flight (ToF) cameras, which are also referred to
as Flash Lidar or Time-of-Flight Lidar, use the
known speed of light to calculate distances and
dimensions, akin to functions performed by lidar
representations. Such representations are no
doubt valuable to automated vehicles’ efforts
to understand their surroundings, but have
sizeable drawbacks, fi rst and foremost being
cost. While initial vehicular mechanical lidar
systems could cost around $75,000 or more,
BNEF projects that demand from Waymo, Uber,
General Motors and Mercedes-Benz is expected
to lower the cost.73 In recent years, newer solid-
state sensors have emerged that are targeting
price points of a couple hundred dollars. Still,
given that most automated vehicle developers
employ multiple lidars per vehicle, developers are
continually working to lower costs. Additional
current efforts include improving lidar’s range,
poor weather performance, velocity data, and
ability to be physically integrated so as not to
impair vehicles’ aesthetics.
Global Navigation Satellite System (GNSS):GNSS is a general term describing any satellite
constellation that provides positioning,
Lane DepartureWarning
Cross TrafficAlert
ParkAssist
ParkAssist
• Emergency Braking• Pedestrian Detection• Collision Avoidance
Rear CollisionWarning
Blind SpotDetection
Surround View
Park Assistance/Surround View
Adaptive Cruise ControlGNSS
Surround View
Traffic SignRecognition
Long-Range Radar
Short/Mid-Range Radar
LIDAR
Camera
Ultrasound
GNSS
Figure 8: Typical Automated Vehicle Sensor Placement and Functionality

INTRODUCTION 29
• Level 0 – No Automation: The full-time
performance by the human driver of
all aspects of the dynamic driving task,
even when enhanced by warning or
intervention systems;
• Level 1 – Driver Assistance: The
driving mode-specific execution
by a driver assistance system of
either steering or acceleration/
deceleration using information about
the driving environment and with the
expectation that the human driver
performs all remaining aspects of the
dynamic driving task;
• Level 2 – Partial Automation: The
driving mode-specific execution by
one or more driver assistance systems
of both steering and acceleration/
deceleration using information about
the driving environment, and with the
expectation that the human driver
performs all remaining aspects of the
dynamic driving task;
• Level 3 – Conditional Automation: The
driving mode-specific performance by
an Automated Driving System (ADS) of
all aspects of the dynamic driving task
with the expectation that the human
driver will respond appropriately to a
request to intervene;
• Level 4 – High Automation: The
driving mode-specific performance by
an ADS of all aspects of the dynamic
driving task, even if a human driver
does not respond appropriately to a
request to intervene;
• Level 5 – Full Automation: The full-time
performance by an ADS of all aspects
of the dynamic driving task under all
roadway and environmental conditions
that can be managed by a human driver.
but at a lower cost. Ground-penetrating radar
(GPR) bolted underneath a vehicle’s chassis can
help create a high definition, navigable map by
scanning 126 times per second up to 10 feet
underground, looking at geologic and man-
made features like soil density, the location of
pipes, cavities, roots, rocks and other larger
and more stable features that are unlikely to
change over time.76
“Sensor fusion” refers to vehicles’ capabilities
to aggregate, process, and synthesize
information collected from all of the vehicle’s
sensors – whether they are the same type or
different – into one coherent understanding of
its surroundings. It’s also an approach by which
vehicles can leverage what redundancies
exist to further validate their understanding
of their surroundings and ensure that safe
and accurate courses of action are made.
Sensor fusion is a hot topic in automation,
driving much of the work in both software and
hardware development. Various sensors’ roles
in enabling different levels of automation are
depicted in Figure 8. It shows how sensors’
placement and capabilities can enhance
and compensate for relative capabilities
and shortcomings.
As sensor data is fused within a vehicle’s central
processing unit (CPU) and software determines
the appropriate course of a vehicle’s action,
automation is enabled. The degree to which a
vehicle is automated is measured by standards
first established by the Society of Automotive
Engineers (SAE) and later adopted into the
National Highway Traffic Safety Administration
(NHTSA) Federal Automated Vehicles Policy
(FAVP) for safe testing and deployment of
automated vehicles.77 This standard identifies
six driving automation levels:78

EMERGING MOBILITY TECHNOLOGIES AND TRENDS30
less intensive and thus expensive sensors and
other components (e.g., lower-range lidar) can
be used to enable these features. It is thus
likely that these lower levels of automation
will be primarily associated with business
models oriented around the purchase of
vehicles. Alternately, the functions performed
at the higher levels of automation (i.e., L 4-5),
whereby humans can cede control some or all
of the time, require more intensive and thus
expensive sensors and processing to ensure
that the vehicle can safely navigate whatever
The functionality of automated vehicles
conveyed by their levels of automation can
imply user models and scenarios for ownership
and use. The functions of advanced driver
assist systems (ADAS), which include features
such as lane keeping assist (LKA) and adaptive
cruise control, fall within the lower (i.e., L 1-3)
levels of automation, are compatible with the
current automotive paradigm for ownership
and use, and are commercially available.
Because humans are still in control during
most scenarios at these levels of automation,
Table 2: SAE Levels of Vehicular Automation and Functionality
SAELevel Name ExamplesVehicleControl
MonitoringFallBackControl
VehicleCapability
0No Automation
N/A Human Driver Human Driver Human Driver N/A
1Driver Assistance
Adaptive Cruise Control / Lane Keeping & Parking Assist
Human Driver & Vehicle
Human Driver Human DriverSome Driving Modes
2Partial Automation
Traffic Jam Assist
Vehicle Human Driver Human DriverSome Driving Modes
3Conditional Automation
Full Stop & Go Highway Driving, Self Parking
Vehicle Vehicle Human DriverSome Driving Modes
4High Automation
Automated Driving
Vehicle Vehicle VehicleSome Driving Modes
5Full Automation
Driverless Vehicle Operation
Vehicle Vehicle VehicleAll Driving Modes
Source: Society of Automotive Engineers

INTRODUCTION 31
caused by human-pilot vehicles that share
the roadways rather than the AV systems
themselves. Finally, miles accrued indicate
nothing about how valuable those miles
were in teaching the AV system to handle a
given scenario.
Safety is always within some domain, for there
will always be some domain in which any level
of vehicular automation is unsafe. The federal
government encourages automated vehicles’
respective manufacturers to denote and, for
the most part, self-certify their particular
Operational Design Domain (ODD). The
information included as part of the ODD
includes the specific conditions under which a
given ADS or feature is intended to function,
including roadway types, geographic areas,
speed ranges, environmental conditions (e.g.,
weather, daytime/nighttime, etc.), and other
domain constraints.82
Thus, when it comes to the safe operation of
a vehicle, ODD certification is paramount. It
should focus on the mobility that is trying to
be achieved; the application, placement, and
fusion of sensors to enable a vehicle to perform
as required within a prescribed domain;
and subsequently the level of functionality
within that domain. Additional factors include
how AVs perform on roadways with other
(automated and non-automated) vehicles83
and the qualification and certification of the
compute platforms underpinning automated
driving to ensure they’re able to handle the
range of harsh environments that come
with road travel.
Taking these and other factors into account,
the International Transport Forum (ITF) at the
Organization for Economic Co-operation and
Development (OECD), an intergovernmental
scenario may arise. While later portions of
this publication outline additional drivers of
shared mobility and ownership models, it may
be that the price point of the necessary L 4-5
components alone drives models of shared
ownership, whereby the high initial costs can
be amortized by a pool of users over time.
That said, the levels of automation contribute
little to understanding an automated vehicle’s
broader contextual functionality, which
most importantly pertains to safety. Early
indications are that the levels of automation
are falling short of facilitating a broader
understanding and acceptance of vehicles’
inherent technologies and performances. The
AAA Foundation for Traffic Safety concluded
that most drivers don't understand the
limitations of the lower levels of automation
– namely ADAS – particularly blind spot
monitoring, forward-collision warning, and
automatic emergency braking.79 Combined
with the fact that the Insurance Institute for
Highway Safety (IIHS) declared that various
ADAS technologies could be unreliable and
require human intervention, an outcome
confirmed by the AAA,80 the misunderstanding
of ADAS technologies could prove fatal.81
For the higher levels of automation, a
fundamental problem exists in the ways that
progress is measured. Typically, companies
– and some states, like California – collect
and report metrics such as disengagements,
accidents, and miles accrued, all of which
are problematic. The number of times an
automated system is disengaged can either
indicate that it is exposed to too few instructive
scenarios (if not disengaged enough) or
that it is not learning enough (if disengaged
too frequently). Regarding accidents, the
overwhelming majority to date have been

EMERGING MOBILITY TECHNOLOGIES AND TRENDS32
organization with 59 member countries
that acts as a think tank for transport policy
and ministers, suggests measures for road
authorities to take to help ensure that roads
become safer as automated vehicles deploy:84
and in-vehicle data generated from on-
board sensor arrays, from other vehicles, the
infrastructure, and the cloud.85 This significant
amount of electrical power would actually be
much greater – between 1.5 and 4 kW, which
almost equates the power consumption for
propulsion when driving urban streets86 – if
a projected 90 percent reduction in energy
consumption from dedicated processors fails
to materialize. Electrical needs and efficiency
considerations are prompting manufacturers
to focus on advancing automated technologies
primarily in plug-in vehicles, whether
hybridized or propelled solely by electricity.
While electrification solves the problem of
power supply, automated electric vehicles’ grid
electricity consumption and carbon footprint
could be impaired.
Aside from the vehicle itself, uncertainties
regarding the final format, business models, and
usage of CAVs mean that there are uncertainties
regarding their impact on energy consumption
and greenhouse gas (GHG) emissions. For
instance, the Technical University of Vienna
in Austria concluded that, should AVs be
privately owned rather than shared, they
would increase vehicle miles traveled (VMT) by
between 15 percent and 59 percent, and would
also increase suburban sprawl.87 Conversely,
researchers from the University of Delaware,
University of Virginia, and Boston University
found that algorithms for automated vehicles
could help coordinate traffic patterns, resulting
in conserved momentum and saved fuel. They
also found that self-driving cars would be more
likely to avoid rear-end crashes when slowing
down by finding the optimal acceleration and
deceleration rates.88 Other research indicates
that a single automated vehicle mixed in with
20 human-driven vehicles can help eliminate
traffic congestion.89
Beyond safety, an automated vehicle’s
environmental footprint is of paramount
importance when considering its
evaluation, application, and mass-market
commercialization. With their array of sensors,
intense computing power, and consistent
wireless data transmission, automated vehicles’
consumption of electricity could be significant.
One automotive supplier projects AVs will
require 200 to 350 W to process incoming
Ensuring Safety with Autonomous Vehicles
• Avoid safety performance being used to market competing automated vehicles;
• Carefully assess the safety impacts of systems that share driving tasks between humans and machines;
• Report on safety-relevant data collected from automated vehicles;
• Apply Vision Zero thinking to automated driving to eliminate road fatalities;
• Develop and use a staged testing regime for automated vehicles;
• Establish comprehensive cybersecurity principles for automated driving;
• Ensure the functional isolation of safety-critical systems and that connectivity does not compromise cybersecurity or safety; and
• Provide clear and targeted knowledge about the vehicles’ capabilities.

INTRODUCTION 33
and others, the DOE concluded that the
widespread deployment and use of CAVs could
increase system-wide energy consumption by
200 percent or decrease it by 60 percent, as
represented in Figure 9.90
Similarly, U-M performed a life cycle
assessment (LCA) of Level 4 CAV sensing and
computing subsystems integrated into internal
combustion engine vehicle (ICEV) and battery
The U.S. Department of Energy (DOE)
National Laboratories took a broad look at
how CAVs can affect future energy use and
other environmental factors. It examined four
possible mobility futures that could exist in
2050 and the positive and negative impacts
of these futures on energy consumption and
the broader economy. Based on variables such
as improved crash avoidance, eco-driving,
increased features, travel cost reductions,
25%
50%
75%
100%
125%
150%
175%
200%
0
-50%
-25%
-75%
-100%
-125%
-150%
-175%
-200%
Cu
rre
nt
En
erg
y C
on
sum
pti
on
Lev
els
200%
-60%
Factors potentially contributing to an increase in energy consumption and associated emissions: Reduced Travel Costs Increase Vehicle Miles Traveled (VMT) Zero-Occupancy Vehicles Access for New User Groups Faster Driving Speeds Shipment of Goods Increased Features
Factors potentially contributing to a decrease in energy consumption and associated emissions: Platooning or Drafting Eco-Driving Congestion Mitigation De-emphasized Performance Emerging Mobility Service Models Improved Crash Avoidance Power Train Efficiencies Zero Emission Vehicles (ZEVs) Less Hunting for Parking Vehicle Right Sizing
Figure 9: Prospective Energy Impacts of Connectivity and Automation
Source: U.S. Department of Energy
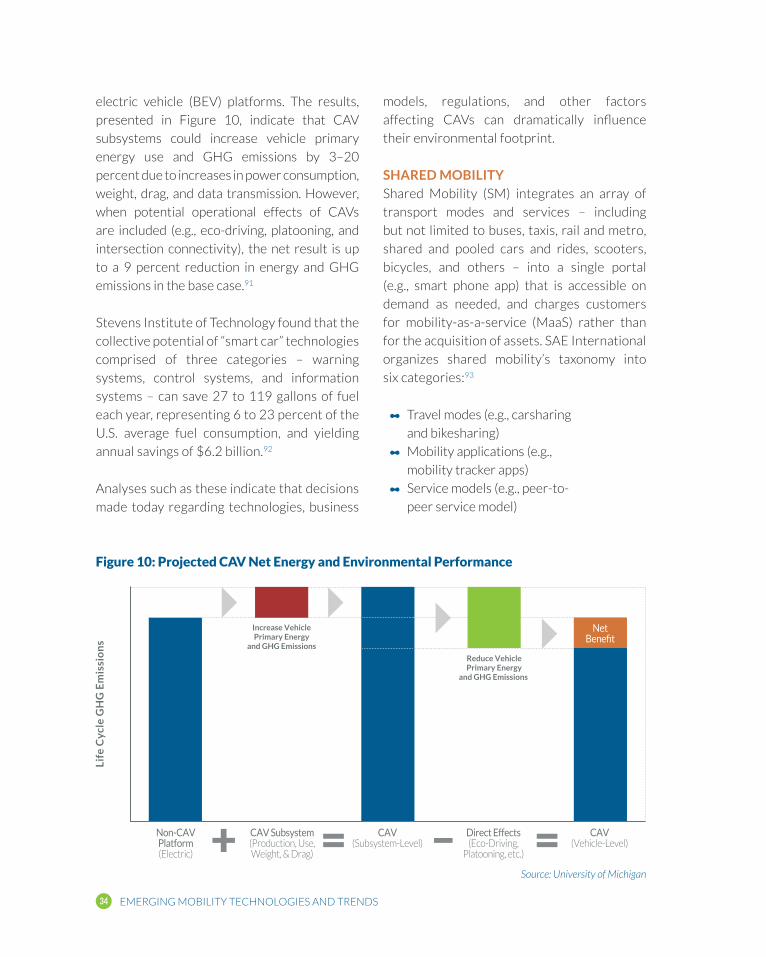
EMERGING MOBILITY TECHNOLOGIES AND TRENDS34
models, regulations, and other factors
affecting CAVs can dramatically influence
their environmental footprint.
SHAREDMOBILITYShared Mobility (SM) integrates an array of
transport modes and services – including
but not limited to buses, taxis, rail and metro,
shared and pooled cars and rides, scooters,
bicycles, and others – into a single portal
(e.g., smart phone app) that is accessible on
demand as needed, and charges customers
for mobility-as-a-service (MaaS) rather than
for the acquisition of assets. SAE International
organizes shared mobility’s taxonomy into
six categories:93
• Travel modes (e.g., carsharing
and bikesharing)
• Mobility applications (e.g.,
mobility tracker apps)
• Service models (e.g., peer-to-
peer service model)
electric vehicle (BEV) platforms. The results,
presented in Figure 10, indicate that CAV
subsystems could increase vehicle primary
energy use and GHG emissions by 3–20
percent due to increases in power consumption,
weight, drag, and data transmission. However,
when potential operational effects of CAVs
are included (e.g., eco-driving, platooning, and
intersection connectivity), the net result is up
to a 9 percent reduction in energy and GHG
emissions in the base case.91
Stevens Institute of Technology found that the
collective potential of “smart car” technologies
comprised of three categories – warning
systems, control systems, and information
systems – can save 27 to 119 gallons of fuel
each year, representing 6 to 23 percent of the
U.S. average fuel consumption, and yielding
annual savings of $6.2 billion.92
Analyses such as these indicate that decisions
made today regarding technologies, business
Figure 10: Projected CAV Net Energy and Environmental Performance
Source: University of Michigan
Non-CAVPlatform(Electric)
CAV Subsystem(Production, Use,Weight, & Drag)
CAV(Subsystem-Level)
Direct Effects(Eco-Driving,
Platooning, etc.)
CAV(Vehicle-Level)
NetBenefit
Life
Cyc
le G
HG
Em
issi
on
s
Increase VehiclePrimary Energy
and GHG Emissions
Reduce VehiclePrimary Energy
and GHG Emissions
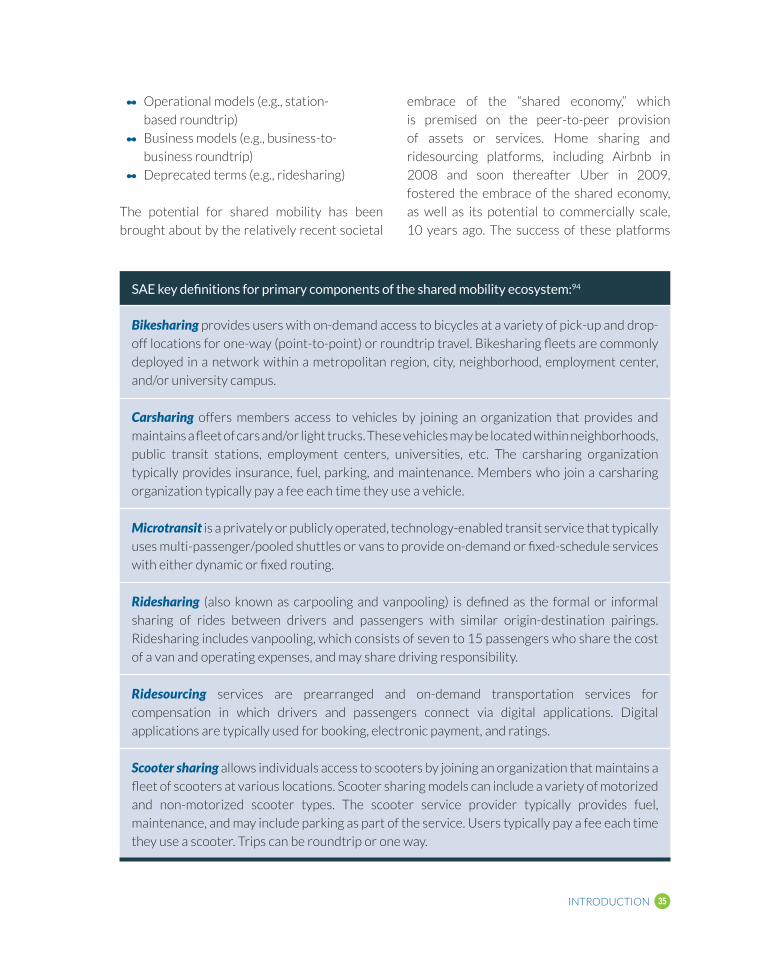
INTRODUCTION 35
embrace of the “shared economy,” which
is premised on the peer-to-peer provision
of assets or services. Home sharing and
ridesourcing platforms, including Airbnb in
2008 and soon thereafter Uber in 2009,
fostered the embrace of the shared economy,
as well as its potential to commercially scale,
10 years ago. The success of these platforms
• Operational models (e.g., station-
based roundtrip)
• Business models (e.g., business-to-
business roundtrip)
• Deprecated terms (e.g., ridesharing)
The potential for shared mobility has been
brought about by the relatively recent societal
SAEkeydefinitionsforprimarycomponentsofthesharedmobilityecosystem:94
Bikesharing provides users with on-demand access to bicycles at a variety of pick-up and drop-
off locations for one-way (point-to-point) or roundtrip travel. Bikesharing fleets are commonly
deployed in a network within a metropolitan region, city, neighborhood, employment center,
and/or university campus.
Carsharing offers members access to vehicles by joining an organization that provides and
maintains a fleet of cars and/or light trucks. These vehicles may be located within neighborhoods,
public transit stations, employment centers, universities, etc. The carsharing organization
typically provides insurance, fuel, parking, and maintenance. Members who join a carsharing
organization typically pay a fee each time they use a vehicle.
Microtransit is a privately or publicly operated, technology-enabled transit service that typically
uses multi-passenger/pooled shuttles or vans to provide on-demand or fixed-schedule services
with either dynamic or fixed routing.
Ridesharing (also known as carpooling and vanpooling) is defined as the formal or informal
sharing of rides between drivers and passengers with similar origin-destination pairings.
Ridesharing includes vanpooling, which consists of seven to 15 passengers who share the cost
of a van and operating expenses, and may share driving responsibility.
Ridesourcing services are prearranged and on-demand transportation services for
compensation in which drivers and passengers connect via digital applications. Digital
applications are typically used for booking, electronic payment, and ratings.
Scooter sharing allows individuals access to scooters by joining an organization that maintains a
fleet of scooters at various locations. Scooter sharing models can include a variety of motorized
and non-motorized scooter types. The scooter service provider typically provides fuel,
maintenance, and may include parking as part of the service. Users typically pay a fee each time
they use a scooter. Trips can be roundtrip or one way.

EMERGING MOBILITY TECHNOLOGIES AND TRENDS36
seconds using GNSS, orient themselves with
accelerometer and gyroscopic sensors, and
collect and share photographic data via small
optical (i.e., camera) sensors.
With people comfortable using other peoples’
property and lending out their own, and
empowered with a convenient platform
by which to source and price rides, shared
mobility is soaring. Today, approximately 40
million people use app-enabled carpooling
services, and the usage of ridesourcing apps
has grown to over 70 million users.96 In major
metropolitan areas, 21 percent of adults have
installed and used ridesourcing apps, and
an additional 9 percent of adults have used
ridesourcing with friends.97 Overall, nearly 10
percent of all Americans use ridesourcing in
any given month. 98
Given the large – and growing – user base,
many have hypothesized that shared mobility
has the potential to reduce the need to own
vehicles, make travel more efficient, and
altogether reduce congestion. Usage and
awareness of ridesourcing is widespread,
with 88 percent of respondents to an August
firmly disproved the longstanding notion that
Americans prefer not to share their private
property (i.e., cars and homes) with those
they don’t know, nor to access others’ private
property for safety, service, and other reasons.
Technological advancements are a second
factor elevating the potential for shared
mobility. Around the same time that home
sharing and ridesourcing made their first
appearances, the first smartphones arrived.
Apple’s iPhone hit the market in 2007, followed
shortly thereafter by Google’s first phone – the
G1 – in 2008. Today, 10 years after their arrival,
77 percent of Americans own a smartphone,
essentially putting a supercomputer in 250
million Americans’ pockets.95 Smartphones
enable shared mobility by performing tasks
fundamental to the collection and movement
of people and vehicles, such as running third-
party developers’ applications to locate and
match travelers, vehicles, and drivers. But
they also enable shared mobility functions by
leveraging other technological advancements,
namely the miniaturization and dramatic cost
reductions of sensors. As such, smartphones
can establish geo-spatial positioning within
2018 2023 2030
urban private car journeys replaced by
shared mobility
urban private car journeys replaced by
shared mobility annually
global MaaS revenues
17.6M >2.3B $1.0T+
Global Shared Mobility

INTRODUCTION 37
TECHNOLOGIES + TRAVEL MODES + BUSINESS MODELS = 21ST CENTURY MOBILITYElectrification, connection and automation,
and shared mobility each engender radical
leaps in and/or applications of technology.
Vehicle platforms and propulsion systems
are diversifying, and new business
models are emerging to facilitate access,
affordability, and mobility.
2018 survey aware of this mobility option
regardless of where they live.99 Furthermore,
39 percent of respondents indicated that
while access to mobility is necessary, owning
a vehicle is not, a 4 percentage-point increase
over 2015 results.100 That number jumps to
57 percent for urban consumers, a 13-point
increase since 2015. This means increasingly
more consumers are prioritizing technology
solutions that provide convenient and cost-
effective mobility over traditional vehicle
ownership, which can cost upwards of
$8,469 per year.101 As such, shared mobility
could replace over 2.3 billion urban private
car journeys annually in 2023, compared
with just 17.6 million globally in 2018,102
and global MaaS revenues could exceed $1
trillion by 2030.103
Carsharing has experienced slower, pocketed
growth with awareness at 54 percent. Lack
of widespread adoption is due in part to
carsharing being significantly less accessible
than other alternative transportation
methods. In urban areas where carsharing is
most prominent, only 44 percent of consumers
find it accessible versus the 85 percent of
consumers that find ridesourcing accessible.
The carsharing space also is fragmented
with many players, giving consumers a lot of
different options and leaving no clear leaders
in usage. Ridesourcing is less crowded, with
Uber (30 percent) and Lyft (18 percent) as the
clear front-runners in terms of usage among
respondents.104
While these modes and others are discussed in
greater depth in the chapter on the Midrange Domain, what’s important to note is the
significant financial, social, and other benefits
potentially afforded by sharing.
T he core objective for
21st century mobility
is to maintain – or exceed –
the mobility afforded by the
personal automobile while
negating its drawbacks,
including congestion, cost,
pollution, and collisions.
Yet each of these game-changing trends have
challenges and shortcomings that on their
own can impair their advancement. Electric
vehicles costs are coming down, but are still
higher than those of conventionally fueled
vehicles and/or have limited ranges. The
recharging infrastructure that many envision
is needed in order for electric vehicles to fully
displace those powered by gasoline would
require a sizeable investment if oriented
around current mobility paradigms. Connected
vehicles don’t yet have a standard platform,
which is impairing widespread rollout. Highly

EMERGING MOBILITY TECHNOLOGIES AND TRENDS38
each trend is more of a sustaining innovation
than a disruptive one.
Instead, the real change – the radical
disruption that has the potential to solve
the shortcomings of each of the dominant
trends – is the seamless combination and
integration of each of these three trends
while applying them not only to passenger
automobiles, but to a wide array of vehicles
and modes as well. Of particular importance
is the application of these technologies to
those vehicles at the bottom of the market
that are less sophisticated, expensive, and
complicated (e.g., scooters).105 These vehicles
– often introduced by smaller companies with
fewer resources than the incumbents – have
the most potential for classical “disruptive
innovation,”106 as illustrated in Figure 11.
automated vehicles are expensive to build,
would thus be prohibitively expensive for
consumers to purchase, are still a long way off
from higher levels of automation that would
enable their operation wherever a customer
might be, and might grow energy consumption
exponentially. Finally, shared mobility is in
several cases worsening traffic congestion,
particularly in urban regions, and in worst-
case scenarios is increasing fatalities.
Furthermore, while these three trends are
often referred to as disruptive, in the broader
mobility paradigm they are far from it. The
prediction about there being more change
in the next 10 years than in the previous 50
tends to be in reference to the automobile
industry, and thus engenders a 20th century
mobility mindset. As applied to automobiles,
Time
Me
asu
re o
f P
erf
orm
ance
Incumbents nearly always win
Entrants nearly always win
Disruptive Innovations
Pace of TechnicalProgress
Sustaining Innovations
Figure 11: The Classical Model of Disruptive Innovation Shows that Simpler Technologies Overlooked by Incumbents Win Over Time
Source: Clayton Christensen

INTRODUCTION 39
The potential for systemic disruption is
realized from the aggregation of each
mode’s disruptive potential. For instance,
the technologies that are driving the trends
towards electrification, connection and
automation, and shared mobility can be
applied not only to automobiles but also to
multiple other travel modes – ranging from
large-scale, multi-person, heavy vehicles to
single-passenger, unenclosed, micro-vehicles
– and can be utilized by travelers via numerous
business models based on what’s most
appropriate and affordable given the need and
function. Over time, each mode chips away
at the market segment for which it is most
appropriate to serve.
This combination of technologies, modes,
and business models is what forms the
framework for mobility in the 21st century,
and the aggregated disruptive potential
presents the pathway to establish it. The
core objective for 21st century mobility is to
maintain – or exceed – the mobility afforded
by the personal automobile while negating
its drawbacks, including congestion, cost,
pollution, and collisions. This effort entails not
simply displacing current automobiles with
variations, such as those that are electrified
or automated, but rather establishing the
viability of multiple modes of efficient,
electrified, and fully occupied vehicles that
act as a system. Such a system needs a central,
unifying “backbone” upon which the broader
architecture can be layered.

EMERGING MOBILITY TECHNOLOGIES AND TRENDS40
trips per capita) have lower traffic fatality
rates than cities with fewer than 20 transit
trips per capita.109 Previously, APTA found that
public transportation is 10 times safer per mile
than traveling by car in terms of traffic casualty
rate.110 Altogether, and as indicated in Figure
12, APTA estimates that with Americans
taking over 1,300 trips per year, an increase
from 20 to 40 annual transit trips per capita
could reduce traffic fatalities by anywhere
from 10 to 40 percent.111
Researchers have increasingly documented
the health benefits of public transportation
in recent years. Studies show clear linkages
between public transportation use and lower
levels of air pollution, improved safety, and
higher physical activity levels. On average use
of public transportation instead of private
vehicles produces 95 percent less carbon
monoxide, 92 percent fewer volatile organic
compounds, and 45 percent less carbon dioxide
per passenger mile. Additionally, persons in
communities that have access to regular public
transportation service have increased physical
activity levels.112
Public transit can be a wise investment, and
can help spark economic growth. The Union
Internationale des Transports Publics (UITP),
the world’s largest association of public
transportation agencies, points out that
“investment in public transport sparks a chain
reaction in economic activity up to three or four
times the initial investment,” and that “while
large-scale public transport investment projects
are undoubtedly expensive, they are actually
PUBLICTRANSIT: THEBACKBONEOF21STCENTURYMOBILITY
Before the 1920s, most urban residents
commuted to work using public
transportation. Today, eight in 10 Americans
drive to work; just 5 percent take public
transit. This decline is problematic for a
number of reasons, many of which extend far
beyond mobility. For instance, The London
School of Economics determined that access
to public transit played a critical role in helping
transit-oriented submarkets retain their
value throughout the recession circa 2008
and to recover value at a faster rate than
homes without convenient access. Specifically,
houses less than a mile from stations in
Atlanta, Baltimore or Portland all kept their
values to a greater degree than those located
farther away from stations. This outcome is
likely due to lower transport-related costs,
better local economic conditions, and greater
access to employment opportunities.107 The
American Public Transportation Association
(APTA) came to the same conclusion, finding
that residential property values performed
41.6 percent better on average if they were
located near public transportation with
high-frequency service during the most
recent recession.108
APTA and the Vision Zero Network (a
collaborative campaign helping communities
eliminate all traffic fatalities and severe
injuries while increasing universal mobility)
found that places where people take more
trips on public transit per capita have a smaller
proportion of road fatalities. Specifically,
large metro areas with higher levels of public
transportation (more than 40 annual transit

PUBLIC TRANSIT: THE BACKBONE OF 21ST CENTURY MOBILITY 41
Yet, unfortunately, the presence of transit is
shrinking, not growing. Modern modes and
models can help revive transit, but not without
the use of emerging mobility technologies and
establishment of all-encompassing systems.
DECLINING RIDERSHIPBefore the 1920s, most urban residents
commuted to work using public transportation.
Then, between 1945 and 1969, the number
of U.S. transit passengers dropped from 23
billion to 8 billion. Today, increasingly fewer
commuters across the country are using
public transit. Transit ridership fell in 31 of 35
major metropolitan areas between 2016 and
2017, including in the seven cities that serve
the majority of riders: New York, Chicago,
Los Angeles, Washington D.C., San Francisco,
Boston, and Philadelphia. Los Angeles-area
transit agencies have seen dramatic bus
ridership declines since the mid-2000s, with
overall bus ridership falling about 30 percent
over the course of a decade.
Overall, 76.4 percent of Americans drive alone
to work every day; just 5.2 percent take public
significantly less expensive than the direct
cost of congestion, which can seriously harm
the cities’ competitiveness, affecting travel
time reliability and business productivity.”113
Additionally, Chicago's Metropolitan Planning
Commission (MPC) found that businesses
are choosing to locate near transit for several
reasons. First, businesses are co-locating
with public transit to access labor pools, and
transit-accessible neighborhoods outperform
the regional job growth average, altogether
helping to attract and retain jobs in the area.
Additionally, locating near transit offers
businesses greater resiliency.114
Finally, public transit is simply the most efficient
way to move people. The majority of private
vehicles move one person per hour. In dense
cites, fixed route transit buses can move more
than 80 people per hour. Thus, if we’re seeking
to establish a framework for mobility that first
and foremost moves people (i.e., “throughput”)
– but also prioritizes societally desirable
functions such as improved safety, housing
values, green space, clean air, equity, etc. –
transit should be a major component.
0 50 100 150 200 250
15
20
25
10
5
0
Annual Transit Trips per Capita
Traf
fic
Fat
alit
ies/
10
0K
Re
sid
en
ce 20 4020 40
Figure 12: Metro Areas with More Public Transit Use Have Lower Traffic Fatality Rates (2016)
Source: American Public Transit Association

EMERGING MOBILITY TECHNOLOGIES AND TRENDS42
per capita transit trips in 1950.118 Yet by
1970, that number had decreased to 36.1,
where it has roughly remained since, even as
population has grown.
Challenges to transit first emerged with the
onset and increasing popularity of the private
automobile. Today, lower transit ridership is
substantively due to increased car ownership,
particularly among low-income and immigrant
populations, as their incomes rebound in
the improved economy and car ownership
becomes more affordable. Fueling this trend is
the increased ease of obtaining a car through
factors such as subprime auto loans and low
fuel prices.119 The Congressional Research
Service, a public policy research arm of the
U.S. Congress, blames the ridership decline
on low gasoline prices, increased cars, and the
rise of ridesourcing.120
transit.115 In 2017, 7.6 million people took
public transportation, which is 12,000 fewer
than the previous year,116 and overall was the
lowest year of transit ridership since 2005. All
major transit modes experienced decreases,
with the exception of subways and railroads,
and bus ridership alone fell 5 percent.117 Table
3 presents total transit ridership numbers
per mode in 2016 and 2017, and the percent
change between the two years.
Figure 13 illustrates how public transit
ridership has been dropping every
quarter since 2017.
The steep decrease in transit usage isn’t
a recent phenomenon, but rather one
that extends back several decades. The
United States once had a world-class public
transportation system, with 115.8 annual
Source: U.S. Census Bureau
Table 3: Transit Ridership, 2017 vs. 2016
Mode of Transportation Commuters in 2016 Commuters in 2017 Percent Change
Bus or Trolley Bus 3.73 million 3.64 million -2.34% ▼
Streetcar or Trolley Car 92,014 91,956 -0.06%▼
Ferryboat 58,914 57,768 -1.94% ▼
Subway or Elevated Train 2.88 million 2.95 million +2.27% ▲
Railroad 882,668 895,998 +1.51%▲

PUBLIC TRANSIT: THE BACKBONE OF 21ST CENTURY MOBILITY 43
agencies’ budget cuts that, over time, made
transit a less viable alternative to cars.
The frequency of service along existing
lines, as opposed to aggregate transit lines
and geographical service areas, is the most
influential factor that persuades commuters
that transit is a viable car-free alternative form
of travel. Research shows that frequencies of
15 minutes or better are required to entice
commuters to take transit rather than to
drive.122 Yet as transit agencies are forced to
reduce their operating costs as riders switch
to automobiles, transit line service intervals
of 30 minutes or more are common, which
means fewer transit riders. Fewer riders leads
to less revenue for transit agencies, which
prompts a further decrease in service. This
To this last point, while ridesourcing is a factor
attracting travelers away from transit, it’s
not the instigator nor the primary source of
lower ridership, given that per capita transit
ridership began falling before the widespread
availability of services such as Uber and Lyft.
In fact, the University of Toronto concluded
that while Uber reduces transit ridership in
smaller Metropolitan Statistical Areas (MSAs),
it increases ridership in larger cities.121 So
altogether, the picture is mixed.
Instead, while ridership numbers were
destined to decrease in the face of modal
competition from the automobile, such a
dramatic decrease in ridership was by no means
preordained. Rather, it was the progressive
decrease in transit service brought about by
2013 2014 2015 2016 2017
4%
3%
2%
1%
0
-1%
-2%
-4%
-3%
Year
Pu
bli
c Tr
ansi
t R
ide
rsh
ip
Figure 13: Public Transit Ridership Volumes by Quarter, 2013–2017
Source: American Public Transit Association

EMERGING MOBILITY TECHNOLOGIES AND TRENDS44
who lack cars rather than a viable service,
which becomes self-fulfilling as pressure is
imposed on transit operators to keep fares
artificially low. Altogether, these various
components fuel a downward ridership spiral,
as illustrated in Figure 14.
in turn implants the notion that transit is of
questionable value to the broader public,
which leads to opposition to regional efforts
to provide transit funding by other means.123
It also fosters the notion that transit is a
government aid program to help poor people
ReducedTransit
Services MoreCar
Owners
LessTransit
Ridership
Less Revenueto TransitOperators
ReducedTransitServicePublic
Questions Valueof Transit
Transit Seenas Aid Program
for the Poor
Fares KeptArtificially
Low
Less Fundingto TransitOperators
Figure 14: Self-Reinforcing Factors That Reduce Transit Ridership

PUBLIC TRANSIT: THE BACKBONE OF 21ST CENTURY MOBILITY 45
commuters would prefer not to drive. For
instance, a poll of college and university
students indicated that 90 percent would
consider using public transit instead of driving
if it were reliable, affordable, convenient, and
safe.128 Broader support for a viable public
transit system is reflected in a poll that indicated
that 70 percent of U.S. residents would support
an increase in federal funding for public
transportation systems.129 Such examples and
polls indicate that transit has an underlying
level of support that can help its revival. The
emergence of modes and models that afford
better transit experiences, reduce operational
costs, and altogether provide better service
can further assist this effort. These modes and
models include electric transit buses, dynamic
routing, and service-based pricing models.
ELECTRICTRANSITBUSESIn the previous example of Seattle, it’s worth
noting that the city is also a leading adopter
of electric transit buses, operating a fleet of
1,400 hybrid, electric trolley, and battery-
electric models.130 Electric buses can be transit
enablers in at least two ways. First, they help
ensure reliability, which aside from frequency
is perhaps the most important component
of a successful transit system. This is due to
the simpler technical nature of electric as
opposed to internal combustion propulsion.
While internal combustion engines can have
hundreds of moving parts, electric drivetrains
have only a few, thereby reducing the chance
that parts may fail, which would prevent the
bus from completing its assigned service. This
– along with the fact that electric buses are
four times more fuel-efficient than natural gas
buses – also reduces operating costs, as there
are fewer parts to break, fluids to change,
and vitals to track, thereby reducing spare
parts consumption by 80 percent per mile.131
MODERN MODES AND MODELS TO REVIVE RIDERSHIPThe potential exists to revive transit and
establish consistently higher levels of ridership
that are on par with the rest of the world.
This is indicated by exceptions to the trend
in decreasing transit ridership: New Orleans
ridership stayed flat while others decreased, and
Seattle, Phoenix and Houston either expanded
transit coverage and increased service or
underwent ambitious network overhauls.
Impressively, in 2015 Houston reversed the
trend of steep losses that included losing a
fifth of its ridership over a little more than a
decade while fostering significant weekend
ridership gains. It did so by transforming its
bus system from a traditional hub-and-spoke
design focused on downtown to a grid that
apportioned equal service to other parts of
the city,124 eliminating stops and increasing
frequency. In Seattle, transit increased from
29 percent to 47 percent of trips between
2000 and 2016 – improving bus ridership by
17 percent between 2015 and 2017 alone –
by funding nearly 300,000 annual hours of
bus service, improving weekday all-day service
to 10 minutes or better, and undertaking
initiatives to increase bus reliability.125 The city
also implemented low-cost measures such as
making transfers from light rail to bus easier,
implementing bus lanes, optimizing routes so
they travel through the most congested places,
and implementing queue jumps that allow
buses to start before other cars at stoplights.126
Accordingly, 64 percent of Seattle households
were within a 10-minute walk of 10-minute
all-day transit service in 2017, up from 25
percent in 2015.127
Polls in major metropolitan areas consistently
show that if transit service were adequate,

EMERGING MOBILITY TECHNOLOGIES AND TRENDS46
of battery electric propulsion systems that can
enable more than 200 miles of driving range
while eliminating point-source air pollution are
prompting their adoption. About 40 percent
of U.S. transit agencies either have electric
buses in operation or have awarded purchase
contracts. In total, approximately 1,200 electric
buses are in operation nationwide.132 Globally,
Bloomberg New Energy Finance (BNEF)
projects that 84 percent of new bus sales will
be electric by 2030, thereby outpacing electric
light-duty vehicles, as their scale and much
higher utilization allow them to reach pricing
parity with internal combustion vehicles in
2019.133 BNEF also projects that 80 percent of
the global municipal bus fleet will be electric by
2040.134 Figure 16 illustrates the past, present,
and projected demand for hybrid and fully
electric buses.
Figure 15 depicts a typical modern battery
electric transit bus, with its comparatively few
drivetrain components.
With less money allocated to operational costs,
transit agencies can allocate more towards
increasing the frequency of service and thus
help revive ridership. Furthermore, electric
models also offer a smoother and quieter
experience, which makes them popular with
riders. As opposed to internal combustion
engines, which can vibrate a bus’ chassis and
create cabin noise from exhaust pipes, fans and
belts, battery propulsion systems are vibration-
free and, for the most part, silent.
The popularity of electric buses, their reduced
maintenance costs that can enable more
frequent service, and the technological maturity
ElectricMotor
ControlInverter
EnergyStorage
AuxillaryDrive
Figure 15: Battery Electric Transit Bus Drivetrain Components

PUBLIC TRANSIT: THE BACKBONE OF 21ST CENTURY MOBILITY 47
optimizations can better align collection and
drop-off locations with riders’ needs. Coupled
with on-demand technologies that synchronize
rider pickup/drop-off locations and timeframes,
public transit can become more efficient.
This doesn’t necessarily mean that dynamic
routing and passenger boarding are appropriate
– or even feasible – for all transit routes. Routes
with frequent service and consistently high
ridership would be poor candidates and would
likely increase rather than reduce costs and
inefficiencies, given that route capacity is already
saturated. Instead, on-demand, flexible services
have the most potential to improve routes
with infrequent service and/or low ridership.
Examples of routes with these characteristics
are those that operate at night and those with
lower densities, such as rural areas with 5-10
DYNAMIC ROUTINGModern propulsion systems aren’t the only
technology that can play a role in reviving
transit ridership. The technologies – and
even the business models – that enable
connectivity, automation, and shared mobility
can also contribute to the goal of providing
reliable, consistent, and frequent service that
attracts more people.
For instance, the same geolocation, tracking,
and computing technologies that facilitate
ridesourcing can help transit agencies track
their vehicles, provide timely arrival and
departure information to prospective riders,
integrate with other modes for comprehensive
journey planning, and even optimize their
routes to better match with riders’ needs.
To this last point, static and dynamic route
2006 2011 2016 2021
25%
20%
15%
10%
5%
0%
Year
Pe
rce
nt
Figure 16: Hybrid and Fully Electric Buses as a Percent of Total Bus Unit Demand, 2006-2021
Source: The Freedonia Group

EMERGING MOBILITY TECHNOLOGIES AND TRENDS48
SERVICE-BASEDPRICINGMODELSService-based pricing models offer benefits not
just for transit providers, but for manufacturers
as well. While several of the benefits of electric
transit buses were previously covered at length,
one major hurdle they face is the incremental
cost above traditional diesel buses. At a typical
price after incentives of $700,000, electric
buses generally cost about 30 percent more than
the $550,000 typically paid for natural gas and
50 percent more than the $450,000 typically
paid for conventional diesel-powered buses.140
While the lower cost of fuel and reduced
maintenance costs more than offset the higher
upfront costs over the life of the vehicles, transit
agencies still face an initial barrier to overcome
in terms of upfront provision of capital for the
acquisition. When faced with a similar barrier,
the solar power industry innovated with
financial models that enabled homeowners to
install and use solar panels without having to pay
tens of thousands of dollars of upfront capital
costs. Instead, they opted to commit to long-
term offtake agreements priced at a level below
people per square mile, and suburban areas
with 1,000-2,000 people per square mile.135
Tangential benefits from dynamic routing
could come in the form of assisting with bus
stop siting. Most cities in Western Europe
and East Asia have one stop every quarter to
one-third mile, which is more than twice as
far as is common in the United States.136 Bus
stops in the U.S. are spaced comparatively
close to each other because longer distances
would be seen as harming seniors and disabled
riders.137 Dynamic routing alleviates this issue,
for direction can be provided to buses to stop
only when and where there are passengers
and to more mobile passengers to congregate
at centralized locations, thereby reducing the
number of stops made along routes. The longer
distances between stops leads to increased
ridership, for the buses can average faster
speeds, and arrive more often and reliably.
The Washington, D.C. Metro’s models show
that a 10 percent increase in speed raises bus
ridership by between 4 and 10 percent.138
Dynamic routing can also combine with other
typical ridesourcing features to enable transit
providers to price mobility around the value
of the services provided, rather than simply
operating under a one-size-fits-all approach.
For instance, transit systems in cities like
London and Toronto have higher fares that they
use to fund more frequent service, among other
things.139 Transit agencies in the U.S. could use
dynamic routing as a tool to increase ridership
levels by holding prices constant, or they could
justify the imposition of higher fares to different
riders based on their needs, willingness-to-pay,
and tiers of service offered. The increased
funding could then be used to further enhance
services that altogether enable the system to
better compete with cars.
S tatic and dynamic route
optimizations can better
align collection and drop-off
locations with riders’ needs.
Coupled with on-demand
technologies that synchronize
rider pickup/drop-off locations
and timeframes, public transit
can become more efficient.

PUBLIC TRANSIT: THE BACKBONE OF 21ST CENTURY MOBILITY 49
offering service-based models is Proterra, who
works with customers to help identify grant,
loan, and financing programs such as municipal
capital and battery leases.143
Beyond the reduction of upfront capital
costs, potential exists for manufacturers
and/or financiers to structure vehicle and
infrastructure deployments around the
provision of service and mobility rather than
assets. Such a contractual structure has the
added benefit of facilitating other shared
mobility features like fleet maintenance,
training and provision of drivers, and dynamic
routing as service providers would be
incentivized to provide riders with mobility, not
simply routes and stops.
SNAPSHOTTransit agencies, including Belleville Transit
in Ontario, Canada, are experimenting with
projects that highlight prospective use cases
for on-demand, dynamically-routed bus transit.
Belleville Swaps Fixed Routes for
On-Demand, Bus-Hailing
In September 2018, the City of Belleville
in Ontario, Canada, launched a pilot with
Pantonium, a Toronto startup founded in 2010
that optimizes routing for fleets, to test dynamic
route optimization for its transit service.144
The pilot swaps the city’s fixed routes for its
night bus service with a flexible, on-demand
approach that’s akin to what’s used for
ridesourcing. Riders use a smartphone app to
request a pickup and drop-off at any bus stop in
town. Pantonium’s software then processes the
requests, continually updating itself to optimize
all scheduled rides, and maps the best route for
bus drivers to collect and deliver all riders to
their destinations as quickly as possible.145
their current monthly electricity bill, yet high
enough to amortize the capital and financing
costs. Such an innovation catalyzed the solar
power industry, helping it grow to 58.3 GW of
total installed capacity – enough to power 11
million American homes – by mid-2018.141
Similarly, Chinese battery electric bus
manufacturer BYD Motors and Generate Capital
– a specialty finance company that builds, owns,
operates, and finances infrastructure assets
involving energy, water, agriculture and basic
materials – have pioneered a leasing program to
help reduce upfront costs. Under the program,
Generate Capital invested $200 million to buy
and lease buses that are built and marketed by
BYD. Customers can lease an entire bus or buy
only the chassis and lease the batteries on a
monthly payment.142 Generate Capital’s model
includes not just financing, but also monetization
of the onboard batteries’ residual value – i.e., the
point at which the batteries are no longer able
to meet the needs of the vehicle but have some
other market value, such as baseload energy
balancing. Another electric bus manufacturer
B eyond the reduction
of upfront capital
costs, potential exists
for manufacturers and/
or financiers to structure
vehicle and infrastructure
deployments around the
provision of service and
mobility rather than assets.

EMERGING MOBILITY TECHNOLOGIES AND TRENDS50
areas; night bus services; and first/last mile
challenges around transit hubs.150
THE FIRST/LAST MILE CHALLENGEThough freeing up operating budgets by
using less costly and complex technologies,
increasing service frequency and reliability,
and implementing tools such as dynamic
routing and pricing can make meaningful
contributions to increasing transit ridership,
a fundamental challenge exists in the way that
greater metropolitan areas are populated
and structured.
Specifically, typical suburban communities,
comprised of a spider’s web of low-traffic
streets and cul-de-sacs, are less conducive to
transit routes, which work best on main arteries
closer to population centers. As such, where
population densities are lower, sustaining
ridership becomes more difficult as any given
route’s odds of passing through an area with
high transit demand decreases.
Thus, there’s often a meaningful distance
between a transit stop and a prospective
rider’s ultimate destination. This distance
is historically referred to as the “last mile,”
but given that it also applies to the distance
between the stop and one’s point of origin, it
has also been called the “first mile.” The first/
last mile challenge refers to the hurdle that
any transit system – even those in densely
populated areas – has to overcome in order to
obtain riders, for pedestrian access to transit
stations falls off dramatically at distances
greater than one-half mile.151
A meaningful, scalable solution to the first/
last mile challenge has long perplexed transit
planners. No level of service frequency
addresses the issue, for while increased
While the overwhelming majority of riders
have a smartphone or a tablet upon which they
can access the app, the city also allows people
to book rides online or via a phone call, should
they have trouble or otherwise be unable
to use the app.
The pilot comes in part as a response to public
feedback and requests for the municipality
to adopt modern technology. It’s also an
acknowledgement of the inherent inefficiencies
of large diesel buses operating on fixed routes
and schedules, particularly late at night, when
much time is spent circling around routes with
few passengers on board.
Historically, Pantonium’s source of growth has
been providing services to non-emergency
medical transportation companies that operate
in the United States, transporting patients
to medical appointments. The partnership
with Belleville comes as “…a new approach
to an old challenge for public transit in low-
density public transit areas, attempting to
improve upon the ‘dial-a-bus’ model without
replacing or undercutting the existing transit
infrastructure.”146
Belleville’s public transit system is small. The
city has a population of only about 50,000,
the transit system provided 996,000 rides
last year via its 14 buses; the current pilot
involves just three buses.147 Yet if the initial
pilot project goes well, as the doubling of the
app’s registered riders in the pilot’s first two
weeks indicates it might,148 the city would like
to keep its large buses on a fixed route in its
central, high-traffic area, while feeding that
route using the bus-hailing service by bringing
passengers in from low-density zones.149
Pantonium sees this being applied across the
world in rural, suburban, and/or low-density

PUBLIC TRANSIT: THE BACKBONE OF 21ST CENTURY MOBILITY 51
suburban areas, is to facilitate commuters’
transit connections via car. The challenge with
this approach is that transit stations in more
urban settings have limited or no dedicated
parking, leading patrons driving to the station
to rely on street parking. For those who do have
dedicated parking, it’s often limited and fills up
early each workday.152
Even if it were logistically possible and cost
effective to build parking structures at every
major transit stop, no amount of parking could
solve the first/last mile challenge, especially for
those who typically ride and depend on transit.
This is due to the fact that even though riders
could overcome one leg of the challenge with
their private automobile (e.g., the “first” leg),
at their destination they’ll likely face the other
portion of the challenge (e.g., the “last” leg).
More importantly, premising ridership on the
possession of a mode of transportation that
costs an average of over $36,000 to own153
and even more to operate doesn’t align with
transit’s ridership profile. Transportation costs
– the largest household expenditure next
to housing itself (see Figure 17)154 – have a
disproportionately negative impact on lower
income households,155 and in nearly every
urban area public transportation commuters
tend to be poorer than those driving to work.156
For example, a third of New Orleans residents
who commute via public transportation live
in poverty, compared to only nine percent of
those who drive cars. San Diego residents
taking public transportation to work earn
less than half as much as other city workers.
A similarly large disparity exists in Louisville,
Ky, Tucson, Ariz., and numerous other urban
centers. Altogether, 47 percent of bus riders do
not own a personal vehicle.157
frequency improves the attractiveness of
transit as an alternative to personal cars,
riders still have to arrive at the transit stop as
well as their final destinations. Additionally,
while increasing the number of routes and
implementing dynamic routing can address
the challenge to a degree, at some point both
options come up against diminishing returns,
whereby the cost and/or time penalty imposed
by covering an extra mile of routing offsets,
eliminates, or even establishes a negative
correlation with supposed benefits. Yet
solving the first/last mile challenge is essential
not only to enable public transit, but also
to prevent communities from cannibalizing
their fixed-transit network by experimenting
with broader-but-reduced service and/or
misapplied on-demand solutions.
AFFORDABILITY,ACCESSIBILITY,INTERSECTIONALITY,ANDMOBILITYOne approach to overcoming the first/
last mile challenge, particularly in rural and
T he first/last mile
challenge refers to the
hurdle that any transit system
– even those in densely
populated areas – has to
overcome in order to obtain
riders, for pedestrian access
to transit stations falls off
dramatically at distances
greater than one-half mile.

EMERGING MOBILITY TECHNOLOGIES AND TRENDS52
The fi nancial stress imposed on lower income
levels that depend most on affordable mobility
can be compounded by the impact that such
access (or lack thereof) has on living costs and
location. The traditional measure of affordability
recommends that housing cost no more than
30 percent of household income. Under
this view, 55 percent of U.S. neighborhoods
are considered “affordable” for the typical
household. However, that benchmark fails to
take into account transportation costs, which
are typically a household’s second-largest
expenditure. When transportation costs
are factored into the equation, the number
of affordable neighborhoods drops to 26
percent.160 Even worse is the fact that the
First/last mile solutions that impose steep
fi nancial barriers, such as personal car
ownership, also inherently impact racial and
class disparities. Households in poverty are
disproportionately comprised of minorities, with
African Americans and Hispanics experiencing
the highest poverty rates. Limited vehicle
availability and fewer affordable transportation
options affl ict this cost-sensitive group.158 In
New York City, the median earnings of public
transit commuters are about $35,000 per year,
and only a third of those commuters are white.
In Los Angeles, the disparity is even greater: the
median income of public transit commuters is
only $15,000 per year; 71 percent of riders are
Hispanic and only 11 percent are white.159
Figure 17: Household Expenditures, 2016
Source: U.S. Department of Energy, Vehicle Technologies Offi ce
Share ofTransportationExpenditures
Share ofAll
Expenditures
Other
Helathcare
Entertainment
Apparel & Services
Housing
Transportation
Food
Personal Insurance & Pensions
11.9%
13.4%
15.7%
40.1%
21.1%
31.9%
6.9%
6.3%
3.3%
5.0%
1.1%
33.0%
3.1%
5.1%
8.0%
9.6%
Vehicle Purchase
(Net Outlay)
Gasoline& Motor Oil
Other VehicleExpenditures
PublicTransportation
Average Expenditures of All Households
$57,311Average Transportation
Expenditures
$9,049

PUBLIC TRANSIT: THE BACKBONE OF 21ST CENTURY MOBILITY 53
Establishing viable first/last mile solutions and
mobility services for seniors and persons with
disabilities can be particularly challenging.
Only 4 percent of those aged 65 and older
have used ridesourcing services, as compared
with 36 percent of those 18 to 29.167 Beyond
ridesourcing, specialized transportation
services for the elderly, disabled, and
economically disadvantaged are provided
through more than 80 federal programs. In
practice, the sheer number of programs can
result in fragmented, hard to use services.
Often, geographic barriers, trip purposes and
a variety of eligibility restrictions restrict the
use of services. As a result, customers need to
contact multiple caseworkers for multiple types
of trips and book far in advance. Trip times can
be inconvenient, with long pick-up windows
and circuitous routes.168
The intent of this discussion isn’t to invalidate
any single mode of mobility, but rather to
highlight the fact that no single mode should
or even can be relied upon as the sole solution.
Instead, if the goal is to establish an affordable,
universally accessible, and equitable system
that enables widespread and convenient
mobility that is independent of personal car
ownership, clearly an array of travel modes and
usage models that complement each other is
most appropriate.
tradeoff in housing savings gained at the cost
of transportation is eroding, with 77 cents
being spent on transportation for every dollar
spent on housing.161 These factors, which in
part determine neighborhood and community
characteristics, in turn contribute to health
disparities by racial/ethnic group, income level,
and education level.162
To be clear, modal impact on socioeconomic
and racial disparities isn’t limited to scenarios
that depend on personal car ownership. For
example, the use of ridesourcing reinforces
and in some ways exacerbates transportation
systems’ existing racially discriminatory
patterns.163 A 2016 survey found that not only
is the absolute number of those who ridesource
predominantly white, but also that they tend to
be affluent (earning $75,000 per year or more)
and university-educated (29 percent of college
graduates have ridesourced as compared to
only 6 percent of those with a high school
diploma or less).164 A separate survey that
same year found that Uber drivers in Boston
were more than twice as likely to cancel ride
requests from African Americans, while African
Americans in Seattle faced up to a third longer
wait times.165
Ridesourcing as a first/last mile solution reveals
other disparities as well. While 29 percent of
urban residents use ridesourcing regularly,
only 7 percent of those in suburbia use it to
travel in and around their home region. These
numbers and their implications for overall
rural mobility are compounded by the fact that
access to public transportation in rural areas is
limited by travel times and distances, frequency
of service, cost, and limitations in funding to
address these challenges.166

EMERGING MOBILITY TECHNOLOGIES AND TRENDS54
only occupants. This vehicle leaves a lot to
be desired. Take size, for instance: while
the average light vehicle mileage-weighted
occupancy is less than two (1.67) people,169
all of the top selling vehicles in the U.S. seat
at least four people.170 Furthermore, these
vehicles are rather inefficient. As illustrated
in Figure 18, modern vehicles use only 12
to 30 percent of their consumed energy as
a motive force; they waste the rest in the
form of dissipated heat from engine and
other losses.171
Changes to the automobile brought about by
electrification, connection and automation,
and shared mobility will be dramatic, but
As discussed, 20th century mobility at
first included public transport, but soon
became dominated, and more or less defined
by, the personal automobile. The emergence
of this mode led to radical advancements in
mobility, in a sense shrinking the landscape
and making huge swaths of the country
newly accessible.
Yet while it advanced in form, features, safety,
and efficiency over the course of the century,
the personal automobile remained for the
most part the same: a multi-passenger, several
thousand-pound vehicle with an internal
combustion engine fueled by gasoline and
driven on roadways primarily by the vehicles’
THE“MOBILITYMENU”:D O M A I N S , M O D E S , A N D USAGEMODELS
Some percentages may not add to 100% due to rounding
16%-25% Power toWheels
4%-6%ParasiticLosses
0%-2%AuxiliaryElectrical Losses
68%-72% EngineLosses
3%IdleLosses
DrivetrainLosses5%-6%
Figure 18: Energy Requirements for Combined City/Highway Driving
Source: U.S. Department of Energy

THE “MOBILITY MENU”: DOMAINS, MODES, AND USAGE MODELS 55
stated, the average American man and
woman who weigh 195.7 lbs. and 168.5 lbs.
respectively172, should be afforded mobility
options that weigh less 4,035 lbs., the average
weight for new vehicles produced in model-
year 2016,173 so as to optimize their mode
for the travel purpose, mobile efficiency, and
transportation expenditures.
For the most part, Americans travel short
distances. Table 4 shows how the overwhelming
majority of travel is local. In 2017, nearly 60
percent of all trips were five miles or less, and
over 85 percent were fifteen miles or less. Only
4.9 percent were 31 miles or more.174
miss a fundamental point: in its most efficient
form, mobility is enabled by a system, not a
mode. While that system may require multi-
passenger, heavy, long-range vehicles at times,
at other times it won’t.
Many drivers purchase vehicles based on
which ones can fulfill every need – from daily
jaunts around town, shopping for groceries,
and chauffeuring children; to once-a-year
roadtrips across the country, and the periodic
purchases of appliances and other large
items. Yet the data indicates that the ways
in which people actually travel can perhaps
be better met by thinking differently. Simply
Source: Oak Ridge National Laboratory
Table 4: Vehicle Trips By Distance (2017)
Trip Distance Sample Size Sum (Millions) Percent
Less than 0.5 miles 31,851 11,063 5
1 mile 98,955 36,078 16.4
2 miles 84,856 30,430 13.8
3 miles 64,205 22,820 10.4
4 miles 48,361 17,357 7.9
5 miles 37,449 13,276 6
6 - 10 miles 106,830 38,153 17.3
11 - 15 miles 50,791 18,597 8.4
16 - 20 miles 28,913 10,999 5
21 - 30 miles 27,860 10,747 4.9
31 miles or more 31,228 10,895 4.9
TOTAL 611,219 220,415 100

EMERGING MOBILITY TECHNOLOGIES AND TRENDS56
domain. Thus, when interconnected and
layered upon the “backbone” of public transit,
they can form the basis for a mobility system
that solves the first/last mile challenge and
enables personal mobility at a level equal to
or better than that afforded by personal car
ownership, while being more functionally
appropriate for a given trip.
LOCAL DOMAIN: MICROMOBILITY FOR < 5 MILE JOURNEYSNearly 60 percent of all trips are within the
Local Domain, which consists of trips less
than five miles long. Vehicles designed around
this domain are at the heart of solving the
first/last mile challenge, and represent a
significant opportunity for manufacturers and
service providers.
Figure 19 presents the same data visually.
When examined this way, trip volume clustering
reveals three primary travel domains:
• Local Domain: Less than five miles, and
comprising 59.5 percent of all trips
• Midrange Domain: Between five
and 15 miles, and comprising 25.7
percent of all trips
• Long-range Domain: Trips greater than
15 miles long, and comprising 14.8
percent of trips
Understanding the way in which people travel
and the domains associated with the clustering
of trips is the basis for which we can now review
emerging electrified, connected and automated,
shared vehicles that are appropriate for each
Figure 19: Number of Vehicle Trips by Trip Distance
Source: Oak Ridge National Laboratory
<.5mi 1mi 2mi 3mi 4mi 5mi 6-10mi 11-15mi 16-20mi >31mi21-30mi
40K
25K
35K
30K
20K
15K
10K
5K
0
Trip Distance
Ve
hic
le T
rip
s
Local
Travel Domains
Midrange
Long-Range

THE “MOBILITY MENU”: DOMAINS, MODES, AND USAGE MODELS 57
be comprised of three categories of vehicles
based on their size: 1) Unicycles and motorized
skateboards; 2) folding bikes and scooters;
3) enclosed velomobiles and featherweight
cars.179 Of these three, shared electric
scooters and bicycles are the dominant driving
force for micromobility’s rising popularity
and market growth.
SHAREDSCOOTERSANDBICYCLESLong viewed as children’s toys, scooters
emerged as a viable and practical mobility
mode in 2017. Two leaders quickly emerged:
Lime, which was founded in San Mateo, Calif.
in January, and Bird, which was founded in
Santa Monica, Calif. in September. At the time
of publication, both companies had scooters in
service in over 100 cities around the world.180
Bird’s and Lime’s scooters were originally
made by Chinese manufacturers Ninebot or
Xiaomi, and retail for around $500. They have
a top speed of around 15 mph and a range of
around 15 miles.181 In October 2018, Bird
announced the Bird Zero, its new scooter that’s
built in-house, has 60 percent more battery
life, improved ride stability and durability, and
other advanced technologies.182 Lime plans
for its “Gen 3” scooter to be designed in-house
by engineers in California and China and built
by four different unnamed manufacturers. In
addition to being more technology-enabled,
stable, and durable, its battery will reportedly
last 30 miles – about 20 percent longer than the
current generation scooter.183 Other notable
scooter manufacturers and operators include
Skip, Scoot Networks, Spin, and Razor.
Since its launch, the growth of scooter ridership
and markets has been exponential. Bird
facilitated over 10 million cumulative rides
Micromobility comprises just such a group
of vehicles. While no official definition of
micromobility exists, one proposed definition
orients modes around weight classes by
defining micromobility as utility-focused
urban electric vehicles that weigh up to 500
kilograms (approximately 1,100 lbs.).175 The
logic for such a proposal correlates weighting
with distance: ships, trains and airplanes are
all very heavy and have very long ranges, while
the smallest vehicles are very lightweight and
have short ranges.
The first micromobility vehicle, the Segway,
arrived in December 2001. But at a $4,950
price point and lack of modern day geo-locating,
sharing-enabling, and other mobile phone and
“gig” economy technologies, the company only
sold about 100,000 units over 17 years.176, 177
Yet by advancing the technology and building
out a nimble, two-wheel, battery electric
vehicle that could solve the first/last mile
challenge,178 it paved the way for the modern
age of micromobility, which some consider to
LOCALDOMAIN
Mode
of All Trips
59.5%
Trips <5miles
Micromobility (utility-focused urban
electric vehicles)

EMERGING MOBILITY TECHNOLOGIES AND TRENDS58
mobile payments. Using these technologies,
renting a scooter for a few minutes or miles
is as simple as calling up a smartphone app,
following the app’s directions to the nearest
scooter, scanning the scooter’s barcode, and
scooting away. The gig economy framework
also enables dockless systems. At the end of
each day, the scooters are collected, charged
overnight, and redistributed the following
morning by contractors who collect bounties
based on the number of vehicles they service,
the vehicles’ locations, and their states of
charge. Another primary driver of the scooter
boom is that traffic congestion in most U.S.
cities is increasing, resulting in it being faster
in some instances to travel short distances
(such as scooters’ average trip lengths of 1.06
miles185) using micromobility instead of cars.186
While the mode of travel is still relatively new and
– until recently, their user data collected by the
companies kept private, making comprehensive
research difficult – preliminary data indicates
in less than two years, and Lime took just one
year from its launch to reach 6 million rides, and
reached 20 million rides by November 2018.
Importantly, it’s not just wealthy people taking
these rides; lower income groups are more likely
than high-income groups to approve of shared
scooters.184 This broad-based popularity is a
factor in the mode’s rapid growth. As illustrated
in Figure 20, scooter growth rates far exceed
those experienced by transportation network
companies (TNCs) Uber and Lyft, which took
over twice as long to reach 10 million rides.
A main driver of this scooter boom has been
the rise of the dockless system, which allows
users to park anywhere rather than in a fixed
docking station, and is more convenient and
less costly to scale given lower capital costs,
as operators don’t have to build out fixed
stations. Dockless systems were enabled by
some of the same technologies whose mass-
market consumer orientation was brought
about by the smartphone, including GPS and
1 10 100 1K 10K 100K 1M 10M 100M 10B1B
2921
2566
2191
1826
1461
1096
731
366
1
Cumulative Rides
Day
s A
fte
r La
un
ch
Uber
Lyft
Lime
Bird
Figure 20: Days to Reach 10 Million Cumulative Rides
Source: Horace Dediu
THE “MOBILITY MENU”: DOMAINS, MODES, AND USAGE MODELS 59
must be checked out from and returned to
designated docks located at fixed points.
Interestingly, while the dockless technology
proved decisive in enabling scooter sharing, it
is less decisive in enabling bikesharing. In fact, a
Seattle dockless bikeshare pilot project showed
dockless pedal bikes were only being rented an
average of 0.85 times a day. That’s less than
half the rate of Chicago’s Divvy, which sees
more trips out of 5,800 bikes than Seattle saw
out of 10,000 bikes. New York’s Citi Bike, with
12,000 bikes, produced an average of 51,800
daily trips over six months, more than five times
the rate in Seattle.190 Altogether, while three-
quarters of the new bikeshare bikes were
dockless (comprising 44 percent of total shared
bikes) and averaged 1.7 rides per day per bike in
the U.S. in 2017, dockless bikes made up only 4
that scooters are offsetting a large number of
car trips and have the potential to offset even
more. Lime reports that 53 percent of riders in
San Francisco said they might have used a car
if they hadn’t taken a scooter.187 Bird believes
it’s possible to replace a large percentage of the
nearly 40 percent of car trips in the U.S. that
are less than two miles.188 Scoot estimates that
the various small, electric vehicles could make
up 25 percent of all travel within global urban
centers over the next 10 or 20 years.189
Scooters aren’t the only Local Domain mode
capable of replacing car trips and affording
connections to transit. Bicycles are showing
similar capabilities. Bikeshare has both dockless
and docked models. While the dockless versions
are rented and returned in the same manner
as dockless scooters, docked shared bicycles
2010 2011 2012 2013 2014 2015 2016 2017
35M
30M
25M
20M
15M
10M
5M
0
Year
Bik
esh
are
Tri
ps
Fixed
Dockless
Figure 21: Dockless Bikes Represent A Small Portion Of Bikeshare’s Growth
Source: National Association of City Transportation Officials

EMERGING MOBILITY TECHNOLOGIES AND TRENDS60
to cycling. 28 percent of respondents said they
bought an e-bike specifically to replace car
trips. Others pointed to craving a more car-free
lifestyle, such as using e-bikes to carry cargo or
kids, avoid parking and traffic woes, be more
environmentally minded, and have a more cost-
effective form of transportation.195
The bikeshare market has expanded significantly
in recent years. In the first 18 months or so since
dockless bikeshare arrived in the U.S., it spread
to over 88 cities.196 In 2017, 35 million bikeshare
trips were taken in the U.S., which is 25 percent
more than in the year before, and over 57,000
new bikes were added to systems, more than
doubling the number available the previous
year.197 China-based Ofo, which has served
over 200 million users in over 25 cities in 21
countries around the world, went from providing
an average of 300,000 rides per day in the first
quarter of 2017 to an average of around 30
million rides per day by mid 2018 on its bike and
scooter networks worldwide, which is almost as
high as the average weekday ridership of all U.S.
public transit systems combined.198 That said,
whether bikeshare will experience growth levels
similar to scooters remains to be seen. Results
of various pilot programs indicate that riders
prefer scooters to bikes, perhaps because of the
inherent features of scooters, or perhaps due to
highly restrictive dockless bikeshare pilot rules
imposed by some city governments.199
With such growth, the market potential of
scooter and bike share is apparent not only to
investors but also to other mobility providers.
Lyft and Uber have acquired and/or offered
scooters and bikesharing to travelers in select
markets via their respective smartphone apps.
In April 2018, Uber acquired bike-sharing
company Jump Bikes, which operates in 40
U.S. cities. Three months later, Lyft bought
percent of the 35 million bikeshare rides taken
that year and averaged 0.3 rides per day per
bike (see Figure 21).191
That said, it should be noted that dockless
bikeshare only arrived in most cities in
the second half of 2017, and many of the
systems did not make their data available for
review. This is important, for a recent survey
found that 75 percent of dockless bikeshare
riders in Seattle used the service to access
transit. Micromobility data in Washington
D.C. indicates African-American residents
(representing 47 percent of the district’s
population) adopted dockless services 2.6
times more than docked services (compared to
1.2 times more for white residents).192 This data
potentially indicates that while its percentage
of ridership may be relatively small, the value of
dockless micro-modes to the broader mobility
ecosystem may be large.
Instead, electrification seems to be more of a
bikeshare growth factor, for according to Lime,
electric bikes (“e-bikes”) are twice as popular
as pedal bikes.193 The company found that
battery-boosted bikes and scooters are able
to attract more riders per day than traditional
bikes, and they also found that when scooters
are introduced to a market, bike usage also
increased. New York’s Citi Bike e-bikes are
averaging 14 trips per day, while traditional
bikes are averaging only seven rides.194
In addition to fueling growth, e-bikes can
displace cars. An early 2018 poll by the
National Institute for Transportation and
Communities of nearly 1,800 e-bike owners
in North America asked respondents why they
bought electric bikes, what kind of trips they
use them for, and how e-bikes compare to
conventional bikes when it comes to barriers

THE “MOBILITY MENU”: DOMAINS, MODES, AND USAGE MODELS 61
At this pace, the odds are that the landscape for
shared scooter and bicycle brands, markets, and
investors will be different – perhaps dramatically
– within the near future. Yet the important point
made by the frenzy of activity and modal usage
patterns will remain in that scooters and bicycles
have proven themselves a viable component of
shared mobility that can serve the Local Domain
to connect users to transit and offset the use of
cars. UC Berkeley found that bikesharing does
impact how people drive. In Montreal, over a
quarter of surveyed people reported that they
drove their car less, and in Toronto, one third
reported that bikesharing changed their driving
habits. Five percent of respondents to the UC
Berkeley survey as well as a separate survey in
Washington D.C. indicated that bikesharing had
an impact in prompting them to sell their car.
Figure 22 depicts Uber data released six months
after its acquisition of Jump illustrating how new
riders in San Francisco were likely to use Jump
bikes instead of cars, especially during hours of
Motivate, the largest bikeshare operator in
North America200 and the operator of New York
City’s bikeshare program that Citi once paid
over $40 million to sponsor.
Around the same time, Uber announced a
“new modalities” unit to focus on new forms
of transportation, including its bikesharing
business. A month later, the company
announced that it would offer Jump-branded
scooters, built by Chinese manufacturers,
in Santa Monica and San Francisco, but also
quietly began working on building its own
scooter.201 In September 2018, Lyft launched
its scooter business in Denver, Colo. as part of
a one-year pilot program.202 Even traditional
automakers are partaking in the action: Ford
piloted a scooter under the brand name Jelly on
the campus of Purdue University in late 2018203
and acquired Spin in November 2018.204 In late
2018, General Motors announced plans to
start making electric bikes.205
3am12am 6am 9am 12pm 3pm 6pm 9pm
Pro
po
rtio
n o
f Tr
ips JUMP
Uber
Figure 22: Proportion of Uber Trips Represented by Bikeshare vs. Ridesourcing
Source: Uber
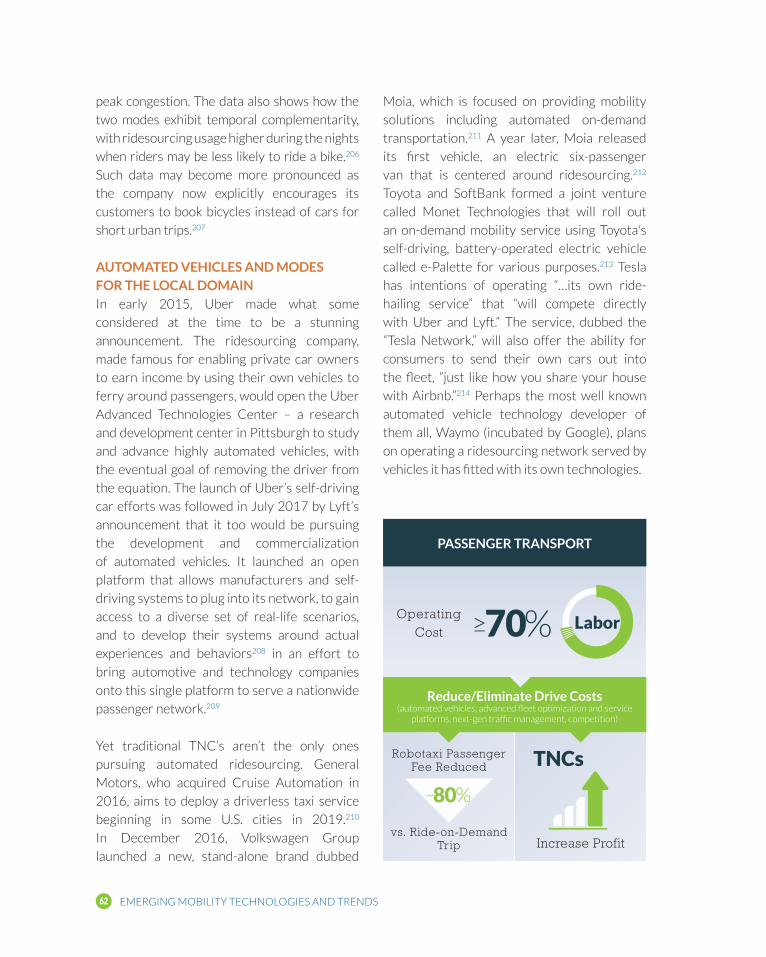
EMERGING MOBILITY TECHNOLOGIES AND TRENDS62
Moia, which is focused on providing mobility
solutions including automated on-demand
transportation.211 A year later, Moia released
its first vehicle, an electric six-passenger
van that is centered around ridesourcing.212
Toyota and SoftBank formed a joint venture
called Monet Technologies that will roll out
an on-demand mobility service using Toyota's
self-driving, battery-operated electric vehicle
called e-Palette for various purposes.213 Tesla
has intentions of operating “…its own ride-
hailing service” that “will compete directly
with Uber and Lyft.” The service, dubbed the
“Tesla Network,” will also offer the ability for
consumers to send their own cars out into
the fleet, “just like how you share your house
with Airbnb.”214 Perhaps the most well known
automated vehicle technology developer of
them all, Waymo (incubated by Google), plans
on operating a ridesourcing network served by
vehicles it has fitted with its own technologies.
peak congestion. The data also shows how the
two modes exhibit temporal complementarity,
with ridesourcing usage higher during the nights
when riders may be less likely to ride a bike.206
Such data may become more pronounced as
the company now explicitly encourages its
customers to book bicycles instead of cars for
short urban trips.207
AUTOMATEDVEHICLESANDMODES FORTHELOCALDOMAINIn early 2015, Uber made what some
considered at the time to be a stunning
announcement. The ridesourcing company,
made famous for enabling private car owners
to earn income by using their own vehicles to
ferry around passengers, would open the Uber
Advanced Technologies Center – a research
and development center in Pittsburgh to study
and advance highly automated vehicles, with
the eventual goal of removing the driver from
the equation. The launch of Uber’s self-driving
car efforts was followed in July 2017 by Lyft’s
announcement that it too would be pursuing
the development and commercialization
of automated vehicles. It launched an open
platform that allows manufacturers and self-
driving systems to plug into its network, to gain
access to a diverse set of real-life scenarios,
and to develop their systems around actual
experiences and behaviors208 in an effort to
bring automotive and technology companies
onto this single platform to serve a nationwide
passenger network.209
Yet traditional TNC’s aren’t the only ones
pursuing automated ridesourcing. General
Motors, who acquired Cruise Automation in
2016, aims to deploy a driverless taxi service
beginning in some U.S. cities in 2019.210
In December 2016, Volkswagen Group
launched a new, stand-alone brand dubbed
PASSENGER TRANSPORT
Increase Profit
Operating Cost
TNCs
Labor≥70%
Reduce/EliminateDriveCosts (automated vehicles, advanced fleet optimization and service
platforms, next-gen traffic management, competition)
Robotaxi Passenger Fee Reduced
vs. Ride-on-Demand Trip
~80%
THE “MOBILITY MENU”: DOMAINS, MODES, AND USAGE MODELS 63
rider trips in the 20 urban markets, premised
on an average of $13.15 per 6.66-mile trip,
and including the use of rental cars for longer
trips. It calculated that ridesourcing as primary
transportation would cost an average of
$20,118 a year, whereas the average cost to
own and operate a new vehicle in urban areas
is $10,049 for the equivalent miles driven.220
It’s important to note that ridesourcing fares
in many markets are subsidized221 and thus
the true discrepancy between ridesourcing
and vehicle ownership using this analysis’
methodology would likely be larger.
The possible economic boon that may
emerge prompts former General Motors
engineer and current Waymo advisor Larry
Burns to call automated ridesourcing “the
$4 trillion disruption.” Burns calculated this
number as follows:
• Americans travel more than 3
trillion miles a year.
• The total cost of owning and operating a
car is about $1.50 per mile.
• Even with the added cost of AV
technology, a driverless car costs only
about 20 cents per mile.
• A driver could save $5,625 a year using
a shared, driverless electric car instead
of a privately owned vehicle.222
But automated ridesourcing in dense, urban
environments, where they could presumably
earn the most revenue, is immensely
complicated and even companies that are the
furthest along in the technology (e.g., Waymo
and GM) have struggled to develop self-
driving vehicles that can navigate tricky traffic
scenarios safely and without irritating other
drivers on the road.223 In some cases, these
challenges may be delaying deployment plans.
The logic behind these respective companies'
decisions to invest in automated shared mobility
is sound, for human drivers currently account
for a significant percentage of transport’s
overall costs. By one estimate, the operating
cost of all passenger transport is at least 70
percent labor.215 In fact, the shift towards shared
electric automated vehicles – combined with
more advanced fleet optimization and servicing
platforms, next-generation traffic management
and more intense competition – can reduce the
fee charged to passengers of robotaxis by as
much as 80 percent versus a ride-on-demand
trip today.216 By reducing or even eliminating
driver costs through the use of automated
fleets, TNC’s can improve their profits. Yet they
can also tap into what’s perceived to be a much
larger and higher margin market that offers
vehicles as ongoing service providers rather
than as one-time sales to customers. General
Motors believes that operating its own network
of automated ridesourced vehicles could in the
long-term generate profit margins of up to 30
percent, versus the nearly 9 percent margin
it posted globally in 2017.217 The Boston
Consulting Group estimates that by 2030,
automated ridesourced fleets could account for
one-quarter of miles driven in the U.S.218 Intel,
whose processors are used in some automated
vehicles, foresees this new, so-called passenger
economy – when today’s drivers become
passengers in driverless cars, shuttles and
other vehicles – generating as much as $800
billion by 2035 and $7 trillion by 2050.219
The focus on using automation to reduce
ridesourcing costs is prudent given that
the current economics are in some cases
challenging. One analysis concluded that, in
many scenarios, ridesourcing could be more
expensive than private car ownership. It used
data from 243,838 economy-level, single-

EMERGING MOBILITY TECHNOLOGIES AND TRENDS64
carrying about nine passengers at a time.225
They facilitate community introductions to
automated vehicles, gather feedback from
community members and data on vehicle usage
and popularity, and to learn whether such AVs
can earn the consumer confidence to move
further onto the road.
Keolis Transit has been operating Navya’s
15-passenger AUTONOM SHUTTLE in Las
Vegas since November 2017. It is one of
the more substantive pilot programs in the
nation in terms of hours clocked, passengers
carried, and function served. The shuttle
operates along a tourist-heavy street, crosses
eight intersections, six traffic lights, and
two stop signs on its circular route, and has
transported more than 35,000 passengers as
of September 2017.226
While the largest automated shuttle pilot in
the U.S. and the first to deploy an automated
shuttle on public streets in mixed traffic, Las
Vegas is by no means the only community
seeking to trial and advance a practical role
for automated ridesourced shuttles in society.
For example, while GM planned to deploy
automated taxis in 2019, unexpected technical
challenges (such as a vehicle’s ability to identify
whether objects are in motion) mean that some
now believe that deployments at scale in 2019
are highly unlikely.224
Not all ridesourcing scenarios are as
challenging as dense, urban environments
though. Operational domains comprised of
more compact and constrained geographies,
especially those that can be precisely mapped
and restrict a vehicle to lower speeds, are
more easily solvable. This recognition has,
in part, given rise to an automated vehicle
mode that can well serve the Local Domain.
Small, 25 mile-per-hour automated shuttles
built by the likes of companies such as Navya,
EasyMile, and Aurrigo have become the focus
of many pilot programs and automated vehicle
demonstrations around the world. For some
of these efforts, the shuttles operate along
fixed routes only a few miles long, while others
are seeking to advance the mode’s role in
society. Research shows current AV shuttle
projects average about 1.5 miles per trip,
$4trillion
~$1.50 ~$0.20 $5,625>3T milesper year per yearper mile per mile
THE DISRUPTION
Distance Traveled by Americans
Cost of Owning and
Operating a Car
Cost of Operating
Driverless Car
Saved by Drivers Using
Driverless EVs
Source: Larry Burns, The Great Auto Disruption

THE “MOBILITY MENU”: DOMAINS, MODES, AND USAGE MODELS 65
already large millennial population. The city
seeks to trial such shuttles by working with the
Georgia Institute of Technology and Stantec
Urban Places, which is looking into possible
routes, fares and other factors to operate a
circulator shuttle in downtown.228 Austin, Texas
is also testing automated transit shuttles, and is
planning to deploy up to a half dozen.229
Others are already working to use such
shuttles as resources for public transit. Bishop
Ranch business park in the San Francisco Bay
Area partnered with automated shuttle service
company EasyMile to connect the office park
to a local train station.230 Ruter, the mass-
transit company for the Oslo metropolitan
area, signed an agreement in late 2018 with
Danish company Autonomous Mobility
involving several automated shuttle pilot
schemes beginning in 2019 and, in the longer
run, tests of a fleet of up to 50 vehicles.231
Finally, in March 2018, the Neuhausen transit
authority in the Swiss state of Shauffhausen
was the first in the world to incorporate an
automated bus into regular route public
transit in mixed traffic.232
In their effort to experiment with functionality
and prove out different models for how they
can aide with mobility, some automated shuttle
manufacturers push up against technological,
regulatory, or other barriers that impair the
mode’s advancement. For instance, NHTSA
stopped a Florida pilot that sought to transport
children to school using an EasyMile automated
school bus operated by Transdev. According
to NHTSA, Transdev was granted permission
to use its driverless shuttle for a specific
demonstration project, but not as a school bus.
Buses, the agency notes, are subject to strict
federal safety standards.233
Ann Arbor, Mich.-based startup May Mobility
deployed a fleet of automated six-seat shuttles
in June 2018 to transport Quicken Loans
employees for free along a one-mile loop, on
which it completed its first 10,000 trips in 75
days. Rather than selling vehicles to service
providers or transit agencies, the company
offers a fully-managed transit service that
includes the vehicles, maintenance, and site
operations crew. May Mobility is building
upon this first pilot with efforts in other cities,
including Columbus, Ohio where it launched a
trial in partnership with the Ohio Department
of Transportation in October 2018. The pilot
was comprised of three shuttles operating at
15 miles-per-hour, seven days a week, from 6
a.m. to 10 p.m. for one year around a roughly
one-mile loop adjacent to the city’s downtown
riverfront park. The plan is to expand the trial
in 2019 and test first/last mile routes through
low-income neighborhoods to help make
transit more equitable.
In Arlington, Texas, a 12-passenger automated
shuttle manufactured by EasyMile that was
dubbed “Milo” operated from August 2017 to
August 2018 at 15 miles per hour on off-street
trails in the Entertainment District, providing
free rides to visitors and citizens at over 110
events. The electric shuttles operated for public
demonstrations and before and after major
events at AT&T Stadium and Globe Life Park.
Ridership surveys showed that 99 percent of
Milo riders enjoyed riding and felt safe riding in
the vehicle.227
In Chamblee, Ga., stakeholders see automated
shuttles as not only the answer for first-mile/
last-mile concerns, given that the city is on the
Metropolitan Atlanta Rapid Transit Authority
line, but also a way for the city to grow an

EMERGING MOBILITY TECHNOLOGIES AND TRENDS66
survey asked customers about their riding
habits, their perceptions of scooter safety and
popularity and whether they replaced car trips
with scooter rides.235
With nearly 700,000 trips taken and over
800,000 total miles accrued, the survey found
that scooters are replacing automobile trips.
Thinking of their last e-scooter trip, 19 percent
of Portlanders said they would have driven a
personal car or hailed a taxi, and 15 percent
would have taken Uber or Lyft had scooters
not been available. The auto trip replacement
numbers are even higher among tourists
and visitors (48 percent). Additionally, the
survey found that Portlanders are reducing
or considering reducing their auto ownership
due to scooters. 6 percent of users reported
selling a car because of scooters and another
16 percent have considered it.236
SNAPSHOTSRecent micromobility pilot programs
documented its potential to displace
automobiles, and furthered the development
of tools and approaches to overcome
modal challenges.
Portland, Ore. Scooter Pilot Shows
Automobile Trip Displacement
The Portland Bureau of Transportation (PBOT)
conducted a four-month shared electric
scooter pilot the second half of 2018 in order
to evaluate whether the mode can contribute
to the city’s mobility, equity, safety, and climate
action goals.234
As part of this evaluation, PBOT surveyed
more than 4,500 customers of Bird, Lime and
Skip, the three companies permitted to operate
e-scooters in Portland. The wide-ranging
Portland Bureau of TransportationPBOTSHAREDELECTRIC
SCOOTERPILOT
4mosevaluation
Portlanders Visitors
>4,500customers
~700Ktrips taken
>800Kmiles accrued
6%15% 16%
Scootersarereplacingautomobiletrips.Becauseofscooteruse:
19%replaced auto trips
considered selling a car
reported selling a car
did not use Uber or Lyft
did not use personal car
or taxi
48%

THE “MOBILITY MENU”: DOMAINS, MODES, AND USAGE MODELS 67
Pilot Program that aims to inform the
development of long-term policy solutions to
expand sustainable mobility options equitably
while protecting public safety on city streets
and sidewalks.238, 239
Specifically, the goals of the program are to:
• Improve access to mobility options
for residents, employees, and visitors
to Santa Monica.
• Create new options that meet
diverse use cases in support of a new
model of mobility.
• Ensure safety and public access
by reducing sideway, pathway,
and ADA blockages.
• Educate users about the proper
rules and etiquette for shared
mobility devices.
• Create a legal and enforceable
framework for managing shared
mobility service providers in the Public
Right of Way (PROW).
• Build a good working relationship with
shared mobility providers to protect the
PROW while advancing new mobility
options in Santa Monica.
To accomplish these goals, the program will:
• Set a dynamic device cap based
on utilization.
• Require vendors to create interactive
safety education for users and increase
the availability of helmets for riders at
the time of use.
• Require operators to share real-time
utilization data with the City.
• Ensure equitable distribution
throughout the City.
Additional findings include:
• Portlanders are using e-scooters for
transportation and recreation. Nearly a
third of the Portlanders who responded
to the survey said they most frequently
used e-scooters to commute – to get to
work, school, or a work-related meeting.
Another third stated they most frequently
used e-scooters for fun or recreation.
• Scooters are popular with local users.
Eighty-five percent of Portlanders said
they were “extremely” or “very likely” to
recommend scooters to a friend.
• Among all respondents, e-scooters
appear to be more popular among men
(62 percent) than women (36 percent).
• All respondents – Portlanders and
visitors – prefer to ride e-scooters on
the street or in the bike lane over off-
street trails, and riding on sidewalks was
users’ least preferred option.
• E-scooters are bringing new Portlanders
to the bike lane. Forty-five percent of
survey respondents reported “never”
biking and 78 percent had never used
the city’s bikesharing system prior to
using e-scooters.
Furthermore, it appears that the e-scooters
might help increase bikeshare ridership. PBOT
data shows that there were only five weeks
during the scooter pilot program when the
city bikeshare system’s ridership decreased
from the same weeks in 2017. Most weeks,
bikeshare rides increased, in some instances by
as much as 72 percent.237
Santa Monica’s Shared Mobility Pilot Program
Addresses Array of Scooter and Bike Issues
In September 2018, the City of Santa Monica,
Calif. launched a 16-month Shared Mobility

EMERGING MOBILITY TECHNOLOGIES AND TRENDS68
In essence, effective modes within the
Midrange Domain are enabled by the volume
and frequency of travel demand within the
domain. They consist of private and corporate
fleet-owned and driven vehicles. Vehicles that
are in service are never unoccupied.
Primary modes that serve the Midrange
Domain include microtransit, ridesourcing,
and carpooling.
MICROTRANSIT, RIDESOURCING, ANDCARPOOLINGMicrotransit companies, such as Via, use
smartphone and other technologies to match
multiple riders going in the same direction with
vehicles following flexible, optimized routes and
schedules in an effort to maximize efficiency
and quality of service.241
Microtransit operators target commuters,
primarily connecting residential areas with
downtown job centers. However, there are
opportunities for microtransit services to
either expand into the paratransit space or for
• Require operators to develop systems
that will remedy improper parking,
including pick up/drop off zones
and incentives.
• Enhance operator customer service and
responsiveness to resident and user
complaints, including a 24-hour hotline.
• Set forth a broader list of recommended
program components through which
partners could be evaluated during
the pilot term.
In August 2018, the city began installing drop-
off zones for scooters, initially on sidewalks. The
city reports that there were 19 sidewalk corrals
and four in-street corrals as of November
2018, with the aim of having roughly 100
corrals by April 2019, about half on sidewalks
and half in-street.240
Santa Monica also seeks to become an
innovation testbed for dockless programming
and policy. To assist with this effort, the city
will use a mobility data platform, which was
developed by the Los Angeles Department of
Transportation (LADOT), to manage dockless
data and infrastructure and set up systems.
One system the city is testing is geo-fencing
with Lime and Bird scooters, which enables
the vehicles to detect their location and
automatically slow down or stop to abide to the
speed or usage limits in the respective zones.
MIDRANGE DOMAIN: SHARED RIDE MODES FOR 5-15 MILE JOURNEYSAbout 25 percent of all trips are within the
Midrange Domain, which consists of trips
between five and 15 miles long. Modes that
serve the Midrange Domain are those that
provide larger vehicles to shuttle people
between frequently-visited locations, such as
places of work and shopping.
MIDRANGE DOMAIN
Mode
of All Trips
~25%
Trips 5-15miles
Microtransit Ridesourcing
Carpooling

THE “MOBILITY MENU”: DOMAINS, MODES, AND USAGE MODELS 69
context of the Midrange Domain given its
functionality. Specifically, microtransit can only
replace (or enable) public transit in the same
situations that ridesourcing and carpooling
can. These include low-volume, nighttime, and
rural routes. Microtransit can’t be an effective
replacement of high-throughput urban transit
service for dense neighborhoods. What it can
be is more efficient ridesourcing platforms,
given vehicles’ 15-passenger or so capacities
compared to passenger vehicles’ four seats.
A number of microtransit services in the
U.S. are beginning to experiment with
ridesourcing platforms. In Los Angeles,
on-demand, microtransit service FlexLA
launched in October 2018 to shuttle users
around downtown.244 The San Mateo County
Transit District (SamTrans) in California
began testing an on-demand microtransit
route in late 2018.245 In 2016, Alameda-
Contra Costa Transit District (AC Transit) in
the east San Francisco Bay initiated the Flex
pilot that sought to replace low-performing
bus routes with a responsive system that
allowed users to book rides online ahead of
time.246 Also, a partnership between Arlington,
Texas and microtransit provider Via created
a service that aggregates information on
people heading in the same direction, displays
options for shared rides with nearby pick-
up points, and delivers passengers to select
stops around town for a flat $3.00 fare.247
These and several other microtransit efforts
throughout the U.S. indicate the significant
market potential for microtransit. In fact, an
August 2018 analysis found that corporate,
public, and chartered shuttles that comprise
microtransit are projected to account for more
than 60 percent of the demand-responsive
transit (DRT) market, which is poised to grow
from $2.8 billion in 2017 to $551.61 billion
paratransit to innovate along similar lines. The
use of advanced technology has the potential
to lower operating costs for services that target
special populations, such as disabled, older
adults, and low-income groups.242
While much discussion about microtransit has
been in the context of public transit, it’s more
appropriate to frame its discussion within the
Microtransit services typically include
one or more of the following service
characteristics:243
1.Routedeviation:vehicles can deviate
within a zone to serve demand-
responsive requests;
2.Pointdeviation:vehicles providing
demand-responsive service serve a
limitednumberofstopswithoutafixed
route between spots;
3.Demand-responsiveconnections: vehicles operate in a demand-
responsive geographic zone with one or
morefixed-routeconnections;
4. Request stops: passengers can
request unscheduled stops along a
predefinedroute;
5.Flexible-routesegments: demand-
responsive service is available within
segmentsofafixed-route;and
6.Zoneroute: vehicles operate along a
route corridor whose alignment is often
determined based on user input, with
fixeddepartureandarrivaltimesatone
or more end points.

EMERGING MOBILITY TECHNOLOGIES AND TRENDS70
from transit, biking, and walking trips.251 That
study’s same authors, now with NREL, found
that ridesourcing leads to approximately
83.5 percent more VMT than would have
been driven had it not existed, partly due to
the fact that at least 40.8 percent of VMT
are deadheaded (i.e., without passengers).252
Another study drew a similar conclusion
regarding Uber’s operations in New York City,
noting that in 2013 (the last year before Uber’s
presence was felt in the city) use of subways,
buses, and bicycles grew substantially, while
by 2016 the net growth in travel by Uber
and other TNC’s far outstripped growth in
those modes, tripling between June 2015 and
the fall of 2016.253 A December 2017 study
in 2030, and that shuttles could comprise
approximately 50 percent of the overall shared
mobility market.248
While microtransit fleets are primarily owned
and operated by companies, modern day
ridesourcing uses technology that enables
private vehicle owners themselves to transport
third parties. In this way, ridesourcing also
differs from scooters’ and bicycles’ application
of dockless technologies in that ridesourcing
technologies establish markets rather than
enable the use of the vehicle itself or the
management of its fleet.
Ridesourcing is perhaps the most prominent
mode in the Midrange Domain. If applied as part
of a system, it has the potential to reduce costs,
enhance efficiencies, and reduce congestion.
Yet the results of recent studies highlight mixed
results on these fronts.
Some studies have highlighted positive
prospective outcomes. For instance, Arizona
State University found that ridesourcing
services such as Uber significantly decrease
traffic congestion in urban areas – perhaps
due to an increase in vehicle occupancy, a
reduction in car ownership, a shift among
different traffic modes, the impact of surge
pricing, and/or increases in vehicle capacity
utilization.249 Massachusetts Institute of
Technology’s (MIT’s) Computer Science and
Artificial Intelligence Laboratory (CSAIL)
determined that a ridesourcing fleet of 3,000
cars could perform the duties of all 13,000 New
York City taxis.250
Alternately, the University of Colorado
concluded that ridesharing increases traffic
and makes transportation systems less
efficient by mode-shifting passengers away
I n fact, an August 2018
analysis found that
corporate, public, and
chartered shuttles that
comprise microtransit are
projected to account for
more than 60 percent of the
demand-responsive transit
(DRT) market, which is poised
to grow from $2.8 billion in
2017 to $551.61 billion in
2030, and that shuttles could
comprise approximately 50
percent of the overall shared
mobility market.

THE “MOBILITY MENU”: DOMAINS, MODES, AND USAGE MODELS 71
ride-hailing users and traditionally car-centric
households.”256
While concerning, many studies indicating that
ridesourcing is worsening traffic congestion,
VMT, and other metrics are far from conclusive.
In fact, some studies draw mixed or incomplete
conclusions. For instance, the San Francisco
County Transportation Authority (SFMTA)
concluded that Uber and Lyft were responsible
for 51 percent of the daily vehicle delay
hours increase, 47 percent of the increase of
vehicle miles traveled, and 55 percent of the
average speed decline on roadways in the city
between 2010 and 2016.257 Yet a challenge
in drawing such conclusions comes from the
fact that historically, service providers – and
others who impact congestion – are private
and, thus, some if not most of their trip data
is inaccessible. The SFMTA study didn’t have
exact information on the growth of freight
and delivery during the sample period, which
is when services such as Amazon Prime
grocery delivery grew exponentially. Nor did
it have information on construction in the
region, which could also have contributed to
traffic slowdowns. This lack of information is
in addition to the shortage of data from the
TNCs themselves, thus leading a lot of the
data to be induced or inferred.
This is starting to change, for while ridesourcing
companies are still resistant to sharing their
data, larger markets such as New York City have
been successful in negotiating access as part of
granting jurisdictional provisions to operate. As
cities now deal with the rapid influx of scooter
sharing, it seems that many have learned from
experiences managing ridesourcing by insisting
on access to travel data. As more data flows
from private to public companies – and as cities
figure out the best ways to aggregate, integrate,
showed that each mile of personal driving
Uber and Lyft eliminated added 2.8 miles
of professional driving, representing a 180
percent increase in total traffic, and that a 15
percent increase in ride-hailing trips can put
59 percent more vehicles on the streets, 30
percent of which are deadheaded.254 Perhaps
most alarming, the University of Chicago
determined that not only does ridesourcing
increase the number of car registrations by 3
percent, it also increases the number of fatal
accidents by 3 percent.255
The UC Davis Institute of Transportation
Studies surveyed 4,000 users in seven major
metro areas between 2014 and 2016. It
concluded that “…[ridesourcing] is likely
adding vehicle miles traveled to transportation
systems in major cities” due to the fact that
between 49 and 61 percent of trips either
wouldn’t have been made at all, or would have
been accomplished via transit, carsharing, bike,
or foot. Regarding vehicle ownership among
users who don’t use transit, there are “no
differences in vehicle ownership rates between
Massachusetts Institute
of Technology’s
(MIT’s) Computer Science
and Artificial Intelligence
Laboratory (CSAIL)
determined that a ridesourcing
fleet of 3,000 cars could
perform the duties of all
13,000 New York City taxis.

EMERGING MOBILITY TECHNOLOGIES AND TRENDS72
Since then, additional innovations have come
about. For instance, in October 2018 Lyft
launched an all-access subscription plan that
covers users for up to 30 rides per month
for an upfront monthly fee of $299. Each
ride can be for a value of up to $15, and if an
individual ride goes over that amount, the
user pays the difference through the usual
means.258 That same month, Uber launched its
own subscription-based model in Los Angeles,
Austin, Orlando, Denver, and Miami. Dubbed
“Ride Pass,” the service charges between
$14.99 and $24.99 per month to unlock
discounted, fixed rates for as many UberX and
UberPool trips subscribers wish to take. The
company states the service can save riders up
to 15 percent on their overall monthly travel,
based on historical data.259
and process multimodal data – greater insight
will be gained into how shared mobility affects
the broader transportation ecosystem, which in
turn will help cities and other decision makers
make wise policy choices.
We’ve also entered an age of adaptation and
innovation for ridesourcing, as providers begin
offering features and services that go beyond
simply matching drivers with passengers and
according a price-per-mile and time. The first
innovations were shared ride services, such
as Lyft’s “Lyft Line” and Uber’s “Uber Pool,”
which allowed multiple passengers from
different origins who are heading to different
destinations to ride in a single vehicle by
identifying proximate travelers and establishing
intelligent routing.
Fewer Trips Walk Bike Rail Carpool Drive Taxi
25%
20%
15%
10%
5%
0%
Mode
Pe
rce
nt
22%
17%
7%
15%
18%
1%
21%
Figure 23: Stated Modeshare if Ridesourcing Weren’t Available Indicates an Addition of Vehicle Miles Traveled
Source: UC Davis

THE “MOBILITY MENU”: DOMAINS, MODES, AND USAGE MODELS 73
booking fees for each ride.261 Flywheel is a Bay
Area-based ridesourcing app company that
seeks to unite taxicabs into one organized
ridesourcing network. The company offers two
main products: a ridesourcing app for riders,
and a smartphone-based operating system for
taxi drivers that replaces the jumble of meters,
dispatch, advertising, navigation systems, and
credit card readers currently clogging the
interior of the vehicle.262
Carpooling, which involves groups smaller
than seven traveling together in one car,263 is
similar to ridesharing in that they both share
vehicles for travelers heading in the same
direction. Key differences include the fact
that rather than earning income, carpooling
drivers simply focus on reducing their costs by
splitting fuel and usage charges. Additionally,
the drivers themselves are part of the group
needing to travel in the same direction, rather
than just facilitators. Various studies have
documented possible societal benefits that
could result through increased carpooling,
such as a substantive reduction in fuel
consumption264 and a 75 percent reduction in
traffic congestion.265
Recent notable carpooling efforts include the
Alphabet-owned mapping and navigation app
Waze’s June 2018 launch of Waze Carpool,
a new carpooling app that lets drivers across
California offer rides to people traveling on
a similar route. Unlike TNCs, which take a
commission from each ride and whose drivers
use it as a source of income, Waze Carpool
operates more like traditional carpool, where
riders chip in only to cover the cost of gas. The
desired result is one in which passengers obtain
an affordable and convenient ride while drivers
receive fuel money and carpool lane usage.266
In September 2018, Lyft announced a pilot
program in 35 cities that offers to pay
drivers $500 to $600 in Lyft credits to park
their cars for a month. About 2,000 people
participated in the program, which relies on
the honor system for drivers to self-report
their progress. The program follows up on a
smaller pilot that offered 100 residents of
Chicago $550 each in credit to avoid personal
vehicles for a month, an effort the company
deemed successful.260 While the program will
run for only one month, it’s part of a broader
effort by ridesourcing companies to shore
up their business by scaling – i.e., facilitating
peoples’ ridesourcing habits, especially as
an alternative to personal car use – and to
diversify their business models.
New entrants are arriving and offering creative
models as well. Dallas, Texas-based Alto
launched in November 2018. The company has
a dedicated fleet of cars it owns and maintains
with a basic business model revolving around
both a monthly membership fee and individual
Various studies have
documented possible
societal benefits that could
result through increased
carpooling, such as a
substantive reduction in
fuel consumption and a 75
percent reduction in traffic
congestion.

EMERGING MOBILITY TECHNOLOGIES AND TRENDS74
2018, for which the five cities paid a combined
$330,000 to support more than 186,000
local rides.269
In August 2016, the City of Centennial, Colo.
launched Go Centennial, a six-month pilot
program that combined a multimodal trip-
planning mobile app and a fully-subsidized
Lyft Line ridesharing service to help solve the
first/last mile challenge. This private-public
partnership teamed with Conduent, Lyft,
Via, and the Denver South Transportation
Management Association to test a new
platform for door-to-door transit planning
that incorporated information across multiple
transportation modes to facilitate connections
to and from the city’s Dry Creek Light Rail Station.
In total, the pilot provided approximately 1,300
trips for 127 riders, of which 36 percent were
new to using a ridesharing service. Wait times
from the Dry Creek Station were reduced from
2 hours to 5.25 minutes, which helped foster a
73 percent satisfaction rate for the program.
69 percent of riders used the program more
than once and ridership remained stable for
the existing Call-n-Ride service, which suggests
the Go Centennial program attracted new light
rail riders.270
In March 2018, the city of Monrovia in Los
Angeles County kicked off a multimodal
transportation program called GoMonrovia.
Through the GoMonrovia program, the public is
able to access Lyft and Lift Line rides within the
GoMonrovia service area for $0.50 and $3.00,
respectively. In addition, Lime placed more than
200 bikes throughout the city, which can be
rented by the public for $1.00 for a 30-minute
ride.271 The idea for GoMonrovia came from
a need to improve or replace the city’s dial-a-
ride program given that it serves only a very
narrow range of public transportation users,
SNAPSHOTSSeveral examples are furthering or highlighting
the potential that Midrange Domain
modes have in connecting travelers to or
supplementing transit, including cities’ efforts
to subsidize ridesourcing, transit agencies
and TNCs working together to link journeys
via travel hubs, and automated vehicles’ first/
last mile services.
Cities Subsidize Ridesourcing as a
Cost-Effective Supplement to Transit
The rise, popularity, and in many cases cost-
effectiveness of ridesourcing has prompted a
number of transit agencies to consider it as a
tool for augmenting transit lines, or outright
replacing lines, with lower ridership.
In March 2016, Altamonte Springs, Fla.
launched a one-year pilot that allocated up
to $500,000 over a year to pay for residents’
Uber rides within a geo-fenced area around the
9.4-square-mile town. Specifically, it offered a
municipal subsidy that covered 20 percent of
a ride that began and ended in the city, and 25
percent if it began or ended at the local light
rail station.267 The pilot comes on the heels of
a failed effort to secure $2 million in funding
from the Florida Transit Authority to introduce
a demand-responsive bus program that would
transport citizens to and from the local rail
station. While chosen as an alternate in the
wake of being denied funding, the city feels
that its effort with Uber accomplishes much of
what the bus program set out to accomplish,
but at a lower cost.268 Shortly thereafter,
the nearby cities of Lake Mary, Longwood,
Maitland and Sanford joined the program,
which was completed in July 2018 at a cost of
nearly $64,000 for the cities. The cities and
Uber subsequently launched a second phase,
which ran from August 2017 through August

THE “MOBILITY MENU”: DOMAINS, MODES, AND USAGE MODELS 75
surrounding the Eastgate Park-and-Ride –
which is the largest in the region with nearly
1,600 fully-occupied parking spaces – request
a Ford mini-shuttle to pick them up from their
homes. Similar to Uber and Lyft, commuters
input their location on the app and the shuttles
collect them either from their home or at a
designated collection point nearby. Riders
are then ferried to the park-and-ride, where
they can access public transportation for the
remainder of their trips.275
King County Metro plans to expand the on-
demand shuttle service throughout the Seattle
region during the year-long pilot. By offering
this new shuttle service, an estimated 44,000
residents are afforded the option to travel
without depending on their personal cars, nor
hunting for parking spaces.276
In October 2018, Los Angeles County
Metropolitan Transportation Authority
launched its “Mobility On Demand” pilot,
the result of a partnership with ridesourcing
company Via to provide a new way to
access transit.277
The Mobility On Demand pilot is basically
subsidized ridesharing that will serve first/
is inconvenient for general everyday use, and
is an expensive way to move people around,
costing the city around $19.70 per person per
ride. More broadly, the city started to rethink
its role as it relates to the provision of public
transportation in response to local housing
growth, an expanding job base, and regional
population trends.272
Transit Agencies and TNCs Launch
Partnerships to Connect Riders
to Transit Hubs
Research has found that transit systems
could build upon and bolster public transit
offerings by adopting on-demand dynamic
route transportation technology.273 As such,
municipal governments, metropolitan planning
organizations, and transit agencies around the
country are embracing the idea that greater
synergy between TNCs and transit services
can enhance mobility. Most partnerships are
motivated by a desire to improve mobility in
areas in which transit options are inadequate or
nonexistent, or where the supply of parking is
insufficient. Nonetheless, some initiatives also
reflect a desire to bolster the “brand image”
of transit, address budgetary shortfalls, or
promote economic development. Deficiencies
in taxicab service may also be a factor.274
King County Metro in Washington launched
a pilot in October 2018 offering on-demand
shuttle service to and from transit hubs
throughout the region using mobile apps from
6-10 a.m. and 4-8 p.m. The shuttles, which are
operated by Chariot and Ford Smart Mobility,
launched at no cost to passengers but will
eventually charge the same amount as a
Metro bus ride.
Using an app designed by Ford Smart Mobility,
commuters within a designated region
Research has found that
transit systems could
build upon and bolster public
transit offerings by adopting
on-demand dynamic route
transportation technology.

EMERGING MOBILITY TECHNOLOGIES AND TRENDS76
Altogether, DePaul University identified 29
partnerships between TNCs and public bodies
to improve mobility are in place around the
United States, the locations of which are shown
in Figure 24.285
Waymo Focused on Automated Ridesourcing
Service That Connects to Transit
In July 2018, Valley Metro, the transit
authority serving greater Phoenix and
Maricopa County, and Google’s automated
vehicle technology spinout Waymo
announced a partnership to use Waymo’s
fleet of self-driving vehicles for first/last mile
transit trips.286
The effort helps add substance to one of
Waymo’s core long-standing focal points –
last mile needs for specific Metro Stations.278
Using the Via app, passengers are able to
instantly book a seat in a shared, dynamically
routed vehicle to or from three key Metro
stations. Via’s algorithm matches passengers
with others traveling in the same direction
in a vehicle following an optimized flexible
route that seeks to minimize detours and
delays. Additionally, Via is working with
Metro’s Office of Extraordinary Innovation
to expand LA’s mobility menu, improving
access to public transportation and providing
an affordable, equitable, and accessible way
to Go Metro.279
The program is supported by a $1.35 million
grant from the Federal Transit Administration’s
Mobility on Demand (MOD) program.280 Via
will collect and keep fare revenues, $287,000
of which is their “risk-sharing contribution”
against their $2.5 million annual contract.
The total 12-month pilot cost is just short of
$3.4 million.281
Austin, Texas completed a year-long
experiment it called Pickup, also in partnership
with Via, which sought to enable riders
to summon smaller buses to pick them up
from low-density areas and shuttle them to
main routes and stations.282 The goal was to
upgrade a legacy dial-a-ride system to a fully
on-demand service that responds in real time
to rider demand and to improve mobility in
transit deserts efficiently without fixed routes.
While most users used the service as an area
shuttle rather than a connection to transit,283
the information collected and insights
derived from the pilot are informing the city’s
subsequent efforts to create a feeder service
that connects smaller communities to the
larger urban transit system.
Additional notable efforts include:284
• The transit authority in Dayton, Ohio
partnered with Lyft to provide free rides
between select transit stops.
• The city of Charlotte, N.C. will
contribute $4 to every Lyft trip to and
from selected light-rail stations. They
will do this for up to 40 rides for monthly
transit pass holders, and up to two rides
for those with non-monthly passes.
• The city of Vallejo, Calif. partnered
with Lyft to provide $2 or $3 rides
to the Amtrak station that links
Sacramento to San Jose. Rides were
limited to those who work in social
services, food manufacturing, and
hospital organizations.

THE “MOBILITY MENU”: DOMAINS, MODES, AND USAGE MODELS 77
the Waymo app to hail a ride to take them to
their nearest public transportation option.
The company then plans to expand the
partnership by providing fi rst- and last-
mile travel to Valley Metro RideChoice
travelers, which covers groups traditionally
underserved by public transit. This will form
the basis of joint research to evaluate the
adoption of Waymo technology, its impact,
and its long-term potential to enable greater
access to public transit.287
The greater Phoenix and Maricopa County
region has been a major testing hub for Waymo
connecting people to public transportation.
The company’s other three focal points are:
creating a ride-hailing service, developing self-
driving trucks for logistics, and licensing with
OEMs for personally-owned vehicles – each
of which already had signifi cant efforts behind
them. This announcement demonstrates the
company’s fi rst signifi cant effort to connect
people to public transportation.
The fi rst phase of this partnership, launched
in August 2018, offers fi rst- and last-
mile transit connections for Valley Metro
employees, helping to connect them with
public transportation. These riders can use
11. San Diego, CA
19. Detroit, MI
27. Altamonte Springs, FL
22. Boston, MA
28. St. Petersburg, FL
23. Summit, NJ
16. Centennial, CO
3. Bend, OR
21. Cincinnati, OH
15. Dallas, TX
12. Las Vegas, NV
1. Tacoma, WA
2. Portland, OR
24. Philadelphia, PA
25. Washington, DC
Lyft partnership ( if no longer active)Uber partnership ( if no longer active)Lyft + Uber partnership ( if no longer active)
10. San Clemente, CA
20. Dayton, OH
7. Dublin, CA
5. Marin, CA6. Sacramento, CA
4. Vallejo, CA
Online ticketing system incorporates Lyft routing options
Free trips to transit centers in speci�ed geographic zones
Discounted rides for commutes to/from Vallejo train stop to business park
Discounted Ubers on select high-activity summer days
Discounted Lyft Line rides to/from commut-er rail stops
Discounted rides to light-rail stops during major events
50% discount for all ridesharing trips taken within its boundaries Subsidized rides as
paratransit service option
Guaranteed Ride Home program to encourage commuting via alternative transportation
Subsidized rides along cancelled bus route
Free rides to/from light-rail station
Free rides from points on cancelled bus route to transit stops
Established Cincinnati Mobility Lab to share data
$5 o� rides on late-night trips along corridors
Subsidized rides as paratransit service option
Mobile ticketing app with Lyft as transit option
Discounted rides to select geographic zones
Discounts on short-hop trips between �ve communities: Altamonte Springs, Lake Mary, Longwood, Maitland and Sanford
Exploring contract with Uber for non-emergency 911 callers
Discounted rides to/from eleven suburban rail stations
$2 trips to/from rail station for parking permit holders
13. Phoenix, AZDiscounted rides to designated bus stops
17. Boulder, CO $5 credit on rides to downtown business district during holiday season
Centennial, CO
Online ticketing system
P
P
P
P Program designed to alleviate parking shortages
Program allowing for integration of TNC services in route-planning app
Program catering to paratransit-eligible populations and/or the elderly
Program primarily designed to promote TNC connections to rail lines
Program for increased data-sharing opportunities
Program limited to select times of day and/or days of the week
14. Austin, TX
Other active partnership
Free RideAustin rides within Exposition Area and to/from nearby bus stops
8. Monrovia, CA $0.50 �at rate fares for all trips within city boundaries
29. Royal Palm Beach, FLDiscounted rides for seniors within village boundaries, or to/from nearby medical center
P
26. Charlotte, NCDiscounted trips for local transit pass holders to/from two light-rail stops
*Innisfil, ON$5 subsidies on all trips within community boundary; plus additional �ate rate fares to select locations
For more details on each program, please see pages 9-11 in the report.
9. Los Angeles, CA Online app incorporating TNC routing options along with transit and other modes
18. Denver, CO Online app incorporating Lyft routing options along with transit and other modes
Figure 24: Partnerships Between Transportation Network Companies and Public Agencies
Source: DePaul University
Past and Present

EMERGING MOBILITY TECHNOLOGIES AND TRENDS78
that fill ownership, sharing, and subscription
model niches. So-called vehicle “rightsizing”
is the alignment of a vehicle’s size and weight
with the domain in which it serves and the
function it performs.
Of particular note when it comes to vehicle
rightsizing is the emergence of vehicles much
smaller than what’s currently common. Small
vehicles were once the norm in European
countries, and still populate the landscape to
some degree. The Smart ForTwo emerged in
1998 and, at less than 100 inches long, two
could fit in one standard sized parking spot.
It soon made its way to the United States.
The Volvo Monitoring and Concept Center
(VMCC), the company’s Southern California
design studio, thought of narrow vehicles as a
way to enable lane sharing and thus improve
traffic flow and congestion. They conceived of
the Tandem, which sat two occupants inline,
was only 57 inches wide yet engineered to be
safe and crashworthy.290 Recently, the Renault
Twizy emerged as a 92-inch long and 47-inch
wide popular electric car that’s on European
for several years. In addition to testing its self-
driving vehicles there, Waymo also launched an
early rider program in April 2017 that allowed
area residents to ride in Waymo vehicles for
free,288 and subsequently launched its first
commercial service called Waymo One in
December 2018.289 The latest partnership builds
upon this and other earlier regional efforts.
LONG-RANGE DOMAIN: ON-DEMAND, SHARED-ACCESS MODES FOR > 15 MILE JOURNEYSAlmost 15 percent of all trips are within the
Long-Range Domain, which consists of trips
beyond 15 miles long. For such trips, access to
and use of automobiles is primary.
In the context of discussing electric, connected,
automated, and shared vehicles, some have
hypothesized that the age of the personal
automobile will soon be coming to an end,
swapped out in their entirety for fleets of self-
driving, on-demand automated taxis.
However, such a future is unlikely. At a minimum,
personal automobiles will be available for
recreational purposes, for there will always
be a market for those who enjoy controlling
vehicles from behind the wheel. Beyond that,
there will be scenarios for which automobiles
are simply the most appropriate and functional
mode. Distances beyond 15 miles long and
the common purposes for which such trips
are taken generally require routing and
timing flexibility, and often space for multiple
passengers and cargo as well. Facilitating
access to such vehicles can be accomplished via
carsharing and car-subscription models.
While not all vehicles will end up in automated,
shared, electric fleets, one trend that likely will
be seen is the addition of new vehicular types
LONG-RANGEDOMAIN
Mode
of All Trips
Trips >15miles
Automobiles
~15%

THE “MOBILITY MENU”: DOMAINS, MODES, AND USAGE MODELS 79
CARSHARING AND CAR SUBSCRIBINGCarsharing is about having access to a fleet
of vehicles that is owned by somebody else. A
platform operator could own the fleet, or the
fleet could be dispersed.
When owned by fleet operators, carsharing
services can resemble traditional car rental
services in terms of vehicle selection and
consistent branding, but differ in their use
of technology to ease the check out and in
processes, and pricing models to facilitate
shorter-term rentals.
Given the similarities between the two, it’s
therefore not surprising that some of the
major car rental companies now own or
operate carsharing companies or services,
such as Avis’s Zipcar and Hertz On Demand.
Yet a key differentiator between the two
is that traditional car rental is oriented
around supply, and typically offer daily rather
than hourly usage.
When dispersed, vehicles are owned by
individuals who then rent out their vehicles
using peer-to-peer (P2P) networks, akin to
home sharing platforms such as Airbnb. The
emergence of P2P networks is a reflection
of the inefficiency inherent in car ownership.
While a disproportionally large personal
expenditure, personal vehicles tend to be used
only about five percent of the time.293 Thus,
P2P carsharing networks enable owners to
generate income during times when their
cars are unused.
Regardless of whether the vehicles are owned
by fleet operators or peers, carsharing platform
members use cars as needed and only pay for
the time used and mileage incurred. Other
vehicle expenses – including gas, maintenance,
roadways.291 In the future, we may see more
vehicles like these, as well as emerging concept
vehicles including the Toyota i-ROAD – a single-
passenger, three-wheeled urban vehicle with
“Active Lean” technology that enables it to
corner as a motorcycle does.
It’s important to highlight rightsizing and the
emergence of new and uncommon vehicles
before launching into the various models by
which people can access (as opposed to own)
them given the disruptive potential embodied
by these vehicles. In fact, a November 2018
report by the Christensen Institute implies
that small, narrow, electrified vehicles are truly
disruptive innovations given that they serve the
lowest budget existing buyers of vehicles with
a lower-cost and differently featured offering,
and/or are bringing entirely new consumers to
the market with a solution.292
With new types of vehicles such as these
emerging to fill functional gaps left by the
sedan, sports car, minivan, sport utility, pickup
truck, and other current and common vehicle
types, carsharing and subscription models
are well positioned to enable travelers in the
Long-Range Domain to access the type of
vehicle they need when they need it, rather
than purchase – and thus be locked into –
one or two types.
While a disproportionally
large personal
expenditure, personal vehicles
tend to be used only about
five percent of the time.
EMERGING MOBILITY TECHNOLOGIES AND TRENDS80
worldwide membership and 43 percent of
global fleets deployed. Europe follows behind
with 29 percent of worldwide members and
37 percent of global vehicle fleets.
Daimler’s Car2Go first launched in 2008 in
Germany and, as of mid-2017, had more than
2.4 million members in 26 cities across nine
countries, with more than 800,000 members
in North America. While it started with the
company’s Smart ForTwo, the service now
lets customers rent the company’s more
luxurious Mercedes GLA and CLA models.294
In 2016, UC Berkeley’s Transportation
Sustainability Research Center published
results of a three-year study of nearly 10,000
Car2Go members in five North American
cities. The report – co-sponsored by the U.S.
Department of Transportation, Car2Go, and
other funders – found that the service creates
a net reduction on the number of vehicles on
the road and miles traveled. Specifically, Each
Car2Go vehicle removed up to 11 privately-
owned vehicles from city streets, and that
every 1,000 vehicles shared reduces up to 50
million pounds of carbon dioxide. Between 2
and 5 percent of the Car2Go members sold
a vehicle, and an additional 7-10 percent did
not acquire one because of the service.295
BMW began its first carsharing service,
DriveNow, in Europe in 2011 in a joint
venture with the rental car company Sixt. As
of mid-2017, it had about 875,000 members.
In 2016, it established ReachNow, its North
American carsharing service, as a wholly-
owned subsidiary based in Seattle. Now
more than 50,000 members in that city,
Portland, and Brooklyn can rent various
models from BMW’s Mini brand, along with
other BMW models.
and in many cases insurance – are covered
by the owner. In most cases, insurance is
provided, or at least offered by, the carsharing
platform provider.
Round-trip carsharing is the most common
model for repetitive trips, and enabled by
both fleet operator and P2P platforms. For
this model, the vehicle is checked out from
and returned to the same location. A newer
model for carsharing is one-way, which is also
referred to as point-to-point, and usually only
enabled by fleet operator-owned platforms
– unless the P2P platform comes with vehicle
collection and delivery. For this model, a driver
can collect a car at one location and then drop it
off at another location within the service area.
The locations can be designated and branded,
or similar to dockless scooter and bikesharing
technologies, can be at any street parking spot,
with some companies establishing parking
arrangements with cities so customers don’t
have to feed meters.
Like ridesourcing, scooter sharing, and
bikesharing, modern carsharing is enabled by
smartphone technologies. A driver establishes
an online account, stores a form of payment
for the account, downloads a smartphone
app, and subsequently uses the app to
locate, reserve, access, and pay for vehicles.
While not currently as familiar or popular as
ridesourcing, carsharing is quickly growing
and – should current market and usage trends
continue – familiarity of carsharing could
soon approach that of ridesourcing. As of
October 2016, carsharing was operating in 46
countries and six continents, with an estimated
2,095 cities and approximately 15 million
members sharing over 157,000 vehicles.
Asia, the largest carsharing region measured
by membership, accounts for 58 percent of

THE “MOBILITY MENU”: DOMAINS, MODES, AND USAGE MODELS 81
offering carsharing by applying for a permit
in Seattle. Given trends towards vertical
integration and the proven and growing market
potential of carsharing, we can expect similar
moves by others who consider themselves
mobility providers.
Growth opportunities are emerging not only
in traditional ways, but also in more integrative
avenues, as society becomes more accustomed
to – and reliant upon – sharing. For example,
carsharing providers are striking deals with
developers to supply new developments with
vehicle access in lieu of large parking structures.
Daimler AG’s Car2Go, for example, has eyed
partnerships like one it struck in Calgary. The
partnership involved the developer purchasing
Car2Go minutes and splitting them among
tenants in the building, eliminating the need to
own a vehicle and thus parking.296
Altogether, there were over 1.9 million
carsharing members in North America as of
January 2017, more than double the number
fi ve years before that. Additional members
lend and borrow vehicles via P2P platforms
that include Turo and Getaround. Getaround
partnered with Uber to launch Uber Rent, a P2P
car rental service within the Uber app that fi rst
deployed in a pilot program in San Francisco.297
GM has also broken into the P2P space,
launching a new carsharing service in March
2018 that’s in addition to its fl exible carsharing
platform Maven. Called Peer Cars, the program
allows owners and eligible lessees to rent out
their personal GM vehicles to willing renters.298
The company has stated that Peer Cars will be
in 10 U.S. cities by the end of 2018.299
As indicated by Figure 25, in 2006, carsharing
in North America was comprised of nearly
118,000 members and more than 3,300
General Motors formed a carsharing service
in 2016 called Maven after the company
acquired the assets of the start-up Sidecar.
The following year, GM introduced a related
service, Maven Gig, that lets drivers for
Lyft, Uber and ridesharing services rent
electric Chevy Bolts.
Volkswagen plans to launch all-electric
carsharing under its “We Share” sub-brand
in Berlin in the second quarter of 2019, and
subsequently in North America in 2020. The
fi rst fl eet of vehicles will be comprised of 1,500
e-Golfs, and an additional 500 e-up! minicars
will be added later. We Share is the fi rst service
in the new ecosystem “Volkswagen We” aimed at
non-owners. Its operational model is internally
referred to as “free-fl oating” carsharing,
ensuring the spontaneous availability of
electric vehicles for customers at all times. At
a later stage, We Share will be adding smaller
vehicles as micromobility solutions to its fl eet
of electric cars.
Even micromobility companies are partaking
in carsharing action. Just as automakers like
Ford and ridesharing platforms like Uber and
Lyft began offering scooters, Lime indicated
its intentions in the fall of 2018 to begin
>1.9MNorth American
carsharing membersas of 2017

EMERGING MOBILITY TECHNOLOGIES AND TRENDS82
insurance, maintenance, taxes, roadside
assistance, and services such as home pickup
and mounting and storing winter tires. Thus, car
subscriptions are meant to fi ll the gap in vehicle
access between hourly carsharing and yearly
car leasing, and to do so more economically and
conveniently than traditional car renting.
While only beginning to gain traction and
currently only available in select markets, an
August 2018 study determined that 25 percent
of consumers have heard of car subscription
services. It is most appealing to young males
and new-vehicle buyers, with 10 percent of
consumers indicating they would be open
to a vehicle subscription service instead of
purchasing or leasing a vehicle the next time
they are in the market. Access to the latest
vehicles. By 2016, those numbers reached
approximately 1,840,000 and 27,000,
respectively.300
In what could be argued is a version of
carsharing, car subscription models have
emerged as the newest alternative to car
ownership. Similar to leasing, car subscriptions
allow subscribers to control a single vehicle for
extended periods of time. Yet just as carsharing
varied the duration of car rental services, so
does car subscription to traditional car leasing,
for subscribers can change vehicles weekly
or monthly rather than having to wait one or
several years while avoiding down payments
and end-of-lease fees. Users typically pay a
one-time membership fee and a subscription
payment for their vehicle access that includes
Year
117,656MEM
VEH
318,898 516,100 908,584 1,625,652 1,837,854
3,337 7,505 10,420 15,795 24,210 26,691
2.0M
1.8M
1.4M
1.6M
1.2M
1.0M
800K
600K
400K
200K
0
Me
mb
ers
30K
20K
25K
15K
10K
5K
0
Ve
hic
les
2006 2008 2010 2012 2014 2016
Members
Vehicles
Figure 25: Regional Carsharing Market Trends, 2006-2016
Source: Transportation Sustainability Research, UC Berkeley

THE “MOBILITY MENU”: DOMAINS, MODES, AND USAGE MODELS 83
Carsharing Becomes a Real Estate Perk
As previously discussed, the cost of car
ownership can be substantial. In urban settings,
such as New York City and other dense
downtown areas, this substantial cost can be
even higher once the steep cost of parking is
fi gured in. One UC Los Angeles (UCLA) study
found that 700,000 renters in the U.S. who
don’t have cars are nevertheless paying $440
million a year for parking.303 This cost is in
addition to the inconveniences associated with
fi nding parking spots.
With these points in mind, it’s not surprising that
real estate developers and building operators
are offering carsharing services as a perk for
residences. From a building management
perspective, the leveraging of carsharing in
condominium communities reduces the need
for parking spaces in the building, while allowing
tenants more cost-effective access to mobility
compared to traditional car ownership and
monthly parking space fees. Condo amenities
may now include 24/7 access to shared vehicles
for its owners; something that can be a big
selling point for condo buyers.304 Sensing the
opportunity, carsharing providers are actively
pursuing the market and striking deals that land
their services in a development’s garage.
Let’s Drive NYC is GM’s carsharing program for
eligible residents of The Ritz Plaza, owned by
Stonehenge Partners in midtown Manhattan.
Since 2015, residents can use a General
Motors’ developed smartphone app to reserve
a Chevrolet vehicle and access parking in one of
200 garages.305
Equity Residential and Zipcar, the world's
largest carsharing network, announced a
strategic partnership in 2011 that brought
Zipcar's carsharing services to Equity
technology is the key draw to subscription
services (44 percent). Worry-free maintenance
(36 percent), the ability to swap vehicles based
on needs (35 percent), and fl exibility (35
percent) also are strong benefi ts.301
Volvo executives say its Care by Volvo program
has delivered promising results. Launched in
November 2017 with the company's new XC40
crossover as its signature vehicle, Care by Volvo
allows customers to subscribe to a service that
bundles car, insurance and maintenance costs
into a single payment that's $650-$850 per
month, depending on the vehicle. Customers
sign a two-year agreement that lets them swap
for a new vehicle after a year. Within its fi rst four
months of operation, Volvo sold the number of
subscriptions it had anticipated for its fi rst year
of operation. Consumers signing up now for the
XC40 as part of Care by Volvo are on a long wait
list. Care by Volvo claimed as much as 15 percent
of the available crossovers, pinching supply
that dealers had otherwise expected would be
available for traditional vehicle sales.302
Other manufacturers including Ford and
Toyota have started car subscription companies
and services, and Porsche, Mercedes-Benz,
and Cadillac each let drivers in select cities
exchange high-end models several times a year
for approximately $1,000-$2,000 a month.
Yet altogether the model is still relatively new
and its full potential for displacing private
vehicle ownership and on-road vehicles
remains to be seen.
SNAPSHOTSThe provision of carsharing services is
proving to be an asset not only to cities and
communities, but also to others who might seek
to travel in the Long-Range Domain and avoid
personal car ownership.

EMERGING MOBILITY TECHNOLOGIES AND TRENDS84
BlueIndy Deploys Popular European Electric
Vehicle Carsharing Program to Become
Largest in the U.S.
In September 2015, Indianapolis, Ind. became
the home to the largest electric carsharing
service in the United States with the launch of
BlueIndy, an EV carsharing company started
through a mutually beneficial public-private
partnership between the City of Indianapolis,
the local electric utility Indianapolis Power and
Light (IPL), and the Bolloré Group.
The latter party, which obtains its name from the
company’s chairman and largest shareholder,
Vincent Bolloré, is a French holding company
whose subsidiary, BlueSolutions, is focused on
the development of electric vehicles, carsharing,
and integrated transportation solutions.
In 2011, Bolloré Group started Autolib, an
electric car rental business that was popular in
Paris and other parts of France. As of 2017, the
Paris program alone had approximately 4,000
vehicles and 6,100 charging ports.307 Building
upon this success, Autolib expanded into Italy,
London, Singapore, and Indianapolis – it’s first
North American city.308
Part of the Bolloré Group’s motivation for
bringing its program to Indianapolis was to test
what it deems to be its superior lithium metal
polymer batteries in Indianapolis’ cold winters
and hot summers. Bolloré Group executives
argued that the batteries’ solid-state design
make it safer than the standard lithium-ion
batteries used in other electric vehicles, which
contain flammable liquid electrolytes. They
also argue that it will eventually surpass the
lithium-ion battery in its ability to operate
between recharges.309 The company received
further support from the city’s mayor and
municipal government at the time, which
helped seal the deal.
Residential apartment properties. As part of
this agreement, Zipcars were placed at Equity
Residential apartment properties in New
York, Boston, Washington, D.C. and Seattle.
The companies claim that these vehicles are
accessible to more than 17,000 residents living
in participating properties.306
ReachNow, BMW’s carsharing service, has
served the 700 residents of the Solaire, a
residential tower in Battery Park City, N.Y.,
since December 2016. BMW says it plans to
expand the ReachNow program to residential
and business complexes across the U.S.
Recognizing carsharing’s potential to reduce
car ownership and thus the need for parking
spaces, city planners are changing the laws
to facilitate carsharing’s link to real estate. In
the city of New Rochelle, N.Y., for example,
real estate developers can now drop three
conventional car spaces for every carshare
space due to a provision added to their city
bylaws. The reduction in parking spot buildout
requirements can save developers a substantial
amount of money, thus adding to the market
drivers fueling the linking of carsharing
and real estate.
T he reduction in parking
spot buildout requirements
can save developers a
substantial amount of money,
thus adding to the market
drivers fueling the linking of
carsharing and real estate.

THE “MOBILITY MENU”: DOMAINS, MODES, AND USAGE MODELS 85
check out and unlock vehicles by using a pre-
supplied keycard.
In its first year of service, BlueIndy reported
that it had 2,800 members with 32,000 rides,
and that over 80 percent of members signed
up for the yearly membership.315 The BlueIndy
program gained traction in its first year by
successfully attracting members and continuing
to push forward to deploy additional stations.
Although government stakeholders sometimes
disagreed over the details, a broad consensus
formed on the value of BlueIndy to the people in
the metropolitan region of Indianapolis.316 Such
bullish early results indicated that consumer
interest in electric mobility solutions is robust
even in a place like Indiana, which is outside of
primary EV markets. With its expansion into
the suburbs, BlueIndy may further show how
innovative mobility solutions do not have to be
restricted to areas with high population density
and can accommodate the needs of residents
outside the city center.317
Perhaps as exciting as the initial ridership
results is the city’s demonstrated perspective
that BlueIndy is part of a larger, emerging
mobility ecosystem. While Indianapolis’ transit
system ranked the lowest in terms of per capita
ridership before the launch of BlueIndy,318
the city has since developed a plan for smart
corridors through the city that highlights
how it hopes to develop and integrate the
BlueIndy fleet and its electric bus rapid
transit line currently being constructed.319
Furthermore, the plan proposes to automate
BlueIndy’s popular airport-to-downtown
route to demonstrate the value of automated
capabilities in urban and highway roads,
thereby indicating how the service can be a
platform for additional increasing layers of
emerging mobility technologies.320
The Indianapolis project had its share of
hurdles as it progressed towards launch,
including the Indiana state utility regulator's
approval of only $3.7 million of the requested
$16 million electricity rate increase to help
pay for it, and the siting of publicly available
charging infrastructure. Greater stakeholder
engagement and a more robust case for the
public benefit of a program might have helped
overcome these challenges.310 Nonetheless,
after Bolloré and the city agreed to make up
the cost difference, providing funding that was
in addition to Bolloré’s original $35 million
investment,311 the project moved forward.312
Altogether, Bolloré has invested approximately
$41 million into BlueIndy, representing the
overwhelming majority of the effort’s $50.7
million total funding.313
BlueIndy is a subscription-based service,
whereby users who have a credit card
and a driver’s license can sign up for the
program online or at a BlueIndy enrollment
kiosk. Included with BlueIndy membership
is insurance while driving any one of the
company’s 500 vehicles and parking at any
of its 200 charging stations.314 Members can
book either round-trip or one-way journeys
via BlueIndy’s mobile app or at a kiosk, and can

EMERGING MOBILITY TECHNOLOGIES AND TRENDS86
compound this issue given the extraordinary
amount of data they’re projected to generate.
For instance, Intel projects that once essential
components including cameras, radar, sonar,
GPS and lidar are factored in, automated
vehicles will generate approximately 4,000 GB
– or 4 terabytes (TB) – of data a day,322 which
is almost equivalent to what 3,000 people
currently produce per day by using PCs, mobile
phones and wearables. Automated vehicle
technology company Aptiv states that by 2020,
connected vehicles will exchange one million
pieces of data every second.323
Companies whose business models are
premised on big data synthesis are well
positioned to leverage this data, but many public
agencies are unprepared and/or underequipped
to process – or even collect – the data. Those
who are collecting and processing mobility data
are able to derive powerful insights.
For example: South Bend in Indiana asked
bikesharing firm Lime to share data when it
launched there in June 2017. Lime provides
a dashboard for cities showing statistics like
how many of their residents rented bikes, how
many trips they took, and how far and long they
rode. It also has heat maps showing where most
rides occur (it says all data is non-identifiable).
Accordingly, authorities in South Bend could
see that as of September 2018, residents have
taken 340,000 rides, have traveled 158,000
miles, and are now using trip-level data to
decide where to place new bike paths.324
Other prospective insights derived from
processing mobility data include a city’s
ENABLINGTECHNOLOGIES ANDMARKETDRIVERS
T he rise of electrified, connected and
automated, shared vehicles that connect
to and help modernize transit and that serve
the Local, Midrange, and Long-Range Domains
has not occurred in a vacuum. Instead, their rise
has been enabled by, and is in turn influencing,
a number of adjacent technologies and market
drivers. One – the mobile phone – has already
been discussed, given its prominent role in
enabling this transition. Others include: “big
data,” modeling, and predictive and real-time
analytics; freight and commerce; intelligent
transportation systems; land use, urban design,
and traffic congestion; prize competitions;
public policy; safety; smart cities; and
venture capital.
“BIG DATA,” MODELING, AND PREDICTIVE AND REAL-TIME ANALYTICSThe ability to generate, collect, store, process,
and synthesize very large datasets based on
travel preferences and patterns has been a
core enabler of shared mobility. These abilities
lead to the brokering of rides among travelers,
vehicles, and/or drivers, as well as the routing,
optimization, low latency, billing, and eventual
profitability of these various platforms.
Yet many of the issues pertaining to the
generation, processing, and ownership of data
going forward are unresolved and underutilized,
yet are paramount to realizing the full potential
of shared, integrated, multimodal mobility.
One issue is the sheer volume of data that’s
being generated, which according to IBM
equates to 2.5 quintillion bytes of data from
all sources.321 Emerging mobility technologies

ENABLING TECHNOLOGIES AND MARKET DRIVERS 87
as road traffic data – and a platform for public-
private collaborations to manage streets,
reduce traffic deaths, and prepare cities for the
technological advancement emerging in cities.
As part of this effort, Uber is releasing data on
the speeds traveled on individual streets to
more cities to help them better assess traffic
conditions and manage congestion, thereby
helping to facilitate the opening up of what was
once closely guarded travel data. Separately,
Uber has also released some of its data on
pickups and drop-offs as part of another effort
to help cities reimagine the use of curb space
that is usually reserved for parking,328 and
rolled out its Jump bike mobility platform for
cities via its insight platform, Uber Movement,
that displays metrics such as number of vehicles
on the road and user trip details.329
Already operating in over 30 cities around the
world, the SharedStreets platform provides
city leaders with new instruments for managing
transportation networks.330 SharedStreets is
the result of a collaboration with the National
Association of City Transportation Officials
(NACTO), the Open Transport Partnership,
and with financial support from Bloomberg
Philanthropies.331
Other examples include:
• The Populus Mobility Manager, a
platform that integrates real-time
data feeds from major mobility
operators of shared fleets (bikes,
scooters, cars) with an interface for
city policymakers and planners. It
launched in September 2018 as an
advanced analytics platform that seeks
to help cities and private mobility
companies work more seamlessly
together through better data. This
allocation of parking, design of ridesourcing
pickup and dropoff zones, designation of
bike and scooter lanes, equitable access to
transportation,325 and where to locate bike
racks and parking pads for electric scooters
and recharging equipment, among others.
Such insights are only possible if the private
companies and others operating mobility
services are open – or forced – to share the
data they collect. Historically, companies
have been resistant to such data sharing
propositions, given that a significant portion
of their business is predicated upon the data
they collect. Additionally, less than 30 percent
of the more than 1,000 transit agencies in the
United States have an open data policy.326 Even
if mobility service operators do share their
data, a fundamental reality is that for every one
engineer or data scientist working for a city
there are 10 to over 50 in the private sector,327
making the processing of the data for public
benefit difficult.
But driven by regulations, collaborations,
and emerging third-part data platforms, that
situation is quickly changing. For example, Ford
Motor Company, Uber, and Lyft committed to
SharedStreets, a universal data language for
sharing information about city streets – such
Automated vehicle
technology company
Aptiv states that by 2020,
connected vehicles will
exchange one million pieces of
data every second.

EMERGING MOBILITY TECHNOLOGIES AND TRENDS88
systemic complexities and costs, those that are
simplest, cheapest, and/or yield the greatest
economic reward in the shortest timeframe
have an advantage.
The race to commercialize automated vehicles
illustrates these two points well. As discussed,
the technological challenge of automation
is being pursued via a number of strategies
that range in cost and complexity. It remains
to be seen if there is a universal “winning”
combination of lidar, radar, optical, and
ultrasonic sensors that can achieve maximum
versatility at minimal cost, or whether there will
always be innumerable sensor quantities and
combinations based on operational domains,
developer preferences, or other factors.
Yet even without answering this question,
market opportunities tied to the delivery of
commercial goods have emerged in long-haul
trucking, small-load urban delivery, and aerial
drones that are driving a select group and
application of automated and other mobility
technologies. This same subset of technologies
has the potential to drive other micromobility
applications as well.
LONG-HAULTRUCKINGPlatooning – vehicles closely following one
another so as to offset wind resistance –
and other higher levels of automated truck
technologies can provide a clear and near-term
return on investment. Testing done by NREL
demonstrated fuel savings up to 5.3 percent in
the lead truck while the trailing truck saved up to
9.7 percent.334 Given typical truck engine lives
of 700,000 to 1 million miles, savings between
5.3 and 9.7 percent can yield significant fuel cost
savings. Trucks able to engage in higher levels of
automation are estimated to save about $1.67
per mile compared to standard trucks.335
third-party data platform is meant to
aggregate data from mobility providers
within cities and subsequently deliver
insights required to design data-driven
policies and transportation plans, while
protecting information that requires
safeguarding.332
• TransitScreen’s MobilityScore turns
big data about supply, demand, and
access to all forms of mobility into
maps and analytics.
• Remix, a platform that brings
together and enables collaborations
between public transit, streets, and
new mobility to generate insights, is
working with Lime and Spin to make
use data available to the Los Angeles
Department of Transportation
(LADOT). Los Angeles transportation
officials will have access to real-time
location data related to the bikes and
scooters as well as trip route and
device status information.333
In the future, it can be expected that datasets
generated by mobility technologies will
continue to grow and, if properly processed,
yield even greater insights into preferences
and usage patterns, among other things. The
private sector will continue to make use of
these insights using its wealth of resources and
talent, and the public sector will increasingly
have options to access post-processed data via
collaborations with third-party aggregators for
use with policy making.
FREIGHT AND COMMERCEAny emerging technology is greatly – or perhaps
only – enabled when there are existing market
applications. Additionally, for any emerging
technology whereby a variety of configurations
predicated upon market applications can alter

ENABLING TECHNOLOGIES AND MARKET DRIVERS 89
Peloton, has announced plans to imminently
begin operating its two-truck platooning
system in day-to-day commercial operation.336
PERSONALDELIVERYDEVICES(PDDS)A great deal of freight traffic in urban areas is
now comprised of delivery vans,337 which is
causing gridlock and pollution. The problem is
expected to become worse, as urban freight
delivery is projected to grow by 40 percent
by 2050.338 In an effort to capitalize on the
market opportunity that this freight traffic
poses, automated vehicle and other mobility
technologies are being applied to vehicles
without passengers that ferry goods. McKinsey
& Company believes that automated vehicles
will deliver 80 percent of all packages within
10 years.339 KPMG predicts that such vehicles
will serve “islands of autonomy,” metropolitan
markets with unique mixes of consumer living,
working and travel patterns that will drive
requirements for locally tailored delivery
services.340 Early modes for such vehicles
that have emerged and already have market
orientation include small, automated personal
Platooning is one application of automated
technologies closest to market, not just because
of the demonstrable return on investment,
but also because the technologies required to
enable platooning are simpler and less costly
than those required to address higher levels
of automation. For instance, urban automated
taxis such as those envisioned by Uber and
Waymo might require a full suite of lidar,
optical, radar, and ultrasonic sensors, yielding a
vehicle potentially costing more than $250,000
and requiring extensive programming to
fully enable. However, platooning doesn’t
necessarily require lidar and optical sensors,
nor extensive programming to handle complex
urban situations, for highway operations can
be easier to manage. Instead, a combination
of V2V communications, radar, and ultrasonic
sensors can be sufficient to enable trucks to
platoon and reap the financial rewards that
come along with saving fuel.
Accordingly, while fully automated trucks are
still years away from commercialization, one
leading platooning technology developer,
Fuel Saving Lead Truck
Fuel Saving Trailing Truck(s)~5.3% ~9.7%~$1.67
per milesavings compared to standard trucks
700K-1Mmiles
expected truck engine life of
ROIclear and near-term
PLATOONINGANDAUTOMATEDTRUCKTECHNOLOGIES
Source: NREL

EMERGING MOBILITY TECHNOLOGIES AND TRENDS90
Compass Group. Through the pilot, Intuit
workers have been able to request robotic food
deliveries via the Starship app. In the wake of
this pilot, as well as another one in Washington
D.C.345 that led to more than 7,000 deliveries
by the company,346 Starship launched a large-
scale commercial automated delivery service
in April 2018 aimed at corporate and academic
campuses in Europe and the U.S. The company
planned to have around 1,000 robots by the end
of 2018 on a number of campuses, delivering
groceries, campus cafeteria food, business
and other package deliveries.347 One such
effort launched in the U.K. in November 2018,
allowing participating residents to receive an
unlimited number of parcels at a time of their
choosing for approximately $10 per month.
Another company making delivery robots is
Marble, which was the first company to bring
on-demand delivery robots to the streets of
San Francisco in April 2017. The company’s
vehicles are larger than those produced by
Starship, but nonetheless are similarly focused
on food and package deliveries. The company
launched an effort with Yelp Eat24 to ferry
food from restaurants to customers in two
San Francisco neighborhoods.348 Marble
also deployed vehicles in Dallas beginning
November 2018 as part of a six-month pilot
program that allows companies to deploy up
to 20 robotic delivery devices.349 The program
in Dallas comes on the heels of another pilot in
the state whereby the Austin Transportation
Department partnered with private tech
companies and PDD operators in August
2017 to test the feasibility of battery-powered
delivery robots in the city.350 Other notable
early stage efforts include San Francisco-
based Postmates’ sidewalk-based robotic food
delivery carts to residents of Los Angeles,351
PepsiCo’s fleet of “snackbot” snack-carrying
delivery devices (PDDs) that are designed
primarily for last-mile logistics using sidewalks
and driveways, rather than public roads
and highways.341
One company making PDDs is Starship
Technologies. Founded out of Estonia,
Starship Technologies has initiated a number
of automated delivery trials in recent years,
covering food and other small packages, in
more than 100 cities. Though the robots are
automated, they can also be monitored and
controlled remotely by humans if the situation
requires it.342 Designed using readily available
components, the robots are lightweight and
low-cost, enabling the company to bring the
current cost of delivery down by 10 to 15
times per shipment.343 The vehicles travel at a
maximum speed of six kilometers per hour and
carry a maximum payload of ten kilograms,
equivalent to three shopping bags. The
vehicles use optical sensors and GPS to obtain
a localization accuracy of two centimeters.344
In Mountain View, Calif., Starship has been
running a pilot on Intuit’s corporate campus
in conjunction with food service provider
by 2050
projected market growth
within ten yrs
of all deliveriesperformed by AVs*
40% 80%
URBANFREIGHT DELIVERY
*according to McKinsey & Company

ENABLING TECHNOLOGIES AND MARKET DRIVERS 91
The platform also has potential to improve
logistics within the personal mobility market,
for example by transporting, recharging, and
servicing micromobility devices.
THE“CENTERCONSOLE”Historically, vehicles’ center consoles
have been places where radio stations and
temperatures can be modulated. But with
the advent of connectivity, as well as large,
high-resolutions touchscreens that mimic
smartphone operability, the center console in
current and future vehicles is shaping up to be
so much more. While the typical entertainment
options – namely music – will still be accessible,
the center console is positioned to be the
location where vehicle occupants can access
a much broader array of entertainment,
goods, and services.
Perhaps no company illustrates this
better than Samsung. The world’s largest
smartphone maker had virtually no presence
in the auto industry until 2016 when it
acquired Harman International Industries
Inc., a U.S.-based automotive technology
manufacturer, for $8 billion. That acquisition
immediately catapulted the company towards
the top in the market for the top-of-the-line
“infotainment” systems: Samsung was the
second-largest auto infotainment supplier
in 2017, with $4.8 billion in revenue, second
only to Panasonic and Sanyo’s $5.1 billion.354
The company’s current plan is to create a
high-tech “digital cockpit” that updates a car’s
dashboard design for an ultra-connected
vehicle by placing a bank of screens from one
side of the car to the other. The screens would
allow drivers to control everything from the
interior’s temperature to home appliances,
while enabling passengers to surf the web and
watch streaming videos.355
robots on the University of the Pacifi c’s
campus in California,352 and Nuro’s partnership
with Kroger-owned Fry’s Food Store that uses
two of its small (104 inches long by 43 inches
wide by 70 inches high), 25-MPH electric cars
to deliver groceries to nearby homes.
To see how the automated PDDs can expand
beyond the PDD market and infl uence the
broader commercial and mobility paradigms,
one only has to look to the partnership
established between Starship and Mercedes-
Benz that is focused on rethinking traditional
logistics behind last-mile fulfi llment. Mercedes
invested more than $13 million to co-develop a
“mothership” concept comprised of Mercedes
delivery vans that can hold up to eight delivery
robots and a day's worth of parcels.353 At scale,
such a platform has the potential to relieve
stress on a city's infrastructure by orienting
commercial deliveries around smaller modes.
of millennials
would shop more if the ability was integrated into their car*
of all commuters
75% 82%
*based on a 2,000-person survey
SPENDING DURING COMMUTES
$212Bspent by U.S.
drivers

EMERGING MOBILITY TECHNOLOGIES AND TRENDS92
transactions and reach $265 billion by 2023,
according to Juniper Research.358 Such
substantial commercial potential is serving as
a potent driver not just for the development of
advanced, user-friendly infotainment units, but
also for overall vehicular connectivity. It could
be a deciding factor in swaying OEMs to adopt
5G technologies, given that 5G has the potential
to facilitate commercial transactions in addition
to automated applications, as the need arises.
LIGHTELECTRICFREIGHTVEHICLES(LEFVS)Bicycles have long been personal mobility
vehicles and, as discussed, are participating in
the current wave of advancing micromobility
via docked and dockless bikeshare platforms.
Yet the mode of transportation has potential
for additional market growth as companies eye
them for freight and commercial purposes.
So-called light electric freight vehicles (LEFVs)
and “cargobikes” are those that are attached
to or housed within cargo storage capacities.
They’re cheap, navigable, easy to park, have
electrically-propelled assistance, and thus can
be well-suited for urban deliveries. According to
research by the municipality of Amsterdam, the
average loading and unloading time for delivery
vans and trucks is 12 minutes; the same amount
of freight can be unloaded from an e-cargobike
in as little as three minutes.359 As such, mobility
developers, package shipment companies, and
others (including DHL, UPS, TNT) and others
are exploring prototypes, business models, and
pilot projects to experiment with, refine, and
perhaps commercialize the mode.
Volkswagen Commercial Vehicles plans to
produce the Cargo e-Bike, a three-wheel
electric “last-mile deliverer,” beginning in
2019. The vehicle is what the company calls
Leadership positions among center console
infotainment system suppliers are enviable
given these systems’ anticipated role in
driving potentially very large commercial
opportunities. Altogether, U.S. drivers are
responsible for $212 billion of spending during
their commutes. A survey of 2,000 people found
that nearly three quarters of all commuters
surveyed, and 82 percent of millennials with
long commutes, said they would shop more if
the ability to browse and pay for products and
services were integrated into their car.356
As such, initial efforts are already underway to
facilitate easy in-vehicle transactions to bring
both virtual and physical goods into vehicles.
The Visa Connected Car system, which was
unveiled in 2015, is integrated into a car’s
dashboard to enable the driver to use voice-
activated technology or the touch screen to
place orders at participating vendors who
are near a vehicle or on its route. As a proof
of concept, the company partnered with
Pizza Hut and Accenture to test mobile and
online purchases using Visa Checkout, Visa’s
online payment service, cellular connectivity,
Bluetooth Low Energy (BLE), as well as Beacon
technology deployed at Pizza Hut restaurants
to alert staff when the customer has arrived
and is ready to pick up the order.357
OEMs including General Motors, Ford, Toyota
and Volkswagen have developed connected car
commerce systems with varying capabilities
ranging from on-demand music streaming to
automatic payments at gas stations. Retailers
like Starbucks, TGI Fridays, Applebee's, Dunkin'
Donuts and Wingstop are exploring how their
customers are using these systems.
Accordingly, connected car eCommerce
platforms are projected to exceed 8.2 billion

ENABLING TECHNOLOGIES AND MARKET DRIVERS 93
INTELLIGENT TRANSPORTATION SYSTEMSAny new mobility technology or mode is
inserted into and operated with a context. That
context is the transportation infrastructure
comprised of roadways, overpasses,
intersections, junctions, sidewalks, signs,
and others structures that govern where
and how we operate vehicles. Many of these
infrastructures have technologies embedded
within them that enable a certain level of
functionality upon which to enable features and
govern vehicles and traffic.
Intelligent Transportation Systems (ITS)
improve transportation safety and mobility,
reduce environmental impact, promote
sustainable transportation development and
enhance productivity. ITS combines high
technology and improvements in information
systems, communication, sensors, controllers,
and advanced mathematical methods with
the conventional world of transportation
infrastructure.366
Thus, ITS technologies enable vehicles and
infrastructure to act as a system, and can play
a meaningful role in alleviating congestion and
promoting multiple mobility modes. Just as
mobility technologies are evolving, so too are
traffic management approaches. Historically,
such approaches have focused on monitoring
solutions based on embedded road sensors and
centralized, manually operated control centers.
New closed loop systems are leveraging real-
time, hyper-granular crowdsourced traffic data
and enabling active response management.367
Some agencies and companies are integrating
both legacy and evolving approaches to solve not
just the issues pertaining to current generation
vehicle but also to future vehicles, such as
a “pedelec” (pedal electric cycle) that adds
power assistance to its rider's pedaling with a
250-watt (48V) mid-mounted motor at speeds
up to 25 km/h. It is equipped with two wheels
at the front, with the load platform positioned
low between them. Mounted on this load
platform is a cargo box with a storage volume
of 0.5 cubic meters.360
The Tern GSD is designed to carry two
children, a week’s worth of groceries, or 180
kg of cargo, but it’s only 180 cm long—the
same length as a standard bike – and can pack
down small enough to fit in a VW Touran or an
urban apartment.361
German manufacturer Speedliner makes
UPS’s first iteration of a “modular urban
delivery system.” The firm’s new Rytle MovR
cargotrike is similar to a van: it has two hub
motors on the two back wheels, a canopy to
protect the rider from the elements, and is
narrow enough to fit in a bike lane or even on
a sidewalk, thus avoiding traffic in dense urban
areas. It also has a modular loading system that
allows a cargo box to slide easily on and off the
chassis of the bike362 and can hold about 15-20
packages. The company began testing the bike
in Seattle in October 2018,363 and previously
tested an earlier version of an e-bike in
Portland and Pittsburgh. It’s partnering with
the city as well as the University of Washington
Urban Freight Lab to study the vehicle’s
performance, particularly whether the bikes
can reduce the company’s overall “dwell
time” of trucks, helping cut both pollution and
traffic.364 Since the University transitioned to
electric cargo bikes for delivering mail around
campus, deliveries take 10 percent less time,
miles traveled have been reduced by 30
percent, and the university is saving $10,000
per year in fuel/maintenance costs.365
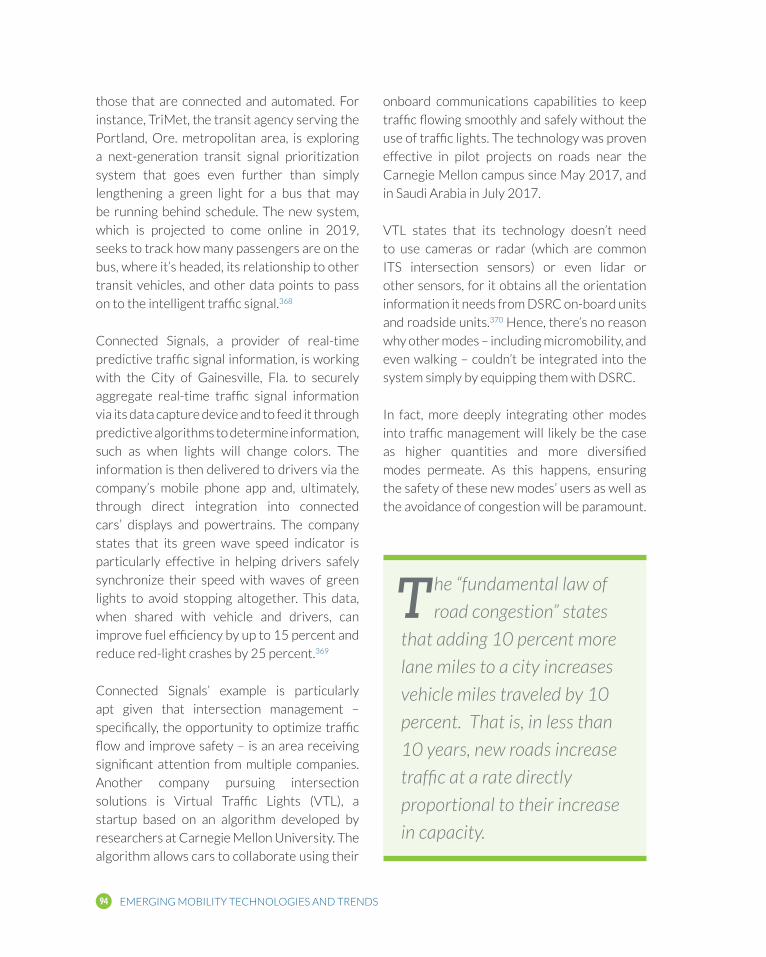
EMERGING MOBILITY TECHNOLOGIES AND TRENDS94
onboard communications capabilities to keep
traffic flowing smoothly and safely without the
use of traffic lights. The technology was proven
effective in pilot projects on roads near the
Carnegie Mellon campus since May 2017, and
in Saudi Arabia in July 2017.
VTL states that its technology doesn’t need
to use cameras or radar (which are common
ITS intersection sensors) or even lidar or
other sensors, for it obtains all the orientation
information it needs from DSRC on-board units
and roadside units.370 Hence, there’s no reason
why other modes – including micromobility, and
even walking – couldn’t be integrated into the
system simply by equipping them with DSRC.
In fact, more deeply integrating other modes
into traffic management will likely be the case
as higher quantities and more diversified
modes permeate. As this happens, ensuring
the safety of these new modes’ users as well as
the avoidance of congestion will be paramount.
those that are connected and automated. For
instance, TriMet, the transit agency serving the
Portland, Ore. metropolitan area, is exploring
a next-generation transit signal prioritization
system that goes even further than simply
lengthening a green light for a bus that may
be running behind schedule. The new system,
which is projected to come online in 2019,
seeks to track how many passengers are on the
bus, where it’s headed, its relationship to other
transit vehicles, and other data points to pass
on to the intelligent traffic signal.368
Connected Signals, a provider of real-time
predictive traffic signal information, is working
with the City of Gainesville, Fla. to securely
aggregate real-time traffic signal information
via its data capture device and to feed it through
predictive algorithms to determine information,
such as when lights will change colors. The
information is then delivered to drivers via the
company’s mobile phone app and, ultimately,
through direct integration into connected
cars’ displays and powertrains. The company
states that its green wave speed indicator is
particularly effective in helping drivers safely
synchronize their speed with waves of green
lights to avoid stopping altogether. This data,
when shared with vehicle and drivers, can
improve fuel efficiency by up to 15 percent and
reduce red-light crashes by 25 percent.369
Connected Signals’ example is particularly
apt given that intersection management –
specifically, the opportunity to optimize traffic
flow and improve safety – is an area receiving
significant attention from multiple companies.
Another company pursuing intersection
solutions is Virtual Traffic Lights (VTL), a
startup based on an algorithm developed by
researchers at Carnegie Mellon University. The
algorithm allows cars to collaborate using their
T he “fundamental law of
road congestion” states
that adding 10 percent more
lane miles to a city increases
vehicle miles traveled by 10
percent. That is, in less than
10 years, new roads increase
traffic at a rate directly
proportional to their increase
in capacity.

ENABLING TECHNOLOGIES AND MARKET DRIVERS 95
mixed into a group of 20 vehicles can smooth
out traffic oscillations and reduce congestion.372
Similar – if not more – potential exists as smaller
mobility modes displace vehicles. As is the case
with CAVs, current micromobility deployments
are taking place within the context of cities
as they currently are. Therefore, riders must
conform to current structures and norms; for
instance, by choosing to ride either on sidewalks
(and risk collisions with humans), bike lanes
(when they exist), or in the flow of traffic (and
risk collisions with vehicles). Yet micromobility
is premised on small vehicles that by definition
offer the most in terms of potential to reduce
the space allocated to roadways.
Forthcoming land use and urban design
decisions can take into account CAVs,
micromobility, and other emerging mobility
technologies and systems to create a new
“fundamental law” that promotes the use of
efficient forms of transportation and, in turn,
yields more green and productive space as the
vehicles become more common. For instance,
Portland is increasing road space for buses and
bikes from 4 to 6 percent, which it projects will
increase the total people-carrying capacity of
the streets rises by an average of 60 percent.373
Other examples include:
• The increased use of CV-equipped
roundabouts to reduce riders’
placement within low-visibility street
crossings and to separate them from
pedestrians, while also enabling
coordinated entrance/exits by CAVs;
• Incentives to trucks to make their
deliveries during off-peak hours to make
room for micromobility;
• Reallocating car parking spaces to
dockless bikes and scooters;
New systems such as those advanced by
Connected Signals, VTL, and others can play
a significant role in ensuring this happens,
but others will also be required given that
congestion alleviation paradoxically leads to
more road traffic, which increases congestion.
LAND USE, URBAN DESIGN, AND TRAFFIC CONGESTIONFor decades most local, regional, and state
governments have focused on increasing
street/road capacity as a solution to infill
development, access, and congestion. The
result of this approach is a landscape that, in
many places, is dominated by roadways that
segregate neighborhoods and increase driving.
In fact, the “fundamental law of road congestion”
states that adding 10 percent more lane miles
to a city increases vehicle miles traveled by 10
percent. That is, in less than 10 years, new roads
increase traffic at a rate directly proportional to
their increase in capacity.371
The arrival of advanced mobility technologies
and modes has the potential to break this
cycle. The form and format of the emerging
modes, their needs, usage patterns, and in the
case of automated vehicles, the ways in which
machine-driven vehicles differ from human-
driven vehicles.
To this last point, while current automated
vehicle programming is oriented around the
way roads and traffic patterns presently are,
as CAV technologies advance and become
commonplace, changes can be made to
roadways to reclaim land – roadways’ total
number, overall width, numbers of lanes, and
lane width. Fewer and narrower lanes can still
carry more vehicular volume given that robots
are predicted to drive more efficiently. Research
indicates that even a single automated vehicle

EMERGING MOBILITY TECHNOLOGIES AND TRENDS96
Prizes take a strategic approach to advancing
an issue. The prize design process is deliberate:
colleagues, partners, and subject matter experts
work together to carefully select and define
problems likely to be solvable through prizes.
They collaborate with stakeholders inside
and outside their organizations to determine
the outcomes they wish to achieve, and then
use those decisions to drive a prize design
process that yields specific outputs. The prize,
its requirements, and its results are publicized
in language that resonates with the audiences
they seek to engage. Finally, to realize the
full benefits of the prize, legacy activities are
initiated to provide resources and support to
the prize participants who remain engaged
after the challenge comes to a conclusion.376
Beyond the DARPA Grand Challenge,
numerous prize competitions have been
focused on advancing transportation and
mobility solutions. The Progressive Insurance
Automotive XPRIZE sought to inspire a new
generation of fuel-efficient vehicles that
meet consumer expectations for safety and
performance. Ten million dollars in prizes were
awarded in September 2010 to the teams that
successfully navigated a staged competition
for clean, production-capable vehicles
that exceed 100 miles per gallon or energy
equivalent (MPGe).377
The EcoCAR Mobility Challenge is a four-year
Advanced Vehicle Technology Competition
sponsored by the U.S. Department of Energy,
General Motors, and The MathWorks, and
is managed by Argonne National Laboratory.
Students are challenged to increase
vehicle efficiency by developing connected
and automated vehicle technologies and
implementing advanced propulsion systems
and electrification. The goal is to reduce
• Establishing multiple bike and scooter
lanes with different speed limits/
requirements for each; and
• A return to older city designs that use
narrower streets and sharper turns,
which are ideal for human beings and
smaller modes of transport.374
PRIZE COMPETITIONSPrize competitions have a more than 300-year
track record of attracting attention, overcoming
complex and lingering challenges, identifying
innovators, advancing innovation, and engaging
people, organizations, and communities.
The push to be the first person to fly solo non-
stop across the Atlantic wasn't motivated
solely by personal pride and determination. A
financial incentive and the potential for global
fame brought about by the Orteig Prize drove
Charles Lindbergh and his competitors to find a
way to make the seemingly impossible possible.
Not only did his success make Lindbergh
famous, it created excitement about aviation
that helped catapult commercial air travel from
curious startup into a global industry.
The same model of innovation through
competition jumpstarted the automated
vehicle industry. In 2004 and 2005, the Defense
Advanced Research Projects Agency (DARPA)
offered a “Grand Challenge” that awarded a
$1 million, then subsequently $2 million, prize
for the first competitor whose automated
vehicle could successfully navigate a 150-mile
course in the California desert. The winner
of the competition was a team from Stanford
University, which was led by Sebastian Thrun,
who went on to found Google’s automated
vehicle program. That program became
Waymo, which Morgan Stanley says could be
worth $175 billion.375

ENABLING TECHNOLOGIES AND MARKET DRIVERS 97
of mobility and transportation apps that run
on 5G wireless networks. Specifically, the
competition website defines appropriate
apps as “high-performance application[s] that
leverage the power of gigabit-speed networks
to address real-world challenges.” For example,
sponsors suggest that mobility apps could work
on traffic safety or directing users to multimodal
transportation options near them.382
Formula E features battery-electric open-
wheel racecars that compete on racing circuits
laid out on city streets. The racing series is a
place for electric vehicle makers to test out
new ways of addressing the unique challenges
of battery-powered transportation: range,
charging technology and heat management.383
The current competition rules prescribe that
all the cars use a 28 kWh battery supplied by
Williams Advanced Engineering, a subsidiary of
the Williams Formula One enterprise; however,
the competition demands are prompting
technological improvements in battery cooling,
bus bars, and detail design around supporting
the cells.384 While teams’ batteries are
currently standardized, some speculate that
once manufacturers are allowed to build their
own batteries, which could happen in or after
2025,385 teams could double their budgets386
and perhaps meaningfully advance electric
vehicle batteries and their management.
PUBLIC POLICY AND REGULATIONSCities and regions are struggling with how
to greet, integrate, and regulate emerging
mobility technologies, which is affecting the
ways in which the modes are being deployed,
their market size and successes, and other
factors. Reactions such as capping ride hail car
licenses in cities like New York,387 forbidding the
use of motorized scooters in cities like Beverly
Hills,388 and considering the ban on automated
energy consumption while maintaining the
performance, safety, and overall sporty design
and feel of the original vehicle, specifically for a
carsharing market.378
In October 2018, the Mobility Open
Blockchain Initiative (MOBI) and the Trusted
IoT Alliance (TIoTA) launched the three-year
MOBI Grand Challenge (MGC) in an effort to
unlock new blockchain-enabled connected and
automated vehicle solutions. The first part of
the challenge is a four-month long tournament
to showcase potential uses of blockchain in
coordinating vehicle movement and improving
transportation in urban environments,
culminating in a public demonstration of
selected technologies.379 The ultimate goal
is the creation of a viable, decentralized,
ad-hoc network of connected vehicles and
infrastructure based on a blockchain-secured
data exchange protocol that can reliably share
data, coordinate behavior, and thereby improve
urban mobility.380
The SAE AutoDrive Challenge is a three-year
automated vehicle competition sponsored
by SAE International and General Motors
focused on spurring university-based teams to
build fully automated passenger vehicles. The
technical goal of the competition is to navigate
an urban driving course in an automated
driving mode as described by SAE Standard
(J3016) level 4 definition by 2020, the third
year of the competition.381 Competing teams
include Kettering University, Michigan State
University, Michigan Technological University,
North Carolina A&T University, Texas A&M
University, Virginia Tech, the University of
Toronto, and the University of Waterloo.
Washington, DC is running the $34,000
GigabitDCx competition to spur the generation
EMERGING MOBILITY TECHNOLOGIES AND TRENDS98
affordability and accessibility. In Oakland, Calif.,
the city council passed a plan that requires
scooter companies that are deployed in the
city to meet several requirements, including
offering unlimited short rides for just five
dollars per year (or a package of “equivalent”
value) to those with low incomes. Those who
receive food stamps or subsidized energy bills
qualify for the affordable membership. The
scooter ordinance also calls for scooters to be
“distributed equitably throughout Oakland”
in an effort to improve access.391 Other cities
can be expected to include affordability and
accessibility provisions in ordinances of their
own, as awareness of such issues increases.
A consequence of a new, high profile market with
nascent regulatory protocols is the ever-present
threat of legal action. This threat is magnified
when the new market entrants are well funded
and supported by investors with large budgets.
Such is the case with micromobility companies
such as Bird and Lime. Accordingly, some law
firms have carved out dedicated spots on their
websites urging people to file scooter-related
claims,392 and in October 2018 the first major
class-action lawsuit against scooter companies
was filed in California.393 The lawsuit accuses
Lime, Bird, and other e-scooter firms of “gross
negligence” and “aiding and abetting assault” by
“dumping” scooters on public streets without
an appropriate warning, among other things.
It’s possible that lawsuits such as these will
only become more common and thus will affect
not only the involved companies’ business
plans, but more generally strategies by which
micromobility is deployed and adopted.
Recognizing that regulations can, and in many
instances already have, an outside role in
determining market dynamics and success,
scooter companies are hiring transit advocates,
vehicles in cities like Chicago389 demonstrate
an inconsistent and uncertain approach among
local governments to mitigating the new
technologies’ downsides. Other policies that
provide incentives for technology or mode
adoption are helping to create markets where
none previously existed. The following are
samples of some of the various ways in which
public policies and regulations are affecting
emerging mobility technologies.
MICROMOBILITYSan Francisco was one of the first cities to
tackle scooter regulation. Annoyed and
offended by the mass deployments undertaken
without permission by scooter companies such
as Bird, Lime, and Spin, the city banned those
companies from deploying. Instead, the city
awarded permission to two other companies,
Scoot and Skip, of which the city perceived as
having more of a focus on safety. The city also
capped the number of scooters each company
could operate at 625.
A similar script is playing out in cities throughout
the country. Scooter companies, following the
“move fast and break things” approach used by
shared mobility companies – most notably Uber
– are dropping hundreds of scooters into new
markets – sometimes in a single night – in an
effort to build a user base that would help resist
efforts to ban the vehicles, should that happen.
Given this approach, those jurisdictions where
rules are not yet in place are an advantage to
the companies. In fact, Bird’s CEO has stated,
“The places where there are no laws, that’s
where we go in.”390
While many jurisdictions are dealing with
fundamental issues such as where and how
many scooters can be deployed and used, some
are already addressing next-level issues, such as

ENABLING TECHNOLOGIES AND MARKET DRIVERS 99
enable an effective balance between regulation
and ad hoc deployments of dockless vehicles.
Invariably, companies’ efforts involve some
level of organizing and sharing data. In August
2018, Bird released its GovTech Platform to
help local governments manage its scooters.
The platform includes four key elements: data
dashboards, geo-fencing, community mode, and
rider education. The dashboards allow cities
to track anonymous data related to scooter
use; geo-fencing will show city-designated no-
scooter zones; community mode allows citizens
to report irresponsible scooter behavior on
the Bird app; and education will occur through
in-app messages to Bird users before every
trip.399 Given that the tool only works with
Bird scooters, there’s a strong element of self-
interest tied into its development, provision,
and adoption, and the platform may be limited
in its overall effects.
The provision of this tool also refl ects an
elemental truth, which is that data is core to
regulation. Primary data sharing policy features
include trip and fl eet availability data, update
frequencies, customer feedback and other
data, and data sharing agreements between
private vendors and public authorities to
meet transportation, safety, and equity goals.
lobbyists, and others with government and
nonprofi t experience in an effort to shape
regulations.394 For example, in October 2018,
former U.S. Secretary of Transportation
Anthony Foxx, who helped spearhead federal
automated vehicle regulations and the Smart
City Challenge, became Chief Policy Offi cer
and Senior Advisor to the President and CEO
at Lyft,395 which had recently expanded its fl eet
to include scooters and e-bikes.396 In addition
to Foxx, Paul Steely White, former executive
director of New York’s Transportation
Alternatives, joined Bird around the same time
that Foxx joined Lyft.397 Lime hired a formidable
lobbyist fi rm, Akin Gump Strauss Hauer & Feld,
for work on “policies supportive of electric
bike and scooter sharing.”398 Experienced,
well-connected professionals and agencies
such as these are primed to help micromobility
companies avoid some of the political and
regulatory missteps they've made when
entering new markets.
Micromobility companies are also taking
collaborative and unilateral actions to improve
cities’ abilities to deploy vehicles. While these
actions may be viewed as a preemptive move
to avert excessive or otherwise onerous
regulations, they can also be viewed as a way to
1 2 3 4
data dashboard geo-fencing community mode rider education
BIRD'SGOVTECHPLATFORM

EMERGING MOBILITY TECHNOLOGIES AND TRENDS100
teleoperators also fall under that defi nition.403
In such a situation, one might look to the federal
government as a standardizing force. But the
federal government has taken a decidedly
hands-off role, electing to provide states
with guidance on how each one can regulate
automated vehicles rather than pushing for its
own regulations.
In 2018, NHTSA released its latest guidelines
for self-driving vehicles in its “Preparing for
the Future of Transportation: Automated
Vehicles 3.0” – the follow up to guidance
provided in versions 1.0 and 2.0 in 2016 and
2017, respectively. It provides guidance and
policy considerations for a range of industry
sectors, including: manufacturers and
technology developers, infrastructure owners
and operators, commercial motor carriers,
bus transit, and state and local governments.
Of particular note, the guidance provides
several updates to the U.S. Department of
Transportation’s (USDOT’s) initiatives relating
to automated vehicles, by:404
• Stating that the USDOT will interpret
and, consistent with all applicable notice
and comment requirements, adapt the
defi nitions of “driver” or “operator” as
appropriate to recognize that such terms
In an effort to codify minimal requirements
for fi elds and content from providers for
both its own and others’ use, the Los Angeles
Department of Transportation has created a
data sharing standard via an iterative, public
process on Github. Dubbed the Mobility Data
Specifi cation (MDS), this data-sharing standard
prescribes a format for trip data, fl eet status,
and communication expectations between
city regulators and private fl eet providers. It
meets most of the broadly specifi ed policy aims
from cities like Nashville, Santa Monica, San
Francisco, and others.400
CONNECTEDANDAUTOMATEDVEHICLESThe efforts undertaken by companies and
cities to deal with and regulate the infl ux of
micromobility have direct applicability to
the issues they’ll be faced with as automated
vehicles deploy. This could be helpful given that
a study of 68 large U.S. cities’ transportation
plans revealed only 6 percent considered how
driverless cars would affect urban mobility.401
Foremost among the applicable lessons learned
is the need for both parties to engage with
each other – perhaps to co-develop tools and
platforms similar to Bird’s – to determine and
enable appropriate regulations. Transferable
issues include promoting competition
within a confi ned landscape, fl eet sizes and
management, pickup and drop-off zoning, and
equity and accessibility, among others.
As of October 2018, 29 states have enacted
legislation related to automated vehicles.
Governors in 10 states have issued executive
orders related to them.402 The challenge with
these various regulations and executive orders
is that they’re inconsistent. For instance, state
laws spell out at least three different defi nitions
for “vehicle operator.” In Texas, it’s the “natural
person” riding in the car, while in California,
of American cities exploring integration of AVs into long-term transportation plan
50%

ENABLING TECHNOLOGIES AND MARKET DRIVERS 101
Connected vehicles are in a similar federal
regulatory limbo. In an effort to overcome
the chicken-and-egg barrier regarding
DSRC, whereby the effectiveness of any
single equipped car depends on the sufficient
existence of others as well as roadside
infrastructure, NHTSA and the USDOT
published the notice of proposed rulemaking
(NPRM) for what is expected to become Federal
Motor Vehicle Safety Standard (FMVSS) 150,
which seeks to mandate V2V communications
for new light vehicles and to standardize the
message and format of V2V transmissions.”407
As drafted, the standard would require vehicle
manufacturers to install DSRC radios in new
vehicles starting around 2023, and to transmit
BSM. However, current federal efforts have
stalled, and the overall status and timeframe
of the rulemaking is questionable.
Smaller automated vehicles for commerce
are sorting out their own regulatory issues.
Regulation of PDDs is truly nascent. Today, a
limited number of states currently or soon will
have PDD-specific statutes or regulations,
including Arizona, Florida, Idaho, Ohio, Utah,
Virginia, and Wisconsin. Each of these statutes
has a few common features: requirements
related to size, speed, and weight limits; and
active control and monitoring by an operator.
Similar frameworks are also being developed
at the city level, including in Washington, D.C.
and Walnut Creek, Calif. The regulations are
far from uniform. For example, while the Idaho
statute includes an 80-pound weight limit
excluding cargo, the resolution establishing
a PDD pilot in Austin, Texas allows for
up to 300 pounds, excluding cargo.408 In
December 2017, the San Francisco Board
of Supervisors voted to severely restrict the
devices and regulate the zones in which the
robots could operate.
do not refer exclusively to a human, but
may include an automated system.
• Identifying and supporting the
development of automation-related
voluntary standards developed through
organizations and associations, which
can be an effective non-regulatory
means to advance the integration of
automation technologies.
• Affirming that the USDOT is continuing
its work to preserve the ability for
transportation safety applications
(i.e., DSRC) to function in the
5.9 GHz spectrum.
Given the non-binding approach taken by
the federal government and the inconsistent
approaches taken by states, cities are leveraging
their control of test sites and streets to take the
lead in regulating automated vehicles. In fact,
50 percent of large American cities are now
exploring how to integrate AVs into their long-
term transportation plans. Cities throughout
the country have embraced different types of
AV pilots, ranging from informal agreements
to structured contracts between cities and
companies. Many city leaders have taken
an active role in AV deployment where
possible by introducing executive orders and
resolutions, issuing requests for proposals,
forming partnerships with companies, hosting
conferences and engaging the public.405 The city
of Arlington, Texas operated automated shuttles
in order to obtain a better understanding of AV
technology, and how it might fit into the city’s
mobility landscape, increase opportunity for
public engagement and education by familiarizing
residents with AVs, and to position Arlington as
an innovative city. In Chandler, Ariz., AVs have
been present since 2016, as the city focuses on
easing the transition to full deployment through
zoning changes and other policies.406

EMERGING MOBILITY TECHNOLOGIES AND TRENDS102
• Restricting the hailing of a TNC from the
street and other requirements;
• Hours a TNC driver can provide service;
• The categorization of TNC drivers either
as contractors or full-time employees;
• Congestion charges; and
• Capping the number of TNCs that can
operate within a city (a policy most
notably undertaken by New York City
in August 2018).
While influenced and advocated by the taxi
industry, policies to cap TNCs are primarily
being driven by concerns about increasing
congestion. Some TNCs are attempting
to address this issue and, in turn, preempt
such regulations. Uber is spending $10
million to help cities develop more efficient
transportation policies and reduce congestion
and vehicle emissions. The company plans to
distribute the money over three years as part
of a campaign to support efforts that prompt
people to take greener alternatives to the
personal automobile, such as car pools, public
transit and bikes. To that end, some of the
money will be used to advocate for congestion
pricing plans, which charge drivers for
entering the busiest neighborhoods at peak
traffic times.412
ELECTRIFIEDVEHICLESThe creation of the modern electric vehicle
industry was prompted by regulation.
Specifically, it was the Zero Emission Vehicle
(ZEV) Program introduced by the California
Air Resources Board (CARB) that prompted
large investments by automakers in electric
vehicle technologies. This program – which at
the time it was introduced in 1990 required
that a percentage of the vehicles produced for
sale in California had to have no emissions of
criteria pollutants413 – was a classic example
CARSHARING AND TNCSAutomated vehicles aren’t the only vehicles
whose deployment models and market success
are highly influenced by public policies and
regulations. A handful of states have enacted
legislation regarding carsharing that includes
incentives, taxation, electrification, and
creating a regulatory framework for peer-to-
peer carsharing. California is even regulating
emissions.409 In some states and municipalities,
short-term carsharing is taxed at very high
rates, in part because shared vehicles are
categorized as rental cars and are taxed at
a daily rate even though the vehicle may be
used only for 15 minutes or an hour. A few
state legislatures have taken action to more
clearly distinguish carsharing from car rentals
and tax carsharing at lesser rates or based on
the actual amount of time the vehicle is being
used.410 Pressure to tax carsharing often comes
from traditional car rental agencies, who seek
the imposition of the same taxes they’re forced
to pay in order to eliminate one of carsharing’s
competitive advantages.
At least 28 states have established some sort of
regulatory framework for TNCs. Delaware has
a memorandum of understanding between its
Department of Transportation and Uber. New
Hampshire and Rhode Island have convened
official legislative study committees. The
scope of these states’ laws varies, dealing with
issues including411
• Insurance requirements;
• Background checks for drivers;
• Standards and timeline for vehicle
safety inspections;
• Record-keeping for drivers and vehicles;
• Communication of estimated fares and
the final receipt to a customer;
• Operation at airports;

ENABLING TECHNOLOGIES AND MARKET DRIVERS 103
What might be different with forthcoming
electric vehicle policies than previous ones
is the modes that may be encouraged. While
previous policies focused on prompting electric
passenger vehicles and transit buses, the
viability and popularity of electric scooters
and other micromobility means that this mode
might now be emphasized. All told, electric
scooters account for only 1-2 percent of the
carbon dioxide emissions that driving a car
the same distance does. Even having to be
collected/recharged, they're still around 70-95
percent more effi cient.418
SAFETYOne of the early markets for automated vehicle
technologies – and thus a driving factor – is
their ability to help make streets safer. There
were more than 37,000 roadway fatalities in
2017,419 and of those approximately 94 percent
were caused by human error.420 AV technologies
have the potential to remedy most if not all of
those human errors, which could lead to nearly
35,000 saved lives each year.
of “technology-forcing” regulation, whereby
a mandated outcome is virtually unachievable
using the technologies available at the time
it’s mandated. Given that the program was
technology agnostic, it prompted widespread
investments in battery, hybrid, fuel cell, and
other low- and zero-emission technologies.
While electrifi ed vehicles’ manufacturing
costs continue to decline, which serves as a
signifi cant market driver on its own, it’s likely
that regulations will continue to assist their
advancement. Transportation recently became
the single biggest source of greenhouse gas
emissions in the U.S.;414 in cities, it tends
to represent an even larger share. As such,
policies are seeking to advance the deployment
of ZEVs. For instance, CARB built upon the
precedent established by its ZEV program in
December 2018 when it unanimously passed a
rule that bars transit agencies from purchasing
new gas-powered buses by 2029, and requiring
only zero-emission buses by 2040.415
Meanwhile, 246 American cities signed on to
the Paris Climate Agreement, which represents
a commitment to reduce greenhouse gas
emissions to 17 percent below 2005 levels
by 2020, and even more by 2025. Some cities
have gone further: Los Angeles recently
pledged to produce zero net carbon emissions
by 2050. Washington, D.C. pledged to reduce
greenhouse gas emissions from transportation
by 60 percent by 2032.416 Several countries,
cities, and jurisdictions throughout the world
have announced plans to outright ban internal
combustion engines.417 Such commitments
mean that public policies focused on spurring
the use of electrifi ed vehicles (i.e., mandates,
subsidies, or economics-based approaches
such as congestion charges, etc.) is likely if cities
are to meet their goals.
more efficient including collection and recharging
emissions of a car over the same distance
electric scooters
1-2% CO2
70-95%

EMERGING MOBILITY TECHNOLOGIES AND TRENDS104
speed crashes as vehicle redesigns prioritize
lower speed functionality over high-speed
driving, among other factors.423
Additionally, the issue of avoiding increased
safety risks during the transition from
conventional to AVs has emerged as a major
challenge, especially given that it is a challenge
likely to persist over decades as at least
some number of conventional vehicles will
remain on roadways. Safety questions exist
for infrastructure and traffic operation, and
law enforcement. To minimize such risks, AV
early adopters may concentrate on closed
communities, precincts and campuses. Local
agencies will need to deal with the most
challenging conditions: dense, complex
urban environments.
Safety also affects micromobility. Users of
micromobility devices instead of personal
cars are reducing the odds of collisions,
especially those that are fatal, given that
micromobility devices weigh a fraction
of the amount of a regular car. That said,
their exposed design means that users
are subject to hazards in new and perhaps
more impactful ways. For instance, potholes
experienced in cars are nuisances whereas
on a scooter the same pothole could derail
a ride. Given micromobility’s nascency, its
total effect on safety is a long way from being
solved. Still, many are already considering
the issue, including micromobility providers
themselves. Lime launched a $3 million
educational campaign, Respect the Ride, to
promote responsible use of the company's
dockless bikes and e-scooters by asking riders
to sign pledges and providing free helmets.424
Similar and even more comprehensive
initiatives can be expected from others in
the near future.
ADAS technologies, which comprise the
lower levels of automation, include automatic
emergency braking (AEB), lane-keeping assist
(LKA), and others that aide humans’ abilities
to drive and help overcome their short fallings,
such as attention averted away from roadways
and falling asleep. Some studies indicate
that lane departure warnings and blind spot
detection systems cut the rate of sideswipe
crashes and injuries421 and AEBs reduce
rear-end crashes by 39 percent.422 Higher
levels have even greater potential to avert
collisions, given their presumed abilities to
sense, anticipate, and communicate intentions
with each other.
That said, AV technologies’ safety
enhancement is far from given. As previously
discussed, many drivers don’t understand
current ADAS technologies, and some of those
technologies don’t work as promised. A study
on higher levels of automation indicates that
while AVs might largely eliminate low-speed
crashes, they could produce more severe high-
fatalities in 2017
caused by human error
AV tech potential remedy for most
human error
lives could be saved annually
>37K
~35K
ROADWAYFATALITIES
~94%
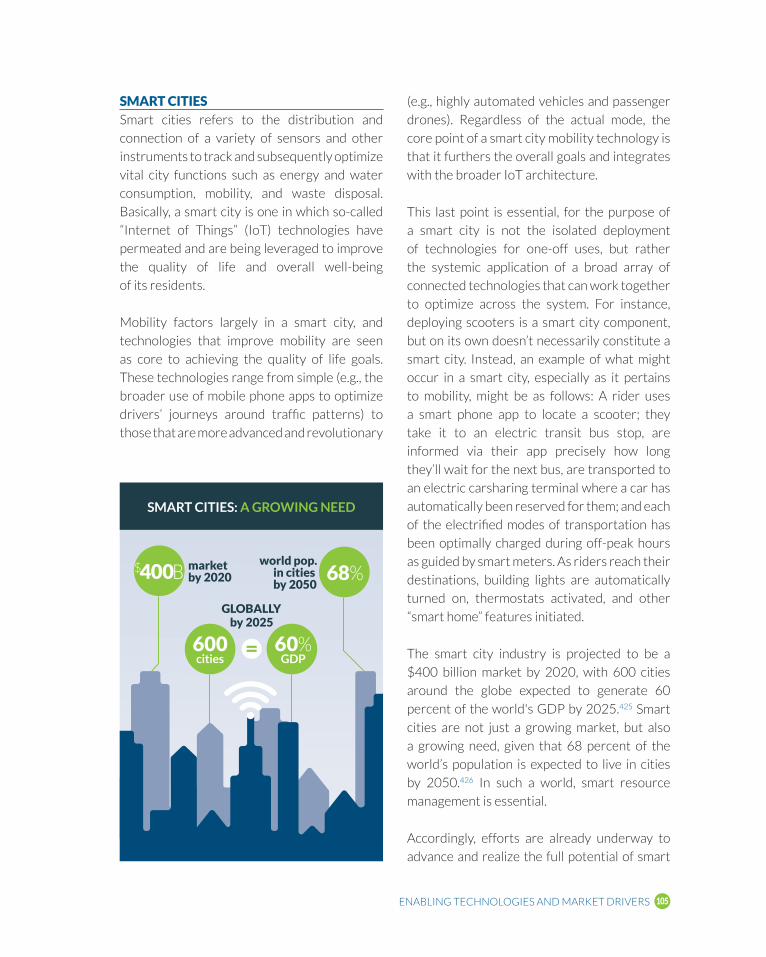
ENABLING TECHNOLOGIES AND MARKET DRIVERS 105
(e.g., highly automated vehicles and passenger
drones). Regardless of the actual mode, the
core point of a smart city mobility technology is
that it furthers the overall goals and integrates
with the broader IoT architecture.
This last point is essential, for the purpose of
a smart city is not the isolated deployment
of technologies for one-off uses, but rather
the systemic application of a broad array of
connected technologies that can work together
to optimize across the system. For instance,
deploying scooters is a smart city component,
but on its own doesn’t necessarily constitute a
smart city. Instead, an example of what might
occur in a smart city, especially as it pertains
to mobility, might be as follows: A rider uses
a smart phone app to locate a scooter; they
take it to an electric transit bus stop, are
informed via their app precisely how long
they’ll wait for the next bus, are transported to
an electric carsharing terminal where a car has
automatically been reserved for them; and each
of the electrified modes of transportation has
been optimally charged during off-peak hours
as guided by smart meters. As riders reach their
destinations, building lights are automatically
turned on, thermostats activated, and other
“smart home” features initiated.
The smart city industry is projected to be a
$400 billion market by 2020, with 600 cities
around the globe expected to generate 60
percent of the world's GDP by 2025.425 Smart
cities are not just a growing market, but also
a growing need, given that 68 percent of the
world’s population is expected to live in cities
by 2050.426 In such a world, smart resource
management is essential.
Accordingly, efforts are already underway to
advance and realize the full potential of smart
SMART CITIESSmart cities refers to the distribution and
connection of a variety of sensors and other
instruments to track and subsequently optimize
vital city functions such as energy and water
consumption, mobility, and waste disposal.
Basically, a smart city is one in which so-called
“Internet of Things” (IoT) technologies have
permeated and are being leveraged to improve
the quality of life and overall well-being
of its residents.
Mobility factors largely in a smart city, and
technologies that improve mobility are seen
as core to achieving the quality of life goals.
These technologies range from simple (e.g., the
broader use of mobile phone apps to optimize
drivers’ journeys around traffic patterns) to
those that are more advanced and revolutionary
market by 2020
$400Bworld pop. in cities by 2050
68%
600 cities
60% GDP
SMARTCITIES:A GROWING NEED
GLOBALLYby 2025

EMERGING MOBILITY TECHNOLOGIES AND TRENDS106
billion in 2017, seeks to turn Singapore into
a modern laboratory for conceptualizing,
testing and implementing ideas to tackle
problems unique to urbanized areas. To
begin, the government has decided to focus
on housing, health and transport.428 Part of
this effort includes a comprehensive and
advanced automated vehicle pilot project
and deployment strategy that includes the
construction of miniature a town dedicated to
the vehicles’ use.429
In the United States, smart cities efforts
that include a prominent role for mobility
include the $50 million Smart City Challenge,
which was launched by the USDOT and
cities. In a study of 140 cities worldwide, 50
were identifi ed as the “smartest” – i.e., those
that are most advanced in categories such as
vision, leadership, budget, fi nancial incentives,
and six other categories. Figure 26 graphically
illustrates the study’s ranking methodology.
The top smart cities were London, Singapore,
Seoul, New York, and Helsinki.427 Interestingly,
while a maximum score of 50 was possible,
the top city of London was scored at 33.5,
indicating room for signifi cant advancement
even among the leaders.
The second place winner, Singapore, adopted
the title of “Smart Nation” in 2014. Its Smart
Nation initiative, funded to the tune of $2.4
Shanghai
Beijing
Surat
Melbourne
CopenhagenStockholm
Los Angeles
Kigali
Ahmedabad
Washington D.C.
New Delhi
Montreal
Helsinki
Taipei
Dubai
AmsterdamVienna Boston
London
Charlotte
Reykjavik
Bhubaneswar
Seattle
ChicagoWellington
Atlanta
Berlin
Dublin
Jakarta Sydney Jaipur
VancouverToronto
Rio de JaneiroKansas City
Columbus
Phuket
Hong Kong
Tokyo
Tel Aviv
Philadelphia
Paris
San Francisco
Lyon
PuneShenzhen
Seoul
New York
Singapore
Barcelona
Integrated
Sco
pe
Shanghai
Beijing
Surat
Melbourne
CopenhagenStockholm
Los Angeles
Kigali
Ahmedabad
Washington D.C.
New Delhi
Montreal
Helsinki
Taipei
Dubai
AmsterdamVienna Boston
London
Charlotte
Reykjavik
Bhubaneswar
Seattle
ChicagoWellington
Atlanta
Berlin
Dublin
Jakarta Sydney Jaipur
VancouverToronto
Rio de JaneiroKansas City
Columbus
Phuket
Hong Kong
Tokyo
Tel Aviv
Philadelphia
Paris
San Francisco
Lyon
PuneShenzhen
Seoul
New York
Singapore
Barcelona
Size of Bubble = Scale of Smart City
Figure 26: Ranking Methodology for 2018/19 Top 50 Smart Cities
Source: Eden Strategy Institute and ONG&ONG (OXD)

ENABLING TECHNOLOGIES AND MARKET DRIVERS 107
coalition for smart cities education and
advocacy, runs an annual “Readiness Challenge”
that helps cities and states advance their
smart cities initiatives. The Challenge offers
communities interactive workshops, mentoring
and digital tools that help them develop their
smart cities plans, build community support
and strengthen their projects to deliver more
widespread and inclusive results. Entrants are
judged not on their previous smart city work,
but on the quality of the programs and projects
they wish to implement next.433 Winners of the
2018 Readiness Challenge were: Birmingham,
Ala.; Cary, N.C.; Las Vegas, Nev.; Louisville/
Jefferson County, Ky.; and the Commonwealth
of Virginia. These jurisdictions shared three
winning traits:434
• They focused on breaking down silos to
help departments provide better, more
effi cient service by working together;
• They emphasized coordinated
collaboration, not just internally,
but also with the community and
nearby regions; and
• They used smart cities strategies
to lift up underserved and
vulnerable populations.
Altogether, it’s likely that as cities increasingly
think comprehensively about mobility, the built
environment, technologies, and the use of their
investment dollars, the adoption of explicit
smart city policies and programs will propagate.
VENTURE CAPITALPrivate investor dollars have played a leading
role in advancing new mobility technologies.
Almost $3.5 billion of early stage venture capital
(VC) investments fl owed into transportation-
related startups from January through August
of 2018. As Figure 27 highlights, such an amount
Vulcan Inc. in December 2015. Its objective
was to consolidate data-driven ideas that
make transportation safer, easier, and more
reliable. The Smart City Challenge attracted
the following:430
• Approximately 300 companies interested
in participating in the Challenge;
• 78 applications, leading to the naming of
seven fi nalists (Austin, Texas; Columbus,
Ohio; Denver, Colo.; Kansas City, Mo.;
Pittsburgh, Pa.; Portland, Ore.; and San
Francisco, Calif.) in March 2016 and
the winner (Columbus) in June of that
year; all proposals had CAVs as central
enabling technologies.
The Smart City Challenge further attracted
attention to extending the benefi ts of the
challenge beyond the winner. In 2018,
Columbus began sharing its playbook for
smart cities – including contracts, program
materials, presentations, white papers, videos,
webinars and data – with hopes of educating
one million city offi cials, policy makers,
business leaders and infl uencers on the
Smart Columbus successes and challenges by
2020.431 Many of the unsuccessful applicants
are advancing parts or all of the smart city
visions proposed in their applications. Broad
interest has been mobilized among private
companies and nonprofi ts that specialize
in fi elds such as wireless transmitters for
vehicles and infrastructure, urban innovation,
cloud computing, telecommunications, solar-
powered charging stations for electric vehicles,
engineering design software, and pedestrian-
and cyclist-detection for buses.432
Nonprofi t and industry stakeholder
organizations are also assisting with the effort.
The Smart Cities Council, a leading industry

EMERGING MOBILITY TECHNOLOGIES AND TRENDS108
24 months between rounds, the average
transportation startup raises a new VC round
roughly every 18 months. The need to raise
money more often may result from capital
intensity – such as the costs to develop, test,
and bring to market automated vehicles, or
the acquisition of large quantities of bikes or
electric scooters.438
Private investor dollars complement larger
corporate mergers, acquisitions, and other
substantial deals that have helped catalyze
established companies. For example, Honda
plans to spend $2.75 billion to support
development and deployment of automated
vehicles with General Motors and its Cruise
Automation subsidiary, whose seed funding
round was for $4.3 million in March 2014. Such
a rapid scale-up and increase in investment
dollars is common in an industry hungry for
technological promise and solutions.
Micromobility also benefited from a substantial
infusion of capital. Its rapid rise has fueled –
represents a 10-year high and constitutes the
bulk of energy-related investments.
Electric vehicle technologies and companies,
especially those in Asia, have received the bulk
of this funding in the form of smaller investments
to a greater array of companies, according
to the International Energy Agency.435 That
said, the past four years have seen a frenzy of
investment activity in automated and related
vehicle technologies, with $80 billion invested
between August 2014 and June 2017,436
punctuated by $4.2 billion in investments into
such companies in the first three quarters of
2018. These investments have been focused
on early-stage companies whose products can
fulfill specific use cases, such as managing a
logistics AV fleet or enabling last-mile deliveries,
while larger funding amounts have gone to
companies building complete vehicles.437
Analysis found that transportation upstarts
raise capital more frequently than the global
average. Whereas the world average is roughly
20082007 201120102009 2012 2013 2014 2016 20172015 2018
2.0
1.5
1.0
0.5
0
Year
Bil
lio
n U
SD
(20
17
)
Transport
Other EnergyTechnologies
Figure 27: Venture Capital Investments in Energy Technologies by Quarter
Source: International Energy Agency, September 2018 (citing data from the Cleantech Group i3 Database)

ENABLING TECHNOLOGIES AND MARKET DRIVERS 109
2010 2011 2012 2013 2014 2015 2016 20182017
$3.5B
$3.0B
$2.5B
$2.0B
$1.5B
$1.0B
$.5B
0
Year
De
al V
alu
e
50
45
40
35
20
25
30
15
10
5
0
De
als
Clo
sed
2626
43
22
$4
28
M
$2
,91
8B
$5
54
M
$2
,48
0B
Scooter Deal Value
Bikesharing Deal Value
Number of Scooter Deals Closed
Number of Bikesharing Deals Closed
Figure 28: Global Venture Capital Scooter and Bikesharing Investments
Source: PitchBook *As of August 8, 2018
2018 by peer-to-peer carsharing company
Getaround. Smart cities is another area of VC
as investment funds are being established
specifically around the smart city framework,
such as Pictet’s UCITS-compliant Pictet-
SmartCity fund launched in August 2018.442
With such large amounts of capital infusions,
startups have been able to scale up rapidly,
develop and advance pre-commercial
technology architectures and pilot projects
(e.g., automated vehicles), flood new markets
with products to make them ubiquitous
and convenient for prospective riders (e.g.,
scooters), and altogether take advantage of
current market opportunities and enthusiasm.
and was fueled by – an influx of hundreds of
millions of dollars from investors looking to
catch the post-ridesourcing shared mobility
wave. Bird has raised $415 million in capital,
the bulk of which was raised in the first half of
2018, which led to its valuation of $2 billion as
of October 2018.439 Lime raised $335 million in
July 2018, bringing its total amount of funding
to $467 million and a valuation of $1 billion as
of October 2018.440 The amount of venture
dollars going into bikesharing companies like
Lime, Ofo, Mobike and Hellobike has increased
by at least 172 percent in each of the past
five years, including a jump of more than 300
percent each of the past two years, as of August
2018 (see Figure 28).441
Another investment category that is helping to
propel emerging mobility technologies is the
Long-Range Domain, with a recent example
being a $300 million funding round in August

EMERGING MOBILITY TECHNOLOGIES AND TRENDS110
REALIZINGTHEVISION: URBANMOBILITYINDEPENDENTOFC A R O W N E R S H I P
T he trend towards electrified, connected
and automated, shared mobility and the
emergence of multiple commercially-viable
modes that fulfill travel needs within the
Local, Midrange, and Long-Range Domains
means that the opportunity to establish and
scale mobility systems that don’t depend on
personal car ownership has never been better.
Yet for such a goal to be realized, core enablers
need to be established and adopted, foremost
among them being the systemic integration
and dynamic coordination between modes and
domains, to facilitate users’ seamless point-to-
point travel (see Figure 29).
THE ESSENTIAL NEED: SYSTEMIC INTEGRATION AND DYNAMIC COORDINATION BETWEEN MODES AND DOMAINSSmartphone applications are emerging as
the preferred tool to stitch together mobility
options and offer prospective users clarity on
modes, availability, travel options, and step-
by-step travel instructions so as to facilitate
modal viability and use. Efforts are now focused
on the broad linking and integration of all of
the various shared mobility modes to enable
seamless point-to-point travel. An ultimate
goal is the creation of a system for modes to
work together; not just passively providing
availability and route timing information, but
actively performing essential tasks like ensuring
modal availability by repositioning micromodes
and coordinating bus stop departure times,
much as an airline would for flight connections.
One platform that is making progress towards
these goals is the Whim app by Finnish startup
MaaS Global. Available in a number of European
cities, Whim offers users access to both public
and private transportation, including everything
from buses to bikes to scooters, all in one
platform. It allows travelers to book a door-to-
door trip with a click, automatically reserving
a car, bike, bus, train or multiple transit modes
to complete a journey. Users can either pay for
all modes that comprise a given journey on a
per-ride or monthly unlimited-use subscription
basis. Whim charges approximately $50 per
month for limited service including public
transit, bikeshare, and limited ridesharing, and
$500 per month for full ridesharing service.
In the United States, a number of comparable
smartphone apps have emerged and
are gaining users:
• Citymapper lets users tap on a nearby
bus stop on their app map to see real-
time arrival information, and also allows
trip comparisons by time as well as cost.
• The Transit app presents users with
real-time information for every nearby
public transportation service and
many other modes, and links modes to
present point-to-point mobility options,
prices, and timeframes. Transit+, which
launched in December 2018, feeds
rides from private mobility services onto
buses and trains and includes planning,
booking, and payments.443
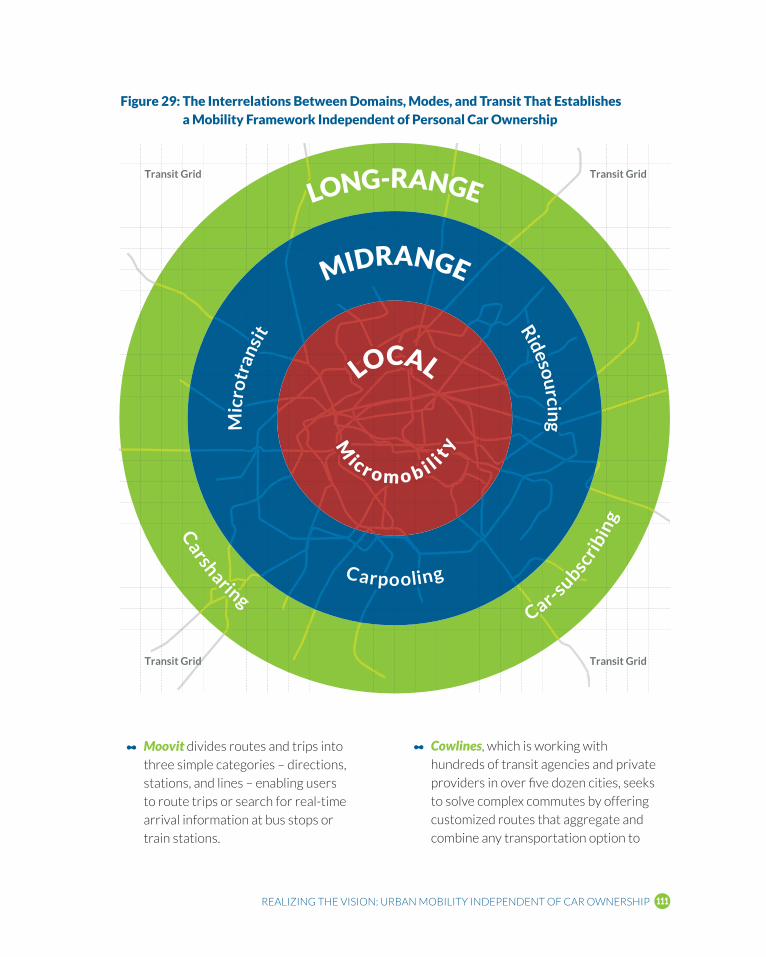
REALIZING THE VISION: URBAN MOBILITY INDEPENDENT OF CAR OWNERSHIP 111
• Cowlines, which is working with
hundreds of transit agencies and private
providers in over fi ve dozen cities, seeks
to solve complex commutes by offering
customized routes that aggregate and
combine any transportation option to
• Moovit divides routes and trips into
three simple categories – directions,
stations, and lines – enabling users
to route trips or search for real-time
arrival information at bus stops or
train stations.
Figure 29: The Interrelations Between Domains, Modes, and Transit That Establishes a Mobility Framework Independent of Personal Car Ownership
M
icr o m o b i l i t y
LOCAL
Mic
rotr
ansi
t Ridesourcing
Carpooling
MIDRANGE
Car-s
ubscribin
g
Carsharing
LONG-RANGE
rr
LLLOO
M
NNNNN
M
CC
G
D
O
RRRRRRRRRR
A
CCC
AA
bb
NN
LLL
g
EEGG
y
dd
CCCC
prrr bbh
r
i
AACCCCCCCO
GGGNNAAD
EGGGGGGAARRGGNOOOOLL
M
icr o m o b i l i t y
LOCAL
Mic
rotr
ansi
t Ridesourcing
Carpooling
MIDRANGE
Car-s
ubscribin
g
Carsharing
LONG-RANGE
Transit Grid
Transit Grid
Transit Grid
Transit Grid

EMERGING MOBILITY TECHNOLOGIES AND TRENDS112
few ways: acquiring Jump Bikes, partnering
with public transportation platform Masabi
to enable users to buy a public transportation
ticket from inside the Uber app, and partnering
with peer-to-peer carsharing firm Getaround to
launch Uber Rent. The company also invested
$335 million in scooter-sharing company Lime
and announced a partnership with the startup
focused on co-branding the scooters and making
them available through Uber’s app. Additionally,
the company plans to integrate public transit
so as to become a true mobility platform,
as part of a broader effort dubbed “Mode
Switch,”448 to provide real-time traffic estimates
to help inform users’ modal selection,449 and
announced plans to spend $10 million over
three years as part of a Fund for Sustainable
Mobility to support campaigns for safety and
improved transit.450 Such moves are consistent
with corporate statements and goals targeted
towards reducing ridesourcing’s share of Uber’s
business to less than 50 percent by 2028.451
Lyft is also working on an offering of integrated
transportation services. The company acquired
Motivate, the largest bike-sharing operator in
the U.S., and also announced that it would launch
a scooter-sharing service. In addition to these
moves, Lyft is working with city programs to
facilitate bike- and scooter riding, with initiatives
including protected bike lanes and providing
public transit information within its app.452 Lyft
also launched a “ditch your car challenge” in
Chicago in August 2018. Through this challenge,
Lyft provided 100 residents with $550 in credit
for Lyft trips, public transit, bikeshare, and
carshare in exchange for pledging to give up their
car for one month. This included $300 in Lyft
credits, $105 for bus and train service, $45 for a
Divvy bikeshare pass, and $100 in Zipcar credits.
Based on the positive results from this pilot, Lyft
expanded the challenge to 35 additional cities.453
move around the city, and claims to
deliver approximately 40 percent faster
routes for non-car trips compared
to other apps.444
• SoMo, built by HERE Mobility, is an app
that provides information on transit,
taxis, ridesourcing, bike-share and
more. It combines aggregated transit
and mobility information with a social
aspect to give users the ability to share
their rides and choose who to ride with,
connect with people based on common
interests, and ride together to events
organized by other users.445
Even public agencies are making inroads. Los
Angeles announced its Metro Transit Access
Pass (“TAP”) Smart Card Program would be
developed into an account-based system that
will become a one-stop shop for payments and
signups across all mobility services including
bikeshare, microtransit, electric vehicle
(EV) sharing and charging, ride-hailing and
parking.446 Columbus, Ohio selected MTECH
Solutions LLC to develop its multimodal trip-
planning and common payment system app that
seeks to allow the end user to pay for multiple
forms of transportation with one payment.447
Apps like Citymapper, Transit, Moovit,
Cowlines, and SoMo are more or less vendor
agnostic, seeking to integrate available options
from all providers. Others have emerged that
take a “walled garden” approach: a vendor-
specific aggregation of modes that offers
consistent branding and perhaps eventually
even active modal coordination, but also limits
the information and options available to a user.
Foremost among these providers are the
traditional ridesourcing providers Uber and
Lyft. Uber expanded its service offerings in a

REALIZING THE VISION: URBAN MOBILITY INDEPENDENT OF CAR OWNERSHIP 113
targeted assistance to enable shoppers’
visitation; medical assistance, in which health
providers subsidize rides to and from hospital
appointments; occupational support whereby
employers cover employees’ multimodal
trips; and others.
FUTURE ENABLERS AND MARKET DRIVERSWhile big data, freight and commerce, ITS,
smart cities, and other technologies and market
drivers are currently enabling the emergence
of mobility technologies and systems,
technologies and market drivers on the horizon
will play a role in the emergence of the 21st
century mobility paradigm.
Traditional OEMs are offering their own
vendor-specific, turnkey multimodal services.
Perhaps foremost among them are BMW and
Daimler, who merged their diverse portfolios of
mobility investments into a single multimodal
network. Daimler’s Moovel was already a
leader in carsharing in Europe, and recently
opened a marketplace for bundled mobility
passes that enables transit authorities to
integrate everything from ridesourcing to
micromobility to traditional public transit454
Through the merger, Moovel will now be
combined with other services, including the
following: ReachNow/DriveNow and Car2Go
(for carsharing); mytaxi, Clever Taxi, Chauffeur
Privé, Clever Taxi and Beat (for ridesourcing);
ParkNow and Parkmobile (for parking
locations); and even electric vehicle charging.
Other OEMs pursuing multimodality include
Ford, who acquired scooter-sharing and other
modality providers in recent years;455 General
Motors, principally through its Maven platform;
and Toyota, who, among other things, led the
series A investment in MobilityX, a Singapore-
based “mobility-as-a-service” startup owned
by the city-state’s largest transport operator
(SMRT Corporation) that allows transport
operators to run their own multimodal versions
of transportation network apps.456
As efforts to integrate and coordinate modes
and domains advances, more creative usage
models may emerge that combine a grab-
bag of modal trip quantities, combinations,
and even distances. For instance, plans might
include a dozen public transit rides, another
dozen bikeshare or e-scooter trips, and one
ridesourcing trip less than 10 miles. Such
mixing and matching can allow users to fine-
tune product packages to meet their specific
needs. It might also unlock other models, such
as sponsored usage whereby retailers provide
Future Enablers and Market Drivers
• Aerial Vehicles
• Automated Micromobility
• Blockchain
• “LandTrafficControl”
• Ultra-Fast EV Charging
• Vehicle-to-Grid
AERIALDRONESANDFLYINGCARS/TAXISAerial drones, or unmanned aerial vehicles
(UAVs), have received attention in recent
years as prospective package delivery devices.
Much of this attention has been driven by
Amazon, which announced in December
2013 its intentions to use drones to ferry
customers’ packages.

EMERGING MOBILITY TECHNOLOGIES AND TRENDS114
The advancement of aerial delivery drones is just
the first step in what’s perceived to eventually
be a meaningful mode for personal mobility. In
fact, some manufacturers and innovators have
examined the concept of pairing vehicles with
drones. Daimler produced a vision for a concept
delivery van with roof-mounted drones,
Local Motors produced a concept car with a
traffic-identifying drone mounted on its rear,
Cincinnati-based Workhorse Group is working
with the University of Cincinnati to launch
delivery drones from the roof of its trucks, and
Ford is investigating ways in which drones can
help AVs solve navigation problems.459
In May 2018, the Federal Aviation
Administration (FAA) selected 10 entities for its
Unmanned Aircraft Systems (UAS) Integration
Pilot Program (IPP).460 Many of those selected
are examining projects that can help reduce
traffic congestion on city streets and enable
governments and private companies to explore
how drones can be used to make everyday life
more efficient. Over two and a half years, the
selectees will collect drone data that will help
the USDOT and the FAA with several objectives:
• Craft new enabling rules that allow
more complex low-altitude operations;
• Identify ways to balance local and national
interests related to UAS integration;
• Improve communications with local,
state and tribal jurisdictions;
• Address security and privacy risks; and
• Accelerate the approval of operations
that currently require special
authorizations.461
Testing began in September 2018, with
companies like AirMap and other private sector
partners providing traffic management and
software among other services.462
While utilizing several technologies commonly
found on automated vehicle platforms to
geolocate and navigate from point to point, the
application of these technologies to airborne
vehicles overcomes core challenges associated
with commercializing highly automated vehicles
– namely assimilating with traffic, existing
roadways, and infrastructure. Additionally, by
focusing on the small package delivery market,
drone developers are able to provide a core
service that’s in immediate demand, while
potentially scaling up platforms and services
once the platform is fully proven.
Amazon is partnering with the United Kingdom
to explore the steps needed to make the
delivery of parcels by small drones a reality,
allowing Amazon to trial new methods of testing
its delivery systems. The work is meant to help
Amazon and the government understand how
drones can be used safely and reliably in the
logistics industry, identify what operating
rules and safety regulations will be needed to
help move the drone industry forward,457 and
altogether help advance Amazon’s Prime Air
service, which is focused on using drones to
deliver packages up to five pounds to customers
in 30 minutes or less.
Alphabet’s “Wing” spinoff plans to launch a
drone delivery service in Helsinki, Finland in
spring 2019 – its first operation in Europe. It
will just be a small-scale trial, with the drones
only able to carry packages weighing up to 3.3
pounds (1.5 kilograms) on a round trip of up
to 20 miles. Wing is pitching the drones as an
environmentally friendly choice, claiming they
have a carbon footprint less than 1/20 that of
traditional deliveries. Wing is asking Finnish
would-be users what they would like to have
delivered, with options including medicine,
groceries, and lunch.458

REALIZING THE VISION: URBAN MOBILITY INDEPENDENT OF CAR OWNERSHIP 115
new market opportunities to solve for the
transportation challenges of the future.468
Additional aerial taxi efforts include:469
• UberAir: The ridesourcing company
envisions rooftop aerodromes
servicing a fleet of fixed-wing air taxis,
carrying four passengers plus a pilot.
The company plans to have ongoing
demonstrator flights in the air by 2020,
and commercial operations by 2023 in
at least three cities: Dallas, Los Angeles
and one more to be named. The initial
business plan states that the company
would eventually use fully automated
technologies to remove pilots from
the aircraft.470
• EHang: The “EHang 184” is an electric
drone capable of carrying a single
passenger who weighs less than
220 pounds over 60 miles. Travel
is controlled mostly by an onboard
tablet inside the pod-like cockpit,
where a passenger selects the flight’s
destination.471
• Rolls-Royce Holdings PLC: The company,
which is separate from the motor vehicle
division, unveiled an electric vertical-
takeoff-and-landing concept in July
2018 that can carry five passengers 500
miles at speeds of up to 250 mph. The
company is targeting the early 2020s to
have commercial vehicles in the air.
• Aston Martin: Working with Rolls-Royce
Holdings PLC, Aston Martin unveiled
its concept “sports car of the air,”
dubbed the Volante, in July 2018 that
it states will take flight commercially no
earlier than 2025.
• General Motors: The company has had
conversations with air taxi companies
Once proven and scaled, the advancement of
commercial services via drones has potential
applications beyond the established format.
Several developers already have plans to
commercialize passenger drones and taxis – a
market that Morgan Stanley says could rise to
$1.5 trillion by 2040.463 Lilum has produced an
electric vertical takeoff and landing jet for use
as a pay-per-ride flying taxi that is affordable
for anyone.464 The new five-seater is claimed
to use only 10 percent of the energy of a
quadcopter-style aircraft and has a range of
over 300 km (186 mi) at a speed of 300 km/h
(186 mph), allowing it to travel from JFK Airport
to Manhattan in five minutes instead of the 55
minutes by road. It is also claimed to cost the
same as a regular taxi because its small takeoff
and landing footprint means less and cheaper
infrastructure.465 The company will conduct its
first manned test flight in 2019 and is targeting
early 2020s for commercial operations.
Boeing is currently building flying taxi
prototype vehicles that it expects to have
airborne sometime in 2019 and a commercial
reality in five years.466 In 2017, the company
acquired Aurora Flight Sciences, which has
worked extensively for the U.S. government on
electric and automated aviation, and is working
with Uber to develop flying taxis in a move that
Boeing sees as accelerating its efforts around
automated aerospace vehicles.467 Boeing is also
working with a start-up called SparkCognition
to develop unmanned aircraft system traffic
management (UTM) solutions for the safe
integration of automated air vehicles. To help
advance UTM and next-generation travel,
Boeing created Boeing NeXt to leverage the
company’s research and development activities
and investments in areas such as automated
flight and advanced propulsion, as well as
focus on modeling smart cities and exploring

EMERGING MOBILITY TECHNOLOGIES AND TRENDS116
Providers are currently solving this challenge by
leveraging “gig economy” workers, essentially
paying part-time contractors a bounty to
collect, recharge, and deposit a vehicle to a
designated location before a certain time.
The solution has enabled providers to enter,
become operational, and scale-up quickly
in new markets. Yet questions surround the
model’s sustainability. Paying contractors to
collect and charge vehicles already represents
approximately 47 percent of the average $3.65
of gross revenue that Bird generates per ride.475
As a market grows and more vehicles deploy to
a wider array of locations, this percentage might
become larger, and perhaps drive up overall
user costs, as higher wages may be required to
attract sufficient quantities of gig workers to
manage the fleet.
Whereas this publication has addressed the
role that automation can – and likely will –
play in ferrying passengers and goods, this
micromobility challenge highlights another
potential value-add for the technology. As
automated technologies’ costs continue
to decrease, they may make their way to
micromobility, where fleets of the future might
be programed to congregate at centralized
collection or recharging areas at the end of each
day or after their batteries are depleted by a
certain percentage, repositioned at opportune
locations before the beginning of the next
day, and always parked neatly in designated
locations so as to avoid public clutter. The public
might not even notice such a use of automated
technologies, should repositioning continue to
take place at night.
One company, Singapore-based Scootbee, is
already beta testing such an approach. The
company aims to produce the world's first
on-demand, self-driving scooter that enables
about using the carmaker's autonomous
and electric vehicle technology to create
flying cars but acknowledged that “it’s
some years away” before widespread
production and sales of such a vehicle
get off the ground.472
• Audi: In conjunction with Airbus and
Italdesign, Audi presented an operational
prototype of Pop.Up Next, its flying taxi
concept that’s a hybrid between a drone
and an automated car. The system has a
ground module and a drone module. A
separate passenger compartment can
be transported by, and passed between,
both transport modules.473
• Bell: The 80-year old helicopter
manufacturer is pursuing the flying
taxi market by undertaking a three-
phase study to determine what types
of control systems will allow “minimally
trained” pilots sufficient control and
oversight without necessarily requiring
them to have the same skills possessed
by crews flying modern helicopters
and airliners.474
Altogether, the work advancing aerial drones
and the application of the platform and
technologies to personal mobility market has
potential to significantly disrupt personal
mobility, perhaps beginning as early as 2022,
which is when close to a dozen current efforts
have announced commercialization.
AUTOMATEDMICROMOBILITYA core challenge faced by micromobility
providers as they scale up is the (nightly)
collection and repositioning of their fleet.
Specifically, because these vehicles are
electric and often dockless, they need to be
recharged and strategically repositioned to
maximize their utility.

REALIZING THE VISION: URBAN MOBILITY INDEPENDENT OF CAR OWNERSHIP 117
chains of blocks. This transaction record,
which includes a unique identifier that
cannot be covertly duplicated and used, is
meant to foster transparency, security, and
trust. It is also meant to reduce transaction
costs, given the decentralized ledger and
avoidance of any central authority who might
charge a commission.
Beyond cryptocurrency, speculative uses of
blockchain include insurance contracts, loyalty
points, and distributed electricity generation.
Because of its orientation around transactions,
many have also envisioned blockchain playing a
role in enabling shared mobility. For instance,
current ridesharing and carsharing platforms
such as Uber and Turo, respectively, create
markets that facilitate the provision of services
between two individuals. The value is in the
creation of the market and its user base, as well
as the establishment of a way to quickly and
securely provide and receive payments.
But that value comes at a cost to those engaging
in the transaction – namely a percentage
(typically 25 percent477) of the overall payment
to the market-making platform and/or
transaction fees paid to payment facilitators,
such as credit card companies (typically 0.5
percent to 5.0 percent of the transaction
amount, plus $0.20 to $0.30 per transaction478).
With blockchain, the potential is to enable the
same secure large marketplace, but to do so
using distributed computing that avoids user
fees. Such a blockchain-based platform could
help owners better monetize their vehicles,
their driving data, and any number of other
services or value streams.
For example, in the case of carsharing, a smart
contract might verify that the vehicle’s claimed
owner actually owns the car, indicate if and
users to summon one of its three-wheeled
scooters with an app, ride to a destination,
then leave the scooter to park itself.476 As
micromobility continues to scale, hits up again
economic and logistic challenges, and as the
price of AV components continues to decline,
it can be expected that more providers follow
Scootbee’s lead.
BLOCKCHAINBlockchain is a digital asset tracking technology
that was first envisioned by Bitcoin inventor
Satoshi Nakamoto in 2008 and has since found
prospective uses in numerous markets and
applications that require precise, secure, and
low-cost tracking and authentication.
Blockchains are decentralized ledgers with
no singular authority that are spread across
thousands of computers. When blockchain-
based transactions take place, they are
recorded permanently and firmly in a block,
which refers back to a previous block, creating
Beyond cryptocurrency,
speculative uses of
blockchain include insurance
contracts, loyalty points,
and distributed electricity
generation. Because of
its orientation around
transactions, many have also
envisioned blockchain playing a
role in enabling shared mobility.

EMERGING MOBILITY TECHNOLOGIES AND TRENDS118
as its communications’ secure transmission
and interpretation are additional prospective
blockchain use cases. General Motors has even
filed a patent on how blockchain can be used
to distribute event information relevant to the
decision making of automated vehicles.481
To this last point, an intriguing example
illustrates one prospective application whereby
cars use tokens such as Streamr’s DATAcoin
to pay for data they require from other cars.
This includes weather forecasts, gas prices
nearby, congestion data, and more. Vehicles
could then earn tokens simply by sharing their
data or choosing to sell it to advertisers or
manufacturers. With this strategy, blockchain
can create a V2V closed ecosystem that
incentivizes and rewards participation
simultaneously.482
In 2017, Toyota Research Institute formed the
Mobility Open Blockchain Initiative (“MOBI”)483
with several startups, academic institutions,
vehicle manufacturers, and consumer-facing
mobility providers to explore applications of
blockchain technology in the mobility space.
MOBI is a nonprofit organization working with
forward-thinking companies, governments, and
NGOs to make mobility services more efficient,
affordable, greener, safer, and less congested.
The organization promotes standards and
accelerates adoption of blockchain, distributed
ledger, and related technologies.484
It remains to be seen what precise role(s)
blockchain will have in serving and/or driving
the adoption of emerging shared, electrified,
automated mobility modes. But with such
a broad roster of companies supporting its
advancement for mobility applications, and
the technology’s overall potential to remove
redundant intermediaries and improve
when an owner would share it, and establish
a threshold for sharing based on reputation
scores. The technology would be structured
such that someone meeting these criteria
could “check out” the car and provide payment
(perhaps using a dedicated currency) directly
to the owner (while avoiding transaction
fees), unlock its doors, start the engine, and
drive away. Infineon Technologies AG and
XAIN are working together on bringing
blockchain technology into the car, with a first
demonstrator showing how access rights, such
as those for carsharing, can be decentrally
granted with a smartphone app.479
Blockchain technology has potential to serve
the broader mobility ecosystem beyond
carsharing. Pittsburgh, Penn.-based iomob
aims to be a user-friendly, open and inclusive
form of mobility-as-a-service aimed at
addressing “inefficiencies” in a multi-modal
but “fragmented mobility landscape.” It allows
end-users to discover, combine, book, and pay
for the mobility services that best cover their
needs at a given point of time. Iomob will be
implemented as an open-source, decentralized
platform that leverages blockchain to allow all
mobility providers to easily join the platform.
By connecting all the mobility operators in an
area, iomob aims to help users to find better
combinations of services for any given trip.480
Other prospective uses of blockchain for
mobile applications include enabling insurance
premiums to better reflect the risk of a particular
driver by incorporating factors for actual
usage and reputation, rather than applying a
crude derivative of a marketwide average. The
aggregation and sharing of vehicular data such
as that that informs and validates the integrity of
automated vehicle programming, and enabling
dynamic V2X spectrum sharing of V2X as well

REALIZING THE VISION: URBAN MOBILITY INDEPENDENT OF CAR OWNERSHIP 119
at Hennepin Healthcare internal medicine
clinic in Minneapolis focused on patients who
historically have missed appointments and
reduced their absences by 27 percent. The
program, which used Hitch Health’s automated
SMS technology to offer Lyft rides to patients in
need, also increased revenue at the clinic by an
estimated $270,000 and yielded an estimated
return on investment of 297 percent.488
A separate pilot led to similarly promising
results. Lyft and Cigna-Health Spring, the
parent company’s Medicare Advantage arm,
partnered to provide non-emergency rides to
members in in Alabama, Georgia, Maryland,
North Carolina, Pennsylvania, Tennessee, Texas
and the District of Columbia. Between May and
November of 2017, Lyft provided more than
transactional efficiencies, there is little doubt
that the technology will be present. The
question simply comes down to figuring out and
enabling winning, mass-market use cases.
HEALTHCARETransportation is the third most frequently
identified reason for missed medical
appointments among older adults. Nearly
3.6 million individuals did not access medical
care in 2017 because they did not have a ride,
and four percent of children missed a medical
appointment because of transportation
barriers.485 According to one estimate, missed
appointments as a whole cost the industry
$150 billion annually,486 and the transportation
access gap has created a market worth
over $3 billion.487
This challenge and resulting market opportunity
has prompted healthcare providers and
transportation service companies alike to
develop technologies and mobility solutions
that can help overcome these barriers. So-called
“dial-a-ride” collection and drop off shuttles
were historic offerings by healthcare providers,
but the solution’s typical requirement that
patients schedule rides via phone at least
24 hours in advance (rather than via more
tech-friendly and real-time platforms such as
smartphones) means that it has done little to
overcome the access gap.
Recognizing this shortcoming, industry
stakeholders such as insurers, providers, and
electronic health record (EHR) companies,
among others, are embracing new technologies
and engaging directly with ridesourcing
companies to structure solutions to provide
non-emergency medical transportation
(NEMT) to their patients. A one-year pilot
between Lyft and Hitch Health conducted
$150B >$3.0B
TRANSPORTATIONANDHEALTHCARE
due to transportation in 2017
did not access medical care~3.6M
of children missed a medical appointment due to transportation
annually, missed appts. cost industry
market worth due to trans. access gap
4%
highest reason for missed medical appt. among older adults - transportation.
3rd
EMERGING MOBILITY TECHNOLOGIES AND TRENDS120
“LANDTRAFFICCONTROL”With the advent of commercial air travel and
the subsequent volume of air travel, air traffic
control systems became a staple in coordinating
the mass movement of travelers arriving
and departing on increasingly sophisticated
machinery. So too could be the case as seamless
mobility ecosystems – comprised of large,
mixed modes, and leveraging technologies
to enable increasingly higher levels of
automation – emerge.
At what stage such systems begin to emerge
remains to be seen. To date, most work has
focused on automating individual vehicles
and proving their functionality, safety, and
other abilities. Little attention and even fewer
demonstrations have been devoted to such
broader level cooperation and management.
Yet as previously discussed, if AV developers
and fleet operators flood cities with vehicles,
poorly managed fleets could increase overall
energy consumption and traffic congestion.
Efficiency requires vehicles, operators, and
users to communicate and coordinate to match
supply and demand.
The University of Southern California laid out
the foundation for such a coordinated approach
in 1998, when it described an “Intermodal
Transportation Operation System.”493 A number
of cities have already put into place components
of such a system:494
• Columbus, Ohio: The winner of the U.S.
DOT’s Smart City Challenge is creating
a Smart Columbus Operating System.
The system will share near-real-time
data on conditions throughout the
city, focusing initially on mobility but
eventually encompassing a full range of
smart city domains.495
14,500 non-emergency rides to Cigna-Health
Spring members. Furthermore, 92 percent of
members who used the service made it their
preferred means of transportation.
In May 2017, Blue Cross Blue Shield (BCBS)
began partnering with Lyft to enable patients in
high-need areas to access Lyft’s transportation
services. The technology analyzed population
data for 106 million BCBS beneficiaries and
determined which patients needed more
transportation support.489 Nearly a year later,
the partnership expanded its array of services
to provide a way for enrollees who don't have
adequate transportation to travel to Walgreens
Boots Alliance and CVS Health pharmacies.490
These and other pilots represent what many
believe could be the tip of the iceberg when it
comes to healthcare’s potential to drive the
adoption of emerging mobility technologies.
While NEMT is already a Medicaid covered
benefit,491 there’s a possibility that the Centers
for Medicare & Medicaid Services (CMS)
could allow managed Medicare plans to
offer a transportation benefit. In April 2018,
CMS began “reinterpreting the standards
for health-related supplemental benefits in
the Medicare Advantage program to include
additional services that increase health and
improve quality of life,” a move that could lead
to a broadening of the definition of “primary
health related” in the Medicare Advantage
program and, therefore, potentially enabling
the provision of transportation services.492
Should this happen, more healthcare dollars
could be used to support an array of mobility
modes and technologies that include not just
ridesourcing, but also other modes such as
microtransit and even automated technologies,
as they mature and are applied to lower the
cost of ridesourcing services.

REALIZING THE VISION: URBAN MOBILITY INDEPENDENT OF CAR OWNERSHIP 121
evenly distribute vehicles, pool travelers, and
manage key performance indicators such as wait
and travel times,501 while alleviating congestion,
balancing electrical grid loads, and improving
safety. Other elements required to see such a
system arise is the standardization of vehicular
communication and control protocols for
onboard hardware and software, as well as the
development of broad-based, system algorithms
that are capable of such efficient coordination. To
this latter point, work is progressing, as evidenced
by the U.S. DOE’s Lawrence Berkeley National
Laboratory’s application of deep reinforcement
learning to train automated vehicles to drive in
ways to simultaneously improve traffic flow and
reduce energy consumption.502 This is but one
of several efforts underway that may gain more
prominence as larger numbers of connected,
automated vehicles deploy.
ULTRA-FASTELECTRICVEHICLECHARGINGModern “Level 3” EV chargers’ specifications
are typically around 50 kW by 480 V, 125 A
direct current (DC). While such specifications
enable vehicle recharging rates that are
magnitudes faster than conventional “Level
2” 240 V charging (delivering about 60 to 80
miles of range in 20 to 30 minutes), it’s still by
no means comparable to the range enabled per
time devoted by conventional gas stations.
In the United States, light passenger vehicle
pump flow rate can be as high as 10 gallons
per minute,503 which means that the average
U.S. light-duty vehicle in 2016 can obtain 220
miles of range or more in a single minute.504 As
previously discussed, the usage profile of EVs can
differ significantly from conventional vehicles,
thus making infrastructure comparisons –
specifically those around quantities – less
appropriate. Yet faster recharging times can
• Singapore’s Intelligent Transport
System incorporates electronic road
pricing, congestion charges, and traffic
monitoring via highway sensors and
taxi GPS applications, all funneled to a
control center that allows tracking and
traveler notifications.496
• Copenhagen, Denmark launched the
world’s first city data marketplace,
a real-world example of the mobility
data exchanges that could form
a key component of a broader
mobility platform.497
• Barcelona, Spain and surrounding cities
implemented an open-source platform
called Sentilo that brings together data
from multiple sources and underpins
the deployment of smart parking and
smart transit services, as well as energy
consumption monitoring and smart
waste collection.498 The City Council has
also implemented City OS to connect
various city projects and services on a
single platform.499
• Dubai, United Arab Emirates (UAE)
launched a “Smart Dubai” initiative
in early 2014, led by the city’s Road
and Transport Authority, which has
initiated several pilot projects in traffic
management, parking, electronic toll
systems, and congestion management.
The city also announced the creation of
a “Smart Dubai Platform,” in partnership
with Dubai-based telecom company
du, which it aims to make the “digital
backbone” of the city, enabling open
data sharing.500
To be clear, such efforts should be seen as a first
yet essential step in the establishment of a land
traffic control system; the ultimate vision being
one in which demand is captured and used to

EMERGING MOBILITY TECHNOLOGIES AND TRENDS122
Mercedes, Ford, and Volkswagen’s Audi and
Porsche – created a joint venture to build out a
network of about 400 ultra-fast, 350 kW CCS-
based charging stations throughout Europe.507
The announcement was in addition to a previous
announcement by Porsche that it is working on
an 800-volt charging system that it said should
be able to charge a large sedan’s battery pack to
80 percent in about 15 minutes. A pilot project
of four such chargers came online in July 2018,
and the Porsche Taycan is projected to be the
first series-production vehicle to feature the
800-volt technology when it becomes available
in 2019.508 EVgo, a leading operator of public
EV charging networks in the U.S., opened its
first of what it envisions will be many 350
kW public charging stations in 2017 in Baker,
Calif.509 Finally, the global DC fast charging
network leader CHAdeMO, which has more
than 17,700 units worldwide, released its
protocol 2.0 in May 2018 to enable 400 kW,
1,000 V high-power charging, a doubling of 200
kW at 500 V enabled by its protocol 1.2.510
As more ultra-fast recharging stations such
as these come online, and as more electric
vehicles are equipped to handle such power,
do much to accelerate EVs’ adoption rates,
at a minimum by helping to overcome the
impression that electrification is somehow
inferior to internal combustion engines, but
more importantly by eliminating range anxiety
and enabling longer distance travels.
Several efforts are already underway to develop
and commercialize ultra-high speed chargers.
Tesla’s “Superchargers” are currently the gold
standard in high-speed charging, with over
11,000 Superchargers worldwide505 offering
145 kW charger capacity (capped at 120 kW
by the vehicles) that is more than double what’s
typically offered by CHAdeMO and Combined
Charging System (CCS) Level 3 systems. Still,
the company is looking to increase this capacity,
citing its planned deployment of Supercharger
V3 technologies that have the capacity to
deliver 200 to 250 kW. Tesla aims to eventually
offer 360 to 480 kW Supercharger capacities,
which it framed as the limit of the technology
for passenger electric cars, and reduce vehicle
charging times down to 5-10 minutes.506
Others are advancing ultra-fast EV chargers
as well. Five automakers – BMW, Daimler’s
Level 2 Level 3 Ultra-high Speed
~50kW~7.6kW 350kW
VEHICLERECHARGINGRATES
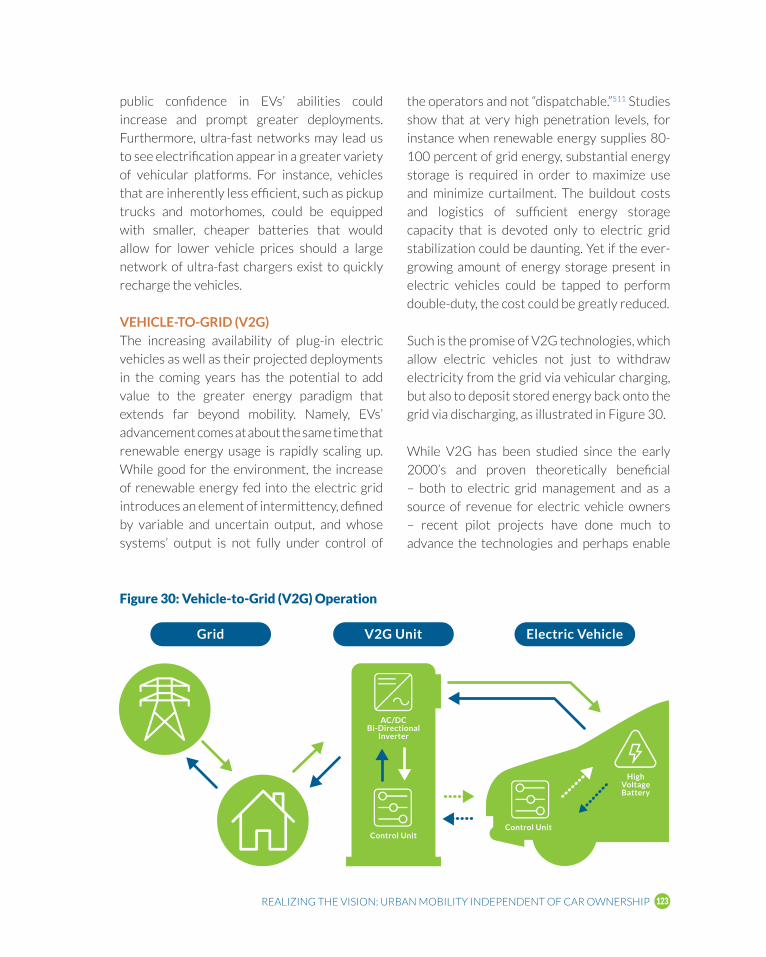
REALIZING THE VISION: URBAN MOBILITY INDEPENDENT OF CAR OWNERSHIP 123
the operators and not “dispatchable.”511 Studies
show that at very high penetration levels, for
instance when renewable energy supplies 80-
100 percent of grid energy, substantial energy
storage is required in order to maximize use
and minimize curtailment. The buildout costs
and logistics of sufficient energy storage
capacity that is devoted only to electric grid
stabilization could be daunting. Yet if the ever-
growing amount of energy storage present in
electric vehicles could be tapped to perform
double-duty, the cost could be greatly reduced.
Such is the promise of V2G technologies, which
allow electric vehicles not just to withdraw
electricity from the grid via vehicular charging,
but also to deposit stored energy back onto the
grid via discharging, as illustrated in Figure 30.
While V2G has been studied since the early
2000’s and proven theoretically beneficial
– both to electric grid management and as a
source of revenue for electric vehicle owners
– recent pilot projects have done much to
advance the technologies and perhaps enable
public confidence in EVs’ abilities could
increase and prompt greater deployments.
Furthermore, ultra-fast networks may lead us
to see electrification appear in a greater variety
of vehicular platforms. For instance, vehicles
that are inherently less efficient, such as pickup
trucks and motorhomes, could be equipped
with smaller, cheaper batteries that would
allow for lower vehicle prices should a large
network of ultra-fast chargers exist to quickly
recharge the vehicles.
VEHICLE-TO-GRID(V2G)The increasing availability of plug-in electric
vehicles as well as their projected deployments
in the coming years has the potential to add
value to the greater energy paradigm that
extends far beyond mobility. Namely, EVs’
advancement comes at about the same time that
renewable energy usage is rapidly scaling up.
While good for the environment, the increase
of renewable energy fed into the electric grid
introduces an element of intermittency, defined
by variable and uncertain output, and whose
systems’ output is not fully under control of
Electric VehicleV2G Unit
AC/DCBi-Directional
Inverter
Control Unit
HighVoltageBattery
Control Unit
Grid
Figure 30: Vehicle-to-Grid (V2G) Operation

EMERGING MOBILITY TECHNOLOGIES AND TRENDS124
V2G services could cover some costs related
to charging an electric car. In fact, Nissan
and OVO Energy, a United Kingdom energy
supplier, began offering V2G service to Nissan
Leaf buyers in 2018 via the launch of a home
charger for V2G.515
Overall, V2G could enable consumers to save
as much as $272 per year on their energy bill.
It could also bring significant cost-savings and
additional revenues of $2 billion to global energy
suppliers in 2025, while performing the critical
service of load shifting demand from peak to off-
peak, according to ABI Research. The company
believes that up to 21 TWh of energy could
be distributed to the grid via V2G in 2025.516
This could allow energy markets to better
incorporate intermittent renewable energy
sources by creating off-peak storage, allowing
these renewable energy sources to run more
often during off-peak hours. V2G could also
provide the grid-critical additional resources
for primary and secondary frequency control as
well as help grid operators better manage line
constraints and forecast demand.517
Yet for V2G to be fully realized requires
overcoming key barriers. Foremost amongst
these barriers is resistance from OEMs, who are
concerned that using electric vehicle batteries
to repeatedly store and discharge energy
from and to the grid could degrade batteries,
negatively impacting vehicle performance and
operating range while potentially increasing
warranty costs. Such concerns could be
overcome via financial mechanisms: battery
leases rather than ownership, modifications
to vehicular warranties that reflect V2G
revenues flowing to vehicle owners, and/
or demonstrating the value proposition to
consumers so that they’re willing to pay more
for V2G equipped vehicles.
its commercialization. For instance, Southern
California Edison (SCE) and the California
Independent System Operator (CAISO)
launched a two-year study in late 2015 of 34
V2G-equipped plug-in electric vehicles.512
The project, which was funded by the U.S.
Department of Defense, took place at the Los
Angeles Air Force Base and demonstrated
that battery storage of PEV fleets can provide
energy and ancillary services to the CAISO
markets to generate additional revenues,
thereby reducing the cost difference between
PEVs and conventional ICE.513 SCE’s final report
on the project concluded that it provided many
tangible benefits. It:514
• Maximized the use of underutilized
vehicle assets by using the batteries as
an energy source;
• Reduced installation energy and fleet
vehicle costs were reduced;
• Reduced GHG emissions associated
with liquid-fuel vehicles;
• Lowered environmental risk
from petroleum processing,
transportation, and spillage;
• Advanced the state of PEVs and
charging stations;
• Advanced the state of V2G engineering
and software applications;
• Stimulated cooperativeness with utility
operators and regulators to embrace an
• alternative energy solution;
• Increased grid energy
storage capacity; and
• Promoted energy security across
the nation while decreasing
dependence on foreign oil
Elsewhere, Nissan, Nuvve and the Italian utility
Enel SpA in Denmark also conducted a yearlong
V2G study. The program confirmed that

REALIZING THE VISION: URBAN MOBILITY INDEPENDENT OF CAR OWNERSHIP 125
Assuming that OEM support can be garnered
and that other commercialization barriers can
be over come, V2G could serve as a significant
driver for EV adoption and vice versa.
This becomes increasingly true as shared,
automated fleets replace private ownership
and operation, given the relative ease of V2G
market entry within centrally-located fleet
applications and their associated recharging
depots. Such depots could even be co-located
with renewable power generation facilities and/
or grid and microgrid resources, thus further
easing its deployment and utilization.

EMERGING MOBILITY TECHNOLOGIES AND TRENDS126
telegraphs and early household telephones. It
appears that mobility’s evolution is following
the same pathway.
KEY INSIGHT #1: TRANSPORTATION IS EVOLVING FROM PRODUCTS AND VEHICLES TO SERVICES AND MOBILITY.While defined by the personal automobile
– a modal monopoly – for much of the past
century, the arrival of electrified, connected
and automated, shared vehicles of different
shapes, sizes, ranges, functions, and prices is
rapidly evolving the paradigm. Modal ubiquity
in various city centers as well as the emergence
of subscription-based usage models by Uber,
Lyft, and others furthers the analogy with the
telecommunications industry.
Yet it’s important to note that for this analogy
to be appropriate, the same level of openness
instituted by deregulatory measures within
the telecommunications industry must be
established for mobility. Until the 1980s in the
United States, the term “telephone company”
was synonymous with American Telephone
& Telegraph (AT&T). The emergence of new
technologies prompted the progressive
opening of the industry, most forcefully in 1984
and 1996 as the federal government relaxed
regulatory barriers that ended the industry’s
monopolies.518 The automobile industry’s
monopoly on mobility wasn’t established
by the same policies, but it did benefit from
policies and subsidies – such as the funding of
the Interstate Highway System, as previously
discussed – that helped it monopolize mobility.
K E Y I N S I G H T S A N D CONCLUSIONS
I n thinking about the transition underway
in transportation and mobility, it may be
more apt to think of it not so much as an
evolution of the automotive industry, but
rather the broadening of the transportation
paradigm via the increasingly rapid wholesale
adoption of usage models developed by
other industries.
Of particular relevance is the
telecommunications industry. The industry
was once slow to evolve and wholly
centralized around single modes – first
the telegraph then subsequently the
telephone, which shortened communication
from days, to hours, to seconds – and was
characterized by uniform usage and pricing
models. Now, the industry is defined by
frequently updated iterations, is diversified,
and telecommunication is ubiquitous. Users
can communicate with others via in-home
fixed telephone lines, mobile phones, Voice
over Internet Protocol (VoIP), satellite
phones, short message service (SMS), and
via other means. Furthermore, they can
select a wide variety of usage and pricing
models that better reflect how and when
they need to communicate by purchasing
minutes and megabytes for an individual
phone as needed, or entire communication
packages comprised of bundled minutes and
data that can even be accessible to a broader
family. They are also afforded a plethora of
different communications devices to select
from for any given usage mode depending
on their needs, a departure from standard

KEY INSIGHTS AND CONCLUSIONS 127
KEY INSIGHT #3: OPEN DATA POLICIES CAN EXPEDITE THE ARRIVAL OF SOCIALLY-DESIRABLE MOBILITY SERVICES, MODES, AND TECHNOLOGIES.Cities and agencies have established an open
API for transit dubbed the General Transit
Feed Specification (GTFS)519 that provides real-
time locations for buses and trains. JUMP and
Motivate both offer an open API for bikesharing
called the General Bikeshare Feed Specification
(GBFS)520 in all their markets, enabling users
to see all the bikes around town regardless of
brand. With open APIs like GTFS and GBFS,
innovators can enter markets and promote car-
free transport in creative ways.
Furthermore, the establishment and adoption
of open API platforms for current modes such
as transit and micromobility can help influence
the direction of development for more
nascent modes, such as automated vehicles.
Organizations such as the DAV Foundation521
are working to establish open source AV
networks that allow vehicles to interconnect
with other vehicles and operators, creating
an entire ecosystem that enables vehicles
to discover, communicate, and transact with
each other to transport anyone – or anything –
anywhere.522 Such networks have the potential
to help avert some of the previously discussed
prospective consequences of modal usage –
such as increased energy consumption and
congestion – while lowering providers’ barriers
to entry and enabling broader systemic
coordination as the network synthesizes with
GTFS, GBFS, and other open platforms.
The work of these and other groups to establish
and build support for open, inclusive networks
KEY INSIGHT #2: SOURCES AND TARGETS OF FEDERAL, STATE, AND LOCAL TRANSPORTATION FUNDING SHOULD BE DIVERSIFIEDRemedying this situation required an
immediate diversification of federal and
other funding to include more micromobility,
shared mobility, and other emerging
technologies and systems. Furthermore,
funding for transportation need not only
come from traditional sources such as the
Department of Transportation, the Federal
Transit Administration, and general taxes,
but also from a greater array of sources,
including those industries such as healthcare
and commerce who are poised to benefit as
mobility modes emerge and blend deeper
into the social fabric.
The industry itself should also adopt behaviors
that do the most to solve core challenges
and establish viable car ownership-free
mobility options. Foremost among these is
averting walled gardens by instituting open
application programming interface (API)
policies so that essential needs – like broad-
based integration and coordination – can
quickly emerge. At a minimum, averting
walled gardens can provide for better user
experiences, for having to toggle between
multiple apps to find and book e-scooters
and ridesourcing services could compel
commuters to instead drive personal
vehicles. More fundamentally, open APIs can
ensure that more players offering the most
desirable mobility options at the best prices
emerge and are oriented around solving
societal goals rather than simply maximizing
any given provider’s revenue.

EMERGING MOBILITY TECHNOLOGIES AND TRENDS128
is paramount as we enter the new “golden age”
of transportation, whereby any single modal
monopoly is averted in favor of mobility-as-
a-system (MaaSys). A systemic approach,
built upon the backbone of modern transit
technologies, that leverages a “mobility menu”
of domains, modes, and usage models provided
by an increasing variety of suppliers operating
electrified, connected, automated, and shared
vehicles – enabled by and seamlessly integrated within open, inclusive networks – is what presents
the very real opportunity to achieve full urban
mobility for the 21st century and beyond.

ENDNOTES 129
1 Schrank, D.; Eisele, B.; Lomax, T. Bak, J. 2015 Urban Mobility Scorecard. (August 2015). Texas A&M
Transportation Institute; INRIX. Retrieved September-December 2018 from https://mobility.tamu.edu/ums/.
2 Arity. (2018, November 8) Be patient, a change is gonna come. Arity.com. Retrieved September-
December 2018 from https://www.arity.com/move/patient-change-gonna-come/.
3 Oldfield, P. (2017, July 11) Searching for Parking Costs Americans $73 Billion a Year. INRIX. Retrieved
September-December 2018 from http://inrix.com/press-releases/parking-pain-us/.
4 U.S. Department of Transportation, National Highway Traffic Safety Administration. Traffic Safety Facts
Research Note. Published October 2018. Retrieved September-December 2018 from https://crashstats.
nhtsa.dot.gov/Api/Public/ViewPublication/812603.
5 Bellis, M. (2018, September 30) History of Roads in America and First Federal Highway: From the
Bicycle to the Interstate Highway System. ThoughtCo. Retrieved September-December 2018 from
https://www.thoughtco.com/history-of-american-roads-4077442.
6 Ibid.
7 Ibid.
8 U.S. Department of Commerce, Bureau of Public Roads. (1955) General location of national system of
interstate highways, including all additional routes at urban areas designated in September 1955. Retrieved
September-December 2018 from https://archive.org/details/generallocationo00unitrich.
9 U.S. Department of Transportation Federal Highway Administration. Office of Highway Policy
Information: Highway Statistics 2013. Published October 21, 2014. Retrieved September-December
2018 from https://www.fhwa.dot.gov/policyinformation/statistics/2013/hm20.cfm.
10 Ibid.
11 Rothstein, R. (2017) The Color of Law: A Forgotten History of how our Government Segregated America.
New York, NY: Liveright Publishing Corporation.
12 Stromberg, J. (2016, May 11) Highways gutted American cities. So why did they build them? Vox.
Retrieved September-December 2018 from https://www.vox.com/2015/5/14/8605917/highways-
interstate-cities-history.
13 Stromberg, J. (2015, May 7) The real story behind the demise of America’s once-mighty streetcars. Vox. Retrieved
September-December 2018 from https://www.vox.com/2015/5/7/8562007/streetcar-history-demise.
14 Smithsonian, The National Museum of American History. A Streetcar City. Retrieved September-
December 2018 from http://americanhistory.si.edu/america-on-the-move/streetcar-city.
15 Meares, H. (2017, September 19) Old photos show the evolution of transportation in LA. Curbed Los
Angeles. Retrieved September-December 2018 from https://la.curbed.com/2017/9/19/16268026/
transportation-old-photos-history.
16 National Highway Traffic Safety Administration (2018, October 3). U.S. DOT Announces 2017 Roadway
Fatalities Down. Retrieved September-December 2018 from https://www.nhtsa.gov/press-releases/us-
dot-announces-2017-roadway-fatalities-down.
17 Texas A&M Transportation Institute, Urban Mobility Information. (2015, August 26) Traffic Gridlock Sets
New Records for Traveler Misery. Retrieved September-December 2018 from https://mobility.tamu.
edu/ums/media-information/press-release/.
E N D N OT E S

EMERGING MOBILITY TECHNOLOGIES AND TRENDS130
18 Calamaras, D. U.S. Government Spending on Highway Infrastructure. BidNet. Retrieved September-
December 2018 from https://www.bidnet.com/resources/business-insights/us-government-spending-
highway-infrastructure-en.jsp.
19 Cowen, T. (2010, August 14) Free Parking Comes at a Price. The New York Times. Retrieved September-
December 2018 from https://www.nytimes.com/2010/08/15/business/economy/15view.html.
20 Chester, M.; Horvath, A.; Madanat, S. (2011, Fall) Parking Infrastructure and the Environment.
Access Magazine, No. 39. Retrieved from http://www.accessmagazine.org/wp-content/uploads/
sites/7/2016/01/access39_parking.pdf.
21 Barra, M. (2016, January 21) The next revolution in the auto industry. Retrieved September-December
2018 from https://www.weforum.org/agenda/2016/01/the-next-revolution-in-the-car-industry/.
22 O’Brien, C. (2018, November 19) How automotive supplier Valeo wants to accelerate autonomous
vehicle development. VentureBeat. Retrieved September-December 2018 from https://venturebeat.
com/2018/11/19/how-automotive-supplier-valeo-wants-to-accelerate-autonomous-vehicle-
development/.
23 World Economic Forum. Reinventing the wheel: digital transformation in the automotive industry.
Retrieved September-December 2018 from http://reports.weforum.org/digital-transformation/
reinventing-the-wheel-the-digital-transformation-of-the-automotive-industry/.
24 Carnegie Mellon University. Vehicle Electrification Group. Retrieved September-December 2018 from
https://www.cmu.edu/cit/veg/electrified%20vehicles/index.html.
25 Mitchell, P.; Waters, J.E. (2017) Energy Storage Roadmap Report. Energy Systems Network.
26 U.S. Department of Energy (2014, September 15) The History of the Electric Car. Retrieved September-
December 2018 from https://energy.gov/articles/history-electric-car.
27 Valdes-Dapena, P. (2012, October 23) Toyota Prius best selling car in California. CNN Business.
Retrieved September-December 2018 from http://money.cnn.com/2012/10/23/autos/toyota-prius-
sales-california/index.html.
28 Mitchell, P.; Waters, J.E. (2017) Energy Storage Roadmap Report. Energy Systems Network.
29 Ibid.
30 ZSW (2018, February 15) Number of electric cars rises from 2 to over 3 million. Retrieved September-
December 2018 from https://www.zsw-bw.de/en/newsroom/news/news-detail/news/detail/News/
number-of-electric-cars-rises-from-2-to-over-3-million.html.
31 Iyer, C. (2018, November 6) Driving Disruption: Catching the Next Wave of Growth in Electric Vehicles.
Christensen Institute. Retrieved September-December 2018 from https://www.christenseninstitute.
org/publications/driving-disruption/.
32 Reback, S. (2018, November 18) EVs Set to Become the Biggest Battery Users. Bloomberg
Businessweek. Retrieved September-December 2018 from https://www.bloomberg.com/news/
articles/2018-11-19/evs-set-to-become-the-biggest-battery-users.
33 Patterson, S. and Gold, R. (2018, February 11) There’s a global race to control batteries – and China is
winning. The Wall Street Journal. Retrieved from https://www.wsj.com/articles/theres-a-global-race-to-
control-batteriesand-china-is-winning-1518374815.
34 Desjardins, J. (2018, October 19) Battery Megafactory Forecast: 400% Increase in Capacity to 1 TWh
by 2028. Visual Capitalist. Retrieved September-December 2018 from http://www.visualcapitalist.com/
battery-megafactory-forecast-1-twh-capacity-2028/.

ENDNOTES 131
35 U.S. Energy Information Administration. (2017, November 3) Growth in plug-in electric vehicles
depends on future market conditions. Retrieved September-December 2018 from https://www.eia.gov/
todayinenergy/detail.php?id=33612.
36 AlixPartners. (2018, July 3) Betting big on Electrification and Autonomous. Retrieved September-
December 2018 from https://www.alixpartners.com/media-center/press-releases/uk-release-the-
alixpartners-global-automotive-outlook-2018/.
37 Frost, L. (2018, October 1) Electric cars cast growing shadow on profits. Reuters. Retrieved September-
December 2018 from https://www.reuters.com/article/us-autoshow-paris-electric-squeeze-analy/
electric-cars-cast-growing-shadow-on-profits-idUSKCN1MB2GD.
38 U.S. Department of Energy, Energy Efficiency & Renewable Energy. Electric Vehicle Charging Station
Locations. Retrieved from September-December 2018 from https://www.afdc.energy.gov/fuels/
electricity_locations.html#/find/nearest?fuel=ELEC.
39 Engle, H.; Hensley, R.; Knupfer, S.; Sahdev, S. (2018) Charging ahead: Electric vehicle infrastructure
demand. Retrieved from https://www.mckinsey.com/industries/automotive-and-assembly/our-insights/
charging-ahead-understanding-the-electric-vehicle-infrastructure-challenge.
40 Trivedi, A. (2018, November 4) The $6 trillion barrier holding electric cars back. Bloomberg. Retrieved
from https://www.bloomberg.com/opinion/articles/2018-11-04/electric-cars-face-a-6-trillion-barrier-
to-widespread-adoption.
41 U.S. Department of Energy, Office of Energy Efficiency & Renewable Energy. Vehicle Charging. Retrieved
September-December 2018 from https://www.energy.gov/eere/electricvehicles/vehicle-charging.
42 Bedir, A.; Crisostomo, N; Allen, J.; Wood, E.; Rames, C. (2018) California Plug-In Electric Vehicle
Infrastructure Projections: 2017-2025. California Energy Commission. Retrieved from https://www.
nrel.gov/docs/fy18osti/70893.pdf.
43 Fox-Penner, P.; Gorman, W.; and Hatch, J. (November 2018) Long-term U.S. transportation electricity use
considering the effect of autonomous vehicles: Estimates and policy observations. Energy Policy, volume 22,
pp. 203-213. Retrieved from https://www.sciencedirect.com/science/article/pii/S0301421518304737.
44 Muratori, M. (2018, January 22) Impact of uncoordinated plug-in electric vehicle charging on residential
power demand. Nature Energy, volume 3, pp. 193-201. Retrieved from https://www.nature.com/articles/
s41560-017-0074-z.
45 Automotive News. (2018, October 1) Nearly 100 electrified models slated to arrive through 2022.
Retrieved from September-December 2018 from http://www.autonews.com/article/20181001/
OEM04/181009990/nearly-100-electrified-models-slated-to-arrive-through-2022.
46 AlixPartners (2018, July 3) Betting big on electrification and autonomous. Retrieved from https://
www.alixpartners.com/media-center/press-releases/uk-release-the-alixpartners-global-automotive-
outlook-2018/.
47 Ibid.
48 U.S. Energy Information Administration (2017, September 14) International Energy Outlook 2017.
Retrieved from https://www.eia.gov/outlooks/ieo/pdf/0484(2017).pdf.
49 International Energy Agency (2017) Global EV Outlook 2017, p. 6. Retrieved from https://www.iea.org/
publications/freepublications/publication/GlobalEVOutlook2017.pdf.
50 Bloomberg New Energy Finance (2018). 2018 Electric Vehicle Outlook. Retrieved from https://about.
bnef.com/electric-vehicle-outlook/.

EMERGING MOBILITY TECHNOLOGIES AND TRENDS132
51 Patterson, S. and Gold, R. (2018, February 11) There’s a global race to control batteries – and China is
winning. The Wall Street Journal. Retrieved from https://www.wsj.com/articles/theres-a-global-race-to-
control-batteriesand-china-is-winning-1518374815.
52 National Highway Traffic Safety Administration. Vehicle-to-Vehicle Communication. Retrieved
September-December 2018 from https://www.nhtsa.gov/technology-innovation/vehicle-vehicle-
communication.
53 Intelligent Transportation Systems Joint Program Office. Vehicle-to-Infrastructure (V2I) resources.
United States Department of Transportation. Retrieved September-December 2018 from https://www.
its.dot.gov/v2i/.
54 IEEE Access. (2018) Emerging Technologies for Vehicle to Everything (V2X). Retrieved September-
December 2018 from http://ieeeaccess.ieee.org/special-sections/emerging-technologies-for-vehicle-to-
everything-v2x/.
55 U.S. Department of Transportation. Fact sheet: Improving safety and mobility through connected vehicle
technology. Retrieved September-December 2018 from (https://www.its.dot.gov/factsheets/pdf/
safetypilot_nhtsa_factsheet.pdf.
56 CAVita, LLC. (2017, September 15) Connected and Automated Technologies and Transportation
Infrastructure Readiness. Retrieved from http://onlinepubs.trb.org/onlinepubs/nchrp/docs/
NCHRP20-24(111)_CEOLeadershipForumWhitePaper-WorldCongressVersion.pdf.
57 Toyota Motor Company. (2016, April 16) Toyota and Lexus to launch technology to connect vehicles
and infrastructure in the U.S. in 2021. Retrieved from https://corporatenews.pressroom.toyota.com/
releases/toyota%2Band%2Blexus%2Bto%2Blaunch%2Btechnology%2Bconnect%2Bvehicles%2B
infrastructure%2Bin%2Bu%2Bs%2B2021.htm.
58 Greimel, H. (2018, August 27) Toyota takes car connectivity for a spin at world’s biggest testbed in
Ann Arbor. Crain’s Detroit Business. Retrieved from http://www.crainsdetroit.com/article/20180827/
news/669436/toyota-takes-car-connectivity-for-a-spin-at-worlds-biggest-testbed-in.
59 General Motors. (2018, June 6) Cadillac to expand Super Cruise across entire lineup. Retrieved from
https://media.gm.com/media/cn/en/gm/news.detail.html/content/Pages/news/cn/en/2018/June/0606_
Cadillac-Lineup.html.
60 Honda. (2018, October 4) Honda demonstrates new ‘smart intersection’ technology that enables
vehicles to virtually see through and around buildings. Retrieved from https://global.honda/newsroom/
worldnews/2018/4181004Smart-Intersection.html.
61 Papathanassiou, A. and Khoryaev, A. (June 2017) Cellular V2X as the essential enabler of superior global
connected transportation devices. IEE 5G Tech Focus, Volume 1, Number 2. Retrieved from https://
futurenetworks.ieee.org/tech-focus/june-2017/cellular-v2x.
62 Nordrum, A. and Clark, K. (2017, January 27) Everything you need to know about 5G. IEEE Spectrum.
Retrieved September-December 2018 from https://spectrum.ieee.org/video/telecom/wireless/
everything-you-need-to-know-about-5g.
63 International Telecommunication Union (2018) Setting the scene for 5G: Opportunities and challenges.
Retrieved from https://www.itu.int/en/ITU-D/Documents/ITU_5G_REPORT-2018.pdf.
64 University of Warwick. (2018, September 26) Researchers set an autonomous vehicle communications
record using 5G – a movie’s worth of data sent in seconds. Retrieved from https://warwick.ac.uk/
newsandevents/pressreleases/researchers_set_an/.

ENDNOTES 133
65 Vartabedian, M. (2018, September 12) What 5G will mean to consumers – and when. The Wall
Street Journal. Retrieved from https://www.wsj.com/articles/what-5g-will-mean-to-consumersand-
when-1536804241.
66 Shepardson, D. (2018, October 25) Trump signs order to set U.S. spectrum strategy as 5G race looms.
Reuters. Retrieved from https://www.reuters.com/article/us-usa-spectrum-trump/trump-signs-order-
to-set-u-s-spectrum-strategy-as-5g-race-looms-idUSKCN1MZ2FG.
67 Vartabedian, M. (2018, September 12) What 5G will mean to consumers – and when. The Wall
Street Journal. Retrieved from https://www.wsj.com/articles/what-5g-will-mean-to-consumersand-
when-1536804241.
68 CTIA (2018, July 19) Modernizing rules around 5G small cells could unlock additional $100 billion in
economic growth, according to new report. Retrieved from https://www.ctia.org/news/modernizing-5g-
rules-could-unlock-billions-in-economic-growth.
69 Semiconductor Research Corporation. Center for Converged TeraHertz Communications and Sensing.
Retrieved September-December 2018 from https://www.src.org/program/jump/comsenter/.
70 Cain, H. (2018, September 10) DSRC is best suited for collision avoidance and other safety applications.
Eno Transportation Weekly. Retrieved from https://www.enotrans.org/article/dsrc-is-best-suited-for-
collision-avoidance-and-other-safety-applications/.
71 Autotalks (2018) The implementation of DSRC above cellular is more cost-effective than implementing
C-V2X. Retrieved September-December 2018 from https://www.auto-talks.com/go/dsrc-cellular-costs-
less-c-v2x/.
72 Marr, B. (2018, October 1) What is deep learning AI? A simple guide with 8 practical steps. Forbes.
Retrieved from https://www.forbes.com/sites/bernardmarr/2018/10/01/what-is-deep-learning-ai-a-
simple-guide-with-8-practical-examples/#6c3cee48d4ba.
73 Ma, J. (2018, September 5) Waymo, Uber driverless projects make scanning sensors cheaper.
Bloomberg. Retrieved from https://www.bloomberg.com/news/articles/2018-09-05/waymo-uber-
driverless-projects-make-scanning-sensors-cheaper.
74 GPS.gov. (2017, December 18) Other Global Navigation Satellite Systems (GNSS). Retrieved
September-December 2018 from https://www.gps.gov/systems/gnss/.
75 GPS.gov. (2017, June 6) The Global Positioning System. Retrieved September-December 2018 from
https://www.gps.gov/systems/gps/.
76 Banker, S. (2018, November 1) The road to autonomous truck viability begins to clear. Forbes. Retrieved
from https://www.forbes.com/sites/stevebanker/2018/11/01/the-road-to-autonomous-truck-viability-
begins-to-clear/#48e622e626ad.
77 National Highway Traffic Safety Administration (NHTSA). Automated Vehicles For Safety. Retrieved
September-December 2018 from https://www.nhtsa.gov/technology-innovation/automated-vehicles-safety.
78 SAE International. (2014, January 16) Taxonomy and definitions of terms related to on-road motor
vehicle automated driving systems. Retrieved from http://standards.sae.org/j3016_201401/.
79 McDonald, A., Carney, C. & McGehee, D.V. (2018). Vehicle Owners’ Experiences with and Reactions
to Advanced Driver Assistance Systems. AAA Foundation for Traffic Safety. Retrieved from http://
aaafoundation.org/vehicle-owners-experiences-reactions-advanced-driver-assistance-systems/.
80 AAA. (November 2018). AAA Level 2 Autonomous Vehicle Testing. Retrieved from https://
publicaffairsresources.aaa.biz/download/12517/.

EMERGING MOBILITY TECHNOLOGIES AND TRENDS134
81 Insurance Institute for Highway Safety, Highway Loss Data Institute. (2018, August 7). Evaluating
autonomy: IIHS examines driver assistance features in road, track tests. Status Report, Vol. 53, No. 4.
Retrieved from https://www.iihs.org/iihs/news/desktopnews/evaluating-autonomy-iihs-examines-
driver-assistance-features-in-road-track-tests.
82 National Highway Traffic Safety Administration (September 2017). Automated Driving Systems 2.0: A
vision for safety. Retrieved September-December 2018 from https://www.nhtsa.gov/sites/nhtsa.dot.
gov/files/documents/13069a-ads2.0_090617_v9a_tag.pdf.
83 Fraade-Blanar, L.; Blumenthal, M.S.; Anderson, J.M. & Kalra, N. (2018). Measuring automated vehicle
safety: Forging a framework. RAND Corporation. Retrieved from https://www.rand.org/content/dam/
rand/pubs/research_reports/RR2600/RR2662/RAND_RR2662.pdf.
84 International Transport Forum. (2018, May 23). Safer roads with automated vehicles? Retrieved from
https://www.itf-oecd.org/safer-roads-automated-vehicles-0.
85 Brooke, Lindsay. (2018, April 3). Overcoming the ‘CO2 penalty’ of autonomous vehicles. Society of
Automotive Engineers. Retrieved from https://www.sae.org/news/2017/04/overcoming-the-co2-
penalty-of-autonomous-vehicles
86 Dunietz, J. (2018, July 27). Autonomous driving takes power. Will that matter for electrification? The
Fuse. Retrieved September-December 2018 from http://energyfuse.org/autonomous-driving-takes-
power-will-that-matter-for-electrification/.
87 Soteropoulos, A.; Berger, M.; and Ciari, F. (2018, September 28). Impacts of automated vehicles on travel
behavior and land use: an international review of modelling studies. Transport Reviews, 39:1, pp. 29-49.
Retrieved from https://www.tandfonline.com/doi/full/10.1080/01441647.2018.1523253.
88 Stewart, J. (2018, October 23). Smart, safer, more efficient vehicles. University of Delaware. Retrieved
from https://www.udel.edu/udaily/2018/october/andreas-malikopoulos-advances-connected-
automated-vehicles/.
89 Leong, J. (2018, February 20). Study shows autonomous vehicles can help improve traffic flow. Phys.org.
Retrieved from https://phys.org/news/2018-02-autonomous-vehicles-traffic.html.
90 U.S. Department of Energy. (January 2017). The transforming mobility ecosystem: Enabling an energy-
efficient future. Retrieved from https://www.energy.gov/sites/prod/files/2017/01/f34/The%20
Transforming%20Mobility%20Ecosystem-Enabling%20an%20Energy%20Efficient%20Future_0117_1.pdf.
91 Gawron, J.H.; Keoleian, G.A.; De Kleine, R.D.; Wallington, T.J.; & Kim, H.C. (2018). Life Cycle Assessment
of Connected and Automated Vehicles: Sensing and Computing Subsystem and Vehicle Level Effects.
Environmental Science & Technology, Vol. 52, (5), pp. 3249-3256. Retrieved from https://pubs.acs.org/
doi/10.1021/acs.est.7b04576.
92 Stevens Institute of Technology. (2018, November 20). Smart car technologies save drivers $6.2 billion
on fuel costs each year. Retrieved from https://www.stevens.edu/news/smart-car-technologies-save-
drivers-62-billion-fuel-costs-each-year.
93 SAE International (2018, September 24). Taxonomy and definitions for terms related to shared mobility
and enabling technologies. Retrieved from https://www.sae.org/standards/content/j3163_201809/.
94 SAE International. Shared Mobility. Retrieved September-December 2018 from https://www.sae.org/
shared-mobility.
95 Pew Research Center. Internet & Technology, Mobile Fact Sheet. Retrieved September-December 2018
from http://www.pewinternet.org/fact-sheet/mobile/.

ENDNOTES 135
96 Digital Transformation of the Automotive Industry. (2017, April 4). Retrieved September-December
2018 from https://www.prnewswire.com/news-releases/digital-transformation-of-the-automotive-
industry-300434496.html.
97 Clewlow, R.R. & Mishra, G.S. (October 2017). Disruptive transportation: The adoption, utilization, and
impacts of ride-hailing in the United States. Institute of Transportation Studies, University of California,
Davis. Retrieved from https://itspubs.ucdavis.edu/wp-content/themes/ucdavis/pubs/download_pdf.
php?id=2752.
98 Conway, M.W.; Salon, D.; & King, D.A. (September 2018). Trends in taxi use and the advent of ridehailing,
1995-2017: Evidence from the US National Household Travel Survey. Urban Science, Vol. 2 (3), p. 79.
Retrieved from https://www.mdpi.com/2413-8851/2/3/79/htm.
99 Cox Automotive. (2018, August 23). Range of mobility models expanding consumer options: Mobility
services becoming more popular as alternatives to vehicle ownership, according to Cox Automotive study.
Retrieved from https://www.coxautoinc.com/news/evolution-of-mobility-study-alternatives-to-ownership/.
100 Ibid.
101 AAA. (2018). Your driving costs: How much are you really paying to drive? Retrieved from https://
publicaffairsresources.aaa.biz/download/11896/.
102 Maynard, N. (2018, April 9) Mobility-as-a-Service: Emerging opportunities, vendor strategies &
market forecasts 2018-2023. Juniper Research. Retrieved from https://www.juniperresearch.com/
researchstore/iot-m2m/mobility-as-a-service/mobility-as-a-service-full-research-suite/.
103 ABI Research (2016, September 12). ABI Research forecasts global mobility as a service revenues to
exceed $1 trillion by 2030. Retrieved from https://www.abiresearch.com/press/abi-research-forecasts-
global-mobility-service-rev/.
104 Cox Automotive. (2018, August 23). Range of mobility models expanding consumer options: Mobility
services becoming more popular as alternatives to vehicle ownership, according to Cox Automotive study.
Retrieved from https://www.coxautoinc.com/news/evolution-of-mobility-study-alternatives-to-ownership/.
105 Clayton Christensen Institute. Disruptive Innovation. Retrieved September-December 2018 from
http://www.claytonchristensen.com/key-concepts/.
106 Christensen, C.M.; Raynor, M.E. & McDonald, R. (December 2015). What is disruptive innovation?
Harvard Business Review. Retrieved from https://hbr.org/2015/12/what-is-disruptive-innovation.
107 Welch, T.F., Gehrke, S.R. & Farber, S. (2018). Rail station access and housing market resilience: Case
studies of Atlanta, Baltimore and Portland. Urban Studies, 55(16), pp. 3615-3630. Retrieved from
https://journals.sagepub.com/doi/abs/10.1177/0042098018760708.
108 Becker, S., Bernstein, S. & Young, L. (March 2013). The new real estate mantra: Location near public
transportation. Center for Neighborhood Technology, American Public Transportation Association
& National Association of Realtors. Retrieved from https://www.apta.com/resources/statistics/
Documents/NewRealEstateMantra.pdf.
109 Dickens, M. & Shaum, L. (August 2018). Public transit is key strategy in advancing Vision Zero, eliminating
traffic fatalities. American Public Transportation Association. Retrieved from https://www.apta.com/
resources/hottopics/Documents/APTA%20VZN%20Transit%20Safety%20Brief%208.2018.pdf.
110 American Public Transportation Association (September 2016). The hidden traffic safety solution: Public
transportation. Retrieved from https://www.apta.com/resources/reportsandpublications/Documents/
APTA-Hidden-Traffic-Safety-Solution-Public-Transportation.pdf.

EMERGING MOBILITY TECHNOLOGIES AND TRENDS136
111 Dickens, M. & Shaum, L. (August 2018). Public transit is key strategy in advancing Vision Zero, eliminating
traffic fatalities. American Public Transportation Association. Retrieved from https://www.apta.com/
resources/hottopics/Documents/APTA%20VZN%20Transit%20Safety%20Brief%208.2018.pdf.
112 U.S. Department of Transportation (2016, February 2). Public transportation trips per capita.
Retrieved September-December 2018 from https://www.transportation.gov/mission/health/public-
transportation-trips-capita.
113 Union Internationale des Transports Publics (UITP) (2015, August 1). Monthly focus: The economic
impact of public transport. Retrieved September-December 2018 from https://www.uitp.org/news/
monthly-focus-economic-impact-public-transport.
114 Metropolitan Planning Council. Transit means business. Retrieved from https://uploads-ssl.webflow.
com/5ba52f91e783e250be30249b/5bce32659dc40a1fdbae9711_transit-means-business.pdf.
115 McKenzie, B. (august 2015). Who drives to work? Commuting by automobile in the United States:
2013. U.S. Census Bureau. Retrieved from https://www.census.gov/content/dam/Census/library/
publications/2015/acs/acs-32.pdf.
116 Hughes-Cromwick, M. & Dickens, M. (March 2018). 2017 public transportation fact book. American
Public Transportation Association. Retrieved from https://www.apta.com/resources/statistics/
Documents/FactBook/2017-APTA-Fact-Book.pdf.
117 TransitCenter. Ridership. Retrieved September-December 2018 from http://transitcenter.org/
initiatives/ridership/.
118 English, J. (2018, August 31). Why did America give up on mass transit? (Don’t blame cars.). Citylab.
Retrieved from https://www.citylab.com/transportation/2018/08/how-america-killed-transit/568825/.
119 Manville, M.; Taylor, B.D. & Blumenberg, E. (2018) Falling transit ridership in southern California. UCLA
Institute of Transportation Studies. Retrieved from https://www.its.ucla.edu/policy-brief/falling-transit-
ridership-southern-california/.
120 Mallett, W.J. (2018, March 26). Trends in public transportation ridership: Implications for federal policy.
Congressional Research Service. Retrieved from https://fas.org/sgp/crs/misc/R45144.pdf.
121 Hall, J.D.; Palsson, C. & Price, J. (2018) Is Uber a substitute or complement for public transit? Journal
of Urban Economics, 108, pp. 36-50. Retrieved from http://individual.utoronto.ca/jhall/documents/
Hall,%20Palsson,%20Price%20-%20JUE%20-%202018.pdf.
122 Shrikant, A. (2018, September 26). Why US public transportation is so bad – and why Americans don’t
care. Vox. Retrieved from https://www.vox.com/the-goods/2018/9/26/17903146/mass-transit-public-
transit-rail-subway-bus-car.
123 Tabuchi, H. (2018, June 19). How the Koch brothers are killing public transit projects around the country.
The New York Times. Retrieved from https://www.nytimes.com/2018/06/19/climate/koch-brothers-
public-transit.html.
124 Siddiqui, F. (2018, March 24). Falling transit ridership poses an ‘emergency’ for cities, experts fear. The
Washington Post. Retrieved from https://www.washingtonpost.com/local/trafficandcommuting/falling-
transit-ridership-poses-an-emergency-for-cities-experts-fear/2018/03/20/ffb67c28-2865-11e8-
874b-d517e912f125_story.html.
125 Seattle Department of Transportation. (2018, January 3). A closer look at Seattle’s rising transit ridership
[Web log post]. Retrieved September-December 2018, from http://sdotblog.seattle.gov/2018/01/03/a-
closer-look-at-seattles-rising-transit-ridership/.

ENDNOTES 137
126 Shrikant, A. (2018, November 5). The bus gets a lot of hate. American cities are trying to change
that [Web log post]. Retrieved November-December 2018, from https://www.vox.com/the-
goods/2018/11/5/18057352/bus-stigma-public-transportation-micro-transit
127 Seattle Department of Transportation. (2018, January 3). A closer look at Seattle’s rising transit ridership
[Web log post]. Retrieved September-December 2018, from http://sdotblog.seattle.gov/2018/01/03/a-
closer-look-at-seattles-rising-transit-ridership/
128 SoCal Survey Shows Students Prefer Not Driving [Web log post]. Retrieved September-December 2018,
from https://www.metrolinktrains.com/news/metrolink-news/socal-survey-shows-students-prefer-not-
driving/
129 More than 7 in 10 Americans Support Increased Federal Funding for Public Transit in Communities of All
Sizes [Web log post]. Retrieved September-December 2018, from https://www.apta.com/mediacenter/
pressreleases/2015/Pages/151125_Federal-Funding.aspx
130 With some all-electric buses, Metro Transit rides into the future [Web log post]. Retrieved September-
December 2018, from https://www.seattletimes.com/opinion/with-some-all-electric-buses-metro-
transit-rides-into-the-future/
131 National Renewable Energy Laboratory. (2016, September). NREL Evaluates Performance of Fast-
Charge Electric Buses [Online PDF]. Retrieved September-December 2018, from https://www.nrel.gov/
docs/fy16osti/67057.pdf
132 American Public Transportation Association
133 BloombergNEF. (2018, May 21). E-Buses to Surge Even Faster Than EVs as Conventional Vehicles Fade
[Web log post]. Retrieved September-December 2018, from https://about.bnef.com/blog/e-buses-surge-
even-faster-evs-conventional-vehicles-fade/
134 BloombergNEF. (2018). Electric Vehicle Outlook: 2018 [Web slide presentation]. Retrieved September-
December 2018, from https://bnef.turtl.co/story/evo2018
135 A Guide for Planning and Operating Flexible Public Transportation Services. Transportation Research
Board (TRB). Retrieved September-December 2018, from http://www.trb.org/Publications/
Blurbs/163788.aspx
136 Goldwyn, E., Levy, A. (2018, October 12). Get on the Bus: A Radical Plan for Brooklyn’s Bus Network.
New York Magazine. Retrieved from http://nymag.com/intelligencer/2018/10/a-radical-plan-for-
brooklyns-bus-network.html
137 Stromberg, J. (2015, August 10). The real reason American public transportation is such a disaster [Web
log post]. Retrieved September-December 2018, from https://www.vox.com/2015/8/10/9118199/
public-transportation-subway-buses
138 Washington Metro. (2018, May). Stabilizing and Growing Metro Ridership {Online PDF]. Retrieved
September-December 2018, from https://assets.documentcloud.org/documents/4953513/Metro-s-
internal-plan-to-grow-ridership.pdf
139 Washington Metro. (2018, May). Stabilizing and Growing Metro Ridership {Online PDF]. Retrieved
September-December 2018, from https://assets.documentcloud.org/documents/4953513/Metro-s-
internal-plan-to-grow-ridership.pdf
140 Carpenter, S. (2018, September 4). Incentives, Improved Technology Are Driving Electric Bus Adoption
[Web log post]. Retrieved September-December 2018, from https://www.trucks.com/2018/09/04/
incentives-technology-drive-electric-bus-adoption/

EMERGING MOBILITY TECHNOLOGIES AND TRENDS138
141 US Solar Market Insight. Wood Mackenzie. Retrieved September-December 2018, from https://www.
woodmac.com/research/products/power-and-renewables/us-solar-market-insight/
142 BYD and Generate Capital to Launch First-Ever U.S. Partnership for an Electric Bus Leasing
Program $200 million allocated to lease program to accelerate adoption of private and public
sector electric buses. BYD. Retrieved September-December 2018, from http://www.byd.com/sites/
Satellite?c=BydArticle&cid=1514427870145&d=Touch&pagename=BYD_EN%2FBydArticle%2FBYD_
ENCommon%2FArticleDetails&rendermode=preview
143 Financing Your Electric Bus. Proterra. Retrieved September-December 2018, from https://www.proterra.
com/financing/
144 McLeod, J. (2018, September 10). Belleville transit pilot project ditches fixed routes for bus-hailing
system [Web log post]. Retrieved September-December 2018, from https://business.financialpost.com/
technology/belleville-transit-pilot-project-ditches-fixed-routes-for-bus-hailing-system
145 Dunne, J. (2018 September 29). Uber for buses? How some Canadian cities are using technology to
tackle transit troubles [Web log post]. Retrieved September-December 2018, from https://www.cbc.ca/
news/business/uber-lyft-ride-hailing-on-demand-public-transit-1.4842699
146 Mellor, L. (2018, April 10). Pantonium On-Demand Transit Project Begins In Belleville Ontario [Web log
post]. Retrieved from September-December 2018, from https://pantonium.com/pantonium-on-demand-
transit-project-begins-in-belleville-ontario/
147 McLeod, J. (2018, September 10). Belleville transit pilot project ditches fixed routes for bus-hailing
system [Web log post]. Retrieved September-December 2018, from https://business.financialpost.com/
technology/belleville-transit-pilot-project-ditches-fixed-routes-for-bus-hailing-system
148 Lindeman, T. (2018, October 5). You Can Hail a Public Bus Like an Uber in This City [Web log post]. Vice.
Retrieved September-December 2018, from https://motherboard.vice.com/en_us/article/j53by7/hail-
on-demand-bus-like-uber-in-belleville
149 Dunne, J. (2018 September 29). Uber for buses? How some Canadian cities are using technology to
tackle transit troubles [Web log post]. Retrieved September-December 2018, from https://www.cbc.ca/
news/business/uber-lyft-ride-hailing-on-demand-public-transit-1.4842699
150 Mellor, L. (2018, April 10). Pantonium On-Demand Transit Project Begins In Belleville Ontario [Web log
post]. Retrieved from September-December 2018, from https://pantonium.com/pantonium-on-demand-
transit-project-begins-in-belleville-ontario/
151 Cervero, R. (2001, January 2). Walk-and-Ride: Factors Influencing Pedestrian Access to Transit
[Journal]. Journal of Public Transportation Article in Volume 3, Issue 4. Retrieved September-December
2018, from https://www.nctr.usf.edu/2001/01/walk-and-ride-factors-influencing-pedestrian-access-to-
transit/
152 Finson, R., Shaheen, S. (2003 February). Bridging the last mile: a study of the behavioral, institutional, and
economic potential of the Segway human transporter [Article]. Retrieved September-December 2018,
from https://www.researchgate.net/publication/228704157_Bridging_the_last_mile_a_study_of_the_
behavioral_institutional_and_economic_potential_of_the_segway_human_transporter/
153 Average New-Car Prices Rise Nearly 4 Percent For January 2018 On Shifting Sales Mix, According To
Kelley Blue Book [Press release]. Kelley Blue Book. Retrieved September-December 2018, from https://
mediaroom.kbb.com/2018-02-01-Average-New-Car-Prices-Rise-Nearly-4-Percent-For-January-2018-
On-Shifting-Sales-Mix-According-To-Kelley-Blue-Book

ENDNOTES 139
154 FOTW #1036, July 2, 2018: Transportation was Nearly 16% of Household Expenditures in 2016 [Web
log post]. Office of Energy Efficiency & Renewable Energy. Retrieved September-December 2018, from
https://www.energy.gov/eere/vehicles/articles/fotw-1036-july-2-2018-transportation-was-nearly-16-
household-expenditures
155 Mobility Challenges for Households in Poverty [PDF]. National Household Travel Survey. Retrieved
September-December 2018, from https://nhts.ornl.gov/briefs/PovertyBrief.pdf
156 Clark, H. (2017, January). Who Rides Public Transportation [PDF]. Retrieved September-December
2018, from https://www.apta.com/resources/reportsandpublications/Documents/APTA-Who-Rides-
Public-Transportation-2017.pdf
157 Clark, H. (2017, January). Who Rides Public Transportation [PDF]. Retrieved September-December
2018, from https://www.apta.com/resources/reportsandpublications/Documents/APTA-Who-Rides-
Public-Transportation-2017.pdf
158 Mobility Challenges for Households in Poverty [PDF]. National Household Travel Survey. Retrieved
September-December 2018, from https://nhts.ornl.gov/briefs/PovertyBrief.pdf
159 Hill, S. (2018, March 17). Ridesharing Versus Public Transit [Web log post]. Retrieved September-
December 2018, from http://prospect.org/article/ridesharing-versus-public-transit
160 Housing and Transportation Index [eTool]. Center for Neighborhood Technology. Retrieved September-
December 2018, from https://www.cnt.org/tools/housing-and-transportation-affordability-index
161 Delgadillo, L., Jewkes, M. (2010). Weaknesses of Housing Affordability Indices Used by Practitioners
[PDF]. Retrieved September-December 2018, from https://afcpe.org/assets/pdf/volume_21_issue_1/
jewkes_delgadillo.pdf
162 Woolf, S., Braveman, P. (2011 October). Where Health Disparities Begin: The Role Of Social And
Economic Determinants—And Why Current Policies May Make Matters Worse [Article]. Retrieved
September-December 2018, from https://www.healthaffairs.org/doi/abs/10.1377/hlthaff.2011.0685
163 Woolf, S., Braveman, P. (2011 October). Where Health Disparities Begin: The Role Of Social And
Economic Determinants—And Why Current Policies May Make Matters Worse [Article]. Retrieved
September-December 2018, from https://www.healthaffairs.org/doi/abs/10.1377/hlthaff.2011.0685
164 Smith, A. (2016, May 19). Shared, Collaborative and On Demand: The New Digital Economy [Report].
Retrieved September-December 2018, from http://www.pewinternet.org/2016/05/19/the-new-digital-
economy/
165 Levich, R. (1987 June). Financial Innovations in International Financial Markets [Article]. Retrieved
September-December 2018, from https://www.nber.org/papers/w2277
166 Rural Public Transportation Systems [Web log post]. Retrieved September-December 2018, from
https://www.transportation.gov/mission/health/Rural-Public-Transportation-Systems
167 Clewlow, R., Mishra, G. (2017 October). Disruptive Transportation: The Adoption, Utilization, and
Impacts of Ride-Hailing in the United States [Research Report]. UC Davis Institute of Transportation
Studies. Retrieved September-December 2018, from https://itspubs.ucdavis.edu/wp-content/themes/
ucdavis/pubs/download_pdf.php?id=2752
168 Mobility Services for All Americans [Report]. United States Department of Transportation. Retrieved
September-December 2018, from https://www.its.dot.gov/research_archives/msaa/index.htm
169 2017 NHTS Weighted Vehicle Occupancy Factors [Report]. United States Department of Transportation.
Retrieved September-December 2018, from https://www.fhwa.dot.gov/policyinformation/nhstable.cfm

EMERGING MOBILITY TECHNOLOGIES AND TRENDS140
170 Pascus, B. (2018, August 20). These are the 20 best-selling cars and trucks in America in 2018 [Web log
post]. Business Insider. Retrieved September-December 2018, from https://www.businessinsider.com/
best-selling-cars-and-trucks-in-america-in-2018-2018-8
171 Where the Energy Goes: Gasoline Vehicles [Report]. Retrieved September-December 2018, from
https://www.fueleconomy.gov/feg/atv.shtml
172 Body Measurements [Report]. Centers for Disease Control and Prevention. Retrieved September-
December 2018, from https://www.cdc.gov/nchs/fastats/body-measurements.htm
173 Highlights of CO2 and Fuel Economy Trends [Report]. Retrieved September-December 2018, from
https://www.epa.gov/fuel-economy-trends/highlights-co2-and-fuel-economy-trends
174 Popular Vehicle Trips Statistics [Report]. National Household Travel Survey. Retrieved September-
December 2018, from https://nhts.ornl.gov/vehicle-trips
175 Bruce, O. (2018, September 3). Episode 2: What is micromobility, how do we define it, and why is it
disruptive? [Web log post]. Retrieved September-December 2018, from https://medium.com/micromobility/
episode-2-what-is-micromobility-how-do-we-define-it-and-why-is-it-disruptive-4653ef260492
176 McFarland, M. Segway was supposed to change the world. Two decades later, it just might [Web log
post]. Retrieved September-December 2018, from https://www.cnn.com/2018/10/30/tech/segway-
history/index.html
177 Golson, J. (2015 January 16). Well That Didn’t Work: The Segway is a Technological Marvel. Too Bad it
Doesn’t Make Any Sense [Web log post]. Wired. Retrieved September-December 2018, from https://
www.wired.com/2015/01/well-didnt-work-segway-technological-marvel-bad-doesnt-make-sense/
178 Finson, R., Shaheen, S. (2003 February). Bridging the last mile: a study of the behavioral, institutional, and
economic potential of the Segway human transporter [Article]. Retrieved September-December 2018,
from https://www.researchgate.net/publication/228704157_Bridging_the_last_mile_a_study_of_the_
behavioral_institutional_and_economic_potential_of_the_segway_human_transporter/
179 Schneider, B. (2018, June 21). Why Little Vehicles Will Conquer the City [Web log post]. Retrieved
September-December 2018, from https://www.citylab.com/transportation/2018/06/welcome-to-the-
tiny-vehicle-age/563342/
180 Hawkins, A. (2018, September 20). The electric scooter craze is officially one year old — what’s
next? [Web log post]. Retrieved September-December 2018, from https://www.theverge.
com/2018/9/20/17878676/electric-scooter-bird-lime-uber-lyft
181 Murphy, M., Griswold, A. (2018, April 19). Rebranded Chinese scooters are taking over San Francisco
[Web log post]. Retrieved September-December 2018, from https://qz.com/1257198/xiaomi-makes-
the-bird-and-spin-scooters-taking-over-san-francisco/
182 Bird Unveils Bird Zero: Custom-Designed e-Scooter for Ridesharing 2.0 [Press release]. Retrieved
September-December 2018, from https://www.prnewswire.com/news-releases/bird-unveils-bird-zero-
custom-designed-e-scooter-for-ridesharing-2-0--300724742.html
183 Marshall, A. (2018, October 19). Lime’s New Scooter is Hardier, Heavier, and Built for Life on the Street
[Web log post]. Retrieved September-December 2018, fromhttps://www.wired.com/story/lime-scooter-
gen3-design/
184 The Micro-Mobility Revolution: The Introduction and Adoption of Electric Scooters in the United States
[Report]. Populus. Retrieved September-December 2018, from https://www.populus.ai/micro-mobility-
2018-july

ENDNOTES 141
185 Lime: One Year Report [PDF]. Retrieved September-December 2018, from https://www.limebike.com/
hubfs/Lime_Official_One_Year_Report.pdf
186 Reid, C. (2018, November 7). Data From Millions Of Smartphone Journeys Proves Cyclists Faster In
Cities Than Cars And Motorbikes [Web log post]. Retrieved September-December 2018, from https://
www.forbes.com/sites/carltonreid/2018/11/07/data-from-millions-of-smartphone-journeys-proves-
cyclists-faster-in-cities-than-cars-and-motorbikes/#2e7a1c493794
187 Lime: One Year Report [PDF]. Retrieved September-December 2018, from https://www.limebike.com/
hubfs/Lime_Official_One_Year_Report.pdf
188 Bird Announces $100 Million in Series B Funding [Press release]. Retrieved September-December
2018, from https://www.bird.co/blog/bird-announces-100-million-in-series-b-funding
189 Madrigal, A. (2018, October 15). San Francisco’s Scooter War Is Over, and the Scooters Won [Web log
post]. Retrieved September-December2018, from https://www.citylab.com/transportation/2018/10/
san-franciscos-scooter-war-is-over-and-the-scooters-won/573022/
190 2017 Free-Floating Bike Share Pilot Evaluation Report [PDF]. Seattle Department of Transportation.
Retrieved September-December 2018, from http://www.seattle.gov/Documents/Departments/SDOT/
BikeProgram/2017BikeShareEvaluationReport.pdf
191 Bike Share in the U.S.: 2017 [Report]. National Association of City Transportation Officials. Retrieved
September-December 2018, from https://nacto.org/bike-share-statistics-2017/
192 Clewlow, R. (2018, November 15). DC is growing its dockless bike and scooter program: We partnered
with them to evaluate how it’s expanding access in underserved communities [Web log post]. Retrieved
September-December 2018, from https://medium.com/populus-ai/measuring-equity-dockless-
27c40af259f8
193 How reliable are those colorful bike-share bikes on Seattle streets and sidewalks? [Article]. Seattle
Times. Retrieved September-December 2018, from https://www.seattletimes.com/seattle-news/
transportation/how-reliable-are-those-colorful-bike-share-bikes-on-seattle-streets-and-sidewalks/
194 Furfaro, D., Denmark, S. (2018, November 25). Good luck grabbing these snazzy Citi Bikes [Article]. New
York Post. Retrieved December 2018, from https://nypost.com/2018/11/25/good-luck-grabbing-these-
snazzy-citi-bikes/
195 The Fun of Biking With the Ease of Driving: E-Bikes Offer Both [Web log post]. National Institute for
Transportation and Communities. Retrieved September-December 2018, from https://nitc.trec.pdx.edu/
news/fun-biking-ease-driving-e-bikes-offer-both
196 Woyke, E. (2018, September 28). The secret data collected by dockless bikes is helping cities map your
movement [Web log post]. Retrieved September-December 2018, from https://www.technologyreview.
com/s/612123/the-secret-data-collected-by-dockless-bikes-is-helping-cities-map-your-movement/
197 Bike Share in the U.S.: 2017 [Report]. National Association of City Transportation Officials. Retrieved
September-December 2018, from https://nacto.org/bike-share-statistics-2017/
198 Schneider, B. (2018, June 21). Why Little Vehicles Will Conquer the City [Web log post]. Retrieved
September-December 2018, from https://www.citylab.com/transportation/2018/06/welcome-to-the-
tiny-vehicle-age/563342/
199 Sussman, M. (2018, October 5). Where have all the dockless bicycles gone? Data from DC’s pilot is
revealing [Web log post]. Retrieved September-December 2018, from https://ggwash.org/view/69307/
who-killed-dcs-dockless-pedal-bicycles

EMERGING MOBILITY TECHNOLOGIES AND TRENDS142
200 Introducing Lyft Bikes [Web log post]. Retrieved September-December 2018, from https://blog.lyft.com/
posts/lyft-to-acquire-us-bikeshare-leader
201 Brustein, J. (2018, August 30). Uber Is Building Its Own Scooter to Compete in Frenzy [Web log post].
Retrieved September-December 2018, from https://www.bloomberg.com/news/articles/2018-08-30/
uber-embraces-bikes-scooters-as-the-future-of-urban-transport
202 Hawkins, A. (2018, September 6). Lyft rolls out its first electric scooters in Denver [Web log post].
Retrieved September-December 2018, from https://www.theverge.com/2018/9/6/17824040/lyft-
electric-scooter-denver-dockless-public-transportation
203 Hawkins, A. (2018, October 23). Meet Jelly, the new electric scooter science project run by
Ford [Web log post]. Retrieved September-December 2018, from https://www.theverge.
com/2018/10/23/18014774/ford-jelly-electric-scooter-research-purdue-university
204 Madra, S. (2018, November 8). Let’s Go for a Spin: Ford Buys Scooter Company to Provide Customers a First-
Last Mile Solution [Web log post]. Retrieved September-December 2018, from https://medium.com/@ford/
lets-go-for-a-spin-ford-buys-scooter-company-to-provide-customers-a-first-last-mile-solution-bbeae278d373
205 General Motors Is Building an eBike and Wants You to Name It [Web log post]. General Motors. Retrieved
September-December 2018, from https://media.gm.com/media/us/en/gm/home.detail.html/content/
Pages/news/us/en/2018/nov/1102-ebike.html
206 Rao, S. (2018, July 19). Understanding multimodality: An analysis of early JUMP users [Web log post].
Retrieved September-December 2018, from https://medium.com/uber-under-the-hood/understanding-
multimodality-an-analysis-of-early-jump-users-4a35d647b7e6
207 Uber plans shift from cars to bikes for shorter trips [Web log post]. Retrieved September-December
2018, from https://www.ft.com/content/986d878a-a7c4-11e8-8ecf-a7ae1beff35b
208 The Open Era of Autonomous [Webpage]. Retrieved September-December 2018, from https://take.lyft.
com/open-platform/
209 Vincent, L. (2017, July 21). Introducing Level 5 and Our Self-Driving Team [Web log post]. Retrieved
September-December 2018, from https://medium.com/@lvincent/introducing-level-5-and-our-self-
driving-team-705ef8989f03
210 Learn more about General Motors’ approach to safely putting self-driving cars on the roads in 2019
[Webpage]. General Motors. Retrieved September-December 2018, from https://www.gm.com/our-
stories/self-driving-cars.html
211 Volkswagen launches Moia, a new standalone mobility company [Web log post]. Retrieved September-
December 2018, from https://techcrunch.com/2016/12/05/volkswagen-launches-moia-a-new-
standalone-mobility-company/
212 Volkswagen’s MOIA Debuts Its All Electric Rideshare Vehicle [Web log post]. Retrieved September-
December 2018, from https://techcrunch.com/2017/12/04/volkswagens-moia-debuts-its-all-electric-
rideshare-vehicle/
213 Toyota and SoftBank Agreed on Strategic Partnership To Establish Joint Venture for New Mobility
Services [Press release]. Retrieved September-December 2018, from https://www.softbank.jp/en/corp/
group/sbm/news/press/2018/20181004_01/
214 Brown, M. (2018, October 25). Elon Musk Explains How Tesla Will Power an Autonomous Uber-
AirBnB Service [Web log post]. Retrieved September-December 2018, from https://www.inverse.com/
article/50169-elon-musk-explains-how-tesla-will-power-an-autonomous-uber-airbnb-service

ENDNOTES 143
215 MacKenchie, C. (2017, July 10). How Much Does a Bus Cost to Purchase and Operate? [Web log post].
Retrieved September-December 2018, from https://www.thoughtco.com/bus-cost-to-purchase-and-
operate-2798845
216 How disruptive will a mass adoption of robotaxis be? [PDF]. Retrieved September-December 2018, from
https://neo.ubs.com/shared/d1RIO9MkGM/ues83702.pdf
217 Will Tech Leave Detroit in the Dust?. The Wall Street Journal. Retrieved September-December 2018,
from https://www.wsj.com/articles/can-detroit-become-a-software-business-1540008107
218 By 2030, 25% of Miles Driven in US Could Be in Shared Self-Driving Electric Cars [Press release].
Retrieved September-December 2018, from https://www.bcg.com/d/press/10april2017-future-
autonomous-electric-vehicles-151076
219 Intel Predicts Autonomous Driving Will Spur New ‘Passenger Economy’ Worth $7 Trillion [Web log
post]. Retrieved September-December 2018, from https://newsroom.intel.com/news-releases/intel-
predicts-autonomous-driving-will-spur-new-passenger-economy-worth-7-trillion/
220 AAA: Ride-Hailing Twice the Cost of Car Ownership [Press release]. Retrieved September-December
2018, from https://newsroom.aaa.com/2018/08/ride-hailing-double-cost-car-ownership/
221 True price of an Uber ride in question as investors assess firm’s value [Web log post]. Retrieved
September-December 2018, from https://www.reuters.com/article/us-uber-profitability/true-price-of-
an-uber-ride-in-question-as-investors-assess-firms-value-idUSKCN1B3103
222 The great auto disruption [Web log post]. Retrieved September-December 2018, from https://www.
businesstelegraph.co.uk/the-great-auto-disruption/
223 Hawkins, A. (2018, September 17). Self-driving pods are slow, boring, and weird-looking — and that’s
a good thing [Web log post]. Retrieved September-December 2018, from https://www.theverge.
com/2018/9/17/17859112/self-driving-cars-shuttle-pods-delivery-services
224 GM’s driverless car bet faces long road ahead [Web log post]. Retrieved September-December 2018,
from https://www.reuters.com/article/us-gm-selfdriving-cruise-insight/gms-driverless-car-bet-faces-
long-road-ahead-idUSKCN1MY0CK
225 Descant, S. (2018 October 17). Autonomous Shuttles Have the Opportunity to Improve the Bus
Experience [Web log post]. Retrieved September-December 2018, from http://www.govtech.com/fs/
Autonomous-Shuttles-Have-the-Opportunity-to-Improve-the-Bus-Experience.html
226 Here’s one autonomous vehicle that seems to be making some headway: the bus [Web log post]. Retrieved
September-December 2018, from https://thehustle.co/navya-autonomou-vehicles-bus-las-vegas/
227 Milo [Web log post]. City of Arlington. Retrieved September-December 2018, from http://www.arlington-
tx.gov/visitors/av/milo/
228 Descant, S. (2018 October 17). Autonomous Shuttles Have the Opportunity to Improve the Bus
Experience [Web log post]. Retrieved September-December 2018, from http://www.govtech.com/fs/
Autonomous-Shuttles-Have-the-Opportunity-to-Improve-the-Bus-Experience.html
229 Capital Metro, City of Austin and RATP Dev USA are Testing Autonomous Transit [Web log post].
Retrieved September-December 2018, from https://www.capmetro.org/About-Capital-Metro/Media-
Center/News-Stories/2018-News-Stories/4294970588/
230 Shared Autonomous Vehicles Make Debut at Bishop Ranch as Part of Pilot Program [Web log post].
Retrieved September-December 2018, from https://www.bishopranch.com/press-release/shared-
autonomous-vehicles-make-debut-bishop-ranch-part-pilot-program/
EMERGING MOBILITY TECHNOLOGIES AND TRENDS144
231 Autonomous vehicles: Expect up to 50 driverless buses on Oslo streets by 2021 [Web log post].
Retrieved September-December 2018, from https://www.zdnet.com/article/autonomous-vehicles-
expect-up-to-50-driverless-buses-on-oslo-streets-by-2021/
232 Driverless shuttle enters passenger service in mixed traffic [Web log post]. Retrieved September-
December 2018, from https://www.metro-report.com/news/single-view/view/driverless-shuttle-enters-
passenger-service-in-mixed-traffic.html
233 NHTSA directs driverless shuttle to stop transporting school children in Florida {web log post]. Retrieved
September-December 2018, from https://www.nhtsa.gov/press-releases/nhtsa-directs-driverless-
shuttle-stop-transporting-school-children-florida
234 Shared Electric Scooter Pilot [Report]. Portland Bureau of Transportation. Retrieved September-
December 2018, from https://www.portlandoregon.gov/transportation/77294
235 2018 E-SCOOTER PILOT User Survey Results [Report]. Portland Bureau of Transportation.
Retrieved September-December 2018, from https://www.portlandoregon.gov/transportation/
article/700916
236 2018 E-Scooter Findings Report [Report]. Portland Bureau of Transportation. Retrieved September-
December 2018, from https://www.portlandoregon.gov/transportation/78431
237 Herron, E. (2018, November 26). Portland’s E-Scooters Didn’t Squelch Bike Share Use. In Fact, They
Might Have Helped [Web log post]. Retrieved September-December 2018, from https://www.wweek.
com/news/2018/11/26/portlands-e-scooters-didnt-squelch-bike-share-use-in-fact-they-might-have-
helped/
238 Scooter and Bike Share Services [report]. Retrieved September-December 2018, from https://www.
smgov.net/Departments/PCD/Transportation/Shared-Mobility-Services/
239 Santa Monica City Council Approves Shared Mobility Pilot Program [Web log post]. Retrieved
September-December 2018, from https://www.santamonica.gov/press/2018/06/13/santa-monica-city-
council-approves-shared-mobility-pilot-program
240 Linton, J. (2018, November 8). Santa Monica Installs In-Street E-Scooter Parking Corrals [Web log post].
Retrieved September-December 2018, from https://la.streetsblog.org/2018/11/08/santa-monica-
installs-in-street-e-scooter-parking-corrals/
241 Technology for the future of mobility [Webpage]. Retrieved September-December 2018, from https://
platform.ridewithvia.com/
242 Shared Mobility: Definitions, Industry Developments, and Early Understanding [PDF]. Retrieved
September-December 2018, from http://innovativemobility.org/wp-content/uploads/2015/11/
SharedMobility_WhitePaper_FINAL.pdf
243 Shared Mobility: Definitions, Industry Developments, and Early Understanding [PDF]. Retrieved
September-December 2018, from http://innovativemobility.org/wp-content/uploads/2015/11/
SharedMobility_WhitePaper_FINAL.pdf
244 Descant, S. (2018, October 12). FlexLA is Ready to Shuttle You Around Downtown Los Angeles [Web
log post]. Retrieved September-December 2018, from http://www.govtech.com/fs/FlexLA-is-Ready-to-
Shuttle-You-Around-Downtown-Los-Angeles.html
245 Shafer, M. (2018, October 17). Uber For Buses? SamTrans Will Test An On-Demand Route [Article].
Retrieved September-December 2018, from https://kcbsradio.radio.com/blogs/margie-shafer/samtrans-
micro-transit-app-will-offer-rides-demand-pacifica

ENDNOTES 145
246 Sisson, P. (2018, January 12). Microtransit: How cities are, and aren’t, adapting transit technology [Web
log post]. Retrieved September-December 2018, from https://www.curbed.com/2018/1/9/16871474/
microtransit-mass-transit-uber-lyft
247 Via Rideshare [Web log post]. City of Arlington. Retrieved September-December 2018, from http://www.
arlington-tx.gov/residents/via/
248 Demand-Responsive Shuttles to Account for 50% of Global Shared Mobility Market by 2030
[Press release]. Retrieved September-December 2018, from https://www.prnewswire.com/
news-releases/demand-responsive-shuttles-to-account-for-50-of-global-shared-mobility-market-
by-2030-300700246.html
249 Li, Z., Hong, Y., Zhang, Z., (2016, August 30). Do On-demand Ride-sharing Services Affect Traffic
Congestion? [Journal]. Retrieved September-December 2018, from https://papers.ssrn.com/sol3/
papers.cfm?abstract_id=2838043
250 Conner-Simmons, A. (2016, December 1). Study: carpooling apps could reduce taxi traffic 75% [Report].
Retrieved September-December 2018, from https://www.csail.mit.edu/news/study-carpooling-apps-
could-reduce-taxi-traffic-75
251 Henao, A. (2017, January 19). Impacts of Ridesourcing – Lyft and Uber – on Transportation including VMT,
Mode Replacement, Parking, and Travel Behavior. Retrieved between September-December 2018 from
https://media.wix.com/ugd/c7a0b1_68028ed55eff47a1bb18d41b5fba5af4.pdf.
252 Henao, A. (2018, September 20). The impact of ride-hailing on vehicle miles traveled. Retrieved between
September-December 2018 from https://link.springer.com/article/10.1007/s11116-018-9923-2.
253 Schaller, B. (2017, February 27). Unsustainable?: The Growth of APP-Based Ride Services and Traffic, Travel
and the Future of New York City. Retrieved between September-December 2018 from http://www.
schallerconsult.com/rideservices/unsustainable.pdf.
254 Schaller, B. (2017, December 21). Empty Seats, Full Streets: Fixing Manhattan’s Traffic Problem. Retrieved
between September-December 2018 from http://schallerconsult.com/rideservices/emptyseats.pdf.
255 Barrios, J.M., Hochberg, Y.V., Yi, L.H. (2018). The Cost of Convenience: Ridesharing and Traffic Fatalities.
New Working Paper Series, no. 27. Retrieved between September-December 2018 from https://research.
chicagobooth.edu/-/media/research/stigler/pdfs/workingpapers/27thecostofconvenience.pdf.
256 Clewlow, R.R., Mishra, G.S. (2017, October). Disruptive Transportation: The Adoption, Utilization, and
Impacts of Ride-Hailing in the United States. Retrieved between September-December 2018 from https://
itspubs.ucdavis.edu/wp-content/themes/ucdavis/pubs/download_pdf.php?id=2752.
257 San Francisco County Transportation Authority. (2018, October). TNCs & Congestion. Retrieved between
September-December 2018 from https://www.sfcta.org/sites/default/files/content/Planning/TNCs/
TNCs_Congestion_Report_181015_Final.pdf.
258 Lyft. (2018, October 16). New! Subscribe and Save with the All-Access Plan. Lyft. Retrieved between
September-December 2018 from https://blog.lyft.com/posts/subscribe-and-save-with-the-all-access-
plan.
259 Hawkins, Andrew J. “Uber introduces an Amazon Prime-style monthly subscription service.” The Verge.
30 October 2018. Web. Retrieved between September-December 2018 from https://www.theverge.
com/2018/10/30/18042120/uber-ride-pass-monthly-subscription-cheap-fare.
260 Lyft. Official US Rules, n.d. Web. Retrieved between September-December 2018 from https://
ditchwithlyft.com/rules.

EMERGING MOBILITY TECHNOLOGIES AND TRENDS146
261 Kirkpatrick, D. “Dallas-based Ridesharing Startup Alto Raises $13M, Plans to Launch Next Month.”
Dallas Innovates. 16 October 2018. Web. Retrieved between September-December 2018 from
https://dallasinnovates.com/dallas-based-ride-sharing-startup-alto-raises-13m-plans-to-launch-next-
month/.
262 Hawkins, A.J. “California approves Flywheel, the app that makes taxis work like Uber.” The Verge. 22
December 2015. Web. Retrieved between September-December 2018 from https://www.theverge.
com/2015/12/22/10647506/flywheel-california-taxiOS-taxi-uber.
263 Bansal, A., Chan, N., Cohen, A., Shaheen, S. (2015, November). Shared Mobility: Definitions,
Industry Developments, and Early Understanding. Retrieved between September-December 2018
from http://innovativemobility.org/wp-content/uploads/2015/11/SharedMobility_WhitePaper_
FINAL.pdf.
264 Barzegar, A., Hasanpour, S., Mamdoohi, A., Seyedabrishami, S. “Impact of Carpooling on Fuel Saving in
Urban Transportation: Case Study of Tehran.” Procedia- Social and Behavioral Sciences vol 54 (2012)
323-331. Web. Retrieved between September-December 2018 from https://www.sciencedirect.com/
science/article/pii/S1877042812042139.
265 Conner-Simons, A. (2016, December 1). Study: carpooling apps could reduce taxi traffic 75%. MIT
Computer Science & Artificial Intelligence Lab. Retrieved between September-December 2018 from
https://www.csail.mit.edu/news/study-carpooling-apps-could-reduce-taxi-traffic-75.
266 Lien, T. “Waze will roll out its carpool app across California.” Los Angeles Times. 31 May 2001. Web.
Retrieved between September-December 2018 from https://www.latimes.com/business/technology/
la-fi-tn-waze-carpool-california-20170531-story.html.
267 Jon. (2016, March 21). Uber and Altamonte Springs launch pilot program to improve transportation
access. Uber Blog. Retrieved between September-December 2018 from https://www.uber.com/blog/
orlando/altamonte-springs/
268 Sisson, P. “This U.S. City Is Subsidizing Uber- Here’s Why.” Curbed. 22 March 2016. Web. Retrieved
between September-December 2018 from https://www.curbed.com/2016/3/22/11285802/uber-
transportation-subsidy-altamonte-spring.
269 Lynch, R. “See how many rides Uber generated through its Central Florida pilot program.” Orlando
Business Journal. 20 July 2018. Web. Retrieved between September-December 2018 from https://
www.bizjournals.com/orlando/news/2018/07/20/see-how-many-rides-uber-generated-through-its.
html.
270 City of Centennial, CO. (2017, June). Go Centennial Final Report. Retrieved between September-
December 2018 from http://www.centennialco.gov/uploads/files/Government/Iteam/Go%20
Centennial%20Final%20Report_for%20web.pdf.
271 City of Monrovia, CA. (n.d.). GoMonrovia. Retrieved between September-December 2018 from
https://www.cityofmonrovia.org/your-government/public-works/transportation/gomonrovia.
272 City of Monrovia, CA. (2018, March 14). City of Monrovia Set to Launch a New Model for Suburban
Mobility through Partnerships with Lyft and LimeBike. Retrieved between September-December 2018
from https://www.cityofmonrovia.org/Home/Components/News/News/2229/785.
273 Shared Use Mobility Center. (2016, March). Shared Mobility and the Transformation of Public
Transit. Retrieved between September-December 2018 from https://www.apta.com/resources/
reportsandpublications/Documents/APTA-Shared-Mobility.pdf.

ENDNOTES 147
274 Livingston, M., Schwieterman, J.P., Van Der Slot, S. (2018, August 1). Partners in Transit: A Review
of Partnerships between Transportation Network Companies and Public Agencies in the United States.
Retrieved between September-December 2018 from https://las.depaul.edu/centers-and-institutes/
chaddick-institute-for-metropolitan-development/research-and-publications/Documents/Partners%20
in%20Transit_Live1.pdf.
275 Nickelsburg, M. (2018, October 18). Seattle-area public transit adds Chariot micro-shuttles
in new mobility pilot. GeekWire. Retrieved between September-December 2018 from
https://www.geekwire.com/2018/seattle-area-public-transit-adds-chariot-micro-shuttles-new-
mobility-pilot/.
276 King County, WA. (2018, October 27). First- and last-mile solutions: King County Metro to launch ride-
hailing apps for on-demand shuttle service to transit. Retrieved between September-December 2018 from
https://www.kingcounty.gov/elected/executive/constantine/news/release/2018/October/17-metro-
shuttle-app.aspx.
277 Metro Board. (2018, October 18). 2018-0355 Mobility on Demand Pilot Project. Retrieved between
September-December 2018 from https://boardagendas.metro.net/board-report/2018-0355/.
278 Linton, J. (2018 October 18). Metro Set To Approve Mobility On Demand Pilot for Artesia, El Monte,
and NoHo. StreetsBlogLA. Retrieved between September-December 2018 from https://la.streetsblog.
org/2018/10/18/metro-set-to-approve-mobility-on-demand-pilot-for-artesia-el-monte-and-noho/.
279 VIA. (2017 November 17). LA Metro and Via Join Forces to offer Shared Rides to Select Transit Stations.
RideWithVia. Retrieved between September-December 2018 from https://ridewithvia.com/2017/11/la-
metro-via-join-forces-offer-shared-rides-select-transit-stations/.
280 Federal Transit Administration. “Mobility on Demand (MOD) Sandbox Program.” https://www.transit.
dot.gov/research-innovation/mobility-demand-mod-sandbox-program. 18 Dec. 2018.Web. Retrieved
between September-December 2018.
281 Linton, J. (2018 October 18). Metro Set To Approve Mobility On Demand Pilot for Artesia, El Monte,
and NoHo. StreetsBlogLA. Retrieved between September-December 2018 from https://la.streetsblog.
org/2018/10/18/metro-set-to-approve-mobility-on-demand-pilot-for-artesia-el-monte-and-noho/.
282 Descant, S. “ Transit and Ride-Sharing Partnerships on the Rise, Despite Growing Pains.” Govtech.com
GovTech Future Structure, 20 August 2018. Web. Retrieved between September-December 2018
from http://www.govtech.com/fs/transportation/Transit-and-Ride-Sharing-Partnerships-on-the-Rise-
Despite-Growing-Pains.html.
283 Wear, B. “Cap Metro dabbles in ride-hailing with new “Pickup” service.” Statesman, 25 September
2018. Web. Retrieved between September-December 2018 from https://www.statesman.com/
news/20170605/wear-cap-metro-dabbles-in-ride-hailing-with-new-pickup-service.
284 Shrikant, A. “The bus gets a lot of hate. American Cities are trying to change that.” Vox. 5 November
2018. Web. Retrieved between September-December 2018 from https://www.vox.com/the-
goods/2018/11/5/18057352/bus-stigma-public-transportation-micro-transit.
285 Livingston, M., Schwieterman, J.P., Van Der Slot, S. (2018, August 1). Partners in Transit: A Review
of Partnerships between Transportation Network Companies and Public Agencies in the United States.
Retrieved between September-December 2018 from https://las.depaul.edu/centers-and-institutes/
chaddick-institute-for-metropolitan-development/research-and-publications/Documents/Partners%20
in%20Transit_Live1.pdf.

EMERGING MOBILITY TECHNOLOGIES AND TRENDS148
286 Alley Metro. (n.d.). Valley Metro + Waymo announce technology & transit partnership. Valleymetro.
com. Retrieved between September-December 2018 from https://www.valleymetro.org/news/valley-
metro-waymo-announce-technology-transit-partnership
287 Waymo Team. (2018, July 31). Partnering with Valley Metro to explore public transportation
solutions. Medium. Retrieved between September-December 2018 from https://medium.com/waymo/
partnering-with-valley-metro-to-explore-public-transportation-solutions-ff01ae36484d.
288 Waymo.com Early Rider Program, n.d. Web. Retrieved between September-December 2018 from
https://waymo.com/apply/.
289 Mitchell, R. “Waymo One, the first commercial robotaxi service, is now picking up passengers in
Arizona.” Los Angeles Times. 5 December 2018. Web. Retrieved between September-December 2018
from https://www.latimes.com/business/autos/la-fi-hy-waymo-one-20181205-story.html.
290 Smith, K. “Narrow-Track Mobility: A four-wheel motorcycle.” MotorTrend. 15 July, 2004. Web.
Retrieved between September-December 2018 from https://www.motortrend.ca/en/news/volvo-
tandem/.
291 TWIZY.com TWIZY Electric, n.d. Web. Retrieved between September-December 2018 from https://
www.renault.co.uk/vehicles/new-vehicles/twizy.html.
292 Iyer, C. (2018, November). Driving Disruption: Catching the Next Wave of Growth in Electric Vehicles.
Retrieved between September-December 2018 from https://www.christenseninstitute.org/wp-
content/uploads/2018/11/Driving-Disruption.pdf.
293 Shoup, D. The High Cost of Free Parking. American Planning Association. 2005.
294 Wingfield, N. “Automakers Race to Get Ahead of Silicon Valley on Car-Sharing.” The New York Times.
8 June, 2017. Web. Retrieved between September-December 2018 from https://www.nytimes.
com/2017/06/08/technology/automakers-race-to-get-ahead-of-silicon-valley-on-car-sharing.html.
295 Martin, E. Shaheen, S. (2016, July). Impacts of Car2Go on Vehicle Ownership, Modal Shift, Vehicle Miles
Traveled, and Greenhouse Gas Emissions: An Analysis of Five North American Cities. Retrieved between
September-December 2018 from http://innovativemobility.org/wp-content/uploads/2016/07/
Impactsofcar2go_FiveCities_2016.pdf.
296 Aryafar, A. (2017, November 16). Carsharing Concept Gains Momentum in Condominium
Developments. Auto Rental News. Retrieved from https://www.autorentalnews.com/157800/
carsharing-concept-gains-momentum-in-condominium-developments.
297 Griswold, A. “Uber is launching a rental car service inside its app.” Quartz.com Quartz, 11 April,
2018. Web. Retrieved between September-December 2018 from https://qz.com/1250062/uber-is-
launching-uber-rent-a-rental-car-service-with-getaround/.
298 Maven. (2018, April 24). Maven Platform Lets GM Owners Share Cars, Earn Money. Retrieved between
September-December 2018 from https://media.gm.com/media/us/en/maven/pressroom.detail.html/
content/Pages/news/us/en/2018/jul/0724-maven.html.
299 O’Kane, S. “GM is letting more people rent their cars for money.” The Verge. 23 October,
2018. Web. Retrieved between September-December 2018 from https://www.theverge.
com/2018/10/23/18014166/maven-gm-peer-car-rental-sharing.
300 Cohen, A., Jaffee, M., Shaheen, S. (2018). Innovative Mobility: Carsharing Outlook. Transportation
Sustainability Research Center, doi:10.7922/G2CC0XVW. Retrieved between September-December
2018 from https://escholarship.org/uc/item/49j961wb.

ENDNOTES 149
301 Cox Automotive. “Mobility Services Becoming More Popular as Alternatives to Vehicle Ownership,
According to Cox Automotive Study.” Cox Automotive. 23, August 2018. Web. Retrieved between
September-December 2018 from https://www.coxautoinc.com/news/evolution-of-mobility-study-
alternatives-to-ownership/.
302 “Volvo’s subscription service copes with its success.” Automotive News. 12 November 2018. Web.
Retrieved between September-December 2018 from http://www.autonews.com/article/20181112/
RETAIL/181119952/volvo-care-subscription.
303 Gabbe, C.J., & Pierce, G. (2017). Hidden Costs and Deadweight Losses: Bundled Parking and
Residential Rents in the Metropolitan United States. Housing Policy Debate, 27(2), 217–229. Retrieved
between September-December 2018 from https://scholarcommons.scu.edu/cgi/viewcontent.
cgi?article=1040&context=ess.
304 Aryafar, A. “Carsharing Concept Gains Momentum in Condominium Developments.” Auto Rental News. 16
November 2017. Web. Retrieved between September-December 2018 from https://www.autorentalnews.
com/157800/carsharing-concept-gains-momentum-in-condominium-developments.
305 GM Corporate Newsroom. “GM Unveils ‘Let’s Drive NYC’ Car-sharing Program.” 01 October, 2015. Web.
Retrieved between September-December 2018 from https://media.gm.com/media/us/en/gm/home.
detail.html/content/Pages/news/us/en/2015/oct/1001-nyc-car-sharing.html.
306 Zipcar. “Equity Residential and Zipcar Announce Partnership To Bring Zipcars to Apartment Properties
in Top U.S. Cities.” PR Newswire. 03 May 2011. Web. Retrieved between September-December 2018
from https://www.prnewswire.com/news-releases/equity-residential-and-zipcar-announce-partnership-
to-bring-zipcars-to-apartment-properties-in-top-us-cities-121149349.html.
307 Walsh, A., Nigro, N. (2017 April). Lessons Learned From BlueIndy. Atlas Public Policy. Retrieved between
September-December 2018, from https://atlaspolicy.com/wp-content/uploads/2017/04/2017-04-06_
Lessons_Learned_from_BlueIndy.pdf.
308 Jolly, D., Cres, Y., Dimitriadis, S. (2015, June 12). Vincent Bolloré’s Long Bet on Solid-State Batteries for
Electric Cars. The New York Times. Retrieved between September-December 2018, from https://www.
nytimes.com/2015/06/13/business/international/vincent-bollores-long-bet-on-solid-state-batteries-
for-electric-cars.html.
309 Ibid.
310 Walsh, A., Nigro, N. (2017 April). Lessons Learned From BlueIndy. Atlas Public Policy. Retrieved between
September-December 2018, from https://atlaspolicy.com/wp-content/uploads/2017/04/2017-04-06_
Lessons_Learned_from_BlueIndy.pdf.
311 Swiatek, J. (2014, May 19). Indy starts BlueIndy, all-electric ‘car share’ program. Indy Star. Retrieved
between October-December 2018, from: https://www.indystar.com/story/news/politics/2014/05/19/
indy-starting-electric-car-share-program/9275179/.
312 Jolly, D., Cres, Y., Dimitriadis, S. (2015, June 12). Vincent Bolloré’s Long Bet on Solid-State Batteries for
Electric Cars. The New York Times. Retrieved between September-December 2018, from https://www.
nytimes.com/2015/06/13/business/international/vincent-bollores-long-bet-on-solid-state-batteries-
for-electric-cars.html.
313 Walsh, A., Nigro, N. (2017 April). Lessons Learned From BlueIndy. Atlas Public Policy. Retrieved between
September-December 2018, from https://atlaspolicy.com/wp-content/uploads/2017/04/2017-04-06_
Lessons_Learned_from_BlueIndy.pdf.

EMERGING MOBILITY TECHNOLOGIES AND TRENDS150
314 Erdody, L. (2016, September 19). BlueIndy considering expansion into Carmel. Indianapolis Business
Journal. Retrieved September-December 2018, from https://www.ibj.com/blogs/11-north-of-96th-
lindsey/post/60434-blueindy-considering-expansion-into-carmel.
315 Melillo, J. (2016, October 7). Indianapolis reaches new agreement with BlueIndy. WISHTV. Retrieved
September-December 2018, from https://www.wishtv.com/news/indianapolis-reaches-new-agreement-
with-blueindy/1064284106.
316 Kryah, K. (2016, August 2). Smart CityScape Series: Indianapolis Part 3 - Transforming Transit. Smart
Resilient Cities. Retrieved September-December 2018, from http://www.smartresilient.com/smart-
cityscape-series-indianapolis-part-3-transforming-transit.
317 Walsh, A., Nigro, N. (2017 April). Lessons Learned From BlueIndy. Atlas Public Policy. Retrieved between
September-December 2018, from https://atlaspolicy.com/wp-content/uploads/2017/04/2017-04-06_
Lessons_Learned_from_BlueIndy.pdf.
318 Fischer-Baum, R. (2014, July 31). How Your City’s Public Transit Stacks Up. FiveThirtyEight. Retrieved
September-December 2018, from https://fivethirtyeight.com/features/how-your-citys-public-transit-
stacks-up/.
319 The City of Indianapolis Department of Metropolitan Development. (2016, February 4). Indianapolis
Smart Corridors. Retrieved September-December 2018, from https://cms.dot.gov/sites/dot.gov/files/
docs/IN%20Indianapolis.pdf.
320 Ibid.
321 IBM. (n.d.) Retrieved between September-December 2018 from https://www-01.ibm.com/software/
data/bigdata/what-is-big-data.html.
322 Krzanich, B. “Data is the New Oil in the Future of Automated Driving.” Intel Newsroom. 15 November,
2016. Web. Retrieved between September-December 2018 from https://newsroom.intel.com/
editorials/krzanich-the-future-of-automated-driving/.
323 APTIV Media (2018, January 11). Aptiv’s Smart Mobility Architecture unlocks features, solves industry’s
toughest challenges. APTIV.com. Web. Retrieved between September-December 2018 from https://
www.aptiv.com/media/article/2018/01/11/aptiv-s-smart-mobility-architecture-unlocks-features-
solves-industry-s-toughest-challenges.
324 Woyke, E. “The secret data collected by dockless bikes is helping cities map your movement.” Technology
Review. 28 September, 2018. Web. Retrieved between September-December 2018 from https://www.
technologyreview.com/s/612123/the-secret-data-collected-by-dockless-bikes-is-helping-cities-map-
your-movement/.
325 Clewlow, R. “The opportunity to reshape cities with shared mobility data.” Forbes. 10 October
2018. Web. Retrieved between September-December 2018 from https://www.forbes.com/sites/
reginaclewlow/2018/10/10/the-opportunity-to-reshape-cities-with-shared-mobility-data/#7e5fa4da617f.
326 Toesland, F. MaaS: Changing the way you travel. Raconteur. 11 September, 2018. Web. Retrieved
between September-December 2018 from https://www.raconteur.net/technology/maas-changing-
travel.
327 Clewlow, R. “The opportunity to reshape cities with shared mobility data.” Forbes. 10 October
2018. Web. Retrieved between September-December 2018 from https://www.forbes.com/
sites/reginaclewlow/2018/10/10/the-opportunity-to-reshape-cities-with-shared-mobility-
data/#7e5fa4da617f.

ENDNOTES 151
328 National Conference of State Legislatures. “Carsharing: State Laws and Legislation.” 2 February
2017. Web. Retrieved between September-December 2018 from http://www.ncsl.org/research/
transportation/car-sharing-state-laws-and-legislation.aspx.
329 Gilbertson, J., Strand, E. “New mobility dashboard for JUMP electric bikes.” Uber Newsroom, 25
October, 2018. Web. Retrieved between September-December 2018 from https://www.uber.com/
newsroom/mobility-dashboard-for-jump-bikes/.
330 Ford (26 September 2018). Ford, Uber and Lyft announce agreement to share data through new
platform that gives cities and mobility companies new tools to manage congestion, cut greenhouse gases
and reduce crashes. Web. Retrieved between September-December 2018 from https://media.ford.com/
content/fordmedia/fna/us/en/news/2018/09/26/ford-uber-and-lyft-agreement-data.html.
331 Sharedstreets. (n.d.). Retrieved between September-December 2018 from https://sharedstreets.io/.
332 Clelow, R. Introducing Populus Mobility Manager: An Advanced Data Platform for the Future of Cities.
Medium, 18 September, 2018. Web. Retrieved between September-December 2018 from https://
medium.com/populus-ai/https-medium-com-populus-ai-introducing-populus-mobility-manager-
6febabc63c1b.
333 Cision PRweb (9 November, 2018). United for Safer Streets, Scooter and Bike Companies Join
Forces with LADOT and Remix to Improve Data Sharing for City Planning. Web. Retrieved between
September-December 2018 from https://www.prweb.com/releases/united_for_safer_streets_scooter_
and_bike_companies_join_forces_with_ladot_and_remix_to_improve_data_sharing_for_city_planning/
prweb15904479.htm
334 NREL. (n.d.). Truck Platooning Evaluations. Retrieved between September-December 2018 from https://
www.nrel.gov/transportation/fleettest-platooning.html.
335 Wollenhaupt, G. (17 April 2017). Telematics lays the foundation for autonomous trucking. Samsung.
Web. Retrieved between September-December 2018 from https://insights.samsung.com/2017/04/17/
telematics-lays-the-foundation-for-autonomous-trucking/.
336 Gilroy, R. “Peloton to Launch Platooning by End of 2018.” Transport Topics. 7 May 2018. Web. Retrieved
between September-December 2018 from https://www.ttnews.com/articles/peloton-launch-
platooning-end-2018.
337 Knowledge Center Technology. (29 August 2018). Retrieved between September-December 2018 from
https://www.hva.nl/kc-techniek/gedeelde-content/contentgroep/levv/levv.html.
338 MHI. The 2018 MHI Annual Industry Report - Overcoming Barriers to NextGen Supply Chain Innovation.
n.d. Retrieved between September-December 2018 from https://www.mhi.org/publications/report.
339 Joerss, M., Neuhaus, F., Schroder, J. “How customer demands are reshaping last-mile delivery.”
McKinsey, October 2016. Web. Retrieved between September-December 2018 from https://www.
mckinsey.com/industries/travel-transport-and-logistics/our-insights/how-customer-demands-are-
reshaping-last-mile-delivery.
340 KPMG. (2017). Islands of autonomy: How autonomous vehicles will emerge in cities around the world.
Retrieved between September-December 2018 from https://assets.kpmg.com/content/dam/kpmg/za/
pdf/2017/11/islands-of-autonomy-web.pdf.
341 Schwartz, T. “Personal Delivery Devices (PDD): New transportation frontiers emerge for autonomous
vehicle rulemakers.” Morrison Foerester. 2 March 2018. Web. Retrieved between September-December
2018 from https://www.mofo.com/resources/publications/180302-personal-delivery-devices.html.

EMERGING MOBILITY TECHNOLOGIES AND TRENDS152
342 Sawers, P. “Starship Technologies launches autonomous robot delivery services for campuses.” VB
Venture Beat, 30 April 2018. Web. Retrieved between September-December 2018 from https://
venturebeat.com/2018/04/30/starship-technologies-launches-autonomous-robot-delivery-services-
for-campuses/.
343 DesignBloom. (n.d.) “Starship technologies plans to bring a fleet of delivery drones to the streets.” Web.
Retrieved between September-December 2018 from https://www.designboom.com/technology/
starship-technologies-delivery-drones-11-02-2015/.
344 Kharagorgiiev, S. (2017). Chief Computer Vision Engineer at Starship Technologies - Self-driving robots
for revolutionary local delivery. [Online video]. Retrieved between September-December 2018 from
https://www.slideshare.net/Codiax/sergii-kharagorgiiev-chief-computer-vision-engineer-at-starship-
technologies-selfdriving-robots-for-revolutionary-local-delivery.
345 Washington D.C. Personal Delivery Device Pilot Program Act of 2016 amendment. Retrieved
between September-December 2018 from http://lims.dccouncil.us/Download/39408/B22-0625-
SignedAct.pdf.
346 Wood, C. “Sidewalk robot test program extended in Washington, D.C., with strong government support.”
Statescoop, 1 March 2018. Web. Retrieved between September-December 2018 from https://
statescoop.com/sidewalk-robots-dc-starship-technologies-extended.
347 Starship Deliveries. (n.d.). Retrieved between September-December 2018 from https://
starshipdeliveries.com/.
348 Sheth, S. “The Robots Are Coming! Yelp Eat24 Launches Robot Delivery Pilot With Marble In San
Francisco.” Yelp, 12 April 2017. Web. Retrieved between September-December 2018 from https://www.
yelpblog.com/2017/04/robots-coming-yelp-eat24-launches-robot-delivery-pilot-marble-san-francisco.
349 Smith, C. “What you need to know about the delivery robots heading to dallas.” The Dallas Morning
News, 17 October 2018. Web. Retrieved between September-December 2018 from https://www.
dallasnews.com/news/dallas-city-hall/2018/10/17/need-know-delivery-robots-heading-dallas.
350 Rambin, J. “Austin City Council Approves Delivery Robot Pilot Program.” Towers, 10 August 2017. Web.
Retrieved between September-December 2018 from https://austin.towers.net/austin-city-council-
approves-delivery-robot-pilot-program/.
351 Postmates. (n.d.). Retrieved between September-December 2018 from https://serve.postmates.com/.
352 PepsiCo. “PepsiCo’s Hello Goodness snackbot is Off to College.” PR Newswire, 3 January 2019. Web.
Retrieved between September-December 2018 from https://www.prnewswire.com/news-releases/
pepsicos-hello-goodness-snackbot-is-off-to-college-300772246.html.
353 Daimler. (n.d.). Retrieved between September-December 2018 from https://media.daimler.com/
marsMediaSite/en/instance/ko/Mercedes-Benz-Vans-invests-in-Starship-Technologies-the-worlds-
leading-manufacturer-of-delivery-robots.xhtml.
354 Martin, T. “The Coming Battle Over the Car Cockpit.” The Wall Street Journal. 12 November 2018. Web.
Retrieved between September-December 2018 from https://www.wsj.com/articles/the-coming-battle-
over-the-car-cockpit-1542037395.
355 Ibid.
356 Williams, R. “How in-car tech will give new meaning to ‘mobile commerce’.” Mobile Marketer, 27 August
2018. Web. Retrieved between September-December 2018 from https://www.mobilemarketer.com/
news/how-in-car-tech-will-give-new-meaning-to-mobile-commerce/530422/.

ENDNOTES 153
357 “Visa, Pizza Hut and Accenture Develop Connected Car Commerce Experience.” Business
Wire, 2 March, 2015. Web. Retrieved between September-December 2018 from https://www.
businesswire.com/news/home/20150302006046/en/Visa-Pizza-Hut-Accenture-Develop-
Connected-Car.
358 Juniper Research. (n.d.). Retrieved between September-December 2018 from https://www.
juniperresearch.com/researchstore/iot-m2m/consumer-connected-cars.
359 Reid, C. “Cargobikes Not Drones Are The Future For Urban Deliveries.” Forbes, 15 October
2018. Web. Retrieved between September-December 2018 from https://www.forbes.
com/sites/carltonreid/2018/10/15/cargobikes-not-drones-are-the-future-for-urban-
deliveries/#62441e63e790.
360 Volkswagen. Volkswagen Commercial Vehicles is electrifying the 2018 IAA with five new zero-
emission models. (2018, September 19). Retrieved from https://www.automotiveworld.com/
news-releases/volkswagen-commercial-vehicles-is-electrifying-the-2018-iaa-with-five-new-zero-
emission-models/.
361 Tern Bicycles. (n.d.). Retrieved between September-December 2018 from https://www.ternbicycles.
com/us/bikes/gsd.
362 Peters, A. “UPS is experimenting with delivering packages by e-bike.” Fast Company, 25 October 2018.
Web. Retrieved between September-December 2018 from https://www.fastcompany.com/90254825/
ups-is-experimenting-with-delivering-packages-by-e-bike.
363 Descant, S. “Seattle becomes latest test site for Cargo e-Bikes.” Future Structure, 30 October 2018.
Web. Retrieved between September-December 2018 from http://www.govtech.com/fs/transportation/
Seattle-Becomes-Latest-Test-Site-for-Cargo-e-Bikes.html.
364 Peters, A. “UPS is experimenting with delivering packages by e-bike.” Fast Company, 25 October 2018.
Web. Retrieved between September-December 2018 from https://www.fastcompany.com/90254825/
ups-is-experimenting-with-delivering-packages-by-e-bike.
365 Milan, J. “Delivering difference: Mailing services uses e-biked to move mail at UW.” University of
Washington, 18 November 2018. Web. Retrieved between September-December 2018 from https://
green.uw.edu/blog/2018-11/delivering-difference-mailing-services-uses-e-bikes-move-mail-uw.
366 Lin, Y., Ma, M., Wang, P. “Intelligent Transportation Systems (ITS): Concept, Challenge, and Opportunity. IEE
Explore, 2017. Web. Retrieved between September-December 2018 from https://ieeexplore.ieee.org/
document/7980336.
367 ABI Research, 22 August 2018. “Transforming Traffic Management Industry to Generate over US$6
Billion in System Revenues by 2023.” Web. Retrieved between September-December 2018 from https://
www.abiresearch.com/press/transforming-traffic-management-industry-generate-over-us6-billion-
system-revenues-2023/.
368 Descant, S. “How Transit Is Turning to Tech to Cut Through Congestion.” Future Structure, 15 November
2018. Web. Retrieved between September-December 2018 from http://www.govtech.com/fs/
infrastructure/How-Transit-is-Turning-to-Tech-to-Cut-Through-Congestion---.html.
369 Piyush, R. “Connected Signals enables real-time, predictive traffic signal information.” (2018, August
29). Telematics Wire. Retrieved from http://www.telematicswire.net/connected-vehicles-with-internet-
access-or-wireless-local-area-network-lte/connected-signals-enables-real-time-predictive-traffic-
signal-information-in-gainesville/.

EMERGING MOBILITY TECHNOLOGIES AND TRENDS154
370 Tonguz, O. “How Vehicle-to-Vehicle Communication Could Replace Traffic Lights and Shorten
Commutes.” IEEE Spectrum, 25 September 2018. Web. Retrieved between September-December 2018
from https://spectrum.ieee.org/transportation/infrastructure/how-vehicletovehicle-communication-
could-replace-traffic-lights-and-shorten-commutes.
371 Turner, M. “The Fundamental Law of Road Congestion and Its Implications for Transportation Policy.”
Resources for the Future, 19 February 2010. Web. Retrieved between September-December
2018 from http://www.rff.org/blog/2010/fundamental-law-road-congestion-and-its-implications-
transportation-policy.
372 Hall, H. “Expert: Autonomous vehicles should help traffic, but not anytime soon.” Vanderbilt Research
News, 30 April 2018. Web. Retrieved between September-December 2018 from https://news.
vanderbilt.edu/2018/04/30/expert-autonomous-vehicles-could-help-traffic-but-not-anytime-soon/.
373 Schmitt, A. “Portland will grow- but without adding cars.” Streetsblog USA, 16 November, 2018. Web.
Retrieved between September-December 2018 from https://usa.streetsblog.org/2018/11/16/how-
portland-plans-to-grow-its-downtown-without-adding-cars/.
374 Grobart, S. “Five Ways to Redesign Cities for the Scooter Era.” Bloomberg, 16 October 2018.
Web. Retrieved between September-December 2018 from https://www.bloomberg.com/news/
articles/2018-10-16/five-ways-to-redesign-cities-for-the-scooter-era.
375 Rapier, G. “Waymo is worth $100 billion more than previous estimates, Morgan Stanley says (GOOGL).”
Business Insider, 7 August 2018. Web. Retrieved between September-December 2018 from https://
markets.businessinsider.com/news/stocks/google-stock-price-waymo-worth-100-billion-more-than-
before-morgan-stanley-2018-8-1027439248.
376 Joshi, S., Mitchell, K., Parker, A. “The craft of incentive prize design.” Deloitte Insights, 18 June 2014.
Web. Retrieved between September-December 2018 from https://www2.deloitte.com/insights/us/en/
topics/social-impact/the-craft-of-incentive-prize-design.html.
377 Progressive Automotive XPRIZE. (n.d.). Retrieved between September-December 2018 from https://
auto.xprize.org/prizes/auto.
378 Office of Energy Efficiency & Renewable Energy. “The U.S. Department of Energy, General Motors and
MathWorks Launch EcoCAR Mobility Challenge.” Office of Energy Efficiency & Renewable Energy, 24
October 2018. Web. Retrieved between September-December 2018 from https://www.energy.gov/
eere/articles/us-department-energy-general-motors-and-mathworks-launch-ecocar-mobility-challenge.
379 Happich, J. “Blockchain-connected autonomous vehicles for a congestion-free future.” EE News
Europe, 11 October 2018. Web. Retrieved between September-December 2018 from http://www.
eenewseurope.com/news/blockchain-connected-autonomous-vehicles-congestion-free-future.
380 Mobi Grand Challenge. (n.d.). Retrieved between September-December 2018 from https://mobihacks.
devpost.com/.
381 SAE AutoDrive Challenge: Year 1. (n.d.). Retrieved between September-December 2018 from https://
www.sae.org/attend/student-events/autodrive-challenge/.
382 GigabitDCx. (n.d.). Retrieved between September-December 2018 from https://www.herox.com/
gigabitDCx.
383 Ewing, J. “Formula E racing series paves the way to a battery-powered future.” New York Times, 5 July,
2018. Web. Retrieved between September-December 2018 from https://www.seattletimes.com/
business/formula-e-racing-series-paves-the-way-to-a-battery-powered-future/.

ENDNOTES 155
384 Hanley, S. “Williams Formula E Experience will make better EV battery possible.” Gas2, 27 April 2017.
Web. Retrieved between September-December 2018 from http://gas2.org/2017/04/27/wiliams-
formula-e-experience-better-ev-battery/.
385 Mitchell, S. “Formula E to keep standard battery until at least 2025.” Motorsport, 9 December 2017.
Web. Retrieved between September-December 2018 from https://www.motorsport.com/us/formula-e/
news/fe-battery-supplier-competition-987025/1382883/.
386 Brunsdon, S., Mitchell, S. “Battery war could ‘nearly double’ Formula E budgets- Renault.” Autosport, 21
November 2017. Web. Retrieved between September-December 2018 from https://www.autosport.
com/fe/news/133183/battery-war-could-nearly-double-fe-budgets.
387 BBC News, 9 August 2018. New York votes to cap Uber and Lyft services.” Web. Retrieved between
September-December 2018 from https://www.bbc.com/news/world-us-canada-45123806.
388 Tchekmedyian, A. “Beverly Hills City Council Approves six-month ban on electric scooters.” LA Times. 25
June 2018. Web. Retrieved between September-December 2018 from http://www.latimes.com/local/
lanow/la-me-ln-scooters-beverly-hills-20180724-story.html.
389 Korte, A. “Chicago Alderman Propose Ban on Driverless Cars.” Illinois Policy, 15 September 2016. Web.
Retrieved from https://www.illinoispolicy.org/chicago-aldermen-propose-ban-on-driverless-cars/
390 Nusca, A. (2018, October 10). Bird CEO: ‘The Places Where There Are No Laws, That’s Where We Go
In’. Fortune. Retrieved September-December 2018, from http://fortune.com/2018/10/09/bird-ceo-
scooters-laws
391 KQED News. Oakland City Council Approves New Electric Scooter Regulations. (2018, September
18). Retrieved September-December 2018, from https://www.kqed.org/news/11692906/oaklands-
proposed-scooter-rules-focus-on-access-for-underserved-neighborhoods
392 Sakoui, A & Pettersson, E. (2018, June 12). Now the Personal Injury Lawyers Have Scooters in Their
Sights. Bloomberg. Retrieved September-December 2018, from https://www.bloomberg.com/news/
articles/2018-06-12/now-the-personal-injury-lawyers-have-scooters-in-their-sights
393 Holley, P. (2018, October 20). Class-action Lawuit Accuses E-scooter Companies of ‘Gross Negligence.’
The Washington Post. Retrieved September-December 2018, from https://www.washingtonpost.com/
technology/2018/10/20/class-action-lawsuit-accuses-e-scooter-companies-gross-negligence/
394 Sisson, P. (2018, October 17). Scooter Companies, Seeking to Shape Regulations, Hire Transit Advocates.
Curbed. Retrieved September-December 2018, from https://www.curbed.com/2018/10/17/17990972/
transportation-scooters-bird-lime-government-policy
395 Foxx, A. (2018, October 9). Why I’m Joining Lyft. Medium. Retrieved September-December 2018, from
https://medium.com/@Anthony_Foxx/why-im-joining-lyft-cd0a91b47725
396 Walker, A. (2018, December 7). New Lyft App Will Give Directions to Scooters, Public Transit Across L.A.
Curbed. Retrieved September-December 2018, from https://la.curbed.com/2018/9/14/17861416/lyft-
scooters-app-santa-monica-transit
397 Colon, D. (2018, October 4). Interview: Paul Steely White Says Goodbye to Transportation Alternatives.
Curbed. Retrieved September-December 2018, from https://ny.curbed.com/2018/10/4/17938028/nyc-
safe-streets-transportation-alternatives-paul-steely-white
398 Lobbying Registration. (2018, August 30). Akin Gump Strauss Hauer & Feld. Retrieved from https://
soprweb.senate.gov/index.cfm?event=getFilingDetails&filingID=C87E1A05-8438-474D-9914-
D5BF71C9BDF4&filingTypeID=1

EMERGING MOBILITY TECHNOLOGIES AND TRENDS156
399 Bird. (2018, August 29). Bird Announces New GovTech Products and Team; Cities Primary Customer for
New Offerings. Retrieved September-December 2018, from https://www.bird.co/blog/bird-announces-
new-govtech-products-and-team-cities-primary-customer-for
400 Migurski, M. (2018, October 17). Mobility Brief #2: Micromobility Data Policies: A Survey of City Needs.
Medium. Retrieved September-December 2018, from https://blog.remix.com/micromobility-data-policy-
survey-7adda2c6024d
401 National League of Cities: Center for City Solutions and Applied Research (2015). City of the Future:
Technology & Mobility. Retrieved September-December 2018, from https://www.nlc.org/sites/default/
files/2016-12/City%20of%20the%20Future%20FINAL%20WEB.pdf
402 Autonomous Vehicles (2018, November 7). Retrieved September-December 2018, from
http://www.ncsl.org/research/transportation/autonomous-vehicles-self-driving-vehicles-enacted-
legislation.aspx
403 West, D. (2018, July 23). Brookings Survey Finds only 21 Percent Willing to Ride in a Self-driving
Car. Brookings. Retrieved September-December 2018, from https://www.brookings.edu/blog/
techtank/2018/07/23/brookings-survey-finds-only-21-percent-willing-to-ride-in-a-self-driving-car/
404 U.S. Department of Transportation (2018, October 4). U.S. Department of Transportation Releases
Preparing for the Future of Transportation” Automated Vehicles 3.0.” Retrieved September-December
2018, from https://www.transportation.gov/briefing-room/automated-vehicles
405 National League of Cities (2018, October 17). National League of Cities Unveils Definitive Guide to Piloting
Autonomous Vehicles. Retrieved September-December 2018, from https://www.nlc.org/article/national-
league-of-cities-unveils-definitive-guide-to-piloting-autonomous-vehicles
406 Rainwater, B & DuPuis, N. (2018, October 23). Cities Have Taken the Lead in Regulating Driverless
Vehicles. CityLab. Retrieved September-December 2018, from https://www.citylab.com/
perspective/2018/10/cities-lead-regulation-driverless-vehicles/573325/
407 National Highway Traffic Safety Administration (2017, January 12). Federal Motor Vehicle Safety
Standards; V2V Communications. Federal Register. Retrieved September-December 2018 from
https://www.federalregister.gov/documents/2017/01/12/2016-31059/federal-motor-vehicle-safety-
standards-v2v-communications
408 Schwartz, T. (2018, March 2). Personal Delivery Devices (PDD): New Transportation
Frontiers Energy for Autonomous Vehicle Rulemakers. Morrison Foerster. Retrieved September-
December 2018, from https://www.mofo.com/resources/publications/180302-personal-delivery-
devices.html
409 New California Law Regulates Ridesharing Emissions (2018, September 14). Auto Rental News.
Retrieved September-December 2018 from https://www.autorentalnews.com/313413/new-california-
law-regulates-ridesharing-emissions
410 Car Sharing (2017, February 16). Retrieved September-December 2018, from http://www.ncsl.org/
research/transportation/car-sharing-state-laws-and-legislation.aspx
411 Marshall, A. (2018, August 8). New York City Goes After Uber and Lyft. Wired. Retrieved September-
December 2018, from https://www.wired.com/story/new-york-city-cap-uber-lyft/
412 Hu, W. (2018, September 16). Uber Will Spend $10 Million to Solve a Problem It Helped Create. The
New York Times. Retrieved September-December 2018, from https://www.nytimes.com/2018/09/26/
nyregion/uber-city-congestion.html

ENDNOTES 157
413 California Environmental Protection Agency (2003). 2003 Zero Emission vehicle Program
Changes. Retrieved September-December 2018, from https://www.arb.ca.gov/msprog/zevprog/
factsheets/2003zevchanges.pdf
414 Environmental Protection Agency (n.d.). Sources of Greenhouse Gas Emissions. Retrieved September-
December 2018, from https://www.epa.gov/ghgemissions/sources-greenhouse-gas-emissions.
415 California Air Resources Board (2018, December 2018). Proposed Innovative Clean Transit Regulation, a
Replacement of the Fleet Rule for Transit Agencies. Retrieved September-December 2018, from https://
www.arb.ca.gov/regact/2018/ict2018/ict2018.htm
416 Schneider, B. (2018, June 21). Why Little Vehicles Will Conquer the City. CityLab. Retrieved September-
December 2018, from https://www.citylab.com/transportation/2018/06/welcome-to-the-tiny-vehicle-
age/563342/.
417 Coren, M. (2018, August 7). Nine Countries Say They’ll Ban Internal Combustion Engines. So Far,
It’s Just Words. Quartz. Retrieved September-December 2018, from https://qz.com/1341155/nine-
countries-say-they-will-ban-internal-combustion-engines-none-have-a-law-to-do-so/.
418 Chester Energy and Policy (2018, June 11). The Electric Scooter Fallacy: Just Because They’re Electric
Doesn’t Mean They’re Green. Retrieved September-December 2018, from http://chesterenergyandpolicy.
com/2018/06/11/the-electric-scooter-fallacy-just-because-theyre-electric-doesnt-mean-theyre-green/.
419 National Highway Traffic Safety Administration (2018, October 3). U.S. DOT Announces 2017 Roadway
Fatalities Down. Retrieved September-December 2018, from https://www.nhtsa.gov/press-releases/us-
dot-announces-2017-roadway-fatalities-down.
420 Smith, B. (2013, December 18). Human Error as a Cause of Vehicle Crashes. The Center for Internet and
Society. Retrieved September-December 2018, from https://cyberlaw.stanford.edu/blog/2013/12/
human-error-cause-vehicle-crashes.
421 Insurance Institute for Highway Safety & Highway Loss Data Institute (2017, August 23). Stay Within
the Lines: Lane Departure Warning, Blind Spot Detection Help Drivers Avoid Trouble. Status Report
52(6). Retrieved September-December 2018, from https://www.iihs.org/iihs/news/desktopnews/stay-
within-the-lines-lane-departure-warning-blind-spot-detection-help-drivers-avoid-trouble.
422 Insurance Institute for Highway Safety & Highway Loss Data Institute (2016, January 28). Crashes
Avoided. Status Report 51(1).Retrieved September-December 2018, from https://cdn1.vox-cdn.com/
uploads/chorus_asset/file/5970439/FCP_SR_012816.0.pdf.
423 Hudson, C.R., Deb S., Carruth, D.W., McGinley, J., Frey, D. (2018, June 26). Pedestrian Perception
of Autonomous Vehicles with External Interacting Features. Advances in Human Factors and
Systems Interaction 781. Retrieved September-December 2018, from https://link.springer.com/
chapter/10.1007%2F978-3-319-94334-3_5.
424 Sun, T. (2018, November 5). Respect the Ride: Continuing Lime’s Commitment to Rider Safety and
Education. LimeNews. Retrieved September-December 2018, from https://www.li.me/blog/respect-the-
ride-lime-commitment-rider-safety-education.
425 Dobbs, R., Remes, J., Manyika, J., Roxburgh, C., Smit, S., Schaer, F. (2012, June). Urban World: Cities and
the Rise of the Consuming Class. McKinsey. Retrieved September-December 2018, from https://www.
mckinsey.com/~/media/McKinsey/Featured%20Insights/Urbanization/Urban%20world%20Cities%20
and%20the%20rise%20of%20the%20consuming%20class/MGI%20Urban%20world_Executive%20
Summary_June%202012.ashx.

EMERGING MOBILITY TECHNOLOGIES AND TRENDS158
426 United Nations Department of Economic and Social Affairs (2018, May 16). 68% of the World Population
Projected to Live in Urban Areas by 2050, Says UN. Retrieved September-December 2018, from https://
www.un.org/development/desa/en/news/population/2018-revision-of-world-urbanization-prospects.
html.
427 Eden Strategy Institute & ONG&ONG Pte Ltd. (2018). Top 50 Smart City Governments. Retrieved
September-December 2018, from https://www.smartcitygovt.com/.
428 Wazir, B. (2018, February 21). Future Cities Have to Get Even Smarter. Raconteur. Retrieved
September-December 2018, from https://www.raconteur.net/digital-transformation/future-cities-
get-even-smarter.
429 Park, K. & Chia, K. (2018, June 4). Singapore Built a Dedicated Town for Self-Driving Buses. Bloomberg.
Retrieved September-December 2018, from https://www.bloomberg.com/news/features/2018-06-04/
singapore-built-a-town-to-test-autonomous-self-driving-vehicles.
430 U.S. Department of Transportation (2017, June 29). Smart City Challenge. Retrieved September-
December 2018, from https://www.transportation.gov/smartcity.
431 Smart Columbus (n.d.). Our Path to Smart: Bringing the Future to Others. Retrieved September-December
2018, from https://smart.columbus.gov/playbook/.
432 Vock, D. (2016, June 23). Why Columbus Won the Smart City Challenge. Governing. Retrieved
September-December 2018, from http://www.governing.com/topics/transportation-infrastructure/gov-
columbus-ohio-smart-city-winner.html.
433 Smart Cities Council (2018, October 18). Smart Cities Council Launches Annual Readiness Challenge to
Advance Smart Cities. Retrieved September-December 2018, from https://na.smartcitiescouncil.com/
article/smart-cities-council-launches-annual-readiness-challenge-advance-smart-cities.
434 Ebi, K. (2018, March 8). Meet Our 2018 Smart Cities Council Readiness Challenge Winners. Retrieved
September-December 2018, from https://na.smartcitiescouncil.com/article/meet-our-2018-smart-
cities-council-readiness-challenge-winners.
435 Bennet, S. (2018, September 5). Commentary: IEA Steps Up its Work on Energy Innovation as Money Flows
into New Energy Tech Companies. Retrieved September-December 2018, from https://www.iea.org/
newsroom/news/2018/september/commentary-iea-steps-up-its-work-on-energy-innovation-as-money-
flows-into-new-en.html.
436 Kerry, C.F. & Karsten, J. (2017, October 16). Gauging Investment in Self-Driving Cars. Brookings.
Retrieved September-December 2018, from https://www.brookings.edu/research/gauging-investment-
in-self-driving-cars/.
437 Kokalitcheva, K. (2018, October 27). Billions of Dollars Pour into Autonomous Vehicle Technology. Axios.
Retrieved September-December 2018, from https://www.axios.com/autonomous-vehicles-technology-
investment-7a6b40d3-c4d2-47dc-98e2-89f3120c6d40.html.
438 Rowley, J.D. (2018, November 29). Transportation Startups Accelerate past SaaS in VC Funding
Frequency Metrics. Crunchbase News. Retrieved September-December 2018, from https://news.
crunchbase.com/news/transportation-startups-accelerate-past-saas-in-vc-funding-frequency-metrics/.
439 Bird: Overview (n.d.). Crunchbase. Retrieved September-December 2018, from https://www.crunchbase.
com/organization/bird.
440 Lime: Overview (n.d.). Crunchbase. Retrieved September-December 2018, from https://www.
crunchbase.com/organization/limebike#section-overview.

ENDNOTES 159
441 Dowd, K. (2018, September 21). The Future of Urban Mobility Has Two Wheels (or so VCs Think).
PitchBook. Retrieved September-December 2018, from https://pitchbook.com/news/articles/the-future-
of-urban-mobility-has-two-wheels-or-so-vcs-think.
442 Pictet (2018, August 24). Pictet Asset Management is Launching SmartCity, a New Thematic Fund.
Retrieved September-December 2018, from https://www.group.pictet/media-relations/pictet-asset-
management-launching-smartcity-new-thematic-fund.
443 Finally: A Real Solution to First and Last Mile Trips (2018, November 27). Medium. Retrieved September-
December 2018, from https://medium.com/transit-app/finally-a-real-solution-to-first-and-last-mile-
trips-adedbdcd8bb9.
444 Smart Cities World News Team (2018, November 27). Mobility App Aims to Cut the U.S. Carbon Footprint.
Retrieved September-December 2018, from https://www.smartcitiesworld.net/news/mobility-app-
aims-to-cut-the-us-carbon-footprint-3604.
445 HERE Mobility (2019, January 7). HERE Mobility Launches SoMo, First-of-its-Kind Consumer App,
Making Mobility Social. PR Newswire. Retrieved September-December 2018, from https://www.
prnewswire.com/news-releases/here-mobility-launches-somo-first-of-its-kind-consumer-app-making-
mobility-social-840173456.html.
446 Descant, S. (2018, August 9). L.A. Metro Readies Launch of Multi-Purpose Mobility Payment Card.
GovTech. Retrieved September-December 2018, from http://www.govtech.com/fs/insights/LA-Metro-
Readies-Launch-of-Multi-Purpose-Mobility-Payment-Card.html.
447 Ghose, C. (2018, November 20). Smart Columbus Picks Local Startup to Build Trip-Planning App with
Mobile Payments. Columbus Business First. Retrieved September-December 2018, from https://www.
bizjournals.com/columbus/news/2018/11/19/smart-columbus-picks-local-startup-for-trip-planne.html.
448 Khosrowshahi, D. (2018, September 6). A Small Step Towards Your Phone Replacing Your Car. Uber
Newsroom. Retrieved September-December 2018, from https://www.uber.com/newsroom/mode_switch/.
449 Constine, J. (2018, September). Uber Fires Up its Own Traffic Estimates to Fuel Demand
Beyond Cars. TechCrunch. Retrieved September-December 2018, from https://techcrunch.
com/2018/09/16/uber-traffic/.
450 Khosrowshahi, D. (2018, September 26). The Campaign for Sustainable Mobility. Uber Newsroom.
Retrieved September-December 2018, from https://www.uber.com/newsroom/campaign-
sustainable-mobility/.
451 Korosec, K. (2018, August). Uber CEO: Ride Hailing Will be Eclipsed by Scooters, Bikes and Even Flying
Taxis. TechCrunch. Retrieved September-December 2018, from https://techcrunch.com/2018/09/06/
uber-ceo-ride-hailing-will-be-eclipsed-by-scooters-bikes-and-even-flying-taxis/.
452 Lyft (2018, September 19). Lyft Launches Nearby Transit in Santa Monica to Show Public Transit Routes
In-App. Lyft Blog. Retrieved September-December 2018, from https://blog.lyft.com/posts/2018/9/19/
lyft-launches-nearby-transit-in-santa-monica-to-show-public-transit-routes-in-app.
453 Hawkins, A.J. (2018, September 26). Lyft Expands the ‘Ditch your Car’ Challenge to 35 New Cities. The
Verge. Retrieved September-December 2018, from https://www.theverge.com/2018/9/26/17900970/
lyft-ditch-car-challenge-cities-new-york-san-francisco-boston-washington.
454 Marchant, C. (2018, September 19). Daimler’s Moovel Opens Marketplace for Bundled Mobility Passes.
Motor Finance. Retrieved September-December 2018, from https://www.verdict.co.uk/motor-finance-
online/news/company-news/moovel-daimler-maas-marketplace-mobility/.
EMERGING MOBILITY TECHNOLOGIES AND TRENDS160
455 Hu, J.C. (2018, November 8). Ford is on Track to Turning the Jargon of Being a “Mobility Company” into a
Reality. Quartz. Retrieved September-December 2018, from https://qz.com/1455335/ford-is-on-track-
to-turning-the-jargon-of-being-a-mobility-company-into-a-reality/.
456 MobilityX (2018, October 3). Toyota Tsusho Leads Series A Funding in Singaporean Start-Up mobilityX.
Retrieved September-December 2018, from https://www.mobility-x.com/press/toyota-tsusho-leads-
series-a-funding-in-singaporean-start-up-mobilityx/.
457 Business Wire (2016, July 25). Amazon and UK Government Aim for the Sky with Partnership on
Drones. Business Wire. Retrieved September-December 2018, from https://www.businesswire.com/
news/home/20160725006350/en/.
458 Jee, C. (2019, January 23). Waymo Plans to Open the World’s First Self-Driving-Car Factory This Year.
Technology Review. Retrieved September-December 2018, from https://www.technologyreview.com/
the-download/612516/alphabets-wing-spinoff-is-about-to-launch-drone-deliveries-in-finland/.
459 Peak, M. (2016, December 20). Regional Demonstrations Can Prompt Self-Driving Trucks to Work with
Other Robotic Vehicles. The Hill. Retrieved September-December 2018, from http://thehill.com/blogs/
congress-blog/technology/311245-regional-demonstrations-can-prompt-self-driving-trucks-to-work.
460 DOT Public Affairs (2018, May 9). Press Release – U.S. Transportation Secretary Elaine L. Chao Announces
Unmanned Aircraft Systems Integration Pilot Program Selectees. Retrieved September-December 2018,
from https://www.faa.gov/news/press_releases/news_story.cfm?newsId=22755.
461 Ibid.
462 Shaw, K. (2018, August 31). FAA Gives Updates on Drone Integration Program. Robotics Business Review.
Retrieved September-December 2018, from https://www.roboticsbusinessreview.com/unmanned/faa-
gives-updates-on-drone-integration-program-flights/.
463 Boyle, A. (2018, December 7). Morgan Stanley Says Market for Self-Flying Cars Could Rise to $1.5
Trillion by 2040. GeekWire. Retrieved September-December 2018, from https://www.geekwire.
com/2018/morgan-stanley-report-says-market-self-flying-cars-hit-1-5-trillion-2040/.
464 The Lilium Jet (n.d.). Retrieved September-December 2018, from https://lilium.com/.
465 Szondy, D. (2017, April 20). Lilium Plans Five-Seater Air Taxi After Successful Unmanned Flight.
New Atlas. Retrieved September-December 2018, from https://newatlas.com/lilium-electic-air-taxi-
maiden/49135/.
466 Badkar, M. (2018, October 3). Boeing CEO Expects Aerial Taxi Prototype to Take Off Within the Year.
Financial Times. Retrieved September-December 2018, from https://www.ft.com/content/59dd9ed4-
c75d-11e8-ba8f-ee390057b8c9.
467 PRNewswire (2017, October 15). Boeing to Acquire Aurora Flight Sciences to Advance Autonomous
Technology Capabilities. Retrieved September-December 2018, from http://boeing.mediaroom.
com/2017-10-05-Boeing-to-Acquire-Aurora-Flight-Sciences-to-Advance-Autonomous-Technology-
Capabilities.
468 PRNewswire (2018, July 17). Boeing, SparkCognition to Shape the Future of Travel and Transport.
Retrieved September-December 2018, from http://boeing.mediaroom.com/2018-07-17-Boeing-
SparkCognition-to-shape-the-future-of-travel-and-transport.
469 Neil, D. (2018, September 12). The First Flying-Car Review. The Wall Street Journal. Retrieved
September-December 2018, from https://www.wsj.com/articles/the-first-flying-car-
review-1536753601.

ENDNOTES 161
470 Uber (2016, October 27). Fast-Forwarding to a Future of On-Demand Urban Air Transportation.
Retrieved September-December 2018, from https://www.uber.com/elevate.pdf.
471 Zaleski, A. (2016, January 7). Fly to Work in The World’s First Autonomous, Human-Size Drone. Fortune.
Retrieved September-December 2018, from http://fortune.com/2016/01/07/ehang184-autonomous-
human-size-drone/.
472 LaReau, J.L. (2018, November 9). FM’s Future Lineup Will Run on Electricity, Drive Itself – And Fly.
Detroit Free Press. Retrieved September-December 2018, from https://www.freep.com/story/money/
cars/general-motors/2018/11/09/general-motors-future-lineup-include-flying-cars/1930877002/.
473 Pop.Up Next (2018). Italdesign. Retrieved September-December 2018, from https://www.italdesign.it/
project/pop-up-next/.
474 Experience the Future of Transportation (2018). Bell Flight. Retrieved September-December 2018, from
https://www.bellflight.com/company/innovation/air-taxi.
475 Efrati, A. & Weinberg, C. (2018, October 23). Inside Bird’s Scooter Economics. The Information.
Retrieved September-December 2018, from https://www.theinformation.com/articles/inside-birds-
scooter-economics/.
476 Custer, C. (2018, July 27). Forget Shared Bicycles. Here Come Self-Driving Scooters. Tech In Asia.
Retrieved September-December 2018, from https://www.techinasia.com/self-driving-scooters-
singapore-scootbee.
477 Turo (n.d.). Earnings and Payment. Retrieved September-December 2018, from https://support.turo.
com/hc/en-us/articles/203992000-What-will-I-earn-How-do-I-get-paid-.
478 Kagan, J. (2018, March 19). Per Transaction Fees. Investopedia. Retrieved September-December 2018,
from https://www.investopedia.com/terms/t/transaction-fees.asp.
479 Scharfenberg, O. (2018, October 25). Sharing Your Own Car Via an App: Infineon and XAIN to
Collaborate on Bringing Blockchain into the Car. Infineon. Retrieved September-December 2018, from
https://www.infineon.com/cms/en/about-infineon/press/press-releases/2018/INFATV201810-005.
html.
480 Ford (2018, November 28). Pittsburgh Announces the Winners of the City of Tomorrow Challenge.
Retrieved September-December 2018, from https://media.ford.com/content/fordmedia/fna/us/en/
news/2018/11/28/pittsburgh-announces-winners-city-of-tomorrow-challenge.pdf.
481 Zachary, C.L. (2018, November 29). Method and System Using a Blockchain Database for
Data Exchange Between Vehicles and Entities. Retrieved September-December 2018,
from http://appft.uspto.gov/netacgi/nph-Parser?Sect1=PTO2&Sect2=HITOFF&u=%2Fnet
ahtml%2FPTO%2Fsearch-adv.html&r=1&p=1&f=G&l=50&d=PG01&S1=20180342036.
PGNR.&OS=dn/20180342036&RS=DN/20180342036.
482 Liebkind, J. (2018, May 17). How Blockchain Will Revolutionize Future Cars. Investopedia. Retrieved
September-December 2018, from https://www.investopedia.com/investing/how-blockchain-will-
revolutionize-future-cars/.
483 Mobi (n.d.). Retrieved September-December 2018, from https://www.dlt.mobi/.
484 Ibid.
485 Heath, S. (2018, July 13). How Rideshare Companies Can Address Social Determinants of Health.
Patient Engagement HIT. Retrieved September-December 2018, from https://patientengagementhit.
com/features/how-rideshare-companies-can-address-social-determinants-of-health.

EMERGING MOBILITY TECHNOLOGIES AND TRENDS162
486 Gier, J. (2017 May). Missed appointments cost the U.S. healthcare system $150B each year. Health
Management Technology. Retrieved September-December 2018, from https://www.scisolutions.com/
uploads/news/Missed-Appts-Cost-HMT-Article-042617.pdf.
487 Musumeci, M.B., Rudowitz, R. (2016, February 24). Medicaid Non-Emergency Medical
Transportation: Overview and Key Issues in Medicaid Expansion Waivers. Henry J Kaiser Family
Foundation. Retrieved September-December 2018, from https://www.kff.org/medicaid/issue-
brief/medicaid-non-emergency-medical-transportation-overview-and-key-issues-in-medicaid-
expansion-waivers/.
488 Hitch Health and Lyft Demonstrate Significant Reduction in Missed Medical Appointments. (2018,
July 23). Business Wire. Retrieved September-December 2018, from https://www.businesswire.com/
news/home/20180723005141/en/Hitch-Health-Lyft-Demonstrate-Significant-Reduction-Missed.
489 Blue Cross and Blue Shield and Lyft Join Forces to Increase Access to Health Care in Communities
with Transportation Deserts. (2017, May 10). PR Newswire. Retrieved September-December 2018,
from https://www.prnewswire.com/news-releases/blue-cross-and-blue-shield-and-lyft-join-forces-to-
increase-access-to-health-care-in-communities-with-transportation-deserts-300455125.html.
490 Japsen, B. (2018, April 8). For Uber And Lyft, Medicare Could Be The Next Profitable Ride. Forbes.
Retrieved September-December 2018, from https://www.forbes.com/sites/brucejapsen/2018/04/08/
for-uber-and-lyft-medicare-could-be-the-next-profitable-ride/#39850ae41b0f.
491 Centers for Medicare & Medicaid Services (CMS). Let Medicaid Give You A Ride. (2016 April).
Retrieved September-December 2018, from https://www.cms.gov/medicare-medicaid-coordination/
fraud-prevention/medicaid-integrity-education/downloads/nemt-factsheet.pdf.
492 Centers for Medicare & Medicaid Services. CMS lowers the cost of prescription drugs for Medicare
beneficiaries. (2018, April 2). Retrieved September-December 2018, from https://www.cms.gov/
newsroom/press-releases/cms-lowers-cost-prescription-drugs-medicare-beneficiaries.
493 Hall, R., Parekh, C., Thakker, V. (1998, August 1). Intermodal Transportation Operation System (ITOS)
For the State Of California. UC Berkeley Working Papers. Retrieved September-December 2018, from
https://escholarship.org/content/qt4cw3h230/qt4cw3h230.pdf.
494 Corwin, S., Dinamani, A., Hood, J., Skowron, J., Pankratz, D.M. (2018, March 9). Cities Explore Digital
Mobility Platforms. Deloitte Insights. Retrieved September-December 2018, from https://www2.
deloitte.com/insights/us/en/focus/future-of-mobility/urban-transport-mobility-platforms.html.
495 Leonard, M. (2017, October 6). Columbus Lays Groundwork for Connected Transportation Data
Exchange. GCN. Retrieved September-December 2018, from https://gcn.com/articles/2017/10/06/
columbus-traffic-data-exchange.aspx.
496 Land Transport Authority (n.d.). Intelligent Transport Systems. Retrieved September-December
2018, from https://www.lta.gov.sg/content/ltaweb/en/roads-and-motoring/managing-traffic-and-
congestion/intelligent-transport-systems.html.
497 Cooray, M. & Duus, R. (2017, August 23). Technology is not Enough to Create Connected Cities –
Here’s Why. The Conversation. Retrieved September-December 2018, from https://theconversation.
com/technology-is-not-enough-to-create-connected-cities-heres-why-82740.
498 Exciting Projects Based on Sentilo in the SCEWC 2016 (2016, December 29). Sentilo. Retrieved
September-December 2018, from http://www.sentilo.io/wordpress/exciting-projects-based-on-
sentilo-in-the-scewc-2016/.

ENDNOTES 163
499 Barcelona Digital City. Retrieved September-December 2018, from https://ajuntament.barcelona.cat/
digital/en/digital-transformation/city-data-commons/cityos.
500 Smartdubai.ae (2018). Retrieved September-December 2018, from https://www.smartdubai.ae/.
501 Gindrat, R. (2018, October 31). How a Central Control System Could Keep AV Traffic Flowing
Smoothly. Axios. Retrieved September-December 2018, from https://www.axios.com/how-a-
central-control-system-could-keep-av-traffic-flowing-smoothly-b2c59a00-3a3b-4e8d-b78f-
a9bdca348037.html.
502 Chao, J. (2018, October 28). Machine Learning to Help Optimize Traffic and Reduce Pollution. Berkeley
Lab News Center. Retrieved September-December 2018, from https://newscenter.lbl.gov/2018/10/28/
machine-learning-to-help-optimize-traffic-and-reduce-pollution/.
503 Federal Register (1996, June 26). Federal Register Volume 61, Number 124. Retrieved September-
December 2018, from https://www.gpo.gov/fdsys/pkg/FR-1996-06-26/html/96-16205.htm.
504 Bureau of Transportation Statistics (n.d.). Average Fuel Efficiency of U.S. Light Duty Vehicles. Retrieved
September-December 2018, from https://www.bts.gov/content/average-fuel-efficiency-us-light-duty-
vehicles.
505 Tesla (n.d.). On the Road. Retrieved September-December 2018, from https://www.tesla.com/
supercharger.
506 Lambert, F. (2018, June 6). Tesla Pushes Supercharger V3 to ‘End of the year,’ Says it Will be
‘Zombie Apocalypse-Proof.’ Electrek. Retrieved September-December 2018, from https://electrek.
co/2018/06/06/tesla-pushes-supercharger-v3-expansion-batteries-solar/.
507 BMW Group, Daimler AG, Ford Motor Company and Volkswagen Group with Audi and Porsche Plan a
Joint Venture for Ultra-Fast, high-Power Charging Along Major Highways in Europe (2016, November
29). Ford Media Center. Retrieved September-December 2018, from https://media.ford.com/content/
fordmedia/fna/us/en/news/2016/11/29/bmw-daimler-ford-volkswagen-audi-porsche-plan-ultra-fast-
charging-major-europe-highways.html.
508 Porsche News. First Porsche fast charging park featuring 800-volt technology. (2018, July 11). Retrieved
from https://newsroom.porsche.com/en/company/porsche-fast-charging-park-berlin-adlershof-electric-
cars-electro-mobility-plug-in-technology-turbo-infrastructure-15814.html.
509 EVgo (2015, December 15). EVgo Breaks Ground on the First Public High-Power Electric Vehicle Charging
Station, Connecting Los Angeles and Las Vegas at World’s Tallest Thermometer. Retrieved September-
December 2018, from https://www.evgo.com/about/news/evgo-breaks-ground-first-public-high-power-
electric-vehicle-charging-station-connecting-los-angeles-las-vegas-worlds-tallest-thermometer/.
510 CHAdeMO (2018, June 15). CHAdeMO Releases the Latest Version of the Protocol Enabling up to
400KW. Retrieved September-December 2018, from https://www.chademo.com/chademo-releases-
the-latest-version-of-the-protocol-enabling-up-to-400kw/.
511 IEEE (n.d.). Effects of Intermittency on the Electric Power Grid and the Role of Storage. Retrieved
September-December 2018, from https://smartgrid.ieee.org/images/files/pdf/IEEE_QER_Intermittent_
Renewables_Storage_October_3_2014.pdf.
512 Smith, J. (2017, Fall). EV Charging Station and Los Angeles Air Force Base V2G Pilot Technical
Evaluations. U.S. Department of Energy. Retrieved September-December 2018, from https://www.
energy.gov/sites/prod/files/2017/11/f46/16-fupwgfall2017_smith.pdf.
513 Ibid.

EMERGING MOBILITY TECHNOLOGIES AND TRENDS164
514 California Public Utilities Commission. Southern California Edison Company’s Department of Defense
Vehicle-to-Grid Final Report (n.d.). Retrieved September-December 2018, from http://www.cpuc.ca.gov/
WorkArea/DownloadAsset.aspx?id=6442455793.
515 Enel (2016, August 29). Nissan, Enel and Nuwe Operate World’s First Fully Commercial Vehicle-to-
Grid Hub in Denmark. Retrieved September-December 2018, from https://www.enel.com/media/
press/d/2016/08/nissan-enel-and-nuvve-operate-worlds-first-fully-commercial-vehicle-to-grid-hub-in-
denmark.
516 ABI Research (n.d.). Vehicle-to-Grid Technologies and Applications. Retrieved September-December
2018, from https://www.abiresearch.com/market-research/product/1031277-vehicle-to-grid-
technologies-and-applicati/.
517 ABI Research (2018, September 18). V2G Technology: An Energy Game-Changer for All Stakeholders -
Once Market Barriers Are Overcome. PR Newswire. Retrieved September-December 2018, from https://
www.prnewswire.com/news-releases/v2g-technology-an-energy-game-changer-for-all-stakeholders---
once-market-barriers-are-overcome-300714573.html.
518 U.S. Department of State (2017, March 27). Deregulating Telecommunications. ThoughtCo.
Retrieved September-December 2018, from https://www.thoughtco.com/deregulating-
telecommunications-1147515.
519 Mobility Data (n.d.). General Transit Feed Specification. Retrieved September-December 2018, from
http://gtfs.org/.
520 GitHub (n.d.). General Bikeshare Feed Specification. Retrieved September-December 2018, from
https://github.com/NABSA/gbfs.
521 DAV Network (n.d.). Retrieved September-December 2018, from https://dav.network/.
522 Intelligent Transport. $24 million raised to build an open source network for autonomous vehicles
(2018, October 4). Intelligent Transport. Retrieved September-December 2018, from https://www.
intelligenttransport.com/transport-news/72228/sharing-modes-dav-investment/.

INTRODUCTION 165
Our MissionWe leverage our network of global thought leaders to
develop integrated energy solutions that:
• Reduce costs, emissions and waste;
•Influencepolicy;and
• Advance technological innovation
…to increase quality of life for today and tomorrow.
Our VisionESN is building an energy ecosystem that integrates all
aspects of the energy landscape: energy generation,
distribution, the built environment, and transportation.

EMERGING MOBILITY TECHNOLOGIES AND TRENDS166
111 Monument Circle
Suite 1800
Indianapolis, IN 46204
P: 317.532.4774
F: 317.638.2110
www.energysystemsnetwork.com