Embed Size (px)
Citation preview

Emerging India: Capturing Opportunities

AMITY
• Amity is currently a leading education provider in India with programs ranging from pre-nursery to post-doctoral levels in almost all areas including management, engineering, law, communication, insurance, behavioural science, fine arts etc
• Presently, more than 50,000 students study in 130 programs across 22 campuses spread over 700 acres of land with 4.1 million sq. ft. of built area.
• One of the first to launch programs like Cyber Law, Bioinformatics and Nanotechnology among many others in India.
Source: http://www.amity.edu
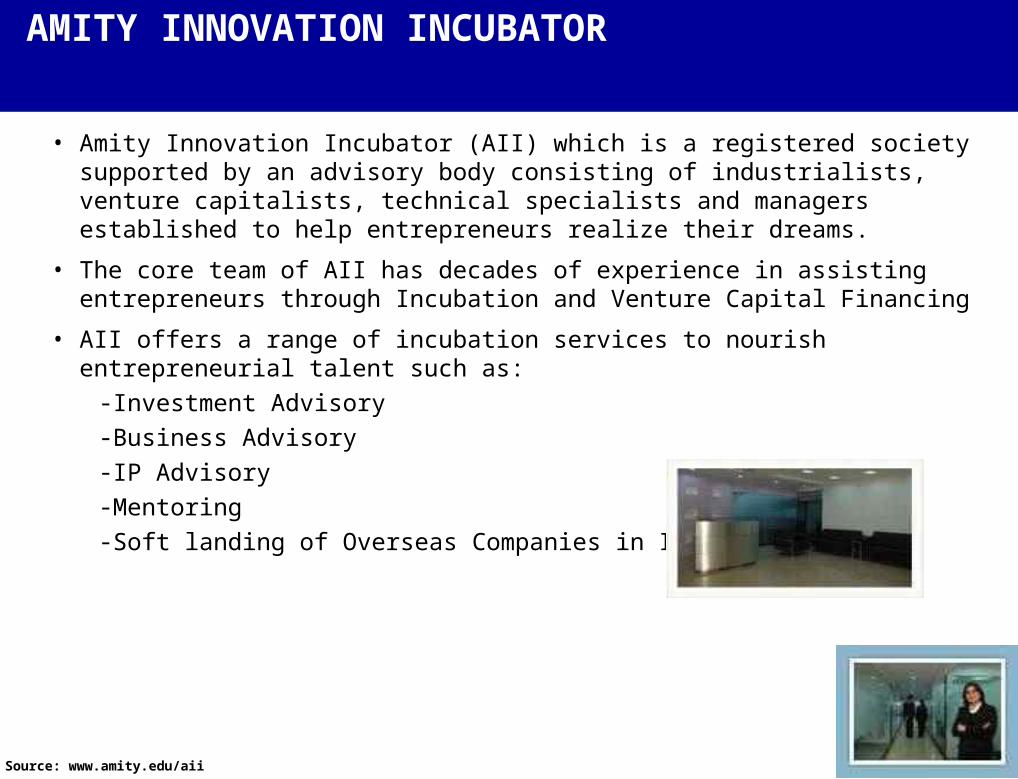
AMITY INNOVATION INCUBATOR
• Amity Innovation Incubator (AII) which is a registered society supported by an advisory body consisting of industrialists, venture capitalists, technical specialists and managers established to help entrepreneurs realize their dreams.
• The core team of AII has decades of experience in assisting entrepreneurs through Incubation and Venture Capital Financing
• AII offers a range of incubation services to nourish entrepreneurial talent such as:
- Investment Advisory- Business Advisory- IP Advisory- Mentoring- Soft landing of Overseas Companies in India
Source: www.amity.edu/aii
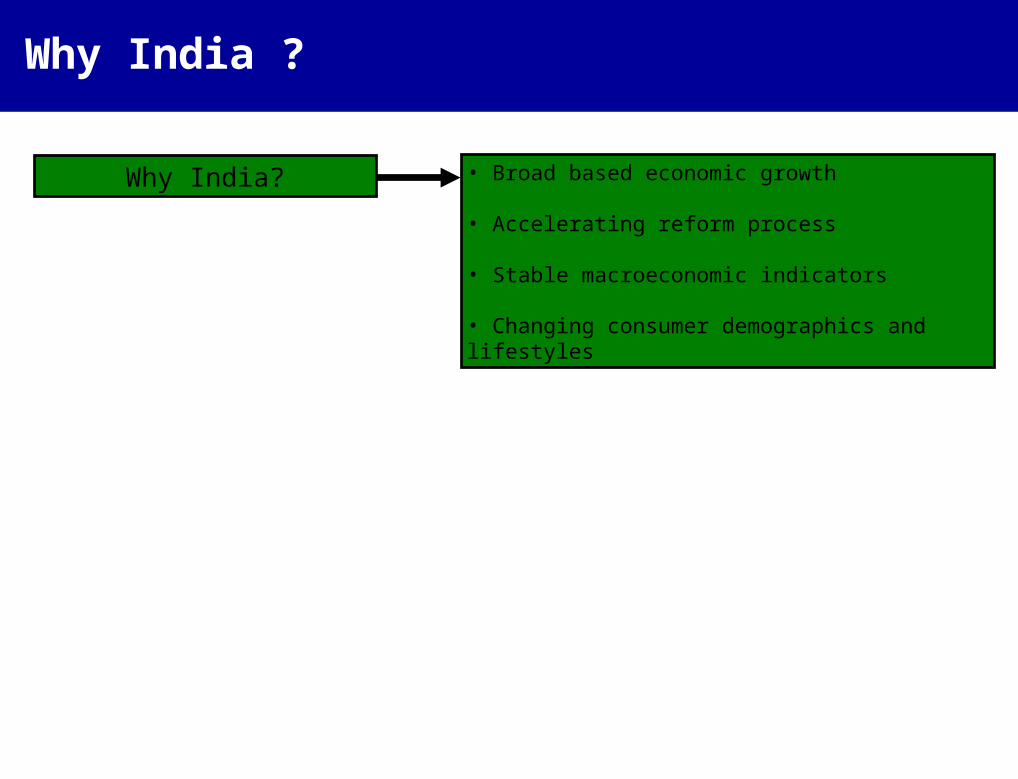
Why India ?
Why India? • Broad based economic growth
• Accelerating reform process
• Stable macroeconomic indicators
• Changing consumer demographics and lifestyles

Acceleration of reforms…
• Public control of key sectors
• Planning Commission created
• Administered prices for commodities
• Capacity controls
• Nationalization of financial sector
• Foreign exchange control
• High taxation (a max. marginal rate of 90%)
• IMF program established
• Reduction of budget deficit
• Tariffs lowered and simplified
• Currency made fully convertible for current account
• Automatic approval for foreign stakes of up to 51%
• Capacity controls abolished
• Privatization program initiated
• New takeover code
• 100% stakes allowed for foreign investors
• Deregulation of financial institutions
• India signatory to WTO
• FDI encouraged
• Share buybacks allowed
• Insurance system reformed
• Patent law enacted
• New trademark law enacted
• New foreign exchange law enacted
• New telecom policy adopted
• Major privatization initiative implemented
• Legal reforms undertaken
Tight government controls: 1947-1991 Early Reforms: 1991-1996
Corporate reforms: 1996-1998 Reforms accelerate: 1998-present


India will become…
…with the fastest growth rate
India China Brazil Russia US UK France Germany Italy Japan0%
2%
4%
6%
8%
10%
Projected GDPGrowth Rate
Source: Goldman Sachs BRIC Report, Merrill Lynch


Long Term Market PerformanceLast 5 years
Source: BSE India
CAGR
40%
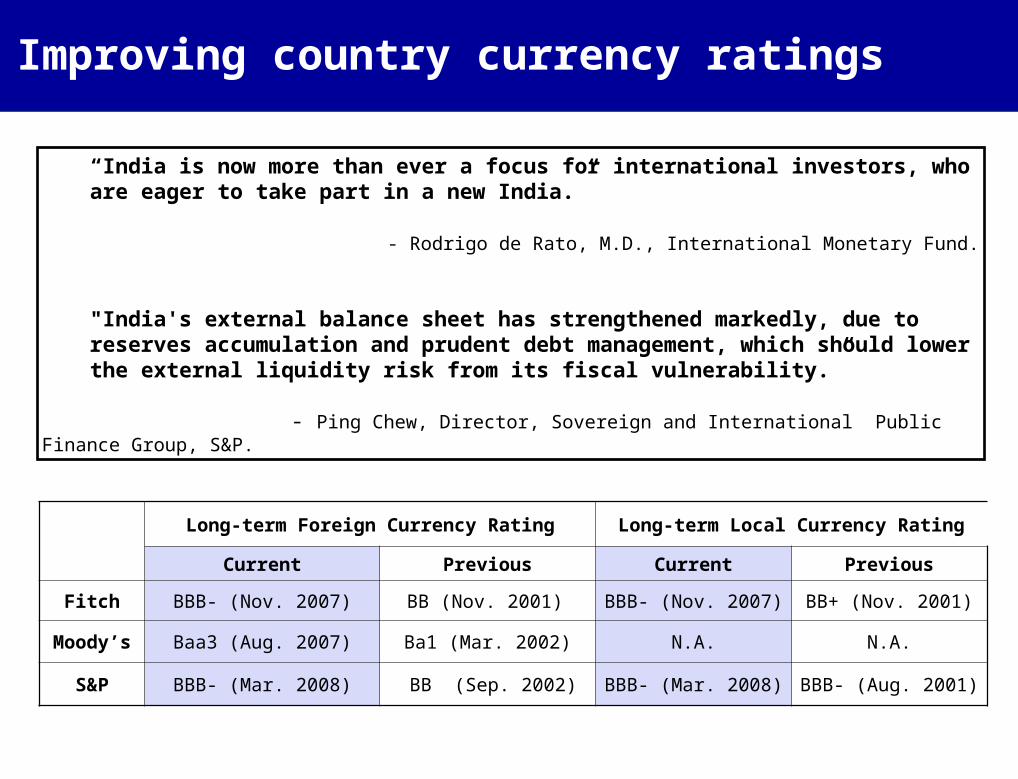
Improving country currency ratings
Long-term Foreign Currency Rating Long-term Local Currency Rating
Current Previous Current Previous
Fitch BBB- (Nov. 2007) BB (Nov. 2001) BBB- (Nov. 2007) BB+ (Nov. 2001)
Moody’s Baa3 (Aug. 2007) Ba1 (Mar. 2002) N.A. N.A.
S&P BBB- (Mar. 2008) BB (Sep. 2002) BBB- (Mar. 2008) BBB- (Aug. 2001)
“India is now more than ever a focus for international investors, who are eager to take part in a new India.”
- Rodrigo de Rato, M.D., International Monetary Fund.
"India's external balance sheet has strengthened markedly, due to reserves accumulation and prudent debt management, which should lower the external liquidity risk from its fiscal vulnerability.”
- Ping Chew, Director, Sovereign and International Public Finance Group, S&P.

Average depreciation over Last 10 Years = 0.4 %
Stable currency, favorable outlook
Source: Reserve Bank of India
“Over the long term, India's exchange rate will surely appreciate – and massively - as it catches up with the rest of the world in productivity.’’
- Kenneth Rogoff, Harvard University Economics Professor.
Exchange Ratio
39
41
43
45
47
49
Apr-98 Apr-99 Apr-00 Apr-01 Apr-02 Apr-03 Apr-04 Apr-05 Apr-06 Apr-07
Indian Rupee ($INRUSD) - Currency Spot Rate

India is a “red-hot” FDI DestinationAT Kearney FDI Confidence Index – 2007

Over USD 45 Bn FDI Inflow since FY01Country Break-up : Centers of Action
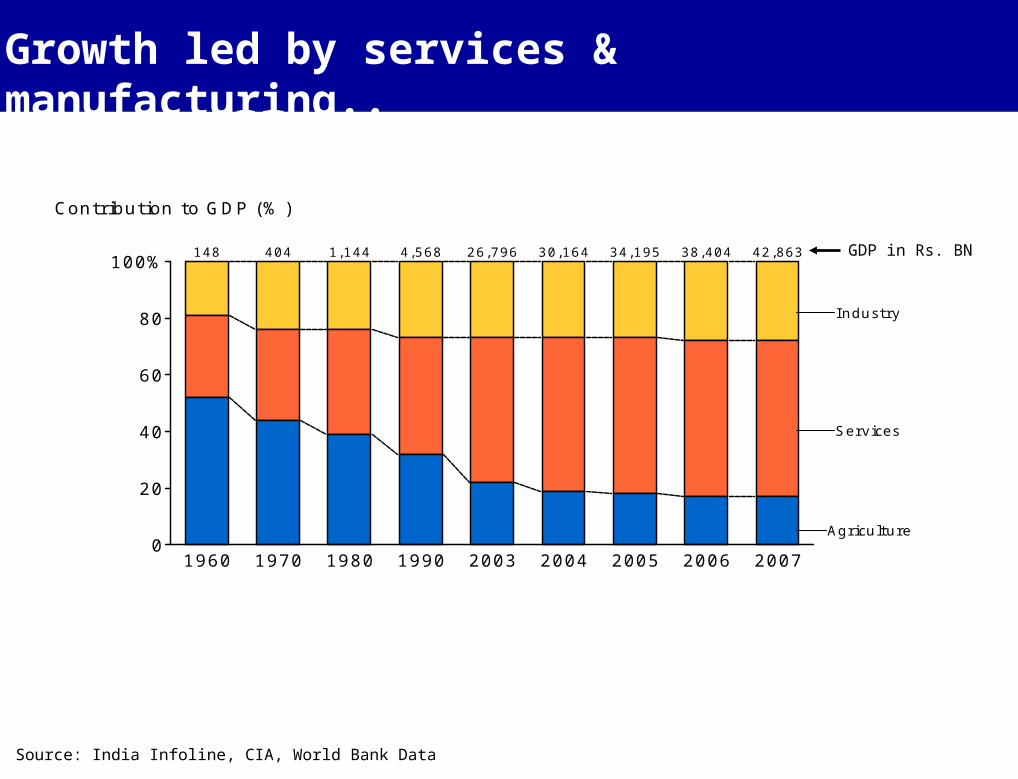
Growth led by services & manufacturing..
Source: India Infoline, CIA, World Bank Data
Industry
Services
Agriculture
1960 1970 1980 1990 2003 2004 2005 2006 2007
148 404 1,144 4,568 26,796 30,164 34,195 38,404 42,863
0
20
40
60
80
100%
Contribution to GDP (%)
GDP in Rs. BN
*Source: Indian Brand Equity Foundation (www.ibef.org)
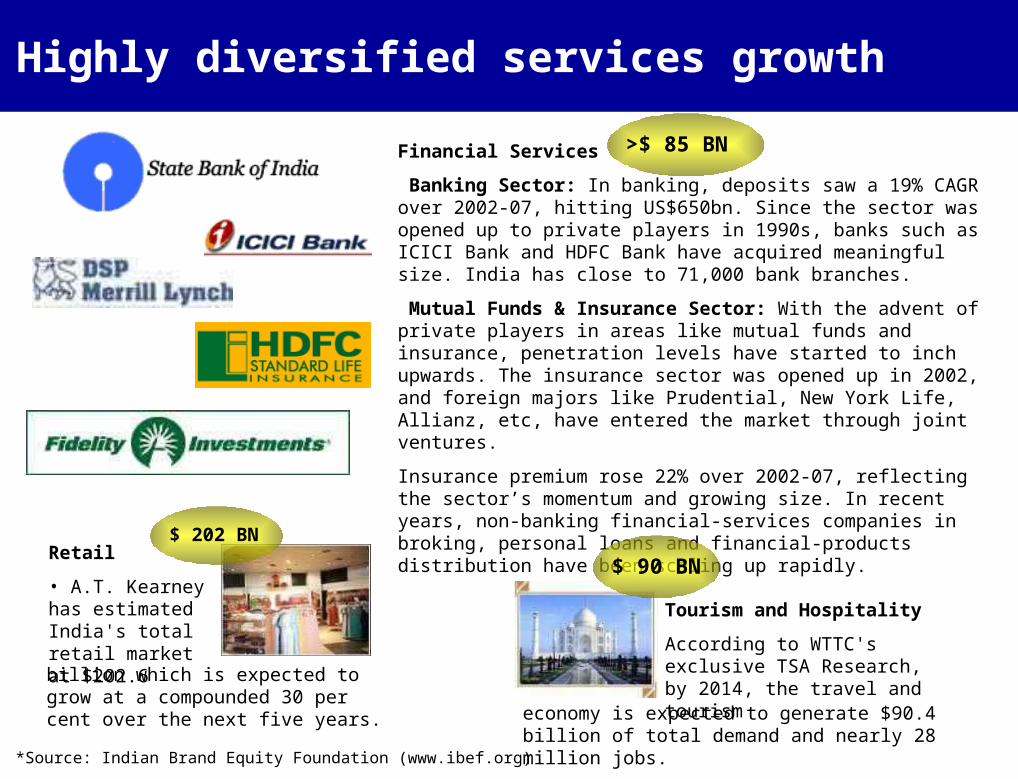
Financial Services
Banking Sector: In banking, deposits saw a 19% CAGR over 2002-07, hitting US$650bn. Since the sector was opened up to private players in 1990s, banks such as ICICI Bank and HDFC Bank have acquired meaningful size. India has close to 71,000 bank branches.
Mutual Funds & Insurance Sector: With the advent of private players in areas like mutual funds and insurance, penetration levels have started to inch upwards. The insurance sector was opened up in 2002, and foreign majors like Prudential, New York Life, Allianz, etc, have entered the market through joint ventures.
Insurance premium rose 22% over 2002-07, reflecting the sector’s momentum and growing size. In recent years, non-banking financial-services companies in broking, personal loans and financial-products distribution have been scaling up rapidly.
>$ 85 BN
Highly diversified services growth
Tourism and Hospitality
According to WTTC's exclusive TSA Research, by 2014, the travel and tourism
economy is expected to generate $90.4 billion of total demand and nearly 28 million jobs.
$ 90 BNRetail
• A.T. Kearney has estimated India's total retail market at $202.6billion which is expected to grow at a compounded 30 per cent over the next five years.
$ 202 BN

Highly diversified industrial growth
*Source: Indian Brand Equity Foundation (www.ibef.org)
Automobiles
• Turnover exceeded USD 23 BN in 2003-04. Production exceeded 6 million units in 2004-05 and 10 million units in 2006-07.
Textiles
• Indian textile and apparel industry can achieve a potential sizeof US$ 85 billion by 2010, with a domestic market size of US$ 45 billion and nearly 60 per cent of exports comprising of garments.
Pharmaceuticals
• The pharma industry's turnover is expected to increase to US$ 12 billion by 2008 from US$ 6.3 billion in 2002.
• The Indian pharma industry has the highest number of plants approved by
the US Food and Drug Administration (FDA) outside the US.
• It also has the largest number of Drug Master Files (DMF’s) filed which gives it access to the high growth generic bulk drugs market.
$ 85 BN $ 12 BN
$ 40 BN

Highly diversified industrial growth
*Source: Indian Brand Equity Foundation (www.ibef.org), Business Monitor International: “India Oil and Gas Report” 2004.
According to a CII-McKinsey report, manufacturing exports from India are likely to grow to $300BN in 2015 from $48BN in 2003.
Telecommunications
India’s telecom sector is the poster boy of Indian reforms and the country is among the fastest-growing mobile markets in the world.
$ 9 BN
Energy - Oil and Gas
“With more than a billion people, a structural demographic shift resulting in exploding consumptionexpenditure, full deregulation of a 100 m tonne market growing at twice world averages, India represents one of the most exciting oil markets in the world today” - CLSA Asia Pacific
$ 24 BN
Auto Components
• A robust component industry has developed around the auto clusters and exports have crossed US$1bn in 2006.
$ 6.7 BN
The auto-component export opportunity is estimated at US$25bn by 2012.
. As of December 2007, there are 229 million mobile subscribers and monthly mobile net adds, at eight million, are the highest in the world

Real Estate Revenue PoolUSD 300 – 600 BN over next 5 years
Source: CBRE, FIRE Capital, Merrill Lynch.
0
100
200
300
400
500
600
USD 50 – 100BN FDI potential in next 5 years
USD 537 BNUSD 30 BN
USD 25 BN
USD 268 BN USD 9 BN USD 13 BN
USD 290 BN
USD 592 BN
Construction Area (M sft)
Residential Commercial Retail Total
High 21,340 263 137 21,740
Low 6,700 100 68.5 6,869
Revenue Pool
(USD BN)

Increasing housing shortage
1961 1971 1981 1991 2001 2005E 2011E0
100
200
300
0
10
20
30
Housing shortfall(MN homes)
Usable Housing Stock
Number of households
Source: Merrill Lynch
Urban 6.7M : Rural 12.7M

BPORevenues
2003 2008E
2.3
21.0
0
5
10
15
20
25
USD BN
CAGR = 5
6%
Service sector boom: BPO
Source: NASSCOM-McKinsey Study 2003, NASSCOM Indian Software and Services 2002-03, IDC, JMS Research

Indian ITServices
Revenues
1998 2003 2008E
1.8
7.2
36.0
0
5
10
15
20
25
30
35
40
USD BN
Growth Rates 1998-2003 2003-2008E
Global IT Market CAGR 6% 7*%
Indian IT Exports CAGR 32% 38%
Source: NASSCOM-McKinsey Study 2003, NASSCOM Indian Software and Services 2002-03, IDC, JMS Research
* For the period 2002-2007
Service sector boom: IT
Lack of infrastructure has been a major concern
“The issue that has to be dealt with in India, first and foremost, is infrastructure - ahead of everything else. It's important that folks outside India see an effort and willingness (from the Indian government) to invest in infrastructure.”
- Brett White, President, CB Richard Ellis.

Rural backbone is being built…
Source: India Today (11th April, 2005)
• PMGSY (Pradhan Mantri Gram Sadak Yojna or Prime Minister rural roads program) would forge the “farm-to-market” link that entails upgrading the entire rural network.
• The budget outlay for the rural roads program has been more than doubled to USD 30 BN
• Land prices along the roads have gone up significantly

…strong infrastructure development underway

Number of households (population), millions
1995 - 96 2001 - 02 FY2009(E)
“Rich”: > Rs 0.5 Mn CAGR: 15%
“Upper Middle”: Rs 0.3 – 0.5 MnCAGR: 10%
“Middle Income”: Rs 0.1 – 0.3 MnCAGR: 2%
“Lower Income”: < Rs 0.1 MnCAGR (8%)
1.2 (7) 2.6 (15) 7 (40)
32.5 (186) 46.4 (265) 91 (525)
54.1 (312) 74.4 (429) 85 (490)
77.0 (444) 57.2 (332) 30 (177)
HouseholdIncome Class
55 million families (320 million people) added in the middle income group
Growing middle class
Source: ICICI Venture Fund

…that has more than ever to spend!
Source: National statistical offices/UN/Euromonitor
1990 1995 2000 2005 20100
25
50
75
100
125
Mean Disposable HouseholdIncome (Rs. '000)
CAGR = 7%

India has the largest young population…
>6035-5915-340-14
India
China
USA
EU
0 25 50 75 100
% of Population (2003)
Highest proportion of population below 35 years (70%) in India……
Source: ICICI Venture Fund

130 m plus people get added to working population by 2009!
…which means many more workers
73
240
365
365
87
295
449
391
2003 2009E0
500
1,000
1,500
Population (Million)
0-1415-3435-59>60
working population
Source: ICICI Venture Fund

Growing Urbanisation
%
1950 1960 1970 1980 1990 2000 2010 2020 20300
10
20
30
40
50
Urban population as % of Total
Source: Geo Hive, Census data GOI
2005 2010E 2015E 2020E 2025E 2030E
Urban Population (in Mn) 332 380 435 499 566 633

Changing ConsumerStatus Acquisition, Indulge, Consume, Credit
• New Age- Rapid advances witnessed by India in areas like education, communication, information technology and transportation have created a sense of freedom in the minds of consumers.
• More is less- Urbanization producing more and younger families with both the spending power and the desire to spend.
• Similar mindsets- Growing media penetration is leading to a convergence of aspirations of various classes of consumers, bridging the rural-urban divide.
• Indulgence- Younger population tends to have higher aspirations and spends more as it enters the earning phase.
• Brand / Price sensitivity- Urban consumers today are relatively less price sensitive than a few years earlier
- Urban households spending 2.5x more than rural families.
• Growing number of double-income households- Decrease in the average size of the family.
• Credit no more a feared entity
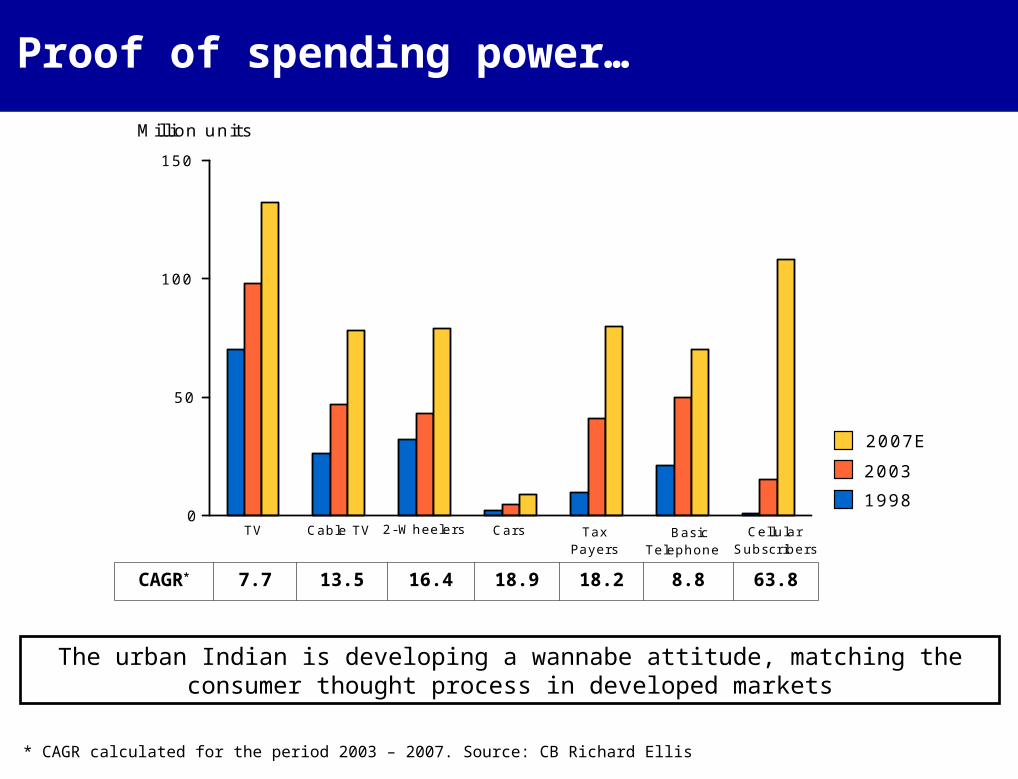
TV Cable TV 2-Wheelers Cars TaxPayers
BasicTelephone
CellularSubscribers
0
50
100
150
Million units
19982003
2007E
Proof of spending power…
CAGR* 7.7 13.5 16.4 18.9 18.2 8.8 63.8
* CAGR calculated for the period 2003 – 2007. Source: CB Richard Ellis
The urban Indian is developing a wannabe attitude, matching the consumer thought process in developed markets

DemographicsLiteracy
• Government spend on education, at about 1% of GDP, remains low (10% in China) and the country intends to push this up to 6% with an enhanced focus on primary education and vocational training.
• The private sector is increasingly involved in education and training, estimated to be a US$40bn opportunity.
• An estimated 350,000 engineers and 60,000 MBA candidates graduate every year
The Steel Industry
Source: CMIE, CLSA
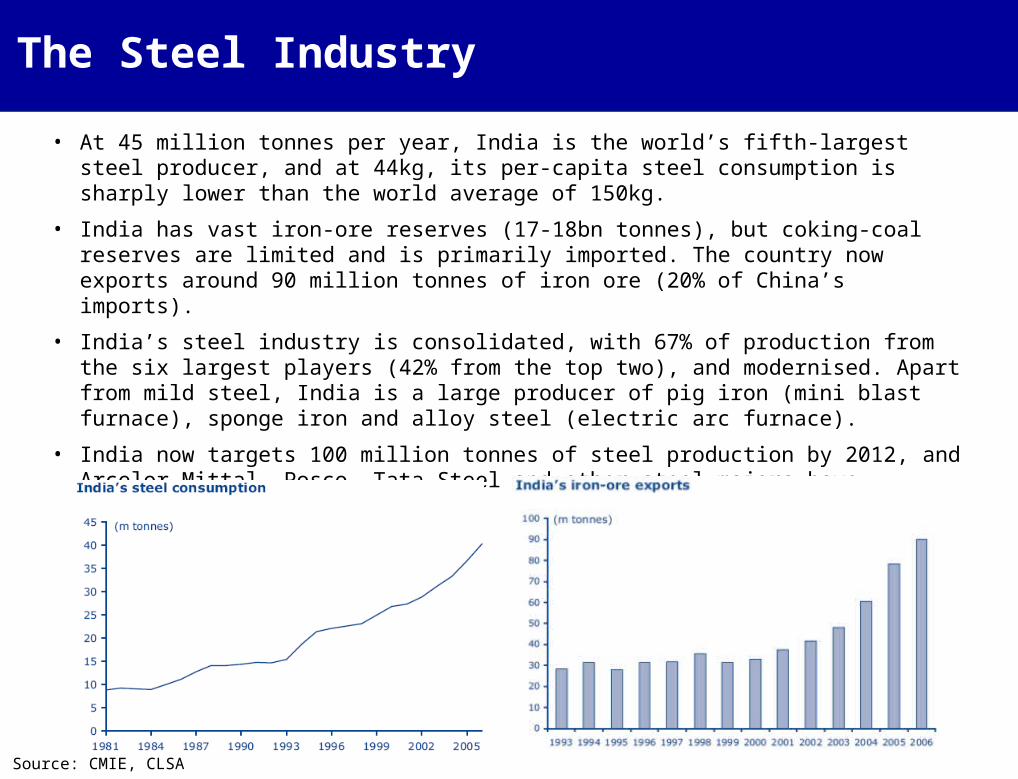
• At 45 million tonnes per year, India is the world’s fifth-largest steel producer, and at 44kg, its per-capita steel consumption is sharply lower than the world average of 150kg.
• India has vast iron-ore reserves (17-18bn tonnes), but coking-coal reserves are limited and is primarily imported. The country now exports around 90 million tonnes of iron ore (20% of China’s imports).
• India’s steel industry is consolidated, with 67% of production from the six largest players (42% from the top two), and modernised. Apart from mild steel, India is a large producer of pig iron (mini blast furnace), sponge iron and alloy steel (electric arc furnace).
• India now targets 100 million tonnes of steel production by 2012, and Arcelor Mittal, Posco, Tata Steel and other steel majors have proposed large investments.

The Bearings IndustryIndia Overview
Source: Emkay, IBEF
• The Indian bearing industry is $670 million in size, where the organised sector accounts for 53 per cent of the market.
• Imports account for the next 23 per cent and the rest is smuggled into the country.
• There are 12 large and medium units which together turn out over 100 million bearings every year.
• Since the bearing industry is technology intensive and brand conscious, most Indian players have so far worked in collaboration or as joint venture partners with other more established global players
• Leaders in this market are SKF in ball bearings (a 41 per cent marketshare); FAG in spherical roller bearing (60 per cent); NBC in taper roller bearings (23) and NRB in needle roller bearings (100).

Foreign companiesTaking a keen interest in the Indian market
Source: Emkay, IBEF
• Glacier Garlock Bearings, now part of the US-based EnPro group, opened up its firstoffice in India.
- GGB's focus in India will be to penetrate the OEM markets as a bearing supplier for automotive and industrial products.
• European Bearing Company plans to build a bearing manufacturing plant in Hyderabad at a cost of $27 million.
- Production in Hyderabad will cater to India's industrial manufacturing and mining sectors, and the rail industry.
• Germany's INA Bearings too has begun an expansion programme in Pune which will double its manufacturing capacity there by 2008.
- Although INA has had a direct presence in India since 1990, it begun manufacturing bearings since 2002.
- INA will spend $34 million on the new facility.
• Magnum Engineers and Germany's Diamant MetalPlastic formed a consortium to develop and manufacture molded polymer air bearings last year.
- Their target is to reduce manufacturing costs for a line of specialty-engineered air bearings by as much as 50 per cent.
- The consortium will receive the bulk of its funding from INTEC.
Shift with ClientsOverseas manufacturing
Source: Emkay, IBEF
• While there continues to be a large domestic market to cater to, the need to go overseas has never been higher.
"Our traditional Indian customers are setting up plants overseas. Bajaj Auto has plans to go to Nigeria and Argentina. It has already set up a manufacturing base in Indonesia. TVS Motors too is planning expansion there. Tata Motors has acquired facilities in Spain and South Korea for its large commercial vehicle segment. Earlier our customers were here, so we stuck to the market but now with Indian companies going abroad, we have to move with them."
- Harshbeena Zaveri, President, NRB Bearings.

Chinese ManufacturersStiff Competition
Source: Emkay, IBEF
• Dumping is a common offence, where Chinese bearings are sold in the local market under fake brand names.
"This is a technology-intensive industry and there is a significant difference in the quality of both products, which works in India's favour.“
-Umesh Karne, Analyst, Emkay Brokers & Research.