Embed Size (px)
Citation preview

Markets Asia Team:
Paul Gruenwald Head of Economics and Research +65 6216 1814 [email protected]
Tamara Henderson Director of Currency and Rates Strategy +65 6216 1845 [email protected]
Ivy Tan Associate Director, Credit Research +65 6216 3643 [email protected]
Joshua Saldanha Associate Director, Economic Research +65 6216 1936 [email protected]
Chang Wei Liang Analyst +65 6216 1838 [email protected]
2 October 2008
Emerging Asia Economics Monthly – October 2008
Our Vision:
For Economics & Markets Research to be the most respected, sought-after and commercially valued source of economics and markets research and information on Australia, New Zealand, the Pacific and Asia.
Highlights • Activity indicators continue to deteriorate across emerging Asia,
pointing to slower growth ahead for the region. • Inflation has peaked in all but a few countries and is fast
disappearing as an issue; a few central banks have begun to cut policy rates and others have signalled a change in bias.
• Although the direct exposure of financial entities in the region to Lehman assets was small, asset market contagion from the latest U.S. financial sector fallout was swift and substantial.
• We have updated (and downgraded) our baseline growth forecasts for the rest of 2008 and 2009, and view the risks to growth be firmly on the downside.
• Sharply deteriorating global growth prospects will keep emerging Asian currencies under pressure. Countries with current account deficits (or small surpluses) have led the way lower thus far. Countries with large export exposure and more developed financial sectors will be next.
Table of Contents
Feature Article: Update Emerging Asia GDP Forecasts……… 2
Annex: Lehman-related Exposure by Asian Financial Entities……………………………………………………………………………….………..
4
Macro-Economic Forecasts…………………………………….……………….. 5
Foreign Exchange and Rates Overview…………………………………
6
Foreign Exchange and Policy Rate Forecasts……………………… 7
Long Term Foreign Currency Government Bond Ratings…. 8
Country Updates, and FX and Rates Strategy:
• China……………………………………………………………………………………. 9
• Hong Kong……………………………………………………………………………. 11
• India……………………………………………………………………………………… 13
• Indonesia……………………………………………………………………………… 15
• Malaysia……………………………………………………………………………….. 17
• Philippines……………………………………………………………………………. 19
• Singapore…………………………………………………………………………….. 21
• South Korea…………………………………………………………………………. 23
• Taiwan…..…………………………………………………………………………….. 25
• Thailand………………………………………………………………………………… 27
• Vietnam………………………………………………………………………………… 29

Emerging Asia Economics Monthly – October 2008
Feature Article: Updated Emerging Asia GDP Forecasts
In this issue of ANZ’s Emerging Asia Economic Monthly we launch our feature article series. The aim is to provide readers with a short, thematic piece on an issue with region-wide ramifications. In this inaugural article we provide an overview of our recently-updated quarterly GDP growth forecasts against the background of a slowing global economy and a deepening global financial crisis. While these represent our current read on the region, given the fluid situation in financial markets we expect to revisit our forecasts on a relatively frequent basis. In an Annex to this article we present some data on Lehman-related exposures of banks in Asia.
Before delving into the actual forecasting exercise, a few methodological notes are in order. First, in weighting our economies we use purchasing power parity (PPP) exchange rates as calculated by the IMF. These PPP rates ensure that all goods and services cost the same in all countries. While not a totally defensible assumption when discussing non-traded goods, it does have the benefit of analytical simplicity. Of note, on this measure China dominates the region with a weighting of almost 50%. Second, in order to help the exposition, and examine the region without the distorting effect of China, we use two well known sub-groupings for Asian economies. The Newly Industrialized Economies or NIEs includes Hong Kong, Korea, Singapore, and Taiwan. This group constitutes 16% of emerging Asia’s GDP and Korea constitutes the largest share with a weight of 50%. The ASEAN group includes Indonesia, Malaysia, the Philippines, and Thailand (Vietnam is excluded owing to data availability issues). This group constitutes 14% of regional GDP and Indonesia leads the way with a 42% weight.
Emerging Asia GDP Weights (PPP Basis)
49%
21%
16%
14%
0% 20% 40% 60%
China
India
NIEs
ASEAN
To date, the effects of the ongoing credit crisis on emerging Asia to have for the most part been limited to financial market channels. Although the direct exposure of the region’s financial institutions to sub-prime and related credits is relatively small, equity market contagion from advanced countries to emerging Asia has been high. Bond and swap spreads have widened in line with global trends as well. That being said, the wealth channel in emerging Asia is relatively small. Not surprisingly, the real effects of the crisis have so far been most pronounced in emerging Asia’s two money centres, Hong Kong and Singapore, where growth (q/q, sa) was negative in the second quarter of 2008.
Measuring the indirect effects of the credit crisis on Asia with the aim of obtaining an “all in” impact on growth is a challenging exercise. As we argued in “Emerging Asia in a Post-Lehman World” (17 September 2008), one simple approach is to focus on two key vulnerabilities—the dependency of growth on net exports and the current account deficit—in order to arrive at a ranking of regional economies in terms of their resilience to the current complex of external shocks. We concluded that the NIEs were vulnerable given their recent dependence on net exports for growth, and that India and Vietnam (and, more recently, Korea) were vulnerable as net capital importers; i.e., they are running a current account deficit.
In the context of the present exercise, the deepening of the credit crisis and its effects on financial institutions constitutes an additional source of vulnerabilities for the NIEs given their relatively advanced financial systems and the prominence of the financial sector in the macro economy. Indeed, as seen from the chart below, we are forecasting the steepest decline in growth in that group over the coming quarters.
Page 2

Emerging Asia Economics Monthly – October 2008
Page 3
Emerging Asia - GDP Growth
6un
-06
Sep-
06Dec
-06
Mar-0
7Ju
n-07
Sep-
07Dec
-07
Mar-0
8Ju
n-08
Sep-
08Dec
-08
Mar-0
9Ju
n-09
Sep-
09Dec
-09
Emerging Asia NIEs ASEAN-5
0
2
4
6
8
10
12
Mar-0
J
IndiaChina
In terms of the baseline forecast, the pace of growth for emerging Asia as a whole declines from about 8½% in the first half of 2008 to 7% in early 2009, before rising to nearly 8% by year end. The growth profiles for individual countries and groups vary according to their vulnerabilities.
• China continues to lead the region in terms of growth rates. However, quarterly growth (year-on-year) is forecast to decline from 10¼% percent in the first half of 2008 to just over 8½% in early 2009. This reflects the combination of a slowing a global economy and a rising, though still modest, contribution to growth from net exports with relatively heavy exposure to the U.S. and Europe.
• Growth in India, which accounts for one-fifth of the region’s GDP, drops from over 8% in early 2008 to 7% in the first quarter of 2009. Although India is a relatively closed economy, suggesting that the trade channel will have a limited impact on growth, capital inflows needed to finance part of investment (and growth) are seen as less forthcoming in the current period of heightened global risk aversion.
• The NIEs take the biggest hit in the region, for reasons noted above, with growth falling from over 6% in early 2008 to 3½% in late 2008 and 2009. The slowdown started earlier in this group, which tends to lead the region, and growth is thus expected to turn up sooner than elsewhere.
• The ASEAN group shows the least variability in its growth profile owing to its high reliance on domestic demand, the relatively low trade exposure to countries outside the region, and the beneficial effects of high commodity prices. For this group, growth is expected to moderate from 6% in early 2008 to 5% in early 2009.
On balance, we see the risks to these baseline forecasts to be on the downside. While there is a chance that domestic demand will prove to be somewhat more resilient than expected, there is a greater probability that the knock-on effects from the global financial turbulence will be more pronounced than currently envisaged. There is also a risk that political developments in Thailand and Malaysia could pull down growth as uncertainty about developments there increases. Finally, a sharper than expected downturn in the U.S. and Europe would likely have a disproportionately large negative effect on Asia given the region’s high growth beta, including dampening investment, a main factor in the recovery of domestic demand in recent years.
Paul Gruenwald

Emerging Asia Economics Monthly – October 2008
Page 4
Annex: Lehman-related Exposure by Asian Banks
In its bankruptcy petition on 15 September, Lehman Brothers listed outstanding debts amounting to $613 billion. As financial companies and investors worldwide scrambled to assess their exposures to Lehman, Fitch announced its preliminary findings on 16 September, suggesting that the net exposure to Lehman for banks in the Asia Pacific region is small for most part, and that the direct impact on banks will be limited.
Based on publicly available information, the largest disclosed Lehman exposures in Asia are being held by Japanese financial institutions, with a combined amount of $2.4 billion, mostly in the form of bonds or loans. This is followed by the Taiwanese financial institutions which reportedly hold about $1.2 billion in bonds and stocks linked to Lehman. The Korean regulator announced that its financial institutions held $720 million in Lehman-linked assets (loans, securities and derivatives) and the Chinese banks are reported to have a similar amount of exposure. Several banks in the rest of Asia have also announced small exposures to Lehman-linked assets, including in the money centres of Hong Kong and Singapore.
As most of these numbers pertain only to on-balance sheet exposure, we believe that the full impact on the banks’ financial performance could be greater and certainly more complex than these preliminary numbers suggest. For example, we understand that Lehman created $30.5 billion worth of structured notes for clients. For a start, the credit provisions for potential losses will be adding to the banks’ existing burden of write-downs arising from turbulence in the global financial markets. As a result, banks’ earnings in second-half of fiscal 2008 and probably the first-half of fiscal 2009 will be adversely affected.
Ivy Tan
Exposure to Lehman-linked Assets (US$ million)
Japanese Banks 2,400 Chinese Banks 722
Aozoro Bank 463 China Construction Bank 191
Mizuho Trust 382 Industrial & Commercial Bank of China 152
Shinsei Bank 231 Bank of China 129
UFJ Bank 185 China Citic Bank 76
Sumitomo Bank 177 China Merchants Bank 70
Chuo Mitsui Trust 144 Bank of Communications 70
Shinkin Central 93 Industrial Bank 34
Nippon Life Ins 46 Hong Kong Banks (HKMA) 0.05% of total banking assets
Taiwanese Banks (Taiwanese regulator)
1,200 Bank of China, Hong Kong 69
Mega Financial 116 Philippine Banks (Bangko Sentral ng Pilipinas)
386
Shin Kong Financial 80 Banco de Oro Unibank 134
Tai Shin Financial 56 Development Bank of Philippines 90
Cathay Financial 33 Metropolitian Bank and Trust Co. 71
Central Reinsurance 32 Rizal Commercial Bank 40
Fubon Financial 27 Bank of Commerce 15
Entie Bank 24 United Planeters Bank 10
Bank of Kaohsiung 18 Thai Banks (Bank of Thailand)
124
Hua Nan Financial 73 Bangkok Bank 102
Polaris Securities 11 Indian Banks
ING Life Taiwan 9 ICICI Bank 81
Taiwan Business Bank 7 Indonesian Banks (Bank Indonesia) Limited
SinoPac Financial 2 Singapore Banks
First Financial 44 DBS Insignificant
Bank of Taiwan 25 UOB Insignificant
South Korea Banks (Financial Services Commissions)
720
Source: Reuters, Bloomberg (Updated as at 29 Sep 2008)

Emerging Asia Economics Monthly – October 2008
Page 5
Macro Economic Forecasts Real GDP (%)
2005 2006 2007 2008f 2009f
China 10.1 10.7 11.6 9.8 8.9
Hong Kong 7.1 6.8 6.5 4.4 4.8
India 8.0 7.4 7.9 8.0 7.5
Indonesia 5.7 5.5 6.3 6.2 5.8
Korea 4.1 5.2 4.9 4.7 4.5
Malaysia 5.3 5.8 6.3 6.1 5.4
Philippines 4.9 5.4 7.2 4.5 4.9
Singapore 7.3 8.2 7.7 3.8 4.5
Taiwan 4.1 4.9 5.7 4.1 3.8
Thailand 4.5 5.1 4.7 5.3 5.3
Vietnam 8.4 8.2 8.5 6.4 6.6
Inflation (%) Sep-08 Oct-08 Nov-08 Dec-08 2008f
China 4.7 4.6 4.0 2.9 6.2
Hong Kong 4.3 4.0 4.0 3.6 4.8
India 12.2 12.1 12.1 12.1 10.0
Indonesia 11.5 10.9 10.9 10.1 9.4
Korea 5.4 4.9 5.0 4.7 4.8
Malaysia 8.5 8.4 8.3 7.8 6.0
Philippines 11.9 11.6 11.0 10.3 9.6
Singapore 6.6 5.9 5.6 5.2 6.6
Taiwan 3.8 3.7 3.8 4.3 4.1
Thailand 6.1 5.3 4.9 4.9 6.2
Vietnam 27.8 27.2 26.0 23.1 23.5
Exports of Goods & Services (%) 2005 2006 2007 2008f 2009f
China* na na na na na
Hong Kong 10.5 9.6 8.1 4.9 6.9
India 5.9 3.7 6.4 11.4 10.5
Indonesia 16.9 9.5 8.0 15.2 12.3
Korea 8.5 11.9 12.0 11.1 11.0
Malaysia 8.4 7.0 4.1 7.7 8.6
Philippines 4.6 13.6 5.8 3.4 8.3
Singapore 12.1 11.4 6.6 7.1 6.9
Taiwan 7.5 10.7 8.8 7.8 7.1
Thailand 3.8 8.7 7.1 8.8 10.3
Vietnam* 21.0 23.0 22.0 17.0 15.0
Imports of Goods & Services (%) 2005 2006 2007 2008f 2009f
China* na na na na na
Hong Kong 7.8 9.2 8.8 4.6 6.6
India 8.3 5.0 3.7 3.1 2.5
Indonesia 18.1 8.5 8.9 15.1 10.8
Korea 7.3 11.4 11.8 9.0 11.6
Malaysia 8.9 8.7 5.3 6.9 9.5
Philippines 2.3 1.9 -4.3 4.4 7.1
Singapore 11.1 11.7 6.8 10.2 7.5
Taiwan 3.8 5.3 3.6 2.8 6.5
Thailand 8.7 2.6 3.5 7.3 7.9
Vietnam* 18.0 22.0 39.0 19.0 9.0 *Data on an expenditure basis are not available for China.

Emerging Asia Economics Monthly – October 2008
Page 6
Overview: FX and Rates Strategy Asia
Our view that growth risks would trump inflation in H2 has materialized, albeit in a much more dramatic fashion and at a much more accelerated pace than what we had anticipated. The barrage of shocks now hitting the global financial system—triggered by the dizzying Lehman-Merrill-AIG weekend in mid September—has markedly downgraded global growth prospects, trumping inflation concerns in the process.
To date, FX markets have been punishing those Asian economies with current account deficits—South Korea and India. The countries with relatively small current account surpluses have also been under-performers in the region—the Philippines and Thailand. Going forward, we expect FX markets to start to target the currencies with the largest export exposures and the more developed financial sectors—notably Taiwan and Singapore.
For the first time in over 20 years Taiwan posted back-to-back trade deficits in July and August—so cracks have started to develop there. Meanwhile, swift policy U-turns by China’s PBoC and Taiwan’s CBC pave the way for easing by Singapore’s MAS—which we expect to surprise markets in coming days with a move to a neutral FX policy. In short, the relentless downtrend in USD-CNY, USD-TWD and USD-SGD is not expected to continue.
In rates markets, the weaker trajectory for global growth should generally compress yields and steepen curves. However, where inflation remains in the double-digits—India, Indonesia, the Philippines and Vietnam—progress at the front-end of the curve will be constrained by improvement in CPI figures or, alternatively, a clear shift in central bank policy to a growth focus. There is still some risk that India’s RBI and Indonesia’s BI will tighten one more time this cycle, demonstrating their inflation-fighting credentials ahead of elections next year, but our baseline scenario is for both central banks to stand pat amid the global turmoil.
Tamara Henderson
Performance within AXJ (ytd % chg)
-20%
-15%
-10%
-5%
0%
5%
10%
15%
CNY-
AXJ
TWD-
AXJ
HKD-
AXJ
SGD-A
XJ
IDR-
AXJ
VND-
AXJ
MYR-A
XJ
PHP-
AXJ
THB-
AXJ
INR-
AXJ
KRW
-AXJ

Emerging Asia Economics Monthly – October 2008
Page 7
Foreign Exchange and Policy Rate Forecasts
Current Dec-08 Mar-09 Jun-09 Sep-09 Dec-09
China
USD/CNY 6.846 6.95 7.00 6.95 6.90 6.85
AUD/CNY 5.425 6.00 5.80 5.60 5.40 5.20
PBOC 1-yr-base lending rate 7.20 7.02 6.84 6.65 6.65 6.65
Hong Kong
USD/HKD 7.765 7.80 7.83 7.81 7.80 7.80
AUD/HKD 6.153 6.70 6.50 6.20 6.10 5.90
HKMA discount rate 3.50 3.25 3.25 3.25 3.25 3.75
India
USD/INR 46.96 48.00 49.00 48.00 47.00 46.00
AUD/INR 37.22 41.30 40.70 38.40 36.70 35.00
RBI repo rate 9.00 9.00 9.00 8.50 8.50 8.50
Indonesia
USD/IDR 9506 9600 9800 9700 9600 9400
AUD/IDR 7532 8256 8134 7760 7488 7144
BI bank rate 9.25 9.00 9.00 9.00 9.00 9.00
Malaysia
USD/MYR 3.44 3.50 3.60 3.60 3.50 3.50
AUD/MYR 2.72 3.00 3.00 2.90 2.80 2.60
BNM overnight policy rate 3.50 3.50 3.50 3.50 3.50 3.50
Philippines
USD/PHP 47.05 49.00 50.00 49.80 49.50 49.00
AUD/PHP 37.28 42.10 41.50 39.80 38.60 37.20
BSP overnight reverse repo 6.00 6.00 5.75 5.50 5.50 5.00
Singapore
USD/SGD 1.435 1.46 1.53 1.54 1.52 1.50
AUD/SGD 1.137 1.26 1.27 1.23 1.19 1.14
3-month SIBOR 1.85 1.30 0.90 1.00 1.30 1.50
South Korea
USD/KRW 1207 1260 1300 1275 1250 1225
AUD/KRW 956 1084 1079 1020 975 931
BOK overnight call rate 5.25 5.00 4.75 4.50 4.50 4.50
Taiwan
USD/TWD 32.21 34.00 35.00 34.50 34.00 33.50
AUD/TWD 25.52 29.20 29.10 27.60 26.50 25.50
BOC discount rate 3.50 3.38 3.25 3.13 3.13 3.13
Thailand
USD/THB 33.86 35.50 36.00 35.80 35.30 34.80
AUD/THB 26.83 30.50 29.90 28.60 27.50 26.40
BOT 1-day repo rate 3.75 3.75 3.75 3.75 3.75 3.75
Vietnam
USD/VND 16600 16600 16600 16500 16300 16100
AUD/VND 13154 14280 13780 13200 12710 12240
SBV base lending rate 14.00 13.50 13.00 12.50 12.50 11.00

Emerging Asia Economics Monthly – October 2008
Page 8
Long Term Foreign Currency Government Bond Ratings Moody's S&P Fitch
Investment Grade
China A1 A+ A+
Hong Kong Aa2 AA+ AA
India Baa2 BBB- BBB-
Korea A2 A A+
Malaysia A3 A- A-
Singapore Aaa AAA AAA
Taiwan Aa3 AA- A+
Thailand Baa1 BBB+ BBB+
Sub-Investment Grade
Cambodia B1 B+ NR
Indonesia Ba3 BB- BB
Philippines B1 BB- BB
Vietnam Ba3 BB BB-
* : denotes an upgrade in the current month; # : denotes a downgrade in the current month.
Source: Bloomberg

Emerging Asia Economics Monthly – October 2008
Page 9
Country Update: China
China-Inflation
0
2
4
6
8
10
12
Jan-
06
Apr-0
6
Jul-0
6
Oct-0
6
Jan-
07
Apr-0
7
Jul-0
7
Oct-0
7
Jan-
08
Apr-0
8
Jul-0
8
Consumer Prices (y/y)Producer Prices (y/y)
China-Domestic Demand Indicators
-10
0
10
20
30
40
50
60
Jan-
06Ap
r-06
Jul-0
6Oct
-06
Jan-
07Ap
r-07
Jul-0
7Oct
-07
Jan-
08Ap
r-08
Jul-0
8
Vehicle Sales (y/y)Industrial Value-added (y/y)
China-Trade Development (y/y)
0
5
10
15
20
25
30
35
40
Jan-
06
Apr-0
6
Jul-0
6
Oct-0
6
Jan-
07
Apr-0
7
Jul-0
7
Oct-0
7
Jan-
08
Apr-0
8
Jul-0
8
Export Growth (3mma)
Import Growth (3mma)
Consumer price inflation has clearly peaked, although producer price inflation remains at a cyclical high. The pace of activity appears to be moderating, although indicators are mixed, while exports are holding up well. Equity markets had a wild ride in September, tracking global financial and credit market concerns. The authorities have room to ease policy settings should growth slow more than expected.
• Consumer price inflation has clearly peaked, falling to 4.9% (y/y) in August after reaching 8.7% in February. This result reflects declining food prices—food inflation fell 4ppt to 10.3% while non-food inflation was steady at 2.1% However, producer price inflation remains elevated at 10.1%.
• Surprising the markets, the People’s Bank of China cut its lending rate by 27 bps to 7.20%, the first central bank in Asia to lower its policy rate this year.
• Nominal retail sales growth continues to be robust, rising 23% in August on higher sales of garments, food and jewellery. However, vehicle sales growth (measured in units) dropped by 6.3% (y/y).
• Industrial production growth slowed to 12.8% in August, the lowest rate in six years. This reflected a continued moderation of the pace of activity, although sharp declines in steel, auto, and pig iron suggest that some of the decline reflects the authorities’ efforts to improve air quality during the Olympics. Lower export order growth was also a factor.
• Export growth continued at a healthy 21% (y/y) rate in August. Shipments to the EU are still rising at around 20% (YTD), but those to the U.S. are increasing at half that rate. Import growth has been declining reflecting lower prices, and was 23% (y/y) in August.
• China’s equity markets had a rollercoaster month. The Shanghai and Shenzhen indices declined by 15% in the first half of September, but recovered somewhat thereafter. That being said, both indices are down more than 50 percent for the year.
• We expect growth in China to continue to moderate as the external environment deteriorates and domestic demand eases. Should growth slow more than expected, the authorities have ample scope to ease policy settings. External vulnerability remains low.
Paul Gruenwald
Economic Data - China 248 217 186 155 124 93 62 31Monthly data Jan-08 Feb-08 Mar-08 Apr-08 May-08 Jun-08 Jul-08 Aug-08Industrial Production, % y/y N/A 15.4 17.8 15.7 16.0 16.0 14.7 12.8Retail Sales, % y/y 21.2 19.1 21.5 22.0 21.6 23.0 23.3 23.2Consumer Price Index, % y/y 7.1 8.7 8.3 8.5 7.7 7.1 6.3 4.9Exports, % y/y 26.6 6.4 30.6 21.8 28.1 17.7 26.9 21.1Imports, % y/y 27.5 35.1 24.8 26.6 40.1 31.2 33.6 22.9Trade Balance, US$ bn 19.5 8.6 13.4 16.7 20.2 21.4 25.3 28.7Foreign Exchange Reserves, US$ bn 1,589.8 1,647.1 1,682.2 1,756.7 1,797.0 1,808.8 N/A N/AQuarterly data Sep-06 Dec-06 Mar-07 Jun-07 Sep-07 Dec-07 Mar-08 Jun-08Real GDP, % y/y 10.6 10.4 11.7 12.6 11.5 11.3 10.6 10.1-Primary Sector 4.9 5.0 4.4 4.0 4.3 3.7 2.8 3.5-Secondary sector 13.3 13.0 13.2 13.7 13.5 13.4 11.5 11.3-Tertiary sector 11.8 12.1 11.3 12.1 12.7 12.6 10.9 10.5Nominal GDP, RMB tn 14.5 21.2 5.1 10.9 16.9 25.0 6.1 13.1Current Account, US$ bn (semi-annual) N/A 249.9 N/A 162.9 N/A 371.8 N/A N/ACapital Account, US$ bn (semi-annual) N/A 4.0 N/A 1.5 N/A 3.1 N/A N/A
Sources: CEIC, Bloomberg

Emerging Asia Economics Monthly – October 2008
Page 10
China: FX and Rates Strategy
CNY appreciation is over for now
6.2
6.4
6.6
6.8
7.0
7.2
Jan-
08
Apr-08
Jul-0
8
Oct-0
8
Jan-
09
Apr-09
Jul-0
9
Oct-0
9
USD-CNY
12M NDF
CNY gains vs AXJ (ytd % chg)
0%
5%
10%
15%
20%
25%
30%
35%
CNY-
TWD
CNY-
HKD
CNY-
SGD
CNY-
IDR
CNY-
VND
CNY-
MYR
CNY-
PHP
CNY-
THB
CNY-
INR
CNY-
KRW
2s-10s IRS expected to steepen
020406080
100120140160180200
Mar-0
7
Jun-
07
Sep-
07
Dec-0
7
Mar-0
8
Jun-
08
Sep-
08
Dec-0
8
Mar-0
9
Jun-
09
Sep-
09
Dec-0
9
The PBoC’s surprise easing went beyond the move to neutral monetary policy that we had been anticipating. It also signals the end of tolerance for a stronger CNY.
FX In the wake of Lehman’s filing for bankruptcy protection, the PBoC swiftly cut the one-year lending rate by 27 bps to 7.20% and reduced the reserve requirement by one percentage point for selected banks. The move caught markets (and ourselves) by surprise—as recent commentary by authorities had previously seemed to suggest a move to more of a dual focus on inflation and growth (i.e., a shift to neutral from its previously existing bias for tighter policy). Meanwhile, the ongoing barrage of shocks to the US/global financial system has seen a U-turn in market expectations of Fed policy, from tightening to loosening. The combination of actual PBoC easing and expected Fed easing has put USD-CNY in a holding pattern near 6.84. Meanwhile, the 12-month NDF outright is close to the 7.00 level. The key issue for USD-CNY going forward is whether the Chinese authorities prefer a weaker as opposed to a stable CNY. Given that the renminbi has gained 12% versus AXJ year-to-date—ranging from a low of 6% versus the Taiwan dollar to a high of 27% versus the Korean won—we would expect the Chinese authorities to tolerate some retrenchment toward the 7.000 level in USD-CNY over a six month horizon. Much more retrenchment might prove difficult to achieve for political reasons, but also because of China’s relatively strong fundamentals. Rates More rate cuts by the PBoC are anticipated, suggesting a downtrend in 2-year CNY IRS by year-end and further steepening in the 2s-10s IRS curve. The 2-year CNY IRS rate is seen at 2.6% by mid-2009 and the 2s-10s spread is seen widening to 90 bps, versus 54 bps currently.
Tamara Henderson
Market Forecasts - China FX Current Ytd (%) Dec-08 Mar-09 Jun-09 Sep-09 Dec-09 USD-CNY 6.846 -6.3% 6.95 7.00 6.95 6.90 6.85 AUD-CNY 5.425 -15.0% 6.00 5.80 5.60 5.40 5.20 NZD-CNY 4.590 -17.9% 4.50 4.80 4.50 4.30 4.20
Rates Current Ytd
(bps) Dec-08 Mar-09 Jun-09 Sep-09 Dec-09 PBOC's 1-year base lending rate 7.20 -27 7.02 6.84 6.65 6.65 6.65 2-year IRS (versus 7-day repo fix) 3.12 -66 2.9 2.8 2.6 2.6 2.7 5-year IRS 3.25 -85 3.1 3.0 2.9 2.9 3.0 10-year IRS 3.66 -94 3.6 3.5 3.5 3.5 3.5
Sources: ANZ, Bloomberg

Emerging Asia Economics Monthly – October 2008
Page 11
Country Update: Hong Kong
Hong Kong-Inflation
0
1
2
3
4
5
6
7
Jan-
06Ap
r-06
Jul-0
6Oct
-06
Jan-
07Ap
r-07
Jul-0
7Oct
-07
Jan-
08Ap
r-08
Jul-0
8
CPI (y/y)
Hong Kong-Trade Developments
02468
101214161820
Jan-
06
Apr-06
Jul-0
6
Oct-0
6
Jan-
07
Apr-07
Jul-0
7
Oct-0
7
Jan-
08
Apr-08
Jul-0
8
Exports (3mma)
Imports (3mma)
Hong Kong - Stock Index
17000
22000
27000
32000
37000
42000
47000
Jan-
08
Feb-
08
Mar-0
8
Apr-08
May-0
8
Jun-
08
Jul-0
8
Aug-
08
Sep-
08
Hang Seng IndexHang Seng Finance Index
Inflation continues to decline as growth has stalled, commodity prices have fallen, and the government waived rents and introduced modest subsidies. Exports slowed as the global downturn and financial market turmoil reduced external demand. In contrast, domestic demand appears to be somewhat resilient, as retail sales firmed and unemployment remained stable. Global financial turbulence has resulted in a volatile Hang Seng Index. Going forward, Hong Kong appears relatively vulnerable on the growth front.
• Inflation slowed to 4.6% (y/y) in August from 6.3% in July owing to slower growth and declining commodity prices. This also reflected the government waiving rents to help low-income residents and introducing subsidies for food, transport, and electricity costs.
• Hong Kong’s export growth fell to 1.9% (y/y) in August from 11.1% in July as the global slowdown and financial market turmoil have reduced global demand for Chinese products shipped through Hong Kong.
• Hong Kong’s retail sales growth unexpectedly picked up to 13.8% (y/y) in July from 11.7% in June as visitor arrivals from China increased.
• Despite the slowdown, the seasonally adjusted unemployment rate was unexpectedly stable at 3.2% in the quarter ending in August. The ongoing financial market turbulence is expected to cost financial sector jobs going forward.
• Reacting to the news of Lehman and AIG, the Hang Seng Index plunged by 9% over the week of 15 September and only partially rebounded later in the month. Nonetheless, prices of local financial stocks continued to decline, with the Hang Seng Financial index dropping by 2% over the past two weeks.
• We expect growth to continue to decline into early 2009 as Hong Kong’s open and financial services-based economy will be relatively hard hit by turbulence in global financial markets. A key risk is the extent to which growth in Mainland China slows.
Ivy Tan
Economic Data - Hong KongMonthly data Jan-08 Feb-08 Mar-08 Apr-08 May-08 Jun-08 Jul-08 Aug-08Retail Sales, % y/y 23.3 9.6 20.1 18.6 13.1 11.7 13.7 N/AComposite Consumer Price Index sa, % y/y 3.0 6.5 4.1 5.4 5.7 6.1 6.2Exports, % y/y 15.8 7.6 7.6 14.5 10.3 -0.6 11.1 9.0Imports, % y/y 16.9 11.9 6.6 11.3 15.4 1.3 15.4 10.8Trade Balance, US$ bn -1.0 -2.0 -3.6 -2.1 -3.5 -3.1 -2.5 -2.5Foreign Exchange Reserves, US$ bn 155.2 156.2 157.1 155.7 154.2 152.1 153.3 N/AQuarterly data Sep-06 Dec-06 Mar-07 Jun-07 Sep-07 Dec-07 Mar-08 Jun-08Industrial Production, % y/y -0.7 -1.4 -1.6 -2.3 -2.0 -0.3 -4.4 -4Real GDP, % y/y 6.4 6.6 5.5 6.2 6.8 6.9 7.3-Private consumption 4.6 6.0 4.5 6.6 10.6 9.5 7.9 3.1-Government consumption -0.9 1.3 2.3 3.0 1.5 2.3 0.3-Gross fixed capital formation 10.0 7.5 0.8 8.1 -0.5 8.2 9.9 4.3Nominal GDP, HKD bn 375.6 400.3 373.6 380.1 413.8 448.7 410.2 404.1Current Account, US$ bn 7.7 7.2 8.2 3.3 8.4 8.1 6.6 4.4Capital & Financial Account, US$ bn -10.1 -9.3 -6.9 -5.1 -10.3 -9.8 -4.3 -2.6
6.0
.24.2
3.5
Sources: Bloomberg, CEIC

Emerging Asia Economics Monthly – October 2008
Page 12
Hong Kong: FX and Rates Strategy
USD-HKD to move above mid-point
7.75
7.78
7.80
7.83
7.85
Feb-
08
May-0
8
Aug-
08
Nov-
08
Feb-
09
May-0
9
Aug-
09
Nov-
09
USD-HKD diverging from 2Y spread
-20-10
01020304050607080
30-Jun
14-Jul
28-Jul
11-A
ug
25-A
ug
8-Se
p
22-S
ep7.757.767.777.787.797.807.817.827.837.847.85
2Y US-HK IRS spread
USD-HKD spot
IRS rates to compress
2.0
2.5
3.0
3.5
4.0
4.5
5.0
5.5
Mar-0
7
Jun-
07
Sep-
07
Dec-0
7
Mar-0
8
Jun-
08
Sep-
08
Dec-0
8
Mar-0
9
Jun-
09
Sep-
09
Re-coupling reinforces the viability of an already solid HK-US dollar currency peg, and should keep USD-HKD in the upper half of the trading band. US Congressional approval of a $700bn bailout should ease liquidity conditions, normalizing HKD swap rates to the benefit of receiver positions. FX The deteriorating global growth outlook combined with substantial stress in the global financial system present a substantial risk of a technical recession in Hong Kong, where GDP growth already contracted in Q2 (for the first time since SARS). Exports contribute close to 200% of Hong Kong’s GDP. Meanwhile, Hong Kong’s more developed financial market is more vulnerable to the recent barrage of shocks to the global financial system. Hong Kong’s current account surplus is ample at 8.5% of GDP, but a significant narrowing is likely. The resurgence of the re-coupling theme—i.e. the rotation of US weakness to the rest of the world—serves to reinforce the viability of the HK-US dollar currency peg. It should also put to rest the speculation heard earlier in the year of a possible revaluation of the HKD. With growth trumping inflation concerns via two channels (the real and financial sectors), USD-HKD should find support in the upper half of the 7.75-7.85 trading range. Rates Because of its currency peg, movements in Hong Kong interest rates closely track US Treasuries. Market expectations for Fed tightening have completely unwound, now pricing in substantial risk of a cut in October. At the same time, the global liquidity crunch has seen swap rates balloon amid a scramble to hold cash. The US government’s bailout package should ease liquidity conditions, compressing rates across the HKD IRS curve to the benefit of receiver positions.
Tamara Henderson
Market Forecasts - Hong Kong FX Current Ytd (%) Dec-08 Mar-09 Jun-09 Sep-09 Dec-09 USD-HKD 7.765 -0.4% 7.80 7.83 7.81 7.80 7.80 AUD-HKD 6.153 -9.8% 6.7 6.5 6.2 6.1 5.9 NZD-HKD 5.201 -12.9% 5.1 5.3 5.1 4.9 4.8
Rates Current Ytd
(bps) Dec-08 Mar-09 Jun-09 Sep-09 Dec-09 HKMA's discount rate 3.50 -225 3.25 3.25 3.25 3.25 3.75 2-year IRS (onshore versus 3M HIBOR) 3.02 -41 2.8 2.7 2.6 2.8 3.3 5-year IRS 3.45 -34 3.3 3.2 3.2 3.3 3.6 10-year IRS 3.64 -37 3.6 3.5 3.5 3.6 3.7
Sources: ANZ, Bloomberg

Emerging Asia Economics Monthly – October 2008
Page 13
Country Update: India
India-Inflation
0
2
4
6
8
10
12
14
Jun-
06
Sep-
06
Dec-0
6
Mar-0
7
Jun-
07
Sep-
07
Dec-0
7
Mar-0
8
Jun-
08
Sep-
08
WPI (3mma)
India-Trade Developments
05
101520253035404550
Jan-
06
Apr-06
Jul-0
6
Oct-0
6
Jan-
07
Apr-07
Jul-0
7
Oct-0
7
Jan-
08
Apr-08
Jul-0
8
Oct-0
8
Exports (3mma)
Imports (3mma)
India-Net Foreign Equity Flows ($bn)
-5-4-3-2-1012345
Jan-
06
Apr-06
Jul-0
6
Oct-0
6
Jan-
07
Apr-07
Jul-0
7
Oct-0
7
Jan-
08
Apr-08
Jul-0
8
Inflation is finally moderating, while manufacturing and export growth remain robust—supported by a much more competitive rupee. The Reserve Bank of India (RBI) has a new Governor, Dr. Subbarao, who said it is essential to contain inflation, but also that he would be mindful of growth prospects.
• Inflation has started to moderate, helped by softer prices for fuel and manufactured products. The WPI fell for three consecutive weeks in August, with the most recent reading for the week ending September 6 at 12.14% (y/y) versus the peak of 12.63% in August.
• Domestic demand is weakening, weighed by higher prices and interest rates. Motor vehicle sales slowed to 9.6% (y/y) in August compared with 14.2% in July. In particular, domestic passenger car sales continued to fall, dropping 4.4% (y/y) in August following July’s decline of 1.7%, the first decline in over 2½ years.
• Industrial production exceeded expectations in July, rising 7.1% (y/y) versus 5.4% in June. The primary driver was a 21.9% increase in capital goods production (versus 8.3% in June) and a surprising 11.2% (y/y) gain in consumer durables production (versus 3.7% in June and -2.7% last year).
• Export growth accelerated to 31.2% (y/y) in July, from 23.5% in June, propelled by shipments of gems, auto parts, medicines, and other manufactured products reflecting a much more competitive exchange rate. Import growth also jumped to 48.1%, bringing India’s trade deficit to a record $10.8bn.
• Capital inflows continued to recede in tandem with the reduction in global risk appetite, with net foreign equity investment down $9.2bn year-to-date, compared with a gain of $17.4bn in all of 2007. The BSE Sensex equity index shed another 12% in September.
• The RBI has a new Governor, Dr. Subbarao, who said it is essential to contain inflation. Asked about further tightening this year, he said there were several unknowns, including the impact of measures already taken, and the impact of global developments. We do not expect further tightening by the RBI during this cycle.
• We cut our annual GDP forecast to 7.5% in 2009 with growth bottoming at 7% (y/y) in Q2. This is based on a more pessimistic outlook for investment, given recent events in the global financial markets.
Tamara Henderson
Economic Data - IndiaMonthly data Jan-08 Feb-08 Mar-08 Apr-08 May-08 Jun-08 Jul-08 Aug-08Industrial Production, % y/y 6.2 9.5 5.5 6.2 4.1 5.4 7.1 N/AAutomobile Sales, % y/y -5.0 -4.9 4.9 12.3 9.2 8.7 15.3 11.7Wholesale Price Index, % y/y 4.1 5.7 7.7 8.3 9.4 12.0 12.0 12.6Exports, % y/y 35.7 40.7 18.6 31.5 12.9 23.5 31.2 NImports, % y/y 63.9 46.7 35.9 36.6 27.1 25.9 48.1 NTrade Balance, US$ bn -7.8 -5.9 -8.0 -9.9 -10.8 -9.8 -10.8 N/AForei
/A/A
gn Exchange Reserves, US$ bn 283.6 291.3 299.2 304.2 304.9 302.3 295.9 N/AQuarterly data Sep-06 Dec-06 Mar-07 Jun-07 Sep-07 Dec-07 Mar-08 Jun-08Real GDP, % y/y 10.1 9.3 9.7 9.2 9.3 8.8 8.8 7.9-Agriculture 3.2 4.0 4.9 4.4 4.7 6.0 2.9 3.0-Industry 12.1 11.1 12.6 9.9 10.0 8.8 8.0 7.4-Services 11.5 11.1 10.3 11.0 10.5 10.4 11.2 10Nominal GDP, INR tn 8.6 10.2 10.4 9.9 9.8 11.4 11.9 11Current Account, US$ bn -6.3 -3.7 4.3 -6.3 -4.9 -5.1 -1.0 NCapital Account, US$ bn 8.8 11.0 15.6 17.3 34.0 31.3 25.4 N
.0
.5/A/A
Sources: Bloomberg, CEIC

Emerging Asia Economics Monthly – October 2008
Page 14
India: FX and Rates Strategy
USD-INR seen even higher
39
41
43
45
47
49
51
Jan-
08
Apr-08
Jul-0
8
Oct-0
8
Jan-
09
Apr-09
Jul-0
9
Oct-0
9
2Y IRS buffeted by cross-winds
6.06.57.07.58.08.59.09.5
10.010.5
Jan-
08
Apr-08
Jul-0
8
Oct-0
8
Jan-
09
Apr-09
Jul-0
9
Oct-0
9
RBI repo rate
2Y IRS
Escalating risk aversion and continued pressure from the current account should generate further advances in USD-INR as we head into 2009. Tough talk on inflation by the RBI’s new governor will not translate into rate hikes in the current global environment, but presents two-way risk for IRS.
FX As the breadth and depth of the global slowdown has increased, risk appetite has continued to deteriorate—keeping the rupee under significant pressure. We don’t expect this pressure to abate any time soon, given the continued outflow of foreign portfolio flows ($1.9bn in August alone) as well as the FX market’s aversion for Asian currencies with current account deficits. The rupee has plunged 19% year-to-date versus the US dollar, and has dropped 11% versus AXJ. Although this is giving Indian exports a boost, the trade deficit still managed to hit a new record in July. With INR under pressure from both sides of the balance of payments, USD-INR is expected to be trading near the 48.0 level by year-end (versus 46.96 currently). Rates The RBI has a new governor, Dr. Subbarao, who’s commentary in the press suggests that the battle against inflation remains a key focus. With WPI still at 12% and elections due before May, the RBI has no choice but to maintain the hawkish rhetoric. However, we don’t expect the tough talk to translate into action—particularly given the ongoing sequence of blows to the global financial system. Although inflation has yet to make a significant retreat from double-digit rates, it is clear that Indian CPI has peaked. Also the key driver of Indian GDP growth—domestic demand—is slowing. Ultimately, this will translate into further compression in Indian IRS rates. The 2-year INR IRS rate is expected to shed 30 bps by end-March.
Tamara Henderson
Market Forecasts - India FX Current Ytd (%) Dec-08 Mar-09 Jun-09 Sep-09 Dec-09 USD-INR 46.96 19.1% 48.0 49.0 48.0 47.0 46.0 AUD-INR 37.22 7.9% 41.3 40.7 38.4 36.7 35.0 NZD-INR 31.47 4.3% 31.2 33.3 31.2 29.6 28.1 Rates Current Ytd (bps) Dec-08 Mar-09 Jun-09 Sep-09 Dec-09 RBI's repo rate 9.00 125 9.00 9.00 8.50 8.50 8.50 2-year IRS (versus NSE MIBOR) 8.56 167 8.5 8.3 8.0 8.0 8.1 5-year IRS 8.28 125 8.2 8.1 7.9 7.9 8.0 10-year IRS 8.33 116 8.3 8.2 8.1 8.1 8.2
Sources: ANZ, Bloomberg

Emerging Asia Economics Monthly – October 2008
Page 15
Country Update: Indonesia
Indonesia - Inflation
05
101520253035404550
Jan-
06
Apr-06
Jul-0
6
Oct-0
6
Jan-
07
Apr-07
Jul-0
7
Oct-0
7
Jan-
08
Apr-08
Jul-0
8
CPI (y/y)3mma/3mma
Indonesia - Trade Developments
-20-10
010203040506070
Jan-
06
Apr-06
Jul-0
6
Oct-0
6
Jan-
07
Apr-07
Jul-0
7
Oct-0
7
Jan-
08
Apr-08
Jul-0
8
Exports
Imports
Indonesia-Domestic Demand Indicators
-60
-40
-20
0
20
40
60
80
Jan-
06
Apr-0
6
Jul-0
6
Oct-0
6
Jan-
07
Apr-0
7
Jul-0
7
Oct-0
7
Jan-
08
Apr-0
8
Jul-0
8
Cement Consumption (3mma)Vehicle Sales (3mma)
Inflation remained near a 22-month high in August, and the Bank of Indonesia raised its benchmark rate in September for the fifth time this year. Robust vehicle and motorcycles sales and non-oil imports point to robust domestic demand and export growth continues to be strong. Indonesia was relatively unaffected by the recent financial market turmoil and growth prospects remain favourable.
• Inflation was 11.85% (y/y) in August, near a 22-month high, as food prices rose by almost 20%.
• The Bank of Indonesia raised its policy rate by 25bps to 9.25% in September, the fifth straight increase this year, as inflation hovered near its 22 month high. The central bank in raising rates stated the need to curb domestic demand within safe limits to achieve its 2009 inflation target of 6.5% - 7.5%.
• Domestic demand indicators show continued strength. Vehicles and motorcycles grew by 41% (y/y) and 43.3% (y/y) respectively in August. Also, import data in July point to strong domestic demand as non-oil imports rose 68.8% from the previous month’s 63.4%.
• Industrial production for June rose 1.5% versus 3.8% the previous month. This growth was the weakest in 20 months. The biggest contractions were in the manufacture of transport equipment, refined petroleum and motor vehicles, which fell 57.1%, 36.7% and 21.6% respectively.
• Exports continued to grow robustly at 25% (y/y) in July. There was no major reduction in growth to any of Indonesia’s major markets (Australia, Singapore, and the US).
• The rupiah fell by 3.2% against the US dollar in September reflecting a rise in global risk aversion following the intensification of the credit crisis.
• Foreign portfolio investments in equities continue to hold up in spite of the 32.4% fall in the equity market this year. There has been $807 million net inflows so far in 2008.
Joshua Saldanha
Economic Data - IndonesiaMonthly data Jan-08 Feb-08 Mar-08 Apr-08 May-08 Jun-08 Jul-08 Aug-08Industrial Production, % y/y 5.8 9.5 2.5 2.8 3.8 1.4 1.4 N/ARetail Sales Index, % y/y -1.7 11.7 1.7 10.3 7.5 7.4 6.9 N/AConsumer Price Index, % y/y 7.4 7.4 8.2 9.0 10.4 11.0 11.8 N/AExports, % y/y 34.5 28.7 32.5 22.5 31.6 34.9 25.0 N/AImports, % y/y 42.0 68.8 41.1 65.7 49.8 63.4 68.8 N/ATrade Balance, US$ bn 3.7 2.7 4.0 1.6 3.2 3.1 1.8 N/AForeign Exchange Reserves, US$ bn 53.4 54.4 56.4 56.2 54.9 56.8 58.0 55.9Quarterly data Sep-06 Dec-06 Mar-07 Jun-07 Sep-07 Dec-07 Mar-08 Jun-08Real GDP, % y/y 5.9 6.0 6.1 6.4 6.5 6.3 6.3 6.4-Private consumption 3.0 3.8 4.7 4.7 5.1 5.6 5.7 5.3-Government consumption 1.7 2.2 3.7 3.8 3.3 2.0 4.7 2.2-Gross fixed capital expenditure 0.8 6.8 7.0 6.9 10.4 12.1 15.4 12.8Nominal GDP, IDR tn 870.6 873.2 920.2 962.8 1,033.3 1,041.1 1,122.1 1,230.9Current Account, US$ bn 3.8 2.2 2.6 2.3 2.1 3.4 2.3 -1.5Capital & Financial Account, US$ bn -1.2 1.3 1.8 2.0 -0.9 0.5 -0.3 3.7
Sources: Bloomberg, CEIC

Emerging Asia Economics Monthly – October 2008
Page 16
Indonesia: FX and Rates Strategy
USD-IDR to break current range
9,000
9,200
9,400
9,600
9,800
10,000
10,200
10,400
May-0
7
Aug-
07
Nov-
07
Feb-
08
May-0
8
Aug-
08
Nov-
08
Feb-
09
May-0
9
Aug-
09
Nov-
09
USD-IDR
12M NDF
IDR moves within AXJ (ytd % chg)
-10%
-8%
-6%
-4%
-2%
0%
2%
4%
IDR-
CNY
IDR-
TWD
IDR-
HKD
IDR-
SGD
IDR-
VND
IDR-
MYR
IRS to track CPI lower
8.5
9.0
9.5
10.0
10.5
11.0
11.5
12.0
12.5
Jul-0
8
Oct-0
8
Jan-
09
Apr-09
Jul-0
9
Oct-0
9
2Y IRSBI rate
The rupiah is among the group of out-performers in AXJ this year, benefiting from robust domestic demand and still buoyant exports. FX markets have also found Indonesia’s large current account surplus appealing amid the current financial storm. We expect IDR to remain attractive versus the USD and AXJ as global conditions continue to deteriorate.
FX Indonesia is better placed than many of its Asian counterparts to ride out the deterioration in global growth—enjoying a comfortable external position as well as smaller export exposure. Also, FDI and foreign portfolio flows have held up quite well so far this year. Although there is still upward momentum in Indonesian inflation, the outlook has improved greatly. Global demand is slowing, food and fuel prices are in a down-trend, and 100 bps of past BI tightening should be feeding through the economy just as elections come due next year. It is a close call, but we do not expect to see any more tightening by BI over the next 12 months. Nevertheless, a BI promise to return to single digit inflation before end-2008 will require continued stability in the rupiah to deliver on this pledge. Hence, in spite of the barrage of shocks hitting the global financial system, IDR is unlikely to wander very far from the current 9000-9500 trading range. Although IDR has been an out-performer within AXJ this year, the currency would seem to still offer good value versus TWD, SGD and HKD—economies with much greater sensitivity to financial market shocks and much larger exposure to the ongoing deterioration in global growth prospects. Rates An extended pause in BI tightening and heightened risk aversion point to lower IRS rates, favouring receiver positions. The market will take its cue from inflation data—seen very close to single digits by year-end (at 10.1%).
Tamara Henderson
Market Forecasts - Indonesia FX Current Ytd (%) Dec-08 Mar-09 Jun-09 Sep-09 Dec-09 USD-IDR 9506 1.2% 9600 9800 9700 9600 9400 AUD-IDR 7532 -8.4% 8256 8134 7760 7488 7144 NZD-IDR 6367 -11.5% 6240 6664 6305 6048 5734 Rates Current Ytd (bps) Dec-08 Mar-09 Jun-09 Sep-09 Dec-09 BI's bank rate 9.25 125 9.00 9.00 9.00 9.00 9.00 2-year IRS (versus IDR fix) 11.25 375 11.0 10.9 10.6 10.4 10.1 5-year IRS 11.33 308 11.2 11.1 10.9 10.7 10.6 10-year IRS 11.45 255 11.4 11.3 11.2 11.2 11.1
Sources: ANZ, Bloomberg

Emerging Asia Economics Monthly – October 2008
Page 17
Country Update: Malaysia
Malaysia - Trade Developments
-10-505
1015202530
Jan-
06
Apr-06
Jul-0
6
Oct-0
6
Jan-
07
Apr-07
Jul-0
7
Oct-0
7
Jan-
08
Apr-08
Jul-0
8
Exports (y/y)
Imports (y/y)
Malaysia - Vehicle growth (y/y)
-40-30-20-10
0102030405060
Jan-
06
Apr-0
6
Jul-0
6
Oct-0
6
Jan-
07
Apr-0
7
Jul-0
7
Oct-0
7
Jan-
08
Apr-0
8
Jul-0
8
Malaysia-KLCI Index
900
1000
1100
1200
1300
1400
1500
1600
Jan-
08
Mar
-08
Apr-08
Jun-
08
Aug-
08
In spite of the global slowdown, Malaysia’s exports continue to hold up well. Inflation remained high in August, but has probably peaked and Bank Negara seems likely to stand pat on rates. Weaker industrial production and vehicle sales data point to some growth easing. On the political front, pressure heats up on the incumbent premier to step down.
• Inflation stayed at a 26-year high in August, rising 8.5% (y/y). Food and fuel drove the increase, rising 11.6%.
• Domestic demand growth appears to be easing. Industrial production increased by only 2.3% (3mma y/y) for July down from 3.4% in June. Meanwhile, vehicles sales contracted by 0.8% (y/y) in August after rising 20.2% (y/y) in July.
• Exports continued to hold up well despite the global slowdown, rising 25.4% (y/y) in July. Exports to the European Union and North America posted strong growth. Imports rose 14.8% (y/y) in July, up from 12.5% in June.
• With the global credit crisis intensifying, the Malaysian one month interbank LABUAN rate increased to 5.5%, up from 2.5% in August. Equity markets have fallen in line with others regionally, and are down about 30% this year.
• Political tensions have increased since the popular opposition leader Anwar Ibrahim stated he wants to oust the ruling party, putting pressure on Prime Minister Abdullah Badawi to step down earlier than the promised 2010.
• We see growth moderating in the coming quarters, but supported by firm commodity exports. For us the key short-term risk facing the country is political instability, which could hurt domestic consumption and investment.
• Inflation pressures should abate with the easing of food and fuel prices, so we don’t see Bank Negara raising rates as it focuses more on combating slowing growth, which could be exacerbated by the rising political tensions.
Joshua Saldanha
Economic Data - MalaysiaMonthly data Jan-08 Feb-08 Mar-08 Apr-08 May-08 Jun-08 Jul-08 Aug-08Industrial Production, % y/y 7.4 6.7 3.5 5.2 2.9 2.2 1.7 N/AManufacturing Sales, % y/y 15.8 19.6 10.2 17.9 15.1 18.1 15.0 N/AConsumer Price Index, % y/y 2.3 2.7 2.8 3.0 3.8 7.7 8.5 8.5Exports, % y/y 10.4 14.5 5.5 20.9 22.9 18.6 25.4 N/AImports, % y/y 7.1 11.1 2.9 7.9 9.4 12.5 14.8 N/ATrade Balance, USD bn 3.0 2.9 2.5 3.9 4.8 3.9 4.4 N/AForeign Exchange Reserves, US$ bn 102.9 110.6 114.2 118.0 119.4 120.0 119.3 116.9Quarterly data Sep-06 Dec-06 Mar-07 Jun-07 Sep-07 Dec-07 Mar-08 Jun-08Retail Sales, % y/y 20.9 16.8 25.3 33.0 39.7 35.7 19.8 23.8Real GDP, % y/y 5.9 5.3 5.5 5.7 6.7 7.3 7.1 6.3-Private consumption 6.4 6.4 7.6 12.3 13.0 10.2 11.7 9.0-Government consumption 9.2 4.4 7.3 10.4 6.0 4.2 10.5 7.1-Gross fixed capital formation 3.5 9.8 9.5 6.0 12.8 10.2 6.0 5.6Nominal GDP, MYR bn 149.2 147.8 144.6 154.3 166.3 176.7 174.8 188.8Current Account, US$ bn 7.4 7.9 5.7 7.3 8.6 8.0 7.5 11.3Capital & Financial Account, US$ bn -4.9 -5.7 0.8 2.2 -9.0 -5.2 8.3 -3.8
Sources: Bloomberg, CEIC

Emerging Asia Economics Monthly – October 2008
Page 18
Malaysia: FX and Rates Strategy
Further upside in USD-MYR
3.1
3.2
3.3
3.4
3.5
3.6
3.7
Jan-
08
Apr-08
Jul-0
8
Oct-0
8
Jan-
09
Apr-09
Jul-0
9
Oct-0
9
2Y IRS in a down-trend
3.03.23.43.63.84.04.24.44.64.85.0
Feb-
08
May-0
8
Aug-
08
Nov-
08
Feb-
09
May-0
9
Aug-
09
Nov-
09
BN rate
2Y IRS
Malaysia’s large export exposure is expected to keep MYR under pressure. Political uncertainty, a spike in inflation and lower commodity prices are additional negatives. FX The uptrend in USD-MYR should remain intact, with USD-MYR expected to test 3.50 by year-end, compared with 3.44 currently. Investor preference for the MYR continues to wane as Malaysia’s significant export exposure becomes more of a focus amid the sharply deteriorating global outlook. Political uncertainty, lower commodity prices (i.e. lower export values), and a spike in inflation are added negatives. Meanwhile, Malaysia has one of the best external positions in the region with a current account surplus amounting to 18% of GDP. Also, Malaysia’s financial sector is less developed and therefore less exposed to the recent barrage of financial shocks reverberating out of the US and Europe. This should support the ringgit versus the Singapore dollar. Rates Malaysia’s significant trade exposure to the weaker global outlook means the Bank Negara will be reluctant to tighten policy. Also, our model suggests that inflation is peaking—although the run-down will be relatively slow because of government fuel subsidies. The combination of a weaker growth outlook and a retreat in inflation will allow Bank Negara to leave monetary policy unchanged over the next 12 months. IRS rates are likely to cue off of inflation data, which will be sticky on the way down. As such, the 2-year MYR IRS rate is seen only marginally lower by year-end—down to 3.7% versus 3.8% currently.
Tamara Henderson
Market Forecasts - Malaysia FX Current Ytd (%) Dec-08 Mar-09 Jun-09 Sep-09 Dec-09 USD-MYR 3.44 3.8% 3.5 3.6 3.6 3.5 3.5 AUD-MYR 2.72 -5.9% 3.0 3.0 2.9 2.8 2.6 NZD-MYR 2.30 -9.1% 2.3 2.4 2.3 2.2 2.1 Rates Current Ytd (bps) Dec-08 Mar-09 Jun-09 Sep-09 Dec-09 BNM's overnight policy rate 3.50 0 3.50 3.50 3.50 3.50 3.50 2-year IRS (versus 3M KLIBOR) 3.78 -2 3.7 3.6 3.5 3.5 3.5 5-year IRS 4.13 -5 4.1 4.0 3.9 3.9 3.8 10-year IRS 4.68 -1 4.6 4.6 4.5 4.5 4.5
Sources: ANZ, Bloomberg

Emerging Asia Economics Monthly – October 2008
Page 19
Country Update: Philippines
Philippines - Trade Developments
-10-505
1015202530
Jan-
06
Apr-06
Jul-0
6
Oct-0
6
Jan-
07
Apr-07
Jul-0
7
Oct-0
7
Jan-
08
Apr-08
Jul-0
8
Exports (y/y)
Imports (y/y)
Philippines-Vehicle Sales
-15-10-505
1015202530
Jan-
06
Apr-06
Jun-
06
Sep-
06
Dec-0
6
Mar-0
7
Jun-
07
Sep-
07
Dec-0
7
Mar-0
8
Jun-
08
Philippines-Overseas Remittance
0
5
10
15
20
25
30
35
40
Jan-
06
Apr-06
Jul-0
6
Oct-0
6
Jan-
07
Apr-07
Jul-0
7
Oct-0
7
Jan-
08
Apr-08
Jul-0
8
Inflation remains elevated, reaching a 16-year high in August. Vehicle sales continue to grow strongly, but industrial production data are mixed. Remittances show no sign of being affected by the global slowdown, while exports eased in July.
• Inflation remains elevated, rising 12.5% (y/y) in August, up from July’s 12.3% pace. Core inflation rose to a 38 month high of 7%. The food, fuel, and services components saw the biggest increases.
• Indicators suggest that domestic demand is holding up relatively well. In August vehicles sales grew 11.3% (3mma y/y). Meanwhile industrial production (volume) was up 8.1% (y/y) in July. In the IP sub components, electrical machinery contracted 1.3% (y/y), however.
• Remittances continued their upward trend, growing 23.1% (3mma y/y) in July, the strongest rate in 15 months.
• Exports increased in July 4.4% (y/y), up from the previous month’s 8.8%. Exports to China and US contracted 3.0% (y/y) and 7.9% (y/y) respectively.
• The government’s budget deficit narrowed to 4.6% of GDP as a surplus of 1.7 billion pesos was posted in August. Revenue rose 1.5% (y/y) while expenditure rose 13.5% (y/y).
• Equity markets continue to fall in line with other regional indices and are down by about 30% year to date. Foreign investors have withdrawn $674 million this year. The peso has fallen 12.1% so far this year against the US dollar.
• Our momentum model shows that inflation has peaked. Combined with the global slowdown, it seems likely that the BSP will stand pat on rates.
• With export growth easing and consumption weakening, the pace of activity will slow this year and growth will be below 5% in 2009.
Joshua Saldanha
Economic Data - PhilippinesMonthly data Jan-08 Feb-08 Mar-08 Apr-08 May-08 Jun-08 Jul-08 Aug-08Manufacturing Production Value-add, % y/y -3.0 7.5 -4.5 7.9 10.8 9.4 14.0 N/APassenger Car Sales, % y/y 27.6 10.8 -7.0 25.0 -0.5 17.4 31.0 24.0Consumer Price Index, % y/y 4.9 5.4 6.4 8.3 9.5 11.4 12.3 12.1Exports, % y/y 6.0 10.5 -6.6 4.9 2.3 8.8 4.4 N/AImports, % y/y 27.9 21.7 12.2 11.8 10.9 12.7 16.0 N/ATrade Balance, US$ bn -0.8 -0.4 -0.9 -0.5 -0.5 -0.8 -1.4 N/AForeign Exchange Reserves, US$ bn 30.3 31.6 32.2 32.1 31.8 32.1 32.4 N/AQuarterly data Sep-06 Dec-06 Mar-07 Jun-07 Sep-07 Dec-07 Mar-08 Jun-08Real GDP, % y/y 5.1 5.5 7.0 8.3 7.1 6.4 4.7 4.6-Private consumption 5.3 6.2 5.9 5.6 5.7 6.2 5.2 3.4-Government consumption 14.6 9.8 9.5 11.9 6.4 4.6 1.9 -5.1-Gross fixed capital formation 8.0 3.7 10.3 20.9 8.8 6.7 2.9 5.6Nominal GDP, peso bn 1,476.3 1,713.6 1,524.1 1,618.6 1,613.8 1,891.8 1,668.0 1,834.2Current Account, US$ bn 0.9 2.2 1.9 1.7 1.0 1.7 0.9 0.8Capital & Financial Account, US$ bn 0.4 -0.1 0.5 -0.4 3.3 -0.5 0.8 0.4 Sources: Bloomberg, CIEC

Emerging Asia Economics Monthly – October 2008
Page 20
Philippines: FX and Rates Strategy
Uptrend in USD-PHP seen in tact
4041424344454647484950
Oct-0
7
Jan-
08
Apr-08
Jul-0
8
Oct-0
8
Jan-
09
Apr-09
Jul-0
9
Oct-0
9
IRS rates headed lower
4.04.55.05.56.06.57.07.58.08.59.0
Feb-
08
May-0
8
Aug-
08
Nov-
08
Feb-
09
May-0
9
Aug-
09
Nov-
09
BSP o/n RRP
5Y IRS
2s-10s IRS spread to widen
10
30
50
70
90
110
130
150
170
Sep-
07
Dec-0
7
Mar-0
8
Jun-
08
Sep-
08
Dec-0
8
Mar-0
9
Jun-
09
Sep-
09
Dec-0
9
Although inflation remains in double digits and domestic demand is “solid,” the BSP is not expected to tighten policy any further during this cycle as escalating shocks to the global financial system will adversely impact exports and capital flows. Compared to many Asian counterparts, however, the peso is better-positioned to weather the storm.
FX The recent barrage of shocks to the global financial system has likely shifted the BSP’s focus—away from double digit inflation, signs of second round effects, and still “solid” domestic demand—toward peaking inflation, worsening sentiment and a worrying global outlook. As such, the BSP is not expected to tighten policy any further during this cycle. Fallout from the US credit crunch is accelerating, not abating. As such, there will be greater knock-on effects for the Philippines’ trade deficit (exports to China have already contracted) and for capital outflows, and this will keep the peso under pressure. The Philippines’ has one of the smaller current account surplus cushions in AXJ at 2.6% of GDP, and the PHP has been punished for this. PHP is one of the region’s under-performers, down nearly 14% versus USD and down 6.9% versus AXJ year-to-date. However, FDI remains in an uptrend. Portfolio outflows are much more benign than in other parts of Asia. Remittances are slowing, but remain high. As such, the Philippines is better-positioned to handle the damage to its current account surplus. Consequently, we should start to see PHP out-performance within AXJ, as the currencies with much larger export exposure catch-up to the realities of a much bleaker global outlook. Rates The combination of double-digit inflation and slowing growth should keep conditions in local rates markets choppy until the BSP makes a clear shift to a growth focus. The 2-year PHP IRS rate is seen holding near 5.2% into year-end.
Tamara Henderson
Market Forecasts - Philippines FX Current Ytd (%) Dec-08 Mar-09 Jun-09 Sep-09 Dec-09 USD-PHP 47.05 14.1% 49.0 50.0 49.8 49.5 49.0 AUD-PHP 37.28 3.4% 42.1 41.5 39.8 38.6 37.2 NZD-PHP 31.51 -0.2% 31.9 34.0 32.4 31.2 29.9 Rates Current Ytd (bps) Dec-08 Mar-09 Jun-09 Sep-09 Dec-09 BSP's overnight reverse repo rate 6.00 75 6.00 5.75 5.50 5.50 5.00 2-year IRS (versus 3M IB ref rate) 5.15 -54 5.2 4.9 4.7 4.7 4.2 5-year IRS 5.53 -36 5.5 5.4 5.2 5.2 4.9 10-year IRS 5.98 -58 6.0 5.9 5.8 5.8 5.6
Sources: ANZ, Bloomberg

Emerging Asia Economics Monthly – October 2008
Page 21
Country Update: Singapore
Singapore-Inflation
0
1
2
34
5
6
7
8
Jan-
06
Apr-06
Jul-0
6
Oct-0
6
Jan-
07
Apr-07
Jul-0
7
Oct-0
7
Jan-
08
Apr-08
Jul-0
8
CPI (y/y)
Singapore-Domestic Demand Indicators
-30
-20
-10
0
10
20
30
Jan-
06
Apr-0
6
Jul-0
6
Oct-0
6
Jan-
07
Apr-0
7
Jul-0
7
Oct-0
7
Jan-
08
Apr-08
Jul-0
8
Industrial Productiion (y/y)
Real Retail Sales (y/y)
STI Index
2300
2500
2700
2900
3100
3300
3500
3700
Jan-
08
Jan-
08
Mar-0
8
Mar-0
8
Apr-08
May-0
8
Jun-
08
Jul-0
8
Aug-
08
Singapore’s inflation fell again as food and oil prices eased. Non-domestic exports continued to decline on weakening external demand while retail sales remained buoyant. Turbulence in the global financial markets resulted in a volatile Straits Times Index. Growth looks set to decline further as the external environment remains weak and consumption declines on lower confidence.
• Inflation slowed to 6.4% (y/y) in August from 6.5% in July as food and oil prices eased. The central bank expects consumer prices to rise between 6-7% in 2008.
• Retail sales index rose by 11.8% (y/y) in July as consumers increased purchases of vehicles and spent more at gas stations as oil prices declined. Department-store sales also gained 10.4% (y/y) in July as a result of the month-long summer sale.
• Singapore’s non-oil domestic exports declined for the fourth consecutive month, falling 13.8% (y/y) in August from a decline of 5.8% in July. External demand for electronic products and drugs weakened further.
• Industrial production declined by 12.2% (y/y) in August, after falling by 22% in July, on declining electronic and pharmaceutical output. This suggests that the economy may be heading towards a technical recession (two quarters of negative growth).
• The Straits Times Index plunged by 6% over the last two weeks of September. Prices of local financial stocks remained depressed by the ongoing financial market turmoil.
• Going forward, inflation is expected to moderate but demand for Singapore’s exports as well as consumption will remain weak, taking down growth. The government has indicated that growth in 2008 may be less than 4%. We agree, and expect growth to continue to decline into early 2009 as Singapore’s open and export-driven economy will be adversely affected by the global slowdown and financial crisis.
Ivy Tan
Economic Data-Singapore Monthly data Jan-08 Feb-08 Mar-08 Apr-08 May-08 Jun-08 Jul-08 Aug-08 Industrial Production, % y/y 8.7 10.7 18.3 -4.9 -13.3 2.4 -21.9 22.0 Retail Sales sa, % y/y -1.4 9.0 6.3 7.5 5.1 -3.1 12.4 NA Connsumer Price Index, % y/y 6.6 6.5 6.7 7.5 7.5 7.5 6.5 6.4 Domestic Exports (non-oil), % y/y 2.8 6.2 -5.9 5.3 -10.5 -10.6 -5.8 -13.8 Imports (Non-oil), % y/y 12.0 8.6 7.0 18.0 3.6 3.1 4.3 0.1 Trade Balance, US$ bn 2.8 2.2 1.2 1.5 1.7 1.4 1.5 2.6 Foreign Exchange Reserves, US$ bn 165.4 169.2 176.3 174.5 174.9 175.3 175.6 171.5 Quarterly data Sep-06 Dec-06 Mar-07 Jun-07 Sep-07 Dec-07 Mar-08 Jun-08 Real GDP sa, % y/y 7.2 7.0 7.1 9.1 9.3 5.5 7.1 2.2 -Private consumption sa 3.3 3.7 3.0 4.9 5.7 5.1 4.6 5.3 -Government consumption sa 19.7 5.1 -1.6 7.1 0.5 5.2 12.4 4.5 -Gross fixed capital formation sa 10.5 22.4 22.4 27.8 16.9 16.0 30.7 25.2 Nominal GDP sa, SGD bn 54.2 56.3 57.7 60.5 62.5 62.5 65.6 64.1 Current Account, US$ bn 7.4 8.2 9.8 9.7 12.1 7.5 7.2 6.2 Capital & Financial Account, US$ bn -6.1 -2.2 -8.7 -2.5 -7.4 0.1 0.9 -2.8
Sources: Bloomberg, CEIC

Emerging Asia Economics Monthly – October 2008
Page 22
Singapore: FX and Rates Strategy
USD-SGD eying 1.50 level
1.30
1.35
1.40
1.45
1.50
1.55
1.60
1.65
Feb-
08
May-0
8
Aug-
08
Nov-
08
Feb-
09
May-0
9
Aug-
09
Nov-
09
95
97
99
101
103
105
107
109
111
113
Jan-
06
Apr-06
Jul-0
6
Oct-0
6
Jan-
07
Apr-07
Jul-0
7
Oct-0
7
Jan-
08
Apr-08
Jul-0
8
Oct-0
8
Jan-
09
S$NEER Projection
2s-10s IRS to steepen
020406080
100120140160180
Mar-0
7
Jun-
07
Sep-
07
Dec-0
7
Mar-0
8
Jun-
08
Sep-
08
Dec-0
8
Mar-0
9
Jun-
09
Sep-
09
Dec-0
9
A marked deterioration in growth prospects coupled with severe stress in the global financial system pave the way for an unprecedented (and unexpected) shift to a zero percent appreciation path in the S$NEER policy band from the current tightening bias.
FX At 6.4% y/y, inflation in Singapore remains well above the MAS’s target of 1.5%. However, central bankers are inherently forward looking because of the lags in the transmission of monetary policy. Meanwhile, inflation has clearly peaked and Singapore’s growth prospects have sharply deteriorated since the MAS set policy back in April. Within emerging Asia, Singapore has one of the most open economies (exports are more than 200% of GDP) and Singapore’s financial sector is much more developed. As a result, Singapore will be hit harder by the sharp deterioration in global growth prospects and the severe stress in the global financial system. As such, we expect the MAS to adopt a zero percent appreciation path in the S$NEER policy band and to re-centre the band at the prevailing level of S$NEER at its next meeting on October 10th. This would be consistent with similar policy U-turns made by the PBoC and CBC in recent days. Nevertheless, markets are not expecting such a shift from the MAS. USD-SGD is expected to test 1.50 at the turn of the year. Rates A U-turn in MAS policy should relieve some of the pressure at the front end of the SGD IRS curve, and widen the 2s-10s IRS spread toward 140 bps by year-end (versus 100 bps currently).
Tamara Henderson
Market Forecasts - Singapore FX Current Ytd (%) Dec-08 Mar-09 Jun-09 Sep-09 Dec-09 USD-SGD 1.435 0.8% 1.46 1.53 1.54 1.52 1.50 AUD-SGD 1.137 -9.2% 1.26 1.27 1.23 1.19 1.14 NZD-SGD 0.962 -12.1% 0.95 1.04 1.00 0.96 0.92
Rates Current Ytd
(bps) Dec-08 Mar-09 Jun-09 Sep-09 Dec-09 3-month SIBOR 1.85 35 1.3 0.9 1.0 1.3 1.5 2-year IRS (onshore versus 6M SOR) 2.24 45 1.6 1.2 1.4 1.6 1.9 5-year IRS 2.82 48 2.4 2.2 2.3 2.4 2.6 10-year IRS 3.21 25 3.0 2.9 2.9 3.0 3.1
Sources: ANZ, Bloomberg

Emerging Asia Economics Monthly – October 2008
Page 23
Country Update: South Korea
South Korea-Inflation
0
2
4
6
8
10
12
Jan-
06
Apr-06
Jul-0
6
Oct-0
6
Jan-
07
Apr-07
Jul-0
7
Oct-0
7
Jan-
08
Apr-08
Jul-0
8
CPI (y/y)3mma/3mma
South Korea-Confidence Indices
70
75
80
85
90
95
100
105
110
Sep-
08
Jun-
08
Mar-0
8
Dec-0
7
Sep-0
7
Jun-
07
Mar-0
7
Dec-0
6
Sep-0
6
Jun-
06
Mar-0
6
BOK - Producers NSO - Consumers
South Korea-Stock Index
200
500
800
1100
1400
1700
2000
Jan-
08
Feb-
08
Mar-0
8
Apr-08
May-0
8
Jun-
08
Jul-0
8
Aug-
08
Sep-
08
KOPSI Index
KOSPI-Financial Sector
Domestic demand is languishing as consumers struggle with rising prices and record debts and investment growth remains flat. Inflation has peaked on our momentum measure while previously strong export growth is beginning to fade reflecting weaker external demand.
• Domestic demand and confidence remain weak. Personal consumption growth (sa) in Q2 was fractionally negative with positive overall consumption growth benefiting from a public sector boost. Consumer confidence remains near an 8-year low, but bounced back somewhat in August reflecting the decline in oil prices.
• Retail sales growth remains strong at 12 percent, but largely reflects spending on food and fuel with non-discretionary spending reportedly weak.
• Investment growth (GDP basis) was flat masking a sharp divergence between facilities (linked to the trade sector) which grew by 1 percent q/q, and construction, which declined by an equal amount. Business confidence rebounded off 3-year lows on lower commodity prices, and industrial production growth unexpectedly picked up in July on strong export orders.
• Inflation has apparently peaked, but there are still upside risks from the pass through effects of the depreciation of the won. The m/m rate declined in August on lower fuel prices resulting in a reduction in the y/y rate from 5.9% to 5.6%. That said, food and fuel prices continue to drive index growth with increases y/y of 7.3% and 11.9%, respectively. The BOK kept rates on hold at a 7-year high of 5.25% at its September meeting.
• Exports continue to propel growth, rising 18.7% y/y in August, down from 36% in July. This reflects strong shipments to China (33% growth), Latin America (87%), ASEAN (45%) and the Middle East (41%). Chemical and ship exports continue to do well, while electronics and automobile exports remain soft.
• The new government of MB Kim plans to cut taxes and increase spending to spur growth. Korea is currently running a fiscal surplus of 3-4% of GDP, which the government promises to reduce to stimulate growth.
• Slower growth remains a key risk with a weaker external environment threatening to derail the only driver of growth: exports. The good news is that Korea has a diversified export base in terms of products and destination, with most of the growth coming from emerging economies. Korea’s export growth would thus compare favorably with its peers.
Chang Wei Liang
Economic Data - South KoreaMonthly data Jan-08 Feb-08 Mar-08 Apr-08 May-08 Jun-08 Jul-08 Aug-08Industrial Production, % y/y 11.2 10.3 10.3 10.7 8.6 6.8 9.1 N/ARetail Sales, % y/y 9.6 7.2 8.7 10.6 10.1 6.8 12.3 N/AConsumer Price Index, % y/y 3.9 3.6 3.9 4.1 4.9 5.5 5.9 5.6Exports, % y/y 14.9 18.9 18.5 26.4 26.9 16.5 35.7 18.7Imports, % y/y 31.7 28.3 26.5 29.0 29.2 32.6 47.2 37.0Trade Balance, USD bn -4.0 -1.4 -1.1 -0.3 0.8 -0.5 -2.0 -3.8Foreign Exchange Reserves, US$ bn 262.3 262.6 264.3 260.9 258.7 258.5 247.9 243.4Quarterly data Sep-06 Dec-06 Mar-07 Jun-07 Sep-07 Dec-07 Mar-08 Jun-08Real GDP, % y/y 5.0 4.2 4.0 4.9 5.1 5.7 5.8 4.8-Private consumption 4.4 3.9 4.1 4.4 4.8 4.6 3.4 2.3-Government consumption 6.2 7.2 6.3 6.9 4.5 5.6 3.9 4.0-Gross fixed capital formation 5.1 4.9 7.2 5.5 1.3 2.9 0.5 0.1Nominal GDP, KRW tn 213.7 231.2 204.8 221.6 226.9 247.9 218.7 241.1Current Account, US$ bn 2.0 0.1 -1.6 1.3 2.3 -0.8 -0.1 1.8Capital & Financial Account, US$ bn 0.6 5.5 3.6 -1.4 -3.6 1.2 0.4 -4.0
Sources: Bloomberg, CEIC

Emerging Asia Economics Monthly – October 2008
Page 24
South Korea: FX and Rates Strategy
USD-KRW yet to peak
900950
10001050110011501200125013001350
Apr-08
Jul-0
8
Oct-0
8
Jan-
09
Apr-09
Jul-0
9
Oct-0
9
Cumulative flows from Jan 2007, $ bn
-70
-60
-50
-40
-30
-20
-10
0
10
Jan-
07
Mar-0
7
May-0
7
Jul-0
7
Sep-
07
Nov-
07
Jan-
08
Mar-0
8
May-0
8
Jul-0
8
Sep-
08
Portfolio Flows
FDI Flows
IRS headed lower
3.5
4
4.5
5
5.5
6
6.5
Jan-
08
Apr-08
Jul-0
8
Oct-0
8
Jan-
09
Apr-09
Jul-0
9
Oct-0
9
BoK rate
2Y IRS
Although the won has tumbled far and fast, a meaningful turn in USD-KRW is not expected
before we see improvement in Korea’s current account deficit. Meanwhile, the deficit nearly doubled in August, setting a new record.
FX Without much hesitation USD-KRW has broken through the 1200 level. Year-to-date KRW is down 27% versus the US dollar and nearly 17% versus AXJ. For one thing, FX markets have been punishing the few Asian economies which have current account deficits—namely South Korea and India. The won has also been under pressure from a systemic onshore shortage of USD—the result of restrictions on FX borrowing put in place in Q1. Although Korea’s current account deficit is relatively small, it is widening. Also, massive capital outflows raise the issue of financing the shortfall. Year-to-date portfolio outflows amount to $32.4bn versus outflows of $29.1bn for all of 2007. Somewhat encouraging, the pace of portfolio outflows successively slowed in August and September. Less encouraging, net FDI outflows have picked up sharply since the start of the credit crisis in mid-2007. The sharp drop in the won improves Korea’s export competitiveness. At the same time, lower oil prices and languishing domestic demand should curtail import growth. As such, an improvement in the goods balance should be on the horizon. The problem, however, is Korea’s large services account deficit—which is in a multi-year downtrend. Near 1200 in USD-KRW currently, the next key level is 1368, which was the 2001 peak in the wake of the bursting of the IT bubble. Having tumbled so far, so fast, the pace of KRW depreciation should moderate. Rates In line with our view that the BoK will commence an easing cycle in Q4, Korean swap rates are expected to continue lower and 2s-10s KRW IRS is expected to steepen.
Tamara Henderson
Market Forecasts - South Korea FX Current Ytd (%) Dec-08 Mar-09 Jun-09 Sep-09 Dec-09 USD-KRW 1207 29.0% 1260 1300 1275 1250 1225 AUD-KRW 956 16.7% 1084 1079 1020 975 931 NZD-KRW 808 12.7% 819 884 829 788 747 Rates Current Ytd (bps) Dec-08 Mar-09 Jun-09 Sep-09 Dec-09 BOK's overnight call rate 5.25 25 5.00 4.75 4.50 4.50 4.50 2-year IRS (versus 91D KRW CD) 5.72 -7 5.5 5.2 5.0 4.9 4.8 5-year IRS 5.24 -19 5.1 4.9 4.7 4.7 4.6 10-year IRS 5.10 -36 5.0 4.9 4.9 4.8 4.8
Sources: ANZ, Bloomberg

Emerging Asia Economics Monthly – October 2008
Page 25
Country Update: Taiwan
Taiwan-Inflation
-4
-2
0
2
4
6
8
10
Jan-
06
Apr-0
6
Jul-0
6
Oct-0
6
Jan-
07
Apr-0
7
Jul-0
7
Oct-0
7
Jan-
08
Apr-0
8
Jul-0
8
Oct-0
8
CPI (y/y)
3mma/3mma
Taiwan-Indicators
-2-10123456789
Aug-
08
May-0
8
Feb-
08
Nov-
07
Aug-
07
May-0
7
Feb-
07
Nov-
06
Aug-
06
May-0
6
Feb-
06
Coincident (y/y)Leading (y/y)
Taiwan-Stock Index
500150025003500450055006500750085009500
Jan-
08Fe
b-08
Mar-0
8Ap
r-08
May
-08
Jun-
08Ju
l-08
Aug-
08Se
p-08
Taiex Index
Taiex Finc/Insur Index
Domestic demand remains soft and export growth, while still relatively strong, has been negatively affected by weaker external demand. Indicators suggest a further slowdown in activity, which prompted the government to put out a package of spending and tax cuts. Inflation is declining and the CBC surprised the market by cutting rates.
• Domestic demand remains weak. Retail sales contracted 3.8% (y/y) in July, after falling 0.4% in June. Industrial production was up only 0.4% (y/y) in August, down from 1.1% in July and 6.9% in Q2.
• The consumer confidence index slid in August, reflecting poor expectations of economic conditions over the next 6 months. A survey on consumer confidence in housing prices declined sharply in Q2.
• Exports grew 18.4% (y/y) in August from 8.0% in July, reflecting a 16.4% (m/m) growth in information and technology exports. Import growth surged to 39.9% (y/y) in August from 12.3% in July, mainly due to crude oil. Taiwan registered consecutive trade deficits for August and July, respectively.
• CPI inflation in August came down to 4.8% (y/y) from 5.9% in July. Our momentum measure has peaked and is expected to decline, given that food and fuel prices are likely to trend down.
• Export orders growth fell sharply to 5.4% (y/y) in August, down from 13.2% (y/y) in Q2. In particular, orders from China and Hong Kong contracted 8.9% (y/y) in August, for the first time in more than 6 years
• The Central Bank of China unexpectedly cut its policy rate by 12.5 bps to 3.5% given markedly poorer growth prospects. Weaker external demand, with an easing of inflation, signalled a need to shift gears from controlling inflation to stimulating growth. The government had also embarked on a US$5.6bn spending and tax cuts package to bolster growth.
• The financial markets were rocked by the failure of Lehman Brothers, with the TAIEX falling more than 11% in September. In an effort to calm markets, the CBC cut its required reserved ratio on deposits by 1.25% to inject liquidity in the banking system, as well as adding US$3.6bn in the interbank market. The government is considering using a state fund to support the stock market, saying it has fallen too far.
• Declining industrial and export orders point to elevated growth risks in the months ahead. We expect Taiwan to be more vulnerable to the fallout from the US economy, given its reliance on exports for growth as well as a relatively undiversified export base.
Chang Wei Liang
Economic Data - TaiwanMonthly data Jan-08 Feb-08 Mar-08 Apr-08 May-08 Jun-08 Jul-08 Aug-08Industrial Production, % y/y 12.6 16.0 9.0 10.0 5.6 5.1 1.8 0.4Retail Trade Index, % y/y 4.0 -0.9 -1.4 -1.0 -1.4 -5.1 -10.0 -6.3Consumer Price Index, % y/y 2.9 3.9 3.9 3.9 3.7 5.0 5.9 4.8Exports, % y/y 11.0 15.3 15.2 4.2 10.6 11.3 0.1 11.0Imports, % y/y 14.0 22.8 29.2 7.7 8.0 12.3 4.1 31.1Trade Balance, US$ bn 1.5 1.6 0.0 0.9 2.1 1.4 -0.5 -0.1Foreign Exchange Reserves, US$ bn 272.8 277.8 286.9 289.4 290.1 291.4 290.9 282.1Quarterly data Sep-06 Dec-06 Mar-07 Jun-07 Sep-07 Dec-07 Mar-08 Jun-08Real GDP, % y/y 5.3 4.1 4.2 5.2 6.9 6.5 6.3 4.3-Private consumption 0.8 2.4 2.1 2.6 3.6 1.9 2.0 1.1-Government consumption 0.0 0.0 -0.2 0.0 1.7 1.5 1.7 -0.8-Gross fixed capital formation 4.0 5.2 0.8 6.0 4.5 -1.7 4.4 -7.7Real GNP, % y/y 5.3 4.1 4.2 5.2 6.9 6.5 6.3 4.3Nominal GDP, TWD tn 2.6 2.7 2.6 2.5 2.8 2.9 2.7 2.5Current Account, US$ mn 6,643.0 8,815.0 9,410.0 5,909.0 6,477.0 11,183.0 8,495.0 6,493.0Capital Account, US$ mn -22.0 -41.0 -26.0 -19.0 -33.0 -18.0 -271.0 -20.0
Sources: Bloomberg, CEIC

Emerging Asia Economics Monthly – October 2008
Page 26
Taiwan: FX and Rates Strategy
USD-TWD under pressure
30.030.531.031.532.032.533.033.534.034.535.0
Jan-
08
Apr-08
Jul-0
8
Oct-0
8
Jan-
09
Apr-09
Jul-0
9
Oct-0
9
2Y IRS to benefit from more CBC cuts
1.0
1.5
2.0
2.5
3.0
3.5
4.0
Jan-
08
Apr-08
Jul-0
8
Oct-0
8
Jan-
09
Apr-09
Jul-0
9
Oct-0
9
BoC rate
2Y IRS
2s-10s IRS spread headed wider
20
25
30
35
40
45
50
55
60
Jan-
08
Apr-08
Jul-0
8
Oct-0
8
Jan-
09
Apr-09
Jul-0
9
Oct-0
9
An abrupt policy U-turn by the CBC underscores the large hurdles faced by Taiwan’s economy. Thus far, the TWD has shown resilience versus its peers in the region, but we expect this to change in Q4.
FX After raising rates for 16 consecutive quarters, the CBC caught markets by surprise with an unexpected U-turn—cutting the policy rate by 12.5 bps to 3.6% in September. Domestic demand is contracting, and the economy posted back-to-back trade deficits in July and August for the first time in over 20 years. Net foreign portfolio flows have turned massively negative, now –$11.7bn year-to-date versus a cumulative inflow of +$0.5bn at the start of June. FDI is in a downtrend, albeit normalizing from elevated levels in 2005 and 2006. Within the region, Taiwan is one of the more exposed economies to a global slowdown. It is also more sensitive to US growth dynamics. Meanwhile, Taiwan’s financial sector is among the more developed within emerging Asia, so the recent barrage of shocks to the global financial system will have a larger impact. Nevertheless, the TWD remains among the region’s top performers this year, up 1% versus the USD (the second best performance in the region after CNY’s 6%) and up 7% versus AXJ. Deteriorating global growth prospects have pushed USD-TWD above the 32.00 level as we had expected, but we have yet to see a re-alignment in TWD versus AXJ. This is likely to change in Q4 as we see further deterioration in the current account surplus—already down 24% to $6.5bn in Q2 from $8.5bn in Q1. Rates In line with our view that the CBC will continue to ease monetary policy over the coming quarters, swap rates should continue to fall and the 2s-10s IRS curve should start to steepen.
Tamara Henderson
Market Forecasts - Taiwan FX Current Ytd (%) Dec-08 Mar-09 Jun-09 Sep-09 Dec-09 USD-TWD 32.21 -0.7% 34.0 35.0 34.5 34.0 33.5 AUD-TWD 25.52 -10.0% 29.2 29.1 27.6 26.5 25.5 NZD-TWD 21.57 -13.1% 22.1 23.8 22.4 21.4 20.4 Rates Current Ytd (bps) Dec-08 Mar-09 Jun-09 Sep-09 Dec-09 BOC's discount rate 3.50 13 3.38 3.25 3.13 3.13 3.13 2-year IRS (versus 3M CP) 2.23 -17 2.1 2.0 1.9 1.8 1.9 5-year IRS 2.33 -21 2.2 2.2 2.1 2.0 2.1 10-year IRS 2.50 -19 2.5 2.4 2.4 2.4 2.4
Sources: ANZ, Bloomberg

Emerging Asia Economics Monthly – October 2008
Page 27
Country Update: Thailand
Thailand - Inflation
0123456789
10
Jan-
06
Apr-06
Jul-0
6
Oct-0
6
Jan-
07
Apr-07
Jul-0
7
Oct-0
7
Jan-
08
Apr-08
Jul-0
8
CPI (y/y)Core Inflation (y/y)
Thailand-Domestic Demand Indicators
-20-15-10-505
101520
Jan-
06
Apr-0
6
Jul-0
6
Oct-0
6
Jan-
07
Apr-07
Jul-0
7
Oct-0
7
Jan-
08
Apr-0
8
Jul-0
8
Industrial Production (y/y)
Car Sales (y/y, 3mma)
Thailand-Stock Index
500550600650700750800850900950
Jan-
08
Feb-
08
Mar-0
8
Apr-0
8
May-0
8
May-0
8
Jun-
08
Jul-0
8
Aug-0
8
Political uncertainty escalated with a change of the prime minister. Inflation slowed in September from the fastest pace recorded in a decade, and looks to have peaked. The global slowdown is having a negative impact on export growth, which fell in August increasing the trade deficit. The main risks are continued political uncertainty which will depress domestic sentiment, and the effects of a weaker external environment on exports.
• Political developments saw Prime Minister Sundaravej forced out, replaced by Somchai Wongsawat (brother-in-law of the ousted Premier Thaksin Shinawatra). Protesters from the People's Alliance for Democracy continue to occupy the prime minister's office in their bid to topple the elected government.
• CPI and core inflation (y/y) declined to 6.4% and 2.7% respectively in August versus 9.2% and 3.7% in July. This result was helped by the government providing free electricity and water to low-use households and waiving some bus and train fares.
• Recent data point to slowing domestic demand. For August, vehicle sales contracted 10.4% (3mma y/y) versus the previous month’s contraction of 3.8%. Manufacturing production growth eased to 10.9% (y/y) in July.
• Exports rose 14% (y/y) in August, much slower than in July. Destination data show continued increases across Thailand’s key markets: ASEAN, China, and the US.
• Given the prospects of lower inflation, we see the Bank of Thailand keeping the repurchase rate unchanged at 3.75% for the rest of the year and into 2009.
• With global risk aversion increasing, and given the political situation in Thailand, the Thai stock market fell by 10% in September and almost 30% year to date. Foreigners have taken $743 million this month (year to date $3.8 billion) out of the equity markets. Moreover, the political and emerging market risk has seen the Thai Baht come under pressure, depreciating 12.4% against the US dollar this year.
Joshua Saldanha
Economic Data - ThailandMonthly data Jan-08 Feb-08 Mar-08 Apr-08 May-08 Jun-08 Jul-08 Aug-08Industrial Production, % y/y 14.0 15.0 9.2 10.0 9.0 11.2 10.9 N/ARetail Sales, % y/y 11.0 11.3 9.1 7.4 9.7 9.5 N/A N/AConsumer Price Index, % y/y 4.3 5.4 5.3 6.2 7.6 8.9 9.2 6.4Exports, % y/y 25.0 7.2 4.3 13.9 9.6 18.1 38.6 14.2Imports, % y/y 39.8 22.7 20.9 29.7 4.6 21.1 49.4 26.1Trade Balance, US$ bn -0.8 -0.8 0.0 -1.9 1.1 0.4 -1.2 -0.9Foreign Exchange Reserves, USD bn 90.2 97.8 107.3 107.3 106.4 103.0 102.1 98.9Quarterly data Sep-06 Dec-06 Mar-07 Jun-07 Sep-07 Dec-07 Mar-08 Jun-08Real GDP, % y/y 4.5 4.3 4.2 4.3 4.8 5.7 6.1 5.3-Private consumption 2.8 2.7 1.4 0.9 1.8 1.8 2.6 2.4-Government consumption 3.2 -4.0 9.1 9.3 9.5 16.0 -0.1 -2.4-Gross fixed capital formation 3.1 1.9 -1.3 0.2 2.6 4.0 5.4 1.9Nominal GDP, THB bn 1,938.3 2,054.4 2,082.7 2,031.0 2,073.7 2,281.7 2,291.6 2,260.0Current Account, US$ bn 0.8 0.6 1.9 1.3 1.9 2.4 0.9 0.7Capital & Financial Account, US$ bn 1.8 1.4 0.0 1.0 2.3 1.4 6.5 -4.4 Sources: Bloomberg, CEIC
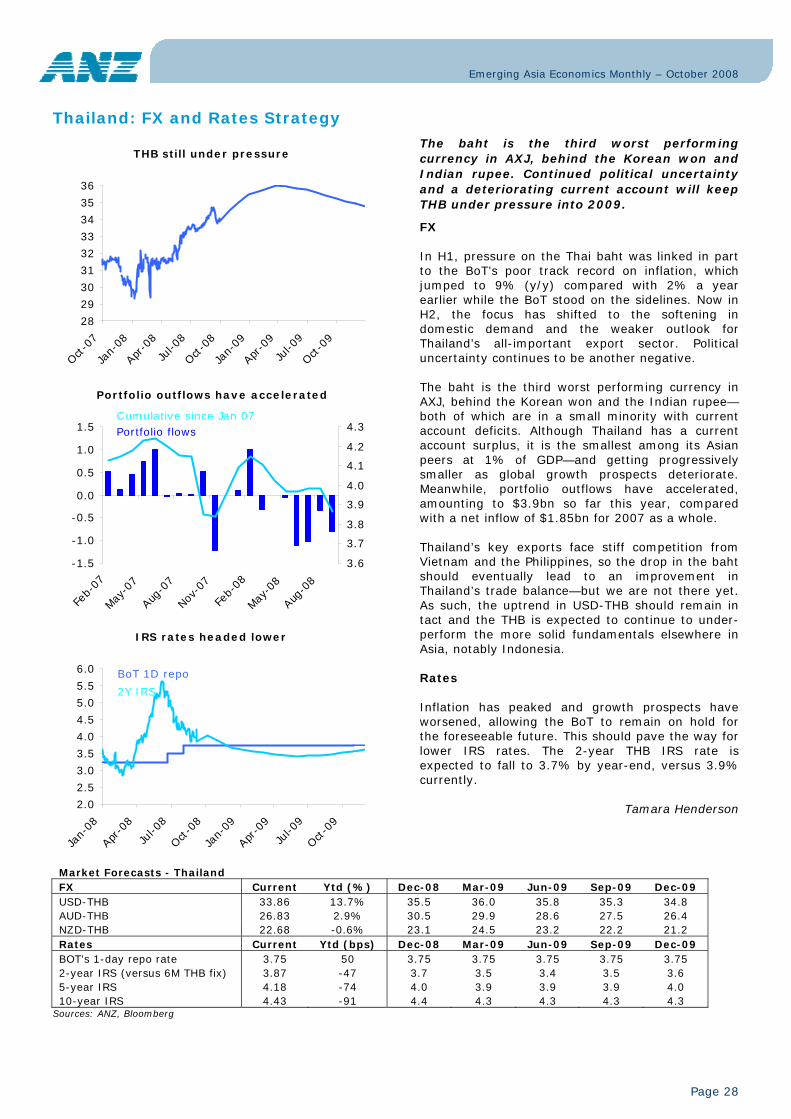
Emerging Asia Economics Monthly – October 2008
Page 28
Thailand: FX and Rates Strategy
THB still under pressure
28
29
30
31
32
33
34
35
36
Oct-0
7
Jan-
08
Apr-08
Jul-0
8
Oct-0
8
Jan-
09
Apr-09
Jul-0
9
Oct-0
9
Portfolio outflows have accelerated
-1.5
-1.0
-0.5
0.0
0.5
1.0
1.5
Feb-
07
May-0
7
Aug-
07
Nov-
07
Feb-
08
May-0
8
Aug-
08
3.6
3.7
3.8
3.9
4.0
4.1
4.2
4.3Portfolio flowsCumulative since Jan 07
IRS rates headed lower
2.0
2.5
3.0
3.5
4.0
4.5
5.0
5.5
6.0
Jan-
08
Apr-08
Jul-0
8
Oct-0
8
Jan-
09
Apr-09
Jul-0
9
Oct-0
9
BoT 1D repo
2Y IRS
The baht is the third worst performing currency in AXJ, behind the Korean won and Indian rupee. Continued political uncertainty and a deteriorating current account will keep THB under pressure into 2009.
FX In H1, pressure on the Thai baht was linked in part to the BoT’s poor track record on inflation, which jumped to 9% (y/y) compared with 2% a year earlier while the BoT stood on the sidelines. Now in H2, the focus has shifted to the softening in domestic demand and the weaker outlook for Thailand’s all-important export sector. Political uncertainty continues to be another negative. The baht is the third worst performing currency in AXJ, behind the Korean won and the Indian rupee—both of which are in a small minority with current account deficits. Although Thailand has a current account surplus, it is the smallest among its Asian peers at 1% of GDP—and getting progressively smaller as global growth prospects deteriorate. Meanwhile, portfolio outflows have accelerated, amounting to $3.9bn so far this year, compared with a net inflow of $1.85bn for 2007 as a whole. Thailand’s key exports face stiff competition from Vietnam and the Philippines, so the drop in the baht should eventually lead to an improvement in Thailand’s trade balance—but we are not there yet. As such, the uptrend in USD-THB should remain in tact and the THB is expected to continue to under-perform the more solid fundamentals elsewhere in Asia, notably Indonesia. Rates Inflation has peaked and growth prospects have worsened, allowing the BoT to remain on hold for the foreseeable future. This should pave the way for lower IRS rates. The 2-year THB IRS rate is expected to fall to 3.7% by year-end, versus 3.9% currently.
Tamara Henderson
Market Forecasts - Thailand FX Current Ytd (%) Dec-08 Mar-09 Jun-09 Sep-09 Dec-09 USD-THB 33.86 13.7% 35.5 36.0 35.8 35.3 34.8 AUD-THB 26.83 2.9% 30.5 29.9 28.6 27.5 26.4 NZD-THB 22.68 -0.6% 23.1 24.5 23.2 22.2 21.2 Rates Current Ytd (bps) Dec-08 Mar-09 Jun-09 Sep-09 Dec-09 BOT's 1-day repo rate 3.75 50 3.75 3.75 3.75 3.75 3.75 2-year IRS (versus 6M THB fix) 3.87 -47 3.7 3.5 3.4 3.5 3.6 5-year IRS 4.18 -74 4.0 3.9 3.9 3.9 4.0 10-year IRS 4.43 -91 4.4 4.3 4.3 4.3 4.3
Sources: ANZ, Bloomberg

Emerging Asia Economics Monthly – October 2008
Page 29
Country Update: Vietnam
Vietnam-Inflation (y/y)
0.00.51.01.52.02.53.03.54.04.5
Jul-0
6
Oct-0
6
Jan-
07
Apr-07
Jul-0
7
Oct-0
7
Jan-
08
Apr-08
Jul-0
8
Vietnam-Real Industrial Output Growth (3mma)
-150%
-100%
-50%
0%
50%
100%
150%
Jan-
06
Apr-06
Jul-0
6
Oct-0
6
Jan-
07
Apr-07
Jul-0
7
Oct-0
7
Jan-
08
Apr-08
Jul-0
8
State Sector
Non-State Sector
Foreign Sector
Vietnam-Trade Developments
0102030405060708090
Jan-
06
Apr-06
Jul-0
6
Oct-0
6
Jan-
07
Apr-07
Jul-0
7
Oct-0
7
Jan-
08
Apr-08
Jul-0
8
Exports (3mma)Imports (3mma)
Growth is on a more sustainable track, aided by the government’s stabilization measures as well as a soft global environment. Domestic demand signals are mixed and headline inflation has peaked. Exports continue to do well, import growth remains on a firm downward trend, and the trade balance resumes its gradual improvement. Equities had a bad month, but positive signs emerged in the debt markets.
• Inflation (y/y) has finally peaked, falling to 27.9% in August. This is not surprising since on a “momentum” basis the peak was back in June. Importantly, month-on-month inflation rose by only 0.2% in September, the lowest print in two years as fuel prices were cut.
• Domestic demand signals are mixed. Nominal retail sales growth in August fell to 27½% (y/y), down 6ppt from the average of the first seven months of the year; however, declining inflation complicates the read. Real industrial output growth spiked to 30% as activity in the foreign sector and domestic private sector both surged.
• Export growth remained solid in September at 46% (y/y, 3mma) as rice and crude oil continued their recent strength. Meanwhile, import growth declined to 26%, although petroleum and steel import growth remains high. The trade balance continued its gradual improvement when measured on a 12-month rolling basis.
• Recent government bond auctions have been well-bid, with coupons on 2- and 3-year notes at 15.5%. Local participation has been increasing, suggesting improved confidence.
• The Ho Chi Minh and Hanoi stock indices were down sharply in September, with volatility spiking after Lehman declared bankruptcy. Declines for the month were about 20 percent. Foreigners have been net sellers of stock four weeks running.
• The stabilization measures adopted in June appear to be successful so far, aided in part by a weaker external environment. We expect growth to remain around 6½% (the Q2 outturn) over the near term as consumption and investment growth will need to remain moderate in order to generate a sustained improvement in the trade balance.
Paul Gruenwald
Economic Data - VietnamMonthly data Jan-08 Feb-08 Mar-08 Apr-08 May-08 Jun-08 Jul-08 Aug-08Industrial Production, % y/y 7.4 31.1 35.7 15.5 13.9 12.0 11.4 30.8Retail Sales, % y/y 34.0 39.0 26.7 38.9 25.5 35.5 36.1 27.5Consumer Price Index, % y/y 14.1 15.7 19.4 21.4 25.2 26.8 27.0 28.3Exports, % y/y 30.6 16.8 24.5 39.4 43.7 53.7 46.1 49.4Imports, % y/y 66.2 78.6 81.3 84.9 45.1 43.0 34.6 38.7Trade Balance, USD bn -2.3 -2.8 -3.3 -3.2 -1.9 -0.7 -0.8 -1.0Quarterly data Sep-06 Dec-06 Mar-07 Jun-07 Sep-07 Dec-07 Mar-08 Jun-08Real GDP, % y/y 8.8 8.9 7.7 -37.8 8.7 9.2 7.5 5.8-Agricultural, forestry, fishery 3.0 2.8 2.3 2.9 3.8 4.1 3.2 3.3-Industry and construction 11.2 11.9 9.2 10.2 10.7 11.8 8.0 6.2-Services 8.9 8.9 7.8 9.0 8.8 9.0 8.3 7.0Nominal GDP, VND tn 248.3 299.0 210.9 282.6 293.8 356.2 254.1 371.7Foreign Exchange Reserves, USD bn 11.9 13.4 18.3 20.8 22.6 23.6 0.0 0.0
Sources: Bloomberg, CEIC, General Statistics Office of Vietnam

Emerging Asia Economics Monthly – October 2008
Page 30
Vietnam: FX and Rates Strategy
VND NDF to revert next year
1500016000170001800019000200002100022000230002400025000
Jun-
07
Sep-
07
Dec-0
7
Mar-0
8
Jun-
08
Sep-
08
Dec-0
8
Mar-0
9
Jun-
09
Sep-
09
Dec-0
9
USD-VND
12M NDF
Rates headed lower
8
10
12
14
16
18
20
Feb-
08
May-0
8
Aug-
08
Nov-
08
Feb-
09
May-0
9
Aug-
09
Nov-
09
SBV rate
5Y IRS
2s-10s IRS to steepen
-800
-600
-400
-200
0
200
400
600
Feb-
08
May-0
8
Aug-
08
Nov-
08
Feb-
09
May-0
9
Aug-
09
Nov-
09
Vietnam’s exports are holding up quite well despite the slowdown in global growth. Also, inflation appears to have peaked. However, the next leg of compression in the NDF premium is not expected before year-end.
FX
Inflation in Vietnam is finally showing signs of moderating, now at 27.9% (y/y) compared with a high of 28.3% the previous month. There is still a long way to go, but more importantly markets will need to see evidence of a solid down-trend. As such, further compression in the 12-month NDF premium is not expected until the turn of the year. Although the global growth outlook has significantly worsened, Vietnam’s fundamentals have been holding up. Notably, export growth remains solid at 39% (y/y) in September, despite the drop in commodity prices. That said, portfolio flows are taking a beating in Vietnam in tandem with the global drop in risk appetite. Along with an already fragile external position, this maintains pressure on the dong. Nevertheless, much of the bad news has already been discounted by the market, and the government’s stabilization measures appear to be working. This suggests more limited upside in USD-VND. Also, Vietnam’s long-term fundamentals remain robust—so bargain hunters will be active. USD-VND is expected to hold near 16,600 into year-end, while the 12-month NDF outright is not expected to sustain a break below 18,000 until next year. Rates Although inflation is close to 30% and real interest rates are firmly in negative territory, the downgrade in global growth prospects should benefit receiver positions given Vietnam’s large external exposure. Relatively attractive valuations add to the appeal of Vietnamese rates versus counterparts in the region. The 2-year VND IRS rate is seen falling to 16.2% by year-end, versus 16.7% currently.
Tamara Henderson
FX Current Ytd (%) Dec-08 Mar-09 Jun-09 Sep-09 Dec-09 USD-VND 16600 3.6% 16600 16600 16500 16300 16100 AUD-VND 13154 -6.1% 14280 13780 13200 12710 12240 NZD-VND 11119 -9.3% 10790 11290 10730 10270 9820
Rates Current Ytd
(bps) Dec-08 Mar-09 Jun-09 Sep-09 Dec-09 SBV's base lending rate 14.00 575 13.50 13.00 12.50 12.50 11.00 2-year IRS (versus 3M VNIBOR) 16.68 861 16.2 15.7 15.2 15.2 13.7 5-year IRS 15.99 725 15.7 15.3 15.0 15.0 14.0 10-year IRS 14.85 535 14.7 14.5 14.4 14.4 13.9
Sources: ANZ, Bloomberg

Emerging Asia Economics Monthly – October 2008
Page 31
Contacts ANZ Economics & Markets Research Saul Eslake Fiona Allen Chief Economist Business Manager +61 3 9273 6251 +61 3 9273 6224 [email protected] [email protected] Tony Pearson Mark Rodrigues Julie Toth Paul Deane Deputy Chief Economist, Industry and Strategic Research
Senior Economist, Industry and Strategic Research
Senior Economist, Industry and Strategic Research
Rural and Regional Economist
+61 3 9273 5083 +61 3 9273 6286 +61 3 9273 6252 +61 9273 6295 [email protected] [email protected] [email protected] [email protected] Warren Hogan Katie Dean Riki Polygenis Dr. Alex Joiner Head of Australian Economics and Interest Rates Research
Senior Economist, Australian Economics and Interest Rates Research
Economist, Australian Economics and Interest Rates Research
Economist, Australian Economics and Interest Rates Research
+61 2 9227 1562 +61 3 9273 1381 +61 3 9273 4060 +61 3 9273 6123 [email protected] [email protected] [email protected] [email protected] Patricia Gacis Jason Hill Strategist, Australian Economics and Interest Rates Research
Markets Credit Analyst
+61 2 9227 1272 0434 312 356 [email protected] [email protected] Amy Auster Tony Morriss Jasmine Robinson Amber Rabinov Head of Foreign Exchange and International Economics Research
Senior Currency Strategist, Foreign Exchange and International Economics Research
Senior Economist, Foreign Exchange and International Economics Research
Economist, Foreign Exchange and International Economics Research
+61 3 9273 5417 +61 2 9226 6757 +61 3 9273 6289 +61 3 9273 4853 [email protected] [email protected] [email protected]
Mark Pervan Amber Rabinov Head of Commodities Research Economist, Commodities
Research
+61 3 9273 3716 +61 3 9273 4853 [email protected] [email protected] Paul Braddick Ange Montalti Dr. Alex Joiner Stephanie Wayne Head of Property and Financial System Research
Senior Economist, Property and Financial System Research
Economist, Property and Financial System Research
Research Analyst, Property and Financial System Research
+61 3 9273 5987 +61 3 9273 6288 +61 3 9273 6123 +61 3 9273 4075 [email protected] [email protected] [email protected] [email protected]
om
Paul Gruenwald Tamara Henderson Ivy Tan Joshua Saldanha Chang Wei
Liang Head of Asian Economics, Singapore
Director, Currency and Rates Strategy, Markets Asia
Associate Director, Credit Research, Markets Asia
Associate Director, Economic Research, Markets Asia
Analyst, Markets Asia
+65 6216 1814 +65 6216 1845 +65 6216 3643 +65 6216 1936 +65 6216 1838 [email protected] [email protected]
m
Research & Information Services Mary Yaxley Marilla Rough Manesha Jayasuriya Head of Research & Information Services Senior Information Officer,
R&IS Information Officer, R&IS
+61 3 9273 6265 +61 3 9273 6263 +61 3 9273 4121 [email protected] [email protected] [email protected]
om
ANZ New Zealand Research Cameron Bagrie Khoon Goh Philip Borkin Steve Edwards Kevin Wilson Chief Economist Senior Economist Economist Economist Rural Economist +64 4 802 2212 +64 4 802 2357 +64 4 802 2199 +64 4 802 2217 +64 4 802 2361 [email protected] [email protected].
David Croy Strategist, Interest Rate Strategist
+64 4 802 2286 [email protected]

Emerging Asia Economics Monthly – October 2008
Page 32
Important Notice
Australia and New Zealand Banking Group Limited is represented in:
AUSTRALIA by:
Australia and New Zealand Banking Group Limited ABN 11 005 357 522
14th Floor 100 Queen Street, Melbourne, Victoria, 3000, Australia
Telephone +61 3 9273 6224 Fax +61 3 9273 5711
UNITED KINGDOM by:
Australia and New Zealand Banking Group Limited
ABN 11 005 357 522
40 Bank Street, Canary Wharf, London, E14 5EJ, United Kingdom
Telephone +44 20 3229 2121 Fax +44 20 7378 2378
UNITED STATES OF AMERICA by:
ANZ Securities, Inc. (Member of NASD and SIPC)
6th Floor 1177 Avenue of the Americas
New York, NY 10036, United States of America
Tel: +1 212 801 9160 Fax: +1 212 801 9163
NEW ZEALAND by:
ANZ National Bank Limited
Level 7, 1-9 Victoria Street, Wellington, New Zealand
Telephone +64 4 802 2000 This document (“document”) is distributed to you in Australia and the United Kingdom by Australia and New Zealand Banking Group Limited ABN 11 005 357 522 (“ANZ”) and in New Zealand by ANZ National Bank Limited (“ANZ NZ”). ANZ holds an Australian Financial Services licence no. 234527 and is authorised in the UK by the Financial Services Authority (“FSA”).
This document is being distributed in the United States by ANZ Securities, Inc. (“ANZ S”) (an affiliated company of ANZ), which accepts responsibility for its content. Further information on any securities referred to herein may be obtained from ANZ S upon request. Any US person(s) receiving this document and wishing to effect transactions in any securities referred to herein should contact ANZ S, not its affiliates.
This document is being distributed in the United Kingdom by ANZ for the information of its market counterparties and intermediate customers only. It is not intended for and must not be distributed to private customers. In the UK, ANZ is regulated by the FSA. Nothing here excludes or restricts any duty or liability to a customer which ANZ may have under the UK Financial Services and Markets Act 2000 or under the regulatory system as defined in the Rules of the FSA.
This document is issued on the basis that it is only for the information of the particular person to whom it is provided. This document may not be reproduced, distributed or published by any recipient for any purpose. This document does not take into account your personal needs and financial circumstances. Under no circumstances is this document to be used or considered as an offer to sell, or a solicitation of an offer to buy.
In addition, from time to time ANZ, ANZ NZ, ANZ S, their affiliated companies, or their respective associates and employees may have an interest in any financial products (as defined by the Australian Corporations Act 2001), securities or other investments, directly or indirectly the subject of this document (and may receive commissions or other remuneration in relation to the sale of such financial products, securities or other investments), or may perform services for, or solicit business from, any company the subject of this document. If you have been referred to ANZ, ANZ NZ, ANZ S or their affiliated companies by any person, that person may receive a benefit in respect of any transactions effected on your behalf, details of which will be available upon request.
The information herein has been obtained from, and any opinions herein are based upon, sources believed reliable. The views expressed in this document accurately reflect the author’s personal views, including those about any and all of the securities and issuers referred to herein. The author however makes no representation as to its accuracy or completeness and the information should not be relied upon as such. All opinions and estimates herein reflect the author’s judgement on the date of this document and are subject to change without notice. No part of the author's compensation was, is or will directly or indirectly relate to specific recommendations or views expressed about any securities or issuers in this document. ANZ, ANZ NZ, ANZ S, their affiliated companies, their respective directors, officers, and employees disclaim any responsibility, and shall not be liable, for any loss, damage, claim, liability, proceedings, cost or expense (“Liability”) arising directly or indirectly (and whether in tort (including negligence), contract, equity or otherwise) out of or in connection with the contents of and/or any omissions from this communication except where a Liability is made non-excludable by legislation.
Where the recipient of this publication conducts a business, the provisions of the Consumer Guarantees Act 1993 (NZ) shall not apply.