Embed Size (px)
Citation preview

This PDF document was made available from www.rand.org as a public
service of the RAND Corporation.
6Jump down to document
Visit RAND at www.rand.org
Explore RAND Science and Technology
View document details
This document and trademark(s) contained herein are protected by law as indicated in a notice appearing later in this work. This electronic representation of RAND intellectual property is provided for non-commercial use only. Permission is required from RAND to reproduce, or reuse in another form, any of our research documents for commercial use.
Limited Electronic Distribution Rights
For More Information
CHILDREN AND ADOLESCENTS
CIVIL JUSTICE
EDUCATION
ENERGY AND ENVIRONMENT
HEALTH AND HEALTH CARE
INTERNATIONAL AFFAIRS
POPULATION AND AGING
PUBLIC SAFETY
SCIENCE AND TECHNOLOGY
SUBSTANCE ABUSE
TERRORISM AND HOMELAND SECURITY
TRANSPORTATION ANDINFRASTRUCTURE
U.S. NATIONAL SECURITY
The RAND Corporation is a nonprofit research organization providing objective analysis and effective solutions that address the challenges facing the public and private sectors around the world.
Purchase this document
Browse Books & Publications
Make a charitable contribution
Support RAND

This product is part of the RAND Corporation technical report series. Reports may
include research findings on a specific topic that is limited in scope; present discus-
sions of the methodology employed in research; provide literature reviews, survey
instruments, modeling exercises, guidelines for practitioners and research profes-
sionals, and supporting documentation; or deliver preliminary findings. All RAND
reports undergo rigorous peer review to ensure that they meet high standards for re-
search quality and objectivity.

Emergency ResponderInjuries and Fatalities
An Analysis of Surveillance Data
ARI N. HOUSER, BRIAN A. JACKSON,
JAMES T. BARTIS, D. J. PETERSON
TR-100-NIOSH
March 2004
Prepared for the National Personal Protective Technology Laboratory

The RAND Corporation is a nonprofit research organization providing objective analysisand effective solutions that address the challenges facing the public and private sectorsaround the world. RAND’s publications do not necessarily reflect the opinions of its researchclients and sponsors.
R® is a registered trademark.
© Copyright 2004 RAND Corporation
All rights reserved. No part of this book may be reproduced in any form by any electronic ormechanical means (including photocopying, recording, or information storage and retrieval)without permission in writing from RAND.
Published 2004 by the RAND Corporation1700 Main Street, P.O. Box 2138, Santa Monica, CA 90407-2138
1200 South Hayes Street, Arlington, VA 22202-5050201 North Craig Street, Suite 202, Pittsburgh, PA 15213-1516
RAND URL: http://www.rand.org/To order RAND documents or to obtain additional information, contact
Distribution Services: Telephone: (310) 451-7002; Fax: (310) 451-6915; Email: [email protected]
Library of Congress Cataloging-in-Publication Data
Emergency responder injuries and fatalities : an analysis of surveillance data / Ari N. Houser ... [et al.].p. cm.
“TR-100.”Includes bibliographical references.ISBN 0-8330-3565-7 (pbk.)1. Emergency medical personnel—Wounds and injuries. 2. Emergency medical personnel—Health
and hygiene.[DNLM: 1. Accidents, Occupational. 2. Emergency Medicine. 3. Risk. 4. Wounds and Injuries.
WA 487 E53 2004] I. Houser, Ari N. II. Rand Corporation.
RC965.E48E47 2004614'.3'08836218—dc22
2004001260
The research described in this report was conducted by the Science and Technology PolicyInstitute (operated by RAND from 1992 to November 2003) for the National PersonalProtective Technology Laboratory.

iii
Preface
In FY 2001, the National Institute for Occupational Safety and Health (NIOSH)established the National Personal Protective Technology Laboratory (NPPTL).This new laboratory endeavors to reduce and prevent occupational disease,injury, and death of workers by advancing federal research on personalprotective technologies. Technologies of interest to NPPTL include devices suchas respirators, chemical-resistant clothing, hearing protection, and safety gogglesand glasses that provide a barrier between the worker and an occupational safetyor health risk. Other personal protective technologies include devices thatprovide a worker with early warning of a hazard or otherwise help keep theworker safe from harm, such as sensors that detect toxic atmospheres, andcommunication devices used for safe deployment of workers.
Because emergency responders face significant hazards as they carry out theirmissions, NPPTL selected this group of workers to be an early focus of itsprogram. In the wake of September 11, 2001, when so many emergencyresponders were injured and killed responding to terrorist attacks at the WorldTrade Center and the Pentagon, the significance of this mission has become evenmore apparent.
NPPTL asked the RAND Science and Technology Policy Institute to reviewavailable databases that offer to provide disease, injury, and fatality datapertinent to emergency response functions and the role of personal protectivetechnology.
Surveillance data resources exist that describe the injuries, illnesses, and fatalitiessuffered by emergency responders. These data sources, maintained by bothresponder community organizations and government agencies, contain valuableinformation concerning the hazards facing firefighters, police, and emergencymedical responders. This technical report summarizes the results of an analysisof available surveillance data sources. That analysis, along with the interests andconcerns of the emergency responder community and the expertise of NIOSHstaff, will support development of potential objectives and related research tasksdirected at providing personal protective technologies to emergency responders.

iv
The Science and Technology Policy Institute
Originally created by Congress in 1991 as the Critical Technologies Institute andrenamed in 1998, the Science and Technology Policy Institute is a federallyfunded research and development center sponsored by the National ScienceFoundation. The institute was managed by the RAND Corporation from 1992through November 30, 2003.
The institute's mission is to help improve public policy by conducting objective,independent research and analysis on policy issues that involve science andtechnology. To this end, the institute
• supports the Office of Science and Technology Policy and otherExecutive Branch agencies, offices, and councils
• helps science and technology decisionmakers understand the likelyconsequences of their decisions and choose among alternative policies
• helps improve understanding in both the public and private sectors ofthe ways in which science and technology can better serve nationalobjectives.
In carrying out its mission, the institute consults broadly with representativesfrom private industry, institutions of higher education, and other nonprofitinstitutions.
Inquiries regarding the Science and Technology Policy Institute may be directedto the addresses below.
Stephen RattienDirector, RAND Science and Technology
1200 South Hayes StreetArlington, VA 22202-5050
Phone: (703) 413-1100 x5219http://www.rand.org/scitech/stpi/

v
The RAND Corporation QualityAssurance Process
Peer review is an integral part of all RAND research projects. Prior topublication, this document, as with all documents in the RAND technical reportseries, was subject to a quality assurance process to ensure that the researchmeets several standards, including the following: The problem is wellformulated; the research approach is well designed and well executed; the dataand assumptions are sound; the findings are useful and advance knowledge; theimplications and recommendations follow logically from the findings and areexplained thoroughly; the documentation is accurate, understandable, cogent,and temperate in tone; the research demonstrates understanding of relatedprevious studies; and the research is relevant, objective, independent, and bal-anced. Peer review is conducted by research professionals who were notmembers of the project team.
RAND routinely reviews and refines its quality assurance process and alsoconducts periodic external and internal reviews of the quality of its body ofwork. For additional details regarding the RAND quality assurance process, visithttp://www.rand.org/standards/.


vii
Table of Contents
Preface .................................................................................................iii
The RAND Corporation Quality Assurance Process ....................................v
Figures ................................................................................................... ix
Tables ................................................................................................... xi
Acronyms and Abbreviations ................................................................. xiii
Executive Summary................................................................................ xv
1. Introduction......................................................................................... 1Methodology .................................................................................... 1About This Document ....................................................................... 3
2. The Emergency Responder Population................................................... 5Firefighters ....................................................................................... 5Police/Law Enforcement ................................................................... 6Emergency Medical Services .............................................................. 8
3. Available Surveillance Data Sources to Define the Occupational Injury and Disease Characteristics of the Emergency Responder Workforce ....................................................................... 11
Fire Service Sources ......................................................................... 13Law Enforcement Sources................................................................ 16Emergency Medical Services Sources ................................................ 17General Population or Multi-Service Sources..................................... 17Findings ......................................................................................... 23
4. Observations from the Data Regarding Risks Faced by Emergency Responders....................................................................... 31
Types of Injuries and Fatalities for All Services.................................. 33Firefighter Injuries and Fatalities ...................................................... 36Police Injuries and Fatalities............................................................. 46EMS Injuries and Fatalities............................................................... 49Findings ......................................................................................... 51
5. Conclusions ....................................................................................... 53
References.............................................................................................. 57
Appendix A: RAND Injury and Fatality Classification System ................... 61
Appendix B: Fatality, Injury, Illness, and Exposure Numerical DataTables .............................................................................................. 65


ix
Figures
S.1. Injury Incidence Matrix for Moderate and Severe Firefighter Fireground Injuries by Cause and Activity..................... xvii
S.2. Injury Incidence Matrix for Police Lost-Work-Time Injuries by Cause......................................................................... xviii
3.1. States Reporting to the Hazardous Substances Emergency Events Surveillance, 1998 ................................................................ 22
4.1. Firefighter and Law Enforcement Fatalities, 1980–2001 ..................... 31
4.2. Cause of Fatal Injuries for Firefighters, Police, and EMS Workers................................................................................. 34
4.3. Nature of Injury for Firefighters, Police, and EMS Injuries, 1996–1998 ...................................................................................... 35
4.4. Type of Duty for Firefighter Injuries and Fatalities............................ 39
4.5. Firefighter Activity for Fireground Injuries and Fatalities.................. 41
4.6. Firefighter Fireground Injuries by Cause.......................................... 42
4.7. Breakdown of Firefighter Occupational Injury Retirements ............... 44
4.8. Injury Incidence Matrix for Moderate and Severe Firefighter Fireground Injuries by Cause and Activity....................... 45
4.9. Cause of Injury for Police Lost-Work-Time Injuries and Fatalities.................................................................................. 47
4.10. Severity of Police Lost-Work-Time Injuries, by Cause of Injury......................................................................................... 48
4.11. Injury Incidence Matrix for Police Lost-Work-Time Injuries by Cause........................................................................................ 49
4.12. Cause of Injury for EMS Line-of-Duty Fatalities, 1998–2001 ............... 50


xi
Tables
2.1. Full-Time Law Enforcement Personnel, 2000 ..................................... 7
2.2. Affiliation of National Registry EMTs by Level of Certification, 1999 ........................................................................... 9
3.1. Occupation Codes Used in Federal Government Data Sources.......... 21
3.2. Major Data Sources Describing Emergency Responder Injuries and Fatalities................................................................................. 24
3.3. Coverage of the Data Describing Risks Faced by Emergency Responders.................................................................. 25
3.4. Applicability of Casualty Data to Firefighter Population .................. 26
3.5. Applicability of Casualty Data to Law Enforcement Population........ 28
3.6. Applicability of Casualty Data to EMS Responder Population .......... 29
4.1. Incidence Rates of Nonfatal Injuries and Illnesses per 100 Full-Time Emergency Responders for Five States, 2000 .................... 32
4.2. Average Annual Counts of Firefighter Injuries and Fatalities, 1995–2000 ..................................................................................... 37
A.1. Firefighter Nature of Injury Categories ........................................... 61
A.2. Firefighter Cause of Injury Categories............................................. 62
A.3. Firefighter Type of Duty Categories................................................ 62
A.4. Firefighter Activity Categories........................................................ 63
A.5. Police Cause-Event Categories........................................................ 63
B.1. Data Underlying Figure 4.1—Firefighter and Law Enforcement Fatalities, 1980–2001 .................................................. 65
B.2. Data Underlying Figure 4.2—Cause of Fatal Injuries for Firefighters, Police, and EMS Workers ............................................ 66
B.3. Data Underlying Figure 4.3—Nature of Injury for Firefighters, Police, and EMS Injuries, 1996-1998 ............................. 66
B.4. Data Underlying Figure 4.4—Type of Duty for Firefighter Injuries and Fatalities .................................................................... 67
B.5. Data Underlying Figure 4.5—Firefighter Activity for Fireground Injuries and Fatalities.................................................. 68
B.6. Data Underlying Figure 4.6—Firefighter Fireground Injuries by Cause ...................................................................................... 69
B.7. Data Underlying Figure 4.7—Breakdown of Firefighter Occupational Injury Retirements .................................................... 70

xii
B.8. Data Underlying Figure 4.8—Firefighter Fireground Injuries by Nature, Severity, Cause, and Activity ......................................... 71
B.8a. Firefighter Injuries by Cause and Severity (All Injuries) .................... 71
B.8b. Firefighter Injuries by Cause and Severity (Fireground Injuries)........ 72
B.8c. Firefighter Injuries by Nature and Severity (All Injuries) .................. 72
B.8d. Firefighter Injuries by Nature and Severity (Fireground Only).......... 74
B.8e. Analysis of Avulsion Injuries—Assignment of Avulsions to RAND Injury Categories and Types of Duty.................................... 75
B.8f. Assignment of Dizziness, Fainting and Disorientation to RAND Injury Categories by NFIRS Cause (Fireground Injuries Only) ................................................................................ 76
B.8g. Firefighter Injuries by Activity and Severity (All Injuries) ................. 77
B.8h. Firefighter Injuries by Activity and Severity (Fireground Only) ........ 79
B.8i. Codes Identifying Primary Apparent Symptom of Injury in the NFIRS 1998 Database............................................................ 81
B.8j. Codes Identifying Firefighter Activity in the NFIRS 1998 Database ............................................................................... 83
B.8k. Severity of Injury Codes in the NFIRS 1998 Database ....................... 85
B.8l. Extracted Data for Figure 4.8—Injury Incidence Matrix for Moderate and Severe Firefighter Fireground Injuries by Cause and Activity ........................................................................ 86
B.9. Data Underlying Figures 4.9 and 4.10—Cause of Injury for Police Lost-Work-Time Injuries and Fatalities and Severity of Police Lost-Work-Time Injuries by Cause of Injury ....................... 88
B.10. Data Underlying Figure 4.11—Injury Incidence and Severity of Police Lost-Work-Time Injuries by Cause ..................................... 89
B.11. Data Underlying Figure 4.11—Injury Incidence by Cause and Nature of Police Lost Work Time Injuries ................................. 90
B.12. Data Underlying Figure 4.12—Cause of Injury for EMS Line-of-Duty Fatalities, 1998–2001................................................... 92

xiii
Acronyms
ATSDR Agency for Toxic Substances and Disease Registry
BJS Bureau of Justice Statistics
BLS Bureau of Labor Statistics
CFOI Census of Fatal Occupational Injuries
EMS Emergency Medical Services
EMT Emergency Medical Technician
FACE Fatality Assessment and Control Evaluation
HSEES Hazardous Substances Emergency Events Surveillance
IAFF International Association of Fire Fighters
LEOKA Law Enforcement Officers Killed and Assaulted
NaSH National Surveillance System for Health-Care Workers
NCID National Center for Infectious Diseases
NEISS National Electronic Injury Surveillance System
NEMSMS National EMS Memorial Service
NFIRS National Fire Incident Reporting System
NFPA National Fire Protection Association
NIOSH National Institute for Occupational Safety and Health
NLEOMF National Law Enforcement Officers Memorial Fund
NPPTL National Personal Protective Technology Laboratory
NPSIB National Public Safety Information Bureau
PASS Personal Alert Safety System
R&D Research and Development
SOC Standard Occupation Classification
SOII Survey of Occupational Injuries and Illnesses
USFA United States Fire Administration


xv
Executive Summary
The emergency response community represents a significant population ofworkers exposed to a particularly intense and variable hazard environment inthe course of their work activities. This study focuses on firefighting, lawenforcement, and emergency medical services personnel. In the United States,approximately 1,100,000 firefighters, 600,000 patrol and investigative lawenforcement officers, and 500,000 emergency medical service responders answercalls for assistance and service that result in significant numbers of occupationalinjuries and fatalities.
In addition to the tragic events of September 11, in which over 400 emergencyresponders were killed, an average of 97 firefighters and 155 police officers diedeach year between 1990 and 2001, and an average of at least 11 nonfirefighterEMS personnel died in the line of duty each year between 1998 and 2001. Theinjury and fatality rates here and in the rest of this document do not include theevents of September 11 because the magnitude of those tragic events obscuresother trends in the data. The fatality rate for both police and career (paid)firefighters is approximately three times as great as the average for alloccupations, placing them in the top fifteen occupations for the risk of fataloccupational injury; the fatality rate for emergency medical services respondersis about two and one-half times the rate for all occupations. The rate ofoccupational injury and illness for employees of local fire and police agencies issimilarly elevated. Approximately 88,000 firefighters are injured each year; about2,000 of their injuries are potentially life-threatening. Approximately 100,000police were injured in 2000.
This report is designed to collect and synthesize available data on casualtiesexperienced by the emergency responder population for the purpose ofestimating the frequency, causes, and characterization of those casualties.
The available data sources provide information about the occupational injuriesand fatalities experienced by a significant portion of the emergency responsecommunity. Although there are some gaps in the data, many of these gaps are inthe process of being addressed, and currently available data sources—incombination with community interviews and other sources of information—areadequate to provide an overview of emergency responder protection needs. Inaddition, extensive data are available to describe the injuries and fatalities

xvi
suffered by firefighters. From these sources, counts and incidence rates areavailable for both fatalities and injuries, and both can be broken down by nature,cause, activity, and type of duty. The detailed National Fire Incident ReportingSystem (NFIRS) database, maintained by the U.S. Fire Administration, can beused to investigate specific questions about the risks faced by firefighters at firescenes.
A lesser, but still useful, amount of information is available for police casualties.Significant data exist describing police fatalities, but less information is availableon injuries. Detailed breakdowns of injuries from the Survey of OccupationalInjuries and Illnesses (SOII), maintained by the Bureau of Labor Statistics, can beused to investigate specific questions about the risks faced by police officers.Information regarding officer activity at the time of injury is not available andrepresents the most significant gap in police data. Emergency medical servicesdata sources are scarce, and few conclusions can be drawn from the existing data.However, some data are available describing fatalities, nature and body part ofinjury, and potential exposures to infectious diseases.
Improvements to the occupation coding used by the federal government that arecurrently underway will allow emergency medical responders to be broken outof government public health databases. In addition, the new categories for lawenforcement responders will make understanding the hazards faced by officersinvolved in emergency response more straightforward. The SOII will become aparticularly useful data source when these changes are implemented beginningin the 2003 data year.
The injuries most frequently experienced by firefighters are traumatic injuries,cuts and bruises, burns, asphyxiation and other respiratory injuries, and thermalstress. Physical stress and overexertion, falls, being struck by or making contactwith objects, and exposure to fire products are the primary causes of injury at thefire scene. Physical stress, becoming lost or trapped in a fire situation, andvehicle accidents are the primary causes of death. Physical stress is responsiblefor nearly half of all on-duty deaths.
Approximately half of all firefighter injuries occur at the scene of fireemergencies, or “on the fireground.” Firefighters experience a much higher riskof injury on the fireground than at other emergency incidents or duringnonemergency duty. The injury incidence matrix shown in Figure S.1 showsgraphically during which combinations of fireground activities and hazardsfirefighters are most often seriously injured, as well as the injuries that are mostlikely to result from each combination. Black cells correspond to combinations of

xvii
RAND TR100-S.1
Burns Trauma
Trauma Cuts/bruises
Cuts/bruises Trauma Burns
Burns Respiratory Heat stress
Trauma Heat stress Cardiac Respiratory
Respiratory
Trauma Cuts/bruises Trauma
Respiratory Heat stress
Trauma Heat stress
Trauma Cuts/bruises Trauma
Trauma Heat stress Cardiac
Trauma Cuts/bruises Cuts/bruises
Trauma Heat stress Cardiac
TraumaTraumaCuts/bruises Burns
Trauma
Fire attack, search and
rescue
Ventilation and forcible
entry
Salvage and overhaul
Incident scene
support activities
Riding on or driving apparatus
Fire
gro
un
d a
ctiv
ity
Fell, jumped
Caught, trapped
Struck by or contact with
object
Exposure to fire
products
Exposure to
chemicals
Physical stress, over-
exertion
Cause of Injury
Firefighter Injuries
Highest incidence
High incidence
Moderate incidence
Low incidence
SOURCE: Based on data from the NFIRS 1998 Firefighter Casualty Module. NOTES: Black cells indicate at least 150 reported injuries (10 percent of the total); dark-gray
cells 36 to 66 injuries (2 to 4 percent); and light-gray cells 15 to 28 injuries (1 to 2 percent). Injuries with cause or activity unreported or reported as “other” are not included. Because of sample size, differences between some dark-gray and light-gray and some light-gray and white cells may not be statistically significant. Incident scene support activities include water supply operations and picking up and moving tools.
Figure S.1—Injury Incidence Matrix for Moderate and Severe Firefighter FiregroundInjuries by Cause and Activity
activities and hazards with the highest incidence of injuries, dark gray to highincidence, light gray to moderate incidence, and white to low incidence. Withineach cell, the most common injuries are listed, with the most frequent injurieslisted first.
The highest number of injuries from all causes occurs during fire attack andsearch and rescue. Fire attack is not only one of the most dangerous firegroundactivities but also one of the most common. In activities other than fire attack,firefighters are injured most frequently from falls during salvage and overhaul,incident scene support activities, or from apparatus; and from physical stress andoverexertion or being struck by or making contact with an object duringventilation, forcible entry, salvage and overhaul, and incident scene supportactivities.

xviii
Cuts and bruises and traumatic injuries such as sprains, strains, and fractures arethe most commonly encountered. Burns, respiratory trouble, and heat stress arealso common injuries in “forward” activities such as fire attack and search andrescue.
Most injuries to police are traumatic injuries and cuts and bruises resulting fromvehicle accidents, falls, assaults, or physical stress. Nine out of ten line-of-dutydeaths are due to vehicle accidents or assaults. Figure S.2 compares theincidence of lost-time injuries to patrol and investigative officers from severaltypes of hazards. As with the firefighter injury incidence matrix, black cellscorrespond to hazards resulting in the most injuries, dark gray to high incidence,light gray to moderate incidence, and white to low incidence.
Police are most often injured in falls, assaults, vehicle-related accidents, andthrough stress or overexertion. The most common injuries from all causes aretraumatic injuries, such as sprains and strains, and cuts and bruises. Police arealso at risk of burns and symptoms of illness as a result of exposure to fire andhazardous substances (in the figure, “illness” indicates injuries in which diseaseor illness symptoms are present but a definite diagnosis is lacking or isunclassifiable). These exposure-related injuries represent less than 1 percent of alllaw enforcement injuries.
Information about EMS injuries and hazards is scarce and far less definitive. EMSpersonnel are most at risk of sprains and strains, and back injuries represent ahigher proportion of injuries for EMS personnel than they do for other
RAND TR100-S.2
Trauma Cuts/bruises
Trauma Cuts/bruises
Cuts/bruisesTrauma
Burns TraumaIllness
Trauma Cuts/bruises
TraumaAll activities
Fell, jumped
Assault, violence
Vehicle accident
Struck by, contact
with object
Exposure to fire and
hazardous substances
Physical stress, over-
exertion
Cause of Injury
Police Injuries
Highest incidence
High incidence
Moderate incidence
Low incidence
SOURCE: Based on data from the Survey of Occupational Injuries and Illnesses, Bureau of Labor Statistics (2003b).
NOTES: Data are for police and detectives, State of New York, at the local government level, for the years 1998–2000. Black cells represent at least 5,000 injuries; dark-gray cells at least 4,000 injuries; and the light-gray cell about 2,400 injuries. SOII estimates a total of 25,000 injuries for 1998–2000; the estimate in the figure is based on a smaller number of recorded cases.
Figure S.2—Injury Incidence Matrix for Police Lost Work Time Injuries, by Cause
xix
responders. EMS personnel also have a high risk of infectious disease exposure,mostly through percutaneous injuries such as needle sticks. Nearly all on-dutydeaths for which data are available are due to aircraft and vehicle accidents.
The surveillance data clearly show that some hazards are common to allresponders, including the risk of vehicle-related deaths, traumatic injuries suchas sprains and strains, and cuts and bruises. The data also demonstrate the cleardifferences in hazard exposure and, consequently, the protection needs ofsegments of the emergency response community. The available data can providea route for identifying those combinations of kinds and causes of injury, bodyparts involved, and types of responder activity where injury reduction effortsmight be most effectively applied. Such detailed analyses are most accessible forfirefighters because of the comparative richness of the available data sources.
However, injury counts alone are not sufficient to fully define the protectionneeds of emergency responders. By definition, they measure the negativeconsequences of exposure to particular risks over particular time periods. As aresult, surveillance data give a preferential focus to routine activities becausethose tasks occupy the vast majority of responders’ time. Therefore, the levels ofinjury should not be interpreted as direct measures of the level of risk faced byresponders for all activities. Activities performed by responders for short periodsof time, or events that occur infrequently, may involve a level of risk muchhigher than more common tasks. Natural disasters, major hazardous materialsemergencies, structural collapse, civil disturbance, bomb disposal, hostagesituations, and terrorism response all involve intense hazards not normallyencountered in routine activities. The consequences of other potential hazardsthat have not yet been realized, such as large-scale terrorist attacks involvingbiological or chemical weapons, cannot be effectively captured. To fully assessresponders’ personal protection needs, all high-risk nonroutine activities must beconsidered separately from routine activities.
Similarly, while direct counts of injuries and the severity measures discussed inthis report are excellent indicators of the scope of a health and safety problem,they cannot completely capture all the issues associated with the problem. Forinstance, although sprains and strains are the most common injuries experiencedby responders in all three services, responders typically do not view theseinjuries as a primary concern. Thus, merely using injury frequencies whensetting priorities for protective technology will not adequately address theconcerns of the community. To address the limitations of a purely data-basedapproach, RAND has also gathered information directly from the emergencyresponse community through an extensive structured-interview process. The

xx
results of that effort, included in a separate report (LaTourrette et al., 2003), are acritical complement to the surveillance data analyzed here.
Beyond simply demonstrating the utility of the currently available data and datasources, this analysis also suggests a range of potential future efforts that couldcontribute to a better understanding of this technology area. The diversity of datasources on emergency responders suggests that efforts to interconnectinformation from different databases could be valuable. An area of particularpotential is fatality data—where the comparatively small number of cases andthe availability of rich narrative information could enable many types of analysis.Such interconnection, combined with improved occupational coding efforts,would make it possible to ask detailed questions about protective technologydesign and performance in specific response situations.

1
1. Introduction
Every day in the United States, emergency responders answer calls for help andtake on duties that place them in harm’s way. Over two million paid andvolunteer emergency responders play a critical role in protecting the Americanpublic and property from fire, natural disaster, medical emergency, and theactions of criminals and terrorists. As they fulfill their responsibilities,responders are exposed to significant risk of injury, illness, and death as part oftheir day-to-day jobs.
Responders accept that their job is hazardous—reflected in their principle of“risking a life to save a life”—but this acceptance does not diminish theimportance of taking steps to protect them from the hazards inherent in theiractivities, including the development, deployment, and continued improvementof personal protective technology.
The National Institute for Occupational Safety and Health (NIOSH) NationalPersonal Protective Technology Laboratory (NPPTL) asked the RAND Scienceand Technology Policy Institute to review available databases that providedisease, injury, and fatality data pertinent to emergency response functions andthe role of personal protective technology. This report summarizes the results ofan analysis of available surveillance data sources describing emergencyresponder injuries and fatalities. The analysis, along with the interests andconcerns of the emergency responder community, is intended to supportdevelopment of potential objectives and related research tasks directed atproviding personal protective technologies to emergency responders.
Methodology
RAND obtained injury and fatality information from four responder communityorganizations and six federal agencies. This information included articles andother published reports, tabular data, sortable data sets, and complete sets offatality data accompanied by narrative information. We identified data sourcesand cognizant organizations through recommendations from the emergencyresponse community (including both emergency responders and research and

2
support agencies),1 recommendations from administrators of the data sources,federal government health and occupational health databases, and internet andliterature searches. Pursuant to technical direction from NIOSH, we did notexamine workers’ compensation and insurance industry data sources.
For the analysis in this report, we used data from eight of these organizations,including all four of the responder community sources. This document does notdistinguish occupational illness from occupational injury. This methodologyparallels the approach taken in the injury epidemiology literature by analyzinginjury and illness similarly; the primary difference between the two is the longerperiod of latency before the effects of an illness manifest themselves.2 Thefatalities resulting from the events of September 11 are not included because theirinclusion would overwhelm other trends in the data.
Many of the data sources have restrictions that limit access to their most detaileddata for privacy or other reasons. It is possible to get access to most of therestricted data with confidentiality agreements; these agreements typicallyrequire the administrating agency to review any documents produced thatinclude the data. To avoid this problem, we chose to limit ourselves to publiclyavailable information from restricted sources whenever such public informationwas adequate for our purposes. Because the analysis summarized in this reportcontributes to a larger effort sponsored by NPPTL that has resulted in severaldocuments as well as informal communication of that information, we feel thatour goal of providing timely and meaningful continuing contributions to NPPTLand to others in the emergency responder community is best served byeschewing confidential data wherever publicly available data are of comparablequality.
Any data access restrictions are discussed in the descriptions of individual datasources. Pursuing access to the confidential data could be an element of futureanalytical efforts in this area. Access to these data could provide a higherresolution understanding of injury incidence within some sectors of theresponder population, particularly for law enforcement responders.
In order to have a single set of categories for nature, cause, activity, and type ofduty, we did some reclassification, regrouping, and interpolation of data. Each
_________________1 The term emergency response community is used in this document to refer not only to emergency
responders and their departments but also to technology providers and manufacturers,organizations, nongovernment research and data collection organizations, and other interestedparties. The term emergency responder population is used to refer to the responders only. For this study,emergency responders are defined as members of the fire, law enforcement, and emergency medicalservices who respond to calls for service.
2 See, for example, Haddon (1980).

3
data source has a distinct classification system for subcategorizing injuriesand/or fatalities by nature, cause, and other factors. We made reasonableassumptions to translate these varied classification systems to a single system forall sources. Although this makes it possible to take advantage of a range of datasources on responder injuries and fatalities, the combined values do not linearlycorrespond to those reported in the individual data sources. Appendix A showshow the data sets were combined and explains where additional analysis wasused to complete some categories. When multiple years or sets of data werecollected within a single source, we combined the raw counts. For sources thatreported only percentages, we estimated raw counts and combined the estimatedcounts. In the absence of clear reasons to select one data source over another,whenever two or more data sources used for analysis reported breakdowns bythe same factor, we used the average of the sources. We weighted all sourcesequally.
The analysis in this document seeks to present the types of injuries and fatalityexperienced by emergency responders and the circumstances surrounding thesecasualties (cause of injury or death and type of activity). Where possible, we alsodid cross-analyses between nature and injury circumstance for firefighters andpolice. Our analysis of fatality data generally made use of complete or near-complete samples. Injury data were drawn primarily from surveys of eitherrandom or self-selected populations. As a result, uncertainty is inherent in thedata, and small differences should not automatically be considered significant.All relative comparisons explicitly made in the text should be consideredstatistically significant. Statistical significance for such comparisons has beenconfirmed at a 95% confidence level or greater by a chi-square test (for sourcesproviding exact counts in the surveillance sample), by a t test (for sourcesproviding estimated counts or relative frequency but not exact counts for six ormore independent sample years), by confidence interval bounds reported in thedata source (for sources providing them), or by observation that the comparisonwould pass a chi-square test based on sample size and resolution (for all othersources).
About This Document
Section 2 describes the emergency responder population and characterizes thenumber and role of emergency responders in the United States. Section 3describes the data sources that are available from responder community andgovernment organizations, including the types of data contained in each sourceand how they can be used in analysis of responder injuries for personalprotective technology program planning. Section 4 presents an analysis of the

4
types of injuries experienced by emergency responders and the causes of injuryand activities that put responders at risk. Section 5 presents our conclusions.
This report relates to Task B in the Interagency Project Description describing thework RAND is performing for NIOSH/NPPTL. Task B includes activitiesfocused on helping NPPTL develop an agenda for its programs in personalprotective technology research and development, partnership, service, andcommunication. This document serves as a deliverable relating to Task B1,“Analysis of Occupational Injury and Disease Data.”

5
2. The Emergency Responder Population
Emergency responders are typically divided into three services: firefighters,police, and emergency medical services (EMS). We use this convention to definethe emergency responder population. However, this division is neither completenor comprehensive because many individual responders belong to more thanone service and there is some variation in the duties of personnel within eachservice. For example, a firefighter may be cross-trained as an emergency medicaltechnician and respond to medical calls, and a police officer may also serve as avolunteer firefighter. Furthermore, data sets (addressing both the responderpopulation and injury incidence) do not have a uniform definition for whobelongs to these services. Such definitional matters have an impact on howemergency responders are counted and how data about the risks they face aretallied and analyzed. An example of this can be seen with hazardous materials(hazmat) personnel: While the hazmat function is often provided by the fireservice, in many places hazmat responders are either independent or part of thelaw enforcement group, and most of the responder community considers hazmatto be a separate function, similar to EMS: a function often (but frequently not)performed by the fire department but having distinct personnel and skills.However, the surveillance and population data sets we are aware of do not counthazmat personnel separately from their fire, police, or other affiliation.
Firefighters
The main division within the fire service is between career (paid) and volunteerfirefighters and their respective fire departments. In general, most volunteerfirefighters belong to smaller suburban and rural departments, whereas careerfirefighters belong to larger, urban departments. Because of the differences intype of jurisdiction, department size, and ability to provide specialized services,career firefighters experience a somewhat different range of hazards thanvolunteers do.1
________________1 For example, the fraction of line-of-duty deaths that occur while responding to calls is much
greater for volunteer firefighters because they typically respond to the scene or to the station in apersonal vehicle and rural departments have geographically larger coverage zones, so more time isspent on the road. See NFPA (1995–2000a).

6
Each year, the National Fire Protection Association (NFPA) conducts a survey ofmunicipal fire departments and estimates the number of firefighters. In 2000,26,354 departments had a total complement of about 286,800 career firefightersand 777,350 active volunteer firefighters, for a total of about 1,054,000 firefighters.The career total constitutes all firefighters regardless of assignment, includingsome who are not directly involved in firefighting operations.
The 3,285 career or mostly career departments covered 62 percent of thecountry’s population; 23,069 volunteer or mostly volunteer departments coveredthe remainder. The total number of municipal firefighters has remained nearlyconstant since 1985 at between 1.0 and 1.1 million, whereas the number of paidfirefighters has been increasing steadily over the same period. State and federalgovernments (which employ many wildland firefighters) and private firebrigades are not included in this number. More than half of all departmentsprovided some type of emergency medical service to the community.2
The National Public Safety Information Bureau (NPSIB) also publishes a yearlydirectory of fire and EMS departments. The 2002 directory lists 28,579 firedepartments with about 1,446,000 total firefighting and EMS personnel,including 980,000 “firefighters” and 465,000 “emergency personnel.” Somedepartments reported cross-trained firefighters and firefighting personnel whoalso responded to medical calls as “firefighters”; other departments reportedthem as “emergency personnel.”3 Both the NFPA and NPSIB numbers mayoverestimate the absolute number of firefighters, since career firefighters mayvolunteer in one or more departments, and volunteers can also belong tomultiple departments.
Police/Law Enforcement
Of the three services, the total number of personnel in law enforcement is theeasiest to count. However, the day-to-day roles of these personnel varyconsiderably. In addition to patrol officers, detectives, and others who are “onthe street,” sworn law enforcement personnel include bailiffs, correctionalofficers, and others who are unlikely to be on the front lines as emergencyresponders. Although police are actually a subset of all law enforcement officers,we use the terms interchangeably in this report.
_________________2 Karter (2001).3 NPSIB (2002a) and conversations with NPSIB staff.
7
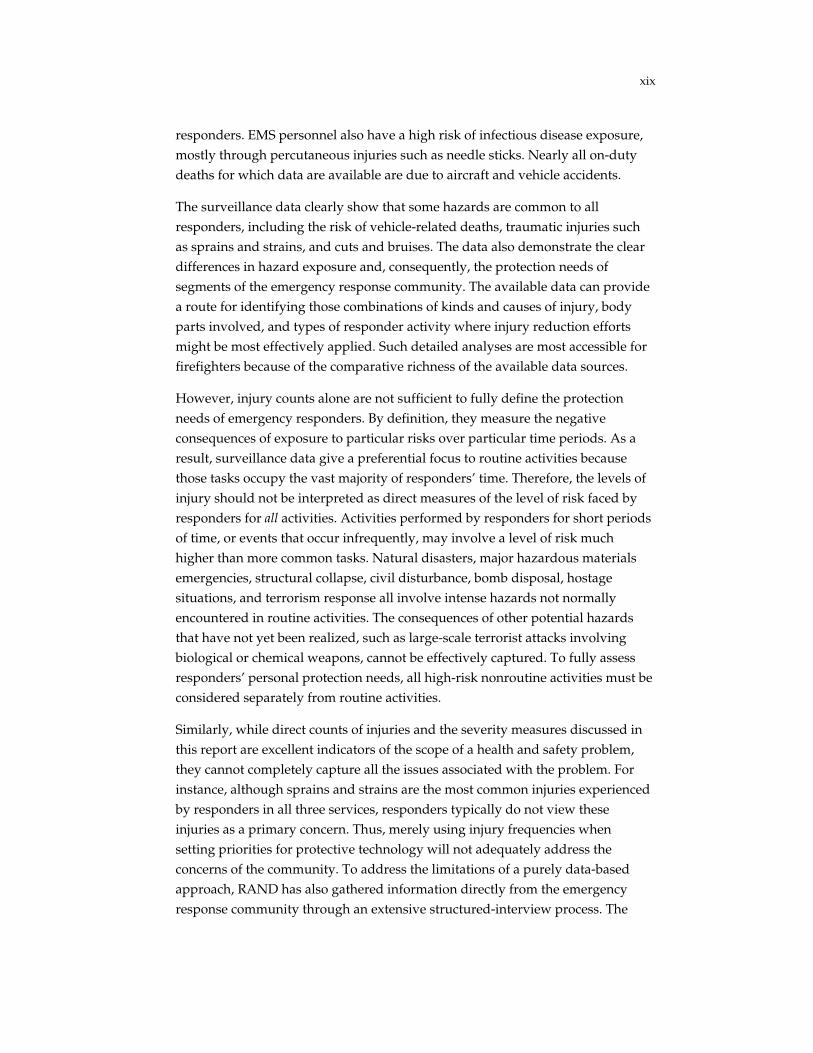
The Bureau of Justice Statistics (BJS) periodically takes a census of lawenforcement personnel at the state and local levels and surveys the number ofpersonnel at the federal, state, and local levels. From these data, BJS calculatesthe number of personnel involved in patrol and investigation. Table 2.1 showsthese data for 2000, the most recent year for which counts for both federal andstate/local officers are available.
Table 2.1Full-Time Law Enforcement Personnel, 2000
Full-Time Sworn Personnel WhoRespond to Calls for Service or Have
Investigative ResponsibilityFull-Time
SwornPersonnel
Full-TimeNonswornPersonnel Service Investigative
Federal 88,496 72,000 17,000 36,000
State/local 708,022 311,474 424,000 106,000
Total 796,518 383,000 441,000 142,000SOURCES: Reaves and Hart (2001), Reaves and Hickman (2002).NOTE: Data on assignment are derived from percentages reported in the sources and are
rounded to the nearest thousand.
In 2000, there were nearly 800,000 full-time sworn law enforcement officers, ofwhom about 441,000 regularly responded to calls for service and another 142,000had primarily investigative responsibility. This number includes not onlyfederal, state, city, and county governments but also special law enforcementdepartments, such as transit and campus police with (usually) firearm and arrestauthority. Private-sector security professionals and employees of the military arenot included. In addition, there were more than 380,000 full-time non-sworn or“civilian” employees. (The approximately 100,000 part-time personnel are notincluded in the table.)
Almost three-fourths of sworn personnel (the approximately 583,000 full-timeofficers with patrol or investigative responsibility) can be considered emergencyresponders, because their jobs require responding to incidents and dealing with awide range of known and unknown hazards. The remaining full-time swornpersonnel have some other primary responsibility, such as administrative, court,or correctional duties, and as a result face a more well-defined—but, in manycases, still significant—set of hazards.

8
The number of federal, state, and local officers, particularly those withoutemergency response duties, has been increasing steadily over the past ten years.The number of state and local full-time sworn officers increased 19 percent from1990 to 2000, and the number of federal officers has increased 28 percent from1993 to 2000.4
Emergency Medical Services
In a particular jurisdiction, emergency medical response may be theresponsibility of a the local fire department, a separate “third service” publicagency, a hospital or group of hospitals, a private company, or a combination ofseveral of these organizations. In part because of the diversity among EMSorganizations, no reliable counts of the number of EMS personnel exist. Thereare, however, several ways to estimate their number.
Members of the emergency response community have estimated their numberfrom 100,000 to 1 million, with most estimates clustering around 500,000,5 notincluding firefighters who respond regularly to both fire and medicalemergencies.6
In addition, NPSIB data provide a range for the EMS population, and counts ofpaid EMS personnel and state-level EMS certifications are available. Takentogether, these sources suggest that 500,000 is a reasonable estimate for thenumber of active EMS responders.
According to the 2002 NPSIB directory, about 212,000 emergency medicalpersonnel belonged to EMS agencies (both public and private) and up to 465,000belonged to fire departments (both career and volunteer), for a total range of212,000 to 678,000 emergency medical responders.7
One statistic that is available is the number of EMS certifications. There wereover 850,000 state-level EMS certifications in 2001 and possibly as many as
_________________4 Counts for 1990 and 1993 from Reaves (1992, 1994).5 Conversations with local and national firefighting and EMS organizations.6 In 2000, firefighters responded to more than 20 million calls, including about 1.7 million fire
incidents and over 12 million emergency medical calls. See NFPA (2002).7 NPSIB (2002a).

9
1,000,000.8 EMS certifications at the state level are required for practicingemergency medical responders. However, the number of EMS responders ismuch smaller, both because some individuals may be certified in multiple statesand because the count of certified personnel includes firefighters and police, aswell as people not affiliated with the emergency response community.
Like the fire service, EMS personnel are a combination of career and volunteerresponders, as the affiliation information for National Registry EmergencyMedical Technicians (EMTs) in Table 2.2 shows.9 Paid emergency medicalservice personnel may belong to either public or private organizations. In 2001,the Bureau of Labor Statistics estimates that there were about 171,000 paid EMTsand paramedics.10
Responders with higher certifications, such as EMT-Paramedic, were more likelyto belong to a paid public or private EMS service than were responders with onlyEMT-Intermediate or EMT-Basic certification. For all levels of certification,
Table 2.2Affiliation of National Registry EMTs by Level of Certification, 1999 (%)
Level of CertificationHospital–
Based
FireDepartment–
Based
Municipalor County–
Based
PrivateAmbulance
Service
VolunteerRescueService
EMT Basic 15 24 14 14 33
EMT Intermediate 16 25 20 21 18
EMT Paramedic 18 31 17 28 5SOURCE: National Registry of Emergency Medical Technicians (1999).NOTE: Survey responses of other, unknown, or no response are omitted from the percentages
reported in the table.
________________8 EMS Magazine (2001) reports a total of about 877,000 certifications. However, about one-half of
the states did not report the number of “first responder” certifications, and several states includeddispatchers and emergency room doctors and nurses in the total. Excluding emergency roompersonnel and dispatchers, the total number of emergency responder certifications reported wasabout 860,000. This number includes about 140,000 paramedics, 575,000 basic and intermediate EMTs,and 145,000 first responders (for the states that reported first responder counts). If first respondercertifications are roughly proportional to state population, an additional 140,000 emergencyresponder certifications were held in the states that did not report these counts.
9 National Registry EMT certification is a nationwide certification that is recognized by manystates through reciprocity agreements. The affiliation of National Registry EMTs may differ from theaffiliation of state-certified EMTs.
10 Bureau of Labor Statistics (2003a).

10
responders were distributed among hospital-based, fire department–based,municipal, and private organizations, with a significant number belonging toeach type of organization.

11
3. Available Surveillance Data Sources toDefine the Occupational Injury andDisease Characteristics of theEmergency Responder Workforce
Four main types of data sources provide information on the occupationalhazards, injuries, and illnesses faced by emergency responders: responder-specific sources, incident-specific sources, general population occupationalhealth and safety sources, and focused epidemiological studies.
• Responder-specific sources are generally collections of injury, fatality,and sometimes illness information for a single service. Because theformat of the data can be tailored to focus specifically on the uniquerange of hazards faced by that service, the information can be verydetailed.
• Incident-specific databases derive from reporting of specific types ofincidents, in which responder injuries are only one part of the requiredreporting.
• General population data sets on work-related injuries, illnesses, andfatalities can be used to analyze emergency responder health and safetyissues when the data sets contain occupation coding. Currently, suchsources allow limited breakouts of data for police and firefighters, butusually not for EMS personnel.
• Focused studies, usually conducted by individual researchers or smallgroups, generally consider one or more safety and health problems. Suchstudies frequently use a small sample population, such as one state or asmall number of departments, and generally address a specific type ofoccupational health hazard. Because non-acute occupational injuries andillnesses are not captured effectively in most data sets, researchers haveconducted epidemiological studies to investigate these hazards.Firefighters are studied much more often than other emergencyresponders are. Focused studies have been done on such topics as the

12
incidence and severity of hearing loss among Houston EMS workers1
and the cancer incidence among firefighters in several Seattle-area firedepartments.2 Available studies suggest that there may be some elevatedincidence of several types of cancer, hearing loss, respiratory problems,and other diseases among firefighters. The studies are frequentlyinconclusive, and indications of slightly increased risk are often presentbut not at statistically significant levels. One major complication inepidemiological studies is the “healthy worker effect.” This manifestsitself in two main ways. First, the population of emergency responders ishealthier than the general population at the time of hiring because of thestringent fitness requirements for duty. Second, workers who becomeunfit after employment because of illness or exposure to occupationalhazards may be removed from the workplace or reassigned to otherduties and are often lost to follow-up analysis.3
RAND obtained data from four responder community organizations and sixfederal agencies (or obtained these reports online) and received a variety of data,including articles and other published reports, tabular data (frequently containedin published reports), sortable data sets, and narrative information. Availabledata on fatalities typically cover all fatalities, whereas data on injuries cover asubset of the total (either a random or self-selected sample).
This report uses data from eight of these organizations, including all of thecommunity sources. Our review indicates that the various data sources havedifferent inclusion criteria and different methods of classifying such informationas cause and nature of injury. Even complete samples of the same nominalpopulation are slightly different. The reasons for these differences includevarying inclusion criteria—particularly those related to who is considered aresponder and what constitutes an occupational fatality. For example, heartattacks occurring on duty are not considered occupationally related by severalsources, whereas other sources include both on-duty heart attacks and thosebelieved to be caused by an on-duty event. The following sections describe indetail the data sources we investigated, grouped by responder service.
_________________1 Pepe et al. (1985).2 Demers, Heyer, and Rosenstock (1992).3 Guidotti (1995).

13
Fire Service Sources
IAFF Death and Injury Survey
The International Association of Fire Fighters (IAFF)4 Death and Injury Survey isan annual report based on a survey of a population-stratified random sample ofcareer-only and career and/or volunteer fire departments. In a typical year, thesampled departments employ around 100,000 firefighters. Information collectedincludes line-of-duty deaths and injuries, incidence and type of infectious diseaseexposure, and occupational injury and illness retirements. Injuries are brokendown by type of duty and nature of injury. IAFF provided RAND with thisinformation for 1993–1998.
The Death and Injury Survey is the only firefighter data source that reportsinformation regarding the incidence of infectious disease exposure and thecauses of occupational injury and illness retirements. It has several limitations:First, it covers only career firefighters. Second, the injury breakdowns are givenas a percentage of all injuries, not as raw or estimated counts. Thus it issomewhat difficult to make year-to-year comparisons, to compare the incidenceof infectious disease exposure with other injuries and illnesses, and to do otheranalyses that requires data manipulation. It is IAFF policy, however, not toprovide raw counts.
NFPA Firefighter Injury Reports
The National Fire Protection Association5 produces an annual report offirefighter injuries based on a survey of a population-stratified random sample ofmunicipal (city and county) fire departments. In 2000, nearly 3,000 firedepartments, protecting 37 percent of the U.S. population, responded to thesurvey. The report is published each year in the NFPA Journal.6 NFPA estimatesthe total number of firefighter line-of-duty injuries in the nation, broken down bytype of duty and nature of injury for all injuries (including a crosswalk of bothvariables), as well as by cause of injury for fireground injuries. NFPA providedRAND with this information for 1995–2000.
________________4 International Association of Fire Fighters, 1750 New York Ave, NW, Washington, DC 20006
(http://www.iaff.org/).5 National Fire Protection Association, 1 Batterymarch Park, Quincy, MA 02269
(http://www.nfpa.org/Home/index.asp).6 Sample reference: Michael J. Karter and Paul LeBlanc, “U.S. Firefighter Injuries— – 1996,”
NFPA Journal, Vol. 91, No. 6, November/December 1997, pp. 67–77.
14
The NFPA firefighter injury reports cover both career and volunteer firefighters,effectively complementing the IAFF Death and Injury Survey by providing muchof the same information but for the total firefighter population instead of careerfirefighters only. Together, the two sources permit a qualitative comparison ofcareer and volunteer firefighter injuries.
NFPA Firefighter Fatality Reports
NFPA also produces an annual report on firefighter fatalities in the NFPA
Journal.7 The NFPA firefighter fatality reports break down the complete set of on-duty deaths by nature of injury, cause of injury, type of duty, and other factors,such as demographics and type of property for fireground deaths, as well as therelationship between these factors. NFPA provided RAND with this informationfor 1995–2000.
Also valuable are analyses of special topics in each annual report. These moredetailed studies include deaths associated with incendiary and suspicious fires(1995), analysis of deaths while responding to or returning from alarms (1996),and fatalities among firefighters wearing Personal Alert Safety System (PASS)devices (1997).
USFA Firefighter Fatality Reports
The United States Fire Administration (USFA) also produces an annual reportbased on the complete set of firefighter on-duty deaths. Fatalities are brokendown by nature of injury and cause of injury; and type of duty, firegroundactivity, and other factors such as demographics and type of property forfireground deaths. In addition, the report contains narrative informationdescribing the circumstances of every fatality. Special topics, such as homicidesand violence in the workplace, firefighter health and wellness, and vehicleaccidents (1996 report) are also covered. For the analysis in this document, weused reports for 1995–2000.8
This data source has significant overlap with the NFPA firefighter fatalityreports. One advantage of the USFA database is that it includes narrative reportsfor all fatalities and a breakdown by activity for fireground injuries.
_________________7 Sample reference: Arthur E. Washburn, Paul R. LeBlanc, and Rita F. Fahy, “1996 Firefighter
Fatalities,” NFPA Journal, Vol. 91, No. 4, July/August 1997, pp. 46–60.8 Reports are available dating back to 1986 at http://www.usfa.fema.gov/dhtml/inside-
usfa/ff_fat.cfm (accessed 10/31/02).

15
National Fire Incident Reporting System
The National Fire Incident Reporting System (NFIRS) is an incident-baseddatabase maintained by USFA that contains information on fire incidentsreported by fire departments in 44 states. About one-third to one-half of all U.S.fire departments participate. The database contains information about the type ofincident, amount of loss, and civilian and firefighter casualties. Extremelydetailed information about firefighter injuries is available in the firefightercasualty module, including the nature, severity, and cause of injury; body partinvolved; activity at the time of injury; and type of personal protectiveequipment worn and whether it performed adequately. USFA provided RANDwith the firefighter casualty module for 1998. The 1998 firefighter casualtymodule contains about 7,000 records, or about 8 percent of all firefighterinjuries.9 For 1998, the NFIRS database covered only fire incidents, but theNFIRS reporting system is being updated to include all emergency incidents towhich fire departments respond, not only fire incidents. The database includesprimarily fireground injuries, with few reported injuries for other types of duty;in 1998, about 95 percent of injuries in the casualty module occurred on thefireground.
NFPA has published a report, Patterns of Firefighter Fireground Injuries, which isan analysis of NFIRS data for 1993–1997 corresponding to fireground injuriesonly. The data are weighted by year based on information in NFPA’s annualsurvey of fire departments, and unknown data were estimated based on thesame proportional distribution as known data.10 This process produces nationalestimates of the number and types of injuries and improves data quality bycorrecting for missing data, but the resulting data set is less flexible than the rawNFIRS data.
The NFIRS database is an extremely useful data source. The firefighter casualtymodule is a sortable database, so the records can be sampled to explore specificcombinations and relationships between the nature and circumstance of injuries.Because the data are voluntarily reported, it is not known whether the reportingdepartments are representative of the fire service as a whole.11
________________9 Total number of injuries from NFPA firefighter injury report (1998).10 Karter (2000).11 Hall and Harwood (1985).

16
Firefighter Fatality Investigation Reports
NIOSH’s firefighter fatality investigation reports, part of the Fatality Assessmentand Control Evaluation (FACE) Program, are detailed investigations into thecauses and circumstances of a subset of firefighter fatality incidents. The reportsalso offer recommendations on preparedness, management, training, and otherfactors that might have prevented the casualties.12
Although these reports investigate only a subset of fatalities, the depth of theinvestigations makes them very useful as a connection between protectivetechnology opportunities and the overall surveillance data analysis. The reportscan be used to identify personal protective technology solutions that couldreduce the number of injuries and fatalities from particular causes.
Law Enforcement Sources
National Law Enforcement Officers Memorial Fund Database
The National Law Enforcement Officers Memorial Fund (NLEOMF)13 keeps adatabase of all line-of-duty deaths, broken down by “primary reason” (similar tocause of injury), whether the fatality was accidental or felonious, and otherfactors, mostly demographic. Short narratives contained in the database allowhand-coding of small samples.
This source is particularly useful because it is the only source that reports line-of-duty illness fatalities for law enforcement personnel. NLEOMF provided RANDwith all records for 1992–2001.
Law Enforcement Officers Killed and Assaulted
Law Enforcement Officers Killed and Assaulted (LEOKA) is an annual statisticalcompilation concerning law enforcement officers who were feloniously oraccidentally killed or assaulted in the line of duty, prepared by the FBI UniformCrime Reporting System’s Law Enforcement Officers Killed and AssaultedProgram. It includes counts of all fatalities reported by law enforcement agenciescontributing to the FBI Uniform Crime Reporting System—a somewhat smallersample than the number reported by NLEOMF and the Census of Fatal
_________________12 The investigation reports may be found at http://www.cdc.gov/niosh/face/firerpts.html
(accessed 10/30/02).13 National Law Enforcement Officers Memorial Fund, 400 7th Street, NW, Suite 300,
Washington, DC 20004 (http://nleomf.org/index1.html).

17
Occupational Injuries (CFOI) (see below). LEOKA reports are available onlinefrom 1996 to 2000, although the database goes back further.14
LEOKA reports provide significant information concerning all aspects offelonious deaths, including narrative information, type of weapon, type ofassignment, and distance between the officer and the offender. Comparativelylittle information is available for accidental deaths. Nonfatal assaults are brokendown by type of weapon and extent of injury.
Emergency Medical Services Sources
National EMS Memorial Service Database
The National EMS Memorial Service (NEMSMS)15 keeps a database of line-of-duty deaths, broken down by cause of death and containing some narrativeinformation about the circumstances surrounding the death. Unlike the NFPA,USFA, and NLEOMF databases, NEMSMS depends entirely on nominationsfrom the responder community to identify fatalities and compile thisinformation. It is not known whether the fatality reports are a complete sampleor are representative of the EMS population. RAND used data for 1998–2001obtained from the NEMSMS website.
National Surveillance System for Health Care Workers
The National Surveillance System for Health Care Workers (NaSH), maintainedby the National Center for Infectious Diseases, collects information onoccupational exposures and infections among health-care workers, includinghospital-based EMTs, in a small sample of hospitals (in 1999, there were 23participating hospitals). For infectious disease exposures, the data includeinformation about the mechanism of exposure. The Centers for Disease Controland Prevention (CDC) provided RAND with data from the program’s inceptionin June 1995 through February 2002.
General Population or Multi-Service Sources
A particular strength of general population sources is that responders can becompared between services and to the general population using the same
________________14 Reports may be found at http://www.fbi.gov/ucr/ucr.htm dating back to 1996 (accessed
10/31/02).15 National EMS Memorial Service, P.O. Box 279, Oilville, VA 23129 (ht tp://nemsms.org/).

18
reporting criteria. However, multiple-service sources also tend not to be asdetailed as the responder-specific data sets because they are unable to focus onthe specific range of hazards faced by emergency responders.
Census of Fatal Occupational Injuries
The Census of Fatal Occupational Injuries, maintained by the Bureau of LaborStatistics (BLS), provides counts of law enforcement and career firefighter work-related injury fatalities. Heart attacks and other non-traumatic on-duty injuriesare not considered work-related. The fatalities are broken down by severalfactors. RAND has obtained these data for 1992–2000,16 as well as a reportsummarizing the data for 1992–1997.17 Another general population data source,the National Traumatic Occupational Fatalities Surveillance System, maintainedby NIOSH, provides similar information.
In our analysis, CFOI was used only to compare the fatality rate of firefightersand police to the general population using a common set of selection criteria.Because of stringent confidentiality requirements, many of the cell counts thatwould be part of detailed breakdowns by variables of interest such asevent/exposure and activity are not publicly available. Because of this, coupledwith the fact that the NFPA, USFA, and NLEOMF databases include much moredescriptive information, we did not pursue CFOI for detailed breakdowns of thenature and circumstance of line-of-duty fatalities.
Survey of Occupational Injuries and Illnesses
The Survey of Occupational Injuries and Illnesses (SOII), maintained by theBureau of Labor Statistics, reports counts and incidence rates for occupationalinjuries, broken down by occupation. Occupation categories include firefighters(code 417), and police and detectives (code 418). Recordable injuries and illnessesare defined as occupational deaths, regardless of the time between injury anddeath or the length of the illness; nonfatal occupational illnesses; and nonfataloccupational injuries that involve one or more of the following: loss ofconsciousness, restriction of work or motion, transfer to another job, or medicaltreatment (other than first aid).
_________________16 Data received from BLS staff. Some data can also be obtained online at http://www.bls.gov/
iif/oshcfoi1.htm (accessed 10/31/02).17 Clarke and Zak (1999).

19
Detailed breakdowns of the data are available from the Case and Demographicstaff for injuries involving lost workdays. These data can be broken down bynature of injury, event/exposure (cause), part of body, and other factors. Therecords contain days away from work for each injury. In addition, the mediandays away from work can be reported for each injury category, providing arough measure of relative severity.
Some SOII data on emergency responder injuries can be obtained online, brokendown by industry.18 Some states report the incidence counts and rates for local-government public administration: police protection (industry code 9221) andfire protection (code 9224). Civilian employees of public safety agencies areincluded in these counts. In 2000, these data were available for California, Maine,New Jersey, New York, and North Carolina.
A major limitation of this source for police and firefighter injuries (EMSpersonnel cannot be broken out) is that public-sector injury data are notaggregated above the state level. Information on injuries to public sectoremployees is reported by only some states,19 and state and local governmentsare separated. Because of strict confidentiality requirements that prevent thepublication of small cell counts, having a number of small data sets instead ofone or two larger sets means that a significant portion of the data is not publiclyavailable, and only California and New York local governments have enoughcase counts for reportable information to be available for any but the most simplebreakdowns. Access to these data could presumably be obtained via agreementwith the BLS or through the Bureau’s standard process for obtaining researcheraccess to confidential data, although BLS confidentiality requirements mayprevent the publication or dissemination of this information. BLS considersapplications for this access three times a year.20
For the purpose of reviewing the SOII database, BLS provided RAND withcomplete breakdowns by nature, event/exposure, event/exposure and nature,and event/exposure and part of body (with mean days away from work for allbreakdowns) for police and detectives at the local government level in New Yorkstate (the state reporting the most police injuries), for the years 1998–2000.
EMS workers are not broken out of SOII and most other general populationdatabases because occupation and industry codes currently in use do not allow
________________18 http://www.bls.gov/iif/oshstate.htm (accessed 10/31/02).19 Data for public-sector employees are available only for those states that have OSHA-
approved safety programs; in 2000, there were 25 such states. Data from “non-OSHA” states are notavailable.
20 John W. Ruser, Bureau of Labor Statistics, personal communication, 3/18/02.

20
them to be identified. However, revisions to the Standard OccupationClassification (SOC) System in 1998 created a category for emergency medicaltechnicians and paramedics, and grouped law enforcement personnel into more-useful categories, including separating police and sheriff’s patrol officers fromofficers who are likely not emergency responders.
NIOSH, BLS, and other government data sources with occupational coding areswitching from Census 1980 codes based on the old SOC system to Census 2000codes based on the 1998 SOC revision. Some sources have already transitioned,while others will do so over the new few years. As of October 15, 2002, nooccupational injury data sources had made the transition. The BLS is expected toadopt the new occupation coding for year 2003 SOII data, which will be availablein 2005. Table 3.1 shows the 1980–1990 occupation codes currently in use and thenew 2000 codes.
National Electronic Injury Surveillance System
The most significant EMS injury data source that RAND was able to obtain wasfrom the National Electronic Injury Surveillance System (NEISS) maintained byNIOSH, which utilizes data reported by a sample of hospital emergencydepartments. A NIOSH analysis done with 1996–1998 data investigated injuriesto responders in all three emergency services, coding occupation from narrativeinformation.21 The analysis broke injuries down by nature of injury and part ofbody for all three services. These data are preliminary—the limited occupationinformation reported by NEISS does not allow accurate distinction between firedepartment employees injured while serving in a fire control capacity versusserving primarily as an EMT. Additionally, firearms-related injuries were are notincluded in the data set. Although the reported injury incidence rates and injuryestimates may have some error as a result of occupation definition issues, thegeneral proportions of injuries by nature and body part are not expected tochange significantly. However, these preliminary data should be viewedjudiciously because they may change with further analyses or injured-workerfollow-back studies on workers’ activity and occupation at the time of injury .22
National Occupational Mortality Surveillance System
The National Occupational Mortality Surveillance System, maintained byNIOSH, contains information on the cause of death and normal occupation
_________________21 NIOSH, L. L. Jackson, unpublished data.22 Larry Jackson, NIOSH, personal communication, 8/1/02.

21
Table 3.1—Occupation Codes Used in Federal Government Data Sources
Occupation CodesService Census 1980 Codes Census 2000 Codes
Police and otherlaw enforcement
414 Supervisors, Police andDetectivesa
415 Supervisors, Guards
418 Police and Detectives,Public Servicea
423 Sheriffs, Bailiffs, andOther Law EnforcementOfficers
424 Correctional InstitutionOfficers
370 First-Line Supervisors/Managers of CorrectionalOfficers
371 First-Line Supervisors/Managers of Police andDetectivesa
380 Bailiffs, Correctional Officers,and Jailers
382 Detectives and CriminalInvestigatorsa
383 Fish and Game Wardens
384 Parking Enforcement Workers
385 Police and Sheriff's PatrolOfficersa
386 Transit and Railroad Policea
Firefightersand otherfire service
413 Supervisors, Firefightingand Fire PreventionOccupationsa
416 Fire Inspection and FirePrevention Occupations
417 FirefightingOccupationsa
372 First-Line Supervisors/Managers of Fire Fighting andPrevention Workersa
374 Fire Fightersa
375 Fire Inspectors
EMS 106 Physician’s Assistants
207 Licensed Practical Nurses
208 Health Technologists andTechnicians, notelsewhere classified
446 Health Aides, exceptNursing
447 Nursing Aides, Orderlies,and Attendants
340 Emergency Medical Techniciansand Paramedicsa
SOURCE: Census 1980 occupation codes for EMS personnel from Maguire, et al. (2002)..NOTES: The categories in the table are those in which emergency responders may be placed, or
in which nonresponder fire department and police personnel are likely to be placed.aPersons with this occupation code are likely to be emergency responders.

22
and industry of the deceased for a significant fraction of all deaths, not just thosethat are work-related. Frequencies and proportional mortality ratios for specificoccupations can be computed. However, the data do not include genetic andbehavioral risk factors such as smoking, many of which are likely moresignificant than occupational risk factors. As such, extensive modeling andanalysis of responder and control populations would be required to use thesedata. We therefore did not pursue this data source for this analysis.
Hazardous Substances Emergency Events Surveillance
The Hazardous Substances Emergency Events Surveillance (HSEES), maintainedby the Agency for Toxic Substances and Disease Registry, captures informationabout any incident involving the release or threatened release of at least onehazardous substance, where hazardous is defined as “might reasonably beexpected to cause adverse human health effects.” Releases of only petroleumproducts are excluded, and data are collected from participating states. Figure 3.1shows the states reporting for 1998.
Information is included in the database on all injuries occurring at these events,including injuries to emergency responders. Responder injuries are broken downby type of responder, nature and severity of injury, and type of protectiveequipment worn. Counts of responder injuries and their nature and severity can
Figure 3.1—States Reporting to the Hazardous Substances Emergency EventsSurveillance, 1998

23
be obtained from published Annual Reports, available online for 1995–1998.23
More-detailed information can be requested directly from the Agency for ToxicSubstances and Disease Registry.
Table 3.2 shows the data sources we obtained that contain information regardingthe injuries, illnesses, and fatalities experienced by emergency responders.Although we did not use data from all of the cited sources in the overview ofresponder injuries and fatalities in the following section, all sources are includedhere as potential contributors to subsequent analyses.
Findings
Extensive data are available for firefighters. By combining sources, counts andincidence rates are available for both fatalities and injuries, and both can bebroken down by nature, cause, activity and type of duty. For police, the data areless extensive, but still adequate to characterize the risks encountered byresponders. Information on responder activity at the time of injury is notavailable and represents the largest gap in police data. For emergency medicalresponders, analogous data sources do not yet exist, but some information onfatalities, injuries, and infectious disease exposure is available. Improvements tooccupation coding in federal government databases are currently underwaywhich will provide new sources of information on EMS injuries.
Although there are some gaps in the data, currently available data sources areadequate to provide an overview of emergency responder protection needs.Table 3.3 summarizes the information currently available from all data sources todescribe the injuries, illnesses, and fatalities experienced by emergencyresponders.
Information is also scarce for non–acute onset and chronic health effects. Thisproblem is not unique to emergency responders. Because conditions with longlatency periods and unclear connections to occupational activities are much more
________________23 http://www.atsdr.cdc.gov/HS/HSEES/ (accessed 10/31/02).

24
Table 3.2Major Data Sources Describing Emergency Responder Injuries and Fatalities
Data Source Name andSupporting Organization
Type andServices Data Format
Years Usedby RAND
OnlineAccess?
Death and Injury Survey (IAFF) Responder-specific (fire)
Tabular 1993–1998 No
Firefighter Fatality Reports(NFPA)
Responder-specific (fire)
Complete settabular
1995–2001 No
Firefighter Injury Reports(NFPA)
Responder-specific (fire)
Tabular 1995–2000 No
Firefighter Fatality Reports(USFA)
Responder-specific (fire)
Complete setnarrative,
tabular
1995–2000 Yes
National Fire Incident ReportingSystem (USFA)
Incident-specific(fire)
Sortable 1998 No
Firefighter Fatality InvestigationReports (NIOSH)
Responder-specific (fire)
Narrative — Yes
National Law EnforcementOfficers Memorial Fund
Responder-specific (police)
Complete setnarrative,sortable
1992–2001 No
Law Enforcement Officers Killedand Assaulted (FBI)
Responder-specific (police)
Complete settabular
— Yes
National EMS Memorial Service Responder-specific (EMS)
Narrative 1998–2001 Yes
National Surveillance System forHealth Care Workers (NCID)
Responder-specific (EMS)
Tabular 1995–2002 No
Census of Fatal OccupationalInjuries (BLS)
Generalpopulation
(fire, police)
Sortable byBLS staff
1992–1997 Yes
Survey of Occupational Injuriesand Illnesses (BLS)
Generalpopulation(fire, police)
Sortable byBLS staff
1998–2000 Yes
National Electronic InjurySurveillance System (NIOSH)
Generalpopulation (all)
Tabular 1996–1998 No
National Occupational MortalitySurveillance (NIOSH)
Generalpopulation(fire, police)
Tabular — No
Hazardous SubstancesEmergency Events Surveillance(ATSDR)
Incident-specific(all)
Tabular — Yes
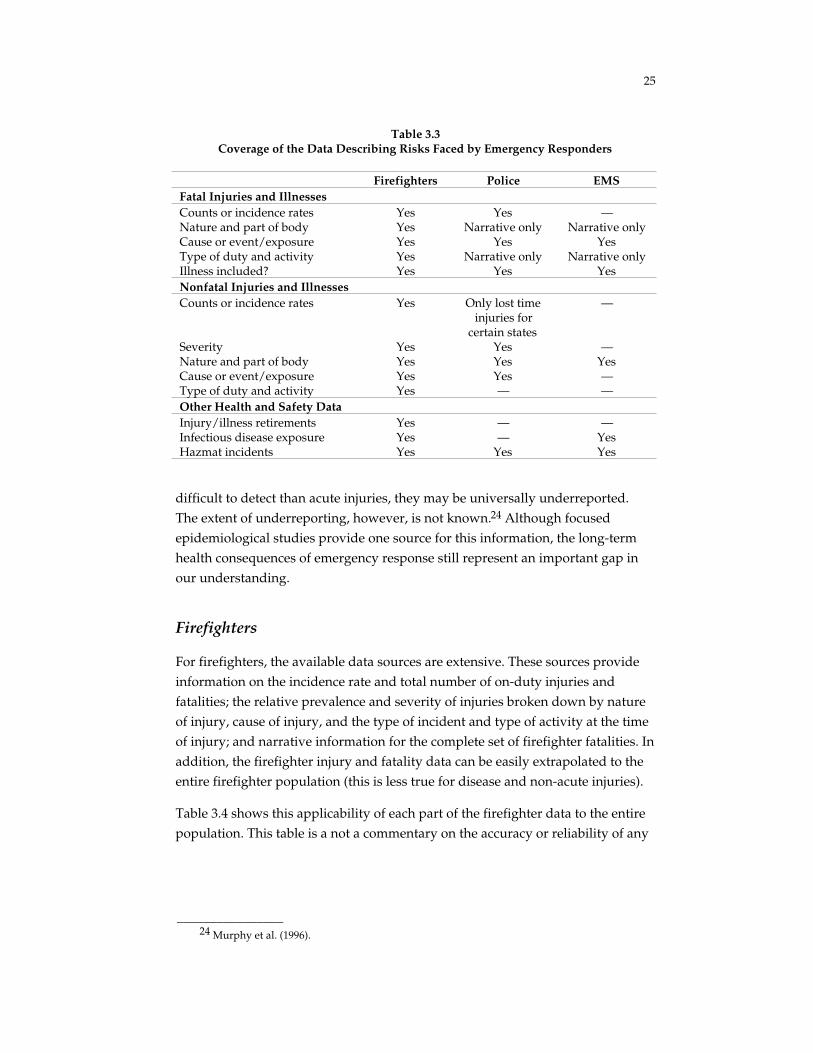
25
Table 3.3Coverage of the Data Describing Risks Faced by Emergency Responders
Firefighters Police EMSFatal Injuries and IllnessesCounts or incidence rates Yes Yes —Nature and part of body Yes Narrative only Narrative onlyCause or event/exposure Yes Yes YesType of duty and activity Yes Narrative only Narrative onlyIllness included? Yes Yes YesNonfatal Injuries and IllnessesCounts or incidence rates Yes Only lost time
injuries forcertain states
—
Severity Yes Yes —Nature and part of body Yes Yes YesCause or event/exposure Yes Yes —Type of duty and activity Yes — —Other Health and Safety DataInjury/illness retirements Yes — —Infectious disease exposure Yes — YesHazmat incidents Yes Yes Yes
difficult to detect than acute injuries, they may be universally underreported.The extent of underreporting, however, is not known.24 Although focusedepidemiological studies provide one source for this information, the long-termhealth consequences of emergency response still represent an important gap inour understanding.
Firefighters
For firefighters, the available data sources are extensive. These sources provideinformation on the incidence rate and total number of on-duty injuries andfatalities; the relative prevalence and severity of injuries broken down by natureof injury, cause of injury, and the type of incident and type of activity at the timeof injury; and narrative information for the complete set of firefighter fatalities. Inaddition, the firefighter injury and fatality data can be easily extrapolated to theentire firefighter population (this is less true for disease and non-acute injuries).
Table 3.4 shows this applicability of each part of the firefighter data to the entirepopulation. This table is a not a commentary on the accuracy or reliability of any
________________24 Murphy et al. (1996).

26
Table 3.4Applicability of Casualty Data to Firefighter Population
Type of Data Applicability Comments
Fatal injury Excellent Multiple sources offering data with high orvery high applicability (NFPA, USFA, IAFF)
Fatal illness Excellent Multiple sources offering data with high orvery high applicability (NFPA, USFA, IAFF)
Nonfatal injury Excellent Multiple sources offering data with high orvery high applicability (NFPA, IAFF, NFIRS)
Nonfatal illness Low Underreported in all sources;, cannot makeany meaningful or significant conclusions
Injury/illnessretirements
Excellent Only for career firefighters; data from IAFF
Infectious diseaseexposure
Medium Underreported in NFIRS; IAFF data includeonly career firefighters; does not have astandard definition of “exposure”
Hazmat incidents High HSEES provides data for participating states
particular data source—not all data sources are designed or intended to reflectthe entire firefighter population.25
NFPA firefighter injury reports and the Death and Injury Survey both providebreakdowns of all on-duty injuries by nature and type of duty. In addition, theNFPA injury reports and NFIRS data provide breakdowns by the nature, cause,and firefighter activity for fireground injuries. The Death and Injury Survey alsoallows comparison between injuries and infectious disease exposures anddocuments the causes of occupational injury and illness retirements. The NFPAand USFA firefighter fatality reports provide information on the complete set ofline-of-duty fatalities. These can be further supplemented with specificinvestigative results, such as those reported by the NIOSH Fire Fighter FatalityInvestigation and Prevention Program.
The NFPA sources, the IAFF Death and Injury Survey, and USFA firefighterfatality reports are all useful for defining a framework to investigate the natures,causes, and types of activities most responsible for injuries and fatalities. For
_________________25 For example, the IAFF Death and Injury Survey looks only at casualties suffered by career
firefighters, who constitute the IAFF membership. These data are somewhat less applicable to theentire (career and volunteer) population than are the NFPA firefighter injury reports, which includeboth types.

27
more-detailed analysis, the NFIRS database is extremely useful. The firefightercasualty module is a sortable database, so the records can be sampled to explorespecific relationships between the nature and circumstance of injuries and toaddress other detailed questions about the hazards faced by firefighters.
Police/Law Enforcement
Although databases tracking the activities and injuries of law enforcementresponders are less developed than those focusing on tracking crime andcriminals, a significant amount of data is available describing police injuries andfatalities. A variety of sources provide narrative information for the complete setof line-of-duty fatalities. The National Law Enforcement Officers Memorial Funddatabase is particularly useful because it includes line-of-duty fatalities resultingfrom illnesses as well as traumatic events, and all data are publicly releasable.The FBI report, Law Enforcement Officers Killed and Assaulted, does not captureas many fatalities but does provide some information on nonfatal assaults, whichresult in a significant portion of job-related injuries.
Several data sources provide information on the nature and cause of nonfatalinjuries. Of these sources, the most detailed data come from the BLS Survey ofOccupational Injuries and Illnesses. However, because of confidentialityrequirements and the fact that data for public-sector employees are notaggregated above the state level, fewer data are publicly available that describenonfatal injuries to police officers than are available for workers in privateindustry (data for the latter are aggregated nationally). In the context of futureanalysis of responder injuries, researchers may be able either to fulfill therequirements needed to obtain access to the confidential records or to obtainalready-analyzed data via an agreement with BLS. The SOII data are sortable byBLS staff, and can be used to address some detailed questions about the type andfrequency of police injuries. Overall, the applicability of police data to the totalresponder population is high, as shown in Table 3.5. The largest hole in thisregard is the nonfatal-injury data.
Aggregated injury and illness data for the reporting states would significantlyupgrade the ability to compare injuries within and across all three services andthe general population. Unlike firefighter data sources, no data source provides

28
Table 3.5Applicability of Casualty Data to Law Enforcement Population
Type of Data Applicability Comments
Fatal injury Excellent Multiple sources offering data with high orvery high applicability (NLEOMF, FBI)
Fatal illness High NLEOMF data include illness as well
Nonfatal injury Medium BLS data publicly available on a state-by-statebasis only; only very large states have enoughreported injuries to be useful for analysis
Hazmat incidents High HSEES provides data for participating states
information on officer activity at the time of injury. The ability to match injuriesto responder activity would be greatly enhanced if worker activity was recordedand tabulated for BLS injury data using a scale similar to the one for fatality datain CFOI.
Emergency Medical Services
Data on EMS responders are scarce. Some narrative information is available todescribe EMS line-of-duty fatalities, and the NaSH database and IAFF Death and
Injury Survey describe the mechanism and type of disease for infectious diseaseexposures. Available data are difficult to extrapolate to the entire population, asindicated in Table 3.6. This difficultly is compounded by the fragmented natureof the EMS sector.
General-population sources contain information on police and firefighters, butEMS personnel are not typically broken out. However, an analysis of NEISS datamade available to RAND by NIOSH researchers breaks injuries down by natureof injury and part of body involved for all three emergency response services,and allows the injuries to be compared across services.26 This study, which is notpublicly releasable, is the only source of information on EMS nonfatal injuries,
_________________26 L. L. Jackson, NIOSH, unpublished data.
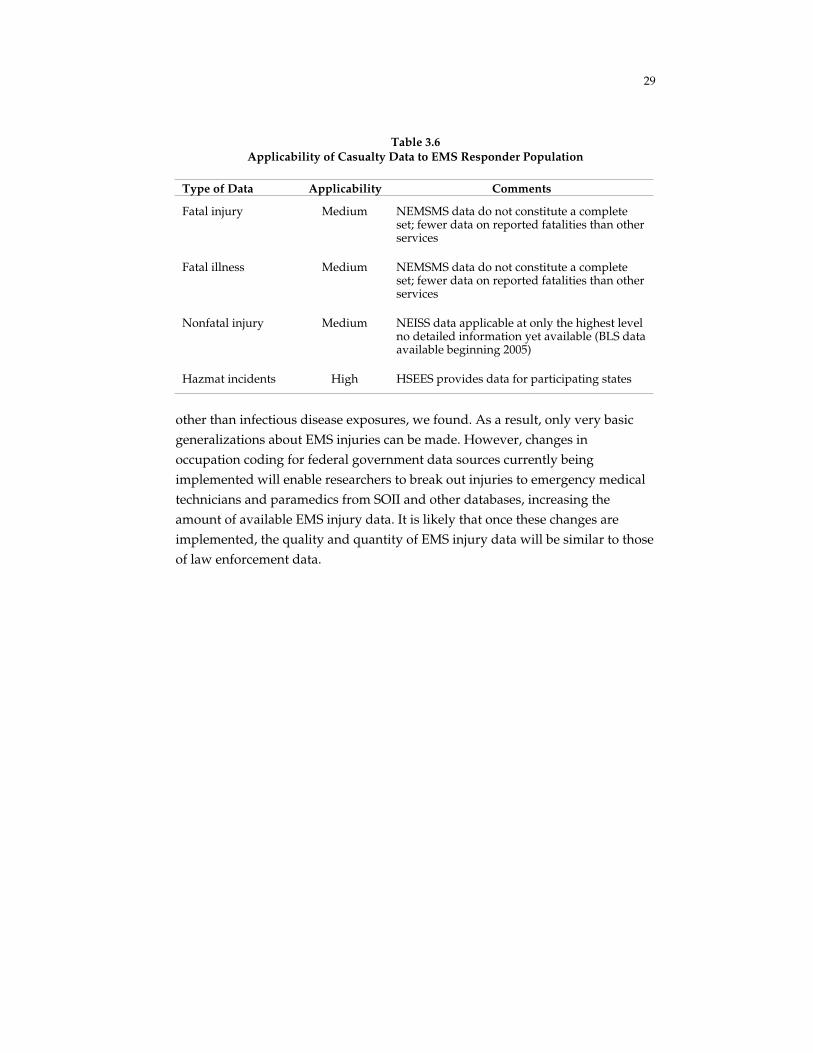
29
Table 3.6Applicability of Casualty Data to EMS Responder Population
Type of Data Applicability Comments
Fatal injury Medium NEMSMS data do not constitute a completeset; fewer data on reported fatalities than otherservices
Fatal illness Medium NEMSMS data do not constitute a completeset; fewer data on reported fatalities than otherservices
Nonfatal injury Medium NEISS data applicable at only the highest levelno detailed information yet available (BLS dataavailable beginning 2005)
Hazmat incidents High HSEES provides data for participating states
other than infectious disease exposures, we found. As a result, only very basicgeneralizations about EMS injuries can be made. However, changes inoccupation coding for federal government data sources currently beingimplemented will enable researchers to break out injuries to emergency medicaltechnicians and paramedics from SOII and other databases, increasing theamount of available EMS injury data. It is likely that once these changes areimplemented, the quality and quantity of EMS injury data will be similar to thoseof law enforcement data.


31
4. Observations from the Data RegardingRisks Faced by Emergency Responders
Because of the high level of risk associated with their mission andresponsibilities, emergency responders are subject to a significant number ofoccupational injuries, illnesses, and fatalities. In addition to the tragic events ofSeptember 11, in which over 400 responders lost their lives, an average of 97firefighters and 155 police officers were killed in the line of duty each year from1990 to 2001 (see Figure 4.1). The firefighter deaths include those that occur whenfirefighters are performing EMS duties, and an average of at least 11 additionalnon-firefighter emergency medical responders died in the line of duty each yearbetween 1998 and 2001.1 Excluding those associated with September 11,responder fatalities have decreased substantially from the level in the early1980s, when over 300 responders died each year.
0
100
200
300
400
500
600
700
1980 1982 1984 1986 1988 1990 1992 1994 1996 1998 2000
Law EnforcementFirefightersLaw Enforcement – 9/11/01Firefighters – 9/11/01
Nu
mb
er o
f fa
talit
ies
RAND TR100-4.1
SOURCE: U.S. Fire Administration (2002), National Law Enforcement Officers Memorial Fund (2002b).
Figure 4.1—Firefighter and Law Enforcement Fatalities, 1980–2001
________________1 National EMS Memorial Service (2002).
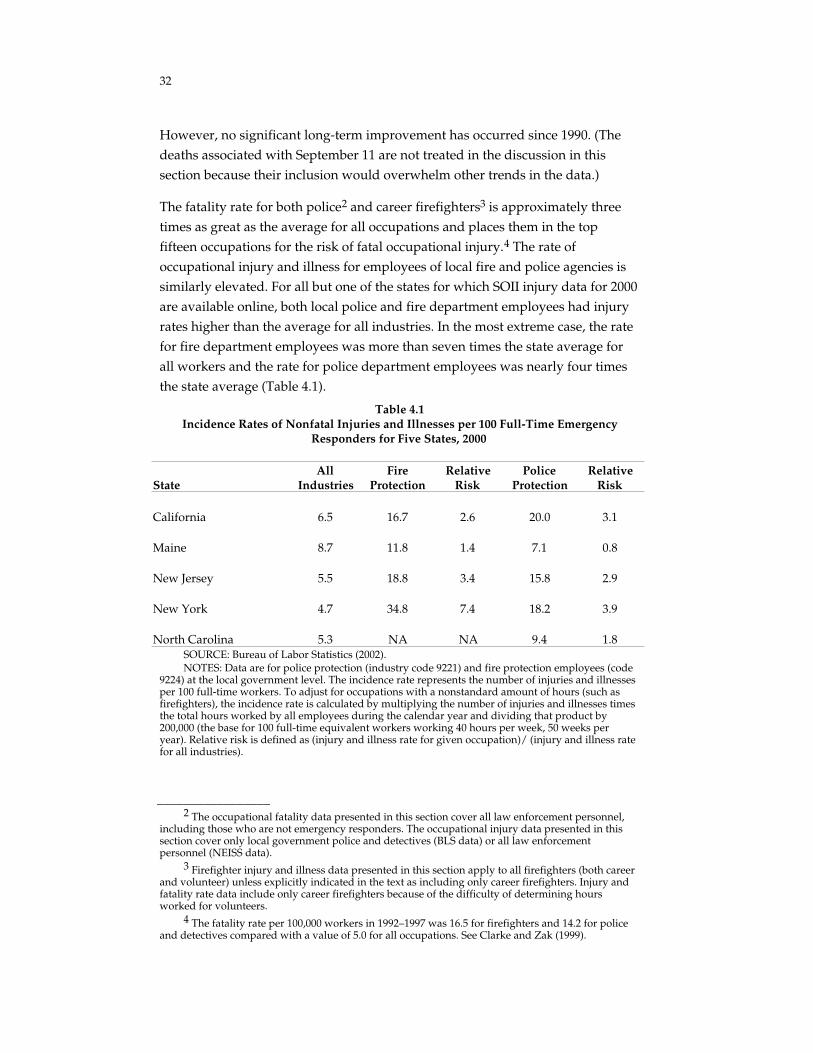
32
However, no significant long-term improvement has occurred since 1990. (Thedeaths associated with September 11 are not treated in the discussion in thissection because their inclusion would overwhelm other trends in the data.)
The fatality rate for both police2 and career firefighters3 is approximately threetimes as great as the average for all occupations and places them in the topfifteen occupations for the risk of fatal occupational injury.4 The rate ofoccupational injury and illness for employees of local fire and police agencies issimilarly elevated. For all but one of the states for which SOII injury data for 2000are available online, both local police and fire department employees had injuryrates higher than the average for all industries. In the most extreme case, the ratefor fire department employees was more than seven times the state average forall workers and the rate for police department employees was nearly four timesthe state average (Table 4.1).
Table 4.1Incidence Rates of Nonfatal Injuries and Illnesses per 100 Full-Time Emergency
Responders for Five States, 2000
StateAll
IndustriesFire
ProtectionRelative
RiskPolice
ProtectionRelative
Risk
California 6.5 16.7 2.6 20.0 3.1
Maine 8.7 11.8 1.4 7.1 0.8
New Jersey 5.5 18.8 3.4 15.8 2.9
New York 4.7 34.8 7.4 18.2 3.9
North Carolina 5.3 NA NA 9.4 1.8SOURCE: Bureau of Labor Statistics (2002).NOTES: Data are for police protection (industry code 9221) and fire protection employees (code
9224) at the local government level. The incidence rate represents the number of injuries and illnessesper 100 full-time workers. To adjust for occupations with a nonstandard amount of hours (such asfirefighters), the incidence rate is calculated by multiplying the number of injuries and illnesses timesthe total hours worked by all employees during the calendar year and dividing that product by200,000 (the base for 100 full-time equivalent workers working 40 hours per week, 50 weeks peryear). Relative risk is defined as (injury and illness rate for given occupation)/ (injury and illness ratefor all industries).
_________________2 The occupational fatality data presented in this section cover all law enforcement personnel,
including those who are not emergency responders. The occupational injury data presented in thissection cover only local government police and detectives (BLS data) or all law enforcementpersonnel (NEISS data).
3 Firefighter injury and illness data presented in this section apply to all firefighters (both careerand volunteer) unless explicitly indicated in the text as including only career firefighters. Injury andfatality rate data include only career firefighters because of the difficulty of determining hoursworked for volunteers.
4 The fatality rate per 100,000 workers in 1992–1997 was 16.5 for firefighters and 14.2 for policeand detectives compared with a value of 5.0 for all occupations. See Clarke and Zak (1999).

33
Between 1995 and 2000, the U.S. firefighter population of more than one million(both career and volunteer) averaged 88,000 work-related injuries each year.5 Asimilar number of injuries occurred for police: Extrapolating from the data inTable 4.1, in 2000 there were approximately 100,000 injuries and illnesses in theUnited States in a population of nearly 600,000 full time patrol and investigativeofficers.6, 7
EMS injury and fatality rate data are difficult to find. An investigation ofNational NEMSMS fatality data and the CFOI estimates the occupational fatalityrate of EMS responders to be about 2.5 times the rate for all workers.8 Noinformation is available on the incidence rate of EMS injuries.
Within this discussion, we performed some reclassification, regrouping, andinterpolation to produce a single set of categories for nature and cause of injury,responder activity, and type of duty. Each data source has a distinct classificationsystem for subcategorizing injuries and/or fatalities by nature, cause, and otherfactors. We used reasonable assumptions to translate these various classificationsystems to a single system for all sources. Although a single system makes itpossible to take advantage of a range of data sources on responder injuries andfatalities, the combined values do not correspond linearly to those reported in theindividual data sources. Appendix A shows how we combined the data sets andexplains where we used additional analysis to complete some categories.
Types of Injuries and Fatalities for All Services
Although occupational injury and fatality rates are significantly elevated for bothfirefighters and police, the types and causes of injury and death for the twogroups are quite different. Stress, becoming lost or trapped, and vehicle accidentsare the primary causes of death for firefighters, whereas police deaths are duealmost exclusively to vehicle accidents and assaults (Figure 4.2). The vastmajority of EMS line-of-duty deaths are due to vehicle accidents and accidentsinvolving rescue helicopters.
________________5 NFPA (1995–2000b).6 Weighting the state injury rates by both responder population in the state (from NPSIB 2002b)
and state population (from the 2000 Census), the incidence rate for employees of local governmentpolice agencies was about 17.5 per 100 full time workers. Because this number includes non-emergency response personnel, the rate for responders may be even higher.
7 Because the injury counts for firefighters and police are reported from different sources, therequirements for defining an injury event in the NFPA and SOII databases may be different.
8 Maguire et al. (2002) estimate the fatality rate for EMS personnel at 12.7 per 100,000 workers,compared with 5.0 for all occupations.

34
0 10 20 30 40 50 60
Percent of fatalities
FirefightersLaw EnforcementEMS workers
Assaults, violence
Vehicle accidents, struck by vehicle
Aircraft accident
Caught, trapped, exposure to fire products or chemicals
Physical stress, overexertion
Other
RAND TR100-4.2
SOURCE: NFPA (1995–2000a), National Law Enforcement Officers Memorial Fund (2002a), and National EMS Memorial Service (2002).
NOTE: Data are for 1995–2000 for firefighters, 1992–2001 for police, and 1998–2001 for EMS.
Figure 4.2—Cause of Fatal Injuries for Firefighters, Police, and EMS Workers
The nature and body parts involved in line-of-duty injuries experienced byemergency responders also vary among the three services, according to ananalysis of information collected in the NEISS database (Figure 4.3). Althoughthe overall breakdown of injuries is similar, the services differ because eachservice faces a different combination of emergency duties and associatedhazards.
NEISS data are collected from emergency room records and therefore represent amore severe sample of injuries than those covered by other sources elsewhere inthis report (by comparison, in almost half of the firefighter injuries included inthe NFIRS database for 1998, the injured firefighter was not transported to amedical care facility). Unlike individual responder-specific data sources, whichmay have different inclusion and coding criteria, NEISS applies identicalstandards to data on members of all three emergency response services.Therefore, NEISS data are particularly useful for comparing injuries experiencedby different types of emergency responders. (The NEISS data reported here arepreliminary and should not be further cited.)

35
0% 10% 20% 30% 40% 50%
Sprains, Strains
Fractures,Dislocations
Lacerations
Punctures
Bruises,Abrasions
Burns
Anoxia, Poisoning
Other
Percent of Injuries within Occupations
Fire Police EMS
SOURCE: L. L. Jackson, NIOSH, unpublished data.aThese estimates represent preliminary data and should not be cited or quoted.RAND TR100-4.3
Figure 4.3—Nature of Injury for Firefighters, Police, and EMS Injuries, 1996–1998,Based on National Estimatesa
According to the NEISS data, the most common occupational injuriesexperienced by firefighters are sprains and strains, which account for about 36percent of all injuries.9 Fractures and dislocations make up about 4 percent ofinjuries, and cuts and bruises (bruises, abrasions, lacerations, and punctures)make up 28 percent. These injuries are similar to those for the other services,indicating that all emergency responders may share the hazards that cause thesetraumatic injuries. Burns and asphyxiation each account for about 7 percent offirefighter injuries. The prevalence of these two types of injuries (compared withthose for other emergency responders) is consistent with an increased risk ofexposure to heat, smoke, and other fire products and hazardous substances.
About 37 percent of police injuries are sprains or strains; 5 percent are fracturesor dislocations; and 40 percent are cuts and bruises, including 28 percent that arebruises or abrasions. The significantly increased incidence of bruises andabrasions is consistent with an increased risk of assault or violence against lawenforcement responders.
________________9 Firearms-related injuries were excluded, but firearms were involved—not necessarily used—in
only 3 percent of nonfatal assaults on police officers in 2000, accounting for only 1.3 percent ofinjuries resulting from assault, so this exclusion amounts to less than 1 percent of all police injuries.See Federal Bureau of Investigation (2002).
36
The NEISS probability-based sample of 67 hospital emergency departmentscontains treatment information for about 600 EMS, 2,000 firefighter, and 3,000police injuries. These cases were used to extrapolate to national estimates ofinjuries treated in U.S. hospital emergency departments. However, the smallnumber of EMS injury cases precludes reliable reporting of national estimates forsome injury subcategories compared with those for firefighters and police.Nearly half of EMS injuries are sprains and strains, and 32 percent are cuts orbruises. The distribution of cuts and bruises among EMS workers is differentthan in the other services: Among police and firefighters, lacerations are two tofour times as common as punctures. For EMS responders, this is reversed,indicating an increased risk of injury from needles or other “sharps.” Suchinjuries are the primary mechanism of infectious disease exposure for theseresponders.
Because the NEISS database includes more detailed information on the site ofinjury, the NEISS data can also be used to describe how responder injuries aredistributed among different parts of the body. Although the distribution of mostinjuries is similar among the three services, EMS responders suffer a much largerpercentage of lower trunk injuries than do police and firefighters and a smallerpercentage of injuries to the lower extremities.10
Firefighter Injuries and Fatalities
The firefighter injury and fatality data can be broken out by cause of injury,nature of injury, and activity and type of duty, including some information onthe severity of nonfatal injuries.
Nature of Injury
Nearly half of all firefighter fatalities are “cardiac” in nature (Table 4.2). Most ofthese are heart attacks. Thirty percent of fatalities are traumatic injuries, most ofwhich are vehicle-related (accidents and struck by vehicle). Another 19 percentare due to burns, asphyxiation, or other respiratory distress, usually occurringwhen a firefighter is trapped in a burning building. About 5 percent of deaths arecaused by all other natures of injury.
The breakdown of injuries is significantly different. Cardiac injuries compriseonly 1 percent of the total, but these injuries are much more likely to be severethan other types of injury. Severity was calculated by the percentage of injuries
_________________10 L. L. Jackson, NIOSH, unpublished data.

37
Table 4.2Average Annual Counts of Firefighter Injuries and Fatalities, 1995–2000
Nature of Injury Minor Moderate Severe Fatality
Sprains, strains 25,600 15,700
Fractures, dislocations 500 1,400500a 29a
Cuts, bruises 11,100 4,200 100 0
Eye injuries 2,700 700 0 0
Burns 3,000 1,800 100 5
Asphyxiation, hazmat inhalation,drowning, other respiratory 2,500 2,500 400 14
Thermal stress 1,700 1,200 300 0
Cardiac 200 600 400 45
All other types 7,300 3,400 300 5
Total 54,500 31,400 2,000 97SOURCES: Fatalities from NFPA (1995–2000a) and U.S. Fire Administration (1996–2001). The
values reported are the average of the two sources. Total injury counts from NFPA (1995–2000b).NOTES: Totals may not add due to rounding. Injuries were sorted into minor, moderate, and
severe using percentages calculated from the NFIRS 1998 firefighter casualty module. Because theNFIRS database contains a different sample of injuries (about 95 percent fireground) than the NFPAinjury reports (about 50 percent fireground), injury breakdowns by severity should be consideredapproximate and are rounded to the nearest hundred.
aFor sprains, strains and fractures, dislocations, values are combined for severe and fatal injuriesbecause distinctions between these natures are often not meaningful for more severe injuries.
38
that are identified as minor, moderate, and severe or worse in the NFIRS 1998database.11
NFIRS defines a severe injury as one in which “the situation is potentially lifethreatening if the condition remains uncontrolled. Immediate medical care isnecessary even though body processes may still be functioning and vital signsmay be normal.” A moderate injury is defined as one in which “there is littledanger of death or permanent disability. Quick medical care is advisable. Thiscategory includes injuries such as fractures or lacerations requiring sutures.” Aminor injury is defined as one in which “the patient is not in danger of death orpermanent disability. Immediate medical care is not necessary.”12
More than one-third of cardiac injuries are severe or worse, and half aremoderate. Asphyxiation and other respiratory injuries (about 6 percent of allinjuries), thermal stress (about 6 percent), and fractures and dislocations (about 2percent) are also among the more severe types of injury. For each type, 6 to 9percent of injuries are severe or worse. Together, these four natures account formore than one-half of severe injuries and fatalities but less than 10 percent ofminor injuries.
All other natures of injury make up 87 percent of injuries but are less severe thanfractures; dislocations; and cardiac, respiratory, and heat stress injuries. Non-fracture traumatic injuries, such as sprains and strains (47 percent of all on-dutyinjuries) and burns (6 percent of injuries), tend to be somewhat less severe (about60 percent are minor injuries, and about 1 to 1.5 percent are severe or worse) andaccount for a smaller fraction of severe injuries and deaths than of minor andmoderate injuries. Cuts and bruises (17 percent of injuries) and eye injuries (4percent of injuries) are common but are nearly always minor. From 1995 to 2001,only one firefighter death was classified as a cut-type injury.
A comparison of the NFPA and IAFF survey data for all on-duty injuries showsthat the types of injuries suffered by volunteer and career firefighters are verysimilar. There is some evidence from these sources that volunteer firefighterssuffer more eye injuries, cuts and bruises, and fractures or dislocations and fewer
_________________11 NFIRS uses a 6-point severity scale. Minor injuries are coded as 1, moderate injuries are
coded as 2, severe injuries as 3, life-threatening as 4, and codes 5 and 6 refer to fatalities. “Severe orworse injuries” refers to codes 3 and 4.
12 This is a life-safety definition of severity, but that is not the only way to consider severity. Forexample, the person affected may consider a burn to the arms or face that causes scarring but noother long-term effects substantially worse than a broken arm because of the social and emotionalimpact of the scarring, even though NFIRS might report both as “moderate.”

39
cardiac-related injuries. However, these differences are small and may beartifacts resulting from differences in data collection by the two organizations.
Type of Duty and Activity
Just over half of firefighter injuries (51 percent) and two-fifths of fatalities (44percent) occur on the fireground, with the remainder being distributed amongresponding to and returning from calls, nonfire emergencies such as EMS calls,training, and other on-duty events (see Figure 4.4).
Although the percentages of firefighter injuries and fatalities occurring duringmost types of duty were similar, the percentage of deaths that occur while enroute to or returning from an alarm is much higher than the correspondingpercentage of injuries. Only 6 percent of injuries occurred while responding to orreturning from calls, but this activity accounted for approximately one-fourth ofall fatalities (frequently as a result of motor vehicle accidents). Nonfireemergencies, primarily EMS calls, were responsible for 16 percent of injuries and11 percent of fatalities.
0% 10% 20% 30% 40% 50% 60%
Fireground
Responding to,Returning from Alarm
Nonfire Emergency
Training
Station, Other
Percent of Casualties
On Duty Injuries Line of Duty Fatalities
SOURCES: Fatalities from NFPA (1995–2000a) and U.S. Fire Administration (2002). Injuriesfrom NFPA (1995–2000b) and International Association of Fire Fighters (1993–1998).
NOTE: The values shown are the average of the two sources.
Figure 4.4—Type of Duty for Firefighter Injuries and Fatalities

40
The large number of injuries and fatalities that occur at the fireground is alsostriking given the comparatively small amount of time firefighters are involvedin fireground operations. In 2000, fire incidents represented only 8 percent of thecalls for service performed by fire departments. In contrast, medical responsesmade up 60 percent of service calls.13
Information about types of activity firefighters were involved in at the time ofinjury is available only for fireground injuries and fatalities. About half offireground injuries and fatalities occur while firefighters are participating in fireattack, more than in any other activity (Figure 4.5).
Burn, respiratory, and thermal stress injuries make up a higher percentage ofinjuries on the fireground than during other types of duty, whereas other typesof injuries are similar or somewhat less frequent during fireground operations.The high percentage of injuries occurring during fire attack probably results notonly from the danger involved in the activity but also from the fact that fireattack—in which many personnel are involved for significant periods of time—isa part of nearly every firefighting operation. About 4 percent of injuries and 13percent of fatalities occur during search and rescue operations, and about 3percent of injuries and 13 percent of fatalities happen while establishing watersupply. Search and rescue often involves entering a burning building without ahoseline because the lives of the occupants may be at risk, and the hazards, forthe most part, are similar to fire attack. The disproportionately high number offatalities indicates especially high level risks associated with search and rescueoperations. The fatalities occurring during water supply operations are primarilydue to heart attacks. Water supply is one of the first tasks performed on thescene, so this may be the first physically stressful task performed by a firefighterarriving at an incident.
Ventilation and forcible entry operations account for 10 percent of injuries and 5percent of fatalities; salvage and overhaul accounts for more than 15 percent ofinjuries but only 1.5 percent of fatalities. Although significant injury hazards areinvolved in ventilation, forcible entry, salvage, and overhaul, the potential for thehighest-level risk during these activities is lower than it is for more “forward”activities, such as fire attack or search and rescue. In addition, salvage andoverhaul operations tend to occur in a calmer, more controlled environment aftermuch or all of the fire has been extinguished.
_________________13 An additional 4 percent of calls were categorized as “mutual aid.” This may include
additional fire incident responses. See NFPA (2002).

41
0 10 20 30 40 50 60
Percent of casualties
Minor injuriesModerate injuriesSevere injuriesLine of duty fatalities
Fire attack
Search and rescue
Ventilation and forcible entry
Salvage and overhaul
Water supply
Other*
RAND TR100-4.5
SOURCE: Fatalities from U.S. Fire Administration (1996–2001). Injuries from Karter (2000), adjusted by analysis of the NFIRS 1998 firefighter casualty module.
NOTES: The NFIRS 1998 data were used to estimate the incidence of activities unreported in Karter (2000) and to reclassify certain natures based on additional information contained in the NFIRS database. Injuries were sorted into minor, moderate, and severe using percentages calculated from the NFIRS 1998 firefighter casualty module for fireground injuries. Severe injuries are based on a sample of fewer than 200 injuries, and therefore there is significant uncertainty involved in calculating both the breakdown of severe injuries by activity and the percentage of severe injuries occurring during each activity. Investigation of the NFIRS 1998 data indicates that many of the injuries in the “other” category occurred while picking up or carrying tools on the fireground.
Figure 4.5—Firefighter Activity for Fireground Injuries and Fatalities
Cause of Injury
There are four main causes of firefighter injuries and fatalities on the fireground,each accounting for about 22 to 25 percent of the total: being struck by or makingcontact with objects; falling or jumping; exposure to fire products, chemicals, orextreme weather; and physical stress or overexertion (see Figure 4.6).
Physical stress or overexertion and exposure are the most severe of the maincauses of injury. For each cause, 4 to 5 percent of fireground injuries are

42
0 5 10 15 20 25 30 35 40
Percent of injuries
Struck by, contact with object
Vehicle-related
Fell, jumped
Caught, trapped
Exposure to fire products, chemicals, extreme weather
Physical stress, overexertion
Other
Minor injuriesModerate injuriesSevere injuries
RAND TR100-4.6
SOURCE: NFPA (1995–2000b) and Karter (2000), adjusted using NFIRS 1998 data. NOTES: The NFIRS 1998 data were used to estimate the incidence of activities unreported in
Karter (2000) and to reclassify certain natures based on additional information contained in the NFIRS database. The values reported are the average of the two sources. Injuries were sorted into minor, moderate, and severe using percentages calculated from the NFIRS 1998 firefighter casualty module for fireground injuries. Severe injuries are based on a sample of fewer than 200 injuries and therefore there is significant uncertainty involved in calculating both the breakdown of severe injuries by activity and the percentage of severe injuries occurring during each activity
Figure 4.6—Firefighter Fireground Injuries by Cause
severe or worse, and more than 40 percent are moderate or worse. As can be seenin Figures 4.2 and 4.6, about two-thirds of severe fireground injuries and one-halfof fatalities14 are caused by either exposure or physical stress/overexertion.
Less than 2 percent of fireground injuries caused by falls or by being struck ormaking contact with an object are severe or worse, and less than 40 percent aremoderate or worse. Together, these causes account for nearly as many minor andmoderate injuries as physical stress/overexertion and exposure, but only one-sixth of severe injuries. Vehicle accidents, a subset of being struck by or making
_________________14 In nonfatal instances of exposure to fire products, the firefighter escapes to a safe area or is
rescued, and the cause of injury is typically classified as exposure. If the firefighter is trapped andunable to escape, and dies from asphyxiation or burns, the cause of death is typically classified ascaught/trapped, even though the nature and mechanism of injury are the same in both cases.Combining caught/trapped with exposure, about 70 percent of line-of-duty fatalities are caused byeither exposure or physical stress and overexertion.

43
contact with an object, account for less than 1 percent of fireground injuries15 but18 percent of fatalities (22 percent if aircraft accidents are included). Nonfatalinjuries occurring in vehicle accidents tend to be more severe than with mostother causes.
Occupational Injury and Illness Retirements
The incident- and survey-based data above provide a good description of acuteinjury events. Although some acute injury events, such as cardiac injuries, arefrequently indicative of long-term conditions, most are sudden events in whichthe measurable consequences are immediately apparent.
One source of information on long-term injury and illness is data describingfirefighter retirements resulting from occupational injury or illness. Often,retirements are due to conditions that build up slowly and at some point becometoo debilitating for the responder to continue working. They can be described bynature and body part but not by event or activity. Breakdowns by event oractivity are not relevant for conditions that develop over long periods; in manycases, the injury or illness cannot be definitively linked to a particular event orincident.16
From 1993 to 1998, occupational injury and illness requirements made up about27 percent of all firefighter retirements (Figure 4.7). Occupational injuryretirements (chiefly back, limb, and torso pain) are about twice as common asillness retirements (primarily heart and lung disease and cancer). Of the 27percent of all retirements that are injury related (about 1,500 each year), aboutone-third are due to back injury. Other injury types—including limb, torso, hand,foot, and face injuries—together account for one-third of occupational injuryretirements. The final third of injury retirements are due to occupational illness,including heart disease, lung disease, cancer, hearing loss, mental stress, andother causes.
________________15 The data on cause of injury include only fireground injuries. It is likely that injuries occurring
in other types of duty (especially responding to and returning from alarms) would result in vehicleaccidents accounting for a greater share of all on-duty injuries than fireground injuries.
16 The available data do not contain information on cause, event, or type of activity for anyoccupational injury retirements.

44
SOURCE: International Association of Fire Fighters (1993–1998).RAND TR100-4.7
Non-InjuryRetirements
73%
Back Injury9%
Limb/Torso Injury6%
Other Injury3%
Heart Disease4%
Cancer1%
Other Illness2%
InjuryRetirements
27%
Lung Disease2%
Figure 4.7—Breakdown of Firefighter Occupational Injury Retirements
Injury Incidence Matrix
The injury incidence matrix shown in Figure 4.8 summarizes the data discussedin the previous sections to show graphically during which combinations ofactivities and hazards firefighters are most often injured, as well as the injuriesthat are most likely to result from each combination. Minor injuries are notincluded in the matrix, both because more-severe injuries are of greater concernand because adopting this convention facilitates comparison with the dataavailable for law enforcement responders.17 Black cells correspond tocombinations of activities and hazards with the most injuries, dark gray to highincidence, light gray to moderate incidence, and white to low incidence. Withineach cell, the most common types of injury are listed, with those most frequentlyencountered listed first.
The incidence matrix was created by classifying all injuries reported in the NFIRS1998 firefighter casualty module that were of at least moderate severity andoccurred on the fireground by cause of injury and activity (only the highest-
_________________17 Law enforcement data are drawn from the BLS Survey of Occupational Injuries and Illnesses,
which only includes injuries that result in lost workdays.

45
RAND TR100-4.8
Burns Trauma
Trauma Cuts/bruises
Cuts/bruises Trauma Burns
Burns Respiratory Heat stress
Trauma Heat stress Cardiac Respiratory
Respiratory
Trauma Cuts/bruises Trauma
Respiratory Heat stress
Trauma Heat stress
Trauma Cuts/bruises Trauma
Trauma Heat stress Cardiac
Trauma Cuts/bruises Cuts/bruises
Trauma Heat stress Cardiac
TraumaTraumaCuts/bruises Burns
Trauma
Fire attack, search and
rescue
Ventilation and forcible
entry
Salvage and overhaul
Incident scene
support activities
Riding on or driving apparatus
Fire
gro
un
d a
ctiv
ity
Fell, jumped
Caught, trapped
Struck by or contact with
object
Exposure to fire
products
Exposure to
chemicals
Physical stress, over-
exertion
Cause of Injury
Firefighter Injuries
Highest incidence
High incidence
Moderate incidence
Low incidence
SOURCE: Based on data from the NFIRS 1998 Firefighter Casualty Module. NOTES: Black cells indicate at least 150 reported injuries (10 percent of the total); dark-gray
cells 36 to 66 injuries (2 to 4 percent); and light-gray cells 15 to 28 injuries (1 to 2 percent). Injuries with cause or activity unreported or reported as “other” are not included. Because of sample size, differences between some dark-gray and light-gray and some light-gray and white cells may not be statistically significant. Incident scene support activities include water supply operations and picking up and moving tools.
Figure 4.8—Injury Incidence Matrix for Moderate and Severe Firefighter FiregroundInjuries by Cause and Activity
frequency hazards and activities are shown). Vehicle-related injuries are morefrequent than indicated in the matrix, as injuries that occur while responding toor returning from an incident are not included.
The highest number of injuries from all causes occurs during fire attack andsearch and rescue. Fire attack is not only one of the most dangerous firegroundactivities but also one of the most common. As a result, the high numbers ofinjuries are related both to the level of hazard and to the time firefighters areexposed while involved in the activity. Of the fire attack-cause combinations, thehighest-risk combinations are exposure to fire products and from physical stressor overexertion, each accounting for almost 20 percent of moderate and severefireground injuries.

46
In activities other than fire attack, firefighters are injured most frequently fromfalls during salvage and overhaul, incident scene support activities, or fromapparatus; and physical stress and overexertion or being struck by or makingcontact with an object during ventilation, forcible entry, salvage and overhaul,and incident scene support activities.
Police Injuries and Fatalities
Police injury data allow breakdowns by cause of injury, as well as by nature ofnonfatal injuries. However, because of the inclusion criteria of the BLS SOIIdatabase, these breakdowns are available only for lost-work-time injuries. Incomparison with the firefighter data, this means that many less-severe injuries(including most that would be classified “minor” and some that would beclassified “moderate” in NFIRS) are not included.
Almost 90 percent of police line-of-duty fatalities are either assault- or vehicle-related (Figure 4.9). Most of the remainder are heart attacks brought on byphysical stress. Assaults (27 percent) and vehicle accidents (16 percent) togethermake up nearly half of lost-time injuries. The other most common causes of lost-time injury are falls (19 percent), and physical stress or overexertion (25 percent).While almost all homicides are shootings (more than 90 percent), more than 80percent of assailants in nonfatal attacks between 1991 and 2000 used “personalweapons” such as hands and feet.18
The severity measure used by the Bureau of Labor Statistics is median days awayfrom work for all lost-work-time injuries of each type. We combined these dataacross three years and occasionally across multiple categories of cause of injury.The resulting severity information for these categories of injury is shown for each
_________________18 Information on assaults from Federal Bureau of Investigation (2002).

47
0% 5% 10% 15% 20% 25% 30% 35% 40% 45% 50%
Assault, Violence
Vehicle Accident
Aircraft Accident
Struck by Vehicle
Fell, Jumped
Physical Stress, Overexertion
Exposure to Fire &Hazardous Substances
Struck by, Contact withObject
Other
Percent of Casualties
Occupational Injuries Line of Duty Fatalities
SOURCE: Fatalities from National Law Enforcement Officers Memorial Fund (2002a).Injuries from Survey of Occupational Injuries and Illnesses, Bureau of Labor Statistics (2003b).
NOTES: Data include police and detectives (occupation code 418), State of New York, at thelocal government level, for the years 1998–2000. “Struck by vehicle” refers to officers struckwhile not inside a vehicle.
Figure 4.9—Cause of Injury for Police Lost-Work-Time Injuries and Fatalities
cause in Figure 4.10.19 Although this measure of severity is significantly differentthan the judgment-based scale used in NFIRS, it does provide a way to compareseverity across injury types.
Of the most common causes of injury, falls and physical stress had a severity offive days away from work, and assaults and vehicle accidents, four days.Exposure to fire and hazardous substances (corresponding to BLS categories“temperature extremes” and “caustic, noxious, or allergenic substances”) wasresponsible for about 1 percent of lost-time injuries, with a severity of four daysaway from work.
________________19 BLS is able to calculate the median days away from work for each category for each data
year. The severity figure above, for three years of data, was calculated in two ways: (1) the medianvalue of the reported severity for every category regardless of the number of injuries, rounded to thenearest whole number, and (2) the weighted average of the median value for each category, roundedto the nearest whole number. In all cases, these methods produced the same value.

48
0 1 2 3 4 5 6
Assault, Violence
Vehicle Accident
Struck by Vehicle
Fell, Jumped
Physical Stress, Overexertion
Exposure to Fire &Hazardous Substances
Struck by, Contact withObject
Total
Days Away From Work
SOURCE: Survey of Occupational Injuries and Illnesses, Bureau of Labor Statistics (2003b).NOTES: Data include police and detectives (occupation code 418), State of New York, at the
local government level, for the years 1998–2000. “Struck by vehicle” refers to officers struckwhile not inside a vehicle.
Figure 4.10—Severity of Police Lost-Work-Time Injuries, by Cause of Injury
Injury Incidence Matrix
Although data on activity at the time of injury are not available for police, asingle dimension injury incidence matrix (Figure 4.11) can be constructed forpolice using data from the BLS Survey of Occupational Injuries and Illnesses,similar to Figure 4.8. The data used are for police and detectives employed bylocal governments in New York State for 1998 through 2000. Only the highest-frequency causes of injury are shown.

49
RAND TR100-4.11
Trauma Cuts/bruises
Trauma Cuts/bruises
Cuts/bruisesTrauma
Burns TraumaIllness
Trauma Cuts/bruises
TraumaAll activities
Fell, jumped
Assault, violence
Vehicle accident
Struck by, contact
with object
Exposure to fire and
hazardous substances
Physical stress, over-
exertion
Cause of Injury
Police Injuries
Highest incidence
High incidence
Moderate incidence
Low incidence
SOURCE: Based on data from the Survey of Occupational Injuries and Illnesses, Bureau of Labor Statistics (2003b).
NOTES: Data are for police and detectives, State of New York, at the local government level, for the years 1998–2000. Black cells represent at least 5,000 injuries; dark-gray cells at least 4,000 injuries; and the light-gray cell about 2,400 injuries. SOII estimates a total of 25,000 injuries for 1998–2000; the estimate in the figure is based on a smaller number of recorded cases.
Figure 4.11—Injury Incidence Matrix for Police Lost-Work-Time Injuries by Cause
As with the firefighter injury incidence matrix, black cells represent hazardsresulting in the most injuries, dark gray cells represent high incidence, and thelight gray cell, moderate incidence. Police are most often injured in falls, assaults,vehicle-related accidents, and through stress or overexertion. From all causes, themost common types of injury are traumatic injuries, such as sprains and strains,and cuts and bruises. Police are also at risk of burns and symptoms of illness as aresult of exposure to fire and hazardous substances (in the figure, “illness”indicates injury cases where symptoms are present from a disease or illness butwhere a definite diagnosis is lacking or is unclassifiable). These exposure-relatedinjuries represent less than 1 percent of all law enforcement injuries.
EMS Injuries and Fatalities
Data on EMS responder injuries and fatalities are limited. A recently publishedanalysis of EMS line-of-duty fatalities using data from the Census of FatalOccupational Injuries and NEMSMS data estimated an average of 19 EMSresponder deaths per year from 1992 to 1997.20 The information available oncauses of fatalities indicates that emergency medical responders are most oftenkilled in aircraft and motor vehicle accidents (Figure 4.12). From 1998 through2001, over one–half (56 percent) of the 46 line-of-duty fatalities reported to the
________________20 In this analysis, motor vehicle accidents were the leading cause of death, followed by aircraft
accidents (Maguire et al., 2002).

50
SOURCE: National EMS Memorial Service (2002).RAND TR100-4.12
Motor Vehicle Accident26%
Heart Attack/Stress7%
Aircraft Accident57%
Other11%
Figure 4.12—Cause of Injury for EMS Line-of-Duty Fatalities, 1998–2001
National EMS Memorial Service were due to rescue helicopter crashes, andanother 25 percent were due to motor vehicle accidents.21 Other causes of deathinclude drowning (2 percent), being struck by vehicles while on foot (4 percent),and heart attacks or other physical stress (7 percent).
Other than the fatality data in Figure 4.12 and the NEISS data included in Figure4.3, the only data sources for injuries to EMS workers focus on infectious diseaseexposures. Among emergency responders, emergency medical personnel havethe highest risk of exposure to infectious disease: From 1996 to 1998, 85 percentof exposures reported by firefighters occurred when performing EMS duties,compared with only about 10 percent on the fireground.22
The most common exposures in 1993–1998 (an exposure does not necessarilymean that the responder was infected) were to tuberculosis (about 32 percent ofexposures), HIV/AIDS (about 18 percent), meningitis (about 11 percent), andhepatitis A, B, and C (about 12 percent together).23 At least one police officer hasdied of AIDS complications after being assaulted by a suspect with an HIV-infected needle.24
_________________21 This number does not include six deaths also recorded by the U. S. Fire Administration as
firefighter fatalities.22 International Association of Fire Fighters (1996–1998).23 International Association of Fire Fighters (1993–1998).24 National Law Enforcement Officers Memorial Fund (2002a).

51
Emergency responders are exposed to diseases through a variety of mechanisms.Blood-borne pathogens are of the greatest concern. According to a surveillance ofhospital-based emergency medical technicians, 65 of 354 (18 percent) EMTs forwhom records are available reported exposure to bodily fluids between June1995 and February 11, 2002, with four being exposed more than once.25 Abouthalf of the exposures were due to percutaneous injuries such as needle sticks,while the other half were due mostly to skin and mucous membrane exposures.Six of the EMTs were tested for tuberculosis after respiratory exposure (none wasinfected), while six other EMTs tested positive for tuberculosis during routinetesting.
Findings
Significant data are available to describe line-of-duty injuries and fatalitiesexperienced by firefighters and police officers, and some data are available todescribe hazards faced by EMS personnel as well. The available data indicatesome similarity across the services in the risks faced by emergency responders,but also significant differences.
The main similarities are (1) many deaths occur as a result of vehicle accidents,and (2) the most common natures of injury experienced by each type ofresponder are cuts and bruises, sprains, strains, and other trauma. For all threeservices, a significant portion of injuries and fatalities occur away from theincident scene. Only half of firefighter injuries occur on the scene of fireemergencies, and less than half of fatalities. For police and EMS, breakdowns bytype of duty are not available. However, the high prevalence of deaths andinjuries resulting from vehicle accidents in these professions strongly suggeststhat responding to and returning from incidents are also very hazardous in theseservices.
The differences in occupational hazards among services are related to thespecialized tasks that each performs. In addition to cuts and other trauma such assprains and strains, the types of injury most experienced by firefighters areburns, asphyxiation and other respiratory injuries, and thermal stress. Physicalstress and overexertion, falls, being struck by or making contact with objects, andexposure to fire products are the primary causes of injury at the fire scene.Physical stress, becoming lost or trapped in a fire situation, and vehicle accidentsare the primary causes of death. Physical stress is responsible for nearly half ofall on-duty deaths.
________________25 National Center for Infectious Diseases (2002).

52
Most injuries to police are traumatic injuries resulting from vehicle accidents,falls, assaults, or physical stress. Nine out of ten line-of-duty deaths are due tovehicle accidents or assaults. Most of the remainder are due to being struck by avehicle and stress or overexertion.
The information about EMS injuries and hazards is scarce and far less definitive.EMS personnel are most at risk of sprains and strains, and they have a muchhigher proportion of back injuries than other responders do. EMS personnel alsohave a high risk of infectious disease exposure, mostly through percutaneousinjuries such as needle sticks. Nearly all on-duty deaths on which data areavailable are due to aircraft and vehicle accidents.
53
5. Conclusions
The emergency response community represents a significant population of workersexposed to a particularly intense and variable hazard environment in the course oftheir work activities. The approximately 1,100,000 firefighters, 600,000 patrol andinvestigative law enforcement officers, and 500,000 emergency medical serviceresponders answer calls for assistance and service that result in significant numbersof occupational injuries and fatalities. The review presented in this document hasshown that extensive surveillance data are available to describe the injuries andfatalities suffered by firefighters. A lesser, but still useful, amount of information isavailable for police casualties. Emergency medical services data are scarce, and fewconclusions can be drawn from the existing data. This document represents acollection and synthesis of currently available data.
Although current data sources have significant limitations in addressing portions ofthe emergency response community (particularly EMS responders), ongoingchanges to the occupation coding of federal government data sources will make iteasier to examine injuries to law enforcement and EMS responders. One of theprimary surveillance data sources, the Survey of Occupational Injuries and Illnesses,will switch to a new occupation coding for the 2003 data year, and data are expectedto become available in 2005. Data sources such as the Survey of OccupationalInjuries and Illnesses and the National Fire Incident Reporting System enabledetailed examination of responder protection needs and strategies for providingthat protection.
The results presented in this report provide an integrated view of what is knownabout the numbers and characteristics of responder injuries and fatalities. Many ofthe results are not surprising, such as the seriousness of the assault and vehicle-related hazards to police and the significant heat and physical stress risks faced byfirefighters. However, some of the findings—most notably, the fact that falls andphysical stress and overexertion result in nearly as many police injuries as assaultsand vehicle accidents do and are relatively more severe—are unexpected.
Overall, physical stress and overexertion, becoming lost or trapped, and vehicleaccidents are the primary causes of death for firefighters. Physical stress andoverexertion, falls, being struck by or making contact with objects, and exposure tofire products are the primary causes of injury at the fire scene. For law enforcementofficers, deaths are due almost exclusively to vehicle accidents and assaults. Police

54
are most at risk of traumatic injuries resulting from vehicle accidents, falls, assaults,and physical stress. The limited available data indicate that EMS personnel are mostat risk of sprains and strains, especially back injuries, and also have a significantlyincreased risk of infectious disease exposure, mostly through percutaneous injuriessuch as needle sticks. The majority of recent line-of-duty EMS deaths resulted frommotor vehicle and rescue helicopter accidents.
The surveillance data clearly show that certain hazards are common to allresponders: the risk of vehicle-related deaths, traumatic injuries such as sprains andstrains, and cuts and bruises. At the same time, the data highlight the particularhazards associated with each service: burns, thermal stress, asphyxiation and otherrespiratory injuries for firefighters; falls, assaults, and physical stress for police; andback injuries and infectious disease exposure for emergency medical responders. Byidentifying combinations of activities and hazards that currently result in the largestnumber and most serious responder injuries, these data provide an important inputfor setting protective technology development and program priorities. The data canprovide a route for identifying combinations of nature and cause of injury, bodypart involved, and responder activity where injury reduction efforts might be mosteffectively applied. Such detailed analyses are most accessible for firefightersbecause of the comparative richness of the relevant data sources.
However, injury counts alone are not sufficient to fully define the protection needsof emergency responders. By definition, they measure the negative consequences ofexposure to particular risks over particular time periods. As a result, surveillancedata give a preferential focus to “routine” activities because those tasks occupy thevast majority of responders’ time. Therefore, the levels of injury should not beinterpreted as direct measures of the level of risk faced by responders for all
activities. Activities performed by responders for short periods of time, or eventsthat occur infrequently, may involve levels of risk much higher than more-commontasks. Events such as major disasters, structural collapse, civil disturbance, bombdisposal, hostage situations, and terrorism response involve intense hazards notnormally encountered in routine activities. As a result, they may be of much greaterconcern than the everyday events that produce the majority of injuries and fatalities.The opposite is also sometimes true: Certain catastrophic events , such as thecollapse of the World Trade Center towers, are frequently excluded (with cause)from data sources as outliers. And the consequences of other potential hazards thathave not yet been realized, such as large-scale terrorist attacks involving biologicalor chemical weapons, cannot be effectively captured. To fully assess responders’personal protection needs, all high-risk nonroutine activities must be consideredseparately from routine activities, whether they dominate the injury and fatalitysurveillance data or are lost within it.
55
Similarly, while direct counts of injuries and the severity measures discussed in thisreport are excellent indicators of the scope of a health and safety problem, theycannot completely capture all the issues associated with the problem. For instance,although sprains and strains are the most common injuries experienced byresponders in all three services, responders typically do not view them as a primaryconcern. Thus, merely using injury frequencies when setting priorities for protectivetechnology will not adequately address the concerns of the community.
To address both the limitations of a purely data-based approach to this area, RANDhas also gathered information directly from the emergency response communitythrough an extensive structured interview process. The results of that effort,included in a separate report (LaTourrette et al., 2003), are a critical complement tothe surveillance data presented here.
In addition to demonstrating the utility of the currently available data and datasources, this analysis also suggests a range of potential future efforts that couldcontribute to a better understanding of emergency responder injuries and fatalitiesand the effects of personal protective technology. The diversity of data sources onemergency responders suggests that efforts to interconnect information fromdifferent databases could be valuable. An area of particular potential is fatalitydata—where the comparatively small number of cases and the availability of richnarrative information could enable many types of analysis. High-resolution injurysources, such as the NFIRS database and to a lesser extent the BLS Survey ofOccupational Injuries and Illnesses, could be sampled to explore specificrelationships between the nature and circumstance of injuries. Furthermore, effortsto aggregate injury data for police and EMS workers to increase sample size, obtaininformation on responder activity at the time of their injury, and further supportstudies of long-term health outcomes could provide additional insight. Suchinterconnection and analysis efforts can help formulate and answer detailedquestions about protective technology design and performance in specific responsesituations.


57
References
Beaumont, James J., George S. T. Chu, Jeffrey R. Jones, Marc B. Schenker, James A.Singleton, Lillian G. Piantanida, and Marc Reiterman, “An Epidemiologic Studyof Cancer and Other Causes of Mortality in San Francisco Firefighters,” AmericanJournal of Industrial Medicine, Vol. 19, 1991, pp. 357–372.
Bureau of Labor Statistics, U.S. Department of Labor, Survey of OccupationalInjuries and Illnesses, http://www.bls.gov/iif/oshstate.htm, accessed October31, 2002.
Bureau of Labor Statistics, U.S. Department of Labor, Occupational EmploymentStatistics Survey by Occupation, 2001, http://www.bls.gov/oes/2001/oes_29He.htm, accessed March 10, 2003a.
Bureau of Labor Statistics, U.S. Department of Labor, Survey of OccupationalInjuries and Illnesses, database report. Obtained via personal communicationfrom Boston-NY Regional Office, March 2003b.
CDC, see Centers for Disease Control and Prevention
Centers for Disease Control and Prevention, U.S. Department of Health and HumanServices, “Public Health Consequences Among First Responders to EmergencyEvents Associated With Illicit Methamphetamine Laboratories—Selected States,1996–1999,” Morbidity and Mortality Weekly Report, Vol. 49, No. 45, November 17,2000, pp. 1021–1024.
Clarke, Cindy, and Mark J. Zak, “Fatalities to Law Enforcement Officers andFirefighters, 1992–1997,” Compensation and Working Conditions, Summer 1999, pp.3–7.
Demers, Paul A., Harvey Checkoway, Thomas L. Vaughn, Noel S. Weiss, Nicholas J.Heyer, and Linda Rosenstock, “Cancer Incidence Among Firefighters in Seattleand Tacoma, Washington (United States),” Cancer Causes and Control, Vol. 5, 1994,pp. 129–135.
Demers, Paul A., Nicholas J. Heyer, and Linda Rosenstock, “Mortality AmongFirefighters from Three Northwestern United States Cities,” British Journal ofIndustrial Medicine, Vol. 49, 1992, pp. 664–670.
EMS Magazine, “State & Province Survey, 2001,” http://www.emsmagazine.com/SURVEY/index.html, accessed October 15, 2002.
Federal Bureau of Investigation, Law Enforcement Officers Killed and Assaulted 2000,available at http://www.fbi.gov/ucr/killed/00leoka.pdf, accessed October 31,2002.
Feuer, Elizabeth, and Kenneth Rosenman, “Mortality in Police and Firefighters inNew Jersey,” American Journal of Industrial Medicine, Vol. 9, 1986, pp. 517–527.

58
Guidotti, Tee L., “Occupational Mortality Among Firefighters: Assessing theAssociation,” Journal of Occupational and Environmental Medicine, Vol. 37, No. 12,December 1995, pp. 1348–1355.
Haddon, Jr., W., “Advances in the Epidemiology of Injuries as a Basis for PublicPolicy,” Public Health Reports, Vol. 95, No. 5, 1980, pp. 411–421.
Hall, Jr., John R., and Beatrice Harwood, “The National Estimates Approach to U.S.Fire Statistics,” Fire Technology, May 1985, pp. 99–113.
Hanson, Eva Stottrup, “A Cohort Study on the Mortality of Firefighters,” BritishJournal of Industrial Medicine, Vol. 47, 1990, pp. 805–809.
International Association of Fire Fighters, Death and Injury Survey, 1993–1998.
Jankovic, J., W. Jones, J. Burkhart, and G. Noonan, “Environmental Study ofFirefighters,” Annals of Occupational Hygiene, Vol. 35, No. 6, 1991, pp. 581–602.
Kales, S. N., G. N. Polyhrornopoulos, J. M. Aldrich, P. J. Mendoza, J. H. Suh, and D.C. Christiani, “Prospective Study of Hepatic, Renal, and HaematologicalSurveillance in Hazardous Materials Firefighters,” Occupational and EnvironmentalMedicine, Vol. 58, No. 2, February 2001, pp. 87–94.
Karter, Jr., Michael J., Patterns of Firefighter Fireground Injuries, Quincy, MA: NationalFire Protection Association, February 2000.
Karter, Jr., Michael J., U.S. Fire Department Profile Through 2000, Quincy, MA:National Fire Protection Association, December 2001.
LaTourrette, T., D. J. Peterson, J. T. Bartis, B. A. Jackson, and A. Houser. ProtectingEmergency Responders, Volume 2: Community Views of Safety and Health Risks andPersonal Protection Needs, Santa Monica, Calif.: RAND Corporation, MR-1646-NIOSH, 2003.
Ma, Fangchao, David J. Lee, Lora E. Fleming, and Mustafa Dosemeci, “Race-SpecificCancer Mortality in U.S. Firefighters,” Journal of Occupational and EnvironmentalMedicine, Vol. 40, No. 12, December 1998, pp. 1134–1137.
Maguire, Brian J., Katherine L. Hunting, Gordon S. Smith, and Nadine R. Levick,“Occupational Fatalities in Emergency Medical Services: A Hidden Crisis,”Annals of Emergency Medicine, Vol. 40, No. 6, December 2002, pp. 625–632.
Mayhew, Claire, “Occupational Health and Safety Risks Faced by Police Officers,”Trends and Issues in Crime and Criminal Justice, No. 196, February 2001.
Mayhew, Claire, “Protecting the Occupational Health and Safety of Police Officers,”Trends and Issues in Crime and Criminal Justice, No. 197, February 2001.
Murphy, Patrice L., Gary S. Sorock, Theodore K. Courtney, Barbara S. Webster, andTom B. Leamon, “Injury and Illness in the American Workplace,” AmericanJournal of Industrial Medicine, Vol. 30, 1996, pp. 130–141.

59
National Center for Infectious Diseases, U.S. Department of Health and HumanServices, National Surveillance System for Health Care Workers, database report.Obtained via personal communication from Adelisa Panlilio, March 12, 2002.
National EMS Memorial Service, Notices of Line of Duty Death, http://nemsms.org/notices.htm, accessed September 4, 2002.
National Fire Protection Association, Fire Department Calls, http://www.nfpa.org/pdf/os.fdcalls.pdf, accessed November 27, 2002.
National Fire Protection Association, Firefighter Fatality Reports, 1995–2000a.
National Fire Protection Association, Firefighter Injury Reports, 1995–2000b.
National Institute for Occupational Safety and Health, U.S. Department of Healthand Human Services, Larry L. Jackson, unpublished data from the NationalElectronic Injury Surveillance System. Obtained via personal communicationfrom Larry L. Jackson, 2001.
National Law Enforcement Officers Memorial Fund, database report. Obtained viapersonal communication from Berneta Spence, April 18, 2002a.
National Law Enforcement Officers Memorial Fund, Year by Year Deaths,http://nleomf.org/FactsFigures/yeardeaths.html, accessed August 20, 2002b.
National Public Safety Information Bureau, National Directory of Fire Chiefs and EMSAdministrators 2002, Stevens Point, WI: Span Publishing, 2002a.
National Public Safety Information Bureau, National Directory of Law EnforcementAdministrators 2002, Stevens Point, WI: Span Publishing, 2002b.
National Registry of Emergency Medical Technicians, Practice Analysis, 1999.
NFPA, see National Fire Protection Association
NIOSH, see National Institute for Occupational Safety and Health
NPSIB, see National Public Safety Information Bureau
Pepe, Paul E., James Jerger, Robert H. Miller, and Susan Jerger, “AcceleratedHearing Loss in Urban Emergency Medical Services Firefighters,” Annals ofEmergency Medicine, Vol. 14, May 1985, pp. 438–442.
Prezant, David J., Kerry J. Kelly, Kevin S. Malley, Manoj L. Karwa, Mary T.McLaughlin, Robin Hirschorn, and Audrey Brown, “Impact of a ModernFirefighting Protective Uniform on the Incidence and Severity of Burn Injuries inNew York City Firefighters,” Journal of Occupational and Environmental Medicine,Vol. 41, No. 6, June 1999, pp. 469–478.
Reaves, Brian A., State and Local Police Departments, 1990, NCJ-133284, WashingtonD.C.: U.S. Department of Justice, Office of Justice Programs, Bureau of JusticeStatistics, 1992.

60
Reaves, Brian A., Federal Law Enforcement Officers, 1993, NCJ-151166, WashingtonD.C.: U.S. Department of Justice, Office of Justice Programs, Bureau of JusticeStatistics, December 1994.
Reaves, Brian A., and Timothy C. Hart, Federal Law Enforcement Officers 2000,NCJ-187231, Washington, D.C.: U.S. Department of Justice, Office of JusticePrograms, Bureau of Justice Statistics, July 2001.
Reaves, Brian A., and Matthew J. Hickman, Census of State and Local Law EnforcementAgencies, 2000, NCJ-194066, Washington D.C.: U.S. Department of Justice, Officeof Justice Programs, Bureau of Justice Statistics, October 2002.
Reed, Elizabeth, Mohamud R. Daya, Jonathan Jui, Kathy Grellman, Leith Gerber,and Mark O. Loveless, “Occupational Infectious Disease Exposures in EMSPersonnel,” Journal of Emergency Medicine, Vol. 11, 1993, pp. 9–16.
Rosenstock, Linda, P. Demers, N. J. Heyer, S. Barnhart, “Respiratory MortalityAmong Firefighters,” British Journal of Industrial Medicine, Vol. 47, 1990, pp.462–465.
Swanton, Bruce, “Research Brief: Police Work and Its Health Impacts,” Trends andIssues in Crime and Criminal Justice, No. 7, October 1987.
U.S. Fire Administration, National Fire Incident Reporting System 1998, FirefighterCasualty Module.
U.S. Fire Administration, Firefighter Fatalities in the United States in 1995, Washington,D.C.: Federal Emergency Management Association, August 1996.
U.S. Fire Administration, Firefighter Fatalities in the United States in 1996, Washington,D.C.: Federal Emergency Management Association, August 1997.
U.S. Fire Administration, Firefighter Fatalities in the United States in 1997, Washington,D.C.: Federal Emergency Management Association, August 1998.
U.S. Fire Administration, Firefighter Fatalities in the United States in 1998, Washington,D.C.: Federal Emergency Management Association, August 1999.
U.S. Fire Administration, Firefighter Fatalities in the United States in 1999, Washington,D.C.: Federal Emergency Management Association, July 2000.
U.S. Fire Administration, Firefighter Fatalities in the United States in 2000, Washington,D.C.: Federal Emergency Management Association, August 2001.
U.S. Fire Administration, USFA Releases Preliminary Firefighter Fatality Statistics for2001, http://www.usfa.fema.gov/dhtml/media/02-004.cfm, accessed December13, 2002.
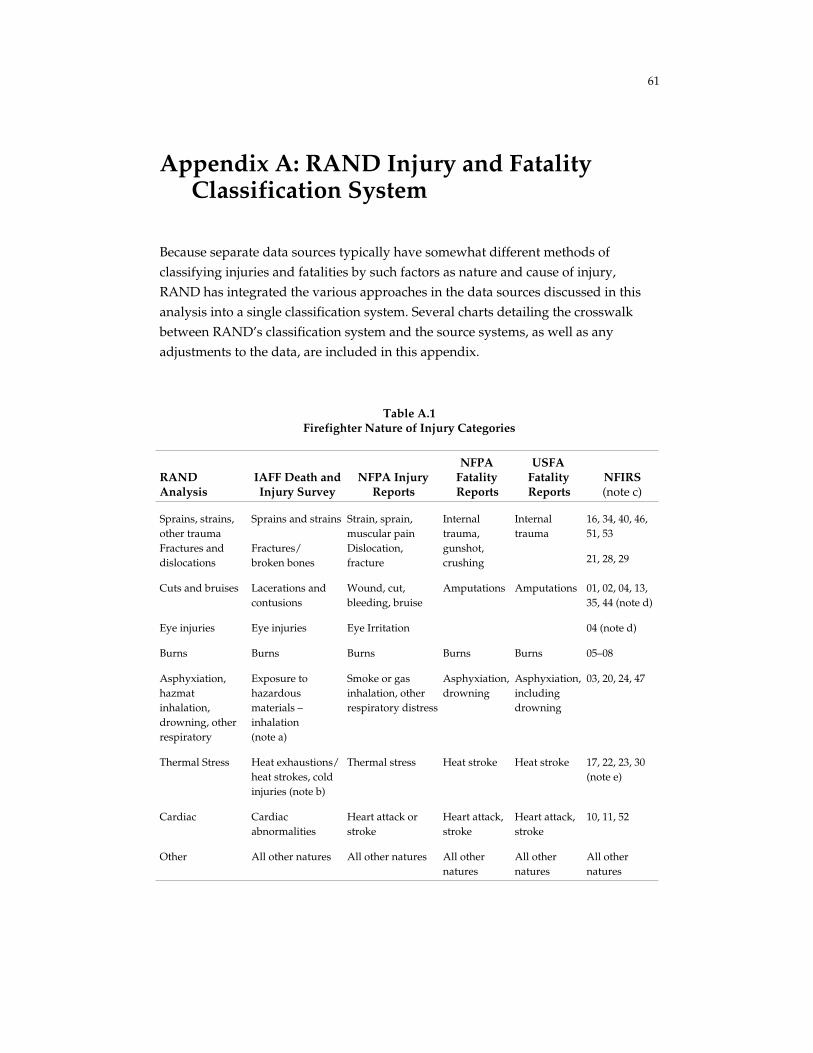
61
Appendix A: RAND Injury and FatalityClassification System
Because separate data sources typically have somewhat different methods ofclassifying injuries and fatalities by such factors as nature and cause of injury,RAND has integrated the various approaches in the data sources discussed in thisanalysis into a single classification system. Several charts detailing the crosswalkbetween RAND’s classification system and the source systems, as well as anyadjustments to the data, are included in this appendix.
Table A.1Firefighter Nature of Injury Categories
RANDAnalysis
IAFF Death andInjury Survey
NFPA InjuryReports
NFPAFatalityReports
USFAFatalityReports
NFIRS(note c)
Internaltrauma
16, 34, 40, 46,51, 53
Sprains, strains,other traumaFractures anddislocations
Sprains and strains
Fractures/broken bones
Strain, sprain,muscular painDislocation,fracture
Internaltrauma,gunshot,crushing 21, 28, 29
Cuts and bruises Lacerations andcontusions
Wound, cut,bleeding, bruise
Amputations Amputations 01, 02, 04, 13,35, 44 (note d)
Eye injuries Eye injuries Eye Irritation 04 (note d)
Burns Burns Burns Burns Burns 05–08
Asphyxiation,hazmatinhalation,drowning, otherrespiratory
Exposure tohazardousmaterials –inhalation(note a)
Smoke or gasinhalation, otherrespiratory distress
Asphyxiation,drowning
Asphyxiation,includingdrowning
03, 20, 24, 47
Thermal Stress Heat exhaustions/heat strokes, coldinjuries (note b)
Thermal stress Heat stroke Heat stroke 17, 22, 23, 30(note e)
Cardiac Cardiacabnormalities
Heart attack orstroke
Heart attack,stroke
Heart attack,stroke
10, 11, 52
Other All other natures All other natures All othernatures
All othernatures
All othernatures

62
Table A.2Firefighter Cause of Injury Categories
RAND AnalysisNFPA Firefighter
Injury ReportsNFPA FirefighterFatality Reports NFIRS (note c)
Struck by, contact withobject
Stepped on, contactwith, object, struck byobject
Stepped on, contact with,object, struck by object
300–400, 403, 404,406–409, 415–419, 499,700–899
Fell, slipped, jumped Fell, slipped, jumped Fell 100–199, 600–699
Caught, trapped Caught, trapped Caught or trapped 200–299
Physical stress,overexertion
Overexertion, strain Stress 500–599
Exposure to chemicalsor radiation
Exposure to chemicalsor radiation
Exposure 412–414
Exposure to fireproducts
Exposure to fireproducts
401, 402, 405, 410, 411
Exposure to extremeweather
Extreme weather 420
Other All other causes All other causes All other causes
Table A.3Firefighter Type of Duty Categories
RAND AnalysisIAFF Death andInjury Survey
NFPAFirefighter
Injury Reports
NFPAFirefighter
Fatality Reports
USFAFirefighter
Fatality Reports
Fireground Structural, non-structural firesuppression
Fireground Fireground Firegroundoperations
Responding,returning fromalarm
Responding,returning fromalarm
Responding orreturning froman incident
Responding to,or returningfrom, alarms
Responding/returning
Nonfire emergency EMS, technicalrescue,HAZMAT
Nonfireemergency
Nonfireemergency
Nonfireemergency
Training Training,physical fitnessexercises
Training Training Training
Other All other typesof duty
All other typesof duty
All other typesof duty
All other typesof duty
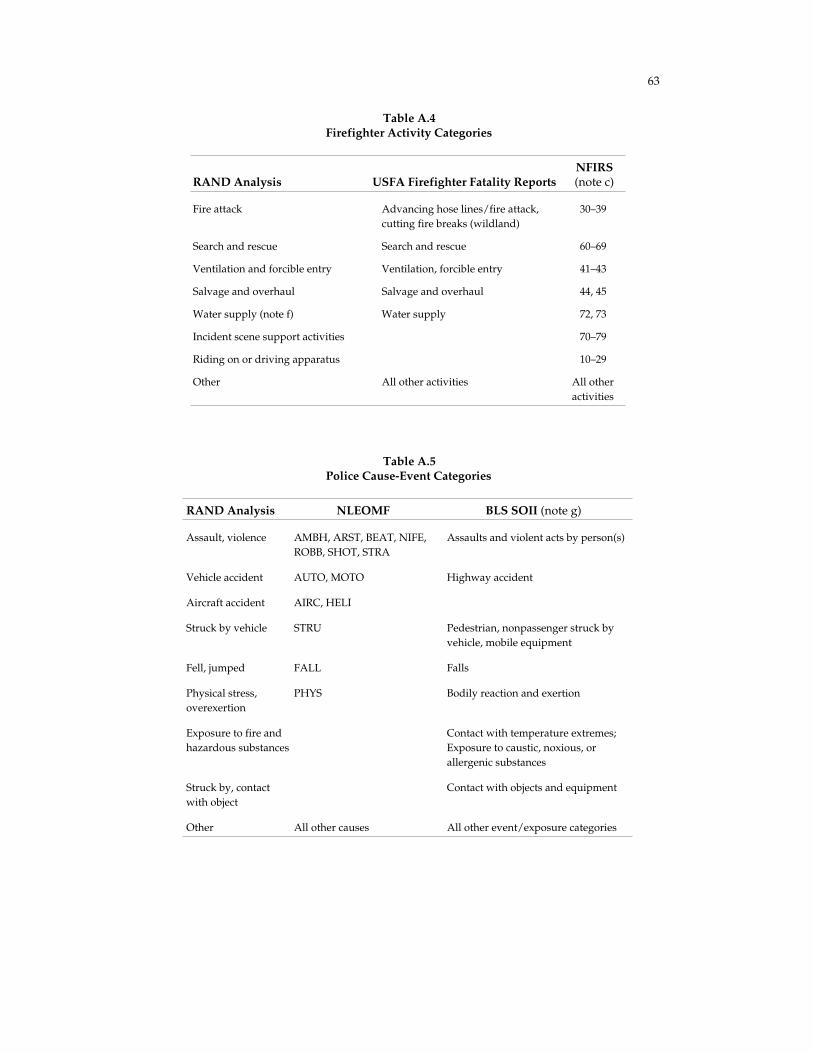
63
Table A.4Firefighter Activity Categories
RAND Analysis USFA Firefighter Fatality ReportsNFIRS(note c)
Fire attack Advancing hose lines/fire attack,cutting fire breaks (wildland)
30–39
Search and rescue Search and rescue 60–69
Ventilation and forcible entry Ventilation, forcible entry 41–43
Salvage and overhaul Salvage and overhaul 44, 45
Water supply (note f) Water supply 72, 73
Incident scene support activities 70–79
Riding on or driving apparatus 10–29
Other All other activities All otheractivities
Table A.5Police Cause-Event Categories
RAND Analysis NLEOMF BLS SOII (note g)
Assault, violence AMBH, ARST, BEAT, NIFE,ROBB, SHOT, STRA
Assaults and violent acts by person(s)
Vehicle accident AUTO, MOTO Highway accident
Aircraft accident AIRC, HELI
Struck by vehicle STRU Pedestrian, nonpassenger struck byvehicle, mobile equipment
Fell, jumped FALL Falls
Physical stress,overexertion
PHYS Bodily reaction and exertion
Exposure to fire andhazardous substances
Contact with temperature extremes;Exposure to caustic, noxious, orallergenic substances
Struck by, contactwith object
Contact with objects and equipment
Other All other causes All other event/exposure categories

64
Notes
a) Other respiratory distress is not among the Death and Injury Survey categories. Inthe analysis, this number was scaled by the following factor: (count of smoke or gasinhalation + count of other respiratory distress for all types of duty in the NFPAfirefighter injury reports)/(count of smoke or gas inhalation for all types of duty inthe NFPA firefighter injury reports).
b) Based on comparison with the rates in NFPA injury reports and NFIRS, the heatstress reported in the Death and Injury Survey appears analogous to NFIRS codes 17and 30. In the analysis, this number was scaled by the following factor: (all heatstress in Michael J. Karter, Jr., Patterns of Firefighter Fireground Injuries, NFPA,February 2000, adjusted by NFIRS 1998 as in note c)/(heat stress in codes 17 and 30).
c) Not all of these categories are included in Michael J. Karter, Jr., Patterns of
Firefighter Fireground Injuries, NFPA, February 2000. For those RAND categories thatinclude some but not all of the listed NFIRS codes for 1993–1997, the missing dataare filled in from existing data in the same proportion as found in the NFIRS 1998data.
d) Category 04 is divided by part of body. If part of body = 12, it is classified as “eyeinjuries,” otherwise as “cuts and bruises.”
e) Investigation of NFIRS 1998 data by cause and activity reveals that the majority ofcodes 22 and 23 can be considered heat stress; this amount can be estimated by 0.85× (code 23 total value).
f) Water Supply is a subset of Incident Scene Support Activities.
g) Breakdowns for the BLS data were obtained at the 2-digit level of detail. Cause-event data for 99 percent of the injuries for 1998 through 2000 in New York Statelocal government were publicly available at this level of detail. The 1 percent ofinjuries that were not reportable are included in the “other” category.

65
Appendix B: Fatality, Injury, Illness, andExposure Numerical Data Tables
This appendix contains the numerical data that serve as the basis for the figuresincluded in the text of the report.
Table B.1Data Underlying Figure 4.1—Firefighter and Law
Enforcement Fatalities, 1980–2001
Yearly Counts September 11, 2001
Year Police Fire Police Fire
1980 201 140
1981 201 131
1982 195 125
1983 190 113
1984 179 119
1985 173 126
1986 177 121
1987 175 131
1988 194 136
1989 191 119
1990 152 108
1991 147 109
1992 158 75
1993 154 77
1994 171 104
1995 174 96
1996 134 95
1997 164 94
1998 161 91
1999 134 112
2000 151 102
2001 158 98 72 343Average
1990–2001 154.8 96.8
SOURCES: U.S. Fire Administration (2002), National LawEnforcement Officers Memorial Fund (2002b).

66
Table B.2Data Underlying Figure 4.2—Cause of Fatal Injuries for Firefighters,
Police, and EMS Workers (%)
Cause of Injury Fire Police EMS
Assaults, violence 1 45 0
Vehicle accidents, struck by vehicle 18 40 30
Aircraft accident 4 4 57
Caught, trapped, exposure to fireproducts or chemicals 23 0 0
Physical stress, overexertion 46 7 7
Other 8 4 7
Total 100 100 100
Total sample size to calculatepercentages 589a 1,575 46
SOURCE: NFPA (1995-2000a), National Law Enforcement Officers MemorialFund (2002a), and National EMS Memorial Service (2002).
NOTES: Data are for 1995–2000 for firefighters, 1992–2001 for police, and1998–2001 for EMS. Total percentages may not add due to rounding.
aData averaged from two sources: 589 records from USFA, 579 records fromNFPA. Near-complete overlap.
Table B.3Data Underlying Figure 4.3—Nature of Injury for Firefighters, Police,
and EMS Injuries, 1996–1998
Nature of Injury % of Fire Injuries % of Police Injuries % of EMS Injuries
Sprains, strains 36.2 36.6 48.3
Fractures, dislocations 3.8 4.7 —a
Lacerations 9.7 8.2 4.5
Punctures 2.4 3.7 9.9
Bruises, abrasions 16.2 28.3 17.6
Burns 6.7 1.1 —a
Asphyxiation, hazmatinhalation 7.1 1.7 —a
Other (1) 16.7 14.2 15.3
Other (2) 1.2 1.5 4.4
Total 100.0 100.0 100.0
SOURCE: L. L. Jackson, NIOSH, unpublished data. Total percentages may not adddue to rounding.
NOTES: Other (1) is reported by the source, and corresponds to injuries coded as"other.” Other (2) is not reported by the source, and corresponds to injuries coded bynature but occurring infrequently and therefore not coded above.
aIndicates these injuries are not broken out from the "other" category.

67
Table B.4Data Underlying Figure 4.4—Type of Duty for Firefighter Injuries and Fatalities
Injuries
Type of Duty
NFPAAverage
Yearly TotalNFPA
PercentIAFF
PercentCombined
Percent
Fireground 44,830 51 52 51Responding to, returningfrom alarm 5,770 7 6 6
Non-fire emergency 13,700 16 17 16
Training 7,020 8 10 9
Other 16,610 19 16 17
Total 87,930 100 100 100
Fatalities
Type of DutyNFPATotal
USFATotal
CombinedTotal
CombinedPercent
Fireground 250 262 512 44Responding to, returningfrom alarm 155 130 285 24
Non-fire emergency 61 72 133 11
Training 48 42 90 8
Other 65 83 148 13
Total 579 589 1,168 100
SOURCES: Fatalities from NFPA (1995–2000a) and U.S. Fire Administration(2002). Injuries from NFPA (1995–2000b) and IAFF (1993–1998).
NOTES: The values reported in the table are the average of the two sources.NFPA average yearly total is rounded to the nearest 10. Total percentages may notadd due to rounding.

68
Table B.5Data Underlying Figure 4.5—Firefighter Activity for Fireground Injuries and Fatalities
Injuries
Patterns of FirefighterFireground Injuries
Breakdown by severity level, calculated byapplying NFIRS 1998 severity frequencies for
each to Patterns totals for each activity
Minor ModerateSevere and Life-
ThreateningFirefighter Activity Total Percent % of Total % of Total % of Total
Fire attack 23,960 49 48 51 56
Search and rescue 1,710 4 3 4 3
Ventilation and forcible entry 4,760 10 10 10 11
Salvage and overhaul 7,600 16 17 13 8
Water supply 1,550 3 3 3 3
Other 9,040 19 19 19 19
Total 48,610 100 100 100 100
Fatalities
USFA FirefighterFatalities
Firefighter Activity Total Percent
Fire attack 115 44
Search and rescue 34 13Ventilation and forcibleentry
13 5
Salvage and overhaul 4 2
Water supply 33 13
Other 63 24
Total 262 100
SOURCES: Fatalities from U.S. Fire Administration (1996–2001). Injuries from Karter (2000) adjustedby analysis of the NFIRS 1998 firefighter casualty module, rounded to the nearest 10.
NOTES: Totals may not add due to rounding. The NFIRS 1998 data were used to estimate theincidence of activities unreported in Karter (2000) and to reclassify certain natures based on additionalinformation contained in the NFIRS database. Injuries were sorted into minor, moderate, and severeusing percentages calculated from the NFIRS 1998 firefighter casualty module for fireground injuries.Severe injuries are based on a sample of less than 200 injuries, and therefore there is significantuncertainty involved in calculating both the breakdown of severe injuries by activity and the percentageof injuries occurring during each activity that are severe. Investigation of the NFIRS 1998 data indicatesthat many of the injuries in the “other” category occurred while picking up or carrying tools on thefireground, or have activity unreported or classified as “other.” Total percentages may not add due torounding.

69
Table B.6Data Underlying Figure 4.6—Firefighter Fireground Injuries by Cause
NFPAFirefighter
Injury Reports(per yearaverage)
Patterns ofFirefighterFireground
InjuriesCombined
Percent of each severity level,calculated by applying NFIRS 1998
severity frequencies for each toPatterns totals for each activity
Cause of Injury Total Percent Total Percent Percent Minor Moderate SevereStruck by, contactwith object 8,600 19 12,110 25 22 25 18 10
Vehicle relateda 230 0.5 0.5 0.4 0.4 2
Fell, jumped 10,820 24 9,790 20 22 23 24 7
Caught, trapped 600 1 2,210 5 3 3 3 3Exposure to fireproducts, chemicals,extreme weather 9,570 21 11,150 23 22 21 24 35Physical stress,overexertion 12,300
27 11,080 23 2524 28 37
Other 2,940 7 2,270 5 6 4 3 8Total 44,830 100 48,610 100 100 100 100 100
SOURCE: NFPA (1995-2000b) and Karter (2000) adjusted by NFIRS 1998 data.NOTES: The NFIRS 1998 data were used to estimate the incidence of activities unreported in Karter
(2000) and to reclassify certain natures based on additional information contained in the NFIRS database.The values reported are the average of the two sources. Injuries were sorted into minor, moderate, andsevere using percentages calculated from the NFIRS 1998 firefighter casualty module for firegroundinjuries. Severe injuries are based on a sample of less than 200 injuries, and therefore there is significantuncertainty involved in calculating both the breakdown of severe injuries by activity and the percentageof injuries occurring during each activity that are severe. Total percentages may not add due to rounding.Counts should be considered approximate, and are rounded to the nearest 10.
a“Vehicle related” is a subcategory of “Struck by, contact with object.”

70
Table B.7Data Underlying Figure 4.7—Breakdown of Firefighter Occupational Injury
Retirements (%)
Retirement Cause 1993 1994 1995 1996 1997 1998
% of
Totala
Noninjury Retirements 67.6 79.7 75.9 69.8 64.5 78.4 73.0
Injury Retirements 25.4 14.4 15.7 17.1 23.7 15.7 18.5
Back injury 44.2 52.6 56.3 52.9 44.7 54.5 9.3
Limb/Torso injury 36.5 28.7 29.2 —b —b —b 5.8
Leg/Hips/Abdomen injury 19.3 19.1 18.9 —
Arm/Shoulder/Chest injury 8.5 11.8 12.5 —
Foot injury 4.2 0.9 2.3 2.1 2.6 3.0 0.5
Hand injury 6.1 1.1 2.6 2.7 2.9 0.8 0.6
Head/Face injury 6.8 1.1 6.4 2.4 0.7 1.9 0.7
Percentageof injuryretirements
Locationunknown 2.2 15.6 3.2 12.1 18.2 8.3 1.8
Illness Retirements 7.0 5.9 8.4 13.1 11.8 5.9 8.5
Heart disease 44.7 50.3 47.0 47.0 55.8 55.0 4.2
Lung disease 10.0 9.0 20.8 23.3 20.4 19.0 1.5
Cancer 9.3 14.5 14.2 17.0 10.6 12.0 1.1
Hearing loss 9.3 5.5 8.7 3.2 4.4 2.0 0.5
Mental stress 9.3 12.4 6.0 4.7 6.2 10.0 0.5
Percentageof illnessretirements
Other disease 17.3 8.3 3.3 4.0 2.7 2.0 0.5
SOURCE: International Association of Fire Fighters, IAFF Death and Injury Survey (1993-1998)NOTE: Total percentages may not add due to rounding aPercent of all retirements, weighted by
estimated number of total retirements in each year (see table below for population adjustments). bAfter1996, Limb/Torso injuries were broken down into Leg/Hip/Abdomen and Arm/Shoulder/Chest.
Population Adjustments 1993 1994 1995 1996 1997 1998
IAFF population sampled 93,786 96,431 89,595 107,988 105,568 97,335
Injury and illness retirements inIAFF sample 695 497 526 584 682 364
Injury and illness retirements asa percentage of all retirements 32.4% 20.3% 24.1% 30.2% 35.5% 21.6%
Career firefighter population(from NFPA) 259,650 265,700 260,850 266,300 275,700 278,300
Estimated total retirements infirefighter population 5,940 6,750 6,350 4,770 5,020 4,820

71
Table B.8Data Underlying Figure 4.8—Firefighter Fireground Injuries by Nature, Severity, Cause
and Activity
The data that serve as the basis for Figure 4.8 are drawn from the National FireIncident Reporting System (NFIRS) database for 1998. The data tables included heresummarize the analysis of the data drawn from that database and creation of thematrix showing the cause and activity for moderate and severe fireground injuriesincluded in the text.
There are 7,072 records in the NFIRS 1998 firefighter casualty module. Of these,6,651 were used in the analysis because the other records contained no informationon the cause of injury, nature of injury, or firefighter activity. Of those records, 5,389occurred on the fireground, with the rest occurring off the fireground or withlocation classified as “other” or “unknown.”
On the following tables, NFIRS code numbers for nature of injury, severity of injury,and firefighter activity used in the 1998 database are included. Keys to those codenumbers are included after the data tables. Note that, changes have occurred in thecodes used in NFIRS since 1998. As a result, the codes included here do notcompletely correspond with the codes in use now.
Table B.8aFirefighter Injuries by Cause and Severity (All Injuries)
Severity
Cause 0 1 2 3 4 5 6 (blank) Total
Other/unknown 11 762 304 20 3 1 3 6 1,110
Fell 664 393 11 1,068
Caught, trapped 170 108 6 3 287
Struck by object(nonvehicle) 520 289 3 1 1 2 816
Struck by vehicle 8 7 3 18
Contact with object(non-exposure) 457 236 10 1 704
Exposure to fireproducts 605 314 47 1 1 1 969
Exposure to chemicalsor radiation 17 59 94 3 173
Contagious disease 3 3 2 8
Extreme weather 9 14 2 25
Physical stress oroverexertion 748 536 52 5 1 1,342
Jumped 47 22 69
Vehicle accident 17 17 1 35
Assault 19 8 27
Total 28 4,088 2,345 158 12 4 10 6 6,651

72
Table B.8bFirefighter Injuries by Cause and Severity (Fireground Injuries)
Severity
Cause 0 1 2 3 4 5 6 Total
Other/unknown 6 253 111 16 2 1 3 392
Fell 626 364 10 1,000
Caught, trapped 155 82 6 3 246
Struck by object(nonvehicle) 497 230 3 1 1 2 734
Struck by vehicle 7 4 3 14
Contact with object(nonexposure) 430 128 10 568
Exposure to fireproducts 587 307 45 1 1 1 942
Exposure to chemicalsor radiation 16 57 88 1 162
Contagious disease 3 2 2 7
Extreme weather 9 14 2 25
Physical stress oroverexertion 705 438 47 5 1 1,196
Jumped 46 20 66
Vehicle accident 7 3 10
Assault 19 8 27
Total 22 3,401 1,799 143 11 4 9 5,389
Table B.8cFirefighter Injuries by Nature and Severity (All Injuries)
SeverityNature Nature
Code 0 1 2 3 4 5 6 (blank) Total
Asphyxiation,hazmatinhalation 03 12 122 131 23 1 2 291
Burns Total 546 328 13 1 88805 15 17 3206 4 5 2 1107 440 282 11 1 73408 87 24 111
Total 63 54 10 127Other respiratory20 63 54 9 12647 1 1
Total 13 45 28 5 2 3 96Cardiac10 1 3 2 3 911 12 45 27 2 8652 1 1
Total 55 35 4 1 1 2 98Other trauma,non-fracture 16 20 14 1 1 36
31 24 8 1 33

73
Table B.8c—continued
SeverityNature Nature
Code 0 1 2 3 4 5 6 (blank) Total
34 10 9 3 2246 1 4 2 7
Total 210 143 31 1 385Likely thermalstress 17 74 58 21 1 154
22 10 6 1623 122 79 10 21130 4 4
Total 36 103 8 1 148Fractures anddislocations 21 19 27 2 48
28 16 75 6 1 9829 1 1 2
Total 1291 786 15 2,09240 468 265 6 739
Sprains, strains,non-fracturetrauma 51 763 486 8 1,257
53 60 35 1 96Total 819 314 5 1,138Cuts and bruises
01 125 20 1 14602 6 2 1 904 10 1 1113 223 78 30135 326 185 3 51444 129 28 157
Eye injury Total 95 23 11804 16 10 2627 79 13 92
Total 16 838 383 21 4 2 6 1,270Other, unknown?? 14 6 1 1 2200 495 95 5 1 6 60212 2 214 1 126 1 132 10 4 1 1533 1 1 236 1 137 17 9 2638 1 141 2 242 13 6 1 2045 3 1 448 1 149 16 16 2 3450 13 6 1 2054 1 3 2 655 5 10 1559 1 198 11 97 47 2 15799 5 133 169 7 1 315
blank 18 4 22
Total 28 4,088 2,345 158 12 4 10 6 6,651

74
Table B.8dFirefighter Injuries by Nature and Severity (Fireground Only)
SeverityNature Nature
Code 0 1 2 3 4 5 6 Total
Asphyxiation 03 8 115 97 21 1 2 244
Burns Total 534 241 12 1 78805 15 17 3206 4 5 2 1107 430 195 10 1 63608 85 24 109
Total 60 52 8 120Otherrespiratory 20 60 52 7 119
47 1 1Cardiac Total 10 37 26 5 2 3 83
10 1 3 2 3 911 9 37 25 2 7352 1 1
Total 46 32 3 1 1 2 8516 17 13 1 1 32
Othertrauma, non-fracture 31 19 7 1 27
34 9 9 2 2046 1 3 2 6
Total 201 134 31 1 36717 73 56 21 1 151
Likelythermal stress
22 8 5 1323 116 73 10 19930 4 4
Total 33 85 7 125Fractures anddislocations 21 16 25 1 42
28 16 59 6 8129 1 1 2
Total 1,191 645 11 1,84740 430 247 4 68151 705 366 7 1,078
Sprains,strains, non-fracturetrauma
53 56 32 88Total 768 238 4 1,010Cuts and
bruises 01 107 18 1 12602 5 2 1 804 10 1 1113 209 70 27935 312 119 2 43344 125 28 153
Eye injuries Total 87 23 11004 14 10 2427 73 13 86
Total 14 356 215 20 4 1 610Other/unknown ?? 7 6 1 1 15
00 64 59 5 1 12912 1 114 1 126 1 1

75
Table B.8d—continued
SeverityNature Nature
Code0 1 2 3 4 5 6 Total
32 8 2 1 11Other/unknown 33 1 1 2
36 1 137 17 6 2341 2 242 12 4 1 1745 3 1 449 13 15 2 3050 9 4 1 1454 1 3 2 655 5 10 1559 1 198 9 81 44 2 13699 5 122 52 6 185
blank 13 3 16
Total 22 3,401 1,799 143 11 4 9 5,389
Table B.8eAnalysis of Avulsion Injuries—Assignment of Avulsions to RAND Injury
Categories and Types of Duty
SeverityRAND Nature ofInjury Category NFIRS Body Part Type of Duty 1 2 Total
Fireground 14 10 24
Enroute/returning 1 1
(blank) 1 1Eye Injuries Eyes
Total 16 10 26
Fireground 10 1Cut/Bruise All other body
parts Total 10 1 11
Fireground 24 11 35
Enroute/returning 1 1
(blank) 1 1Total All body parts
Total 26 11 37

76
Table B.8fAssignment of Dizziness, Fainting and Disorientation to RAND Injury
Categories by NFIRS Cause (Fireground Injuries Only)
SeverityRAND Nature ofInjury Category NFIRS Nature NFIRS Cause
1 2 3 4Total
Thermal stress Disorientation Extreme weather 1 1
Exposure to heat 2 2Physical stress,Overexertion
3 2 5
Total 3 5 8
Extreme weather 4 1 5Dizziness/Fainting
Exposure to heat 12 14 1 27Physical stress,Overexertion
70 40 3 113
Total 86 55 4 145
Other natures Disorientation Caught/trapped 2 2
Fell 1 1
Contact with object 1 1
Struck by object 1 1
Total 5 5
Dizziness/fainting Exposure to smoke 10 5 4 19
Exposure to chemicals 1 1 1 3
Vehicle accident 1 1
Caught/trapped 1 1
Fell 1 1 2
Struck by object 3 1 4
Total 17 8 5 30
For injuries where no NFIRS cause was specified, counts were allocated to thermal stress (81%) andother natures (19%) based on the corresponding fraction of injuries with known cause:
Disorientation 1 1Dizziness/
Fainting13 10 1 24
Total 13 11 1 25

77
Table B.8gFirefighter Injuries by Activity and Severity (All Injuries)
Severity
Firefighter ActivityActivity
Code 0 1 2 3 4 5 6 (blank) Total
Total 2 452 189 8 1 652Salvage andoverhaul 44 41 19 1 61
45 2 411 170 7 1 591Total 273 146 12 1 432Ventilation and
forcible entry 41 79 49 2 13042 52 43 5 10043 142 54 5 1 202
Total 198 145 16 2 1 362Vehicle10 4 15 1 2011 12 6 1 1912 3 1 413 16 23 1 4014 4 415 3 316 2 3 1 1 717 62 28 3 9319 4 1 520 5 2 721 16 16 2 1 3522 5 523 1 5 1 725 41 36 6 8326 5 5 1027 5 1 629 10 4 14
Fire attack Total 16 1,690 1,233 82 5 2 6 3,03430 4 216 415 6 1 64231 1,129 619 64 4 2 5 1,82332 28 14 4233 12 6 1 1934 196 119 7 1 32339 12 109 60 4 185
Search and rescue Total 111 89 5 1 20660 4 17 2161 71 44 5 12062 32 26 1 5969 4 2 6
Total 391 186 9 2 588Incident scenesupport activities 51 13 5 18
52 13 6 1953 1 1 270 32 16 1 4971 3 1 1 572 35 11 4673 69 35 4 10874 77 47 2 12675 77 27 10476 5 4 9

78
Table B.8g—continued
Severity
Firefighter ActivityActivity
Code 0 1 2 3 4 5 6 (blank) Total
77 3 1 4Incident scenesupport activities 79 63 32 2 1 98
Total 10 973 357 26 2 2 1 6 1,377Other, unknown?? 11 2 1300 8 477 63 5 6 55935 1 136 3 337 5 5 1 1140 2 144 106 5 25749 122 51 4 1 17850 18 9 2754 20 21 1 4255 1 2 356 5 6 1 1259 22 22 4463 4 465 5 7 1267 1 168 1 180 1 4 581 14 5 1982 2 2 483 1 184 3 2 585 2 3 2 788 1 189 7 3 1 1191 33 12 3 4892 6 3 1 1093 2 294 5 3 1 995 5 599 42 20 2 2 66
(blank) 11 4 1 16Total 28 4,088 2,345 158 12 4 10 6 6,651

79
Table B.8hFirefighter Injuries by Activity and Severity (Fireground Only)
Severity
Firefighter ActivityActivity
Code 0 1 2 3 4 5 6 Total
Salvage andoverhaul Total 2 442 179 8 1 632
44 40 17 1 5845 2 402 162 7 1 574
Total 265 144 12 1 42241 78 48 2 128
Ventilation andforcible entry
42 47 43 5 9543 140 53 5 1 199
Vehicle Total 147 90 11 1 24910 1 1 211 1 2 312 1 113 2 7 914 3 315 2 216 1 117 59 20 3 8219 2 1 320 4 2 621 9 10 1 1 2122 2 223 1 3 425 40 35 6 8126 5 5 1027 5 1 629 9 4 13
Fire attack Total 16 1,624 906 78 5 2 6 263730 4 196 102 6 1 30931 1,095 610 62 4 2 5 177832 27 13 4033 12 6 1 1934 189 115 7 1 31239 12 105 60 2 179
Total 108 72 4 1 185Search and rescue60 4 2 661 68 42 4 11462 32 26 1 5969 4 2 6
Total 373 178 9 2 56251 13 4 1752 12 6 18
Incident scenesupport activities
53 1 1 270 27 14 1 4271 3 1 1 572 34 11 4573 68 34 4 10674 75 47 2 12475 71 26 9776 5 4 9

80
TableB.8h—continued
SeverityFirefighter Activity
ActivityCode 0 1 2 3 4 5 6 Total
77 3 1 4Incident scenesupport activities 79 61 29 2 1 93
Total 4 442 230 21 2 2 1 702Other, unknown?? 8 2 1000 2 21 13 3 3936 3 337 5 5 1 1140 2 130 72 5 20949 117 45 4 1 16750 18 9 2754 20 21 1 4255 1 2 356 5 6 1 1259 22 22 4463 4 465 5 4 967 1 168 1 182 1 189 1 1 291 33 12 3 4892 5 3 1 993 1 194 5 2 1 895 2 299 32 9 2 2 45
(blank) 2 2 4
Total 22 3,401 1,799 143 11 4 9 5,389

81
Table B.8iCodes Identifying Primary Apparent Symptom of Injury in the NFIRS 1998 Database
01 Abrasion02 Amputation03 Asphyxiation (included is smoke inhalation)04 Avulsion (included is avulsion of eye, eye trauma, out of socket)05 Burn: chemical06 Burn: electrical07 Burn: thermal08 Burn: scald09 Cancer10 Cardiac arrest11 Cardiac symptoms12 Chills13 Contusion/bruise – minor trauma14 Convulsion/seizure: unspecified (included is petite mal)15 Convulsion/seizure: systemic (included is grand mal)16 Crushing17 Dehydration18 Diabetic coma19 Diabetic shock20 Difficulty breathing/shortness of breath21 Dislocation22 Disorientation23 Dizziness/fainting/weakness24 Drowning25 Drug overdose26 Fever27 Foreign body, obstruction28 Fracture: closed29 Fracture: open30 Frostbite31 Hemorrhaging, bleeding32 Hypersensitivity (included is allergic reaction to medicines)33 Impairment similar to that caused by alcohol34 Internal trauma (closed blunt)35 Laceration, cut36 Mental disorder37 Nausea38 Obstetrics – delivery39 Obstetrics – miscarriage40 Pain only41 Paralysis42 Parasthesia, numbness, tingling43 Pneumonia44 Pucture/wound: penetrating (included are stab wounds)45 Poison not listed elsewhere46 Projectile wound – high velocity (included are gunshot wounds)47 Respiratory arrest48 Shock: anaphylactic49 Shock: electrical50 Sickness

82
Table B.8i—continued
51 Sprain, strain52 Stroke (C.V.A.)53 Swelling54 Unconscious55 Vomiting59 Other long-term illness98 No apparent symptom99 Apparent symptom not classified above00 Apparent symptom undetermined or not reported

83
Table B.8jCodes Identifying Firefighter Activity in the NFIRS 1998 Database
1 Riding Vehicle
11 Boarding fire apparatus, emergency vehicle12 Riding fire apparatus: standing13 Riding fire apparatus: sitting14 Riding fire apparatus: position unknown15 Riding other emergency vehicle (included are ambulances, boats,
planes, etc.)16 Riding nonemergency vehicle17 Getting off fire apparatus, emergency vehicle18 Jumping from aircraft19 Riding vehicle not classified above10 Riding vehicle; insufficient information classify further
2 Driving/Operating Apparatus
21 Driving fire apparatus22 Tillering ladder truck23 Driving other emergency vehicle (included are ambulances, boats)24 Flying aircraft25 Operating engine/pump26 Operating ladder truck, elevated platform27 Operating other apparatus/equipment (included are power
winches, stationary generators, etc.)29 Driving/operating not classified above20 Driving/operating; insufficient information classify further
3 Extinguishing Fire/Neutralizing Incident
31 Handling charged hose lines32 Using hand extinguishers33 Operating master stream device34 Using hand tools in extinguishment activity35 Removing power lines36 Removing flammable liquids/chemicals37 Shutting off utilities, gas lines, etc.39 Extinguishing fire/neutralizing incident not classified30 Extinguishing fire/neutralizing incident; insufficient information
classify further
4 Suppression Support
41 Forcible entry42 Ventilation with power tools43 Ventilation with hand tools44 Salvage45 Overhaul49 Suppression support not classified40 Suppression support; insufficient information classify further

84
Table B.8j—continued
5 Access/Egress
51 Carrying ground ladder52 Raising ground ladder53 Lowering ground ladder54 Climbing ladder55 Scaling56 Escaping fire/hazard59 Access/egress not classified50 Access/egress; insufficient information classify further
6 Rescue
61 Searching for fire victim62 Rescue of fire victim63 Rescue of non-fire victim64 Water rescue65 Providing emergency medical care66 Diving operations67 Extraction with power tools68 Extraction with hand tools69 Rescue not classified above60 Rescue; insufficient information classify further
7 Miscellaneous Incident Scene Activity
71 Directing traffic72 Catching hydrant73 Laying hose74 Moving tools or equipment around scene75 Picking up tools, equipment, hose on scene76 Setting up lighting77 Operating portable pump79 Miscellaneous incident scene activity not classified above70 Miscellaneous incident scene activity; insufficient information
classify further
8 Station Activity
81 Moving about station, alarm sounding82 Moving about station, normal activity83 Station maintenance84 Vehicle maintenance85 Equipment maintenance86 Physical fitness activity: supervised87 Physical fitness activity: unsupervised88 Training activity or drill89 Station activity not classified above80 Station activity; insufficient information classify further

85
Table B.8j—continued
9 Other Activity
91 Incident investigation: during incident92 Incident investigation: after incident93 Inspection activity94 Administrative work95 Communication work99 Activity at time injury/accident not classified above00 Activity at time injury/accident undetermined or unreported
Table B.8kSeverity of Injury Codes in the NFIRS 1998 Database
1. Minor The patient is not in danger of death or permanent disability.Immediate medical care is not necessary.
2. Moderate There is little danger of death or permanent disability. Quickmedical care is advisable. This category includes injuries such asfractures or lacerations requiring sutures.
3. Severe The situation is potentially life threatening if the condition remainsuncontrolled. Immediate medical care is necessary even thoughbody processes may still be functioning and vital signs may benormal.
4. Life Threat Death is imminent: body processes and vital signs are not normal.Immediate medical care is necessary. This category includes suchas severe hemorrhaging, severe multiple trauma, and multipleinternal injuries.
5 & 6. Fatality Death occurs either on arrival at the scene or subsequently.

86
Table B.8lExtracted Data for Figure 4.8—Injury Incidence Matrix for Moderate and Severe Firefighter
Fireground Injuries by Cause and Activity
Total Moderate and Severe Injuries by Cause of Injury
ActivityNature of
InjuryCaught,Trapped
Fell,Jumped
Exposureto Fire
ProductsPhysical
Stress
Struck by,Contact
withObject
Exposureto
Chemicals
Asphyxiation 1 1 3Salvage andoverhaul Other 2 2 6 8
Burns 1 1 2 3
Other respiratory 1 1 1
Cardiac 5Other trauma,nonfracture 1 2 1
Thermal stress 8Fractures anddislocations 5 1 1Sprains andstrains 3 23 30 17 1
Cuts and bruises 1 4 1 1 26
Eye injury 9
Asphyxiation 10 2Ventilation andforcible entry Other 2 4 4 2
Burns 1 1 1
Other respiratory 1 1
Cardiac 4Other trauma,non-fracture 1 2
Thermal stress 7 6Fractures anddislocations 1 1 2 3Sprains andstrains 17 22 9
Cuts and bruises 1 1 1 4 29
Eye Injury 1
Search and rescue Asphyxiation 8 1
Other 2 1
Burns 15
Other respiratory 1 1
Cardiac 1Other trauma,non-fracture 1
Thermal stress 4 1Fractures anddislocations 4 1Sprains andstrains 1 3 2 12 3
Cuts and bruises 4 1 5

87
Table B.8l—continued
Total Moderate and Severe Injuries by Cause of Injury
Activity Nature of InjuryCaught,Trapped
Fell,Jumped
Exposureto Fire
ProductsPhysical
Stress
Struck by,Contact
withObject
Exposureto
Chemicals
Incident scenesupport activities Asphyxiation 4 5
Other 3 3 12
Burns 1 1 3 1 1 1
Other respiratory 2
Cardiac 5Other trauma,non-fracture 3 2
Thermal stress 1 7 1Fractures anddislocations 7 2Sprains andstrains 1 32 37 6
Cuts and bruises 2 8 16
Eye injury 1
Fire Attack Asphyxiation 3 44 2 1 14
Other 2 13 28 25 21 34
Burns 28 5 126 1 24 2
Other respiratory 9 15 6 3
Cardiac 5 22 1Other trauma,nonfracture 4 4 2 5
Thermal stress 1 32 56 1Fractures anddislocations 5 18 7 9Sprains andstrains 12 94 2 123 39
Cuts and bruises 3 18 1 4 50
Eye injury 9
Vehicle Asphyxiation 3 1 1
Other 1 1 4 2
Burns 1 1 2
Other respiratory 1 1
Cardiac 1 1Other trauma,nonfracture 1 1
Thermal stress 2 2Fractures anddislocations 8 1Sprains andstrains 33 7 4
Cuts and bruises 2 1 9Eye injury 1

88
Table B.9Data Underlying Figures 4.9 and 4.10—Cause of Injury for Police Lost Work Time Injuries
and Fatalities and Severity of Police Lost Work Time Injuries by Cause of Injury
FatalitiesInjuries, Local Government, Police andDetectives, New York State, 1998–2000
Cause Total Percent Average Annual Percent Severity
Assault, violence 709 45 2,273 27 4
Vehicle accident 493 31 1,348 16 4
Aircraft accident 62 4 —a
Struck by vehicle 143 9 19 0.2 5
Fell, jumped 27 2 1,587 19 5Physical stress,overexertion 103 7 2,080 25 5Exposure to fire andhazardous substances —a 99 1 4Struck by, contactwith object —a 810 10 3
Other 38 2 213 3
Total 1,575 100 8,429 100 4
SOURCES: Fatalities from National Law Enforcement Officers Memorial Fund (2002a). Injuries fromSurvey of Occupational Injuries and Illnesses, Bureau of Labor Statistics (2003b).
NOTES: Data include police and detectives (occupation code 418), State of New York, at the localgovernment level, for the years 1998–2000. “Struck by vehicle” refers to officers struck while not inside avehicle. Severity is based on the median days away from work produced by each injury type. Theoverall severity measure reported here is the median of the three median measurements for the threeyears examined. Total percentages may not add due to rounding.
aIndicates these injuries and fatalities are not broken out from the “other” category.

89
Table B.10Data Underlying Figure 4.11—Injury Incidence and Severity of Police Lost Work Time Injuries by Cause
1998 1999 2000 1998–2000
RAND Cause Category BLS Event or Exposure(Code and Category Name) Count
Percentof
Total
MedianDaysAway Count
Percentof
Total
MedianDaysAway Count
Percentof
Total
MedianDaysAway Count
AnnualAverage
Percentof
Total
MedianDaysAway
Struck by, contact withobject
0 Contact with objects andequipment 804 10 3 712 8 3 914 11 4 2,430 810 10 3
Fell, jumped 1 Falls 1,262 16 6 1,883 21 5 1,617 19 5 4,762 1,587 19 5
Physical stress,overexertion 2 Bodily reaction and exertion 3,269 41 4 1,618 18 5 1,352 16 6 6,240 2,080 25 5
Exposure to fire andhazardous substances 32 Contact with temperature extremes 67 1 6
34 Exposure to caustic, noxious, orallergenic substances 50 1 3 75 1 4 105 1 2
Total 117 1 5 75 1 4 105 1 2 297 99 1 4
Vehicle accident(including struck byvehicle)
41 Highway accident 1,652 1 4 1,161 13 4 1,231 15 5 4,044 1,348 16 4
43 Pedestrian, nonpassengerstruck by vehicle, mobileequipment 27 0.3 4 30 0.4 6 57 19 0.2 5
Total 1,652 21 4 1,188 13 4 1,251 15 5 4,091 1,364 16 4
Assault, violence 61 Assaults and violent acts byperson(s)
616 8 4 3,272 3 3 2,932 35 4 6,820 2,273 27 4
Other All other event/exposures 240 3 — 242 3 — 166 2 — 648 216 3 —
Total 7,960 100 4 8,990 100 4 8,338 100 4 25,288 8,429 100 4
SOURCE: Survey of Occupational Injuries and Illnesses, Bureau of Labor Statistics (2003b), data for police and detectives, State of New York, at the local governmentlevel, for the years 1998–2000.
NOTE: Total percentages may not add due to rounding.

90
Table B.11Data Underlying Figure 4.11—Injury Incidence by Cause and Nature of Police Lost-Work-Time Injuries
RAND Cause CategoryBLS Event or Exposure (Code and
Category Name) RAND NatureBLS Nature Codes(Specified Below)
1998Count
1999Count
2000Count
1998–2000Count
Struck by, contact with object 0 Contact with objects and equipment Trauma 00, 01, 02, 06, 08, 09 308 131 425 864Cuts/bruises 03, 04 373 581 485 1,438
Symptoms of illness 41 64 64Total 804 712 914 2,430
Fell, jumped 1 Falls Trauma 00, 01, 02, 06, 08, 09 925 1,542 1,363 3,830Cuts/bruises 03, 04 274 310 239 823
Symptoms of illness 41 61 10 71Total 1,262 1,883 1,617 4,762
Physical stress, overexertion 2 Bodily reaction and exertion Trauma 00, 01, 02, 06, 08, 09 2,554 1,567 1,342 5,464Cuts/bruises 03, 04 37 37
Symptoms of illness 41 705 705Total 3,269 1,618 1,352 6,239
Exposure to fire and hazardous substances 32 Contact with temperature extremes Burns 05 113 11334 Exposure to caustic, noxious, or
allergenic substances Symptoms of illness 41 35 32 67Trauma 00, 01, 02, 06, 08, 09 32 32
Total 117 75 105 297
Vehicle accident 41 Highway accident Trauma 00, 01, 02, 06, 08, 09 1,255 961 1,189 3,405Cuts/bruises 03, 04 397 200 19 615
Total 1,652 1,161 1,231 4,044
Assault, violence 61 Assaults and violent acts by person(s) Trauma 00, 01, 02, 06, 08, 09 327 2,666 2,230 5,223Cuts/bruises 03, 04 279 603 642 1,524
Symptoms of illness 41 53 53Total 616 3,272 2,932 6,820

91
SOURCE: Survey of Occupational Injuries and Illnesses, Bureau of Labor Statistics (2003b).NOTE: Data are for police and detectives, State of New York, at the local government level, for the years 1998–2000. Total percentages may not add due to rounding.
Totals are higher than the sums of intermediate counts because other natures and nature unknown are omitted from the table. Struck by vehicle was not included withvehicle accidents because the count of this event/exposure was too small to analyze. Blank cell does not necessarily mean zero, but “too few cases to report.”
BLS Name Codes00 Traumatic injuries and disorders, unspecified01 Traumatic injuries to bones, nerves, spinal cord02 Traumatic injuries to muscles, tendons, ligaments, joints, etc.03 Open wounds04 Surface wounds and bruises05 Burns06 Intracranial injuries08 Multiple traumatic injuries and disorders09 Other traumatic injuries and disorders41 Symptoms

92
Table B.12Data Underlying Figure 4.12—Cause of Injury for EMS Line-of-Duty
Fatalities, 1998–2001
Fatalities
Cause 1998 1999 2000 2001 Total Percent
Aircraft accident 9 10 6 1 26 57Motor vehicle accident 5 2 2 3 12 26Heart attack/stress 1 2 3 7Struck by vehicle 2 2 4Drowning 1 1 2Illness 1 1 2Homicide 0 0Other 1 1 2Total 16 14 8 8 46 100
SOURCE: RAND tabulation of National EMS Memorial Service (2002), excluding those EMSresponders (total of 6 fatalities) covered by the U.S. Fire Administration Firefighter Fatality Database.
NOTE: Total percentages may not add due to rounding.