Embed Size (px)
Citation preview
Emergency Food Security Assessment (EFSA) March 2012
1

Emergency Food Security Assessment (EFSA) March 2012
i
Emergency Food Security Assessment (EFSA) March 2012
ii
Acknowledgements The team for this follow-up Emergency Food Security Assessment (EFSA) is grateful to the 2,000 households and 190 Key Informants in urban and rural areas of the Kyrgyz Republic who gave their time to answer enumerators‘ questions and give information. The staff of the company SIAR in Bishkek and in the various oblasts efficiently carried out the field data collection, data entry and cleaning in a very tight timeframe. They also provided the output tables, as per the WFP plan of analysis. From the WFP Country Office in the Kyrgyz Republic, Keigo Obara (Vulnerable Analysis and Mapping Officer) and Aizhan Mamatbekova (Vulnerable Analysis and Mapping Assistant) ensured the preparation, monitored the data collection, compiled the analysis of the data, and prepared the final report, with support from Nadya Frank (Programme Officer) and SueNah Lyons (Reports Officer) and oversight from Michael Huggins (Deputy Country Director).
Emergency Food Security Assessment (EFSA) March 2012
iii
Abbreviations
CSI
Coping Strategy Index
EFSA
Emergency Food Security Assessment
EMOP
Emergency Operation
FAO
Food and Agriculture Organization of the United Nations
FC
Food Consumption
FCS
Food Consumption Score
FSMS
Food Security Monitoring System
GDP
Gross Domestic Product
IDP Internally Displaced Persons
KGS
Kyrgyz Som
KIHS
Kyrgyz Integrated Household Survey
MT
Metric Ton
PDM
Post Distribution Monitoring
PRRO
Protracted Relief and Recovery Operation
UNDP
United Nations Development Programme
UNICEF
United Nations Children’s Fund
VGF
Vulnerable Group Feeding
WFP
United Nations World Food Programme
WHO
World Health Organisation
Cover picture ©WFP/Maxim Shubovich
Emergency Food Security Assessment (EFSA) March 2012
iv
Table of Contents Acknowledgements ................................................................................................................. ii
Abbreviations .......................................................................................................................... iii
Table of Contents ................................................................................................................... iv
EXECUTIVE SUMMARY ........................................................................................................... 1
Context and methodology ..................................................................................................... 1 How many were food insecure in March 2012? .................................................................... 1 Where were the food insecure? ............................................................................................ 1 Who were the food-insecure people? ................................................................................... 2 Why were people food-insecure? .......................................................................................... 2 How is the situation likely to evolve? ..................................................................................... 2
I – CONTEXT AND OBJECTIVES OF THE FOLLOW-UP EMERGENCY FOOD SECURITY ASSESSMENT IN THE KYRGYZ REPUBLIC ................................................................... 3
1.1 – Kyrgyz Republic: context and changes since January 2011 ................................. 3 1.2 – Rationale for the follow-up assessment and objectives ........................................ 4
II – METHODOLOGY ................................................................................................................ 5
2.1 – Sampling and sources of information ..................................................................... 5 2.2 – Analysis of household food security ....................................................................... 6 2.3 – Limitations .................................................................................................................. 7
III – RESULTS ........................................................................................................................... 8
3.1 – Household food security ........................................................................................... 8 3.1.1 – Proportion of food insecurity ................................................................................. 8 3.1.2 – Location of food-insecure households .................................................................. 8
3.2 – Demographic characteristics .................................................................................... 9 3.2.1 – Head of household ................................................................................................ 9 3.2.2 – Average size of households .................................................................................. 9 3.2.3 – Presence of vulnerable household members ..................................................... 10
3.4 – Nutritional situation ................................................................................................. 10 3.5 – Access to education services ................................................................................. 11 3.6 – Food consumption and stocks ............................................................................... 12
3.6.1 – Number of daily meals ........................................................................................ 12 3.6.3 – Food consumption patterns ................................................................................ 12 3.6.4 – Food stocks ......................................................................................................... 14 3.6.5 – Sources of food consumed in the past week ...................................................... 16
3.7 – Poverty, unemployment and social assistance .................................................... 17 3.7.1 – Poverty rates ....................................................................................................... 17 3.7.2 – Unemployment .................................................................................................... 17 3.7.3 – Social assistance ................................................................................................ 17
3.8 – Income, cash sources and cash amount ............................................................... 18 3.8.1 – Wage trends ........................................................................................................ 18 3.8.2 – Average number of cash-earning members and cash sources .......................... 18 3.8.3 – Main sources and amount of cash ...................................................................... 19 3.8.4 – Migrants and remittances ................................................................................... 24
3.9 – Main expenditures .................................................................................................... 24 3.10 – Credit or loans ........................................................................................................ 26 3.11 – Crop cultivation ...................................................................................................... 26
3.11.1 – Agricultural production and food availability at national level ........................... 26 3.11.2 – Household access to garden or land to cultivate .............................................. 26 3.11.4 – Main crops cultivated, sales and self-sufficiency .............................................. 28
Emergency Food Security Assessment (EFSA) March 2012
v
3.12 – Livestock ................................................................................................................. 28 3.12.1 - Livestock ownership .......................................................................................... 28 3.12.2 – Prices of livestock ............................................................................................. 30 3.12.3 – Animal fodder .................................................................................................... 30
3.13 – Markets .................................................................................................................... 31 3.13.1 – Physical access to local markets ...................................................................... 31
3.14– Assets ownership ................................................................................................... 34 3.15 – Main shocks and problems in previous three months ....................................... 34 3.16 – Coping strategies ................................................................................................... 36
3.16.1 – Use of food-related coping strategies ............................................................... 36 3.16.2 – Reduced Coping Strategy Index ....................................................................... 37 3.16.3 – Strategies entailing risks for lives and risks for livelihoods ............................... 38 3.16.4 – Strategies jeopardizing future livelihoods ......................................................... 39
3.17 - Assistance received ............................................................................................... 40 3.17.1 – Current food security assistance from the government and other agencies .... 40 3.17.2 – WFP assistance in the past and within the next 12 months ............................. 40 3.17.2 – Proportion of the households received assistance ........................................... 40
3.18 – Main priorities ......................................................................................................... 41
IV – SUMMARY OF CURRENT FOOD SECURITY SITUATION AND FORECASTED DEVELOPMENT ............................................................................................................... 41
4.1 – Summary of the food security situation and main factors .................................. 41 4.2 – Macro-economic prospects for the next 12 months............................................. 44 4.3 – Agricultural production and food price prospects ............................................... 45 4.4 – Poverty and household food security prospects ................................................. 45
V – SUGGESTIONS FOR FOOD SECURITY ASSISTANCE AND FOR WFP’S OPERATIONS .................................................................................................................. 47
5.1 – Framework for food and nutrition insecurity in Kyrgyzstan ............................... 47 5.2 – Estimated number of people needing food security assistance ......................... 48
ANNEX 1 – Household Questionnaire ................................................................................. 50
ANNEX 2 – Key Informant Questionnaire ........................................................................... 54
ANNEX 3 – Social Assistance System in Kyrgyz Republic ............................................... 57
ANNEX 4 – Estimation of theoretical minimum land acreage for food self-sufficiency. 58
ANNEX 5 – Livelihoods characteristics used for the design of WFP interventions ....... 59
ANNEX 6 – Evolution of Food Security in the Kyrgyz Republic ...................................... 60
ANNEX 7 – Food security profile by oblast ........................................................................ 61
ANNEX 8 – Proportion of food insecure households ........................................................ 63
Emergency Food Security Assessment (EFSA) March 2012
1
EXECUTIVE SUMMARY
Context and methodology
WFP conducted Emergency Food Security Assessment (EFSA) March 2012 to assess current household food security as well as support decision making on food security assistance programmes. Prior to this EFSA and since 2010, WFP carried out three nationwide EFSAs in the Kyrgyz Republic to evaluate the impacts of the April-June 2010 civil unrest, other shocks such as high food and fuel prices, and the effects of the 2008 global financial crisis.
While violence in the southern oblasts of Osh and Jalalabad has receded in the last two years, households across the country continued to be affected by food and fuel price rises. A long and cold 2011-2012 winter season combined with the lean early spring period of the year, when stocks of food are depleted and additional inputs are required for the spring planting campaign, meant the situation of vulnerable households was highly fragile.
Wages for teachers and health workers, as well as pensions and social benefits increased in mid to late 2011.
Data was collected in mid-March 2012 from 2,000 households selected from 25 localities in each oblast and in the city of Bishkek. In addition 190 Key Informants from various localities were interviewed.
To evaluate the evolution of household food security and vulnerability, this EFSA used the same methodology as the previous three EFSAs conducted in August 2010, March 2011 and August 2011.
How many were food insecure in March 2012?
An estimated 18% of households were found to be food insecure, of which 3% were
severely food insecure and 15% were moderately food insecure. This means that about 1 million people were food insecure during the March 2012 assessment.
In addition, nearly 20% of food secure households used negative coping strategies for accessing food such as eating less preferred food to ensure their health and nutritional status of vulnerable members. This indicates that these households could be ‗at-risk‘ of becoming food-insecure in the event of further shocks (e.g. prices increases, upsurge of conflict). This means an additional some 750,000 people were facing the risk of food insecurity.
The proportion of food insecure households remained almost unchanged from August 2011 (18% food insecure including 2% severely food insecure), despite the seasonal effects. The proportion was significantly lower than in March 2011, the previous winter season (46%).
Where were the food insecure?
Food insecurity was more prevalent in rural areas. Twenty-four percent of rural households were food insecure (5% severely and 22% moderately food insecure) while 9% of urban households were food insecure (1% severely and 8% moderate).
The highest proportion of food insecurity was found in Talas (38%), Naryn (37%) and Osh (22%) oblasts, followed by Yssyk-Kul (17%), Batken (14%), Jalalabad (14%) and Chuy (13%) oblasts. Consistent with the results of the past three EFSAs, Naryn and Osh were among the oblasts with the highest proportion of food insecure households, however, for the first time Talas had the highest proportion of food insecurity.
The best food security situation continued to be in Bishkek city.
Emergency Food Security Assessment (EFSA) March 2012
2
Who were the food-insecure people?
Food-insecure households included those with limited access to natural such as land and livestock to ensure more than a few months of self-consumption; and those with limited and irregular access to cash (including from unskilled labour, livestock and agriculture with small pensions and allowances). ‗Aggravating‘ structural factors comprised large family size and vulnerable members.
Why were people food-insecure?
As shown in previous assessments, food insecurity was essentially chronic, with poverty as the base cause of poor food consumption. The vast majority in both urban and rural areas was to a large extent dependent on food purchases and therefore vulnerable to market developments, such as the recent price hikes.
The severity of food insecurity presents seasonal variations – improved food consumption in summer and deterioration of diet in post-harvest time (winter/early spring) when food stocks are depleted, seasonal work opportunities decrease, and food prices increase. The increase in the prices of meat and milk was particularly significant in late 2011 and early 2012.
Severely food insecure households spent more than a half of their budget on food and more than 30% on gas and electricity.
Compared to March 2011, proportions of households who live under the extreme poverty line declined for almost all oblasts, reflecting increased income from social assistance, including pensions. Given the high expenditure on food, gas and electricity in winter, household food access would have been worse without the increase in government social assistance. Food insecure households relied on irregular cash income such as sale of agricultural crops, petty trade, unskilled labour and pensions. Most of the cash thus
obtained was low, meaning that these households remained below the official poverty line1.
Low income and productive asset base and resources (land, animals, skills, credit) did not enable households to maintain an adequate frequency and diversity of food intake, potentially putting the health and nutritional status of vulnerable members in jeopardy through deficiencies, especially in micronutrients.
Decreased prices of wheat, potato and vegetable might have negatively affect suppliers, especially small ones. Further examination and analysis of selling prices of crops is required and will take place during the next assessment.
How were people coping with the situation?
Nearly 20% of food secure households used negative coping strategies when faced with difficulties in accessing food, such as reducing meal size and decreasing expenditures for healthcare. These strategies entail risks for the health and nutritional status of the vulnerable members in the short- and medium-term.
The households in rural areas often used coping strategies which jeopardize their livelihood sources, such as consumption of seed stocks, decreased expenditures for agricultural inputs and sale of livestock.
The households which relied on irregular income sources such as remittances, sale of livestock and agricultural crops also tended to be dependent on the income from social transfers, including pensions.
How is the situation likely to evolve?
1 The official poverty line is set at 1,618 KGS (US$ 34) per capita per month.

Emergency Food Security Assessment (EFSA) March 2012
3
At the macro level, Gross Domestic Product (GDP) declined for the first two months of 2012 due to a big fall in the output of the Kumtor gold-mining complex. Official statistics show that the negative trend in industrial output worsened in February 2012, with a 34.8% decline in that month compared with the same month of the previous year, after recording a sharp 44.1% and 31.7% decline already in December 2011 and January 2012, respectively
2.
Excluding Kumtor production, official GDP growth was 3.7% in January-February 2012 compared to the same period in 2011. This is significantly lower than the growth recorded in 2011 (5.7%).
According to the Ministry of Agriculture, 15,400 ha of wheat will be planted in 2012, which is 35% more than in 2011. The crop forecast for other staple commodities such as potatoes is also higher than in 2011. In total 303,400 of hectares was ploughed, which is 68,900 hectares more than in 2011.
The wages for teachers and health workers, as well as pensions and social benefits increased in mid to late 2011. This will continue to have a positive impact on households‘ income
3.
Despite some positive trends, mentioned above, the following factors have negative effects on the situation in the country and food security in particular:
o The cost of the average food basket particularly protein-rich food such as meat and milk remains extremely high and attempts to compensate for increase in wages. This will continue to be the main risk of food insecurity, particularly during the pre-harvest season.
o In the absence of a significant adjustment of minimum wages, the purchasing power of households will remain depressed, impacting food consumption.
In addition to these, the following factors could have negative impacts on food security:
o As a result of a long and cold winter, spring planting works started late this season4
and will continue to be constrained by the high cost of agricultural inputs (fuel, fertilizers and seeds).
o In addition, the country remains highly susceptible to natural hazards (e.g. earthquake, mudflows, land-slides, snow storms etc.) which may occur at any time and can cause heavy losses of lives, livestock and crops, as well as damage to infrastructure.
o Resurgence of ethnic tensions in the southern provinces may lead to a general deterioration of the security situation. The main source of uncertainty among the interviewed households was the planned demonstrations of the opposition in 2012.
I – CONTEXT AND OBJECTIVES OF THE FOLLOW-UP EMERGENCY FOOD SECURITY ASSESSMENT IN THE KYRGYZ REPUBLIC
1.1 – Kyrgyz Republic: context and changes since January 2011
Following its contraction by 2.6% in 2010 due to economic and political disturbances, GDP grew by 5.7% in 2011 as a result of robust gains in all sectors, including agriculture. However, growth declined for the first two months of 2012 due to reduced mining outputs. The agricultural sector showed growth of 2.3% in 2011. Total agricultural production in 2011 was
2 http://europeandcis.undp.org/senioreconomist/show/4C6CE453-F203-1EE9-B8F4D17A02B45C12
3 “In 2012, the average salary of a Kyrgyz citizen increases to KGS 11,316‖
(http://eng.24.kg/business/2012/04/19/23943.html), accessed on 29 April 2012 4 ―Spring field works in Kyrgyzstan began with delay of 20-25 days - Minister Janybekov‖
(http://www.akipress.com/_en_news.php?id=111581), accessed on 29 April, 2012
Emergency Food Security Assessment (EFSA) March 2012
4
at 144.8 billion Kyrgyz Som (KGS), or US$ 3.15 billion, compared to KGS 113.5 billion, or
US$ 2.47 billion in 20105.
Consumer price inflation slowed to 0.2% year-on-year change in March 2012. In the same month, an 8.3% deflation (year-on-year) in food prices was reported
6, demonstrating a
decrease of prices for wheat flour (33%) and potatoes (47%). However, the prices for meat increased 13% during this period, and dairy and eggs 18% and 7% respectively
7.
Furthermore, the 8.5% increase in natural gas prices in January 2012 (over December 2011) was followed by an additional 0.4% rise in tariffs (against January 2012) in February. This added to the burden on vulnerable households‘ budgets.
Total foreign trade turnover in January 2012 grew at a steady rate reaching nearly US$ 450.6 billion. In January 2011 this figure was only at US$ 409.4 billion, reflecting the post-conflict rehabilitation period and a slowdown in trade.
Exports in 2011 were at US$ 2,239.8 million, while imports were at US$ 4,248.8 million.8 This
was higher than forecasts - exports for 2011 were anticipated at US$ 1,925 million and
imports at US$ 3,570 million.9
The national currency, the Kyrgyz Som, continued to depreciate against the US Dollar,
although at a much slower pace (by 0.3% in 201110
, compared with 6% in 2010 and 11% in
2009)11
due to the return of relative political and economic stability.
However, remittances from Kyrgyz labour migrants abroad grew an impressive 33% in January-November 2011 compared to the same period of 2010 and reached US$ 1.5
billion12
. Remittance inflows accounted for 27% of GDP in 2010. .
The official unemployment rate in January 2012 was down 5.4% compared to a year ago and the figure of registered unemployment was 2.5% out of the total economically active
population.13
1.2 – Rationale for the follow-up assessment and objectives
At the request of the Kyrgyz Government, WFP started conducting household food security analyses in the Kyrgyz Republic in 2008 following a harsh winter and crisis-level prices for food and fuel. The food security situation was then periodically updated using data collected each trimester by the government Kyrgyz Integrated Household Survey (KIHS). In July 2010, WFP conducted a rapid EFSA in Osh and Jalalabad cities and surrounding areas to estimate
the impact of the June civil violence on the food security of the affected population14
. At the
end of July 2010, WFP undertook a nation-wide EFSA to evaluate the food security situation of the population and inform rapid decision-making on food assistance interventions, without waiting for KIHS data that would only be available several months later. This EFSA enabled a subsequent comparison with KIHS data even though slightly different food consumption and economic access indicators were used.
The EFSAs undertaken in March and August 2011 provided updated information on household food security to capture changes in household food security and coping
5
http://www.thefreelibrary.com/Finance+Ministry+forecasts+6.6%25+GDP+growth+in+Kyrgyzstan+in+2012.-a0265852038 6 Official data by National Statistics Committee
7 WFP food price monitoring
8 Food Security and Poverty Information Bulletin, 4
th quarter 2011, National Statistics Committee in
Kyrgyz Republic 9 Ministry of Economic Regulation, September 2011 10 Interstate Statistical Committee of the Commonwealth of Independent States, www.cisstat.kg 11Kyrgyzstan Country Report, February 2011. Economist Intelligence Unit. 12
United Nations Development Programme, Office of the Senior Economist, ―Fast facts‖ from Kyrgyzstan‘s official socio-economic data. January 11, 2012.
13 Food Security and Poverty Information Bulletin, 1
st quarter 2012, National Statistics Committee in
Kyrgyz Republic 14
Rapid Emergency Food Security Assessment in Osh and Jalalabad, Kyrgyz Republic. World Food Programme, July 2010.
Emergency Food Security Assessment (EFSA) March 2012
5
mechanisms compared to 2010, reflecting (i) the pre-harvest summer and post-harvest winter periods, (ii) increased food prices, and (iii) the lingering effects of the June violence on the economy and livelihoods.
The current follow-up EFSA was undertaken to compare food security trends since August 2010, and March and August 2011.
II – METHODOLOGY
In the survey and throughout the report, a ‗household‘ is defined as a group of individuals who live together and share food and income resources. Households are considered separate ‗units‘ if they do not share these resources, even if they live under the same roof.
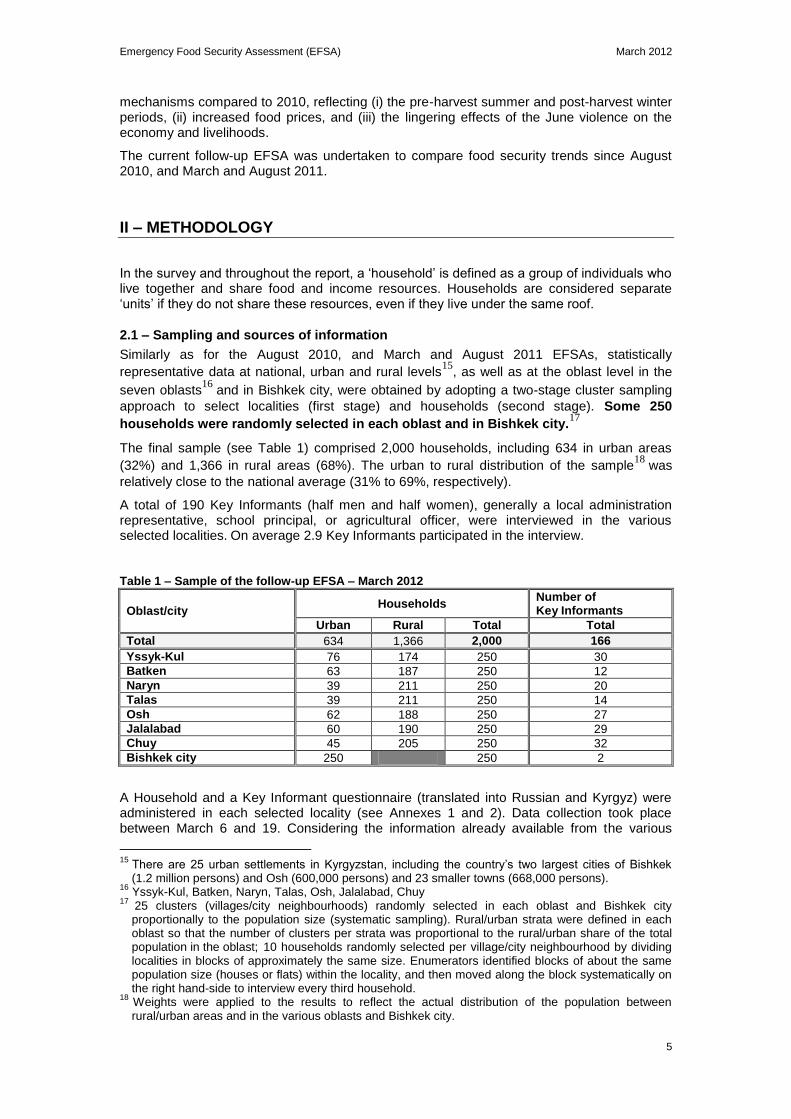
2.1 – Sampling and sources of information
Similarly as for the August 2010, and March and August 2011 EFSAs, statistically
representative data at national, urban and rural levels15
, as well as at the oblast level in the
seven oblasts16
and in Bishkek city, were obtained by adopting a two-stage cluster sampling
approach to select localities (first stage) and households (second stage). Some 250
households were randomly selected in each oblast and in Bishkek city.17
The final sample (see Table 1) comprised 2,000 households, including 634 in urban areas
(32%) and 1,366 in rural areas (68%). The urban to rural distribution of the sample18
was
relatively close to the national average (31% to 69%, respectively).
A total of 190 Key Informants (half men and half women), generally a local administration representative, school principal, or agricultural officer, were interviewed in the various selected localities. On average 2.9 Key Informants participated in the interview.
Table 1 – Sample of the follow-up EFSA – March 2012
Oblast/city Households
Number of Key Informants
Urban Rural Total Total
Total 634 1,366 2,000 166
Yssyk-Kul 76 174 250 30
Batken 63 187 250 12
Naryn 39 211 250 20
Talas 39 211 250 14
Osh 62 188 250 27
Jalalabad 60 190 250 29
Chuy 45 205 250 32
Bishkek city 250 250 2
A Household and a Key Informant questionnaire (translated into Russian and Kyrgyz) were administered in each selected locality (see Annexes 1 and 2). Data collection took place between March 6 and 19. Considering the information already available from the various
15
There are 25 urban settlements in Kyrgyzstan, including the country‘s two largest cities of Bishkek (1.2 million persons) and Osh (600,000 persons) and 23 smaller towns (668,000 persons).
16 Yssyk-Kul, Batken, Naryn, Talas, Osh, Jalalabad, Chuy
17 25 clusters (villages/city neighbourhoods) randomly selected in each oblast and Bishkek city proportionally to the population size (systematic sampling). Rural/urban strata were defined in each oblast so that the number of clusters per strata was proportional to the rural/urban share of the total population in the oblast; 10 households randomly selected per village/city neighbourhood by dividing localities in blocks of approximately the same size. Enumerators identified blocks of about the same population size (houses or flats) within the locality, and then moved along the block systematically on the right hand-side to interview every third household.
18 Weights were applied to the results to reflect the actual distribution of the population between rural/urban areas and in the various oblasts and Bishkek city.
Emergency Food Security Assessment (EFSA) March 2012
6
KIHS updates and Post-Distribution Monitoring (PDM) surveys undertaken by WFP and its partners after food distributions in several oblasts, as well as from the August 2010, March and August 2011 EFSAs, data collection was limited to essential information needed to understand changes in household food security and coping capacities. Data was collected on demographics, livelihoods (income sources, food sources, and main expenditures), ownership of assets, food consumption patterns, food stocks, coping strategies, access to assistance, and priorities.
Key Informants were interviewed on the locality‘s population, main livelihoods, markets access and prices, access to services (health, education), main shocks, vulnerable groups and priorities.
A Kyrgyz company, (SIAR), was contracted to: (i) identify enumerators, (ii) collect, enter and clean the data, and (iii) process output tables with the support of WFP. WFP trained the supervisors and enumerators, prepared the Plan of Analysis, and analysed and interpreted the data.
Comparisons were made between 1) urban and rural areas, 2) oblasts, and 3) food security groups.
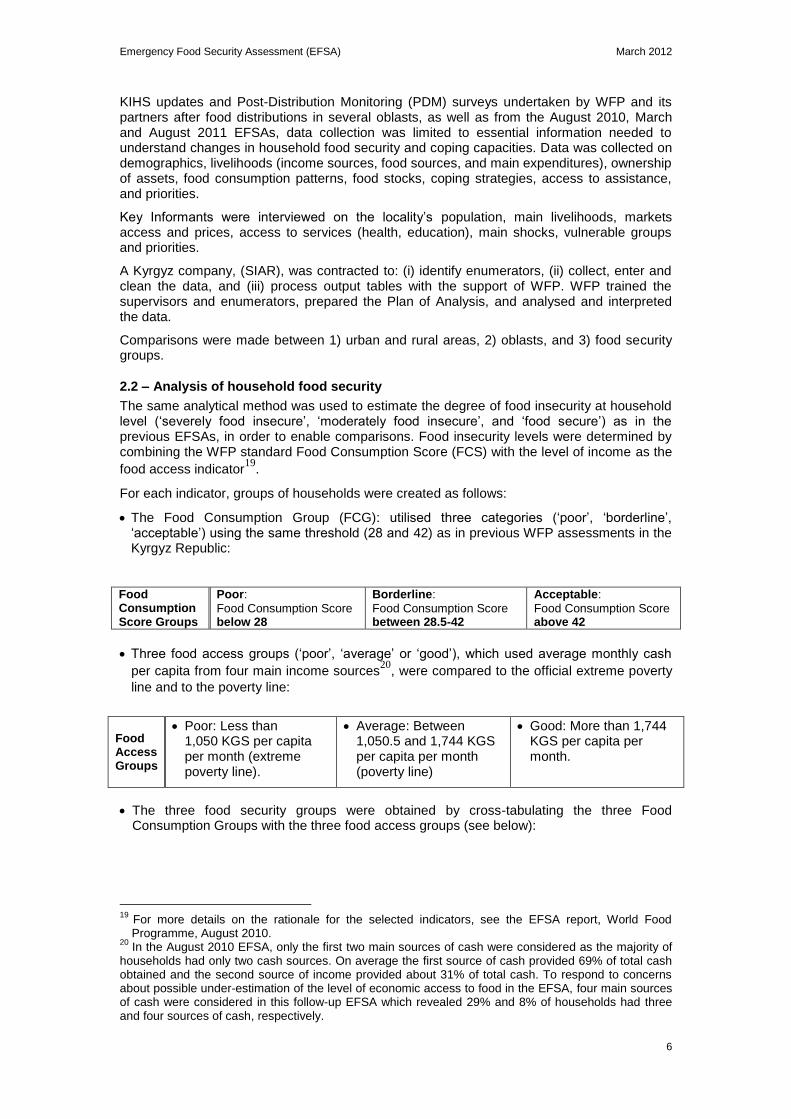
2.2 – Analysis of household food security
The same analytical method was used to estimate the degree of food insecurity at household level (‗severely food insecure‘, ‗moderately food insecure‘, and ‗food secure‘) as in the previous EFSAs, in order to enable comparisons. Food insecurity levels were determined by combining the WFP standard Food Consumption Score (FCS) with the level of income as the
food access indicator19
.
For each indicator, groups of households were created as follows:
The Food Consumption Group (FCG): utilised three categories (‗poor‘, ‗borderline‘, ‗acceptable‘) using the same threshold (28 and 42) as in previous WFP assessments in the Kyrgyz Republic:
Food Consumption Score Groups
Poor:
Food Consumption Score below 28
Borderline:
Food Consumption Score between 28.5-42
Acceptable:
Food Consumption Score above 42
Three food access groups (‗poor‘, ‗average‘ or ‗good‘), which used average monthly cash
per capita from four main income sources20
, were compared to the official extreme poverty
line and to the poverty line:
Food Access Groups
Poor: Less than 1,050 KGS per capita per month (extreme poverty line).
Average: Between 1,050.5 and 1,744 KGS per capita per month (poverty line)
Good: More than 1,744 KGS per capita per month.
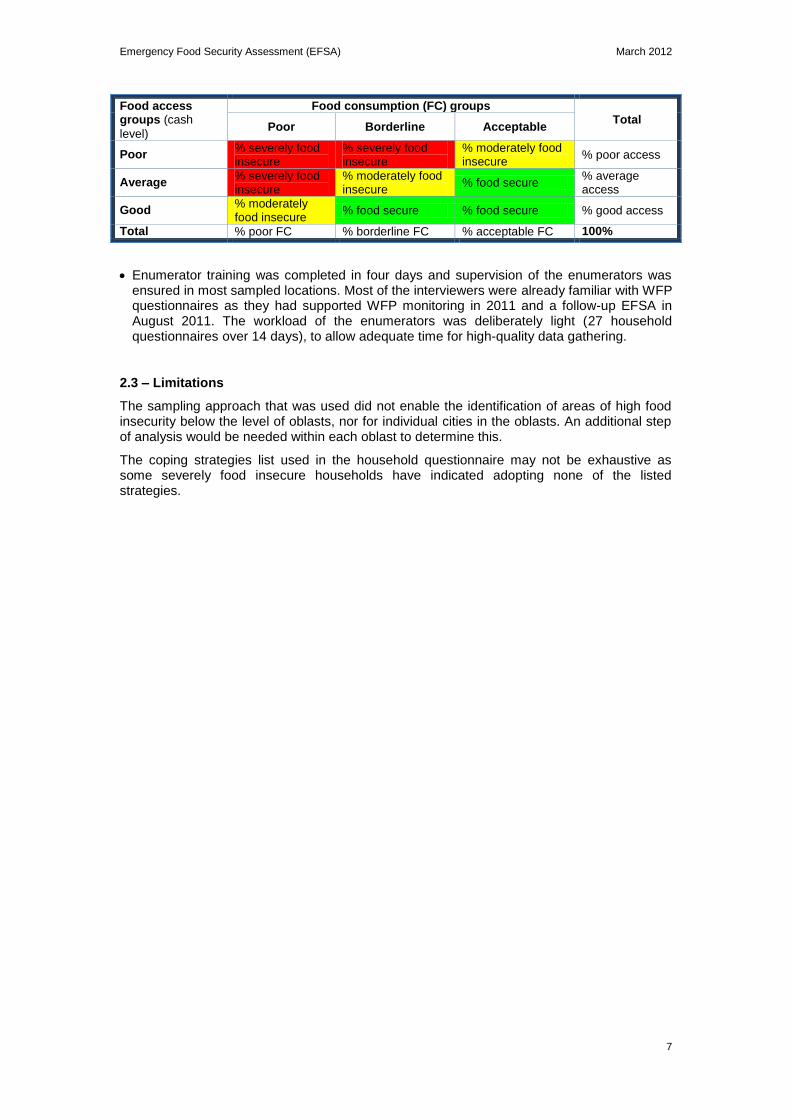
The three food security groups were obtained by cross-tabulating the three Food Consumption Groups with the three food access groups (see below):
19
For more details on the rationale for the selected indicators, see the EFSA report, World Food Programme, August 2010.
20 In the August 2010 EFSA, only the first two main sources of cash were considered as the majority of
households had only two cash sources. On average the first source of cash provided 69% of total cash obtained and the second source of income provided about 31% of total cash. To respond to concerns about possible under-estimation of the level of economic access to food in the EFSA, four main sources of cash were considered in this follow-up EFSA which revealed 29% and 8% of households had three and four sources of cash, respectively.
Emergency Food Security Assessment (EFSA) March 2012
7
Food access groups (cash
level)
Food consumption (FC) groups Total
Poor Borderline Acceptable
Poor % severely food insecure
% severely food insecure
% moderately food insecure
% poor access
Average % severely food insecure
% moderately food insecure
% food secure % average access
Good % moderately food insecure
% food secure % food secure % good access
Total % poor FC % borderline FC % acceptable FC 100%
Enumerator training was completed in four days and supervision of the enumerators was ensured in most sampled locations. Most of the interviewers were already familiar with WFP questionnaires as they had supported WFP monitoring in 2011 and a follow-up EFSA in August 2011. The workload of the enumerators was deliberately light (27 household questionnaires over 14 days), to allow adequate time for high-quality data gathering.
2.3 – Limitations
The sampling approach that was used did not enable the identification of areas of high food insecurity below the level of oblasts, nor for individual cities in the oblasts. An additional step of analysis would be needed within each oblast to determine this.
The coping strategies list used in the household questionnaire may not be exhaustive as some severely food insecure households have indicated adopting none of the listed strategies.
Emergency Food Security Assessment (EFSA) March 2012
8
17 15
7 9
34
59
24
27
0
10
20
30
40
50
60
August March August March
2010 2011 2012
Figure 2: Evolution of food insecurity (%, urban vs. rural areas)
Urban Rural
III – RESULTS
3.1 – Household food security
3.1.1 – Proportion of food insecurity
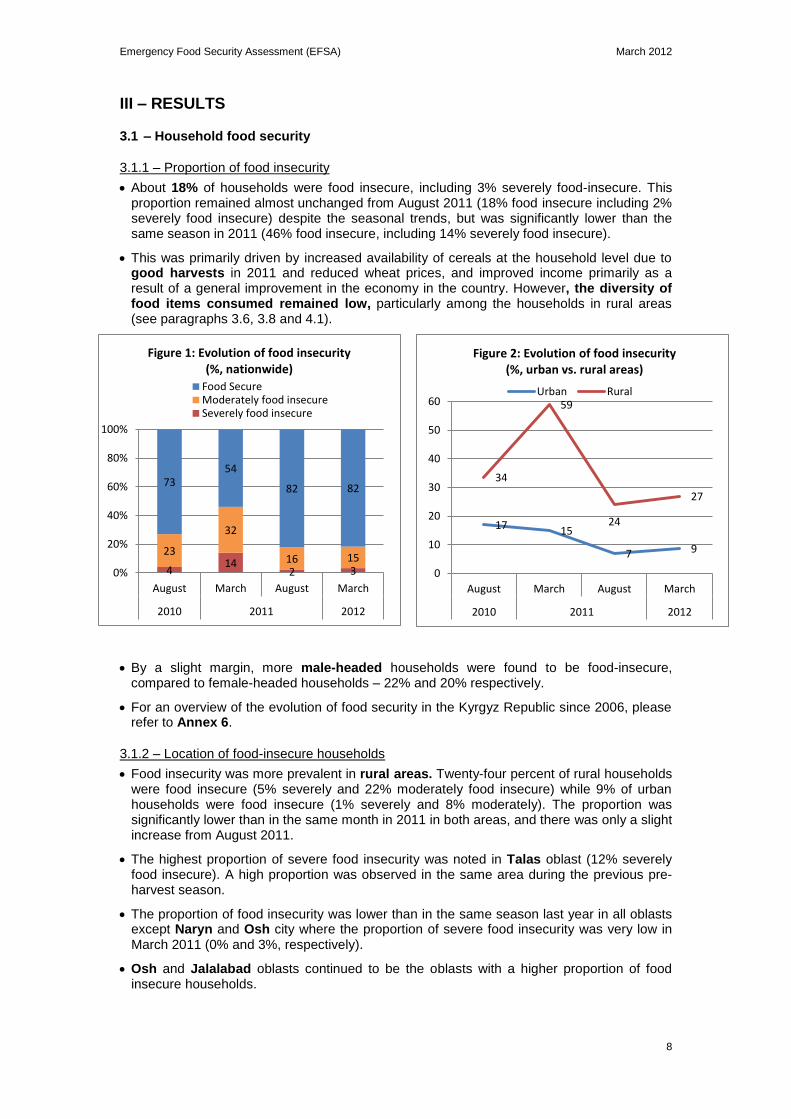
About 18% of households were food insecure, including 3% severely food-insecure. This proportion remained almost unchanged from August 2011 (18% food insecure including 2% severely food insecure) despite the seasonal trends, but was significantly lower than the same season in 2011 (46% food insecure, including 14% severely food insecure).
This was primarily driven by increased availability of cereals at the household level due to good harvests in 2011 and reduced wheat prices, and improved income primarily as a result of a general improvement in the economy in the country. However, the diversity of food items consumed remained low, particularly among the households in rural areas (see paragraphs 3.6, 3.8 and 4.1).
By a slight margin, more male-headed households were found to be food-insecure, compared to female-headed households – 22% and 20% respectively.
For an overview of the evolution of food security in the Kyrgyz Republic since 2006, please refer to Annex 6.
3.1.2 – Location of food-insecure households
Food insecurity was more prevalent in rural areas. Twenty-four percent of rural households were food insecure (5% severely and 22% moderately food insecure) while 9% of urban households were food insecure (1% severely and 8% moderately). The proportion was significantly lower than in the same month in 2011 in both areas, and there was only a slight increase from August 2011.
The highest proportion of severe food insecurity was noted in Talas oblast (12% severely food insecure). A high proportion was observed in the same area during the previous pre-harvest season.
The proportion of food insecurity was lower than in the same season last year in all oblasts except Naryn and Osh city where the proportion of severe food insecurity was very low in March 2011 (0% and 3%, respectively).
Osh and Jalalabad oblasts continued to be the oblasts with a higher proportion of food insecure households.
4 14
2 3
23
32
16 15
73 54
82 82
0%
20%
40%
60%
80%
100%
August March August March
2010 2011 2012
Figure 1: Evolution of food insecurity (%, nationwide)
Food SecureModerately food insecureSeverely food insecure
Emergency Food Security Assessment (EFSA) March 2012
9
4
13
37
17
38
0
20
40
60
80
August March August March
2010 2011 2012
Figure 3: Evolution of food security (%, northern provinces)
Bishkek Chyi Naryn
Issyk-Kul Talas
24
22 14
0
20
40
60
80
August March August March
2010 2011 2012
Figure 4: Evolution of food security (%, southern provinces)
Osh Jalalabad Batken
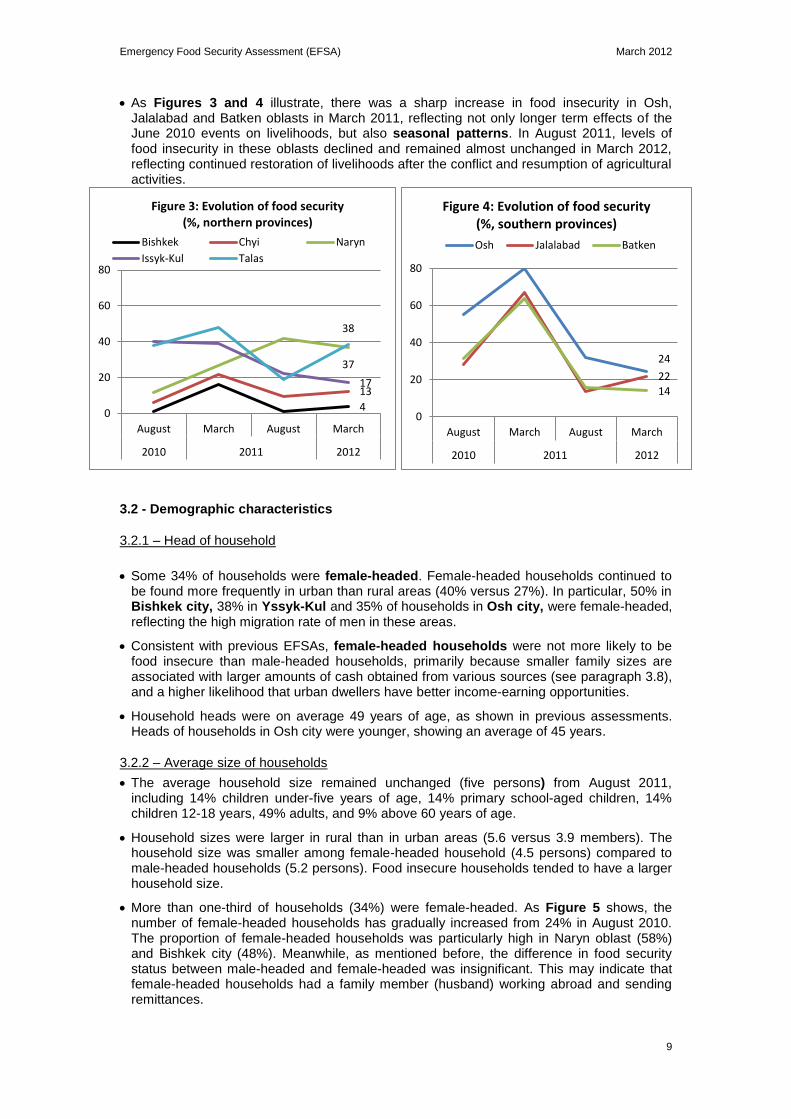
As Figures 3 and 4 illustrate, there was a sharp increase in food insecurity in Osh, Jalalabad and Batken oblasts in March 2011, reflecting not only longer term effects of the June 2010 events on livelihoods, but also seasonal patterns. In August 2011, levels of food insecurity in these oblasts declined and remained almost unchanged in March 2012, reflecting continued restoration of livelihoods after the conflict and resumption of agricultural activities.
3.2 - Demographic characteristics
3.2.1 – Head of household
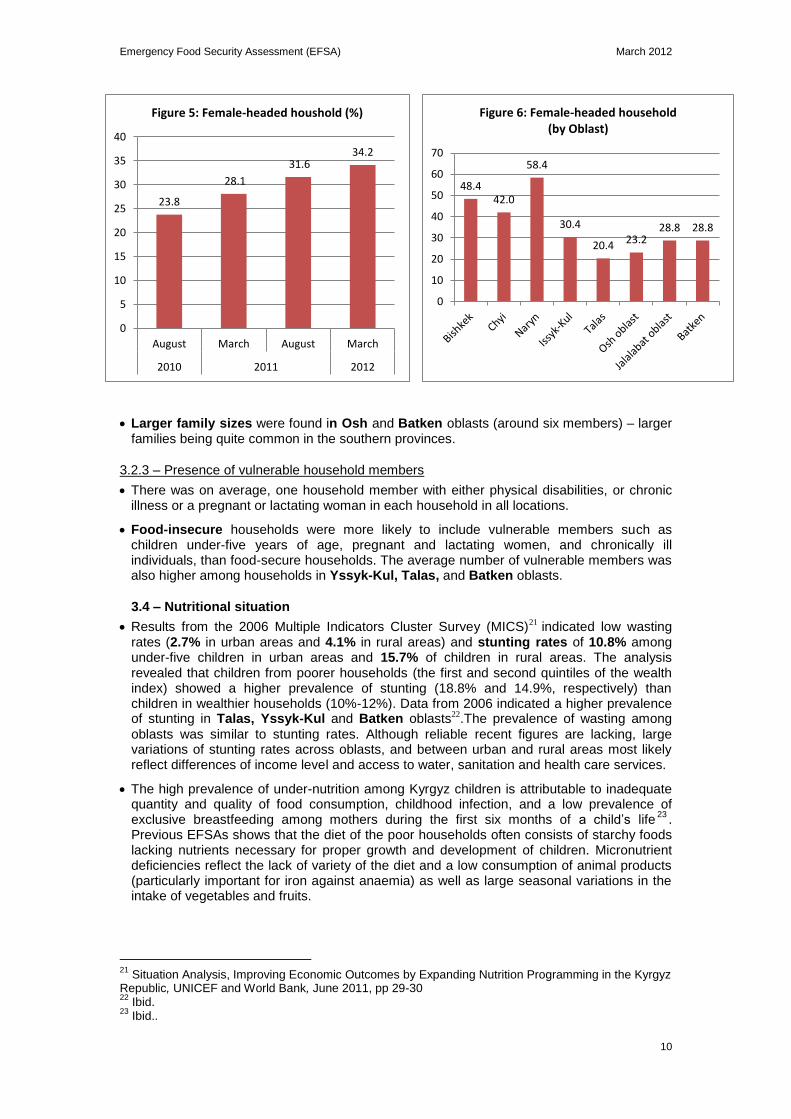
Some 34% of households were female-headed. Female-headed households continued to be found more frequently in urban than rural areas (40% versus 27%). In particular, 50% in Bishkek city, 38% in Yssyk-Kul and 35% of households in Osh city, were female-headed, reflecting the high migration rate of men in these areas.
Consistent with previous EFSAs, female-headed households were not more likely to be food insecure than male-headed households, primarily because smaller family sizes are associated with larger amounts of cash obtained from various sources (see paragraph 3.8), and a higher likelihood that urban dwellers have better income-earning opportunities.
Household heads were on average 49 years of age, as shown in previous assessments. Heads of households in Osh city were younger, showing an average of 45 years.
3.2.2 – Average size of households
The average household size remained unchanged (five persons) from August 2011, including 14% children under-five years of age, 14% primary school-aged children, 14% children 12-18 years, 49% adults, and 9% above 60 years of age.
Household sizes were larger in rural than in urban areas (5.6 versus 3.9 members). The household size was smaller among female-headed household (4.5 persons) compared to male-headed households (5.2 persons). Food insecure households tended to have a larger household size.
More than one-third of households (34%) were female-headed. As Figure 5 shows, the number of female-headed households has gradually increased from 24% in August 2010. The proportion of female-headed households was particularly high in Naryn oblast (58%) and Bishkek city (48%). Meanwhile, as mentioned before, the difference in food security status between male-headed and female-headed was insignificant. This may indicate that female-headed households had a family member (husband) working abroad and sending remittances.
Emergency Food Security Assessment (EFSA) March 2012
10
23.8
28.1
31.6 34.2
0
5
10
15
20
25
30
35
40
August March August March
2010 2011 2012
Figure 5: Female-headed houshold (%)
Larger family sizes were found in Osh and Batken oblasts (around six members) – larger families being quite common in the southern provinces.
3.2.3 – Presence of vulnerable household members
There was on average, one household member with either physical disabilities, or chronic illness or a pregnant or lactating woman in each household in all locations.
Food-insecure households were more likely to include vulnerable members such as children under-five years of age, pregnant and lactating women, and chronically ill individuals, than food-secure households. The average number of vulnerable members was also higher among households in Yssyk-Kul, Talas, and Batken oblasts.
3.4 – Nutritional situation
Results from the 2006 Multiple Indicators Cluster Survey (MICS)21 indicated low wasting rates (2.7% in urban areas and 4.1% in rural areas) and stunting rates of 10.8% among under-five children in urban areas and 15.7% of children in rural areas. The analysis revealed that children from poorer households (the first and second quintiles of the wealth index) showed a higher prevalence of stunting (18.8% and 14.9%, respectively) than children in wealthier households (10%-12%). Data from 2006 indicated a higher prevalence of stunting in Talas, Yssyk-Kul and Batken oblasts22.The prevalence of wasting among
oblasts was similar to stunting rates. Although reliable recent figures are lacking, large variations of stunting rates across oblasts, and between urban and rural areas most likely reflect differences of income level and access to water, sanitation and health care services.
The high prevalence of under-nutrition among Kyrgyz children is attributable to inadequate quantity and quality of food consumption, childhood infection, and a low prevalence of exclusive breastfeeding among mothers during the first six months of a child‘s life
23.
Previous EFSAs shows that the diet of the poor households often consists of starchy foods lacking nutrients necessary for proper growth and development of children. Micronutrient deficiencies reflect the lack of variety of the diet and a low consumption of animal products (particularly important for iron against anaemia) as well as large seasonal variations in the intake of vegetables and fruits.
21
Situation Analysis, Improving Economic Outcomes by Expanding Nutrition Programming in the Kyrgyz Republic, UNICEF and World Bank, June 2011, pp 29-30 22
Ibid. 23
Ibid..
48.4 42.0
58.4
30.4
20.4 23.2 28.8 28.8
0
10
20
30
40
50
60
70
Figure 6: Female-headed household (by Oblast)
Emergency Food Security Assessment (EFSA) March 2012
11
At the same time, micronutrient deficiencies and anaemia in particular are significant problems among young children and women. According to a 2008 UNICEF
24 survey in
Talas oblast, over 50% of children between 6-24 months of age and 25% of mothers were anaemic. A nutrition assessment conducted in September 2010 among the populations affected by the conflict in June 2010, indicated that anaemia had risen by 4.5% among children under-five since June 2009
25. The most common cause of anaemia is iron
deficiency: according to Micronutrient Initiative26
40% to 60% of the nation‘s 6 to 24 month-old children are iron-deficient.
27
The low proportion of exclusively breast-fed children of 40.7% at three months of age, and 31.5% at six months of age28, and relatively late introduction of semi-solid food at nine months, 49.3%29, also contributes to both stunting and micronutrient deficiencies. UNICEF is supporting the Ministry of Health with a nation-wide campaign to improve diet during pregnancy, as well as breastfeeding and complementary feeding practices. A pilot programme of micronutrient powder distribution (sprinkles) has also started in Talas oblast, after the MICS study found the highest prevalence of stunting in the Talas region (27% prevalence of stunting among children under-five)
30, with plans for expansion into other
oblasts.
Under-nutrition in the Kyrgyz Republic remains a significant public health challenge and claims the lives of more than 1,500 children under five years of age annually. It constitutes 22% of all under-five deaths in the country
31.
3.5 – Access to education services
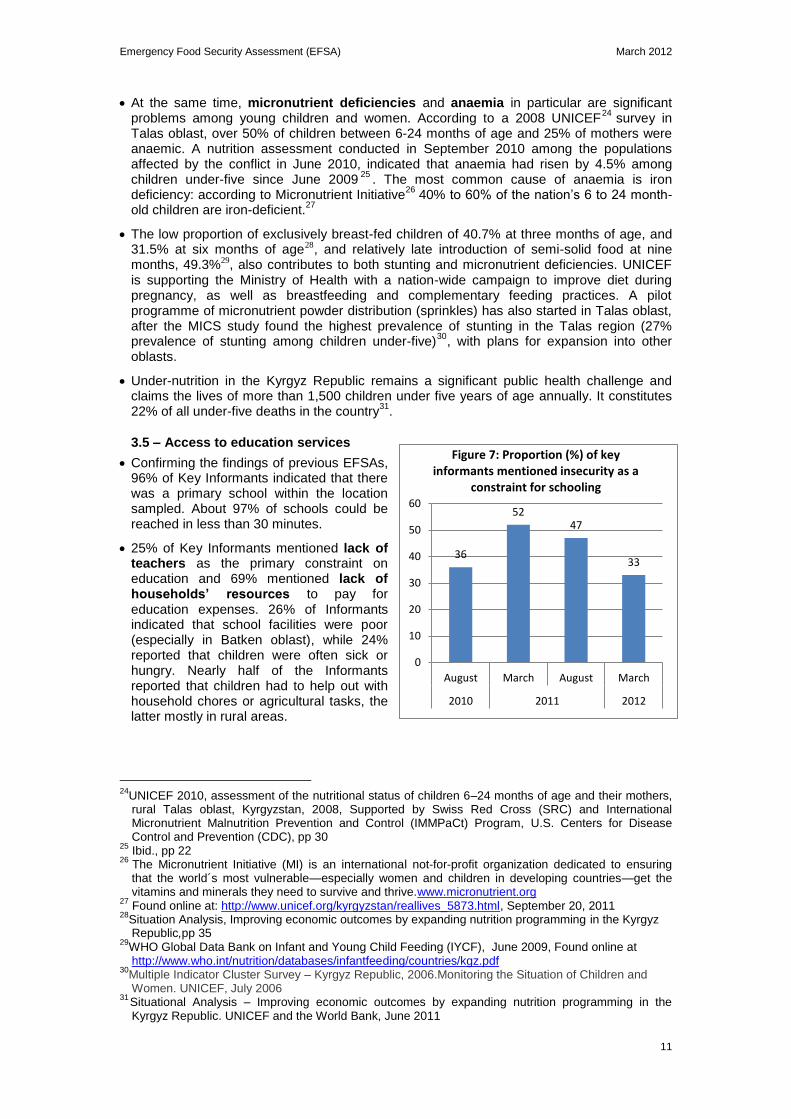
Confirming the findings of previous EFSAs, 96% of Key Informants indicated that there was a primary school within the location sampled. About 97% of schools could be reached in less than 30 minutes.
25% of Key Informants mentioned lack of teachers as the primary constraint on education and 69% mentioned lack of households’ resources to pay for education expenses. 26% of Informants indicated that school facilities were poor (especially in Batken oblast), while 24% reported that children were often sick or hungry. Nearly half of the Informants reported that children had to help out with household chores or agricultural tasks, the latter mostly in rural areas.
24
UNICEF 2010, assessment of the nutritional status of children 6–24 months of age and their mothers, rural Talas oblast, Kyrgyzstan, 2008, Supported by Swiss Red Cross (SRC) and International Micronutrient Malnutrition Prevention and Control (IMMPaCt) Program, U.S. Centers for Disease Control and Prevention (CDC), pp 30
25 Ibid., pp 22
26 The Micronutrient Initiative (MI) is an international not-for-profit organization dedicated to ensuring that the world´s most vulnerable—especially women and children in developing countries—get the vitamins and minerals they need to survive and thrive.www.micronutrient.org
27 Found online at: http://www.unicef.org/kyrgyzstan/reallives_5873.html, September 20, 2011
28Situation Analysis, Improving economic outcomes by expanding nutrition programming in the Kyrgyz Republic,pp 35
29WHO Global Data Bank on Infant and Young Child Feeding (IYCF), June 2009, Found online at http://www.who.int/nutrition/databases/infantfeeding/countries/kgz.pdf
30Multiple Indicator Cluster Survey – Kyrgyz Republic, 2006.Monitoring the Situation of Children and Women. UNICEF, July 2006
31Situational Analysis – Improving economic outcomes by expanding nutrition programming in the Kyrgyz Republic. UNICEF and the World Bank, June 2011
36
52 47
33
0
10
20
30
40
50
60
August March August March
2010 2011 2012
Figure 7: Proportion (%) of key informants mentioned insecurity as a
constraint for schooling
Emergency Food Security Assessment (EFSA) March 2012
12
33% of Key Informants mentioned insecurity as a constraint for education. As Figure 7 shows, this is much lower than August 2011 (47%) or March 2011 (52%), indicating relatively improved security in communities.
The vast majority of children had been enrolled into school. Half of those who had not been enrolled belonged to moderately food-insecure households. As in March 2011 and August 2011, the main reason for non-enrolment was the lack of money for school-related expenditures.
3.6 – Food consumption and stocks
3.6.1 – Number of daily meals
As in August 2010, March 2011 and August 2011, almost all households ate more than three meals per day, with no statistically significant differences observed according to the food security status and the gender of the head of household. Rural households tended to eat more frequently (3.4 meals per day) than urban households (3.1 meals per day).
3.6.3 – Food consumption patterns
As explained in paragraph 2.2, food consumption was analysed by looking at the frequency and diversity of food items consumed during the seven days prior to the interview. Three FCGs were created using standard FCS thresholds (see Box 1).
Box 1 – Food consumption groups and patterns
Poor food consumption patterns: a diet likely to be insufficient in kilocalories and grossly lacking
vitamins and minerals to meet the nutritional requirements of an average household member. Typically this diet consists of daily cereals, oil and sugar, with minimal consumption of animal products, beans/peas, vegetables and fruits. It entails serious risks of malnutrition and diseases if consumed in the medium and longer term, especially for young children, pregnant and lactating women, and the elderly.
Borderline food consumption patterns: a diet that probably contains sufficient kilocalories but
remains insufficiently diversified to provide the essential vitamins and minerals. This diet is characterized by regular consumption of cereals, beans/peas, oil and sugar, and intake of animal products, vegetables and fruits 2-3 times a week. The deficiency in micronutrients causes particularly risks of chronic malnutrition and anaemia.
Good food consumption patterns: a diet with sufficient variety and frequency of weekly
consumption to broadly meet the nutritional requirements of an average household member.
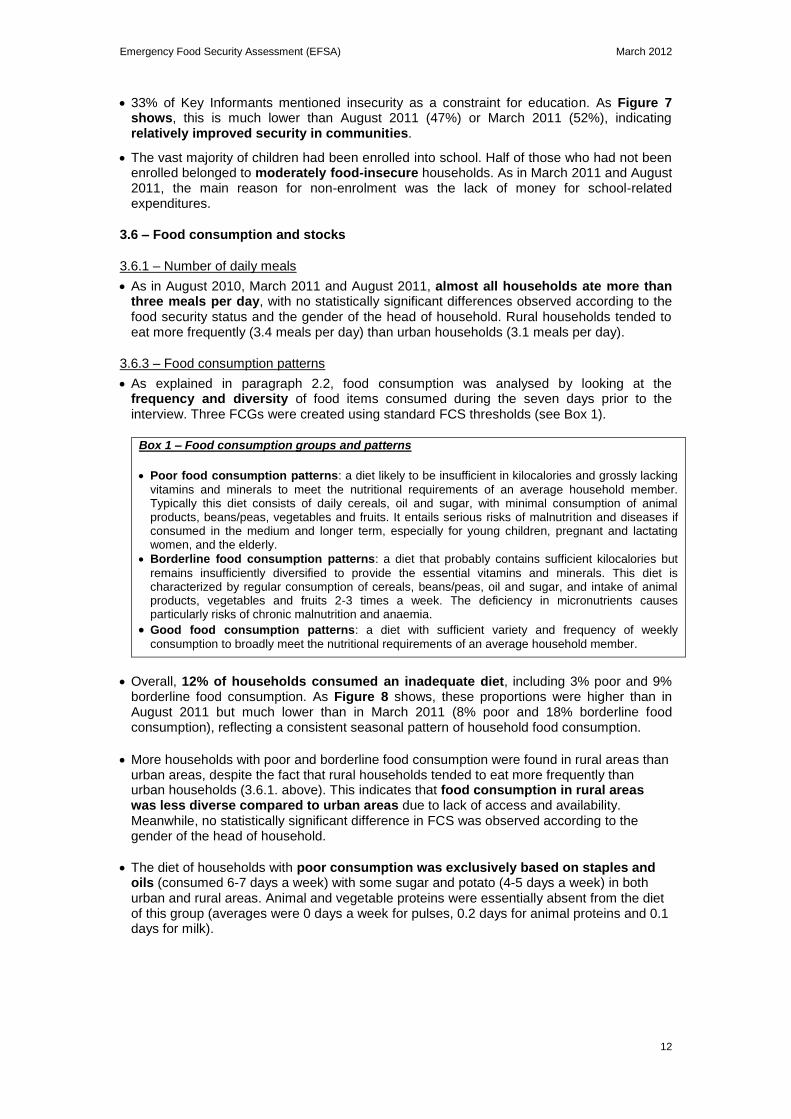
Overall, 12% of households consumed an inadequate diet, including 3% poor and 9% borderline food consumption. As Figure 8 shows, these proportions were higher than in August 2011 but much lower than in March 2011 (8% poor and 18% borderline food consumption), reflecting a consistent seasonal pattern of household food consumption.
More households with poor and borderline food consumption were found in rural areas than urban areas, despite the fact that rural households tended to eat more frequently than urban households (3.6.1. above). This indicates that food consumption in rural areas was less diverse compared to urban areas due to lack of access and availability. Meanwhile, no statistically significant difference in FCS was observed according to the gender of the head of household.
The diet of households with poor consumption was exclusively based on staples and oils (consumed 6-7 days a week) with some sugar and potato (4-5 days a week) in both urban and rural areas. Animal and vegetable proteins were essentially absent from the diet of this group (averages were 0 days a week for pulses, 0.2 days for animal proteins and 0.1 days for milk).
Emergency Food Security Assessment (EFSA) March 2012
13
The households with borderline consumption ate cereals, oils and sugar on a daily basis. Dairy products were consumed 1-3 days a week but consumption of meat, pulses and vegetables was still minimal.
The households with acceptable food consumption ate cereals, oils and sugar on a daily basis and frequently consumed animal proteins. Vegetables and fruits were also significantly present in the diet.
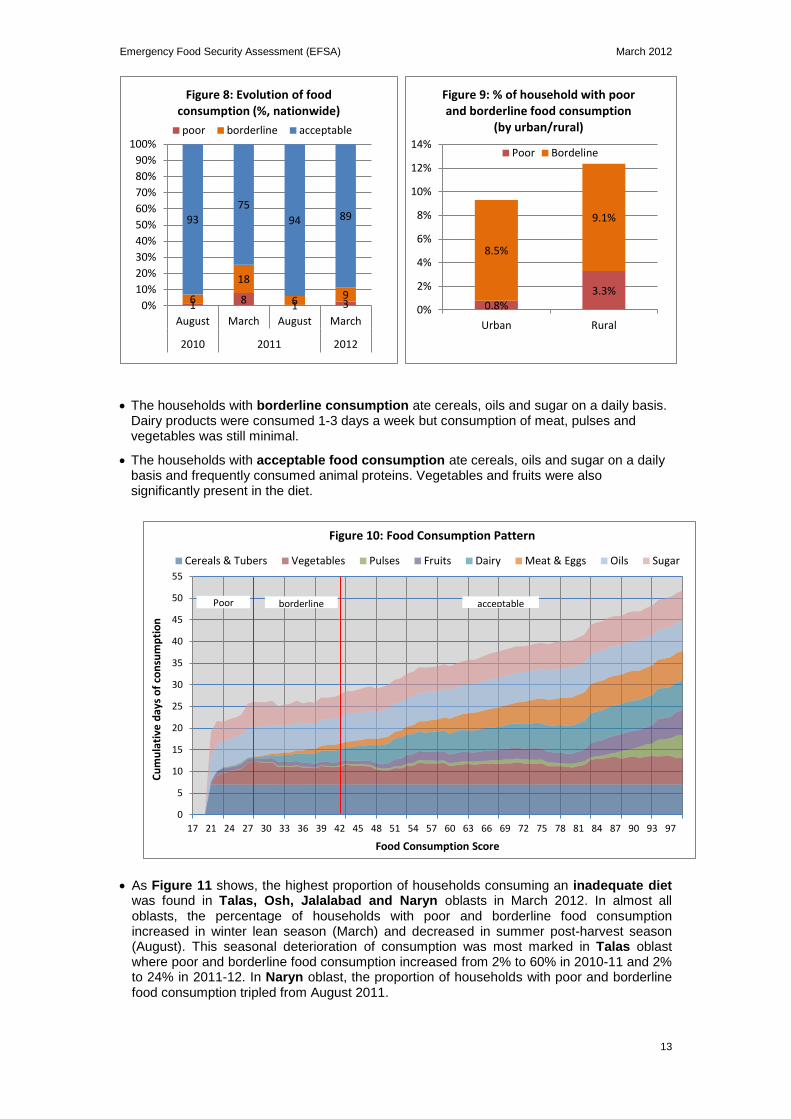
As Figure 11 shows, the highest proportion of households consuming an inadequate diet was found in Talas, Osh, Jalalabad and Naryn oblasts in March 2012. In almost all oblasts, the percentage of households with poor and borderline food consumption increased in winter lean season (March) and decreased in summer post-harvest season (August). This seasonal deterioration of consumption was most marked in Talas oblast where poor and borderline food consumption increased from 2% to 60% in 2010-11 and 2% to 24% in 2011-12. In Naryn oblast, the proportion of households with poor and borderline food consumption tripled from August 2011.
0
5
10
15
20
25
30
35
40
45
50
55
17 21 24 27 30 33 36 39 42 45 48 51 54 57 60 63 66 69 72 75 78 81 84 87 90 93 97
Cu
mu
lati
ve d
ays
of
con
sum
pti
on
Food Consumption Score
Figure 10: Food Consumption Pattern
Cereals & Tubers Vegetables Pulses Fruits Dairy Meat & Eggs Oils Sugar
Poor
0.8% 3.3%
8.5%
9.1%
0%
2%
4%
6%
8%
10%
12%
14%
Urban Rural
Figure 9: % of household with poor and borderline food consumption
(by urban/rural)
Poor Bordeline
1 8 1 3 6
18
6 9
93 75
94 89
0%
10%
20%
30%
40%
50%
60%
70%
80%
90%
100%
August March August March
2010 2011 2012
Figure 8: Evolution of food consumption (%, nationwide)
poor borderline acceptable
borderline acceptable
Emergency Food Security Assessment (EFSA) March 2012
14
The proportion of households consuming an inadequate diet was consistently higher in rural areas than in urban areas. The seasonal deterioration of consumption was also more remarkable in rural areas (Figure 12).
3.6.4 – Food stocks
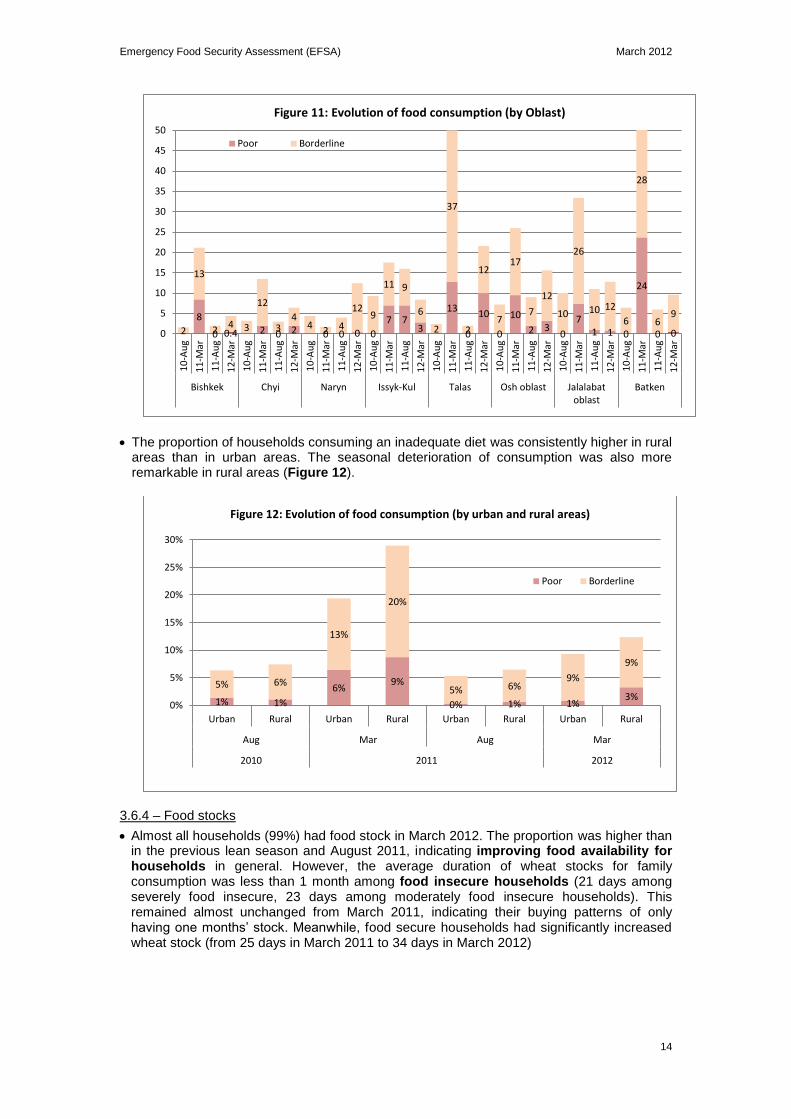
Almost all households (99%) had food stock in March 2012. The proportion was higher than in the previous lean season and August 2011, indicating improving food availability for households in general. However, the average duration of wheat stocks for family consumption was less than 1 month among food insecure households (21 days among severely food insecure, 23 days among moderately food insecure households). This remained almost unchanged from March 2011, indicating their buying patterns of only having one months‘ stock. Meanwhile, food secure households had significantly increased wheat stock (from 25 days in March 2011 to 34 days in March 2012)
8
0 0.4 2 0 2 0 0 0 0
7 7 3
13
0
10
0
10
2 3 0
7 1 1 0
24
0 0 2
13
2 4 3
12
3 4
4 2 4
12 9
11 9
6
2
37
2
12
7
17
7
12
10
26
10 12
6
28
6 9
0
5
10
15
20
25
30
35
40
45
50
10
-Au
g
11
-Mar
11
-Au
g
12
-Mar
10
-Au
g
11
-Mar
11
-Au
g
12
-Mar
10
-Au
g
11
-Mar
11
-Au
g
12
-Mar
10
-Au
g
11
-Mar
11
-Au
g
12
-Mar
10
-Au
g
11
-Mar
11
-Au
g
12
-Mar
10
-Au
g
11
-Mar
11
-Au
g
12
-Mar
10
-Au
g
11
-Mar
11
-Au
g
12
-Mar
10
-Au
g
11
-Mar
11
-Au
g
12
-Mar
Bishkek Chyi Naryn Issyk-Kul Talas Osh oblast Jalalabatoblast
Batken
Figure 11: Evolution of food consumption (by Oblast)
Poor Borderline
1% 1%
6% 9%
0% 1% 1% 3%
5% 6%
13%
20%
5% 6% 9%
9%
0%
5%
10%
15%
20%
25%
30%
Urban Rural Urban Rural Urban Rural Urban Rural
Aug Mar Aug Mar
2010 2011 2012
Figure 12: Evolution of food consumption (by urban and rural areas)
Poor Borderline
Emergency Food Security Assessment (EFSA) March 2012
15
21 23 25
21
26
34
0
10
20
30
40
Severely foodinsecure
Moderately foodinsecure
Food secure
Figure 14: Duration of wheat stock (days)
2011 March 2012 March
67%
87% 99%
0%
20%
40%
60%
80%
100%
March August March
2011 2012
Figure 13: % of household with food stock
21
40
24
61
47
34
18 18
48
84
39
110 108
29 23
36
0
20
40
60
80
100
120
Bishkek Chyi Naryn Issyk-Kul Talas Osh oblast Jalalabatoblast
Batken
Figure 15: Duration of potato stock (days)
2011 March
2012 March
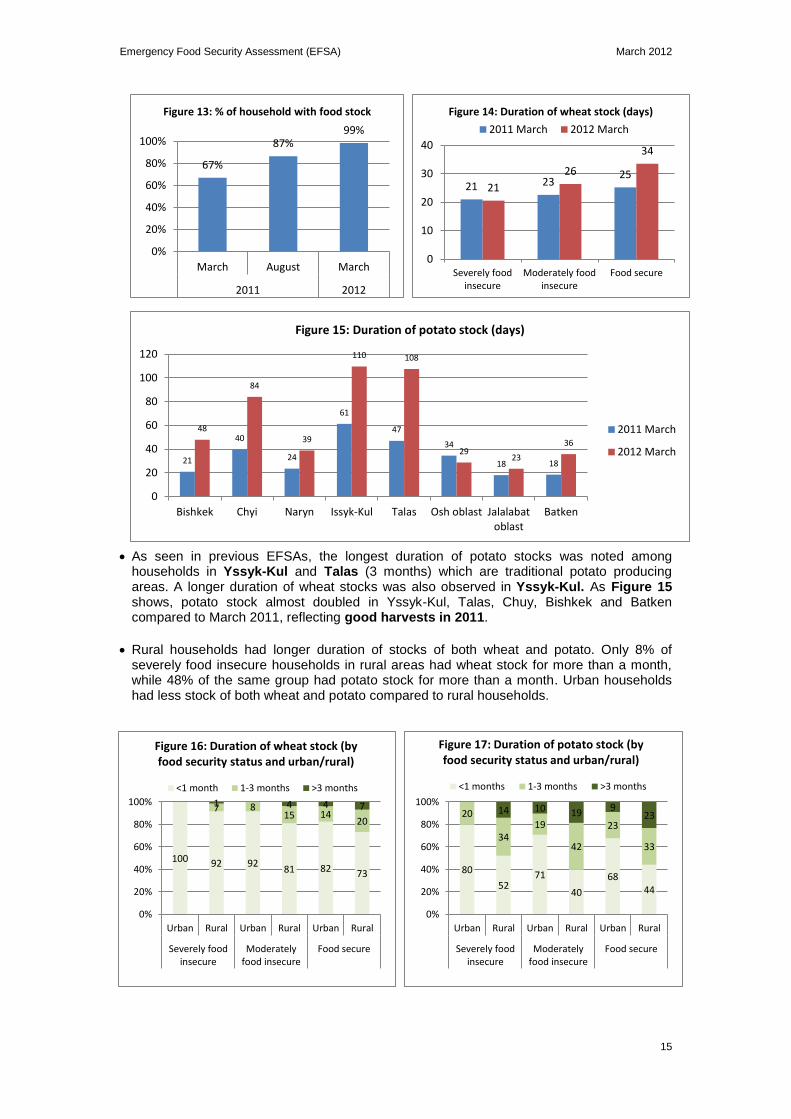
As seen in previous EFSAs, the longest duration of potato stocks was noted among households in Yssyk-Kul and Talas (3 months) which are traditional potato producing areas. A longer duration of wheat stocks was also observed in Yssyk-Kul. As Figure 15 shows, potato stock almost doubled in Yssyk-Kul, Talas, Chuy, Bishkek and Batken compared to March 2011, reflecting good harvests in 2011.
Rural households had longer duration of stocks of both wheat and potato. Only 8% of severely food insecure households in rural areas had wheat stock for more than a month, while 48% of the same group had potato stock for more than a month. Urban households had less stock of both wheat and potato compared to rural households.
100 92 92 81 82 73
7 8 15 14
20
1 4 4 7
0%
20%
40%
60%
80%
100%
Urban Rural Urban Rural Urban Rural
Severely foodinsecure
Moderatelyfood insecure
Food secure
Figure 16: Duration of wheat stock (by food security status and urban/rural)
<1 month 1-3 months >3 months
80
52 71
40
68 44
20
34 19
42
23
33
14 10 19 9
23
0%
20%
40%
60%
80%
100%
Urban Rural Urban Rural Urban Rural
Severely foodinsecure
Moderatelyfood insecure
Food secure
Figure 17: Duration of potato stock (by food security status and urban/rural)
<1 months 1-3 months >3 months
Emergency Food Security Assessment (EFSA) March 2012
16
3.6.5 – Sources of food consumed in the past week
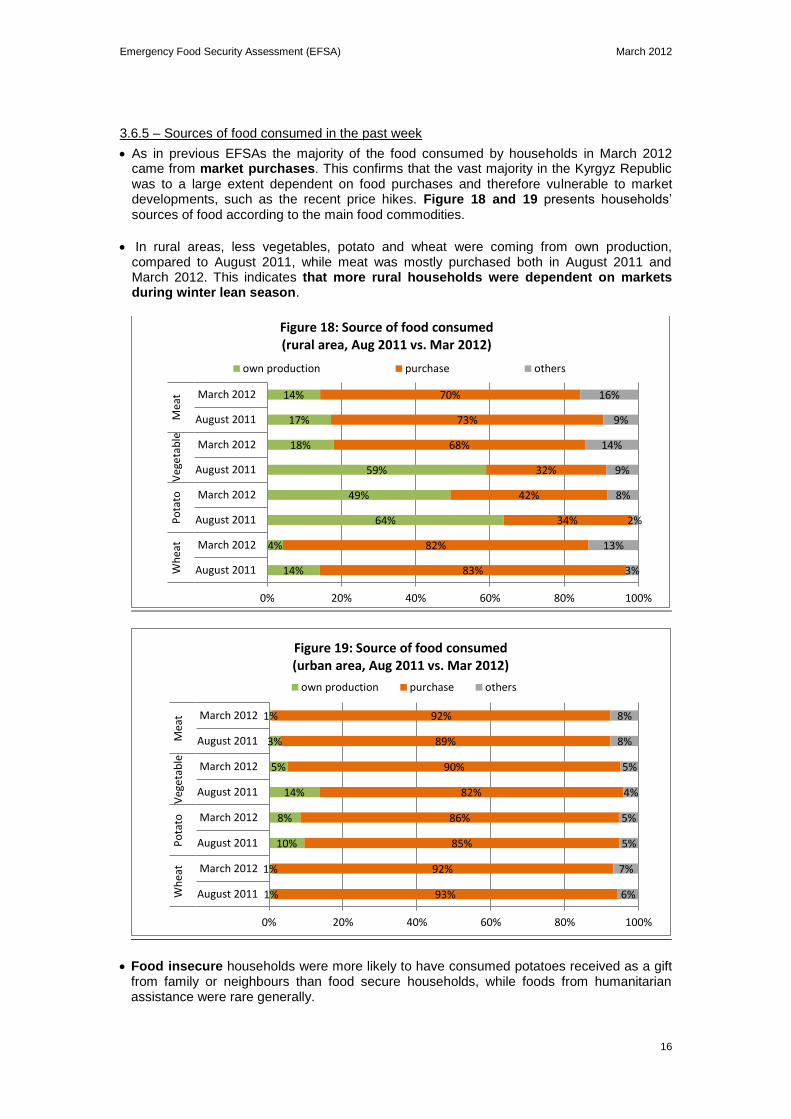
As in previous EFSAs the majority of the food consumed by households in March 2012 came from market purchases. This confirms that the vast majority in the Kyrgyz Republic was to a large extent dependent on food purchases and therefore vulnerable to market developments, such as the recent price hikes. Figure 18 and 19 presents households‘ sources of food according to the main food commodities.
In rural areas, less vegetables, potato and wheat were coming from own production, compared to August 2011, while meat was mostly purchased both in August 2011 and March 2012. This indicates that more rural households were dependent on markets during winter lean season.
Food insecure households were more likely to have consumed potatoes received as a gift from family or neighbours than food secure households, while foods from humanitarian assistance were rare generally.
14%
4%
64%
49%
59%
18%
17%
14%
83%
82%
34%
42%
32%
68%
73%
70%
3%
13%
2%
8%
9%
14%
9%
16%
0% 20% 40% 60% 80% 100%
August 2011
March 2012
August 2011
March 2012
August 2011
March 2012
August 2011
March 2012
Wh
eat
Po
tato
Veg
eta
ble
Mea
t
Figure 18: Source of food consumed (rural area, Aug 2011 vs. Mar 2012)
own production purchase others
1%
1%
10%
8%
14%
5%
3%
1%
93%
92%
85%
86%
82%
90%
89%
92%
6%
7%
5%
5%
4%
5%
8%
8%
0% 20% 40% 60% 80% 100%
August 2011
March 2012
August 2011
March 2012
August 2011
March 2012
August 2011
March 2012
Wh
eat
Po
tato
Veg
eta
ble
Mea
t
Figure 19: Source of food consumed (urban area, Aug 2011 vs. Mar 2012)
own production purchase others
Emergency Food Security Assessment (EFSA) March 2012
17
38%
54%
42%
22%
8%
34%
0%
10%
20%
30%
40%
50%
60%
2007 2008 2009 2010
Figure 20: Trend in poverty rate (northern provinces)
Issyk-kul
Naryn
Talas
Chui
Bishkek
Nationalavg.
45%
42%
34%
0%
10%
20%
30%
40%
50%
60%
2007 2008 2009 2010
Figure 21: Trend in poverty rate (southern provinces)
Batken
Jalalabad
Osh
Nationalavg.
3.7 – Poverty, unemployment and social assistance
The background information on poverty and on the social assistance system in the Kyrgyz Republic and its various components is included in Annex 3.
3.7.1 – Poverty rates
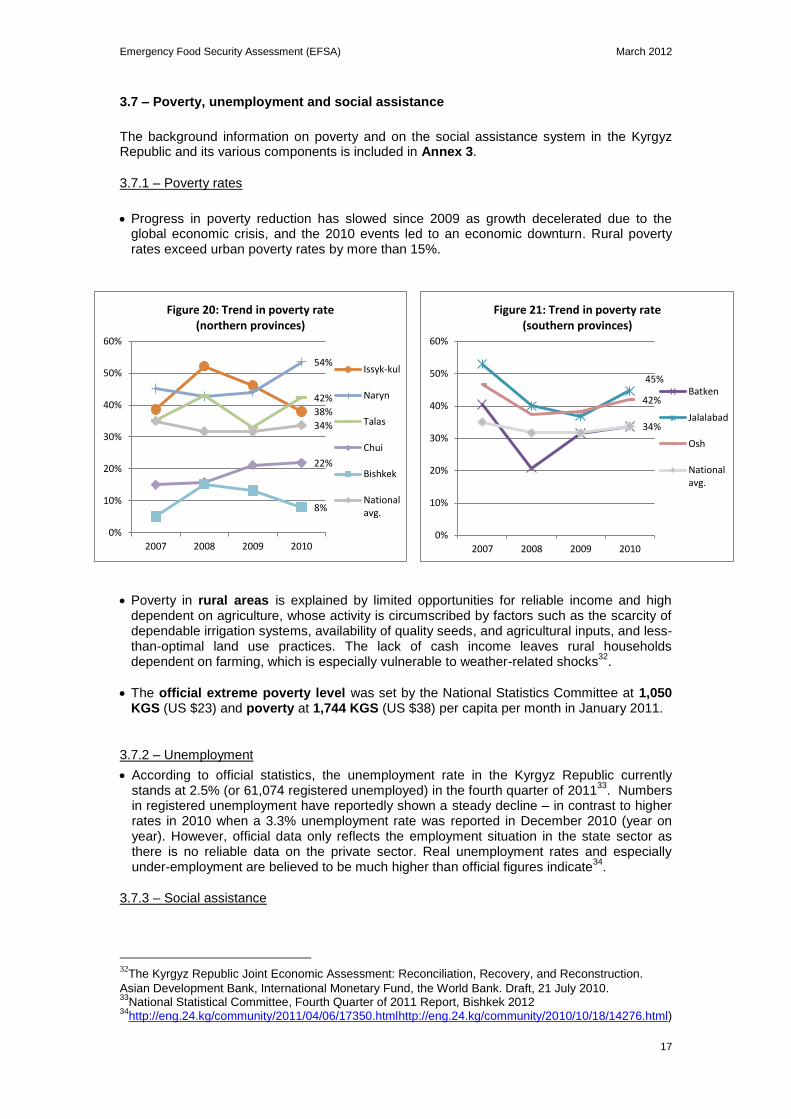
Progress in poverty reduction has slowed since 2009 as growth decelerated due to the global economic crisis, and the 2010 events led to an economic downturn. Rural poverty rates exceed urban poverty rates by more than 15%.
Poverty in rural areas is explained by limited opportunities for reliable income and high dependent on agriculture, whose activity is circumscribed by factors such as the scarcity of dependable irrigation systems, availability of quality seeds, and agricultural inputs, and less-than-optimal land use practices. The lack of cash income leaves rural households dependent on farming, which is especially vulnerable to weather-related shocks
32.
The official extreme poverty level was set by the National Statistics Committee at 1,050 KGS (US $23) and poverty at 1,744 KGS (US $38) per capita per month in January 2011.
3.7.2 – Unemployment
According to official statistics, the unemployment rate in the Kyrgyz Republic currently stands at 2.5% (or 61,074 registered unemployed) in the fourth quarter of 2011
33. Numbers
in registered unemployment have reportedly shown a steady decline – in contrast to higher rates in 2010 when a 3.3% unemployment rate was reported in December 2010 (year on year). However, official data only reflects the employment situation in the state sector as there is no reliable data on the private sector. Real unemployment rates and especially under-employment are believed to be much higher than official figures indicate
34.
3.7.3 – Social assistance
32
The Kyrgyz Republic Joint Economic Assessment: Reconciliation, Recovery, and Reconstruction.
Asian Development Bank, International Monetary Fund, the World Bank. Draft, 21 July 2010. 33
National Statistical Committee, Fourth Quarter of 2011 Report, Bishkek 2012 34
http://eng.24.kg/community/2011/04/06/17350.htmlhttp://eng.24.kg/community/2010/10/18/14276.html)
Emergency Food Security Assessment (EFSA) March 2012
18
The social assistance system35
is composed of: (i) Monthly Benefit (MB) for children of the poorest families; (ii) Monthly Social Benefit (MSB) mainly for the disabled and elderly not eligible for a pension (without any working record); (iii) privileges/compensations for those living in mountainous areas, people with disabilities, war veterans, law enforcement officials, the military, Chernobyl victims, and some other categories; (iv) social services (residential institutions for children, people with disabilities and the elderly); and (v) social insurance (pensions).
Pensions were raised by 12% in May 2011 and by 20% in mid to late 2011, and now amount to KGS 4,172 (US $91) on average per month. Pensions are effective for reducing poverty among the elderly and their extended families, but eligibility is conditional to employment in the formal sector. Nearly half of the workforce is found in the informal sector, and is excluded from the pension scheme. As such, pensions are not targeted to the poor or vulnerable. Yet a recent UNICEF report
36 points out that one of the most decisive factors
of whether a household falls below the poverty line is the presence of a household member entitled to a state pension rather than social benefits.
Many eligible, extremely poor families are excluded from receiving a MSB, which is as low as 370 KGS (US $8) per month after the increases in June/July 2011. Benefits for families who take care of children with disabilities can be comparatively high reaching KGS 3,000 (US $66) per month.
Official survey data37
indicated that only about half of the Kyrgyz Republic‘s social benefits were received by low-income households; this share actually dropped slightly during 2009-2010 (to 50%, down from 52% in 2008). By contrast, the share of social benefits in accrual to upper-income households more than doubled (from 6% to 13%) during 2008-2010.
3.8 – Income, cash sources and cash amount
3.8.1 – Wage trends
According to the National Statistics Committee, the average monthly nominal salary increased by 29.5% in 2011. The real increase (considering the inflation) was 10%
38.
However, despite recent pay increases for some state employees such as teachers, nurses and doctors, the lowest wage and salary levels were still in education, the health sector, agriculture, and the provision of communal and social services.
3.8.2 – Average number of cash-earning members and cash sources
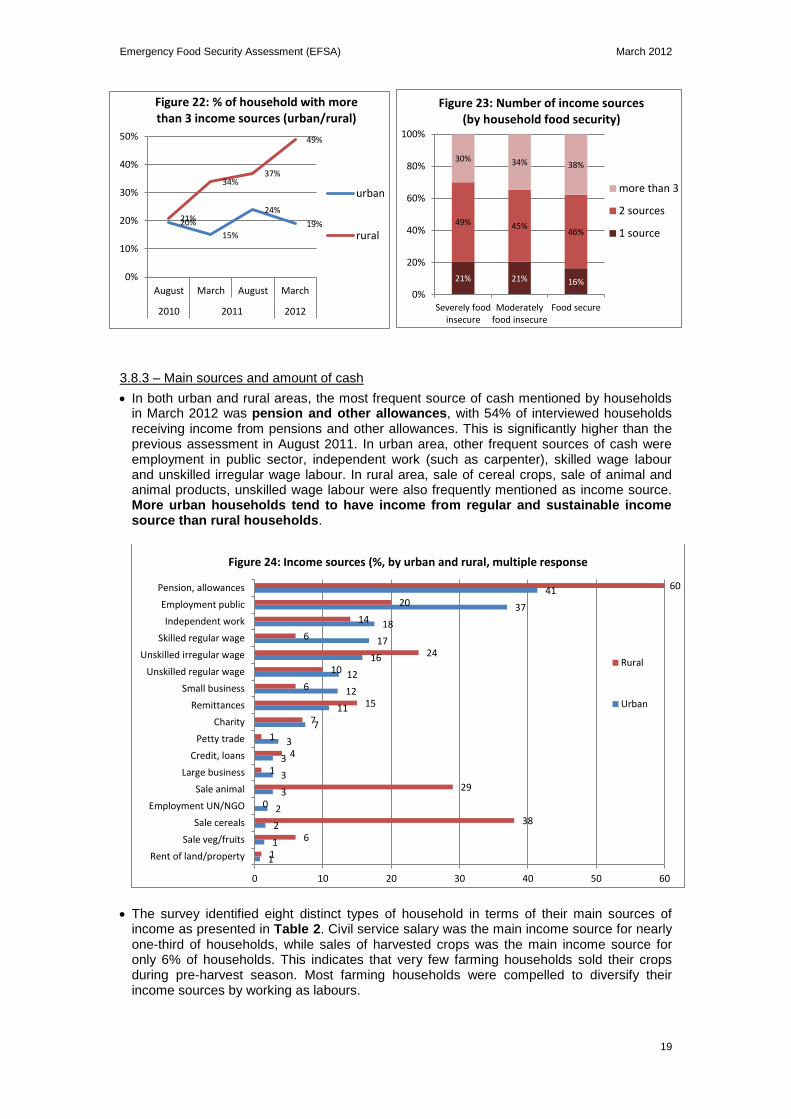
On average two members per household were earning some cash. Households in rural areas were more likely to have a third or fourth source of cash than in urban areas: 49% of rural households had more than three sources of cash compared to 19% of urban households. As Figure 22 shows, the proportion gradually increased in rural areas throughout the previous EFSAs, while urban areas reflected seasonal work opportunities in summer.
As Figure 23 shows, the difference in the number of income sources between food secure and insecure households was not significant. This might indicate low level of remuneration or unreliability of income sources among food insecure households.
35
See Annex 3 for more details on the social assistance system, its components and limitations. 36
UNICEF, Situation Assessment of Children in the Kyrgyz Republic, 2011 37
The National Statistical Committee of the Kyrgyz Republic, Food Security and Poverty Information
Bulletin, 2/2011, July 2011 38
The National Statistical Committee of the Kyrgyz Republic, Food Security and Poverty Information
Bulletin, 1/2012, March 2012
Emergency Food Security Assessment (EFSA) March 2012
19
20%
15%
24%
19% 21%
34% 37%
49%
0%
10%
20%
30%
40%
50%
August March August March
2010 2011 2012
Figure 22: % of household with more than 3 income sources (urban/rural)
urban
rural
21% 21% 16%
49% 45% 46%
30% 34% 38%
0%
20%
40%
60%
80%
100%
Severely foodinsecure
Moderatelyfood insecure
Food secure
Figure 23: Number of income sources (by household food security)
more than 3
2 sources
1 source
3.8.3 – Main sources and amount of cash
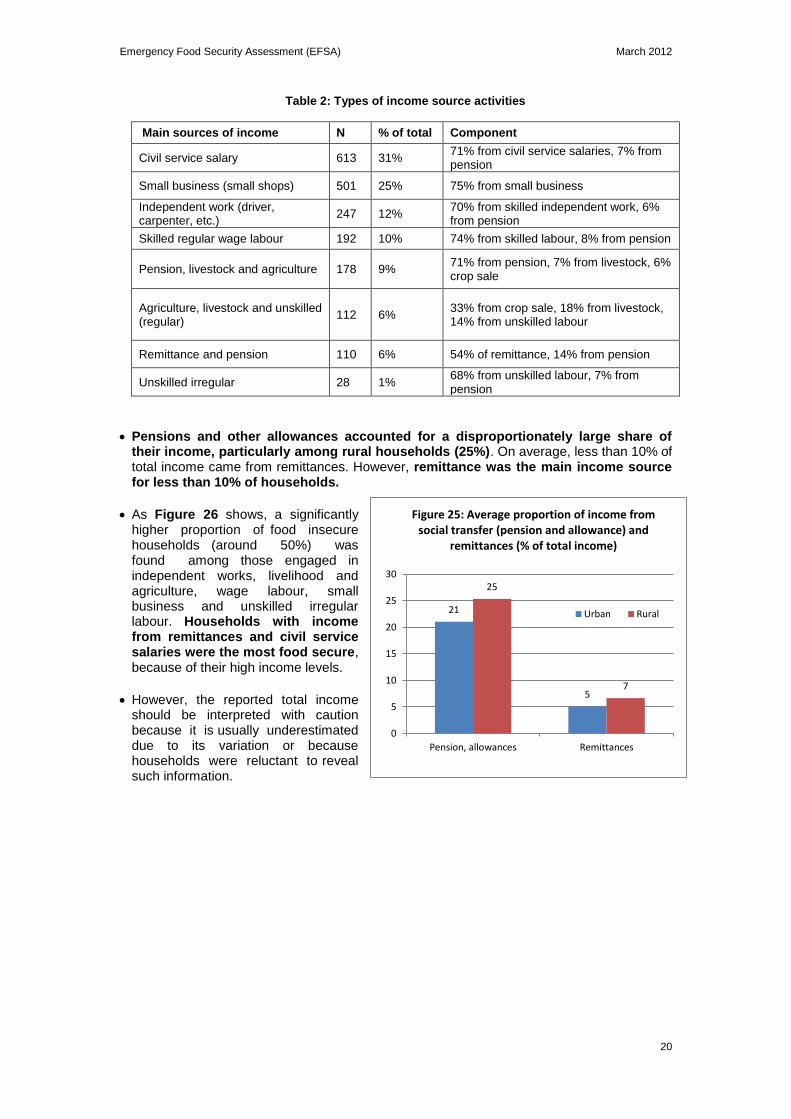
In both urban and rural areas, the most frequent source of cash mentioned by households in March 2012 was pension and other allowances, with 54% of interviewed households receiving income from pensions and other allowances. This is significantly higher than the previous assessment in August 2011. In urban area, other frequent sources of cash were employment in public sector, independent work (such as carpenter), skilled wage labour and unskilled irregular wage labour. In rural area, sale of cereal crops, sale of animal and animal products, unskilled wage labour were also frequently mentioned as income source. More urban households tend to have income from regular and sustainable income source than rural households.
The survey identified eight distinct types of household in terms of their main sources of income as presented in Table 2. Civil service salary was the main income source for nearly one-third of households, while sales of harvested crops was the main income source for only 6% of households. This indicates that very few farming households sold their crops during pre-harvest season. Most farming households were compelled to diversify their income sources by working as labours.
1
1
2
2
3
3
3
3
7
11
12
12
16
17
18
37
41
1
6
38
0
29
1
4
1
7
15
6
10
24
6
14
20
60
0 10 20 30 40 50 60
Rent of land/property
Sale veg/fruits
Sale cereals
Employment UN/NGO
Sale animal
Large business
Credit, loans
Petty trade
Charity
Remittances
Small business
Unskilled regular wage
Unskilled irregular wage
Skilled regular wage
Independent work
Employment public
Pension, allowances
Figure 24: Income sources (%, by urban and rural, multiple response
Rural
Urban
Emergency Food Security Assessment (EFSA) March 2012
20
Table 2: Types of income source activities
Main sources of income N % of total Component
Civil service salary 613 31% 71% from civil service salaries, 7% from pension
Small business (small shops) 501 25% 75% from small business
Independent work (driver, carpenter, etc.)
247 12% 70% from skilled independent work, 6% from pension
Skilled regular wage labour 192 10% 74% from skilled labour, 8% from pension
Pension, livestock and agriculture 178 9% 71% from pension, 7% from livestock, 6% crop sale
Agriculture, livestock and unskilled (regular)
112 6% 33% from crop sale, 18% from livestock, 14% from unskilled labour
Remittance and pension 110 6% 54% of remittance, 14% from pension
Unskilled irregular 28 1% 68% from unskilled labour, 7% from pension
Pensions and other allowances accounted for a disproportionately large share of their income, particularly among rural households (25%). On average, less than 10% of total income came from remittances. However, remittance was the main income source for less than 10% of households.
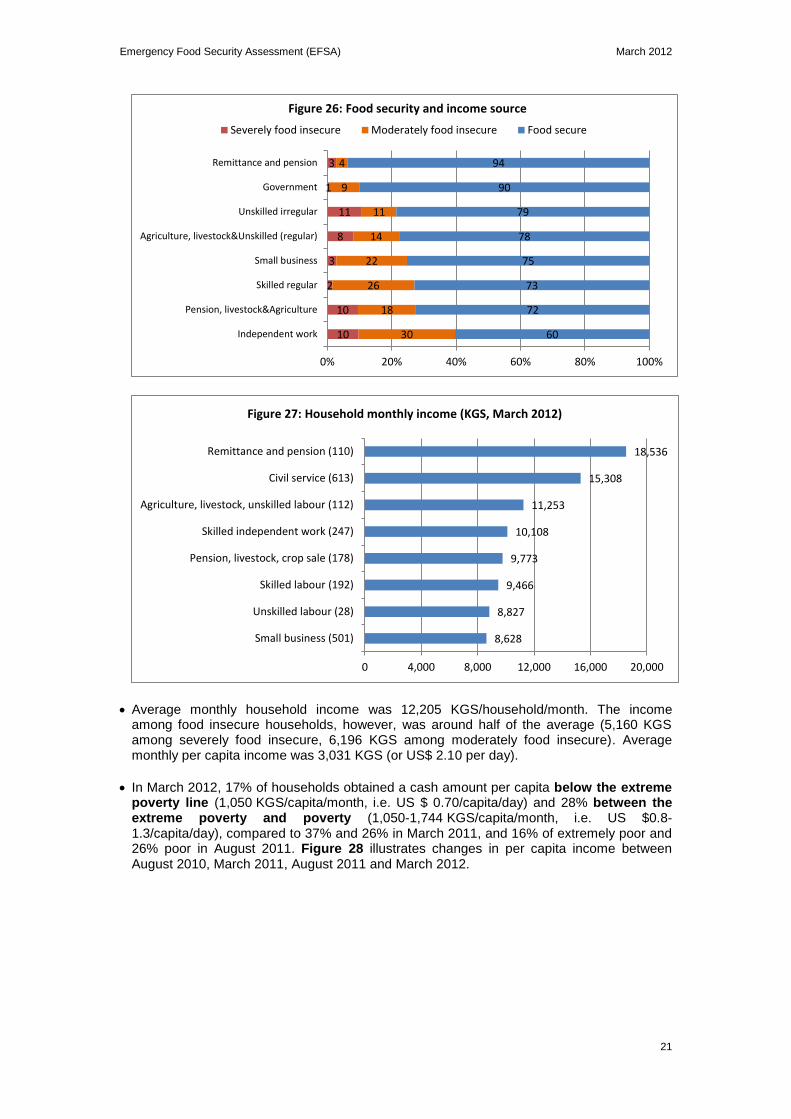
As Figure 26 shows, a significantly higher proportion of food insecure households (around 50%) was found among those engaged in independent works, livelihood and agriculture, wage labour, small business and unskilled irregular labour. Households with income from remittances and civil service salaries were the most food secure, because of their high income levels.
However, the reported total income should be interpreted with caution because it is usually underestimated due to its variation or because households were reluctant to reveal such information.
21
5
25
7
0
5
10
15
20
25
30
Pension, allowances Remittances
Figure 25: Average proportion of income from social transfer (pension and allowance) and
remittances (% of total income)
Urban Rural
Emergency Food Security Assessment (EFSA) March 2012
21
Average monthly household income was 12,205 KGS/household/month. The income among food insecure households, however, was around half of the average (5,160 KGS among severely food insecure, 6,196 KGS among moderately food insecure). Average monthly per capita income was 3,031 KGS (or US$ 2.10 per day).
In March 2012, 17% of households obtained a cash amount per capita below the extreme poverty line (1,050 KGS/capita/month, i.e. US $ 0.70/capita/day) and 28% between the extreme poverty and poverty (1,050-1,744 KGS/capita/month, i.e. US $0.8-1.3/capita/day), compared to 37% and 26% in March 2011, and 16% of extremely poor and 26% poor in August 2011. Figure 28 illustrates changes in per capita income between August 2010, March 2011, August 2011 and March 2012.
10
10
2
3
8
11
1
3
30
18
26
22
14
11
9
4
60
72
73
75
78
79
90
94
0% 20% 40% 60% 80% 100%
Independent work
Pension, livestock&Agriculture
Skilled regular
Small business
Agriculture, livestock&Unskilled (regular)
Unskilled irregular
Government
Remittance and pension
Figure 26: Food security and income source
Severely food insecure Moderately food insecure Food secure
8,628
8,827
9,466
9,773
10,108
11,253
15,308
18,536
0 4,000 8,000 12,000 16,000 20,000
Small business (501)
Unskilled labour (28)
Skilled labour (192)
Pension, livestock, crop sale (178)
Skilled independent work (247)
Agriculture, livestock, unskilled labour (112)
Civil service (613)
Remittance and pension (110)
Figure 27: Household monthly income (KGS, March 2012)
Emergency Food Security Assessment (EFSA) March 2012
22
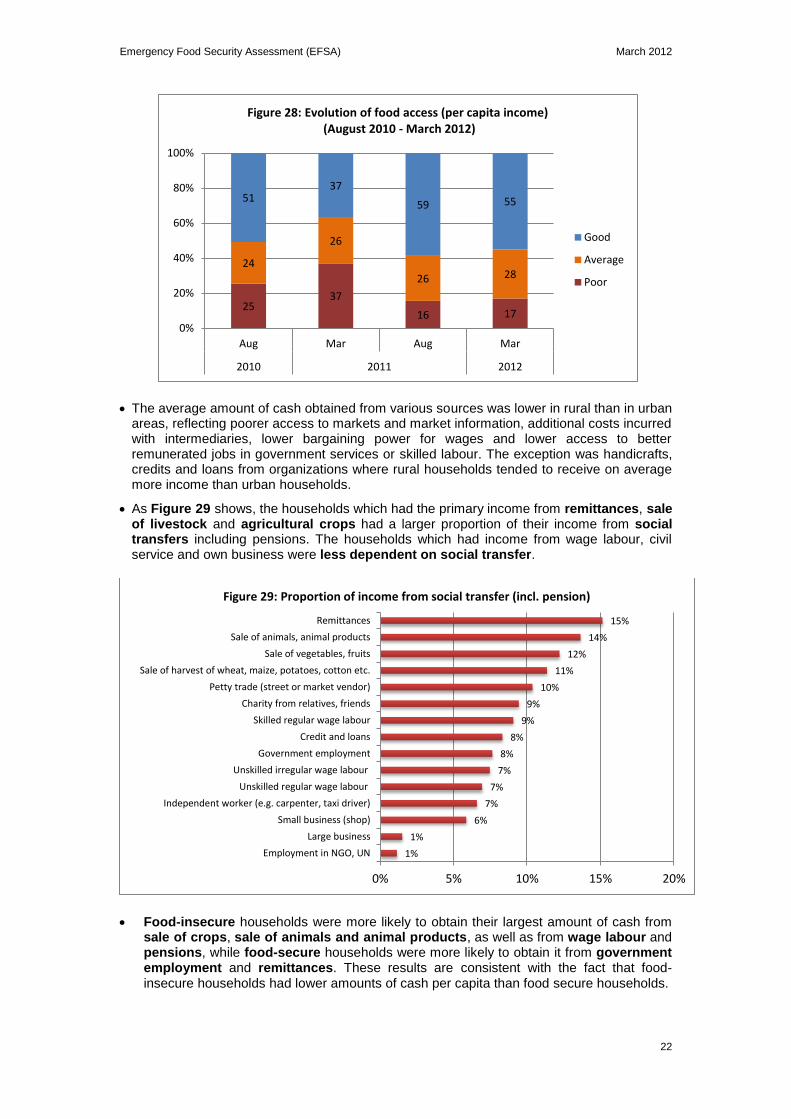
The average amount of cash obtained from various sources was lower in rural than in urban areas, reflecting poorer access to markets and market information, additional costs incurred with intermediaries, lower bargaining power for wages and lower access to better remunerated jobs in government services or skilled labour. The exception was handicrafts, credits and loans from organizations where rural households tended to receive on average more income than urban households.
As Figure 29 shows, the households which had the primary income from remittances, sale of livestock and agricultural crops had a larger proportion of their income from social transfers including pensions. The households which had income from wage labour, civil service and own business were less dependent on social transfer.
Food-insecure households were more likely to obtain their largest amount of cash from sale of crops, sale of animals and animal products, as well as from wage labour and pensions, while food-secure households were more likely to obtain it from government employment and remittances. These results are consistent with the fact that food-insecure households had lower amounts of cash per capita than food secure households.
25 37
16 17
24
26
26 28
51 37
59 55
0%
20%
40%
60%
80%
100%
Aug Mar Aug Mar
2010 2011 2012
Figure 28: Evolution of food access (per capita income) (August 2010 - March 2012)
Good
Average
Poor
1%
1%
6%
7%
7%
7%
8%
8%
9%
9%
10%
11%
12%
14%
15%
0% 5% 10% 15% 20%
Employment in NGO, UN
Large business
Small business (shop)
Independent worker (e.g. carpenter, taxi driver)
Unskilled regular wage labour
Unskilled irregular wage labour
Government employment
Credit and loans
Skilled regular wage labour
Charity from relatives, friends
Petty trade (street or market vendor)
Sale of harvest of wheat, maize, potatoes, cotton etc.
Sale of vegetables, fruits
Sale of animals, animal products
Remittances
Figure 29: Proportion of income from social transfer (incl. pension)
Emergency Food Security Assessment (EFSA) March 2012
23
18 16
30 25
53 59
0%
20%
40%
60%
80%
100%
Male headed Female headed
Figure 30: Food access (per capita income) by gender of household head
Good access (>poverty line)
Average access (extremepoverty<income<poverty line)
Poor access (income<extreme poverty line)
3 11
34
12
31 18 17
10 17 9
15
27
26
26
35 40 44 28
88 74
38
61
43 47 43 46 55
0%
20%
40%
60%
80%
100%
Bishkek Chyi Naryn Issyk-Kul Talas Oshoblast
Jalalabatoblast
Batken Total
Figure 31: Food access (per capita income) by location
Good access(>poverty line)
Average access(extremepoverty<income<poverty line)
Poor access(income<extremepoverty line)
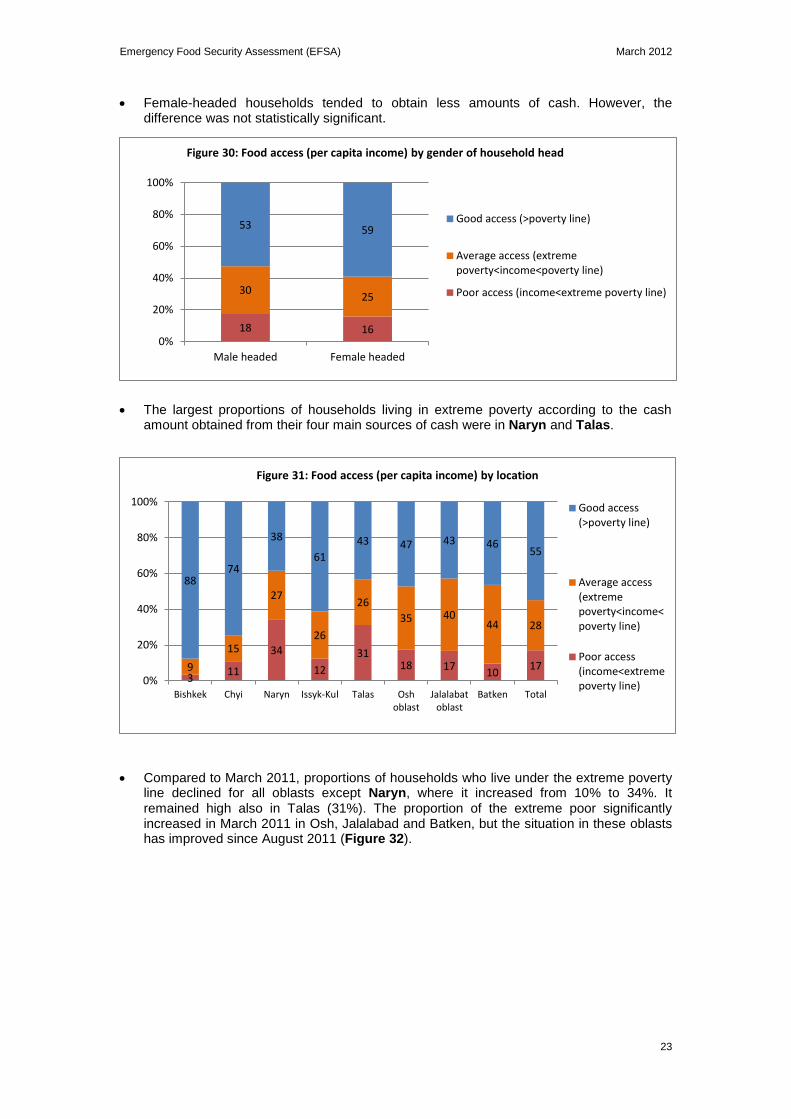
Female-headed households tended to obtain less amounts of cash. However, the difference was not statistically significant.
The largest proportions of households living in extreme poverty according to the cash amount obtained from their four main sources of cash were in Naryn and Talas.
Compared to March 2011, proportions of households who live under the extreme poverty line declined for all oblasts except Naryn, where it increased from 10% to 34%. It remained high also in Talas (31%). The proportion of the extreme poor significantly increased in March 2011 in Osh, Jalalabad and Batken, but the situation in these oblasts has improved since August 2011 (Figure 32).
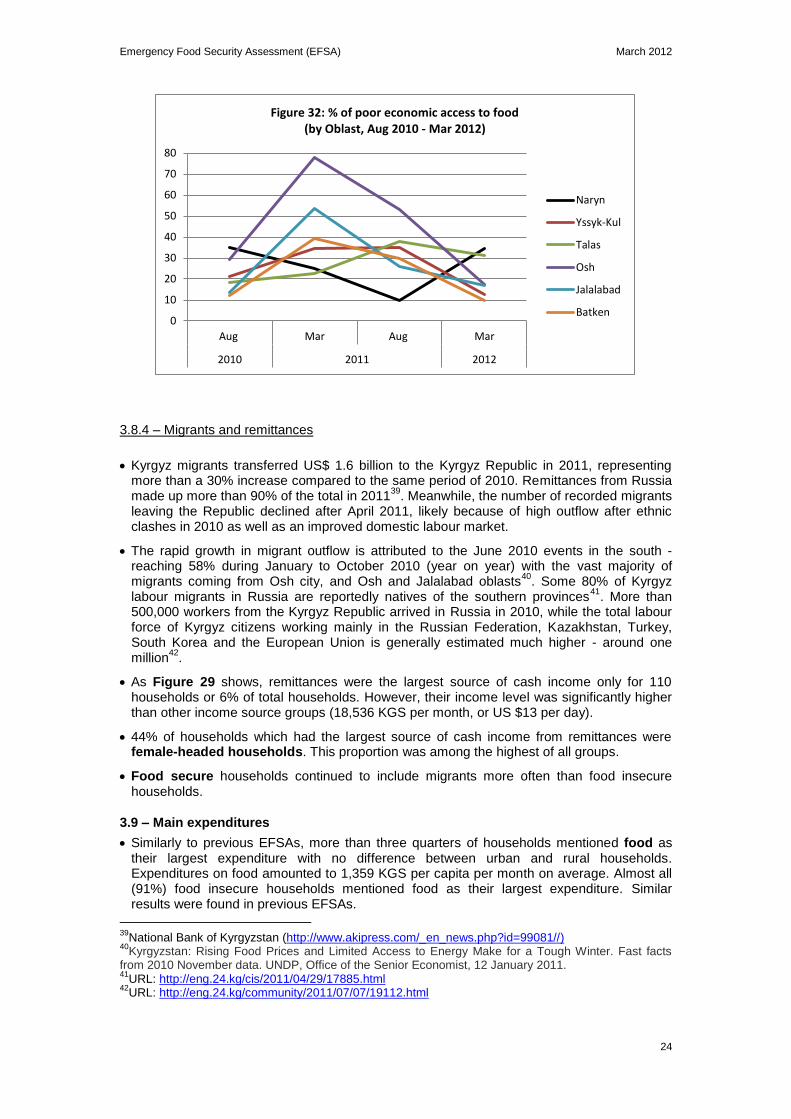
Emergency Food Security Assessment (EFSA) March 2012
24
3.8.4 – Migrants and remittances
Kyrgyz migrants transferred US$ 1.6 billion to the Kyrgyz Republic in 2011, representing more than a 30% increase compared to the same period of 2010. Remittances from Russia made up more than 90% of the total in 2011
39. Meanwhile, the number of recorded migrants
leaving the Republic declined after April 2011, likely because of high outflow after ethnic clashes in 2010 as well as an improved domestic labour market.
The rapid growth in migrant outflow is attributed to the June 2010 events in the south - reaching 58% during January to October 2010 (year on year) with the vast majority of migrants coming from Osh city, and Osh and Jalalabad oblasts
40. Some 80% of Kyrgyz
labour migrants in Russia are reportedly natives of the southern provinces41
. More than 500,000 workers from the Kyrgyz Republic arrived in Russia in 2010, while the total labour force of Kyrgyz citizens working mainly in the Russian Federation, Kazakhstan, Turkey, South Korea and the European Union is generally estimated much higher - around one million
42.
As Figure 29 shows, remittances were the largest source of cash income only for 110 households or 6% of total households. However, their income level was significantly higher than other income source groups (18,536 KGS per month, or US $13 per day).
44% of households which had the largest source of cash income from remittances were female-headed households. This proportion was among the highest of all groups.
Food secure households continued to include migrants more often than food insecure households.
3.9 – Main expenditures
Similarly to previous EFSAs, more than three quarters of households mentioned food as their largest expenditure with no difference between urban and rural households. Expenditures on food amounted to 1,359 KGS per capita per month on average. Almost all (91%) food insecure households mentioned food as their largest expenditure. Similar results were found in previous EFSAs.
39
National Bank of Kyrgyzstan (http://www.akipress.com/_en_news.php?id=99081//) 40
Kyrgyzstan: Rising Food Prices and Limited Access to Energy Make for a Tough Winter. Fast facts from 2010 November data. UNDP, Office of the Senior Economist, 12 January 2011. 41
URL: http://eng.24.kg/cis/2011/04/29/17885.html 42
URL: http://eng.24.kg/community/2011/07/07/19112.html
0
10
20
30
40
50
60
70
80
Aug Mar Aug Mar
2010 2011 2012
Figure 32: % of poor economic access to food (by Oblast, Aug 2010 - Mar 2012)
Naryn
Yssyk-Kul
Talas
Osh
Jalalabad
Batken
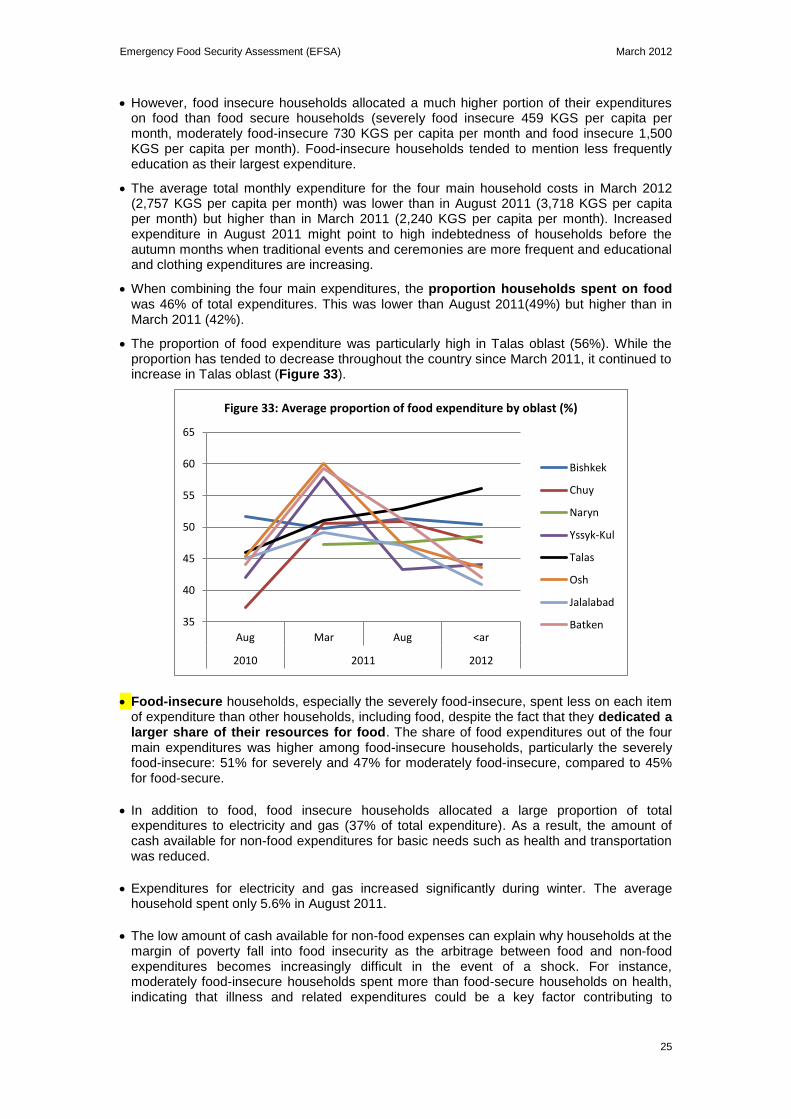
Emergency Food Security Assessment (EFSA) March 2012
25
However, food insecure households allocated a much higher portion of their expenditures on food than food secure households (severely food insecure 459 KGS per capita per month, moderately food-insecure 730 KGS per capita per month and food insecure 1,500 KGS per capita per month). Food-insecure households tended to mention less frequently education as their largest expenditure.
The average total monthly expenditure for the four main household costs in March 2012 (2,757 KGS per capita per month) was lower than in August 2011 (3,718 KGS per capita per month) but higher than in March 2011 (2,240 KGS per capita per month). Increased expenditure in August 2011 might point to high indebtedness of households before the autumn months when traditional events and ceremonies are more frequent and educational and clothing expenditures are increasing.
When combining the four main expenditures, the proportion households spent on food was 46% of total expenditures. This was lower than August 2011(49%) but higher than in March 2011 (42%).
The proportion of food expenditure was particularly high in Talas oblast (56%). While the proportion has tended to decrease throughout the country since March 2011, it continued to increase in Talas oblast (Figure 33).
Food-insecure households, especially the severely food-insecure, spent less on each item of expenditure than other households, including food, despite the fact that they dedicated a larger share of their resources for food. The share of food expenditures out of the four main expenditures was higher among food-insecure households, particularly the severely food-insecure: 51% for severely and 47% for moderately food-insecure, compared to 45% for food-secure.
In addition to food, food insecure households allocated a large proportion of total expenditures to electricity and gas (37% of total expenditure). As a result, the amount of cash available for non-food expenditures for basic needs such as health and transportation was reduced.
Expenditures for electricity and gas increased significantly during winter. The average household spent only 5.6% in August 2011.
The low amount of cash available for non-food expenses can explain why households at the margin of poverty fall into food insecurity as the arbitrage between food and non-food expenditures becomes increasingly difficult in the event of a shock. For instance, moderately food-insecure households spent more than food-secure households on health, indicating that illness and related expenditures could be a key factor contributing to
35
40
45
50
55
60
65
Aug Mar Aug <ar
2010 2011 2012
Figure 33: Average proportion of food expenditure by oblast (%)
Bishkek
Chuy
Naryn
Yssyk-Kul
Talas
Osh
Jalalabad
Batken
Emergency Food Security Assessment (EFSA) March 2012
26
moderate food insecurity. Some moderately food-insecure households also mentioned large expenditures for materials to repair or reconstruct housing.
3.10 – Credit or loans
About 23% of households had credit or loans to reimburse, similarly as in previous EFSAs. The proportion was significantly higher in Naryn (52%), Yssyk-Kul (34%) and Talas (28%) oblasts.
Similarly, as in previous EFSAs, nearly one-third of indebted households used borrowed money to purchase food. Another one-third of indebted households used it to purchase agricultural inputs, animal feed and irrigation. Despite the relative improvement in food access in most households, debts were still largely used to meet food needs, and farming households were dependent on debt for their farming inputs.
In addition to food and agricultural inputs, food insecure households also used borrowed money for ceremonies, most likely for Nauruz (21
st of March, the first day of spring). This
pattern of use of credits/loans reflects the need of severely food-insecure households to meet immediate, basic consumption requirements, rather than investing in long-term productive activities such as education and business development.
Rural households were more likely to be indebted than urban households (25% and 15% respectively).
3.11 – Crop cultivation
3.11.1 – Agricultural production and food availability at national level
Agriculture remains a key sector of the economy, accounting for about a quarter of total GDP. The country has predominantly mountainous terrain with only about 6% of land suitable for cultivation, or 1.4 million hectares (ha). As a result, the livestock sector is a major agricultural activity, with wool, meat and dairy products being the main commodities. More than 90% of cattle, sheep and horses and 85% of poultry are owned by small-scale farms with either small household plots or private farms.
The major crops are potato, wheat, sugar beet, cotton, tobacco, vegetables and fruit. About half of the wheat consumed by the population is imported, mainly from Kazakhstan. Around 40% of vegetable oil and up to 90% of sugar are also imported. It is estimated that around 70% of food products needed for consumption are imported each year.
43
Domestic harvest of wheat was 3,100 MT or 0.2% less than 2010, while the harvest of other cereals increased (3% for potatoes, 14% for sugar beet).
44 This indicates that reduced
wheat prices on domestic markets were mostly due to decreased import prices.
According to the Ministry of Agriculture, 15,400 ha of wheat will be planted in 2012, which is 35% more than in 2011
45. The crop forecast for other staple commodities such as potatoes
is also higher than in 2011. In total 303,400 of hectares was ploughed, which is 68,900 hectares more than in 2011
46.
3.11.2 – Household access to garden or land to cultivate
In March 2012, 80% of rural households and 27% of urban households reported cultivating land or garden. These proportions were similar to August 2011 (respectively 78% and 21%), and higher than in March 2011 (57% and 13%).
43
http://www.bulak.kg/sites/default/files/prodovolstvennaya_bezopasnost._analiticheskiy_dokument.pdf 44
Ibid. 45
agromarket.kg 46
Ibid.
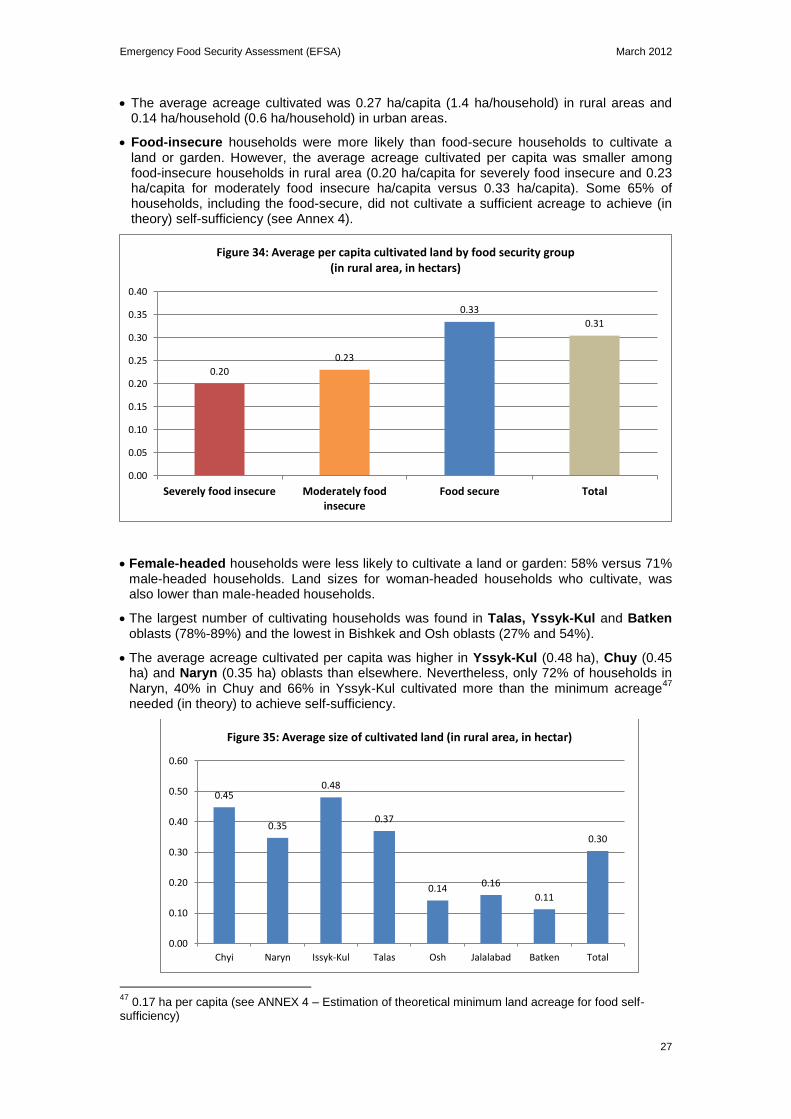
Emergency Food Security Assessment (EFSA) March 2012
27
The average acreage cultivated was 0.27 ha/capita (1.4 ha/household) in rural areas and 0.14 ha/household (0.6 ha/household) in urban areas.
Food-insecure households were more likely than food-secure households to cultivate a land or garden. However, the average acreage cultivated per capita was smaller among food-insecure households in rural area (0.20 ha/capita for severely food insecure and 0.23 ha/capita for moderately food insecure ha/capita versus 0.33 ha/capita). Some 65% of households, including the food-secure, did not cultivate a sufficient acreage to achieve (in theory) self-sufficiency (see Annex 4).
Female-headed households were less likely to cultivate a land or garden: 58% versus 71% male-headed households. Land sizes for woman-headed households who cultivate, was also lower than male-headed households.
The largest number of cultivating households was found in Talas, Yssyk-Kul and Batken oblasts (78%-89%) and the lowest in Bishkek and Osh oblasts (27% and 54%).
The average acreage cultivated per capita was higher in Yssyk-Kul (0.48 ha), Chuy (0.45 ha) and Naryn (0.35 ha) oblasts than elsewhere. Nevertheless, only 72% of households in Naryn, 40% in Chuy and 66% in Yssyk-Kul cultivated more than the minimum acreage
47
needed (in theory) to achieve self-sufficiency.
47
0.17 ha per capita (see ANNEX 4 – Estimation of theoretical minimum land acreage for food self-sufficiency)
0.20
0.23
0.33
0.31
0.00
0.05
0.10
0.15
0.20
0.25
0.30
0.35
0.40
Severely food insecure Moderately foodinsecure
Food secure Total
Figure 34: Average per capita cultivated land by food security group (in rural area, in hectars)
0.45
0.35
0.48
0.37
0.14 0.16
0.11
0.30
0.00
0.10
0.20
0.30
0.40
0.50
0.60
Chyi Naryn Issyk-Kul Talas Osh Jalalabad Batken Total
Figure 35: Average size of cultivated land (in rural area, in hectar)

Emergency Food Security Assessment (EFSA) March 2012
28
3.11.4 – Main crops cultivated, sales and self-sufficiency
Wheat
24% of households in rural areas answered that they will plant wheat this year.
On average, those who will plant wheat planned to sell 22% of the harvest this year, although farming households in Chuy, Talas and Osh oblasts were above this (32%-36%). The remaining wheat was reported to last between 7-8 months for family self-consumption. These results were slightly lower than actual harvest and sale in post-harvest season in August 2011.
Only 12% of severely food insecure households planned to plant wheat this year, while 20% of moderately food insecure and 21% of food secure household will plant it.
As noted in previous assessments, wheat was cultivated more often in Yssyk-Kul, Naryn and Batken oblasts.
Potatoes
63% of households planned to plant potato this year – 67% in rural and 45% in urban areas. The households planned to sell only about 20% of the harvest in rural areas and 6% in urban areas.
The majority of food insecure households were likely to plant potatoes (71% of moderately food insecure, 42% of severely food insecure). The expected duration of the harvest for self-consumption was around seven months among all groups.
Over 80% of households in Naryn (96%), Batken (89%), Talas (87%) and Yssyk-Kul (86%) planned to plant potatoes, and 42-70% in Jalalabad, Osh and Chuy. The proportion of sale varied across oblasts, with the highest share sold by households in Yssyk-Kul and Talas (34%).
Vegetables
46% of rural households but 72% of urban households planned to plant vegetables this year. These proportions were similar in August 2011.
Food insecure households continued to be less likely to cultivate vegetables than food-secure households (31%-45% versus 53%). The expected share of vegetables for sale was low (around 12%) and the amount to be kept for family consumption was about four months for both food-insecure and secure households.
Vegetable cultivation was higher in Talas (79%), Chuy (78%), Bishkek (76%) and Yssyk-Kul (71%) oblasts.
3.12 – Livestock
3.12.1 - Livestock ownership
Some 76% of rural households and 18% of urban households owned livestock, which is similar to August 2011 (73% and 16%) and higher than March 2011 (62% and 20%).
For those who owned livestock, the number of livestock was quite similar between rural and urban households: on average two head of cattle, 8-9 small ruminants (sheep and goat), and eight poultry. These figures were similar with the previous assessments.
While the average number of small ruminants, the most commonly owned livestock, increased from 7.8 (per household) in August 2011 to 10.0 in March 2012, the number
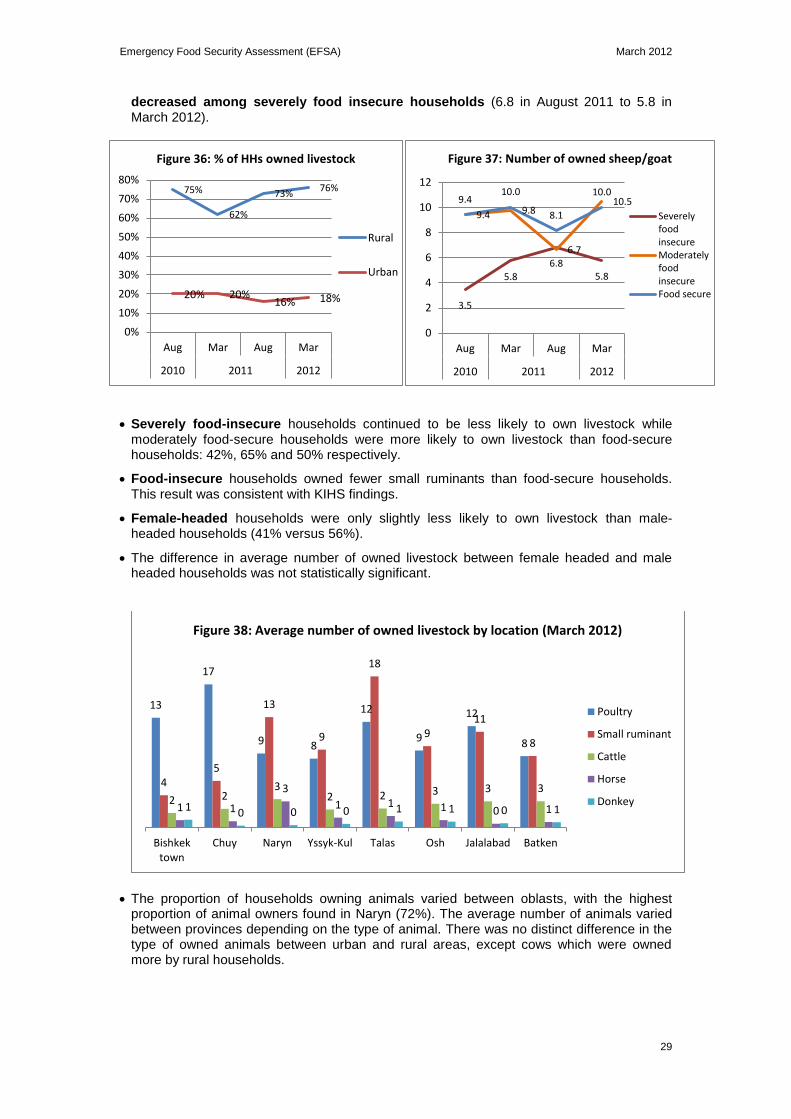
Emergency Food Security Assessment (EFSA) March 2012
29
75%
62%
73% 76%
20% 20% 16% 18%
0%
10%
20%
30%
40%
50%
60%
70%
80%
Aug Mar Aug Mar
2010 2011 2012
Figure 36: % of HHs owned livestock
Rural
Urban
3.5
5.8
6.8 5.8
9.4 9.8
6.7
10.5 9.4 10.0
8.1
10.0
0
2
4
6
8
10
12
Aug Mar Aug Mar
2010 2011 2012
Figure 37: Number of owned sheep/goat
SeverelyfoodinsecureModeratelyfoodinsecureFood secure
decreased among severely food insecure households (6.8 in August 2011 to 5.8 in March 2012).
Severely food-insecure households continued to be less likely to own livestock while moderately food-secure households were more likely to own livestock than food-secure households: 42%, 65% and 50% respectively.
Food-insecure households owned fewer small ruminants than food-secure households. This result was consistent with KIHS findings.
Female-headed households were only slightly less likely to own livestock than male-headed households (41% versus 56%).
The difference in average number of owned livestock between female headed and male headed households was not statistically significant.
The proportion of households owning animals varied between oblasts, with the highest proportion of animal owners found in Naryn (72%). The average number of animals varied between provinces depending on the type of animal. There was no distinct difference in the type of owned animals between urban and rural areas, except cows which were owned more by rural households.
13
17
9 8
12
9
12
8
4 5
13
9
18
9 11
8
2 2 3
2 2 3 3 3
1 1
3
1 1 1 0 1 1 0 0 0 1 1 0 1
Bishkektown
Chuy Naryn Yssyk-Kul Talas Osh Jalalabad Batken
Figure 38: Average number of owned livestock by location (March 2012)
Poultry
Small ruminant
Cattle
Horse
Donkey

Emergency Food Security Assessment (EFSA) March 2012
30
3.12.2 – Prices of livestock
According to Key Informant interviews which were conducted as a part of the EFSA, the prices of sheep and cows were higher by 10% and 36% respectively compared to prices in March 2011.This result was consistent with WFP‘s monthly food price monitoring and the data provided by the Ministry of Agriculture.
Livestock prices increased significantly in 2011 and early 2012. According to the Ministry of Agriculture, the national average price of a cow (2.5-5 years, female) was 32% higher than in March 2012 compared to a year ago. The price increased at a faster rate in some oblasts such as Yssyk-Kul (68%) and Naryn (43%)
48.
This was likely because of the lack of fodder as a result of the dry summer in 2011 followed by a particularly long and cold winter. Due to the limited availability, the price of fodder increased in March 2012
49.
Similarly, the price of sheep increased significantly in Chuy and Yssyk-Kul (38%, 24% and 21% respectively)
50.
3.12.3 – Animal fodder
Nearly half of the households (45%) who owned livestock did not have adequate winter fodder. This proportion was significantly higher than in March 2011 (31%). As Figure 40 shows households in southern oblasts, particularly Jalalabad and Batken provinces were unable to secure adequate winter fodders compared to those in the north (Talas, Yssyk-Kul and Chuy oblasts).
48
http://www.monitor.kg/ 49
Farmers in Kyrgyzstan experience shortage of animal fodder, March 2012 http://ktrk.kg/rus/index.php?newsid=3786 50
Ibid..
-
10,000
20,000
30,000
40,000
50,000
60,000
KG
S
Figure 39: Price of cow and sheep on local markets, by location (Mar-11, Aug-11 and Mar-12)
Cow Mar-11 Cow Aug-11 Cow Mar-12 Sheep Mar-11 Sheep Aug-11 Sheep Mar-12
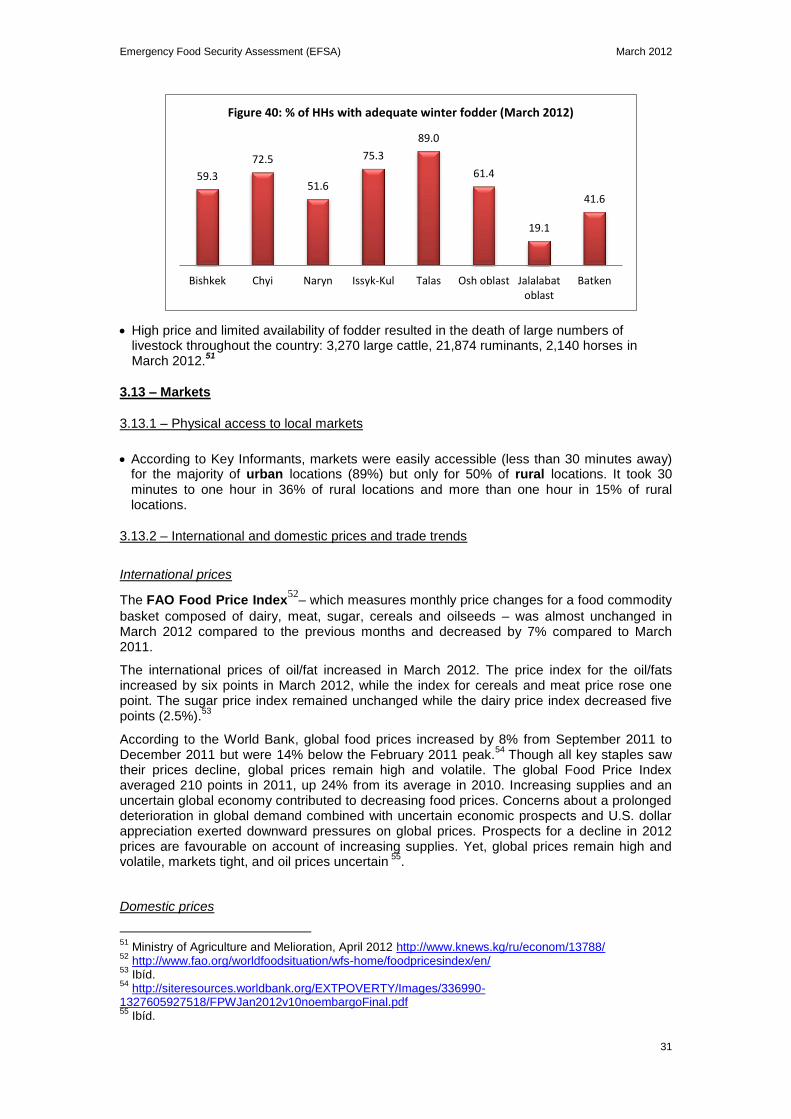
Emergency Food Security Assessment (EFSA) March 2012
31
High price and limited availability of fodder resulted in the death of large numbers of livestock throughout the country: 3,270 large cattle, 21,874 ruminants, 2,140 horses in March 2012.
51
3.13 – Markets
3.13.1 – Physical access to local markets
According to Key Informants, markets were easily accessible (less than 30 minutes away) for the majority of urban locations (89%) but only for 50% of rural locations. It took 30 minutes to one hour in 36% of rural locations and more than one hour in 15% of rural locations.
3.13.2 – International and domestic prices and trade trends
International prices
The FAO Food Price Index52
– which measures monthly price changes for a food commodity
basket composed of dairy, meat, sugar, cereals and oilseeds – was almost unchanged in March 2012 compared to the previous months and decreased by 7% compared to March 2011.
The international prices of oil/fat increased in March 2012. The price index for the oil/fats increased by six points in March 2012, while the index for cereals and meat price rose one point. The sugar price index remained unchanged while the dairy price index decreased five points (2.5%).
53
According to the World Bank, global food prices increased by 8% from September 2011 to December 2011 but were 14% below the February 2011 peak.
54 Though all key staples saw
their prices decline, global prices remain high and volatile. The global Food Price Index averaged 210 points in 2011, up 24% from its average in 2010. Increasing supplies and an uncertain global economy contributed to decreasing food prices. Concerns about a prolonged deterioration in global demand combined with uncertain economic prospects and U.S. dollar appreciation exerted downward pressures on global prices. Prospects for a decline in 2012 prices are favourable on account of increasing supplies. Yet, global prices remain high and volatile, markets tight, and oil prices uncertain
55.
Domestic prices
51
Ministry of Agriculture and Melioration, April 2012 http://www.knews.kg/ru/econom/13788/ 52
http://www.fao.org/worldfoodsituation/wfs-home/foodpricesindex/en/ 53
Ibíd. 54
http://siteresources.worldbank.org/EXTPOVERTY/Images/336990-1327605927518/FPWJan2012v10noembargoFinal.pdf 55
Ibíd.
59.3
72.5
51.6
75.3
89.0
61.4
19.1
41.6
Bishkek Chyi Naryn Issyk-Kul Talas Osh oblast Jalalabatoblast
Batken
Figure 40: % of HHs with adequate winter fodder (March 2012)
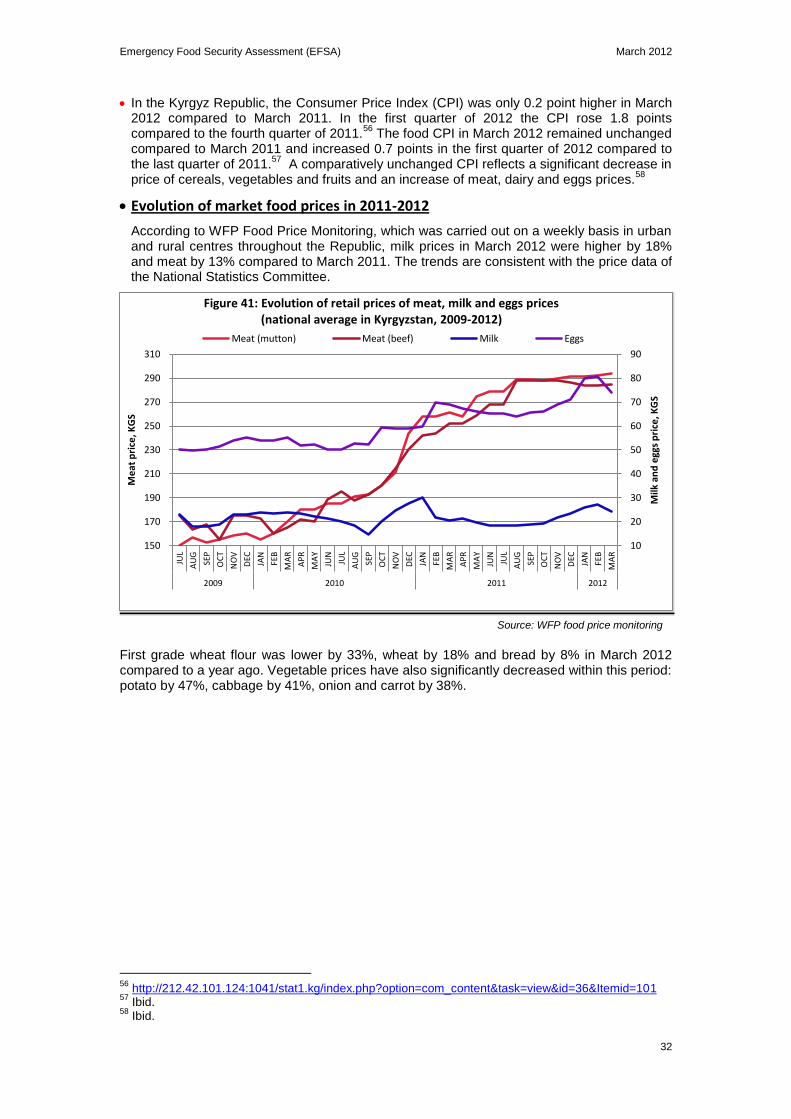
Emergency Food Security Assessment (EFSA) March 2012
32
In the Kyrgyz Republic, the Consumer Price Index (CPI) was only 0.2 point higher in March 2012 compared to March 2011. In the first quarter of 2012 the CPI rose 1.8 points compared to the fourth quarter of 2011.
56 The food CPI in March 2012 remained unchanged
compared to March 2011 and increased 0.7 points in the first quarter of 2012 compared to the last quarter of 2011.
57 A comparatively unchanged CPI reflects a significant decrease in
price of cereals, vegetables and fruits and an increase of meat, dairy and eggs prices.58
Evolution of market food prices in 2011-2012
According to WFP Food Price Monitoring, which was carried out on a weekly basis in urban and rural centres throughout the Republic, milk prices in March 2012 were higher by 18% and meat by 13% compared to March 2011. The trends are consistent with the price data of the National Statistics Committee.
First grade wheat flour was lower by 33%, wheat by 18% and bread by 8% in March 2012 compared to a year ago. Vegetable prices have also significantly decreased within this period: potato by 47%, cabbage by 41%, onion and carrot by 38%.
56
http://212.42.101.124:1041/stat1.kg/index.php?option=com_content&task=view&id=36&Itemid=101 57
Ibid. 58
Ibid.
10
20
30
40
50
60
70
80
90
150
170
190
210
230
250
270
290
310
JUL
AU
G
SEP
OC
T
NO
V
DEC
JAN
FEB
MA
R
AP
R
MA
Y
JUN
JUL
AU
G
SEP
OC
T
NO
V
DEC
JAN
FEB
MA
R
AP
R
MA
Y
JUN
JUL
AU
G
SEP
OC
T
NO
V
DEC
JAN
FEB
MA
R
2009 2010 2011 2012
Milk
an
d e
ggs
pri
ce, K
GS
Me
at p
rice
, KG
S
Figure 41: Evolution of retail prices of meat, milk and eggs prices (national average in Kyrgyzstan, 2009-2012)
Meat (mutton) Meat (beef) Milk Eggs
Source: WFP food price monitoring
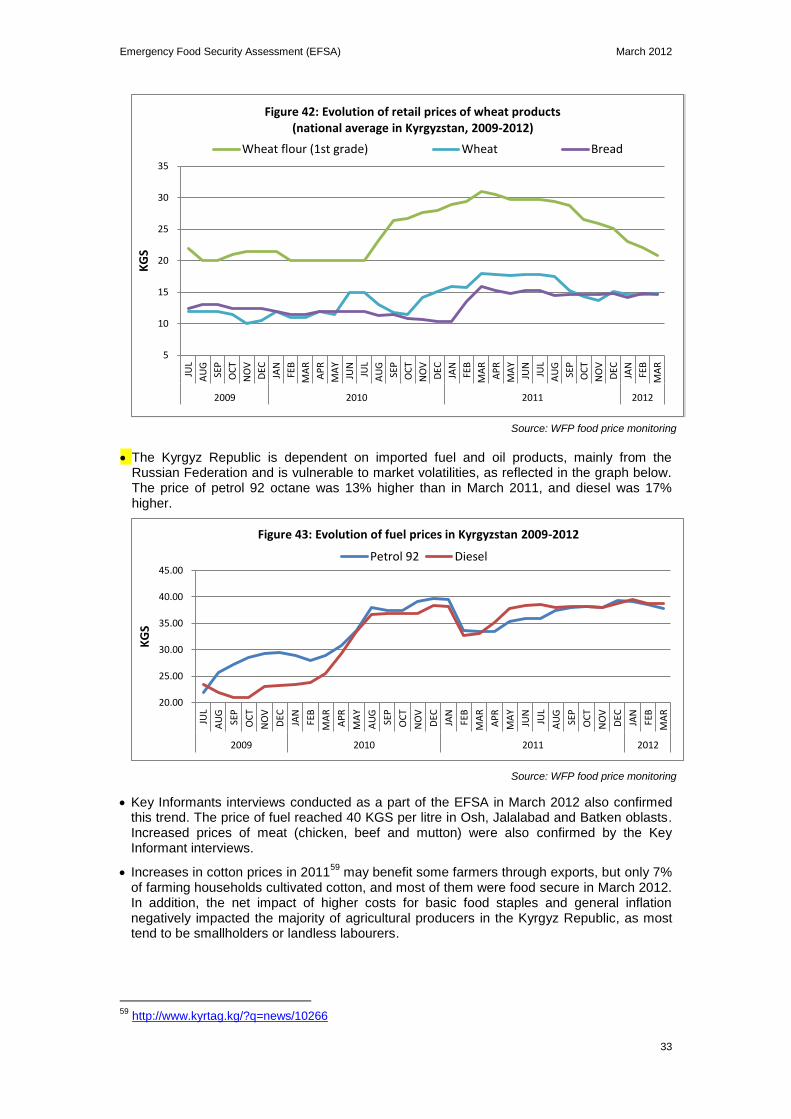
Emergency Food Security Assessment (EFSA) March 2012
33
The Kyrgyz Republic is dependent on imported fuel and oil products, mainly from the Russian Federation and is vulnerable to market volatilities, as reflected in the graph below. The price of petrol 92 octane was 13% higher than in March 2011, and diesel was 17% higher.
Key Informants interviews conducted as a part of the EFSA in March 2012 also confirmed this trend. The price of fuel reached 40 KGS per litre in Osh, Jalalabad and Batken oblasts. Increased prices of meat (chicken, beef and mutton) were also confirmed by the Key Informant interviews.
Increases in cotton prices in 201159
may benefit some farmers through exports, but only 7% of farming households cultivated cotton, and most of them were food secure in March 2012. In addition, the net impact of higher costs for basic food staples and general inflation negatively impacted the majority of agricultural producers in the Kyrgyz Republic, as most tend to be smallholders or landless labourers.
59
http://www.kyrtag.kg/?q=news/10266
5
10
15
20
25
30
35
JUL
AU
G
SEP
OC
T
NO
V
DEC
JAN
FEB
MA
R
AP
R
MA
Y
JUN
JUL
AU
G
SEP
OC
T
NO
V
DEC
JAN
FEB
MA
R
AP
R
MA
Y
JUN
JUL
AU
G
SEP
OC
T
NO
V
DEC
JAN
FEB
MA
R
2009 2010 2011 2012
KG
S
Figure 42: Evolution of retail prices of wheat products (national average in Kyrgyzstan, 2009-2012)
Wheat flour (1st grade) Wheat Bread
20.00
25.00
30.00
35.00
40.00
45.00
JUL
AU
G
SEP
OC
T
NO
V
DEC
JAN
FEB
MA
R
AP
R
MA
Y
AU
G
SEP
OC
T
NO
V
DEC
JAN
FEB
MA
R
AP
R
MA
Y
JUN
JUL
AU
G
SEP
OC
T
NO
V
DEC
JAN
FEB
MA
R
2009 2010 2011 2012
KG
S
Figure 43: Evolution of fuel prices in Kyrgyzstan 2009-2012
Petrol 92 Diesel
Source: WFP food price monitoring
Source: WFP food price monitoring

Emergency Food Security Assessment (EFSA) March 2012
34
0%
10%
20%
30%
40%
50%
60%
70%
80%
90%
100%
Mar Aug Mar Aug
2012 2011 2010
Figure 46: % of households reported 4 main difficulties (Aug 2010 - Mar 2012)
Poorweather foragriculture
Healthproblems
High foodprices
High fuelprices
3.14– Assets ownership
This EFSA looked mainly at the productive assets owned by households, i.e. agricultural equipment (tractor, combine and seeding machine), shops or vehicles.
The most commonly owned productive asset was a car (34%) and a shop (7%). However, severely food-insecure households continued to less frequently own these assets. Moderately food-insecure households were also less likely to own a shop or a car, compared to food-secure households. Asset ownership was similar between woman-headed and man-headed households.
In March 2012, fewer households owned agricultural assets compared to August 2011 in Talas (4% in March 2012, 9% in August 2011).
3.15 – Main shocks and problems in previous three months
The proportions of households affected by various problems were comparable to March 2011.
High food prices were noted by most households (86%), followed by high fuel prices (58%), health problems (50%), and poor weather for agriculture (40%). These problems have been repeatedly noted since August 2010.
Overall, problems related to violence and insecurity were mentioned as a problem by a lower percentage of households compared to past EFSA assessments. This indicates an
3.1 1.6
15.4
2.4 3.0
24.6
3.0 7.3
36.2
Agricultural assets Shop Car
Figure 44: Proportion of households owning productive assets by food security groups (March 2012)
Severely food insecure Moderately food insecure Food secure
40% 50%
86%
58%
Poorweather foragriculture
Healthproblems
High foodprices
High fuelprices
Figure 45: Main difficulties in the past 3 months (March 2012)

Emergency Food Security Assessment (EFSA) March 2012
35
improved security situation. However, more households reported violence and insecurity in Batken oblast in March 2012.
As expected, rural households were more likely to mention agricultural-related difficulties: 61% of rural households versus 19% of urban households indicated increased costs for agricultural inputs were a major problem during the three months prior to the assessment. Poor harvests were indicated as a problem by 43% of rural households, and for 68% of rural households the major problem was the high cost of fuel.
As in previous assessments, food-insecure households were more likely to have been affected by shocks and difficulties than food-secure households. Severely food-insecure households in particular mentioned more frequently high food prices (93%), unemployment (26%), health problems (50%) and agricultural-related difficulties (64%), than other households. The role played by individual (idiosyncratic) shocks (jobs, disease) on top of ‗common‘ shocks (e.g. high food prices) for food security is important to note.
0%
10%
20%
30%
40%
50%
60%
70%
80%
Aug Mar Aug Mar
2010 2011 2012
Figure 47: Households reported violence and insecurity as a problem
Nation wide
Osh
Jalalabad
Batken
58
52
12
52
89
62 58 58
41
10
50
91
69
58
37
26
9
50
85
56
45
0
10
20
30
40
50
60
70
80
90
100
Poorweather foragriculture
Low harvest Loss ofemployment
Healthproblems
High foodprices
High fuelprices
High cost ofagricultural
inputs
Figure 48: Main difficulties in the past 3 months according to food security status (March 2012)
Severelyfoodinsecure
Moderatelyfoodinsecure
Food secure
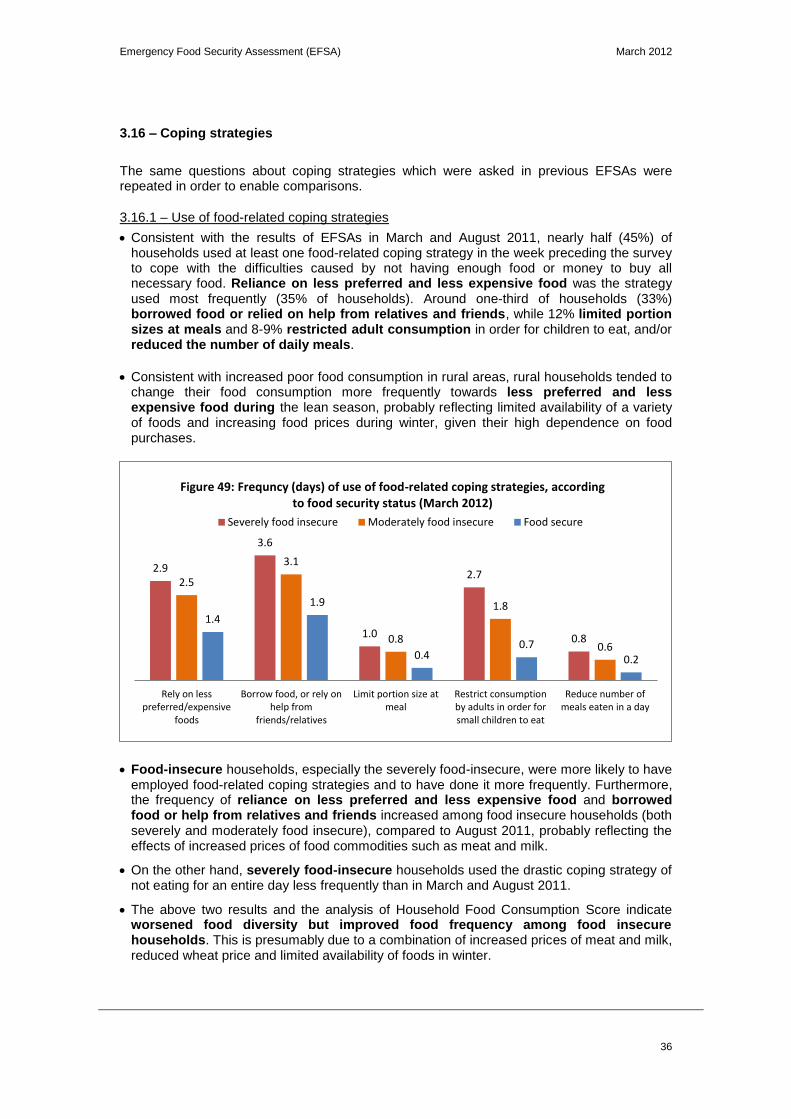
Emergency Food Security Assessment (EFSA) March 2012
36
3.16 – Coping strategies
The same questions about coping strategies which were asked in previous EFSAs were repeated in order to enable comparisons.
3.16.1 – Use of food-related coping strategies
Consistent with the results of EFSAs in March and August 2011, nearly half (45%) of households used at least one food-related coping strategy in the week preceding the survey to cope with the difficulties caused by not having enough food or money to buy all necessary food. Reliance on less preferred and less expensive food was the strategy used most frequently (35% of households). Around one-third of households (33%) borrowed food or relied on help from relatives and friends, while 12% limited portion sizes at meals and 8-9% restricted adult consumption in order for children to eat, and/or reduced the number of daily meals.
Consistent with increased poor food consumption in rural areas, rural households tended to change their food consumption more frequently towards less preferred and less expensive food during the lean season, probably reflecting limited availability of a variety of foods and increasing food prices during winter, given their high dependence on food purchases.
Food-insecure households, especially the severely food-insecure, were more likely to have employed food-related coping strategies and to have done it more frequently. Furthermore, the frequency of reliance on less preferred and less expensive food and borrowed food or help from relatives and friends increased among food insecure households (both severely and moderately food insecure), compared to August 2011, probably reflecting the effects of increased prices of food commodities such as meat and milk.
On the other hand, severely food-insecure households used the drastic coping strategy of not eating for an entire day less frequently than in March and August 2011.
The above two results and the analysis of Household Food Consumption Score indicate worsened food diversity but improved food frequency among food insecure households. This is presumably due to a combination of increased prices of meat and milk, reduced wheat price and limited availability of foods in winter.
2.9
3.6
1.0
2.7
0.8
2.5
3.1
0.8
1.8
0.6
1.4
1.9
0.4 0.7
0.2
Rely on lesspreferred/expensive
foods
Borrow food, or rely onhelp from
friends/relatives
Limit portion size atmeal
Restrict consumptionby adults in order forsmall children to eat
Reduce number ofmeals eaten in a day
Figure 49: Frequncy (days) of use of food-related coping strategies, according to food security status (March 2012)
Severely food insecure Moderately food insecure Food secure
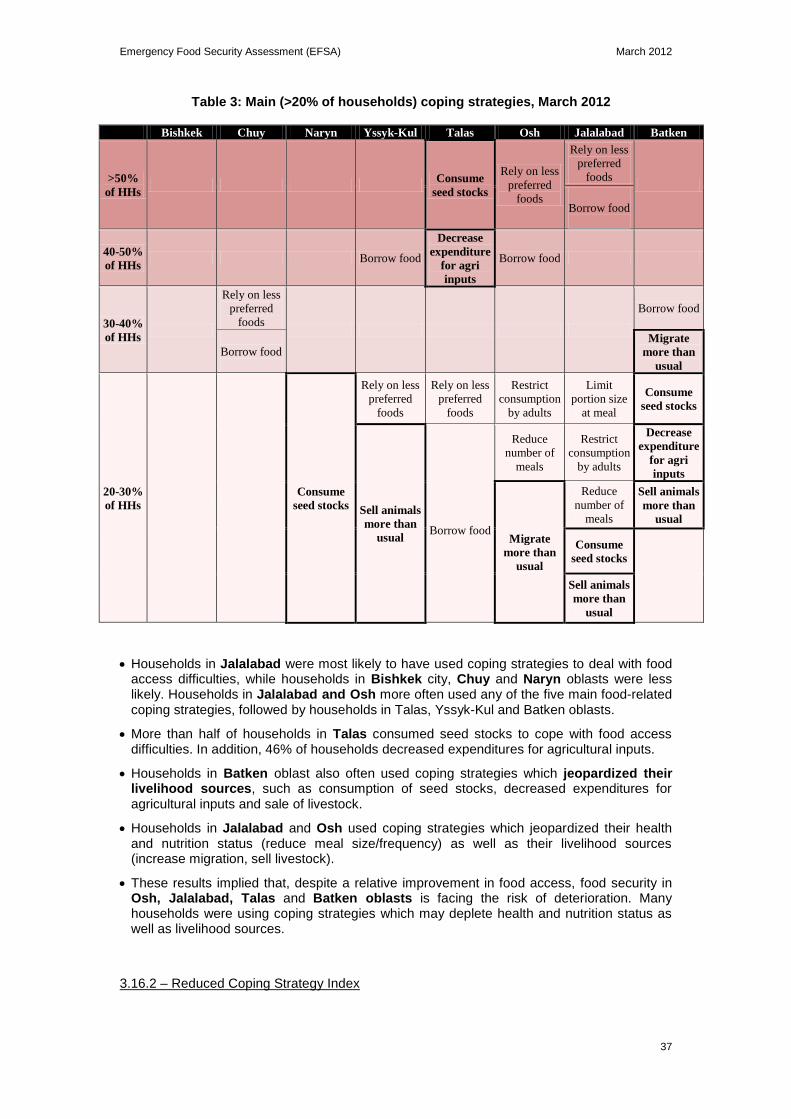
Emergency Food Security Assessment (EFSA) March 2012
37
Table 3: Main (>20% of households) coping strategies, March 2012
Bishkek Chuy Naryn Yssyk-Kul Talas Osh Jalalabad Batken
>50%
of HHs
Consume
seed stocks
Rely on less
preferred
foods
Rely on less
preferred
foods
Borrow food
40-50%
of HHs Borrow food
Decrease
expenditure
for agri
inputs
Borrow food
30-40%
of HHs
Rely on less
preferred
foods
Borrow food
Borrow food
Migrate
more than
usual
20-30%
of HHs
Consume
seed stocks
Rely on less
preferred
foods
Rely on less
preferred
foods
Restrict
consumption
by adults
Limit
portion size
at meal
Consume
seed stocks
Sell animals
more than
usual
Borrow food
Reduce
number of
meals
Restrict
consumption
by adults
Decrease
expenditure
for agri
inputs
Migrate
more than
usual
Reduce
number of
meals
Sell animals
more than
usual
Consume
seed stocks
Sell animals
more than
usual
Households in Jalalabad were most likely to have used coping strategies to deal with food access difficulties, while households in Bishkek city, Chuy and Naryn oblasts were less likely. Households in Jalalabad and Osh more often used any of the five main food-related coping strategies, followed by households in Talas, Yssyk-Kul and Batken oblasts.
More than half of households in Talas consumed seed stocks to cope with food access difficulties. In addition, 46% of households decreased expenditures for agricultural inputs.
Households in Batken oblast also often used coping strategies which jeopardized their livelihood sources, such as consumption of seed stocks, decreased expenditures for agricultural inputs and sale of livestock.
Households in Jalalabad and Osh used coping strategies which jeopardized their health and nutrition status (reduce meal size/frequency) as well as their livelihood sources (increase migration, sell livestock).
These results implied that, despite a relative improvement in food access, food security in Osh, Jalalabad, Talas and Batken oblasts is facing the risk of deterioration. Many households were using coping strategies which may deplete health and nutrition status as well as livelihood sources.
3.16.2 – Reduced Coping Strategy Index
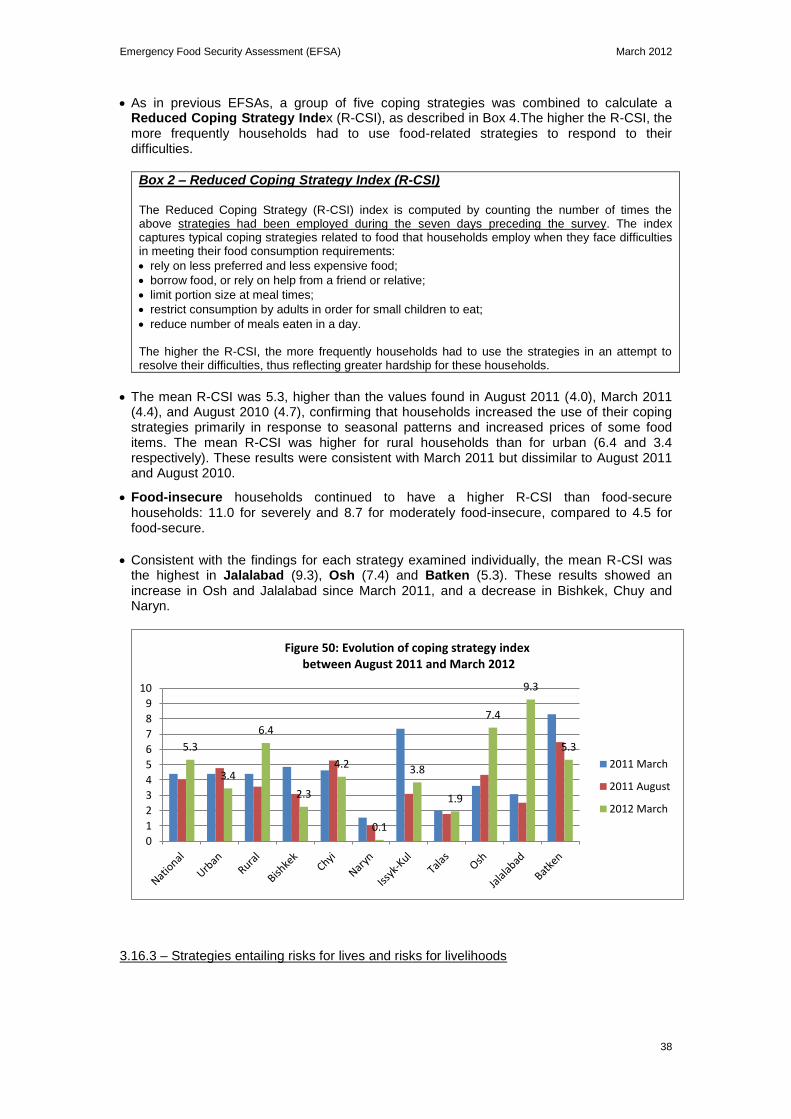
Emergency Food Security Assessment (EFSA) March 2012
38
As in previous EFSAs, a group of five coping strategies was combined to calculate a Reduced Coping Strategy Index (R-CSI), as described in Box 4.The higher the R-CSI, the more frequently households had to use food-related strategies to respond to their difficulties.
Box 2 – Reduced Coping Strategy Index (R-CSI) The Reduced Coping Strategy (R-CSI) index is computed by counting the number of times the above strategies had been employed during the seven days preceding the survey. The index captures typical coping strategies related to food that households employ when they face difficulties in meeting their food consumption requirements:
rely on less preferred and less expensive food;
borrow food, or rely on help from a friend or relative;
limit portion size at meal times;
restrict consumption by adults in order for small children to eat;
reduce number of meals eaten in a day. The higher the R-CSI, the more frequently households had to use the strategies in an attempt to resolve their difficulties, thus reflecting greater hardship for these households.
The mean R-CSI was 5.3, higher than the values found in August 2011 (4.0), March 2011 (4.4), and August 2010 (4.7), confirming that households increased the use of their coping strategies primarily in response to seasonal patterns and increased prices of some food items. The mean R-CSI was higher for rural households than for urban (6.4 and 3.4 respectively). These results were consistent with March 2011 but dissimilar to August 2011 and August 2010.
Food-insecure households continued to have a higher R-CSI than food-secure households: 11.0 for severely and 8.7 for moderately food-insecure, compared to 4.5 for food-secure.
Consistent with the findings for each strategy examined individually, the mean R-CSI was the highest in Jalalabad (9.3), Osh (7.4) and Batken (5.3). These results showed an increase in Osh and Jalalabad since March 2011, and a decrease in Bishkek, Chuy and Naryn.
3.16.3 – Strategies entailing risks for lives and risks for livelihoods
5.3
3.4
6.4
2.3
4.2
0.1
3.8
1.9
7.4
9.3
5.3
0
1
2
3
4
5
6
7
8
9
10
Figure 50: Evolution of coping strategy index between August 2011 and March 2012
2011 March
2011 August
2012 March
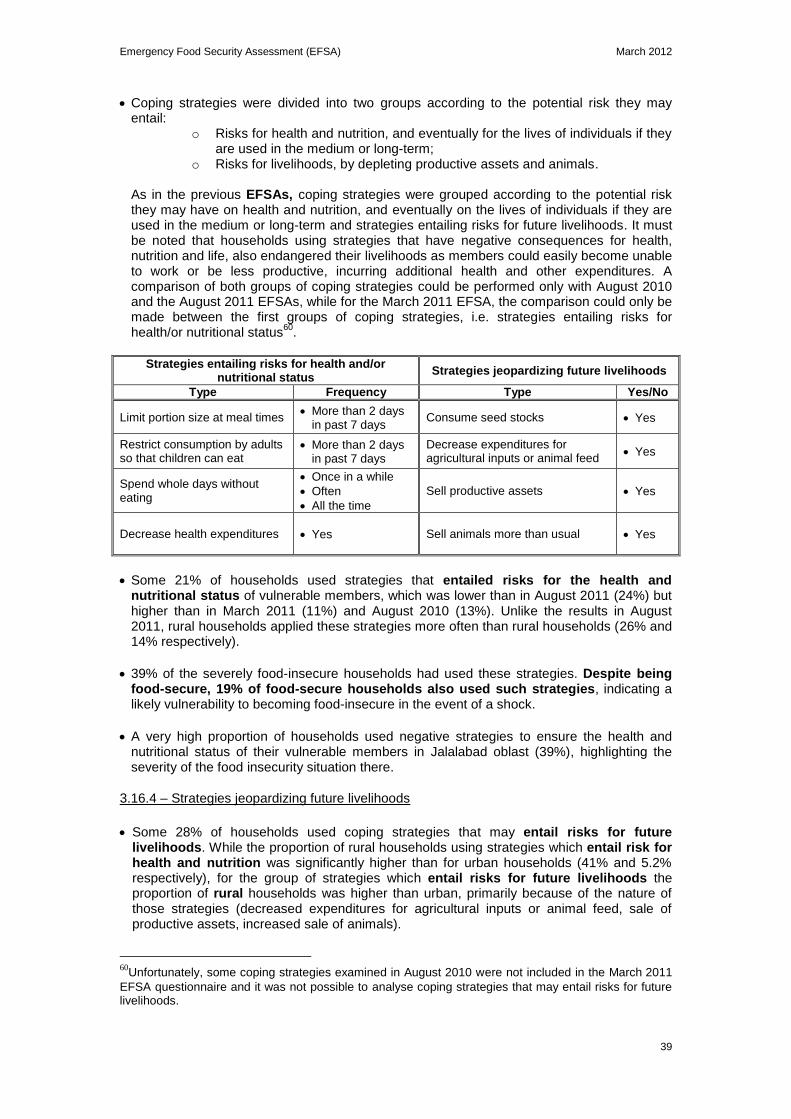
Emergency Food Security Assessment (EFSA) March 2012
39
Coping strategies were divided into two groups according to the potential risk they may entail:
o Risks for health and nutrition, and eventually for the lives of individuals if they are used in the medium or long-term;
o Risks for livelihoods, by depleting productive assets and animals. As in the previous EFSAs, coping strategies were grouped according to the potential risk they may have on health and nutrition, and eventually on the lives of individuals if they are used in the medium or long-term and strategies entailing risks for future livelihoods. It must be noted that households using strategies that have negative consequences for health, nutrition and life, also endangered their livelihoods as members could easily become unable to work or be less productive, incurring additional health and other expenditures. A comparison of both groups of coping strategies could be performed only with August 2010 and the August 2011 EFSAs, while for the March 2011 EFSA, the comparison could only be made between the first groups of coping strategies, i.e. strategies entailing risks for health/or nutritional status
60.
Strategies entailing risks for health and/or nutritional status
Strategies jeopardizing future livelihoods
Type Frequency Type Yes/No
Limit portion size at meal times More than 2 days
in past 7 days Consume seed stocks Yes
Restrict consumption by adults so that children can eat
More than 2 days in past 7 days
Decrease expenditures for agricultural inputs or animal feed
Yes
Spend whole days without eating
Once in a while
Often
All the time
Sell productive assets Yes
Decrease health expenditures Yes Sell animals more than usual Yes
Some 21% of households used strategies that entailed risks for the health and nutritional status of vulnerable members, which was lower than in August 2011 (24%) but higher than in March 2011 (11%) and August 2010 (13%). Unlike the results in August 2011, rural households applied these strategies more often than rural households (26% and 14% respectively).
39% of the severely food-insecure households had used these strategies. Despite being food-secure, 19% of food-secure households also used such strategies, indicating a likely vulnerability to becoming food-insecure in the event of a shock.
A very high proportion of households used negative strategies to ensure the health and nutritional status of their vulnerable members in Jalalabad oblast (39%), highlighting the severity of the food insecurity situation there.
3.16.4 – Strategies jeopardizing future livelihoods
Some 28% of households used coping strategies that may entail risks for future livelihoods. While the proportion of rural households using strategies which entail risk for health and nutrition was significantly higher than for urban households (41% and 5.2% respectively), for the group of strategies which entail risks for future livelihoods the proportion of rural households was higher than urban, primarily because of the nature of those strategies (decreased expenditures for agricultural inputs or animal feed, sale of productive assets, increased sale of animals).
60
Unfortunately, some coping strategies examined in August 2010 were not included in the March 2011
EFSA questionnaire and it was not possible to analyse coping strategies that may entail risks for future livelihoods.
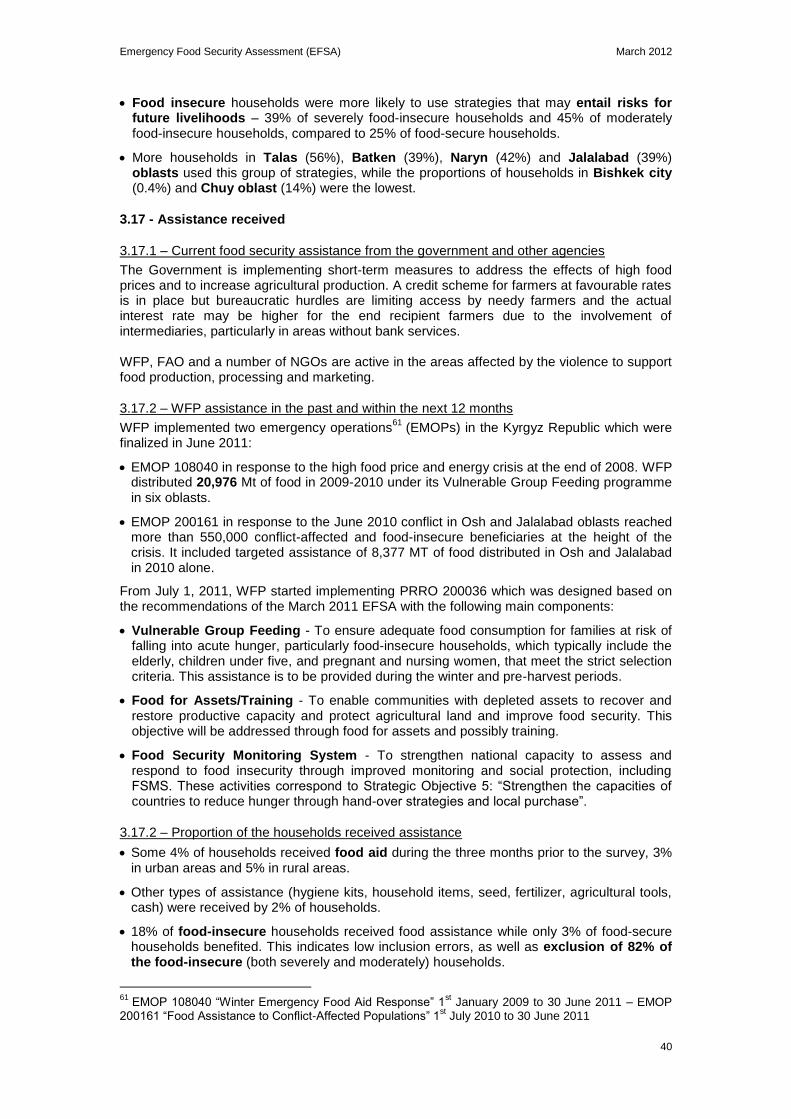
Emergency Food Security Assessment (EFSA) March 2012
40
Food insecure households were more likely to use strategies that may entail risks for future livelihoods – 39% of severely food-insecure households and 45% of moderately food-insecure households, compared to 25% of food-secure households.
More households in Talas (56%), Batken (39%), Naryn (42%) and Jalalabad (39%) oblasts used this group of strategies, while the proportions of households in Bishkek city (0.4%) and Chuy oblast (14%) were the lowest.
3.17 - Assistance received
3.17.1 – Current food security assistance from the government and other agencies
The Government is implementing short-term measures to address the effects of high food prices and to increase agricultural production. A credit scheme for farmers at favourable rates is in place but bureaucratic hurdles are limiting access by needy farmers and the actual interest rate may be higher for the end recipient farmers due to the involvement of intermediaries, particularly in areas without bank services. WFP, FAO and a number of NGOs are active in the areas affected by the violence to support food production, processing and marketing.
3.17.2 – WFP assistance in the past and within the next 12 months
WFP implemented two emergency operations61
(EMOPs) in the Kyrgyz Republic which were finalized in June 2011:
EMOP 108040 in response to the high food price and energy crisis at the end of 2008. WFP distributed 20,976 Mt of food in 2009-2010 under its Vulnerable Group Feeding programme in six oblasts.
EMOP 200161 in response to the June 2010 conflict in Osh and Jalalabad oblasts reached more than 550,000 conflict-affected and food-insecure beneficiaries at the height of the crisis. It included targeted assistance of 8,377 MT of food distributed in Osh and Jalalabad in 2010 alone.
From July 1, 2011, WFP started implementing PRRO 200036 which was designed based on the recommendations of the March 2011 EFSA with the following main components:
Vulnerable Group Feeding - To ensure adequate food consumption for families at risk of falling into acute hunger, particularly food-insecure households, which typically include the elderly, children under five, and pregnant and nursing women, that meet the strict selection criteria. This assistance is to be provided during the winter and pre-harvest periods.
Food for Assets/Training - To enable communities with depleted assets to recover and restore productive capacity and protect agricultural land and improve food security. This objective will be addressed through food for assets and possibly training.
Food Security Monitoring System - To strengthen national capacity to assess and respond to food insecurity through improved monitoring and social protection, including FSMS. These activities correspond to Strategic Objective 5: ―Strengthen the capacities of countries to reduce hunger through hand-over strategies and local purchase‖.
3.17.2 – Proportion of the households received assistance
Some 4% of households received food aid during the three months prior to the survey, 3% in urban areas and 5% in rural areas.
Other types of assistance (hygiene kits, household items, seed, fertilizer, agricultural tools, cash) were received by 2% of households.
18% of food-insecure households received food assistance while only 3% of food-secure households benefited. This indicates low inclusion errors, as well as exclusion of 82% of the food-insecure (both severely and moderately) households.
61
EMOP 108040 ―Winter Emergency Food Aid Response‖ 1st January 2009 to 30 June 2011 – EMOP
200161 ―Food Assistance to Conflict-Affected Populations‖ 1st July 2010 to 30 June 2011
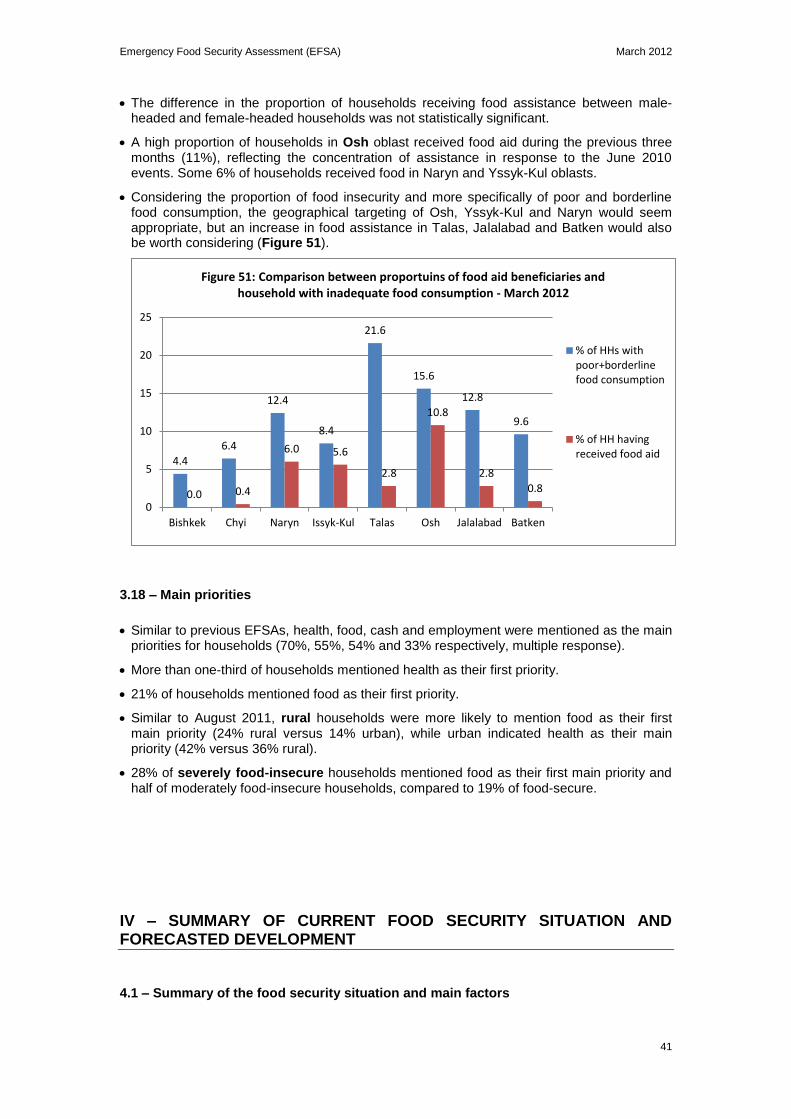
Emergency Food Security Assessment (EFSA) March 2012
41
The difference in the proportion of households receiving food assistance between male-headed and female-headed households was not statistically significant.
A high proportion of households in Osh oblast received food aid during the previous three months (11%), reflecting the concentration of assistance in response to the June 2010 events. Some 6% of households received food in Naryn and Yssyk-Kul oblasts.
Considering the proportion of food insecurity and more specifically of poor and borderline food consumption, the geographical targeting of Osh, Yssyk-Kul and Naryn would seem appropriate, but an increase in food assistance in Talas, Jalalabad and Batken would also be worth considering (Figure 51).
3.18 – Main priorities
Similar to previous EFSAs, health, food, cash and employment were mentioned as the main priorities for households (70%, 55%, 54% and 33% respectively, multiple response).
More than one-third of households mentioned health as their first priority.
21% of households mentioned food as their first priority.
Similar to August 2011, rural households were more likely to mention food as their first main priority (24% rural versus 14% urban), while urban indicated health as their main priority (42% versus 36% rural).
28% of severely food-insecure households mentioned food as their first main priority and half of moderately food-insecure households, compared to 19% of food-secure.
IV – SUMMARY OF CURRENT FOOD SECURITY SITUATION AND FORECASTED DEVELOPMENT
4.1 – Summary of the food security situation and main factors
4.4
6.4
12.4
8.4
21.6
15.6
12.8
9.6
0.0 0.4
6.0 5.6
2.8
10.8
2.8
0.8
0
5
10
15
20
25
Bishkek Chyi Naryn Issyk-Kul Talas Osh Jalalabad Batken
Figure 51: Comparison between proportuins of food aid beneficiaries and household with inadequate food consumption - March 2012
% of HHs withpoor+borderlinefood consumption
% of HH havingreceived food aid
Emergency Food Security Assessment (EFSA) March 2012
42
Some 18% of households were food-insecure. The proportion of food-insecurity significantly decreased compared to the results of the EFSA conducted a year earlier (46%, March 2011). When compared to the August 2011 EFSA, the proportion of food insecurity remained unchanged despite general seasonal trends such as depleted food stocks and decreased seasonal work opportunities. This is mainly explained by an improvement of income and decreased wheat price. The positive factors contributing to the improved income include:
- General improvement in the country‘s economy including improved labour market; - Increased remittances; - Relatively stabilized security situation in the south compared to a year ago; and - Increase of wages for teachers, doctors and health workers, as well as increased
pensions and social benefits.
However, the results of this follow-up EFSA indicate deteriorated food consumption, particularly food diversity. Overall, 12% of households consumed an inadequate diet which was higher than in August 2011 and 2010 (7% for both) but lower than in March 2011 (26%). Consistently, a high proportion (21%) of households continued to use negative coping strategies such as eating less preferred food to ensure their health and nutritional status of vulnerable members, which was much higher than in March 2011 and August 2010 (13%) but lower than in August 2011 (24%). The negative factors affecting food consumption and diversity include:
- Increased prices of meat and milk; - Limited variety of food available in markets; and - Restricted physical access (road, vehicle for transportation) to diversified food
available in markets
The diet of the households with poor consumption was exclusively based on staples and oils (consumed 6-7 days a week) with some sugar (4-5 days a week). Consumption of animal and vegetable proteins was essentially absent. This entails serious risks of malnutrition and diseases if continued in the medium and longer term, especially for young children, pregnant and lactating women, and the elderly.
The following factors should also be included as potential negative effects on the country in general and household food access in particular:
- The sharp rise of prices of basic food items over and above normal seasonal variations, which was not matched by a corresponding rise of wages, pensions and allowances, could lead to a deterioration of purchasing power.
- Potential further increase in fuel prices or decrease labour demand in domestic and international markets due to uncertainty in international politics and economy
62;
and - Poor harvest due to depleted water resources, natural disasters or unfavourable
weather
- National political and economic uncertainty which may result in recurring conflict.
Food insecurity continued to be worse in rural areas (27%) than in urban areas (9%). This is attributable to a number of factors. Despite more diversified income sources in rural area, rural households tended to rely on irregular, less sustainable and unstable income sources such as selling livestock, wage labour and small business such as shops. Rural households were more likely to rely on pensions and social transfer. 80% of rural households cultivated land, with the average acreage of land owned by food insecure rural household being 0.22 ha/capita, which is only slightly above the theoretical minimum required for self-sufficiency (0.17ha/capita). Therefore, most of them were compelled to diversify their income sources by working as labourers.
62
“Food Prices Rise Again on Higher Oil Prices and Adverse Weather” 25 April, 2012
http://web.worldbank.org/WBSITE/EXTERNAL/NEWS/0,,contentMDK:23180612~pagePK:6425704
3~piPK:437376~theSitePK:4607,00.html
Emergency Food Security Assessment (EFSA) March 2012
43
An increased coping strategy index in rural areas during pre-harvest season (March 2011 and March 2012) also indicates that rural households tended to struggle more to ensure their access to food. More than one-fourth of rural households (26%) used coping strategies that may entail risks for health and nutrition such as eating less preferred food. Furthermore, nearly half of rural households (41%) used coping strategies which may jeopardise future livelihoods, such as consuming seed stocks and decreasing inputs for farming.
These results show that rural households were more vulnerable to seasonal effects of food prices, availability and employment opportunities. As a result, food consumption among food insecure households in rural areas tended to deteriorate during the pre-harvest period.
The proportion of overall food insecurity significantly increased in Talas oblast compared to March 2011. The level of food insecurity remained very high in Naryn oblast, and relatively low in Yssyk-Kul, Chuy and Bishkek. The situation in Osh and Jalalabad oblasts improved in comparison to March 2011, reflecting continued restoration of livelihoods after the conflict and resumption of agricultural activities. In all oblasts except Yssyk-Kul, however, food consumption deteriorated compared to August 2011.
This seasonal deterioration of consumption was most marked in Talas oblast, where households consuming an inadequate diet increased from 2% to 60% between August 2010 and March 2011, and from 2% to 24% between August 2011 and March 2012. Food consumption was the least diverse in Talas among all oblasts both in March 2011 and March 2012. It should be noted that the proportion of stunting among under-five children is also high in Talas. Deteriorated food consumption entails further risks of malnutrition and diseases in the medium and long term.
Households in Talas oblast tended to have more household stocks of potato (more than three months) than any other oblasts. Therefore, deteriorated food consumption can be explained by limited economic access to protein-rich food such as meat and milk. The proportion of households living under the extreme poverty line remained very high in Talas (31%) while on average 56% of total expenditures was spent on food. This resulted in decreased investment in future livelihoods; for example, 46% of households in Talas decreased expenditures for agricultural inputs and more than half of households consumed seed stocks to cope with food access difficulties.
Although there was a sharp increase in food insecurity in Osh, Jalalabad and Batken oblasts in March 2011, reflecting the longer term effects of the June 2010 events and seasonal patterns, levels of food insecurity in these oblasts declined in August 2011 and remained almost unchanged in March 2012.
This stabilization likely reflects continued restoration of livelihoods after the conflict and resumption of agricultural activities. Proportions of households who live under the extreme poverty line have declined for these oblasts after a sharp increase in March 2011. Compared to past EFSA assessments, violence and insecurity were mentioned as a problem by a lower percentage of households in March 2012, except in Batken oblast.
Despite relative improvements in income, the proportion of households consuming an inadequate diet remained higher in southern oblasts particularly in winter, compared to northern oblasts. The coping strategy index showed continuous stress in Osh and Jalalabad since March 2011 and remained high in Batken. 21-39% of households used coping strategies entailing risks for health and nutritional status, while 34-48% used strategies jeopardizing future livelihoods. Household staple stock tended to be lower than in northern oblasts.
These results indicate that the effects of the violence in Osh and Jalalabad oblasts persisted and continued to impair affected households‘ access to normal livelihoods, including limitations on harvesting some crops, and loss of businesses and jobs.
Structural characteristics associated with poor and food-insecure households identified during this assessment support the findings of previous studies, including:
- Large family size;
Emergency Food Security Assessment (EFSA) March 2012
44
- Presence of vulnerable members (young children); - Low-paid and irregular employment; - Limited access to garden or land for cultivation; - Absence of or small numbers of animals, limiting access to expensive animal
products of high nutritional value (good quality protein and micronutrients).
In turn, these characteristics stem from deteriorating education services and levels of education, unemployment, and the inadequacy of the social assistance system to support the needs of the jobless, pensioners and large families. In past years, food imports have grown to meet domestic food demand, confirming that food insecurity is more a problem of low income (access) than low availability of food.
The follow-up EFSA also confirmed that female-headed households were not more frequently food-insecure than male-headed households. The structural factors of food insecurity mentioned above were the main drivers of food insecurity, rather than the gender of the head of household.
As in previous EFSAs, the March 2012 assessment confirmed that the vast majority of people in the Kyrgyz Republic were dependent on food purchases and were vulnerable to market volatility.
Ultimately, the analysis confirmed that food insecurity in the Kyrgyz Republic is essentially chronic, with poverty as the basic cause of poor food consumption. The low income, productive asset base and resources (land, animals, skills, credit) of households do not enable them to maintain an adequate frequency and diversity of food intake, potentially putting the health and nutritional status of vulnerable members in jeopardy through deficiencies, especially in micronutrients.
4.2 – Macro-economic prospects for the next 12 months
Following the ouster of the president in April 2010 and the outbreak of inter-communal violence in June, the country has remained vulnerable to further unrest. Restoring political and economic stability are the main concerns of the current administration. Tensions, particularly in the south of the Republic, persist and could spark renewed violence. The proponents of the opposition wing in the country are voicing their discontent with the ruling authorities and have conducted large-scale demonstrations in different parts of the country.
Despite shrinking GDP in January and February 2012 due to declining industrial production, real wages continue to grow thanks to increasing nominal wages and declining inflation
63.
There are some concerns, however, that if declining industrial production doesn‘t improve and exports continue to shrink, the inflow of foreign exchange to the country will contract. This may contribute to a devaluation of the Kyrgyz Som and push inflation higher. Additionally, a further decline in industrial production would also negatively affect budget revenues, which could lead to a budget deficit or result in cuts in budget expenditures, which would have an adverse impact on the socio-economic situation in the country.
64Excluding the negative growth of mining production, official GDP growth was
3.7% in January-February 2012 compared to the same period in 2011.65
This is significantly lower than in December 2011 – January 2012 (5.7%) and November-December 2011 (8.4%).
Growth is expected to be driven by the industrial and services sectors. Government plans to provide subsidized loans to farmers in 2012 are expected to promote growth in agriculture.
66
63
UNDP, Office of the Senior Economist http://europeandcis.undp.org/senioreconomist/show/4C6CE453-F203-1EE9-B8F4D17A02B45C12 64
Ibid. 65
Ibid. 66
Ibid.
Emergency Food Security Assessment (EFSA) March 2012
45
The government aims to reduce the fiscal deficit to 7.3% of GDP or less in the next two years, in order to improve debt sustainability and contain inflation pressures. These lower deficits would likely maintain the ratio of total public debt to GDP at 52–53% in the forecast period.
67
While the continued favourable trend in foodstuff prices has a positive impact on household budgets, the 8.5% increase in natural gas prices in January 2012 (over December 2011) was followed by an additional 0.4% rise in tariffs (against January 2012) in February. This will add to the burden on vulnerable households‘ budgets. If the gas price continues to rise in the coming months, the situation may even worsen. The main gas exporting countries, Uzbekistan and Kazakhstan, announced that they will increase gas export prices to Kyrgyzstan in 2012. This is likely to translate into higher prices for gas in the domestic market.
68
4.3 – Agricultural production and food price prospects
As a result of a long and cold winter, precipitation levels are expected to be good for the spring planting campaign. However, spring planting works started late because of the cold weather and will continue to be constrained by the high cost of agricultural inputs (fuel, fertilizers and seeds).
In addition, the Kyrgyz Republic remains highly susceptible to natural hazards (e.g. earthquake, mudflows, land-slides, snow storms etc.) which may occur at any time and can cause heavy losses of lives, livestock and crops, as well as damage to infrastructure
69.
Although wheat prices have stabilized in 2011, the cost of the average food basket remains extremely high due to increased prices of protein-rich food such as meat and milk, and attempts to compensate for increase in nominal income. This will continue to be the main risk of household food insecurity in the country, particularly during the pre-harvest seasons of spring/summer. In addition, many farmers continue to face difficulties in securing agricultural inputs for the 2012 autumn harvesting season due to the high prices of fuel, fertilizers and high quality seeds.
4.4 – Poverty and household food security prospects
Following public pressure and mass protests, pensions and salaries for health workers, teachers and other state employees were raised again in mid to late 2011. The Government increased the pension by 13.4%, considering the high inflation rate in 2011.
70 Average
monthly nominal salary in January-November 2011 was KGS 8,908, an increase of 29.5% compared to the same period last year. The real increase (considering the CPI) was 10%.
71
Although there has been an increase in income in the formal sector and significant decrease in prices for some food commodities, such as wheat products, vegetables and fruits, other foodstuff such as vegetable oil, meat, milk and eggs still remain high or are increasing. This fact could dent the improving finances of vulnerable households
72.
Despite considerable progress towards recovery in the southern oblasts (Osh, Jalalabad and Batken) affected by violence and destruction in 2010, the negative impact of the events still directly and indirectly affect households. Continuous tensions with potential outbreaks of violence are feared for the coming spring/summer months due to the increased activity of the opposition proponents and frequent demonstrations. Political stability and national cohesion based on establishing lasting peace and justice among all ethnic groups are preconditions for the Kyrgyz Republic to maintain and accelerate promising economic
67
Ibid. 68
UNDP, Office of the Senior Economist http://europeandcis.undp.org/senioreconomist/show/4C6CE453-F203-1EE9-B8F4D17A02B45C12 69
In April 2012, floods destroyed 200 homes in south Kyrgyzstan (http://www.universalnewswires.com/centralasia/kyrgyzstan/viewstory.aspx?id=11901) 70
http://www.kyrtag.kg/?q=ru/news/17341 71
National Statistics Committee, www.stat.kg 72
UNDP. Office of the Senior Economist. http://europeandcis.undp.org/senioreconomist/show/DA969AB4-F203-1EE9-BDDD709AB03459ED
Emergency Food Security Assessment (EFSA) March 2012
46
growth rates. Improved revenue raising as well as continued international assistance are needed to finance higher levels of social spending and in order to address structural weaknesses to bring poverty rates down, which lie at the core of continued food insecurity in the Kyrgyz Republic.
Emergency Food Security Assessment (EFSA) March 2012
47
V – SUGGESTIONS FOR FOOD SECURITY ASSISTANCE AND FOR WFP’S OPERATIONS
5.1 – Framework for food and nutrition insecurity in Kyrgyzstan
Food insecurity in the Kyrgyz Republic manifests itself through the consumption of cereal- and starch-based diets that do not provide sufficient energy for a significant cross section of the population, and an inadequate amount of minerals and vitamins essential for growth and health for an even larger number. This poor diet is a key contributing factor to chronic malnutrition among young children, anaemia, and other nutrition-related illnesses that affect learning capacities and productivity. Malnutrition is compounded by the deterioration of public health services such as drinking water, sanitation and waste disposal systems particularly in rural and remote areas. At the national level, malnutrition translates into significant economic losses, recently estimated at US $32 million (0.6% of GDP)73.
Food is available at the national level in the Republic from domestic agricultural production and commercial imports. Seasonal shortages limit the variety of food available in some areas during winter, due to lack of appropriate storage facilities and all-weather roads enabling traders to bring in supplies. In other areas, insufficient purchasing power to acquire available food is the main determinant of food insecurity.
Low purchasing power, in turn, is related to:
Unemployment and under-employment, in both urban and rural areas;
Deteriorating education quality that limits access to well-remunerated jobs;
Low agricultural productivity in rural areas mostly;
Deficient infrastructures limiting trade;
Inadequate social assistance which excludes most of the eligible poor 74 provides low benefits and does not protect against shocks, such as loss of job, illness or natural- and man-made disasters.
The March and August 2011 EFSAs included some general recommendations on the short- and medium-term measures to address food insecurity in the Kyrgyz Republic, taking into consideration existing economic and structural constraints and the 2010 civil unrest events. A brief summary is provided here, as these recommendations remain relevant:
1. Considering the important role of pensions and social transfers to alleviate poverty and food insecurity, measures to strengthen the social assistance system are essential, including an expansion of the Monthly Benefit in coverage and size, and an adjustment of the compensation/privileges budget compared to other social assistance transfers. There is no evidence that such measures have been taken to date.
2. In the short- to medium-term, employment creation and targeted livelihood support are also necessary for those who were directly affected by the events in April and June 2010, other vulnerable and poor population groups, and other marginalized, at-risk regions.
3. To address chronic under-nutrition (high stunting rates) suspected in some areas, a package of preventive and therapeutic nutrition interventions (salt iodization, promotion of complementary feeding practices and zinc for the treatment of diarrhoea, promotion of exclusive breastfeeding, supplementation to pregnant women, and fortification of salt with iodine and flour with vitamins and minerals),
73
Situational Analysis. Improving Economic Outcomes by Expanding Nutrition Programming in Kyrgyzstan. World Bank/UNICEF, June 2011. 74
An estimated 67% of the extreme poor are excluded from Monthly Benefit. Source: Joint Economic Assessment: Reconciliation, Recovery and Reconstruction. Asian Development Bank, International Monetary Fund, The World Bank. July 2010.
Emergency Food Security Assessment (EFSA) March 2012
48
together with social protection and agricultural support to address the underlying and basic causes of under-nutrition, should be implemented.
4. In view of reduced and stabilised prices of cereals and tubers, limited consumption of protein-rich food such as meat and milk, and continued trend of high prices of such food items, food and nutrition security interventions should consider improvement of access to a more variety of food. The food insecure and vulnerable would benefit from receiving voucher or cash to meet their context-specific needs especially if the interventions are combined with food and nutrition education.
5. To reduce the vulnerability to volatile prices of imported wheat, invest in small scale wheat-growing farmers to ensure sustainable yields and better quality
6. Donor support to the government budget is needed to meet emergency expenditures, and to provide social assistance for livelihoods, social protection and other social programmes, investments to rebuild destroyed infrastructure and in the energy and transport sectors, and support for agriculture and security-related requirements.
7. Food Security Monitoring System (FSMS) should be set up to provide evidence-base for timely and effective planning of food and nutrition security interventions.
8. Next EFSA should examine and analyse selling prices of main crops for vulnerable farmers. Significant decrease in retail prices of food may negatively affect suppliers, especially small ones, and lead to increase in food insecurity.
9. Both agricultural and livestock farmers were found to be highly vulnerable to extreme weather and climate change. It is important that food security assessment and monitoring surveys capture the impact of climate related natural disasters on food security for planning appropriate responses.
In terms of assistance timing, the difference in the proportion of household food insecurity between the August 2010 and the August 2011 EFSA, and between the EFSAs conducted in March 2011 and in March 2012, confirms important seasonal variations of food insecurity
75, which manifests itself in changes in diet (both in quantity and diversity) as well
as in food purchasing power. As a result, it makes sense to concentrate food assistance interventions during the most critical months of the year in the winter and early spring, when food stocks are low and prices high. This applies particularly to rural areas where most of the food-insecure are located.
5.2 – Estimated number of people needing food security assistance
Estimations of the number of households and people requiring food security assistance were made considering the current proportion of severe food insecurity. On this basis, an estimated 1,004,508 persons are currently food-insecure.
On this basis, an estimated 948,318 persons are currently severely food-insecure.
Severely food-insecure
Moderately food-insecure
Total Food-insecure
Food Secure Using Coping Strategies Risks to Lives
Total76
180,367 824,140 1,004,508 748,866
75
Seasonal variations are not prominent in the KIHS, possibly because the food consumption indicator is based on kilocalorie intake which may hide large seasonal changes in the quality (diversity) of the diet.
Emergency Food Security Assessment (EFSA) March 2012
49
Bishkek 3,674 29,395 33,069 95,533
Chuy 9,897 92,374 102,271 135,262
Naryn 13,631 82,835 96,466 22,020
Yssyk-Kul 7,112 69,345 76,457 40,896
Talas 28,746 60,273 89,018 4,636
Osh 83,204 255,159 338,363 183,049
Jalalabad 37,319 190,742 228,062 290,260
Batken 1,764 59,990 61,754 74,105
Food-insecure people are concentrated in Osh and Jalalabad oblasts, followed by Chuy, Naryn, Talas and Yssyk-Kul.
3,674 9,897 13,631 7,112 28,746
83,204 37,319
1,764 29,395
92,374 82,835 69,345
60,273
255,159
190,742
59,990
95,533
135,262
22,020 40,896 4,636
183,049
290,260
74,105
-
100,000
200,000
300,000
400,000
500,000
600,000
Bishkek Chyi Naryn Issyk-Kul Talas Osh Jalalabat Batken
Figure 52: Food insecure and at risk person by oblast, March 2012
Food secure,at risk
Moderatelyfood-insecure
Severely food-insecure
Emergency Food Security Assessment (EFSA) March 2012
50
ANNEX 1 - HOUSEHOLD QUESTIONNAIRE
Code Oblast : │___│ Code Rayon : │_____│ Code AiylOkrugs : │______│Name of the location ______________________ Questionnaire number: │_││_││_││_│ Date : │_││_│/ │_││_│ 2011 day / month Name of enumerators :____________________________/ _____________________________ Consent: We are assessing the living situation of families in Kyrgyzstan. As it is not possible to meet everybody, we have selected at random localities and families in order to have an idea of the general situation. None of the localities or families visited will be privileged to receive particular assistance, and we do not register names. However, this information will be used to take decisions on programmes to contribute to improving the living conditions of the population in the country. The interview should not last more than 40 minutes. The answers you will give will remain strictly confidential and will not be given to others. You can refuse to participate or to answer to some of the questions. But we hope that you will accept to participate, as your answers are very important to take the best decisions possible. Do you have questions for us? Can we start? Ask if several families share the same house without eating together and without sharing their income. If there are distinct families, select one at random for the interview.
I – HOUSEHOLD COMPOSITION
Who is making the decisions for the household? 1= Man/ 2 = Woman 1.1 │___│ How old is he/she? 1.2 │___│ years
How many children and adults live in your family? 1.3 │___│
Children below 5 years 1.4 │___│ Primary school-age children 6-11 years 1.5 │___│
Secondary school-age children 12-18 years 1.6 │___│ Adult men 19-60 years 1.7 │___│
Adult women19-60 years 1.8 │___│ Adults above 60 years of age 1.9 │___│
Write total number of persons, or 0 if there are none:
1.10 Are there persons who have long-duration sickness (e.g. diabetes)? │___│chronic sick
1.11 Are there pregnant/ lactating women? │___│
pregnant/lactating
1.12 Including your own family, how many other families live here? (Families are considered separate if they do not eat together and do not share their income)
│___│
II– FOOD CONSUMPTION
How many meals do you eat each day? 2.1 │___│
Consider only meals consumed at home or in public kitchen but not in private restaurants or street food Do NOT count food consumed in very small amount (less than a teaspoon per person)
How many days for the last 7 days did
your family consume these food items?
What was the main source of these food?
1= Own production/garden 2= Purchase in shops, markets, petty traders 3= Purchase at credit, borrowed 4= Received against work (in-kind payment) 5= Bartered against other goods 6= Received as gift from family or neighbours, begged 7= Humanitarian food aid 99= Not eaten during the 7 past days
0 = Not eaten 4= 4 days 1= 1 day 5 = 5 days 2= 2 days 6= 6 days 3= 3 days 7= 7 days
Bread 2.2 │___│ 2.3 │___│
Wheat (grain, flour), rice, maize, pasta 2.4 │___│ 2.5 │___│
Biscuits, High Energy Biscuits 2.6 │___│ 2.7 │___│
Potatoes, sweet potatoes 2.8 │___│ 2.9 │___│
Beans, chickpeas, lentils, peas 2.10 │___│ 2.11 │___│
Vegetables 2.12 │___│ 2.13 │___│
Fruits 2.14 │___│ 2.15 │___│
Nuts, walnuts, hazelnuts 2.16 │___│ 2.17 │___│
Meat (red, poultry) 2.18 │___│ 2.19 │___│
Eggs 2.20 │___│ 2.21 │___│
Fish 2.22 │___│ 2.23 │___│
Dairy products (yogurt, cheese, milk) 2.24 │___│ 2.25 │___│
Vegetable oil, butter, grease 2.26 │___│ 2.27 │___│
Emergency Food Security Assessment (EFSA) March 2012
51
Sugar, honey, jam 2.28 │___│ 2.29 │___│
Do you have stocks of food? 1= Yes / 2= No 2.30 │___│If No stocks, go to
Section III
How long will your stocks last for the family consumption? Write number of days (0 if no stock)
2.31 Wheat (grain, flour) │___│ days 2.32 Potatoes, sweetpotatoes │___│ days
2.33 Rice │___│ days 2.34 Oil, butter, grease │___│ days
2.35 Beans, peas, chickpeas, lentils │___│ days 2.36 Sugar │___│ days
III – EXPENDITURES What are your 4largest expenditures for your living? Ranking Amount per week (KGS)
1= Food 2= Water 3= Gas, electricity, other cooking fuel 4= Soap, hygiene products 5= Clothing 6= Rental of housing 7= Telephone communications 8= Transportation, diesel for car or truck 9= Health care, drugs 10= Schooling 11= Ceremonies (including funerals) 12= Debt or credit repayment 13= Agricultural inputs, animal feed, irrigation 14= Rental of land 15= Material to remove rubbles 16= Material to repair or reconstruct housing 17= Other (specify) _________________________
3.1 │___│ Largest
expenditure
3.2
│____________│ KGS/week
3.3 │___│ 2
nd
expenditure 3.4
│____________│ KGS/week
3.5 │___│ 3
rd
expenditure 3.6
│____________│ KGS/week
3.7 │___│ 4
th
expenditure 3.8
│____________│ KGS/week
Do you have some loans or credit to reimburse? 1= Yes / 2= No 3.9 │___│ If No, go to
Section IV
What are the main expenditures that you have covered with this money?1= Yes / 2= No
Food 3.10 │___│ Transportation, diesel for car/trucks 3.11 │___│ Water 3.12 │___│ Health care, drugs 3.13 │___│ Gas, electricity, other cooking fuel 3.14 │___│ Schooling 3.15 │___│ Soap, hygiene products 3.16 │___│ Ceremonies (including funerals) 3.17 │___│ Clothing 3.18 │___│ Agricultural inputs, animal feed, irrigation 3.19 │___│ Rental of housing 3.20 │___│ Rental of land 3.21 │___│ Material to remove rubbles 3.22 │___│ Material to repair of reconstruct housing 3.23 │___│ IV – INCOME SOURCES AND ASSETS
How many persons in the family can earn some cash? 4.1 │___│
How many different sources of income do you have? 4.2 │___│
What are the 4 main sources of cash for the family? Ranking Amount per month
(KGS)
1= Sale of harvest of wheat, maize, potatoes, cotton etc. 2= Sale of vegetables or fruits 3= Sale of animal products or animals 4= Irregular wage labour unskilled r (e.g. seasonal, temporary) 5= Regular wage labour unskilled (e.g. driver, cleaner, guard) 6 = Regular wage labour skilled (e.g. employee in factory) 7= Independent worker (e.g. carpenter, taxi driver) 8= Government employment (e.g. police, administration, health, school…) 9= Employment in UN agency or NGO 10= Sale of handicraft 11= Petty trade (street or market vendor without shop) 12= Small business (shop) 13= Large business 14= Rent of land or rent of property 15= Pension, allowances 16 = Remittances 17= Sale of humanitarian assistance 18 = Sale of assets, sale of domestic belongings 19= Use of personal savings, sale of jewellery 20= Credit, loans from organizations, banks, money lenders
4.3 │___│
Largest source 4.4
│_______│ KGS/month
4.5 │___│
2nd source 4.6
│_______│ KGS/month
4.7 │___│
3rd source 4.8
│_______│ KGS/month
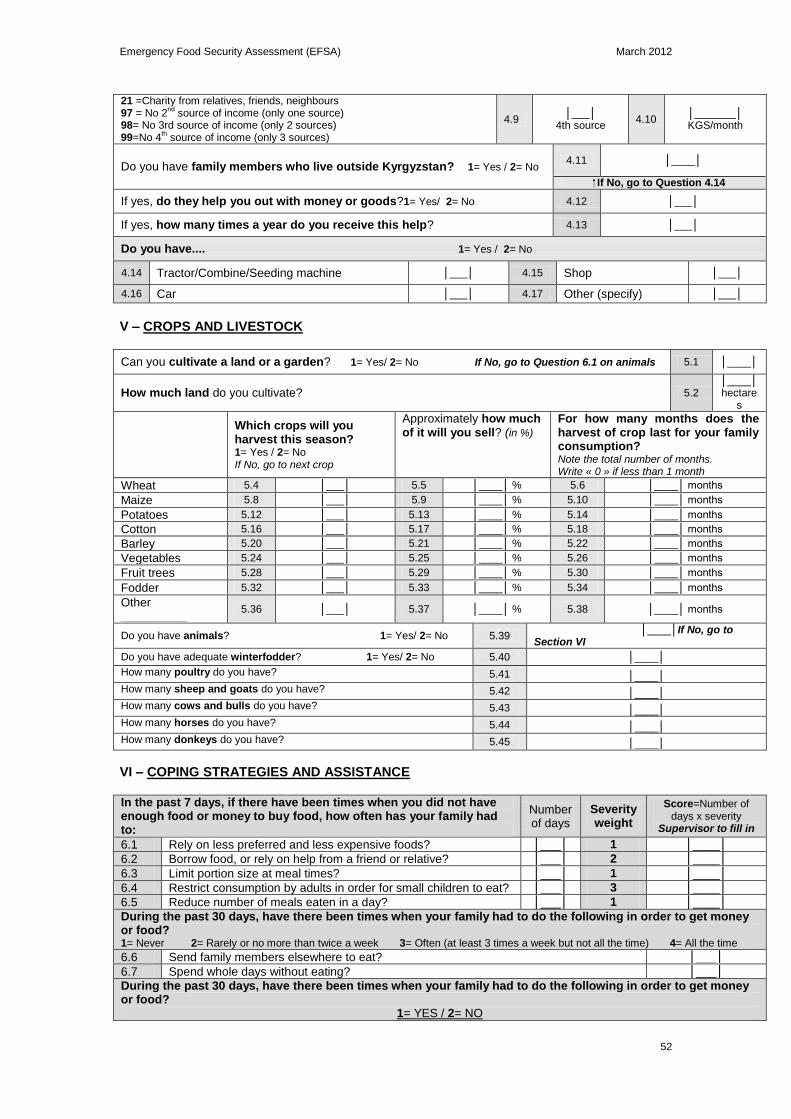
Emergency Food Security Assessment (EFSA) March 2012
52
21 =Charity from relatives, friends, neighbours 97 = No 2
nd source of income (only one source)
98= No 3rd source of income (only 2 sources) 99=No 4
th source of income (only 3 sources)
4.9 │___│
4th source 4.10
│_______│ KGS/month
Do you have family members who live outside Kyrgyzstan? 1= Yes / 2= No 4.11 │____│
If No, go to Question 4.14
If yes, do they help you out with money or goods?1= Yes/ 2= No 4.12 │___│
If yes, how many times a year do you receive this help? 4.13 │___│
Do you have.... 1= Yes / 2= No
4.14 Tractor/Combine/Seeding machine │___│ 4.15 Shop │___│
4.16 Car │___│ 4.17 Other (specify) │___│
V – CROPS AND LIVESTOCK
Can you cultivate a land or a garden? 1= Yes/ 2= No If No, go to Question 6.1 on animals 5.1 │____│
How much land do you cultivate? 5.2 │____│ hectare
s
Which crops will you harvest this season? 1= Yes / 2= No If No, go to next crop
Approximately how much of it will you sell? (in %)
For how many months does the harvest of crop last for your family consumption? Note the total number of months. Write « 0 » if less than 1 month
Wheat 5.4 │___│ 5.5 │____│ % 5.6 │____│ months
Maize 5.8 │___│ 5.9 │____│ % 5.10 │____│ months
Potatoes 5.12 │___│ 5.13 │____│ % 5.14 │____│ months
Cotton 5.16 │___│ 5.17 │____│ % 5.18 │____│ months
Barley 5.20 │___│ 5.21 │____│ % 5.22 │____│ months
Vegetables 5.24 │___│ 5.25 │____│ % 5.26 │____│ months
Fruit trees 5.28 │___│ 5.29 │____│ % 5.30 │____│ months
Fodder 5.32 │___│ 5.33 │____│ % 5.34 │____│ months
Other __________
5.36 │___│ 5.37 │____│ % 5.38 │____│ months
Do you have animals? 1= Yes/ 2= No 5.39 │____│If No, go to Section VI
Do you have adequate winterfodder? 1= Yes/ 2= No 5.40 │____│
How many poultry do you have? 5.41 │____│
How many sheep and goats do you have? 5.42 │____│
How many cows and bulls do you have? 5.43 │____│
How many horses do you have? 5.44 │____│
How many donkeys do you have? 5.45 │____│
VI – COPING STRATEGIES AND ASSISTANCE In the past 7 days, if there have been times when you did not have enough food or money to buy food, how often has your family had to:
Number of days
Severityweight
Score=Number of days x severity
Supervisor to fill in
6.1 Rely on less preferred and less expensive foods? │___│ 1 │____│
6.2 Borrow food, or rely on help from a friend or relative? │___│ 2 │____│
6.3 Limit portion size at meal times? │___│ 1 │____│
6.4 Restrict consumption by adults in order for small children to eat? │___│ 3 │____│
6.5 Reduce number of meals eaten in a day? │___│ 1 │____│
During the past 30 days, have there been times when your family had to do the following in order to get money or food? 1= Never 2= Rarely or no more than twice a week 3= Often (at least 3 times a week but not all the time) 4= All the time
6.6 Send family members elsewhere to eat? │___│ 6.7 Spend whole days without eating? │___│ During the past 30 days, have there been times when your family had to do the following in order to get money or food?
1= YES / 2= NO
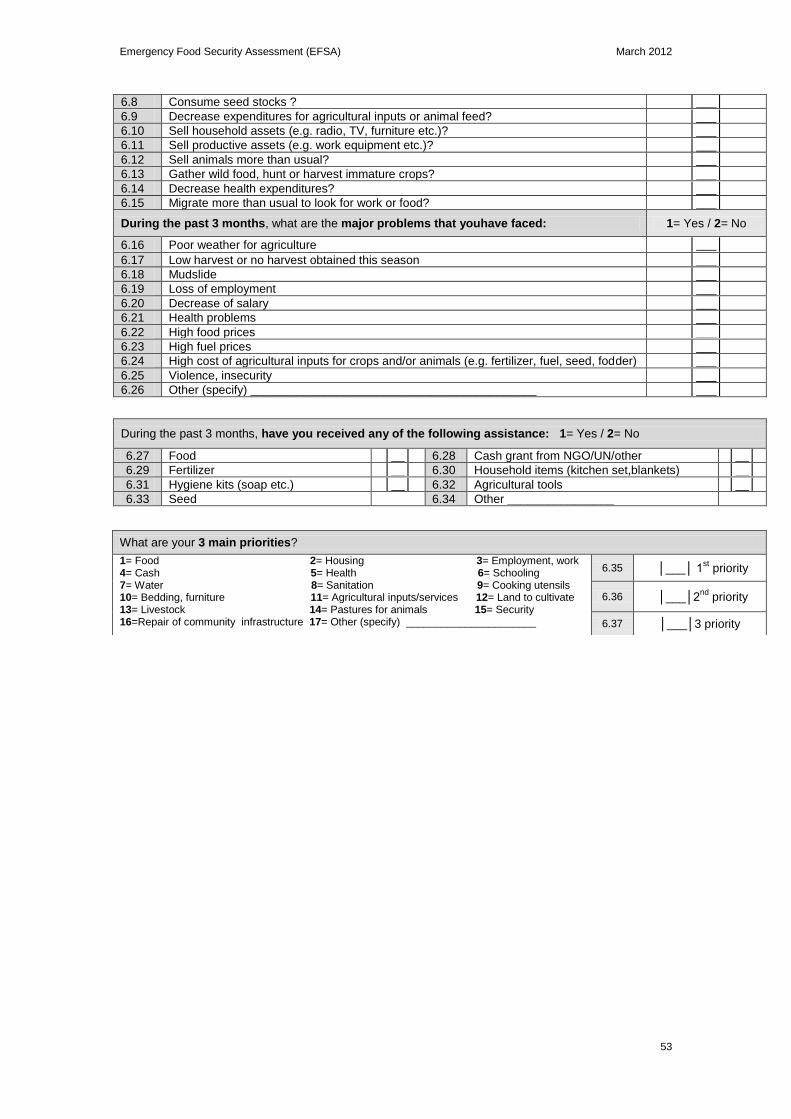
Emergency Food Security Assessment (EFSA) March 2012
53
6.8 Consume seed stocks ? │___│ 6.9 Decrease expenditures for agricultural inputs or animal feed? │___│ 6.10 Sell household assets (e.g. radio, TV, furniture etc.)? │___│ 6.11 Sell productive assets (e.g. work equipment etc.)? │___│ 6.12 Sell animals more than usual? │___│ 6.13 Gather wild food, hunt or harvest immature crops? │___│ 6.14 Decrease health expenditures? │___│ 6.15 Migrate more than usual to look for work or food? │___│
During the past 3 months, what are the major problems that youhave faced: 1= Yes / 2= No
6.16 Poor weather for agriculture │___│ 6.17 Low harvest or no harvest obtained this season │___│ 6.18 Mudslide │___│ 6.19 Loss of employment │___│ 6.20 Decrease of salary │___│ 6.21 Health problems │___│ 6.22 High food prices │___│ 6.23 High fuel prices │___│ 6.24 High cost of agricultural inputs for crops and/or animals (e.g. fertilizer, fuel, seed, fodder) │___│ 6.25 Violence, insecurity │___│ 6.26 Other (specify) ___________________________________________ │___│
During the past 3 months, have you received any of the following assistance: 1= Yes / 2= No
6.27 Food │__│ 6.28 Cash grant from NGO/UN/other │__│
6.29 Fertilizer │__│ 6.30 Household items (kitchen set,blankets) │__│
6.31 Hygiene kits (soap etc.) │__│ 6.32 Agricultural tools │__│
6.33 Seed 6.34 Other ________________
What are your 3 main priorities?
1= Food 2= Housing 3= Employment, work 4= Cash 5= Health 6= Schooling 7= Water 8= Sanitation 9= Cooking utensils 10= Bedding, furniture 11= Agricultural inputs/services 12= Land to cultivate 13= Livestock 14= Pastures for animals 15= Security 16=Repair of community infrastructure 17= Other (specify) ______________________
6.35 │___│ 1st priority
6.36 │___│2nd
priority
6.37 │___│3 priority
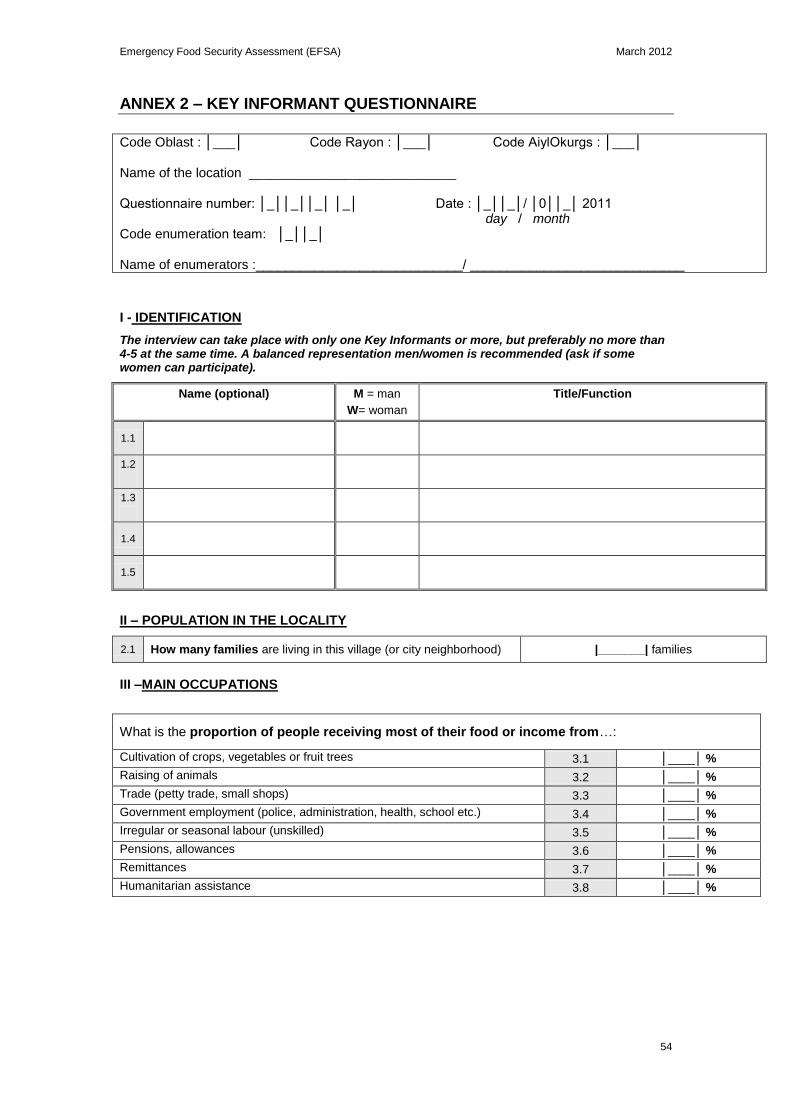
Emergency Food Security Assessment (EFSA) March 2012
54
ANNEX 2 – KEY INFORMANT QUESTIONNAIRE
Code Oblast : │___│ Code Rayon : │___│ Code AiylOkurgs : │___│ Name of the location ____________________________ Questionnaire number: │_││_││_│ │_│ Date : │_││_│/ │0││_│ 2011 day / month Code enumeration team: │_││_│ Name of enumerators :____________________________/ _____________________________
I - IDENTIFICATION
The interview can take place with only one Key Informants or more, but preferably no more than 4-5 at the same time. A balanced representation men/women is recommended (ask if some women can participate).
Name (optional) M = man
W= woman
Title/Function
1.1
1.2
1.3
1.4
1.5
II – POPULATION IN THE LOCALITY
2.1 How many families are living in this village (or city neighborhood) |_______| families
III –MAIN OCCUPATIONS
What is the proportion of people receiving most of their food or income from…:
Cultivation of crops, vegetables or fruit trees 3.1 │____│ %
Raising of animals 3.2 │____│ %
Trade (petty trade, small shops) 3.3 │____│ %
Government employment (police, administration, health, school etc.) 3.4 │____│ %
Irregular or seasonal labour (unskilled) 3.5 │____│ %
Pensions, allowances 3.6 │____│ %
Remittances 3.7 │____│ %
Humanitarian assistance 3.8 │____│ %
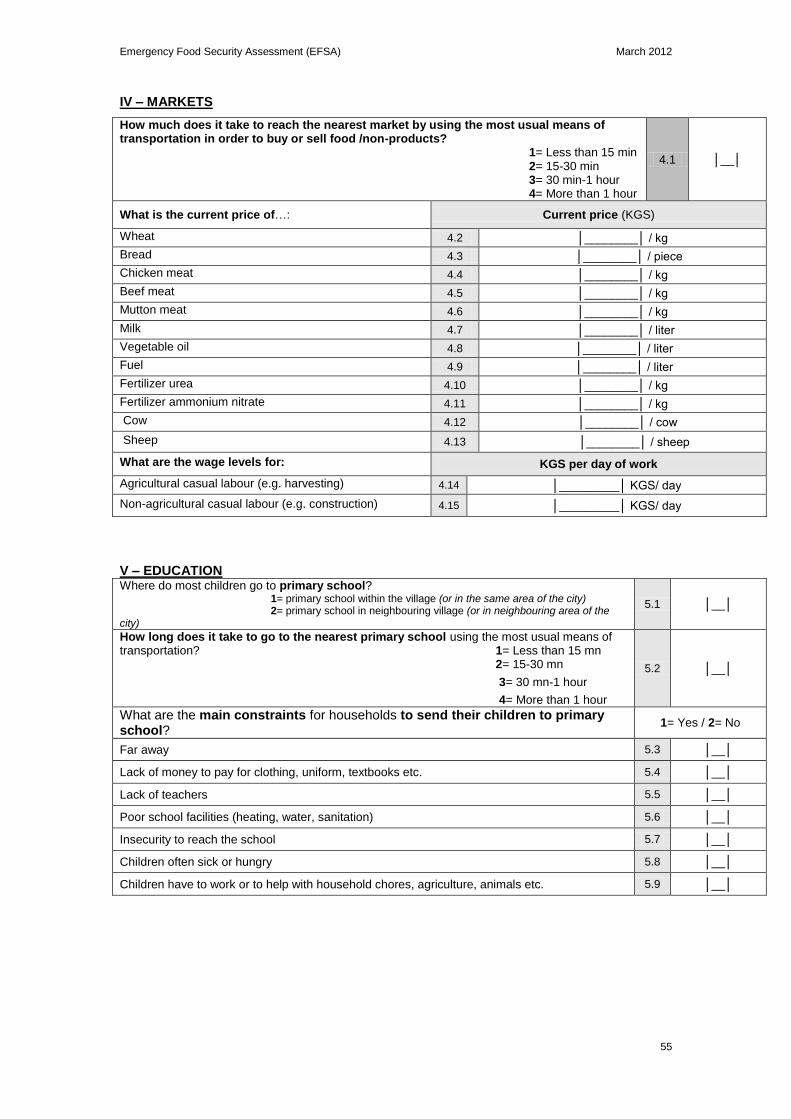
Emergency Food Security Assessment (EFSA) March 2012
55
IV – MARKETS
How much does it take to reach the nearest market by using the most usual means of transportation in order to buy or sell food /non-products?
1= Less than 15 min 2= 15-30 min 3= 30 min-1 hour 4= More than 1 hour
4.1 │__│
What is the current price of…: Current price (KGS)
Wheat 4.2 │________│ / kg
Bread 4.3 │________│ / piece Chicken meat 4.4 │________│ / kg Beef meat 4.5 │________│ / kg Mutton meat 4.6 │________│ / kg
Milk 4.7 │________│ / liter Vegetable oil 4.8 │________│ / liter
Fuel 4.9 │________│ / liter Fertilizer urea 4.10 │________│ / kg Fertilizer ammonium nitrate 4.11 │________│ / kg
Cow 4.12 │________│ / cow Sheep 4.13 │________│ / sheep
What are the wage levels for: KGS per day of work
Agricultural casual labour (e.g. harvesting) 4.14 │_________│ KGS/ day
Non-agricultural casual labour (e.g. construction) 4.15 │_________│ KGS/ day
V – EDUCATION Where do most children go to primary school? 1= primary school within the village (or in the same area of the city) 2= primary school in neighbouring village (or in neighbouring area of the city)
5.1 │__│
How long does it take to go to the nearest primary school using the most usual means of transportation? 1= Less than 15 mn 2= 15-30 mn
3= 30 mn-1 hour
4= More than 1 hour
5.2 │__│
What are the main constraints for households to send their children to primary school?
1= Yes / 2= No
Far away 5.3 │__│
Lack of money to pay for clothing, uniform, textbooks etc. 5.4 │__│
Lack of teachers 5.5 │__│
Poor school facilities (heating, water, sanitation) 5.6 │__│
Insecurity to reach the school 5.7 │__│
Children often sick or hungry 5.8 │__│
Children have to work or to help with household chores, agriculture, animals etc. 5.9 │__│
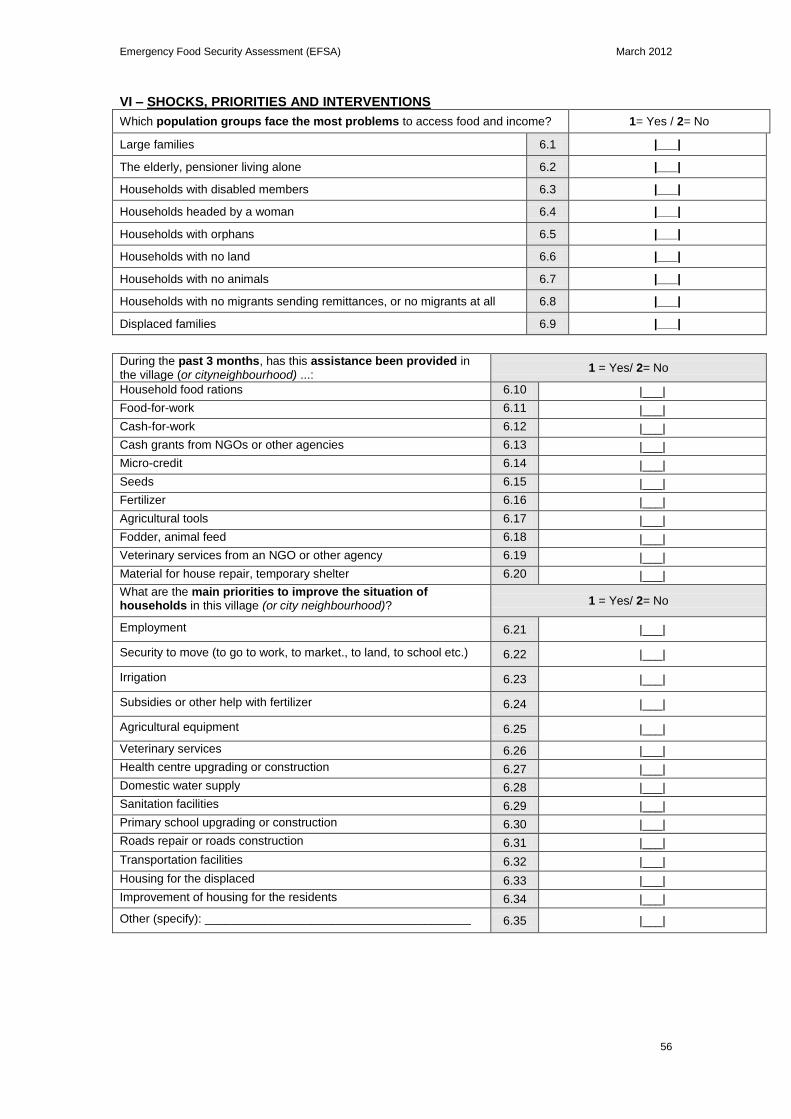
Emergency Food Security Assessment (EFSA) March 2012
56
VI – SHOCKS, PRIORITIES AND INTERVENTIONS
Which population groups face the most problems to access food and income? 1= Yes / 2= No
Large families 6.1 |___|
The elderly, pensioner living alone 6.2 |___|
Households with disabled members 6.3 |___|
Households headed by a woman 6.4 |___|
Households with orphans 6.5 |___|
Households with no land 6.6 |___|
Households with no animals 6.7 |___|
Households with no migrants sending remittances, or no migrants at all 6.8 |___|
Displaced families 6.9 |___|
During the past 3 months, has this assistance been provided in the village (or cityneighbourhood) ...:
1 = Yes/ 2= No
Household food rations 6.10 |___|
Food-for-work 6.11 |___|
Cash-for-work 6.12 |___|
Cash grants from NGOs or other agencies 6.13 |___|
Micro-credit 6.14 |___|
Seeds 6.15 |___|
Fertilizer 6.16 |___|
Agricultural tools 6.17 |___|
Fodder, animal feed 6.18 |___|
Veterinary services from an NGO or other agency 6.19 |___|
Material for house repair, temporary shelter 6.20 |___|
What are the main priorities to improve the situation of households in this village (or city neighbourhood)? 1 = Yes/ 2= No
Employment 6.21 |___|
Security to move (to go to work, to market., to land, to school etc.) 6.22 |___|
Irrigation 6.23 |___|
Subsidies or other help with fertilizer 6.24 |___|
Agricultural equipment 6.25 |___|
Veterinary services 6.26 |___|
Health centre upgrading or construction 6.27 |___|
Domestic water supply 6.28 |___|
Sanitation facilities 6.29 |___|
Primary school upgrading or construction 6.30 |___|
Roads repair or roads construction 6.31 |___|
Transportation facilities 6.32 |___|
Housing for the displaced 6.33 |___|
Improvement of housing for the residents 6.34 |___|
Other (specify): ________________________________________ 6.35 |___|
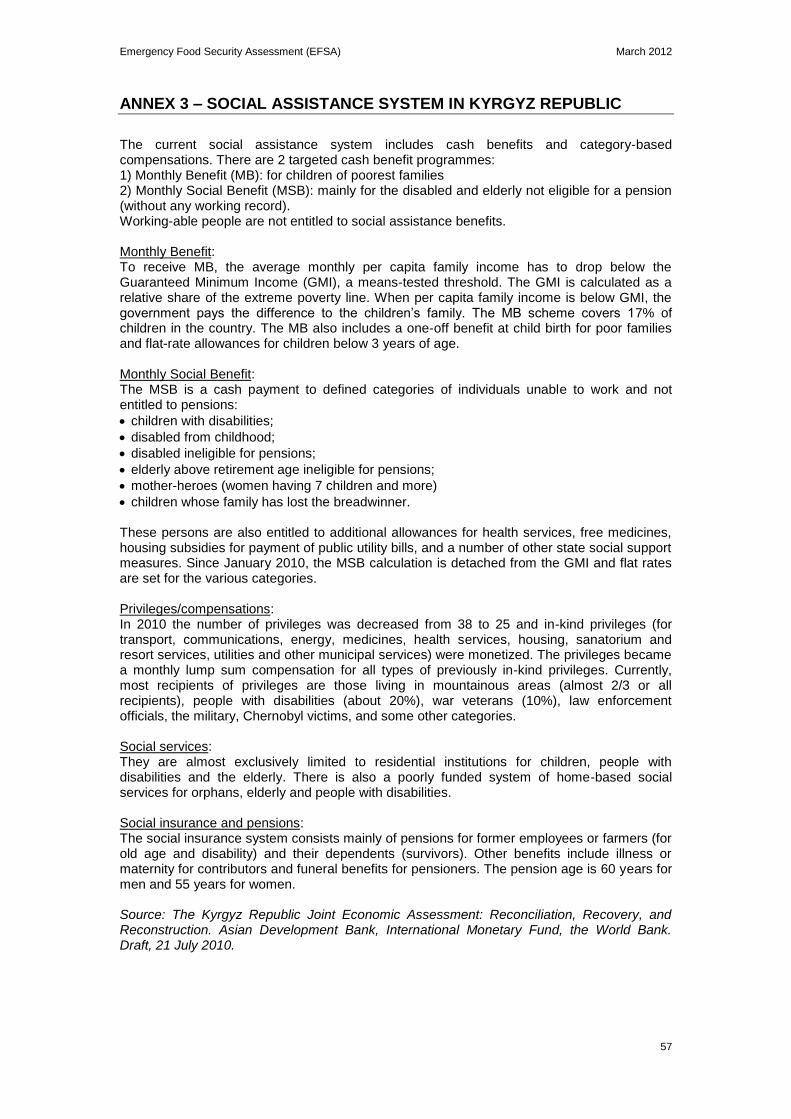
Emergency Food Security Assessment (EFSA) March 2012
57
ANNEX 3 – SOCIAL ASSISTANCE SYSTEM IN KYRGYZ REPUBLIC
The current social assistance system includes cash benefits and category-based compensations. There are 2 targeted cash benefit programmes: 1) Monthly Benefit (MB): for children of poorest families 2) Monthly Social Benefit (MSB): mainly for the disabled and elderly not eligible for a pension (without any working record). Working-able people are not entitled to social assistance benefits. Monthly Benefit: To receive MB, the average monthly per capita family income has to drop below the Guaranteed Minimum Income (GMI), a means-tested threshold. The GMI is calculated as a relative share of the extreme poverty line. When per capita family income is below GMI, the government pays the difference to the children‘s family. The MB scheme covers 17% of children in the country. The MB also includes a one-off benefit at child birth for poor families and flat-rate allowances for children below 3 years of age. Monthly Social Benefit: The MSB is a cash payment to defined categories of individuals unable to work and not entitled to pensions:
children with disabilities;
disabled from childhood;
disabled ineligible for pensions;
elderly above retirement age ineligible for pensions;
mother-heroes (women having 7 children and more)
children whose family has lost the breadwinner. These persons are also entitled to additional allowances for health services, free medicines, housing subsidies for payment of public utility bills, and a number of other state social support measures. Since January 2010, the MSB calculation is detached from the GMI and flat rates are set for the various categories. Privileges/compensations: In 2010 the number of privileges was decreased from 38 to 25 and in-kind privileges (for transport, communications, energy, medicines, health services, housing, sanatorium and resort services, utilities and other municipal services) were monetized. The privileges became a monthly lump sum compensation for all types of previously in-kind privileges. Currently, most recipients of privileges are those living in mountainous areas (almost 2/3 or all recipients), people with disabilities (about 20%), war veterans (10%), law enforcement officials, the military, Chernobyl victims, and some other categories. Social services: They are almost exclusively limited to residential institutions for children, people with disabilities and the elderly. There is also a poorly funded system of home-based social services for orphans, elderly and people with disabilities. Social insurance and pensions: The social insurance system consists mainly of pensions for former employees or farmers (for old age and disability) and their dependents (survivors). Other benefits include illness or maternity for contributors and funeral benefits for pensioners. The pension age is 60 years for men and 55 years for women. Source: The Kyrgyz Republic Joint Economic Assessment: Reconciliation, Recovery, and Reconstruction. Asian Development Bank, International Monetary Fund, the World Bank. Draft, 21 July 2010.
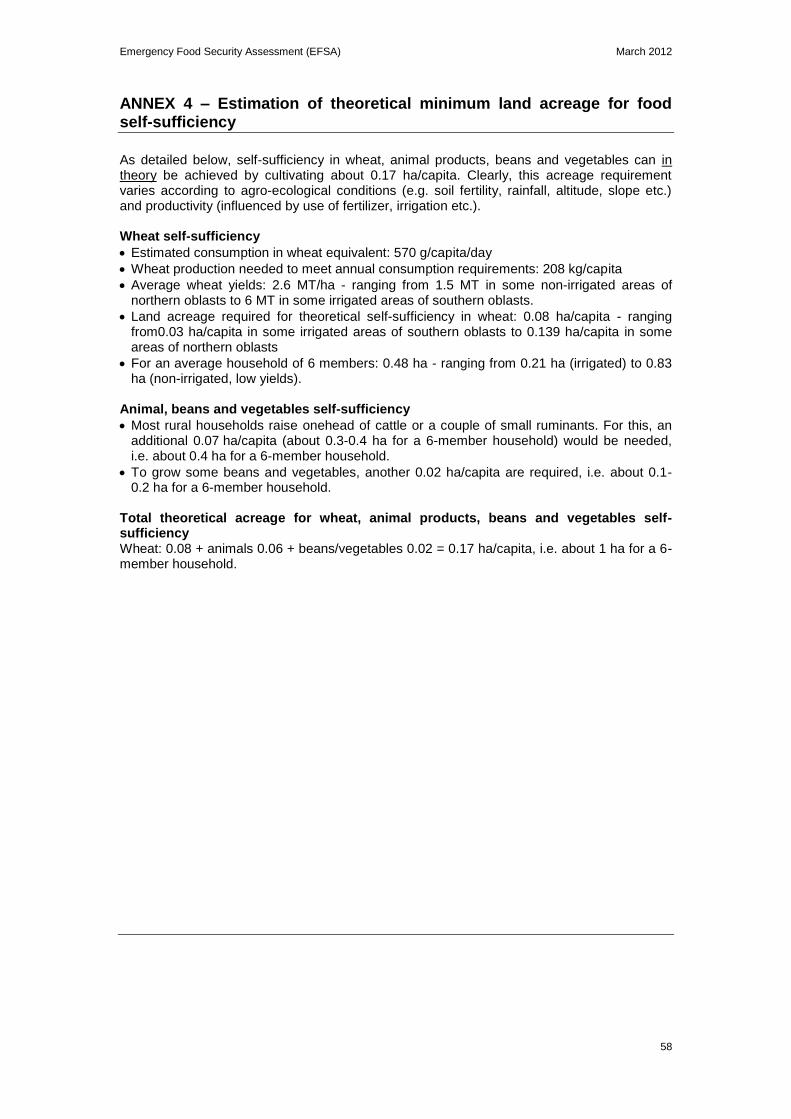
Emergency Food Security Assessment (EFSA) March 2012
58
ANNEX 4 – Estimation of theoretical minimum land acreage for food self-sufficiency
As detailed below, self-sufficiency in wheat, animal products, beans and vegetables can in theory be achieved by cultivating about 0.17 ha/capita. Clearly, this acreage requirement varies according to agro-ecological conditions (e.g. soil fertility, rainfall, altitude, slope etc.) and productivity (influenced by use of fertilizer, irrigation etc.). Wheat self-sufficiency
Estimated consumption in wheat equivalent: 570 g/capita/day
Wheat production needed to meet annual consumption requirements: 208 kg/capita
Average wheat yields: 2.6 MT/ha - ranging from 1.5 MT in some non-irrigated areas of northern oblasts to 6 MT in some irrigated areas of southern oblasts.
Land acreage required for theoretical self-sufficiency in wheat: 0.08 ha/capita - ranging from0.03 ha/capita in some irrigated areas of southern oblasts to 0.139 ha/capita in some areas of northern oblasts
For an average household of 6 members: 0.48 ha - ranging from 0.21 ha (irrigated) to 0.83 ha (non-irrigated, low yields).
Animal, beans and vegetables self-sufficiency
Most rural households raise onehead of cattle or a couple of small ruminants. For this, an additional 0.07 ha/capita (about 0.3-0.4 ha for a 6-member household) would be needed, i.e. about 0.4 ha for a 6-member household.
To grow some beans and vegetables, another 0.02 ha/capita are required, i.e. about 0.1-0.2 ha for a 6-member household.
Total theoretical acreage for wheat, animal products, beans and vegetables self-sufficiency Wheat: 0.08 + animals 0.06 + beans/vegetables 0.02 = 0.17 ha/capita, i.e. about 1 ha for a 6-member household.
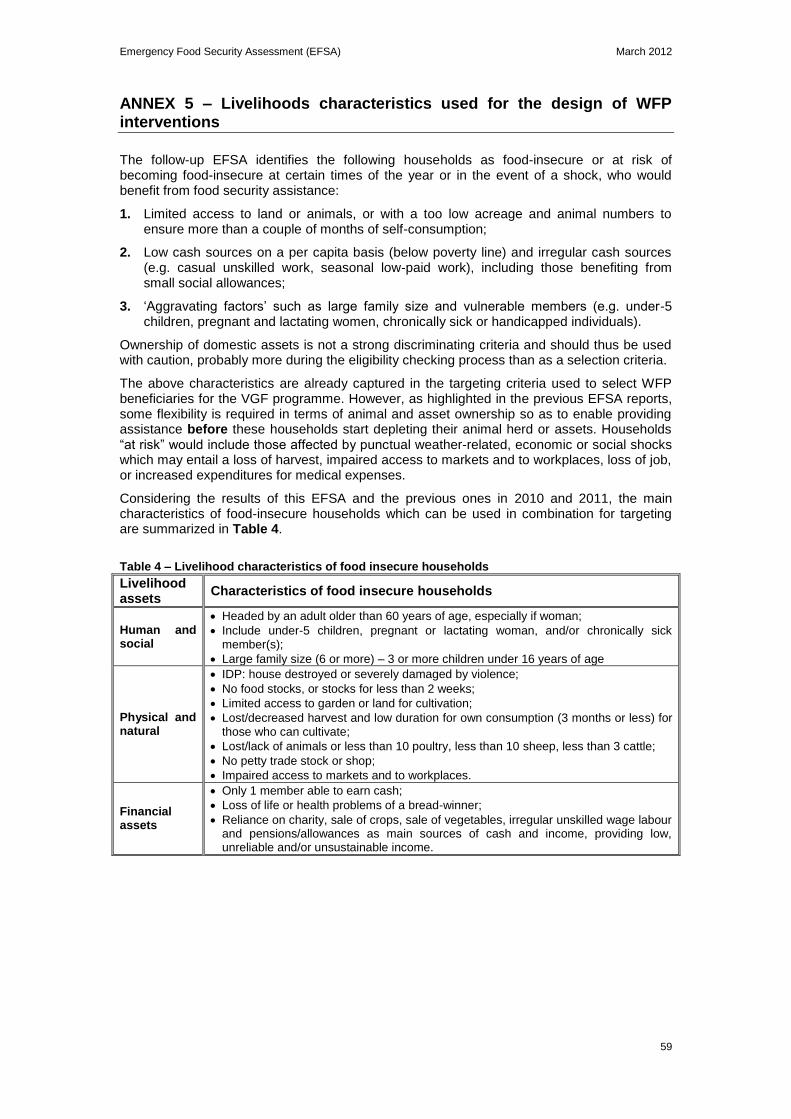
Emergency Food Security Assessment (EFSA) March 2012
59
ANNEX 5 – Livelihoods characteristics used for the design of WFP interventions
The follow-up EFSA identifies the following households as food-insecure or at risk of becoming food-insecure at certain times of the year or in the event of a shock, who would benefit from food security assistance:
1. Limited access to land or animals, or with a too low acreage and animal numbers to ensure more than a couple of months of self-consumption;
2. Low cash sources on a per capita basis (below poverty line) and irregular cash sources (e.g. casual unskilled work, seasonal low-paid work), including those benefiting from small social allowances;
3. ‗Aggravating factors‘ such as large family size and vulnerable members (e.g. under-5 children, pregnant and lactating women, chronically sick or handicapped individuals).
Ownership of domestic assets is not a strong discriminating criteria and should thus be used with caution, probably more during the eligibility checking process than as a selection criteria.
The above characteristics are already captured in the targeting criteria used to select WFP beneficiaries for the VGF programme. However, as highlighted in the previous EFSA reports, some flexibility is required in terms of animal and asset ownership so as to enable providing assistance before these households start depleting their animal herd or assets. Households ―at risk‖ would include those affected by punctual weather-related, economic or social shocks which may entail a loss of harvest, impaired access to markets and to workplaces, loss of job, or increased expenditures for medical expenses.
Considering the results of this EFSA and the previous ones in 2010 and 2011, the main characteristics of food-insecure households which can be used in combination for targeting are summarized in Table 4.
Table 4 – Livelihood characteristics of food insecure households
Livelihood assets
Characteristics of food insecure households
Human and social
Headed by an adult older than 60 years of age, especially if woman;
Include under-5 children, pregnant or lactating woman, and/or chronically sick member(s);
Large family size (6 or more) – 3 or more children under 16 years of age
Physical and natural
IDP: house destroyed or severely damaged by violence;
No food stocks, or stocks for less than 2 weeks;
Limited access to garden or land for cultivation;
Lost/decreased harvest and low duration for own consumption (3 months or less) for those who can cultivate;
Lost/lack of animals or less than 10 poultry, less than 10 sheep, less than 3 cattle;
No petty trade stock or shop;
Impaired access to markets and to workplaces.
Financial assets
Only 1 member able to earn cash;
Loss of life or health problems of a bread-winner;
Reliance on charity, sale of crops, sale of vegetables, irregular unskilled wage labour and pensions/allowances as main sources of cash and income, providing low, unreliable and/or unsustainable income.
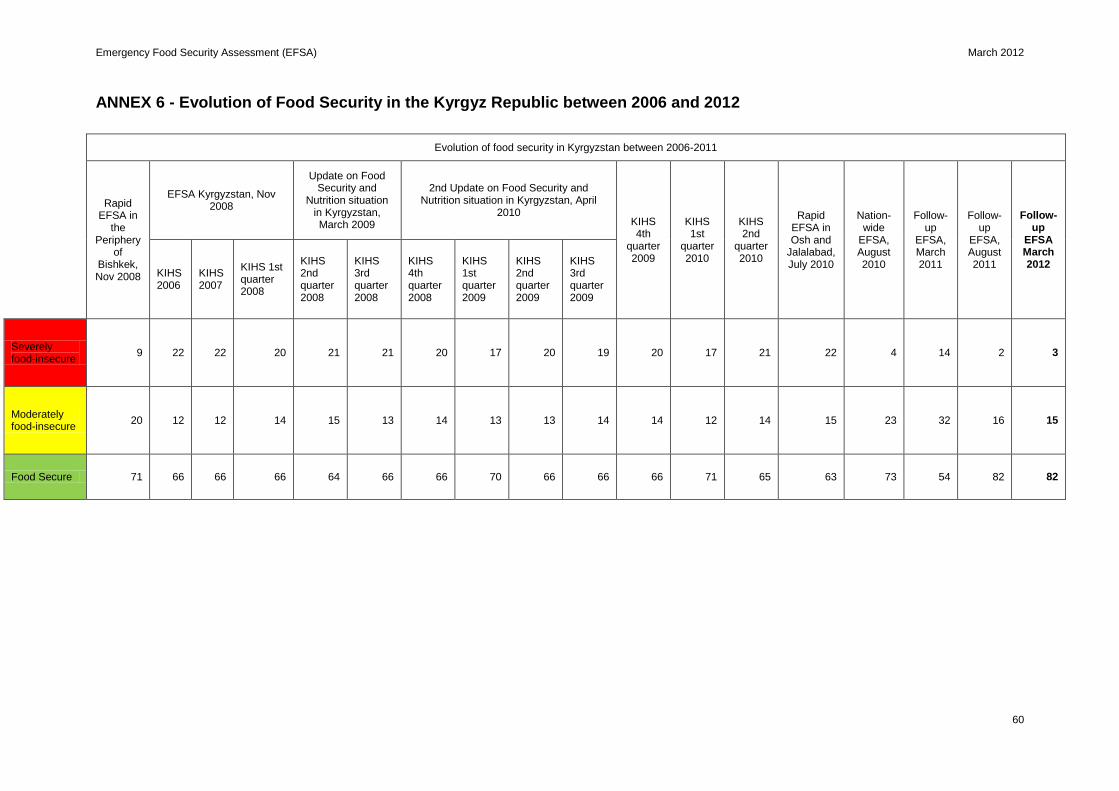
Emergency Food Security Assessment (EFSA) March 2012
60
ANNEX 6 - Evolution of Food Security in the Kyrgyz Republic between 2006 and 2012
Evolution of food security in Kyrgyzstan between 2006-2011
Rapid EFSA in
the Periphery
of Bishkek, Nov 2008
EFSA Kyrgyzstan, Nov 2008
Update on Food Security and
Nutrition situation in Kyrgyzstan, March 2009
2nd Update on Food Security and Nutrition situation in Kyrgyzstan, April
2010 KIHS 4th
quarter 2009
KIHS 1st
quarter 2010
KIHS 2nd
quarter 2010
Rapid EFSA in Osh and
Jalalabad, July 2010
Nation-wide
EFSA, August 2010
Follow-up
EFSA, March 2011
Follow-up
EFSA, August 2011
Follow-up
EFSA March 2012
KIHS 2006
KIHS 2007
KIHS 1st quarter 2008
KIHS 2nd quarter 2008
KIHS 3rd quarter 2008
KIHS 4th quarter 2008
KIHS 1st quarter 2009
KIHS 2nd quarter 2009
KIHS 3rd quarter 2009
Severely food-insecure
9 22 22 20 21 21 20 17 20 19 20 17 21 22 4 14 2 3
Moderately food-insecure
20 12 12 14 15 13 14 13 13 14 14 12 14 15 23 32 16 15
Food Secure 71 66 66 66 64 66 66 70 66 66 66 71 65 63 73 54 82 82

Emergency Food Security Assessment (EFSA) March 2012
61
ANNEX 7 - Food security profile by oblast
Areas (Oblasts)
Food Insecurity level (%)
Shocks (•) and positive factors (○) to food security in March 2012 Chronic food security factors in March 2012
2010 2011 2012
Aug Mar Aug Mar
Bishkek 1% 16% 1% 4%
Increased price of animal fodder and livestock particularly livestock farmers
Increased prices of meat and milk
o Decreased prices of wheat flour, potato, vegetable (potentially negative for producers)
Small size of land for cultivation
Chuy 6% 22% 10% 13%
Increased price of animal fodder and livestock particularly livestock farmers
Increased prices of meat and milk
o Decreased prices of wheat flour, potato, vegetable (potentially negative for producers)
Naryn 12% 27% 42% 38%
High proportion of household with credit or loans to reimburse (52%)
Increased price of animal fodder and livestock particularly livestock farmers
Increased prices of meat and milk
o Decreased prices of wheat flour, potato, vegetable (potentially negative for producers) o Long duration of potato stocks (potentially negative).
Large proportions of
households living in
extreme poverty
Issyk-kul 40% 39% 22% 17%
High proportion of household with credit or loans to reimburse (34%)
Increased price of animal fodder and livestock particularly livestock farmers
Increased prices of meat and milk
Consumed seed stocks and decreased expenditure for agricultural inputs
o Decreased prices of wheat flour, potato, vegetable (potentially negative for producers) o Reduced proportion of households living in extreme poverty
High proportion of stunting among under-five children
Talas 38% 48% 19% 38%
Deterioration of food diversity (X in August 2011 and Y in March 2012)
Large proportion of average proportion of household food expenditure (57%).
High proportion of household with credit or loans to reimburse (28%)
Increased price of animal fodder and livestock particularly livestock farmers
Increased prices of meat and milk
o Long duration of potato stocks (108 days, the second highest among all oblasts) o Decreased prices of wheat flour, potato, vegetable (potentially negative for producers)
High proportion of stunting among U5C
High proportion of anemia among PLW
Large proportion of households living in extreme poverty
High proportion of food expenditure
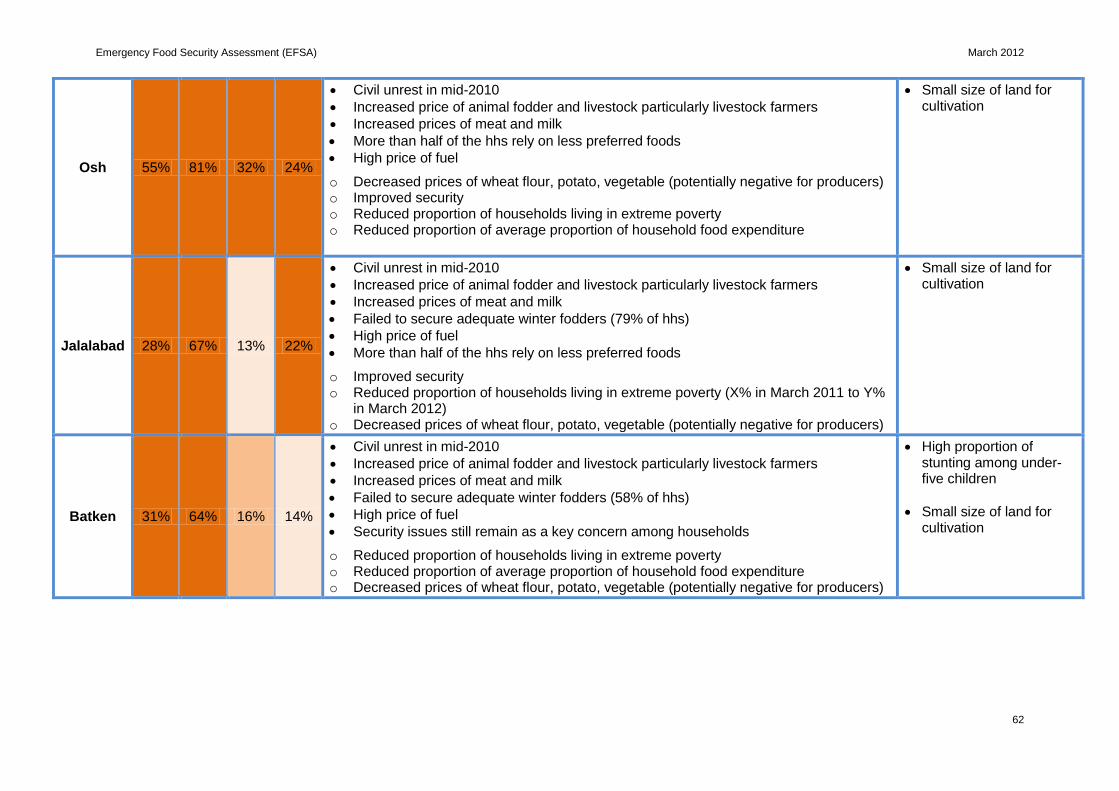
Emergency Food Security Assessment (EFSA) March 2012
62
Osh 55% 81% 32% 24%
Civil unrest in mid-2010
Increased price of animal fodder and livestock particularly livestock farmers
Increased prices of meat and milk
More than half of the hhs rely on less preferred foods
High price of fuel
o Decreased prices of wheat flour, potato, vegetable (potentially negative for producers) o Improved security o Reduced proportion of households living in extreme poverty o Reduced proportion of average proportion of household food expenditure
Small size of land for cultivation
Jalalabad 28% 67% 13% 22%
Civil unrest in mid-2010
Increased price of animal fodder and livestock particularly livestock farmers
Increased prices of meat and milk
Failed to secure adequate winter fodders (79% of hhs)
High price of fuel
More than half of the hhs rely on less preferred foods
o Improved security o Reduced proportion of households living in extreme poverty (X% in March 2011 to Y%
in March 2012) o Decreased prices of wheat flour, potato, vegetable (potentially negative for producers)
Small size of land for cultivation
Batken 31% 64% 16% 14%
Civil unrest in mid-2010
Increased price of animal fodder and livestock particularly livestock farmers
Increased prices of meat and milk
Failed to secure adequate winter fodders (58% of hhs)
High price of fuel
Security issues still remain as a key concern among households
o Reduced proportion of households living in extreme poverty o Reduced proportion of average proportion of household food expenditure o Decreased prices of wheat flour, potato, vegetable (potentially negative for producers)
High proportion of stunting among under-five children
Small size of land for cultivation
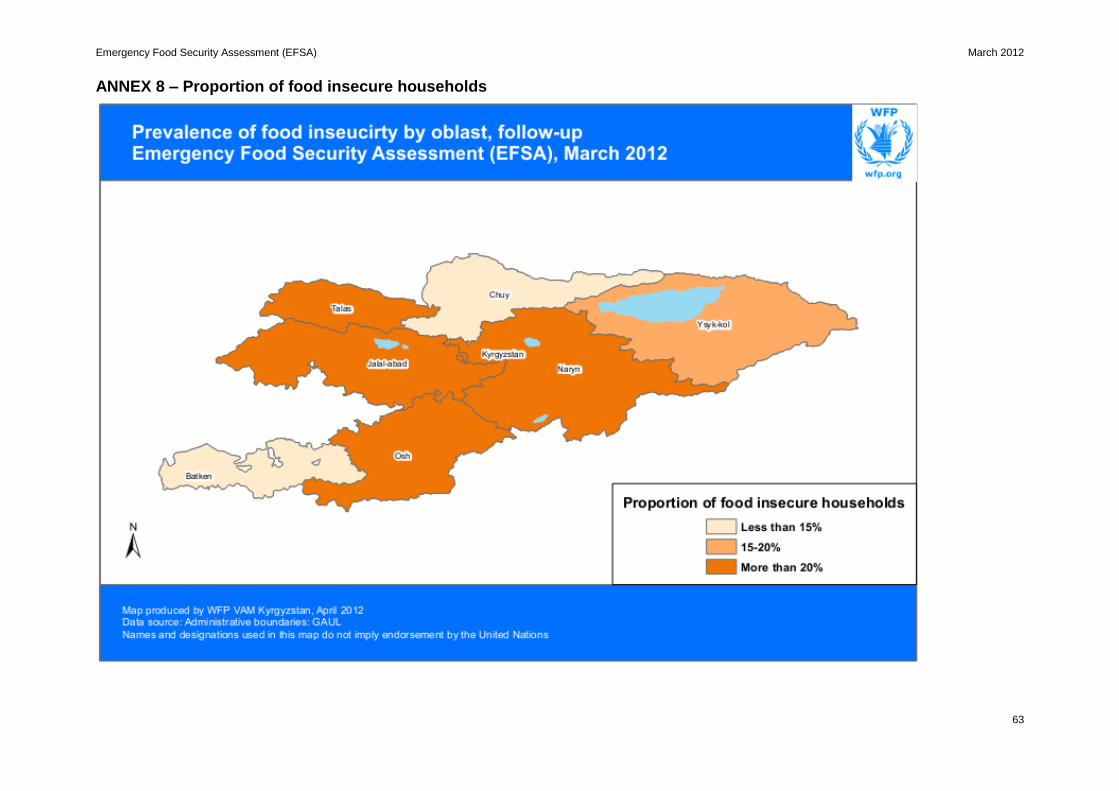
Emergency Food Security Assessment (EFSA) March 2012
63
ANNEX 8 – Proportion of food insecure households

Emergency Food Security Assessment (EFSA) March 2012
0