Embed Size (px)
Citation preview

MIT ICAT
Philippe A. Bonnefoy
R. John Hansman
MIT Global Airline Industry Program -
Industry Advisory Board MeetingMassachusetts Institute of Technology
Nov. 6th
2008
Air Transportation Infrastructure Systems Worldwide; Air Transportation Infrastructure Systems Worldwide; Opportunities for Infrastructure and Technology Opportunities for Infrastructure and Technology
ImprovementsImprovements

MIT ICAT
0
250
500
750
1,000
1,250
1,500
1970 1980 1990 2000 2010
Rev
enue
Pas
seng
er K
ilom
eter
s (b
illio
n)
Motivation & Research Objectives
Increasing demand for air transportation
Key air transportation infrastructure constraints (i.e. capacity)
Implications:•
congestion,•
degradation of the passengers’
quality of travel experience,
•
economic impacts.
Air transportation system is a vital underlying infrastructure of a country’s economy
Analyze the characteristics and capabilities of national airport networks worldwide.
Evaluate the opportunities and the implications of next generation air transportation technologies to improve the access to these airport systems.
2
Historical Evolution of Passenger Traffic (Revenue Passenger Kilometers -
RPKs) from 1971 to 2007
Introduction
Data sources: ICAO (1971-2005) and IATA (2006-2007)
North America
Europe
Asia-PacificMiddle East
Latin America
Africa
MIT ICAT
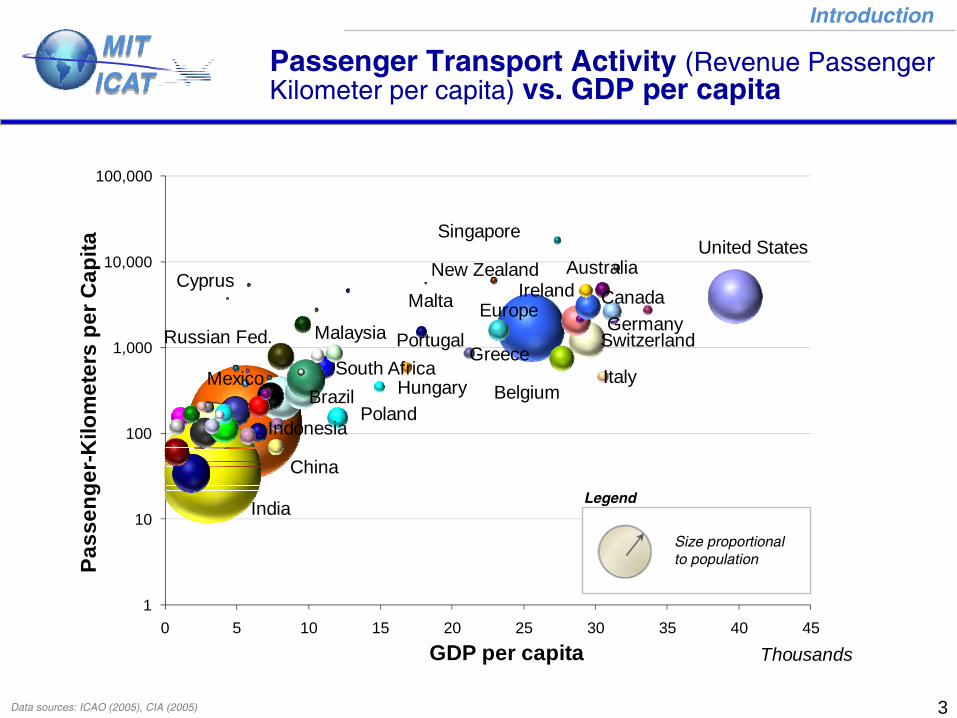
Passenger Transport Activity (Revenue Passenger Kilometer per capita) vs. GDP per capita
3
Introduction
China
Europe
United States
Brazil
Australia
Germany
Ireland
Portugal
PolandHungary
Singapore
South AfricaMexico
Indonesia
Canada
BelgiumItaly
Malta
Greece
Cyprus
India
Russian Fed. Malaysia
New Zealand
Switzerland
1
10
100
1,000
10,000
100,000
0 5 10 15 20 25 30 35 40 45
Pass
enge
r-K
ilom
eter
s pe
r Cap
ita
GDP per capita Thousands
Legend
Size proportional to population
Data sources: ICAO (2005), CIA (2005)

MIT ICAT Approach
Analyzed of the current characteristics and the capabilities of the national airport networks of 190 countries worldwide,
•
Data sources:
Worldwide airport database; Digital Aeronautical Flight Information File (DAFIF 2005),
Population and aggregate airport data from the Central Intelligence Agency (CIA) World Fact Book database (CIA 2006).
Performed a detailed multiple case study analysis of the national airport networks from 8 countries
•
Countries selected based on their characteristics and potential for improvement (identified in phase 1 of the approach),
•
Cases illustrate and contrast the opportunities and the implications of these technologies and capabilities across different types of air transportation systems,
•
Wide array of detailed population distribution databases,•
Country specific information was used in each case study.
Reviewed and analyzed next generation air transportation system technologies and capabilities
•
Literature review,•
Discussion of the implications for potential improvements identified in phase 1 and 2.
4
Research Approach & Methodology
MIT ICAT
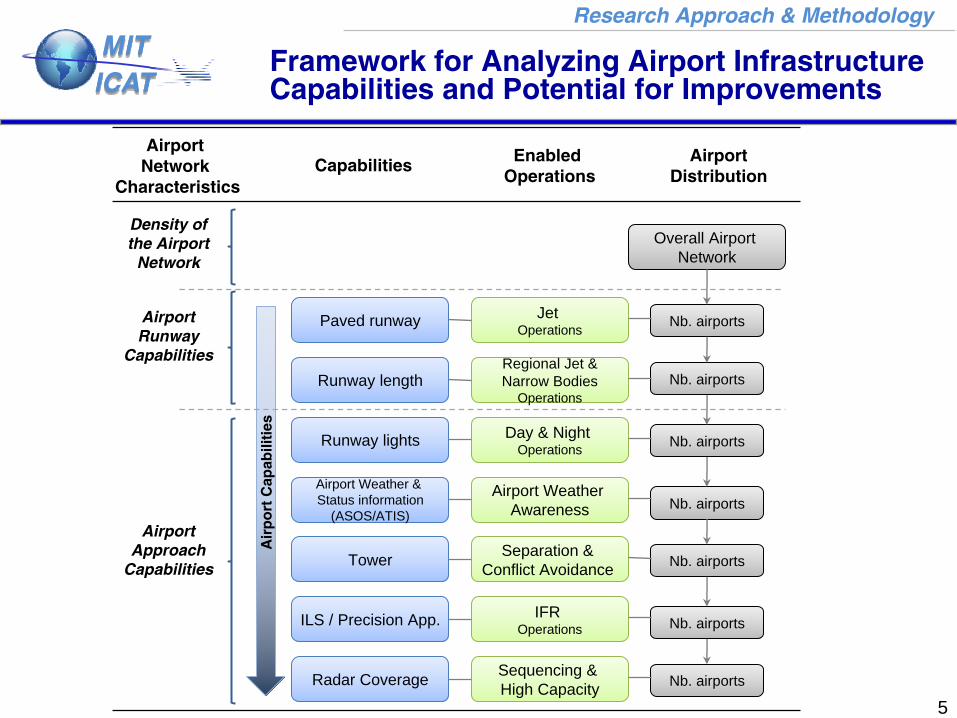
Framework for Analyzing Airport Infrastructure Capabilities and Potential for Improvements
5
Research Approach & Methodology
Runway length
Runway lights
Airport Weather & Status information
(ASOS/ATIS)
Tower
ILS / Precision App.
Radar Coverage
Regional Jet &Narrow Bodies
Operations
Day & Night Operations
Airport Weather Awareness
Separation & Conflict Avoidance
IFR Operations
Sequencing & High Capacity
Paved runway Jet Operations
Overall Airport Network
Capabilities Enabled Operations
Airport Distribution
Nb. airports
Nb. airports
Nb. airports
Nb. airports
Nb. airports
Nb. airports
Nb. airports
Air
po
rt C
apab
iliti
es
Airport Network
Characteristics
Density of the Airport
Network
Airport Runway
Capabilities
Airport Approach
Capabilities

MIT ICAT World Airport Network
World airport network in numbers:•
45,813 airports,•
14,000 airports with at least one paved runway,•
6,750 airports with at least one paved runway longer than 5,000 ft, •
950 airports with at least one paved runway longer than 10,000 ft.
6
Overview of World Airport Network
Data source: DAFIF (2005)

MIT ICAT Analysis of Airport Network Density
Computed ratio of population over the total number of existing airports for each country.
•
Metric that better reflects the adequacy between potential supply of air transportation services and potential demand.
Great diversity in this ratio, indicative of the ability of different countries to accommodate future demand.
All else being equal, countries with high ratio of population to number of existing airports are more likely to need the construction of new airports.
•
e.g. China and India will require significant future development of airport infrastructure as their GDP per capita increases.
•
United States and Europe generally have airport networks that are large enough compared to their population basins that they can rely on existing airports to accommodate future growth. 7
Analyses of the Characteristics and Capabilities of National Airport Systems
Data source: CIA (2007)
10,000 100,000 1,000,000 10,000,000
BangladeshIndiaChina
VietnamNigeriaGhana
PakistanUgandaEthiopia
EgyptJapanTurkey
AfghanistanNepal
ThailandTaiwan
MoroccoYemen
UzbekistanKorea, South
ItalySudan
RomaniaIndonesiaPhilippinesTanzaniaPoland
Korea, NorthSpainCongoIraq
AlgeriaMalaysia
IranKenya
GermanyUnited Kingdom
FranceSaudi Arabia
PeruUkraineRussia
VenezuelaSouth Africa
MexicoColombia
BrazilArgentinaCanada
United States
Ratio of Population over Total Number of Existing Airports
Average = 372,000 (190 countries)
Countries with low potential
for new airports
Countries with high potential
for new airports

MIT ICAT Analysis of Airport Runway Capabilities
Analysis based on data from the Central Intelligence Agency (CIA) World Fact Book database,
Results aggregated into 17 world sub-
regions.
•
On average worldwide, 30% of all airports have paved runways and 15% have at least one runway longer than 5,000 ft.
•
Low end, Melanesia (6% of its airport equipped with paved runway and 3% with runways longer than 5,000 ft). Followed closely by Eastern Africa and Central America.
•
Opposite end, in Eastern Asia (despite having high potential for new airports) 76% of all airports have paved runways and 56% have runways longer than 5,000 ft.
8Data source: CIA (2007)
0% 20% 40% 60% 80% 100%
Total number of existing airports
Airports with paved runways
Airports with runways >5,000 ft
Percentage of Airport Equipped
LegendMelan
esia
Central A
merica
South America
Eastern Africa
Southe
rn Africa
Middle Africa
Northern America
South‐Eastern Asia
Polyne
sia
Western Africa
Eastern Eu
rope
Caribb
ean
Western Europ
eAustralia and
New
Zea
land
Northern Eu
rope
Southe
rn Europ
eMicrone
sia
Southe
rn Asia
Western Asia
Central A
sia
Northern Africa
Eastern Asia
Average for all sub-regions (covering190 countries)
Aggregate result by sub-region
Analyses of the Characteristics and Capabilities of National Airport Systems
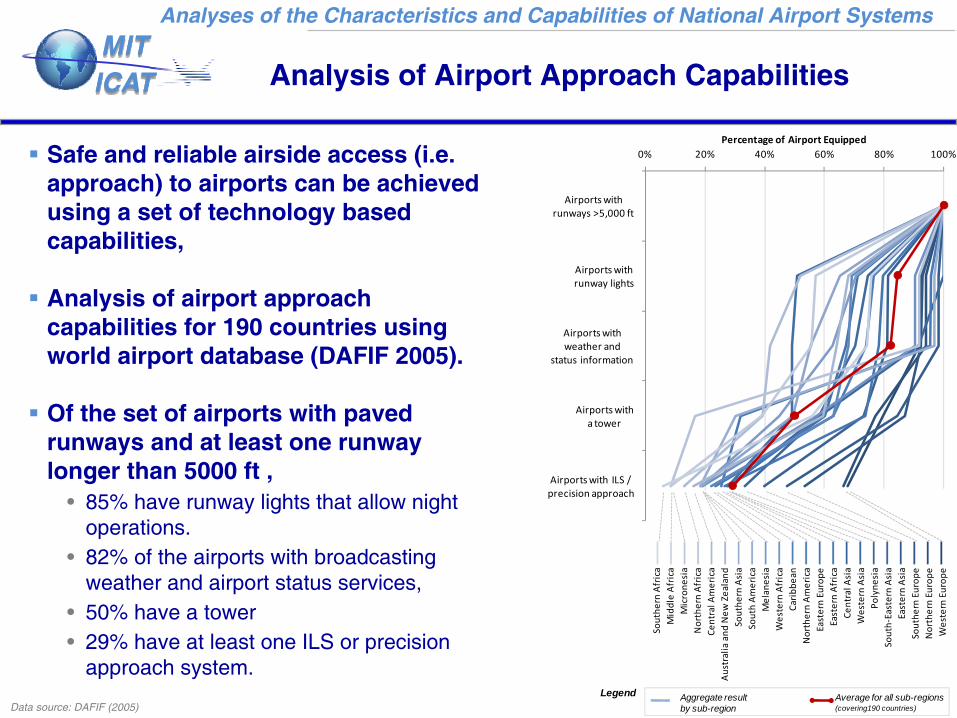
MIT ICAT Analysis of Airport Approach Capabilities
Safe and reliable airside access (i.e. approach) to airports can be achieved using a set of technology based capabilities,
Analysis of airport approach capabilities for 190 countries using world airport database (DAFIF 2005).
Of the set of airports with paved runways and at least one runway longer than 5000 ft ,
•
85% have runway lights that allow night operations.
•
82% of the airports with broadcasting weather and airport status services,
•
50% have a tower •
29% have at least one ILS or precision approach system.
9Data source: DAFIF (2005)
0% 20% 40% 60% 80% 100%
Airports with runways >5,000 ft
Airports with runway lights
Airports with weather and
status information
Airports witha tower
Airports with ILS /precision approach
Percentage of Airport Equipped
Southe
rn Africa
Middle Africa
Microne
sia
Northern Africa
Central A
merica
Australia and
New
Zealand
Southe
rn Asia
South America
Melanesia
Western Africa
Caribb
ean
Northern America
Eastern Europe
Eastern Africa
Central A
sia
Western Asia
Polyne
sia
South‐Eastern Asia
Eastern Asia
Southe
rn Europ
eNorthern Europe
Western Europ
e
Legend Average for all sub-regions (covering190 countries)
Aggregate result by sub-region
Analyses of the Characteristics and Capabilities of National Airport Systems

MIT ICAT
Potential Improvements of National Airport Network Capabilities
Comparative analysis of capabilities and potential improvement across national airport networks based on the analyses of:
•
(1) the density of the airport network with regard to population in each country,
•
(2) the airport runway capabilities of existing airports,
•
(3) the airport approach capabilities,
Used a Potential Improvement Index (PII)
•
where Pi,c
is the percentage of airports equipped with capability i in the set c,
•
n is the number of capabilities in this set c•
Index ranges from 0 to 1.
0 = no potential improvement (airports in the airport network are fully equipped),
1 = full potential for improvement (exhibit none of the capabilities) 10
Summary of Analyses of National Airport Network Capabilities
Data sources: CIA (2007), DAFIF (2005)
Low potential High potential
Low
pot
entia
lH
igh
pote
ntia
l
Ave
rage
Average
Legend Countries with low potential for new airports
Countries with high potential for new airports

MIT ICAT
Airport System in the United States
Density of the airport network: •
14,800 airports,•
Very low ratio of population over number of airports (i.e. 20,300),
Airport runway capabilities:•
5100 with paved runways, •
1800 with a runway longer than 5,000 ft.
Airport approach capabilities:•
96% have runway lights making them accessible by night VFR operations,
•
95% have airport information services, •
33% have a tower,•
28% have at least one ILS or precision approach.
Generally, there is very good access to airports in the United States
Limited potential improvement of airport access 11
Legend
Airport (unpaved runway and/or runway shorter than 5000 ft)
Airport with paved runway and longer than 5000 ft
Airport with paved runway >5000 ft, tower, ILS/Precision approach
Case Study Analysis
Data sources: DAFIF (2005), U.S. Census (2000)
0%
20%
40%
60%
80%
100%
0 5 10 15 20 25 30 35 40 45 50Pe
rcen
tage
of T
otal
Pop
ulat
ion
Distance (miles) from the airportExisting airports
Airports with paved runways longer than 5000ft
Airports with paved runways longer than 5000ft and approach capabilities
1
2
3
Legend
Effect of the construction of new airports1
2
3
Effect of the enhancement of airport physical infrastructure (pavement and lengthening of existing runways)
Effect of the improvement of airport airside access capabilities(installation of new technologies)
MIT ICAT
0%
20%
40%
60%
80%
100%
0 5 10 15 20 25 30 35 40 45 50
Perc
enta
ge o
f Tot
al P
opul
atio
n
Distance (miles) from the airportExisting airports
Airports with paved runways longer than 5000ft
Airports with paved runways longer than 5000ft and approach capabilities
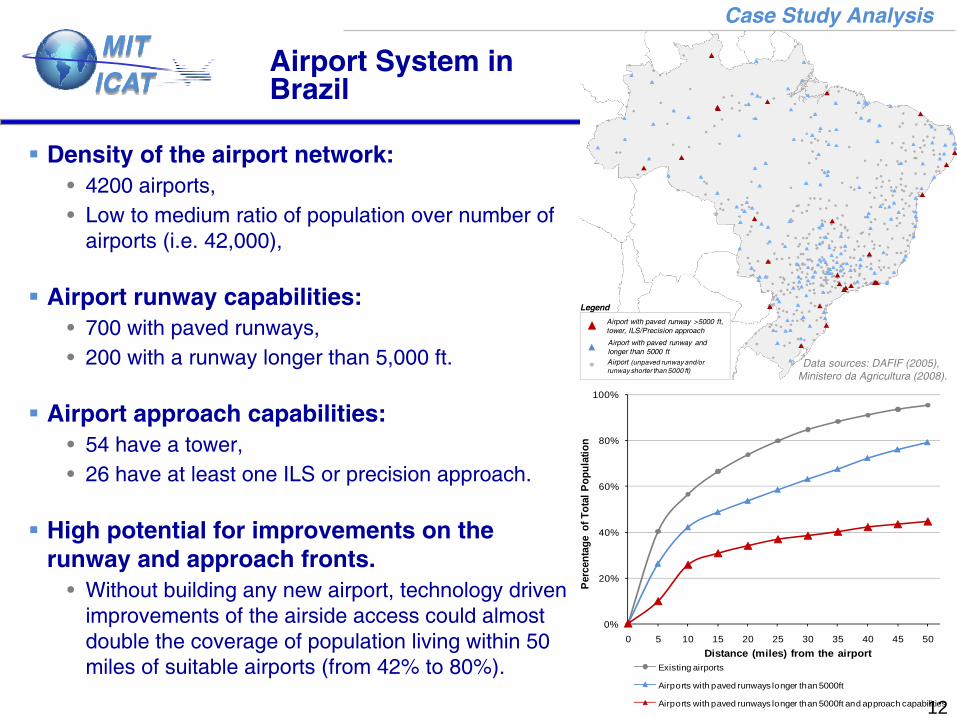
Airport System in Brazil
Density of the airport network: •
4200 airports,•
Low to medium ratio of population over number of airports (i.e. 42,000),
Airport runway capabilities:•
700 with paved runways, •
200 with a runway longer than 5,000 ft.
Airport approach capabilities:•
54 have a tower,•
26 have at least one ILS or precision approach.
High potential for improvements on the runway and approach fronts.
•
Without building any new airport, technology driven improvements of the airside access could almost double the coverage of population living within 50 miles of suitable airports (from 42% to 80%).
12
Legend
Airport (unpaved runway and/or runway shorter than 5000 ft)
Airport with paved runway and longer than 5000 ft
Airport with paved runway >5000 ft, tower, ILS/Precision approach
Case Study Analysis
Data sources: DAFIF (2005), Ministero da Agricultura (2008).

MIT ICAT
0%
20%
40%
60%
80%
100%
0 5 10 15 20 25 30 35 40 45 50
Perc
enta
ge o
f Tot
al P
opul
atio
n
Distance (miles) from the airportExisting airports
Airports with paved runways longer than 5000ft
Airports with paved runways longer than 5000ft and approach capabilities
Legend
Airport System in France
Density of the airport network: •
470 airports,•
Low to medium ratio of population over number of airports (i.e. 128,000),
Airport runway capabilities:•
61% with paved runways, •
30% with a runway longer than 5,000 ft.
Airport approach capabilities:•
78% have at least one ILS or precision approach.
Very good access to equipped airports in France;
•
99.8% of the population living within 50 miles of an airport,
•
99.5% within 50 miles of a “fully”
equipped airport.
Very limited potential for improving access to airports. 13
Legend
Airport (unpaved runway and/or runway shorter than 5000 ft)
Airport with paved runway and longer than 5000 ft
Airport with paved runway >5000 ft, tower, ILS/Precision approach
Paris
Marseille
Lyon
ToulouseNice
Case Study Analysis
Data sources: DAFIF (2005), INSEE (2005)

MIT ICAT
Airport System in Poland
Density of the airport network: •
122 airports,•
Medium ratio of population over number of airports (i.e. 312,000),
Airport runway capabilities:•
68% with paved runways, •
60% with a runway longer than 5,000 ft.
Airport approach capabilities:•
43% have a tower,•
33% have at least one ILS or precision approach.
Next generation air transportation system technologies have potential to improve access to airports.
14
Legend
Airport (unpaved runway and/or runway shorter than 5000 ft)
Airport with paved runway and longer than 5000 ft
Airport with paved runway >5000 ft, tower, ILS/Precision approach
Warsaw
Krakow
Lodz
Wroclaw
Posnan
Case Study Analysis
Data sources: Polish Central Statistical Office (2008), National
Imagery and Mapping Agency –
Poland (2003), DAFIF (2005).
0%
20%
40%
60%
80%
100%
0 5 10 15 20 25 30 35 40 45 50
Perc
enta
ge o
f Tot
al P
opul
atio
n
Distance (miles) from the airportExisting airports
Airports with paved runways longer than 5000ft
Airports with paved runways longer than 5000ft and approach capabilities
Legend

MIT ICAT
0%
20%
40%
60%
80%
100%
0 5 10 15 20 25 30 35 40 45 50
Per
cent
age
of T
otal
Pop
ulat
ion
Distance (miles) from the airport
Existing airports
Airports with paved runways longer than 5000ft
Airports with paved runways longer than 5000ft and approach capabilities
Legend
Airport System in India
Density of the airport network: •
341 airports,•
Very high ratio of population over number of airports (i.e. 3.3 million),
Airport runway capabilities:•
240 with paved runways, •
140 with a runway longer than 5,000 ft.
Airport approach capabilities:•
26 have at least one ILS or precision approach.
Significant potential for technology driven improvement of the airport airside access.
•
60% of the Indian population lives within 50 miles of an airport.
•
Equipping current airports with airside access technologies would significantly improve access to airports (fully equipped airports) from 25% to 50%.
15
Legend
Airport (unpaved runway and/or runway shorter than 5000 ft)
Airport with paved runway and longer than 5000 ft
Airport with paved runway >5000 ft, tower, ILS/Precision approach
Mumbai
Delhi
Bangalore
Kolkata
Chennai
Case Study Analysis
Data sources: DAFIF (2005), ML Infomap, (2002).
MIT ICAT
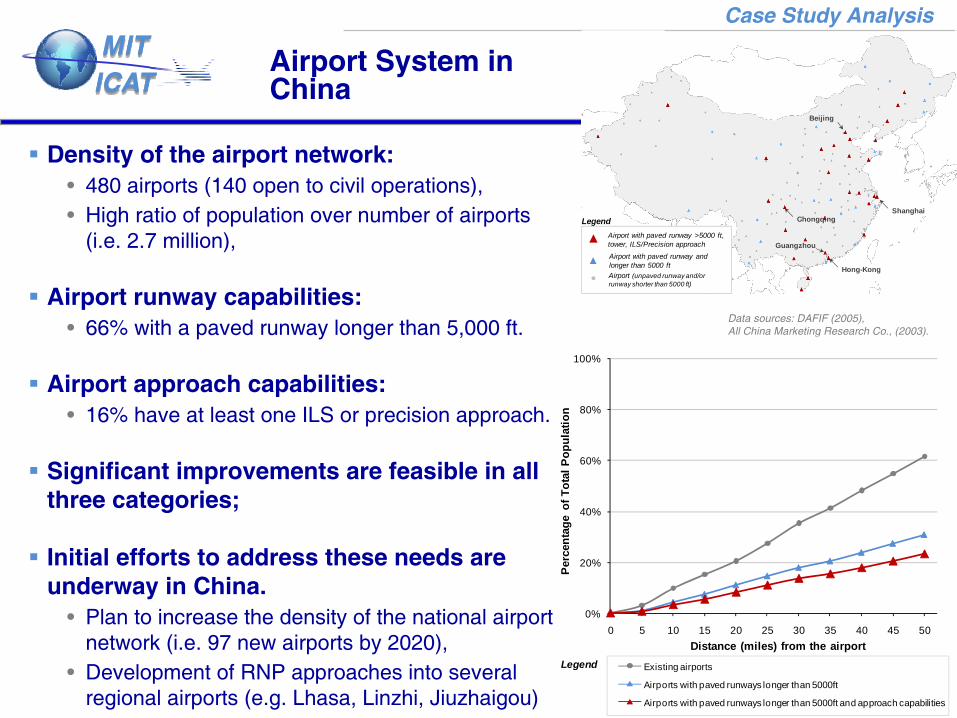
Airport System in China
Density of the airport network: •
480 airports (140 open to civil operations),•
High ratio of population over number of airports (i.e. 2.7 million),
Airport runway capabilities:•
66% with a paved runway longer than 5,000 ft.
Airport approach capabilities:•
16% have at least one ILS or precision approach.
Significant improvements are feasible in all three categories;
Initial efforts to address these needs are underway in China.
•
Plan to increase the density of the national airport network (i.e. 97 new airports by 2020),
•
Development of RNP approaches into several regional airports (e.g. Lhasa, Linzhi, Jiuzhaigou) 16
Case Study Analysis
Data sources: DAFIF (2005), All China Marketing Research Co., (2003).
Legend
Airport (unpaved runway and/or runway shorter than 5000 ft)
Airport with paved runway and longer than 5000 ft
Airport with paved runway >5000 ft, tower, ILS/Precision approach
Shanghai
Beijing
Hong-Kong
Guangzhou
Chongqing
0%
20%
40%
60%
80%
100%
0 5 10 15 20 25 30 35 40 45 50
Perc
enta
ge o
f Tot
al P
opul
atio
n
Distance (miles) from the airport
Existing airports
Airports with paved runways longer than 5000ft
Airports with paved runways longer than 5000ft and approach capabilities
Legend

MIT ICAT Airport System in Nepal
National airport network•
48 airports, •
10 with paved runways,•
1 with a runway longer than 5000ft,•
0 airport with ILS.
Due to difficult terrain conditions (i.e. hilly and mountainous terrain in the northern two-
thirds of the country)
the ground transportation network is limited and expensive to build.
Nepal relies heavily on air transportation for regional transport and tourism.
Next generation technologies could be used to improve access to existing airports and provide reliable and safe approaches in Nepal’s airports.
17
Case Study Analysis
Legend
Airport (unpaved runway and/or runway shorter than 5000 ft)
Airport with paved runway and longer than 5000 ft
Airport with paved runway >5000 ft, tower, ILS/Precision approach
KathmanduPatanBhaktapur
Biratnagar
Pokhara
Data sources: DAFIF (2005), World Airport Codes (2008).

MIT ICAT Airport System in Ethiopia
National airport network•
84 airports,•
13 have runways longer than 5,000 ft,•
1 airport is fully equipped.
Population: 83 million (in 2007)•
second most populous country in Africa after Nigeria.
Country characterized by an inadequate road transport network.
•
Fifth lowest road network length per capita in the world,
•
Poor conditions with only 4300 miles of paved roads.
Air transportation is an important part of the Ethiopian transportation network.
Improvements in the air transportation network and infrastructure would lead to positive economic impact in Ethiopia. 18
Case Study Analysis
Legend
Airport (unpaved runway and/or runway shorter than 5000 ft)
Airport with paved runway and longer than 5000 ft
Airport with paved runway >5000 ft, tower, ILS/Precision approach
Adis AbebaAmara
Dire Dawa
Data sources: DAFIF (2005), World Airport Codes (2008).

MIT ICAT
Opportunities for Infrastructure and Technological Improvements
19
Runway length
Runway lights
Airport Weather & Status information
(ASOS/ATIS)
Tower
ILS / Precision App.
Radar Coverage
Regional Jet &Narrow Bodies
Operations
Day & Night Operations
Airport Weather Awareness
Separation & Conflict Avoidance
IFR Operations
Sequencing & High Capacity
Paved runway Jet Operations
Overall Airport Network
Capabilities Enabled Operations
Airport Distribution
Nb. airports
Nb. airports
Nb. airports
Nb. airports
Nb. airports
Nb. airports
Nb. airports
Air
po
rt C
apab
iliti
es
Airport Network
Characteristics
Density of the Airport
Network
Airport Runway
Capabilities
Airport Approach
Capabilities
Enabling Changes
LED lights
Sensors & Info. Broadcast
Info. Broadcast/ADS-B
SBAS/GBAS& RNP
Virtual Tower/Self Separation
Enabling Next Gen. Technology
Infrastructure Improvements
Next Gen. Aircraft(STOL) Runway
Extension
RunwayPavement

MIT ICAT Conclusions
Analyzed •
current characteristics and capabilities of 190 national airport
systems worldwide,
(1) the density of the airport network with regard to population
in each country,
(2) the airport runway capabilities (of existing airports),
(3) the airport approach capabilities (of existing airports).
•
investigated the opportunities for infrastructure improvements including using next generation air transportation system technologies.
Analyses showed significant differences between the nature and the capabilities of airport infrastructure across world regions.
•
North American and the European systems exhibit good access to air transportation due to high density of airports.
•
In other regions such as Asia (e.g. China, India), a latent need
for the construction of new airports was identified.
Potential from new technologies and capabilities;•
improve the efficiency of operations in regions with more mature
air transportation infrastructure systems but marginal improvements for enhanced access.
•
in developing and emerging regions that these technologies and capabilities are more likely to have the greatest impact on improved access to air transportation by opening up the set of non-utilized and under-equipped airports. 20

MIT ICAT
Questions &
Comments
21
Thank you!