Embed Size (px)
Citation preview

EMC® Ionix™
ControlCenter®
6.1
Performance Manager Metrics GlossaryP/N 300-006-360REV A09

EMC Ionix ControlCenter 6.1 Performance Manager Metrics Glossary2
Copyright © 2007 - 2011 EMC Corporation. All rights reserved. Published in the USA.
Published August 2011
EMC believes the information in this publication is accurate as of its publication date. The information is subject to change without notice.
The information in this publication is provided as is. EMC Corporation makes no representations or warranties of any kind with respect to the information in this publication, and specifically disclaims implied warranties of merchantability or fitness for a particular purpose. Use, copying, and distribution of any EMC software described in this publication requires an applicable software license.
EMC2, EMC, EMC Centera, EMC ControlCenter, EMC LifeLine, EMC OnCourse, EMC Proven, EMC Snap, EMC SourceOne, EMC Storage Administrator, Acartus, Access Logix, AdvantEdge, AlphaStor, ApplicationXtender, ArchiveXtender, Atmos, Authentica, Authentic Problems, Automated Resource Manager, AutoStart, AutoSwap, AVALONidm, Avamar, Captiva, Catalog Solution, C-Clip, Celerra, Celerra Replicator, Centera, CenterStage, CentraStar, ClaimPack, ClaimsEditor, CLARiiON, ClientPak, Codebook Correlation Technology, Common Information Model, Configuration Intelligence, Connectrix, CopyCross, CopyPoint, CX, Dantz, Data Domain, DatabaseXtender, Direct Matrix Architecture, DiskXtender, DiskXtender 2000, Document Sciences, Documentum, elnput, E-Lab, EmailXaminer, EmailXtender, Enginuity, eRoom, Event Explorer, FarPoint, FirstPass, FLARE, FormWare, Geosynchrony, Global File Virtualization, Graphic Visualization, Greenplum, HighRoad, HomeBase, InfoMover, Infoscape, InputAccel, InputAccel Express, Invista, Ionix, ISIS, Max Retriever, MediaStor, MirrorView, Navisphere, NetWorker, OnAlert, OpenScale, PixTools, Powerlink, PowerPath, PowerSnap, QuickScan, Rainfinity, RepliCare, RepliStor, ResourcePak, Retrospect, RSA, SafeLine, SAN Advisor, SAN Copy, SAN Manager, Smarts, SnapImage, SnapSure, SnapView, SRDF, StorageScope, SupportMate, SymmAPI, SymmEnabler, Symmetrix, Symmetrix DMX, Symmetrix VMAX, TimeFinder, UltraFlex, UltraPoint, UltraScale, Unisphere, Viewlets, Virtual Matrix, Virtual Matrix Architecture, Virtual Provisioning, VisualSAN, VisualSRM, VMAX, VNX, VNXe, Voyence, VPLEX, VSAM-Assist, WebXtender, xPression, xPresso, YottaYotta, the EMC logo, and the RSA logo, are registered trademarks or trademarks of EMC Corporation in the United States and other countries. Vblock is a trademark of EMC Corporation in the United States.
All other trademarks used herein are the property of their respective owners.
For the most up-to-date regulatory document for your product line, go to the technical documentation and advisories section on the EMC online support website.

EMC Ionix ControlCenter 6.1 Performance Manager Metrics Glossary 3
CONTENTS
Preface
Chapter 1 Performance Manager Metrics Glossary
Celerra (Nascontainer) Metrics ......................................................... 9Celerra CIFS metrics ................................................................... 9Celerra Data Mover metrics ...................................................... 10Celerra file system I/O metrics ................................................. 11Celerra network metrics ........................................................... 12Celerra NT call metrics ............................................................. 13Celerra port metrics ................................................................. 13Celerra SMB call metrics .......................................................... 13Celerra Trans2 call metrics....................................................... 14
CLARiiON Metrics........................................................................... 14CLARiiON disk metrics.............................................................. 14CLARiiON LUN metrics.............................................................. 16CLARiiON Snap Session metrics ............................................... 20CLARiiON storage processor (SP) metrics ................................. 21
Connectivity (Switch) Metrics ......................................................... 22Connectivity device port metrics .............................................. 22
HDS Metrics................................................................................... 24HDS device metrics.................................................................. 24HDS port metrics...................................................................... 26
Host Metrics .................................................................................. 26Host CPU metrics ..................................................................... 26Host device metrics ................................................................. 27Host logical volume metrics ..................................................... 27Host HP device metrics ............................................................ 29Host MVS device metrics ......................................................... 29
Oracle Metrics ............................................................................... 30Oracle file metrics.................................................................... 30Oracle segment metrics ........................................................... 30
Symmetrix Metrics ......................................................................... 31Symmetrix device metrics ........................................................ 31Symmetrix disk metrics............................................................ 37Symmetrix disk director metrics............................................... 39Symmetrix host director metrics .............................................. 41Symmetrix port metrics ............................................................ 43

4 EMC Ionix ControlCenter 6.1 Performance Manager Metrics Glossary
Contents
Symmetrix VMAX port metrics .................................................. 43Symmetrix SRDF metrics .......................................................... 44Symmetrix SRDF/A metrics....................................................... 44Symmetrix system metrics ....................................................... 46

EMC Ionix ControlCenter 6.1 Performance Manager Metrics Glossary 5
PREFACE
As part of an effort to improve its product lines, EMC periodically releases revisions of its software and hardware. Therefore, some functions described in this document might not be supported by all versions of the software or hardware currently in use. The product release notes provide the most up-to-date information on product features.
Contact your EMC representative if a product does not function properly or does not function as described in this document.
Note: This document was accurate at publication time. New versions of this document might be released on the EMC online support website. Check the EMC online support website to ensure that you are using the latest version of this document.
AudienceThis document lists the metrics and definitions that provide monitoring capabilities for the EMC Ionix ControlCenter Performance Manager application. This document is part of the Ionix ControlCenter documentation set, and is intended for users of the Performance Manager application.
Related documentationIoinx ControlCenter documentation is available in the following locations:
◆ Your Ionix ControlCenter installation kit installs a documentation library as part of the software.
◆ You can install an independent documentation library by running ControlCenterLibrary.exe from the last CD.
◆ EMC online support (http://Powerlink.EMC.com) supplies updated versions of each document, as well as hosting the Doc Updater executable which can install a new documentation library independent of the software installation or refresh all existing documentation libraries on your host.
◆ After installation or updating, the Ionix ControlCenter Documentation Library is available from a desktop icon and the Ionix ControlCenter Console's help menu.

6 EMC Ionix ControlCenter 6.1 Performance Manager Metrics Glossary
Preface
Conventions used in this documentEMC uses the following conventions for special notices:
Note: A note presents information that is important, but not hazard-related.
IMPORTANT
An important notice contains information essential to software or hardware operation.
Typographical conventions
EMC uses the following type style conventions in this document:
Normal Used in running (nonprocedural) text for:• Names of interface elements, such as names of windows, dialog boxes, buttons, fields, and
menus• Names of resources, attributes, pools, Boolean expressions, buttons, DQL statements,
keywords, clauses, environment variables, functions, and utilities• URLs, pathnames, filenames, directory names, computer names, links, groups, service keys,
file systems, and notifications
Bold Used in running (nonprocedural) text for names of commands, daemons, options, programs, processes, services, applications, utilities, kernels, notifications, system calls, and man pages
Used in procedures for:• Names of interface elements, such as names of windows, dialog boxes, buttons, fields, and
menus• What the user specifically selects, clicks, presses, or types
Italic Used in all text (including procedures) for:• Full titles of publications referenced in text• Emphasis, for example, a new term• Variables
Courier Used for:• System output, such as an error message or script• URLs, complete paths, filenames, prompts, and syntax when shown outside of running text
Courier bold Used for specific user input, such as commands
Courier italic Used in procedures for:• Variables on the command line• User input variables
< > Angle brackets enclose parameter or variable values supplied by the user
[ ] Square brackets enclose optional values

EMC Ionix ControlCenter 6.1 Performance Manager Metrics Glossary 7
Preface
Where to get helpEMC support, product, and licensing information can be obtained as follows:
Product information. For documentation, release notes, software updates, or information about EMC products, licensing, and service, go to the EMC online support website (registration required) at:
http://Powerlink.EMC.com
Technical support — For technical support, go to EMC online support and select Support. On the Support page, you will see several options, including one to create a service request. Note that to open a service request, you must have a valid support agreement. Contact your EMC sales representative for details about obtaining a valid support agreement or with questions about your account.
Your commentsYour suggestions will help us continue to improve the accuracy, organization, and overall quality of the user publications. Send your opinions of this document to:
| Vertical bar indicates alternate selections — the bar means “or”
{ } Braces enclose content that the user must specify, such as x or y or z
... Ellipses indicate nonessential information omitted from the example

8 EMC Ionix ControlCenter 6.1 Performance Manager Metrics Glossary
Preface

Performance Manager Metrics Glossary 9
Performance Manager Metrics Glossary
This glossary provides definitions for EMC Ionix ControlCenter Performance Manager metrics. Some performance metrics may be unavailable to your configuration; for example, if your configuration does not include an HDS array, you do not see the HDS metrics.
The contents includes the following:
◆ Celerra (Nascontainer) Metrics ........................................................................... 9◆ CLARiiON Metrics ............................................................................................. 14◆ Connectivity (Switch) Metrics............................................................................ 22◆ HDS Metrics ..................................................................................................... 24◆ Host Metrics..................................................................................................... 26◆ Oracle Metrics .................................................................................................. 30◆ Symmetrix Metrics............................................................................................ 31
Celerra (Nascontainer) Metrics
Celerra CIFS metrics
The following table lists and defines Celerra® Common Internet File System (CIFS) metrics, which include information about NT (Windows NT function) calls, SMB (Service Message Block protocol) calls, and Trans2 (2nd Transform function) calls.
Table 1 Celerra CIFS metrics (page 1 of 2)
Metric Definition
average nt call time (ms) (total nt call time) / (total nt calls per sec)Average time (in milliseconds) for an NT call.
average smb call time (ms) (total smb call time) / (total smb calls per sec)Average time (in milliseconds) for a SMB call.
average trans2 call time (ms) (total trans2 call time) / (total trans2 calls per sec) Average time (in milliseconds) for a Trans2 call.
total cifs calls per sec Total number of CIFS calls each second.
total nt call time (ms) per sec Total NT call time (in milliseconds) performed each second.
total nt calls per sec Total number of NT calls performed each second.

10 EMC Ionix ControlCenter 6.1 Performance Manager Metrics Glossary
Performance Manager Metrics Glossary
Celerra Data Mover metrics
The following table lists and defines Celerra Data Mover metrics.
total smb call time (ms) per sec Total SMB call time (in milliseconds) performed each second.
total smb calls per sec Total number of SMB calls performed each second.
total trans2 call time (ms) per sec Total trans2 call time (in milliseconds) performed each second.
total trans2 calls per sec Total number of trans2 calls performed each second.
Table 1 Celerra CIFS metrics (page 2 of 2)
Table 2 Celerra Data Mover metrics
Metric Definition
free memory [Kbytes] Amount of free memory in kilobytes.
Kbytes read per sec Number of kilobytes read each second from the Data Mover.
Kbytes transferred per sec (Kbytes read per sec) + (Kbytes written per sec)Number of kilobytes transferred each second from the Data Mover.
Kbytes written per sec Number of kilobytes written each second from the Data Mover.
read requests per sec Number of read requests each second.
requests per sec (read requests per sec) + (write requests per sec)Number of requests each second.
write requests per sec Number of write requests each second.

Celerra (Nascontainer) Metrics 11
Performance Manager Metrics Glossary
Celerra file system I/O metrics
The following table lists and defines Celerra file system I/O metrics, which include Celerra file system usage metrics.
Table 3 Celerra file system I/O metrics
Metric Definition
% nodes used 100 * (nodes used / total nodes) Percentage of total nodes used.
% space used 100 * (space used (Kbytes) / total space (Kbytes)) Percentage of total nodes used.
Kbytes read per sec Number of kilobytes read each second from file system.
Kbytes transferred per sec (Kbytes read per sec) + (Kbytes written per sec)Number of kilobytes transferred each second from file system.
Kbytes written per sec Number of kilobytes written each second from file system each second.
nodes used Number of nodes used for file system.
read requests per sec Number of read requests performed each second.
requests per sec (Read requests per sec) + (Write requests per sec)Number of requests performed each second.
space used [Kbytes] Amount of space (in kilobytes) used for file system.
total nodes Number of nodes available.
total space [Kbytes] Total amount of space available in kilobytes.
write requests per sec Number of write requests each second.

12 EMC Ionix ControlCenter 6.1 Performance Manager Metrics Glossary
Performance Manager Metrics Glossary
Celerra network metrics
The following table lists and defines Celerra network metrics.
Table 4 Celerra network metrics
Metric Definition
ip packets delivered per sec Number of IP packets delivered each second.
ip packets received not forwardable per sec
Number of IP packets received but not forwarded each second.
ip packets received per sec Number of IP packets received each second.
ip packets sent per sec Number of IP packets received and forwarded each second.
tcp connection requests per sec Number of requests each second for TCP/IP connections.
tcp connections lingered per sec Number of connections with close requests initiated but remaining open until a close message is received from the client (connection lingered).
tcp packets received per sec Number of data units received each second by the Data Mover from the network.
tcp packets retransmitted per sec Number of data units resent (retransmitted) each second.
tcp packets sent per sec Number of data units sent each second from the Data Mover across the network.
tcp resets per sec Number of times each second that TCP/IP connections were reset.
udp packets bad ports per sec Number of packets received each second with an inappropriate port designation (bad ports).
udp packets delivered per sec Number of packets delivered each second by the Data Mover.
udp packets incompleted per sec Number of packets received each second with inappropriate headers (incomplete headers).
udp packets sent per sec Number of packets sent each second by the Data Mover.

Celerra (Nascontainer) Metrics 13
Performance Manager Metrics Glossary
Celerra NT call metrics
The following table lists and defines Celerra NT (Windows NT function) call metrics.
Celerra port metrics
The following table lists and defines Celerra port metrics.
Celerra SMB call metrics
SMB (Service Message Block protocol) calls are identified by the NAS server name and the call type.
Table 5 Celerra NT call metrics
Metric Definition
average call time(microseconds)
(1000 * total time for calls per sec) / (calls per sec)Average call time each second.
call type Type of call.
calls per sec Number of calls each second.
Table 6 Celerra port metrics
Metric Definition
Kbytes read per sec Number of kilobytes read each second from the port.
Kbytes transferred per sec (Kbytes read per sec) + (Kbytes written per sec) Number of kilobytes transferred through the port each second.
Kbytes written per sec Number of kilobytes written each second into the port.
nas port number Number of the NAS port.
Table 7 Celerra SMB call metrics
Metric Definition
average call time (microseconds) (1000 * total time for calls per sec) / (calls per sec)Average call time each second.
call type Type of call.
calls per sec Number of calls each second.

14 EMC Ionix ControlCenter 6.1 Performance Manager Metrics Glossary
Performance Manager Metrics Glossary
Celerra Trans2 call metrics
Trans2 (2nd Transform function) calls are identified by the NAS server name and the call type.
CLARiiON Metrics
CLARiiON disk metrics
The following table lists and defines CLARiiON® disk metrics.
Table 8 Celerra Trans2 call metrics
Metric Definition
average call time (microseconds) (1000 * total time for calls per sec) / (calls per sec)Average call time each second.
call type Type of call.
calls per sec Number of calls each second.
Table 9 CLARiiON disk metrics (page 1 of 2)
Metric Definition
% Utilization 100 * (Busy Ticks/s) / (Busy Ticks/s + Idle Ticks/s)Percentage of time that the disk was busy serving incoming requests.Busy Ticks/s: Number of ticks (1 tick = 100 ms) that occurred when this disk was busy.Idle Ticks/s: Number of ticks (1 tick = 100 ms) that occurred when this disk was idle.
Average Busy Queue Length (Sum Queue Lengths - Number Arrivals With Non Zero Queue / 2) / (Read Throughput [IO/s] + Write Throughput [IO/s])
Sum Queue Lengths Number of requests waiting for the disk within a time interval, including the current request in service.
Number Arrivals With Non Zero Queue Number of times that a user request arrived while at least one other request was being performed.
Average Seek Distance [GB] (Sum Blocks Seeked/s) / (Total Throughput [IO/s])Sum Blocks Seeked/s: Number of blocks accessed on the disk in response to an I/O request.

CLARiiON Metrics 15
Performance Manager Metrics Glossary
Queue Length (Average Busy Queue Length) * (% Utilization)Average number of requests that are waiting while the disk is busy, including the current request in service.
Read Bandwidth [MB/s] Number of read I/O operations in megabytes performed each second by the disk.
Read Size [KB] (Read Bandwidth [MB/s]) * 1024 / (Read Throughput [IO/s)Size of read I/O operations (in kilobytes).
Read Throughput [IO/s] Number of read I/O operations performed each second by the disk.
Response Time [ms] 1000 * (Queue Length) / (Total Throughput [IO/s])Number of milliseconds required to respond to a request including time spent waiting for a response.
Service Time [ms] 1000 * (% Utilization) / (Total Throughput [IO/s])Number of milliseconds required to service a request, but not including time spent waiting for service.
Total Bandwidth [MB/s] (Read Bandwidth [MB/s]) + (Write Bandwidth [MB/s])
Total Throughput [IO/s] (Read Throughput [IO/s]) + (Write Throughput [IO/s])
Write Bandwidth [MB/s] Number of write I/O operations (in megabytes) performed each second by the disk.
Write Size [KB] (Write Bandwidth [MB/s]) *1024 / (Write Throughput [IO/s])Size of write I/O operations (in kilobytes).
Write Throughput [IO/s] Number of write I/O operations performed each second by the disk.
Table 9 CLARiiON disk metrics (page 2 of 2)
Metric Definition

16 EMC Ionix ControlCenter 6.1 Performance Manager Metrics Glossary
Performance Manager Metrics Glossary
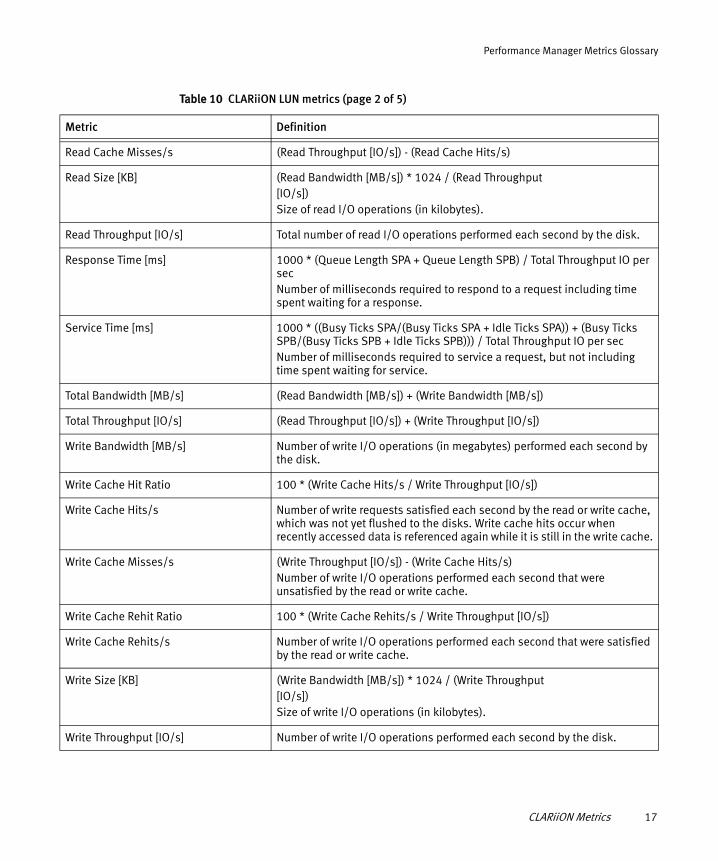
CLARiiON LUN metrics
The following table lists and defines CLARiiON logical unit number (LUN) metrics.
Table 10 CLARiiON LUN metrics (page 1 of 5)
Metric Definition
% Disk Crossings 100 * Disk Crossings per sec / (Read Throughput IO per sec + Write Throughput IO per sec)
% Used Prefetches 100* (Prefetched Blocks/s - Unused Prefetched Blocks/s) / Prefetched Blocks/s)
Unused Prefetched Blocks/s Number of prefetched blocks that were not accessed each second before being ejected from the file cache.
% Utilization (Service Time [ms] / 10) * Total Throughput IO per secPercentage of time that the disk was busy serving incoming requests.
Busy Ticks/s Number of ticks (1 tick = 100 ms) that occurred when this LUN was busy.
Idle Ticks/s Number of ticks (1 tick = 100 ms) that occurred when this LUN was idle.
Average Busy Queue Length Queue Length / (% Utilization / 100)
Sum Queue Lengths Number of requests waiting for the disk within a time interval, including the current request in service.
Number Arrivals With Non Zero Queue Number of times that a user request arrived while at least one other request was being processed.
Disk Crossings/s Number of I/O requests each second that require at least two disks.
Forced Flushes/s Number of times each second that cache had to flush one or more pages to disk in order to free space for incoming write requests in the cache.
Prefetched Blocks/s Number of prefetched blocks accessed each second before being ejected from the cache.
Queue Length (Response Time [ms] / 1000) * Total Throughput IO per secAverage number of requests that are waiting while the disk is busy, including the current request in service.
Read Bandwidth [MB/s] Number of read I/O operations (in megabytes) performed each second by the disk.
Read Cache Hit Ratio 100 * (Read Cache Hits/s / Read Throughput [IO/s])
Read Cache Hits/s Number of read I/O operations performed each second that were satisfied by the read or write cache.
CLARiiON Metrics 17
Performance Manager Metrics Glossary
Read Cache Misses/s (Read Throughput [IO/s]) - (Read Cache Hits/s)
Read Size [KB] (Read Bandwidth [MB/s]) * 1024 / (Read Throughput [IO/s])Size of read I/O operations (in kilobytes).
Read Throughput [IO/s] Total number of read I/O operations performed each second by the disk.
Response Time [ms] 1000 * (Queue Length SPA + Queue Length SPB) / Total Throughput IO per secNumber of milliseconds required to respond to a request including time spent waiting for a response.
Service Time [ms] 1000 * ((Busy Ticks SPA/(Busy Ticks SPA + Idle Ticks SPA)) + (Busy Ticks SPB/(Busy Ticks SPB + Idle Ticks SPB))) / Total Throughput IO per secNumber of milliseconds required to service a request, but not including time spent waiting for service.
Total Bandwidth [MB/s] (Read Bandwidth [MB/s]) + (Write Bandwidth [MB/s])
Total Throughput [IO/s] (Read Throughput [IO/s]) + (Write Throughput [IO/s])
Write Bandwidth [MB/s] Number of write I/O operations (in megabytes) performed each second by the disk.
Write Cache Hit Ratio 100 * (Write Cache Hits/s / Write Throughput [IO/s])
Write Cache Hits/s Number of write requests satisfied each second by the read or write cache, which was not yet flushed to the disks. Write cache hits occur when recently accessed data is referenced again while it is still in the write cache.
Write Cache Misses/s (Write Throughput [IO/s]) - (Write Cache Hits/s)Number of write I/O operations performed each second that were unsatisfied by the read or write cache.
Write Cache Rehit Ratio 100 * (Write Cache Rehits/s / Write Throughput [IO/s])
Write Cache Rehits/s Number of write I/O operations performed each second that were satisfied by the read or write cache.
Write Size [KB] (Write Bandwidth [MB/s]) * 1024 / (Write Throughput [IO/s])Size of write I/O operations (in kilobytes).
Write Throughput [IO/s] Number of write I/O operations performed each second by the disk.
Table 10 CLARiiON LUN metrics (page 2 of 5)
Metric Definition

18 EMC Ionix ControlCenter 6.1 Performance Manager Metrics Glossary
Performance Manager Metrics Glossary
Queue Length SPA ((Sum of Outstanding Requests SPA - NonZero Request Count Arrivals SPA / 2)/(Host Read Requests SPA + Host Write Requests SPA))*(Busy Ticks SPA/(Busy Ticks SPA + Idle Ticks SPA))
Queue Length SPB ((Sum of Outstanding Requests SPB - NonZero Request Count Arrivals SPB / 2)/(Host Read Requests SPB + Host Write Requests SPB))*(Busy Ticks SPB/(Busy Ticks SPB + Idle Ticks SPB))
MM Read Bandwidth MB per sec LUN Blocks Read / 2048
MM Write Bandwidth MB per sec LUN Blocks Written / 2048
MM Total Throughput IO per sec (MM Read Throughput IO per sec + MM Write Throughput IO per sec)
MM Total Bandwidth MB per sec (MM Write Bandwidth MB per sec + MM Read Bandwidth MB per sec)
% MM Utilization ((Cum Read Response Time + Cum Write Response Time) * (MM Read Throughput IO per sec + MM Write Throughput IO per sec)) / (10000 * (Sum Queue Lengths - Number of Arrivals with Non Zero Queue / 2))
MM Average Busy Queue Length (Sum Queue Lengths - Number of Arrivals With Non Zero Queue/2) / (MM Total Throughput IO per sec)
MM Queue Length (Cum Read Response Time + Cum Write Response Time) / 1000000
MM Response Time [ms] (Cum Read Response Time + Cum Write Response Time) / (1000 * (MM Read Throughput IO per sec + MM Write Throughput IO per sec))
MM Service Time [ms] (Cum Read Response Time + Cum Write Response Time) / (1000 * (Sum Queue Lengths - Number of Arrivals with Non Zero Queue / 2))
MM Read Size [KB] MM Read Bandwidth MB per sec * 1024 / MM Read Throughput IO per sec
MM Write Size [KB] MM Write Bandwidth MB per sec * 1024 / MM Write Throughput IO per sec
% MM Disk Crossings 100 * Disk Crossings per sec / MM Total Throughput IO per sec
MM Read Cache Misses per sec MM Read Throughput IO per sec - Read Cache Hits per sec
MM Read Cache Hit Ratio Read Cache Hits per sec / MM Read Throughput IO per sec
MM Write Cache Misses per sec MM Write Throughput IO per sec - Write Cache Hits per sec
MM Write Cache Hit Ratio Write Cache Hits per sec / MM Write Throughput IO per sec
RL Read Cache Misses per sec Read Cache Throughput IO per sec - Read Cache Hits per sec
RL Read Cache Hit Ratio Read Cache Hits per sec / Read Cache Throughput IO per sec
Table 10 CLARiiON LUN metrics (page 3 of 5)
Metric Definition

CLARiiON Metrics 19
Performance Manager Metrics Glossary
RL Write Cache Misses per sec Write Cache Throughput IO per sec - Write Cache Hits per sec
RL Write Cache Hit Ratio Write Cache Hits per sec / Write Cache Throughput IO per sec
Host Blocks Read SPA Number of blocks the host read from the LUN via connections through SPA
Host Blocks Read SPB Number of blocks the host read from the LUN via connections through SPB
Host Blocks Written SPA Number of blocks the host wrote to the LUN via connections through SPA
Host Blocks Written SPB Number of blocks the host wrote to the LUN via connections through SPB
Host Read Requests SPA Number of read requests made by the host to the LUN via connections through SPA
Host Read Requests SPB Number of read requests made by the host to the LUN via connections through SPB
Host Write Requests SPA Number of write requests made by the host to the LUN via connections through SPA
Host Write Requests SPB Number of write requests made by the host to the LUN via connections through SPB
Busy Ticks SPA Amount of time in 100 ms increments (ticks) that requests via connections through SPA were outstanding to the LUN
Busy Ticks SPB Amount of time in 100 ms increments (ticks) that requests via connections through SPB were outstanding to the LUN
Idle Ticks SPA Amount of time in 100 ms increments (ticks) that there were no outstanding requests to the LUN via connections through SPA
Idle Ticks SPB Amount of time in 100 ms increments (ticks) that there were no outstanding requests to the LUN via connections through SPB
Explicit Trespasses SPA Number of trespasses that have been invoked via an external command through SPA
Explicit Trespasses SPB Number of trespasses that have been invoked via an external command through SPB
Implicit Trespasses SPA Number of trespasses that have been invoked internally by SPA
Implicit Trespasses SPB Number of trespasses that have been invoked internally by SPB
NonZero Request Count Arrivals SPA Number of host requests through SPA that were sent while the LUN was busy
Table 10 CLARiiON LUN metrics (page 4 of 5)
Metric Definition

20 EMC Ionix ControlCenter 6.1 Performance Manager Metrics Glossary
Performance Manager Metrics Glossary
CLARiiON Snap Session metrics
The following table lists and defines CLARiiON Snap Session metrics.
NonZero Request Count Arrivals SPB Number of host requests through SPB that were sent while the LUN was busy
Sum of Outstanding Requests SPA Cumulative count of outstanding requests to the LUN via connections through SPA. For each new request via SPA, this count will increment by the number of currently outstanding requests to this LUN on this SP
Sum of Outstanding Requests SPB Cumulative count of outstanding requests to the LUN via connections through SPB. For each new request via SPB, this count will increment by the number of currently outstanding requests to this LUN on this SP
LUN Blocks Read Number of blocks read from the private LUN
LUN Blocks Written Number of blocks written to the private LUN
MM Read Throughput IO per sec Average number of read requests per second sent to the metamember
MM Write Throughput IO per sec Average number of write requests per second sent to the metamember
Read Cache Hit Throughput IO per sec Average number of read requests per second that were satisfied by the cache without requiring any disk access
Write Cache Hit Throughput IO per sec Average number of write requests per second that were satisfied by the cache without requiring any disk access
Table 10 CLARiiON LUN metrics (page 5 of 5)
Metric Definition
Table 11 CLARiiON Snap Session metrics (page 1 of 2)
Metric Definition
Chunks Used In Snapshot Copy Session Number of chunks in disk blocks used in cache during this snapshot session.
Reads From Snapshot Cache Number of reads from cache (instead of reads from the source LUN) performed during this snapshot session.
Reads From Snapshot Copy LUN Number of reads from copies performed during this snapshot session.
Reads From Snapshot Source LUN Number of reads from the source LUN (on the pertinent SP) performed during this snapshot session.

CLARiiON Metrics 21
Performance Manager Metrics Glossary
CLARiiON storage processor (SP) metrics
The following table lists and defines CLARiiON storage processor (SP) metrics.
Writes To Shapshot Source LUN (Reads From Snapshot Copy LUN/s) - (Reads From Snapshot Cache/s)Number of writes to the source LUN (on the pertinent SP) performed during this snapshot session.
Writes To Shapshot Cache Number of writes to cache (instead of writes to the source LUN) performed during this snapshot session.
Writes Larger Than Cache Chunk Size Number of writes that are larger than cache chunks in disk blocks performed during this snapshot session.
Table 11 CLARiiON Snap Session metrics (page 2 of 2)
Table 12 CLARiiON storage processor (SP) metrics (page 1 of 2)
Metric Definition
% Dirty Pages Percentage of cache pages owned by the SP that were modified since they were last read from or written to SP.
% Utilization 100 * (Busy Ticks/s) / (Busy Ticks/s + Idle Ticks/s)Percentage of time that the SP was busy serving incoming requests.Busy Ticks/s: Number of ticks (1 tick = 100 ms) that occurred when this LUN was busy.Idle Ticks/s: Number of ticks (1 tick = 100 ms) that occurred when this LUN was idle.
Average Busy Queue Length (Sum Queue Lengths - Number Arrivals With Non Zero Queue / 2) / (Read Throughput [IO/s] + Write Throughput [IO/s])Sum Queue Lengths: Number of requests waiting for the disk within a time interval, including the current request in service.Number Arrivals With Non Zero Queue: Number of times that a user request arrived while at least one other request was being processed.
Flush Ratio 100 * (Write Cache Flushes/s / Write Throughput [IO/s])Number of flush operations performed compared to the number of write requests.
Queue Length (Average Busy Queue Length) * (% Utilization)Average number of requests that are waiting while the SP is busy, including the current request in service.
Read Bandwidth [MB/s] Number of read I/O operations (in megabytes) performed each second by the SP.

22 EMC Ionix ControlCenter 6.1 Performance Manager Metrics Glossary
Performance Manager Metrics Glossary
Connectivity (Switch) Metrics
Connectivity device port metrics
The following table lists and defines Connectivity device port metrics, which include Connectivity device port errors.
Note: McDATA ED-1032 switches use 32-bit counters for statistic values. These values cause gaps in Workload Analyzer (WLA) Archiver reports. To work around this issue, use a newer version of the switch with 64-bit counters.
Read Size [KB] (Read Bandwidth [MB/s]) * 1024 / (Read Throughput [IO/s])Number of read I/O operations (in kilobytes) performed each second by the SP.
Read Throughput [IO/s] Total number of read I/O operations performed each second by the SP.
Response Time [ms] 1000 * (Queue Length) / (Total Throughput [IO/s])Number of milliseconds required to respond to a request including time spent waiting for a response.
Service Time [ms] 1000 * (% Utilization) / (Total Throughput [IO/s])Number of milliseconds required to service a request, but not including time spent waiting for service.
Total Bandwidth [MB/s] (Read Bandwidth [MB/s]) + (Write Bandwidth [MB/s])
Total Throughput [IO/s] (Read Throughput [IO/s]) + (Write Throughput [IO/s])
Write Bandwidth [MB/s] Number of write I/O operations (in megabytes) performed each second by the SP.
Write Cache Flushes/s Number of I/O operations written each second from cache to the SP.
Write Size [KB] (Write Bandwidth [MB/s]) * 1024 / (Write Throughput [IO/s])
Write Throughput [IO/s] Number of write I/O operations performed each second by the SP.
Table 12 CLARiiON storage processor (SP) metrics (page 2 of 2)
Metric Definition

Connectivity (Switch) Metrics 23
Performance Manager Metrics Glossary
Table 13 Connectivity device port metrics (page 1 of 2)
Metric Definition
BB Credit Zeros per sec Total buffer-to-buffer activity detected each second by the port on the switch.
Class3 Discards per sec Number of Class 3 discards received each second by the port on the switch.
Class2 Frames per sec Number of Class 2 frames received each second by the port on the switch.
Class3 Frames per sec Number of Class 3 frames received each second by the port on the switch.
Error Frames Number of error frames received each second for all the ports on the switch.
Frames Truncated Number of truncated frames received each second for all the ports on the switch.
Frames per sec Number of frames received each second for all the ports on the switch.
Invalid CRCs Number of invalid cyclic redundancy checks received each second for all the ports on the switch.
Invalid Tx Words Total number times each second that frames containing invalid words are transmitted for all the ports on the switch.
Kbytes Received per sec Number of kilobytes received each second by the switch or switch port.
Kbytes Transferred per sec (Kbytes Received per sec) + (Kbytes Transmitted per sec)Number of kilobytes transferred each second by the switch port.
Kbytes Transmitted per sec Number of kilobytes transmitted each second by the switch or switch port.
Link Failures Total number of link failures for all the ports on the switch.
Link Resets (Rx Link Resets) + (Tx Link Resets)Total number of link resets received and transmitted by all the ports on the switch.
Loss of Signal Number of times each second that loss of signal occurs for all the active ports on the switch.
Loss of Synchronization Number of times each second that loss of synchronization occurs for all the ports on the switch.
Offline Sequences Number of offline sequence occurrences for all the ports on the switch.

24 EMC Ionix ControlCenter 6.1 Performance Manager Metrics Glossary
Performance Manager Metrics Glossary
HDS Metrics
HDS device metrics
Not all of the metrics are collected for the HDS 9570V Series (Thunder) or Tagmastore USP family arrays. Click here to find out which metrics are not collected for the HDS 9570V Series (Thunder) and Tagmastore USP family arrays. If you are viewing an HDS 9570V Series (Thunder) or Tagmastore USP family array, the unavailable data views and metrics are grayed out.
There may be a mismatch between the HDS devices shown in Performance Manager as compared to those in the Console. The Storage Agent for HDS retrieves performance data for the HDS array from the Hitachi HiCommand Tuning Manager (HTM) server, while it retrieves configuration data from Hitachi HiCommand server. If the number of devices reported back from the Hitachi HTM server does not match the number of devices reported back from Hitachi HiCommand server, then HDS devices available in Performance Manager will be different than the HDS devices seen in the Console.
Receive Link Utilization 100 * (Kbytes Received per sec / Port Speed Kbytes per sec)Percentage of the receiving link that is used from port to port. Port Speed Kbytes per sec: Maximum number of kilobytes available to the port for I/O operations.
Received Frames per sec Number of frame counts received each second by the port on the switch.
Rx Link Resets Number of link resets received by all the ports on the switch.
Transmit Link Utilization 100 * (Kbytes Transmitted per sec / Port Speed Kbytes per sec)Percentage of the transmitting link that is used from port to port.
Transmitted Frames per sec Number of frames transmitted each second by the switch and switch port.
Tx Link Resets Number of link resets transmitted each second by all the ports on the switch.
Table 13 Connectivity device port metrics (page 2 of 2)
Metric Definition

HDS Metrics 25
Performance Manager Metrics Glossary
Table 14 HDS device metrics
Metric Definition
% read hits 100 * (read hits per sec / reads per sec) Percentage of reads that are hits.
% read hits 100 * (read hits per sec / reads per sec) Percentage of reads that are hits.
% reads 100 * (reads per sec / ios per sec) Percentage of I/O operations that are reads.
% write hits 100 * (write hits per sec / writes per sec) Percentage of writes that are hits.
% writes 100 * (writes per sec / ios per sec) Percentage of I/O operations that are writes.
average Kbytes per io (Kbytes transferred per sec / ios per sec)Average I/O size in kilobytes for the interval.
average Kbytes per read (Kbytes read per sec / reads per sec)Average read size in kilobytes for the interval.
average Kbytes per write (Kbytes written per sec / writes per sec)Average write size in kilobytes for the interval.
ios per sec (reads per sec + writes per sec)Number of I/O operations performed each second.
Kbytes read per sec Number of kilobytes read each second.
Kbytes transferred per sec (Kbytes read per sec + Kbytes written per sec)Total kilobytes transferred each second.
Kbytes written per sec Number of kilobytes written each second.
read hits per sec Number of read hits each second.
reads per sec Number of reads each second.
write hits per sec Number of write hits each second.
writes per sec Number of writes each second.

26 EMC Ionix ControlCenter 6.1 Performance Manager Metrics Glossary
Performance Manager Metrics Glossary
HDS port metrics
Port metrics are not collected for the HDS 9570V Series (Thunder) or Tagmastore USP family arrays. If you are viewing an HDS 9570V Series (Thunder) or the Tagmastore USP family array, the unavailable data views and metrics are grayed out.
Host Metrics
Host CPU metrics
The following table lists and defines Host CPU Metrics.
Table 15 HDS port metrics
Metric Definition
average ios per sec Average number of I/O operations performed each second by the HDS port.
average Kbytes per io Kbytes transferred per sec / ios per sec Average I/O size in kilobytes each second.
average Kbytes per sec Average number of kilobytes transferred each second through the HDS port.
maximum ios per sec Maximum number of I/O operations performed each second by the HDS port.
minimum ios per sec Minimum number of I/O operations performed each second by the HDS port.
maximum Kbytes per sec Maximum number of kilobytes transferred each second through the HDS port.
minimum Kbytes per sec Minimum number of kilobytes transferred each second through the HDS port.
Table 16 Host CPU metrics (page 1 of 2)
Metric Definition
% idle CPU Percentage of time that the host CPU had been idle.
% io wait CPU Percentage of time that the host CPU spent waiting for an I/O operation to complete.

Host Metrics 27
Performance Manager Metrics Glossary
Host device metrics
The following table lists and describes the Host device metrics.
Host logical volume metrics
The following table lists and defines the host logical volume metrics.
% processor CPU (% sys CPU) + (% user CPU) + (% io wait CPU)Percentage of time the host CPU is busy.
% sys CPU Percentage of time that the host CPU spent in system mode.
% user CPU Percentage of time that the host CPU spent in user mode.
Table 16 Host CPU metrics (page 2 of 2)
Table 17 Host device metrics
Metric Definition
average queue Average length of the queue for the device.
average queue Average length of the queue for the device.
ios per sec Number of I/O operations performed each second by the host device.
Kbytes read per sec Number of kilobytes read each second by the host device.
Kbytes transferred per sec (Kbytes read per sec) + (Kbytes written per sec)Total number of kilobytes read and written each second by all of the host devices.
Kbytes written per sec Number of kilobytes written each second by the host device.
reads per sec Number of read I/O operations performed each second by the host devices.
response time (ms) (service time (ms) + wait time (ms))Total of service and wait time in milliseconds required by the host device.
service time (ms) Amount of time in milliseconds spent servicing a request.
wait time (ms) Average amount of time in milliseconds spent waiting before an I/O operation began.
writes per sec Number of write I/O operations performed each second by the host device.

28 EMC Ionix ControlCenter 6.1 Performance Manager Metrics Glossary
Performance Manager Metrics Glossary
Note: The host logical volume statistics are only available if the Veritas Volume Manager is installed.
Table 18 Host logical volume metrics
Metric Definition
avg read time (ms) Average time in milliseconds that it took the host logical volume to perform a read.
avg write time (ms) Average time in milliseconds that it took the host logical volume to perform a write.
io per sec (reads per sec) + (writes per sec)
Kbytes read per sec Number of kilobytes read by the host logical volumes each second.
Kbytes transferred per sec (Kbytes read per sec) + (Kbytes written per sec)Number of kilobytes transferred each second to and from the host logical volume.
Kbytes written per sec Number of kilobytes written each second to the host logical volume.
reads per sec Number of read I/O operations performed each second by the host logical volume.
writes per sec Number of write I/O operations performed each second by the host logical volumes.

Host Metrics 29
Performance Manager Metrics Glossary
Host HP device metrics
The following table lists and defines the HP device metrics.
Host MVS device metrics
The following table lists and describes the MVS device metrics.
Note: In order for Performance Manager to receive data from MVS hosts, you must configure a few SMF and RMF parameters as described in the Configuring IBM SMF and RMF Statistics Collection section of the EMC Ionix ControlCenter Planning and Installation Guide, Volume II (MVS Agents).
Table 19 Host HP device metrics
Metric Definition
average queue Average length of the queue for the device.
ios per sec Number of I/O operations performed each second.
Kbytes transferred per sec Number of kilobytes transferred each second to and from the host logical volume.
response time (ms) (service time (ms) + wait time (ms))
service time (ms) Amount of time in milliseconds spent servicing a request.
wait time (ms) Average amount of time in milliseconds spent waiting before an I/O operation began.
Table 20 Host MVS device metrics
Metric Definition
CONN (ms) Volume connect time for each request in milliseconds.
DISC (ms) Volume disconnect time for each request in milliseconds.
ios per sec Number of I/O operations performed each second.
IOSQ (ms) IOS queue time for each request in milliseconds.
PEND (ms) Pending time for each request in milliseconds.
reads per sec Number of I/O read operations performed each second.
response time (ms) Response time for each request in milliseconds.
writes per sec Number of I/O write operations performed each second.

30 EMC Ionix ControlCenter 6.1 Performance Manager Metrics Glossary
Performance Manager Metrics Glossary
Oracle Metrics
Oracle file metrics
The following table lists and describes metrics for Oracle files.
Oracle segment metrics
The following table lists and describes metrics for Oracle segments.
Table 21 Oracle file metrics
Metric Definition
read average ms/request Average amount of time waited for database file reads in milliseconds.
read kbytes Number of database file reads in kilobytes.
read requests count Number of database file read requests.
total io average ms/request Total average amount of time waited for the database fileI/O by the system in milliseconds.
total io kbytes Total number of database file I/O in kilobytes by the system.
total io requests count Total number of database file I/O operations by the system.
write average ms/request Average amount of time waited for database file writes in milliseconds.
write kbytes Number of kilobytes written to the Oracle file.
write requests count Number of database file write requests.
Table 22 Oracle segment metrics (page 1 of 2)
Metric Definition
read average ms/request Average amount of time waited for segment reads in milliseconds.
read kbytes wait Number of segment read waits in kilobytes. A wait occurs when there is a wait on a system or database request while the resource becomes available.
read request wait count Number of segment read request waits. A wait occurs when there is a wait on a system or database request while the resource becomes available.
total io average ms/request Total average amount of time waited for the segment I/O by the system in millisecond.

Symmetrix Metrics 31
Performance Manager Metrics Glossary
Symmetrix Metrics
Symmetrix device metrics
The following table lists and defines metrics for Symmetrix® devices.
total io kbytes wait Total number of segment I/O in kilobytes waits by the system.
total io requests wait count Total number of segment I/O request waits by the system.
write average ms/request Average amount of time waited for segment writes in milliseconds.
write kbytes wait Number of writes in kilobytes for which there was a wait because the Oracle segment was unavailable.
write request wait count Number of segment write request waits. A wait occurs when there is a wait on a system or database request while the resource becomes available.
Table 22 Oracle segment metrics (page 2 of 2)
Table 23 Symmetrix device metrics (page 1 of 6)
Metric Definition
% hit 100 * (total hits per sec / total ios per sec)Percentage of I/O operations, performed by the Symmetrix device, that were immediately satisfied by cache.
% miss 100 - (% hit)Percentage of read and write miss operations performed each second by the Symmetrix device that were misses. A miss occurs when the requested read data is not found in cache or the write operation had to wait while data was destaged from cache to the disks.
% random read hit 100 * (read hits per sec / total ios per sec)
% random read miss 100 * (read misses per sec / total ios per sec)
% read 100 * (total reads per sec / total ios per sec)Percentage of read I/O operations performed by the Symmetrix device.
% read hit 100 * (total read hits per sec / total reads per sec)Percentage of read hit I/O operations performed each second by the Symmetrix device. Read hits occur when the read operation is satisfied directly from cache.

32 EMC Ionix ControlCenter 6.1 Performance Manager Metrics Glossary
Performance Manager Metrics Glossary
% read miss 100 * (total read misses per sec / total reads per sec)Percentage of read miss I/O operations performed by the Symmetrix device. Read misses occur when the data requested by the read I/O operation was not in cache, causing a wait while it was fetched from disk.
% sequential io 100 * (seq ios per sec / total ios per sec)Use this metric for mainframe performance analysis only.
% Sequential read 100 * (seq reads per sec / total ios per sec)Use this metric for mainframe performance analysis only.
% sequential writes 100 * (seq writes per sec / total ios per sec)Use this metric for mainframe performance analysis only.
% write 100 * (total writes per sec/total ios per sec)Percentage of total write I/O operations performed each second by the Symmetrix device.
% write hits 100 * (( write hits per sec + seq write hits per sec)/total writes per sec)Percentage of write hit I/O operations performed by the Symmetrix device. A write hit occurs when the I/O write operation is received, it is immediately staged in cache and will be written to disk at a later time.
% write miss 100 * (total write misses per sec/total writes per sec)Percentage of write I/O operations performed each second by the Symmetrix device that were write misses. A write miss occurs when the I/O write operations are delayed because the system or device write-pending limit was reached and the cache had to destage slots to the disks before the writes could be written to cache.
average io size in Kbytes (HA Kbytes transferred per sec) / (total ios per sec)Average size of an I/O operation performed by the Symmetrix device.
average read size in Kbytes (Kbytes read per sec) / total reads per sec)Average size of a read I/O operation performed by the Symmetrix device.
average write size in Kbytes (Kbytes written per sec) / (total writes per sec)
DA Kbytes read per sec Number of kilobytes read by the disk directors from the disk each second.
DA Kbytes transferred per sec
(DA Kbytes read per sec) + (DA Kbytes written per sec)Sum of the kilobytes read and written each second on all disk directors associated with the Symmetrix device.
DA Kbytes written per sec Number of kilobytes written to the disk from the disk director each second.
DA prefetched tracks per sec
Total prefetched tracks each second from the disk directors to the cache.
Table 23 Symmetrix device metrics (page 2 of 6)
Metric Definition

Symmetrix Metrics 33
Performance Manager Metrics Glossary
DA prefetched tracks Used per sec
Number of prefetched tracks used each second from the disk directors to the cache.
DA read requests per sec Number of read requests each second performed by the disk directors to the cache.
DA write requests per sec Number of write requests each second performed by the disk directors to the cache.
HA Kbytes transferred per sec
(Kbytes read per sec) + (Kbytes written per sec)Total number of kilobytes read and written each second through host directors associated with the Symmetrix device.
hits per sec Number of I/O operations performed each second by the Symmetrix device that were immediately satisfied by cache.
ios per sec Number of I/O operations performed each second by the Symmetrix device, including writes and random reads. In contrast, the metric “total ios per sec” on page 35 includes writes, random reads, and sequential reads.
Kbytes read per sec Number of kilobytes read by the Symmetrix device each second.
Kbytes written per sec Number of kilobytes written by the Symmetrix device each second.
max write pending Threshold
Maximum number of write-pending slots available for the Symmetrix device. Max Write Pending Threshold is not a static number. It depends on Symmetrix activity. Each Symmetrix device is assigned a limit of write-pending slots that can dynamically change between a base value and a value three times the base (the maximum value). Once the Max Write Pending Threshold has reached three times the base value, writes to the device are delayed so that the cache can destage, which frees the cache slots. As cache slots are freed, the writes resume. While the write-pending limit is reached, disk directors operate in a priority destage write mode. This gives write data higher priority than usual. During the delay, writes to this Symmetrix device are counted as write misses.
read hits per sec Number of random read hit I/O operations performed each second by the Symmetrix device. Read hits occur when the read I/O operation is satisfied directly from cache. The read hits per sec metric for the Symmetrix device statistic does not include sequential read hits. In contrast, the metric “total reads per sec” on page 36 includes random and sequential read hits per sec.
read misses per sec (reads per sec) - (read hits per sec)Read misses occur when the data requested by the read I/O operation was not in cache, causing a wait while it was fetched from disk.
random reads per sec Number of I/O operations performed each second by the Symmetrix device that were random reads. This Random Reads per sec metric for the Symmetrix device statistic does not include sequential reads. In contrast, the metric “total reads per sec” on page 36 includes random and sequential read hits per sec.
Table 23 Symmetrix device metrics (page 3 of 6)
Metric Definition

34 EMC Ionix ControlCenter 6.1 Performance Manager Metrics Glossary
Performance Manager Metrics Glossary
sampled average reads missed time (ms)
Completion time of a read-miss as measured by the host director. Measurements are taken for a sample set of approximately 30% of the I/Os. Read misses occur when the data requested by the read I/O operation was not in cache, causing a wait while it was fetched from disk.Metadevices: This is approximately (within milliseconds) the same response time that the host sees at the head of the meta. The value is calculated by dividing the total sampled elapsed time by the number of sampled events. The number of sampled events counter, and sampled elapsed time counter are maintained for all metamembers under the statistics for the head of the meta.
sampled average read time (ms)
Completion time of a read as measured by the host director. Measurements are taken for a sample set of approximately 30% of the I/Os. Metadevices: This is approximately (within milliseconds) the same response time that the host sees at the head of the meta. The value is calculated by dividing the total sampled elapsed time by the number of sampled events. The number of sampled events counter, and sampled elapsed time counter are maintained for all metamembers under the statistics for the head of the meta.
sampled average write time (ms)
Completion time of a write as measured by the host director. Measurements are taken for a sample set of approximately 30% of the I/Os. metadevices: This is approximately (within milliseconds) the same response time that the host sees at the head of the meta. The value is calculated by dividing the total sampled elapsed time by the number of sampled events. The number of sampled events counter, and sampled elapsed time counter are maintained for all metamembers under the statistics for the head of the meta.
sampled average WP disconnect time (ms)
Completion time of a write-miss as measured by the host director. Measurements are taken for a sample set of approximately 30% of the I/Os. A write miss occurs when a write I/O is held while data is destaged from cache.Metadevices: This is approximately (within milliseconds) the same response time that the host sees at the head of the meta. The value is calculated by dividing the total sampled elapsed time by the number of sampled events. The number of sampled events counter, and sampled elapsed time counter are maintained for all Metamembers under the statistics for the head of the meta.
seq ios per sec (seq reads per sec) + (seq writes per sec)Use this metric for mainframe performance analysis only.
Table 23 Symmetrix device metrics (page 4 of 6)
Metric Definition

Symmetrix Metrics 35
Performance Manager Metrics Glossary
seq read hits per sec Portion of the explicitly counted sequential reads that were satisfied from the cache on request.Information about the type of environment you are working in.Mainframe environment: The Sequential read hits per sec is useful as a sequential counter. Open System environment: The SCSI I/O command does not have indicators to identify whether the I/O is part of a sequential stream, so the counts are not actual indicators of full sequential activity.This metric is needed for open systems to calculate the total reads per sec metric. This metric must be added to the read hits per sec to get the value for the Total read hits per sec.
seq reads per sec Information about the type of environment you are working in.Mainframe environment: The seq reads per sec is useful as a sequential counter. Open System environment: The SCSI I/O command does not have indicators to identify whether the I/O is part of a sequential stream, so the counts are not actual indicators of full sequential activity.In an open-system environment the Sequential Read metric indicates to the back end to start pre-fetch activity after two sequential read misses occurred in a row. In the case where the data is in cache and all reads are hits, the back end does not get involved and therefore there is no indication that the read is sequential. The seq reads per sec metric is still needed for open systems to calculate the total reads per sec metric. Since sequential read misses are not included in the read counters the seq reads per sec must be added to the Random Reads per sec to get the value for the Total Reads per sec.
seq writes per sec Number of write I/O operations performed each second that were sequential. Use this metric for mainframe performance analysis only.
system bus Kbytes per sec (HA Kbytes transferred per sec) + (DA Kbytes transferred per sec)
total DA req per sec (DA read requests per sec) + (DA write requests per sec)
total hits per sec (total read hits per sec) + (write hits per sec)Total number of I/O operations performed each second by the Symmetrix device that were immediately satisfied by cache.
total ios per sec (total reads per sec) + (total writes per sec)Total number of read I/O and total number of write I/O operations performed each second by the Symmetrix device.
total misses per sec (total ios per sec) - (total hits per sec)Total number of missed I/O operations performed each second by the Symmetrix device.
Table 23 Symmetrix device metrics (page 5 of 6)
Metric Definition

36 EMC Ionix ControlCenter 6.1 Performance Manager Metrics Glossary
Performance Manager Metrics Glossary
total read hits per sec (read hits per sec) + (seq read hits per sec)Total number of read hits and sequential read hit operations performed each second by the Symmetrix device.
total reads per sec (random reads per sec) + (seq reads per sec)Total number of random read and sequential read operations performed each second by the Symmetrix device.
total writes per sec (writes per sec + sequential writes per sec)Total number of writes per second and sequential writers operation performation each second by the Symmetrix device.
write hits per sec Number of write hit operations performed each second by the Symmetrix device. A write hit occurs when the I/O write operation is received, it is immediately staged in cache and will be written to disk at a later time.
write misses per sec (writes per sec) - (write hits per sec)This number of write misses that occurred for the Symmetrix device each second. A write miss occurs when the I/O write operations are delayed.
writes per sec Number of write I/O operations performed each second by the Symmetrix device.
write hits per sec Number of write hit operations performed each second by the Symmetrix device. A write hit occurs when the I/O write operation is received, it is immediately staged in cache and will be written to disk at a later time.
total write misses per sec (total writes per sec) - (write hits per sec) - (seq write hits per sec)This total number of write misses that occurred for the Symmetrix device each second.
write pending count Number of cache slots that were write pending for the logical volume at a point in time. This number changes according to the cache destage activity rate and the number of writes. A write is pending when it has been written to cache but has not yet been written to the disk.
writes per sec Number of write I/O operations performed each second by the Symmetrix device.
Table 23 Symmetrix device metrics (page 6 of 6)
Metric Definition

Symmetrix Metrics 37
Performance Manager Metrics Glossary
Symmetrix disk metrics
The following table lists and defines metrics for Symmetrix disks.
Table 24 Symmetrix disk metrics (page 1 of 2)
Metric Definition
% busy 100 - %disk idle
% idle Disk Idle Time Per Sec * 100
% utilization This metric shows how close the disk performance is to 100% utilization.Percentage is based on the number of SCSI commands being performed by the disk.
accumulated queue depth Sum of queue depths for the disk when an event enters this range (0 - over 640).
average hypers per seek (seek distance per sec) / (seeks per sec)Average number of hypervolumes that the disk head crossed during one seek.
average Kbytes per read (Kbytes read per sec) / (read commands per sec)
average Kbytes per write (Kbytes written per sec) / (write commands per sec)
average busy queue depth Average Queue Depth / (1 - Disk Idle Time Per Sec)Ratio of Average Queue Depth to the time the disk is busy.
average queue depth Calculated against the Accumulated Queue Depth and Total SCSI Commands Per Sec.
disk idle time per sec Average time per second that the disk is idle.
Kbytes read per sec Number of kilobytes read by the Symmetrix disk each second.
Kbytes written per sec Number of kilobytes written by the Symmetrix disk each second.
read commands per sec Number of read operations performed each second by the Symmetrix disk.
seek distance per sec Number of hypervolumes that the disk head crossed (during all seeks) each second.
seeks per sec Number of times each second that the disk head moved to find data.
skip mask commands per sec Number of skip mask commands performed each second by the disk.Skip Mask enables a fragmented track, which is chunks of data with gaps in between, to be read from disk or written to disk in one I/O operation. Without Skip Mask, each chunk of data is read or written in a separate I/O operation, causing a fragmented track to require multiple I/O operations to read or write.

38 EMC Ionix ControlCenter 6.1 Performance Manager Metrics Glossary
Performance Manager Metrics Glossary
total SCSI commands per sec Total number of read commands, write commands, skip mask commands, verify commands, XOR write commands, and XOR write-read commands performed by the Symmetrix disk each second.
verify commands per sec Number of verify commands performed each second by the disk. Verify commands are background scrubbing operations performed periodically to check data integrity on the drives.
write commands per sec Number of write operations performed each second by the Symmetrix disk.
XOR write commands per sec Number of exclusive OR (XOR) write commands performed each second by the disk.XOR commands are used to establish parity protection in RAID-S and RAID 5 configurations. In a RAID-S or RAID 5 environment, 3 physical I/Os for each write operation are generated: write, XOR-write-read, and XOR-write. When a write is issued to a disk, which is a member of a RAID-S or RAID 5 set, the write is immediately followed by an XOR-write-read command. The XOR-write-read command extracts the necessary information for parity protection. The information is then written to the parity disk using the XOR-write command.
XOR write-read commands per sec
Number of exclusive OR (XOR) write-read commands performed each second by the disk.XOR commands are used to establish parity protection in RAID-S and RAID 5 configurations. In a RAID-S or RAID 5 environment, 3 physical I/Os for each write operation are generated: write, XOR-write-read, and XOR-write. When a write is issued to a disk, which is a member of a RAID-S or RAID 5 set, the write is immediately followed by an XOR-write-read command. The XOR-write-read command extracts the necessary information for parity protection. The information is then written to the parity disk using the XOR-write command.
Table 24 Symmetrix disk metrics (page 2 of 2)
Metric Definition

Symmetrix Metrics 39
Performance Manager Metrics Glossary
Symmetrix disk director metrics
The following table lists and defines metrics for disk (back-end, or dadir) directors.
Table 25 Symmetrix disk director metrics (page 1 of 2)
Metric Definition
% read 100 * (reads per sec / requests per sec)Percentage of read requests performed by the disk director.
% seq reads 100 * (prefetched tracks per sec / (prefetched tracks per sec + reads per sec))Percentage of read requests that were sequential. A sequential read occurs when the tracks brought into cache by prefetch tasks are read in the order in which they were put in cache.
% utilization This metric shows how close the disk director (back-end director) is to 100% performance utilization. Percentage is based on the number of I/O operations being performed by the disk director.
% write 100 * (writes per sec / requests per sec)Percentage of write requests performed each second by the disk director.
accumulated director idle time Number of ticks that elapsed while the director did not have any requests in its queue.
average lru0 fall through time Average time it takes a cache slot in LRU0 to be freed up. It is the average time from the first use of the contents to its reuse by another address.This is a key metric that Symmetrix algorithms use to manage the cache. It is a measure, on average, in seconds, of how long it takes a slot to go from the top of the LRU to the bottom of the LRU for reselection. The time only measures from the last time the slot is placed at the top of the LRU to the time it reaches the bottom of the LRU. Each time a slot is placed at the top of the LRU, the time value used to calculate the Fall Through Time is reset to current time (effectively, zero). Average is calculated using between 4000 - 8000 slots. This metric is a sometimes misunderstood Symmetrix statistic. The cache algorithms may have placed the slot at the top of the LRU many times before the slot finally reaches the bottom of the LRU. The total time the slot is in the cache would have to account for all of the times the slot was placed at the top of the LRU. This would equal cache residency time (time of reselection minus the time of entry). A common mistake is to think that Fall Through Time is cache residency time. Cache residency time does not exist in Symmetrix statistics.
ios per sec Number of I/O operations performed each second between the Symmetrix disk director and the disk.
long misses per sec Number of times each second that requested data was not in cache, and was not in the process of being fetched.

40 EMC Ionix ControlCenter 6.1 Performance Manager Metrics Glossary
Performance Manager Metrics Glossary
queue depth count Number of events that are waiting while the director's queue is in this range (0 - over 640).
permacache requests per sec Number of requests between permacache and the disk director each second. Permacache is the part of cache reserved for a particular application. A request is the protocol used by directors (host and disk) to marshal data to and from the cache.
prefetched tracks per sec Number of tracks prefetched to cache each second by the disk director.
reads per sec Number of read requests performed each second by the Symmetrix disk director.
requests per sec Number of request operations performed by the disk director.A request is the protocol used by directors (host and disk) to marshal data to and from the cache. This metric is made up of reads and writes.
short misses per sec Number of times each second that requested data was not in cache, but was being fetched when the request was executed.
tracks not used per sec Number of prefeteched tracks per sec that have not been used to satisfy a read request. For more information, refer to “prefetched tracks per sec” on page 47.
tracks used per sec Number of prefeteched tracks per sec that were used to satisfy read requests. For more information, refer to “prefetched tracks per sec” on page 47.
writes per sec Number of write requests performed each second by the Symmetrix disk director.
Table 25 Symmetrix disk director metrics (page 2 of 2)
Metric Definition
Symmetrix Metrics 41
Performance Manager Metrics Glossary
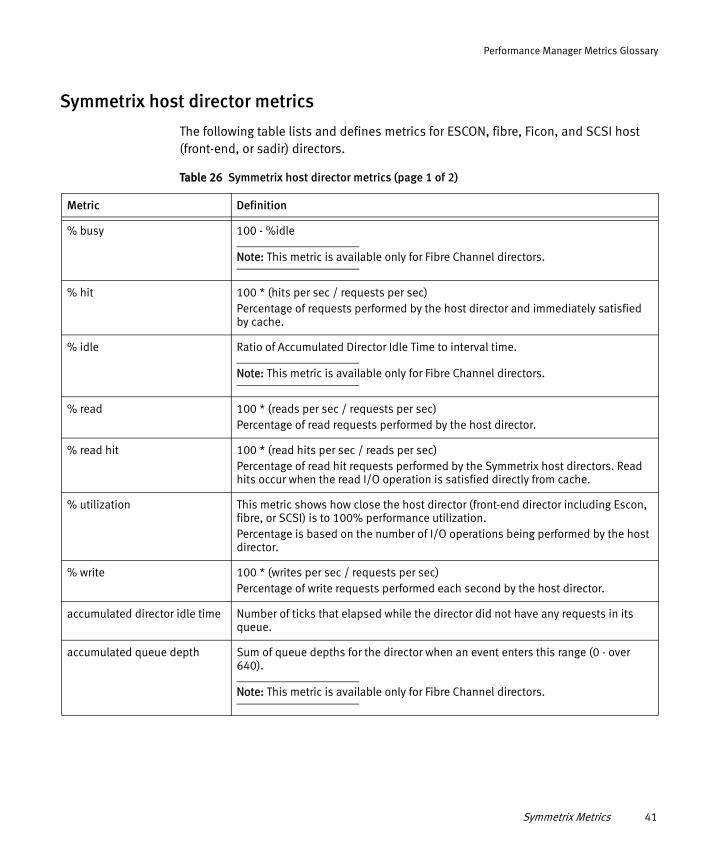
Symmetrix host director metrics
The following table lists and defines metrics for ESCON, fibre, Ficon, and SCSI host (front-end, or sadir) directors.
Table 26 Symmetrix host director metrics (page 1 of 2)
Metric Definition
% busy 100 - %idle
Note: This metric is available only for Fibre Channel directors.
% hit 100 * (hits per sec / requests per sec) Percentage of requests performed by the host director and immediately satisfied by cache.
% idle Ratio of Accumulated Director Idle Time to interval time.
Note: This metric is available only for Fibre Channel directors.
% read 100 * (reads per sec / requests per sec)Percentage of read requests performed by the host director.
% read hit 100 * (read hits per sec / reads per sec)Percentage of read hit requests performed by the Symmetrix host directors. Read hits occur when the read I/O operation is satisfied directly from cache.
% utilization This metric shows how close the host director (front-end director including Escon, fibre, or SCSI) is to 100% performance utilization. Percentage is based on the number of I/O operations being performed by the host director.
% write 100 * (writes per sec / requests per sec)Percentage of write requests performed each second by the host director.
accumulated director idle time Number of ticks that elapsed while the director did not have any requests in its queue.
accumulated queue depth Sum of queue depths for the director when an event enters this range (0 - over 640).
Note: This metric is available only for Fibre Channel directors.

42 EMC Ionix ControlCenter 6.1 Performance Manager Metrics Glossary
Performance Manager Metrics Glossary
average queue depth Average queue depth for the director when an event enters this range (0 - over 640).
Note: This metric is available only for Fibre Channel directors.
device write pending events Number of times, each second, that the write-pending limit for a specific Symmetrix device was reached. When the limit is reached, additional write I/O operations are deferred while waiting for data in cache to be destaged to the disk.
hits per sec Number of read and write requests performed each second by the host director that was immediately satisfied by cache.
ios per sec Number of I/O operations performed each second by the Symmetrix host director. This metric represents activity between the Symmetrix and the host or SAN device.
queue depth count Number of events that are waiting while the director's queue is in this range (0 - over 640).
read hits per sec (requests per sec) - (writes per sec) - (read misses per sec) Number of read hit requests performed each second by the Symmetrix host directors. Read hits occur when the read requests is satisfied directly from cache.
read misses per sec Number of read miss requests performed each second by Symmetrix host director. Read misses occur when the data requested by the read I/O operation was not in cache, causing a wait while it was fetched from disk.
reads per sec Number of random read requests performed each second by Symmetrix host director.
requests per sec Number of cache slots accessed each second by host directors. A request is the protocol used by directors (host and disk) to marshal data to and from the cache. Requests are made up of reads and writes.
slot collisions per sec Number of slot collisions each second. A slot collision occurs when two or more directors try to access the same cache slot and the slot happens to be locked for an update operation by one of the directors.
system write pending events Number of times each second that write activity was heavy enough to use up the system limit set for write tracks occupying cache. When the limit is reached, writes are deferred until data in cache is written to disk.
writes per sec Number of write requests performed each second by the host directors.
Table 26 Symmetrix host director metrics (page 2 of 2)
Metric Definition

Symmetrix Metrics 43
Performance Manager Metrics Glossary
Symmetrix port metrics
The following table lists and describes metrics for Symmetrix ports.
Symmetrix VMAX port metrics
The following table lists and describes metrics for Symmetrix VMAX ports.
Note: For Symmetrix Enginuity 5875 and later, % port busy is supported and % utilitzation is equal to % port busy. For Symmetrix Enginuity 5874 and prior to 5874, % utilitzation should be used.
Table 27 Symmetrix port metrics
Metric Definition
% utilization This metric shows how close the port performance is to 100% utilization. Percentage is the throughput in kilobytes each second being performed by the port divided by a fixed number based on the type of port.
average io size in Kbytes (throughput in Kbytes per sec) / (ios per sec)Average number of kilobytes transferred through the Symmetrix port per I/O operation.
ios per sec Number of I/O operations performed each second by the Symmetrix port.
throughput in Kbytes per sec Number of kilobytes transferred through the Symmetrix port (entering the Symmetrix system) each second.
Table 28 Symmetrix VMAX port metrics
Metric Definition
% port busy This metric shows how busy the port is.100 * (throughput in Kbytes per sec / port speed Kbytes per sec)
% port idle This metric shows the port idle time.(100 - % port busy)
Port Speed Kbytes per sec Maximum number of kilobytes available to the port for I/O operations.
throughput in Kbytes per sec Number of kilobytes transferred through the Symmetrix port (entering the Symmetrix system) each second.
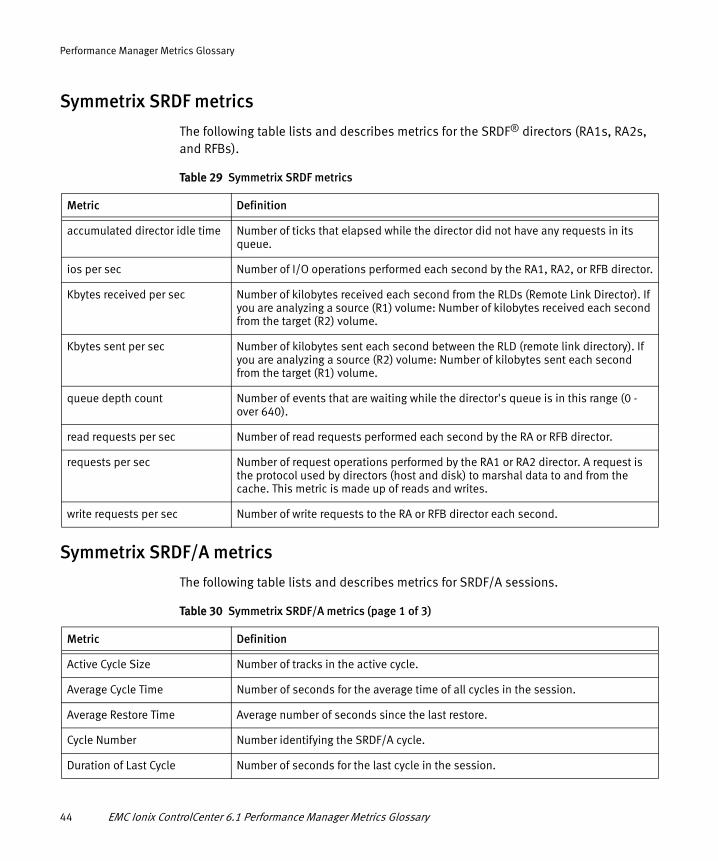
44 EMC Ionix ControlCenter 6.1 Performance Manager Metrics Glossary
Performance Manager Metrics Glossary
Symmetrix SRDF metrics
The following table lists and describes metrics for the SRDF® directors (RA1s, RA2s, and RFBs).
Symmetrix SRDF/A metrics
The following table lists and describes metrics for SRDF/A sessions.
Table 29 Symmetrix SRDF metrics
Metric Definition
accumulated director idle time Number of ticks that elapsed while the director did not have any requests in its queue.
ios per sec Number of I/O operations performed each second by the RA1, RA2, or RFB director.
Kbytes received per sec Number of kilobytes received each second from the RLDs (Remote Link Director). If you are analyzing a source (R1) volume: Number of kilobytes received each second from the target (R2) volume.
Kbytes sent per sec Number of kilobytes sent each second between the RLD (remote link directory). If you are analyzing a source (R2) volume: Number of kilobytes sent each second from the target (R1) volume.
queue depth count Number of events that are waiting while the director's queue is in this range (0 - over 640).
read requests per sec Number of read requests performed each second by the RA or RFB director.
requests per sec Number of request operations performed by the RA1 or RA2 director. A request is the protocol used by directors (host and disk) to marshal data to and from the cache. This metric is made up of reads and writes.
write requests per sec Number of write requests to the RA or RFB director each second.
Table 30 Symmetrix SRDF/A metrics (page 1 of 3)
Metric Definition
Active Cycle Size Number of tracks in the active cycle.
Average Cycle Time Number of seconds for the average time of all cycles in the session.
Average Restore Time Average number of seconds since the last restore.
Cycle Number Number identifying the SRDF/A cycle.
Duration of Last Cycle Number of seconds for the last cycle in the session.

Symmetrix Metrics 45
Performance Manager Metrics Glossary
HA Writes Number of tracks written by HA to the R1.
HA Repeat Writes Number of repeat write operations by HA to the R1.
High Water Mark Number of times each second that I/O activity met the session limit setting.
Host Write IO/s Number of I/O write requests each second for all devices in the group.
Host Write MB/s Number of host I/O write requests (in megabytes) written each second for all devices in the group.
Inactive Cycle Size Number of tracks in the inactive cycle.
Last Restore Time Number of seconds since the last restore.
Local Write Pending Count Number of cache slots with writes pending to a local device.
Max Host Throttle Number of seconds that host writes to SRDF/A devices will be throttled before dropping SRDF/A sessions when cache memory is full. Throttling will delay write operations with the host until a cache track is available. Possible values 0 through 65535.
Max Write Pending Slots Number of system write pending cache slots available for the SRDF/A session.
Minimum Cycle Time Minimum number of seconds to wait before attempting an SRDF/A cycle switch. Value ranges from 5 to 59 seconds.
Number of Device in Session Number of user devices in the SRDF/A session.
R1 to R2 Lag Time Number of seconds that the data on the R2 is behind the data on the R1.
RA Group Number of the RDF (RA) Group.
RA Group IO/s Number of I/O operations each second across the link for the RA Group.
RA Group MB/s Number of I/O operations each second (in megabytes) across the link for the RA Group.
RDFA Active Indicator Number indicating that the SRDF/A session is active (1) or inactive (0).
RDFA Max Cache Usage % Percentage of system write pending cache available for the SRDF/A session. Value ranges from 0 to 100 percent.
RDFA Session Number of the active SRDF/A session. Inactive sessions do not have an assigned type.
Session Number Number of the SRDF/A session.
Table 30 Symmetrix SRDF/A metrics (page 2 of 3)
Metric Definition

46 EMC Ionix ControlCenter 6.1 Performance Manager Metrics Glossary
Performance Manager Metrics Glossary
Symmetrix system metrics
The following table lists and describes metrics for the total of Symmetrix systems or units.
Session Priority Number of the priority used to determine which SRDF/A session to drop when cache memory becomes full. Value ranges from 1 to 64, with 1 representing the highest priority SRDF/A session (last to be dropped).
System Write Pending Count Current write pending count. Number of cache slots in the Symmetrix array with a write pending flag.
Time Since Last Switch Number of seconds since the last switch from active to inactive or from inactive to active. The Metrics view title includes SRDF/A <Symmetrix Identifier/ RA Group / Session Number>; this view also includes the date and time the collection began.
Total Cache Slots In Use Number of cache slots in the active and inactive cycle for the SRDF/A session.
Uncommitted Tracks Number of tracks for all of the RDF/A devices in the session that have not been committed to the R2 device.
Table 30 Symmetrix SRDF/A metrics (page 3 of 3)
Metric Definition
Table 31 Symmetrix system metrics (page 1 of 3)
Metric Definition
% hit 100 * (hits per sec / total ios per sec)Percentage of I/O operations performed by all of the Symmetrix devices, for which the read data was in cache and the write operation could be sent directly to cache without having to wait for data to be destaged from cache to the disks.
% reads 100 * (total reads per sec / total ios per sec)Percentage of total read I/O operations performed each second by all of the Symmetrix devices.
% sequential io 100 * (seq reads per sec / total ios per sec)Percentage of sequential I/O operations. Sequential I/O operations are a combination of the read and write operations. A sequential read occurs when the tracks brought into cache by prefetch tasks are read in the order in which they were put in cache. A sequential write occurs when the data is written to cache sequentially.
% writes 100 * (writes per sec / total ios per sec)Percentage of total write I/O operations performed by all of the Symmetrix devices.

Symmetrix Metrics 47
Performance Manager Metrics Glossary
deferred writes per sec A deferred write is a write hit. A deferred write occurs when the I/O write operations are staged in cache and will be written to disk at a later time.
delayed dfw per sec A delayed deferred fast write (DFW) is a write-miss. A delayed DFW occurs when the I/O write operations are delayed because the system or device write-pending limit was reached and the cache had to destage slots to the disks before the writes could be written to cache.
destaged tracks per sec Number of tracks written per sec from cache to disks.
device max wp limit Maximum number of write-pending slots for the entire Symmetrix. System write-pending limit is equal to 80% of the available cache slots. Symmetrix write-pending limit is not simply a sum of all Symmetrix device write-pending slots. It depends on other factors such as cache size and the Symmetrix configuration.
hits per sec Number of I/O operations performed each second by all of the Symmetrix devices for which the read data was in cache and the write operation could be sent directly to cache without having to wait for data to be destaged from cache to the disks.
ios per sec Number of I/O operations performed each second by all Symmetrix devices including writes and random reads. In contrast, the metric “total ios per sec” on page 48 includes writes, random reads, and sequential reads.
Kbytes read per sec Number of kilobytes read by all of the Symmetrix devices each second.
Kbytes transferred per sec (Kbytes Written per sec) + (Kbytes Read per sec)Number of kilobytes written and read by all of the Symmetrix devices each second.
Kbytes written per sec Number of kilobytes written by all of the Symmetrix devices each second.
number format pending tracks Number of format pending tracks.
number free permacache slots Number of available reserved cache slots.
number used permacache slots Number of use reserved cache slots.
number write pending tracks Number of tracks in cache that are waiting to be destaged to disk and cannot be overwritten.
prefetched tracks per sec Number of tracks prefetched to cache each second across the Symmetrix system.
read hits per sec Number of read hit I/O operations performed each second by all of the Symmetrix devices. Read hits occur when the read I/O operation is satisfied directly from cache.
Table 31 Symmetrix system metrics (page 2 of 3)
Metric Definition

48 EMC Ionix ControlCenter 6.1 Performance Manager Metrics Glossary
Performance Manager Metrics Glossary
reads per sec Number of random reads performed each second by all of the Symmetrix devices.The reads per sec metric for the Symmetrix device statistic does not include sequential reads. In contrast, the metric “total reads per sec” described on this page includes the random and sequential reads each second.
seq reads per sec Number of sequential read I/O operations each second.A sequential read occurs when the tracks brought into cache by prefetch tasks are read in the order in which they were put in cache.
total ios per sec (Random Reads per sec) + (seq reads per sec) + (writes per sec)Total number of read I/O and write I/O operations performed each second by all of the Symmetrix devices.
total reads per sec (Random Reads per sec) + (seq reads per sec)Total number of random read and sequential read operations performed each second by all of the Symmetrix devices.
write hits per sec Number of write hits performed each second by all of the Symmetrix devices.A write hit occurs when the I/O write operation is received, it is immediately staged in cache and will be written to disk at a later time.
writes per sec Number of total writes performed each second by all of the Symmetrix devices.
Table 31 Symmetrix system metrics (page 3 of 3)
Metric Definition