Embed Size (px)
Citation preview

POWERINGN A T I O N S
EMC LIMITEDAnnual Report 2015-16

BOARD OF DIRECTORSMr. Manoj ToshniwalManaging Director
Mr. Ramesh Chandra BardiaJoint Managing Director
Mr. Biplab Shankar BoseDirector
Mr. Suraj Mall SinghiDirector
Mr. Manish AgarwalDirector
Ms. Arundhu� DharWoman Director
CHIEF FINANCIAL OFFICERMr. Arun Kumar Kedia
COMPANY SECRETARYMr. Sumit Kumar Surana
COST AUDITORSN. Radhakrishnan & Co.Cost Accountants
SECRETARIAL AUDITORSA. K. Labh & Co.Company Secretaries
BANKERSState Bank of IndiaAllahabad BankPunjab Na�onal BankUCO BankSber BankState Bank of Pa�alaSyndicate BankCorpora�on BankCentral Bank of IndiaState Bank of HyderabadThe Karur Vysya Bank LimitedThe South Indian Bank LimitedLakshmi Vilas Bank LimitedVijaya BankCanara BankBank of IndiaDena BankIDBI BankBank of BarodaUnion Bank of IndiaBank of Maharashtra
REGISTERED OFFICE"Constan�a Office Complex"(South Block), 8th Floor11, Dr. U. N. Brahmachari Street, Kolkata ‐ 700 017Tel : 2289 3122‐4, Fax : 2289 3121E‐mail : [email protected] : www.emcpower.com
REGISTRAR & TRANSFER AGENTSMaheshwari Datama�cs Pvt. Ltd.6, Mangoe Lane, 2nd Floor, Kolkata ‐ 700 001Tel : 2243 5809, 2243 5029, Fax : 2248 4787E‐mail : [email protected]
Corporate Information
Corporate Overview 1-17
Board & Management Reports 18-40
Standalone Financial Statements 41-66
Consolidated Financial Statements 67-92
Co
nte
nts
France
Spain
GermanyPoland
FinlandSweden
Egypt
Libya
Chad
Italy
Georgia
Canada
USA
Mexico
POWERINGN A T I O N S
EMC LIMITEDAnnual Report 2015-16
This Annual Report is available online at www.emcpower.com
At EMC Limited, the growth strategy for our core businesses reflects three fundamental market trends – the global demand for renewables (par�cularly solar), the evolu�on of energy networks into a pla�orm for distributed‐energy solu�ons and customers' changing needs and requirements.
As an enterprise with a global reputa�on, we are focused on realizing our ambi�on of powering na�ons. In our pursuit of this vision, we aim to add value to all our businesses by delivering an outstanding performance in key areas such as innova�on, customer excellence and sustainability.
Going forward, we believe that this focus will also deepen our rela�onships with customers, business partners and other key stakeholders, posi�oning our business on the path of sustainably profitable growth.
POWERINGNATIONS

EMC Limited is one of India's fastest growing power EPC companies with a revenue CAGR of 36% over the past five years.
With niche turnkey engineering capabili�es built over the decades paired with a global mindset, EMC has emerged as a world‐class provider of end‐to‐end power system solu�ons globally.
VisionSe�ng the standard of excellence in modern power systems globally.
MissionTo be a global provider of outstanding, end‐to‐end integrated solu�ons in transmission lines, sub‐sta�ons, industrial power distribu�on projects and railway infrastructure projects through best‐in‐class technology, supported by experienced professionals, thereby enhancing scalability, providing clean energy, expanding business and empowering lives.
Legacy Established in 1953, EMC has built na�onally‐important power and infrastructure assets and, in doing so, has engaged in extensive na�on‐building. Today, the Company has emerged as a global enterprise with a strong presence in power transmission, power distribu�on, balance‐of‐plant, railways and solar power sectors.
Core advantages At EMC, we are among the few to be qualified to execute 765 kV transmission line projects and among a handful to offer integrated turnkey solu�ons in the field of power transmission systems and associated sub‐systems. We are now poised to enter the 1,200 kV segment. We are also qualified with robust demonstrated experience for up to 765 kV sub‐sta�ons and industrial power systems.
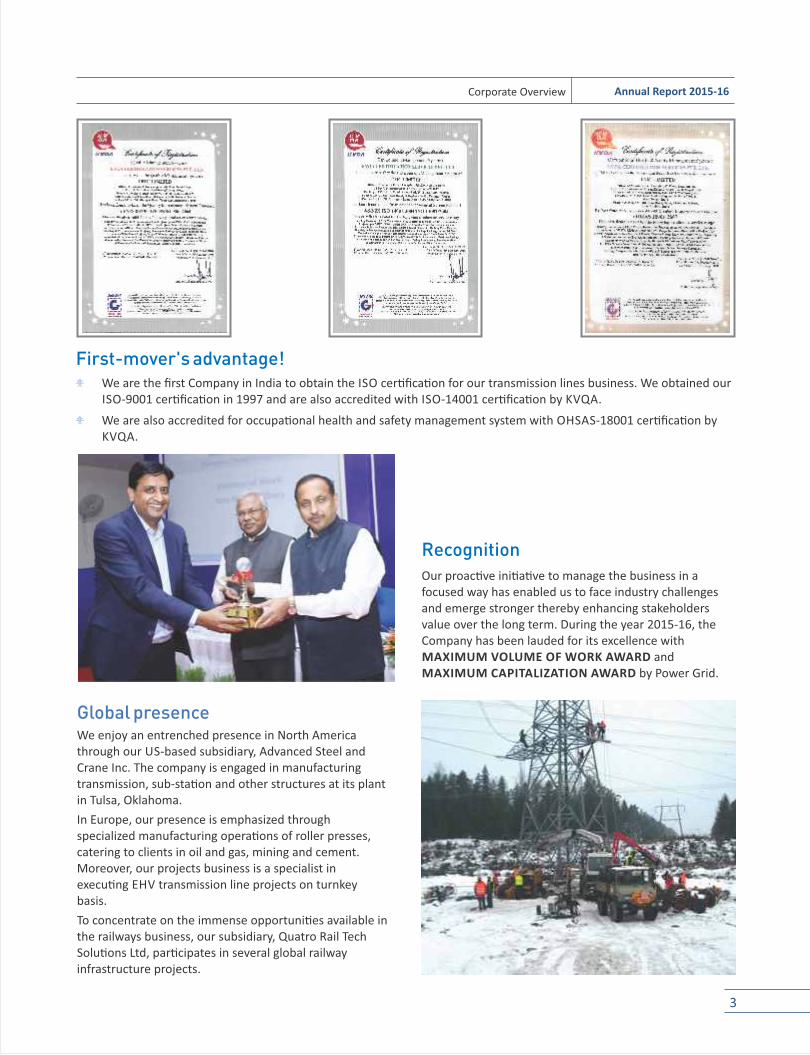
Global presence We enjoy an entrenched presence in North America through our US‐based subsidiary, Advanced Steel and Crane Inc. The company is engaged in manufacturing transmission, sub‐sta�on and other structures at its plant in Tulsa, Oklahoma.
In Europe, our presence is emphasized through specialized manufacturing opera�ons of roller presses, catering to clients in oil and gas, mining and cement. Moreover, our projects business is a specialist in execu�ng EHV transmission line projects on turnkey basis.
To concentrate on the immense opportuni�es available in the railways business, our subsidiary, Quatro Rail Tech Solu�ons Ltd, par�cipates in several global railway infrastructure projects.
First-mover's advantage! We are the first Company in India to obtain the ISO cer�fica�on for our transmission lines business. We obtained our
ISO‐9001 cer�fica�on in 1997 and are also accredited with ISO‐14001 cer�fica�on by KVQA.
We are also accredited for occupa�onal health and safety management system with OHSAS‐18001 cer�fica�on by KVQA.
ParentageEMC is led by Mr. Manoj Toshniwal, a dynamic industry visionary with over 20 years of in‐depth experience in the global power industry.
RecognitionOur proac�ve ini�a�ve to manage the business in a focused way has enabled us to face industry challenges and emerge stronger thereby enhancing stakeholders value over the long term. During the year 2015‐16, the Company has been lauded for its excellence with MAXIMUM VOLUME OF WORK AWARD and MAXIMUM CAPITALIZATION AWARD by Power Grid.
2 3
Corporate Overview Corporate Overview
EMC Limited is one of India's fastest growing power EPC companies with a revenue CAGR of 36% over the past five years.
With niche turnkey engineering capabili�es built over the decades paired with a global mindset, EMC has emerged as a world‐class provider of end‐to‐end power system solu�ons globally.
VisionSe�ng the standard of excellence in modern power systems globally.
MissionTo be a global provider of outstanding, end‐to‐end integrated solu�ons in transmission lines, sub‐sta�ons, industrial power distribu�on projects and railway infrastructure projects through best‐in‐class technology, supported by experienced professionals, thereby enhancing scalability, providing clean energy, expanding business and empowering lives.
Legacy Established in 1953, EMC has built na�onally‐important power and infrastructure assets and, in doing so, has engaged in extensive na�on‐building. Today, the Company has emerged as a global enterprise with a strong presence in power transmission, power distribu�on, balance‐of‐plant, railways and solar power sectors.
Core advantages At EMC, we are among the few to be qualified to execute 765 kV transmission line projects and among a handful to offer integrated turnkey solu�ons in the field of power transmission systems and associated sub‐systems. We are now poised to enter the 1,200 kV segment. We are also qualified with robust demonstrated experience for up to 765 kV sub‐sta�ons and industrial power systems.
Global presence We enjoy an entrenched presence in North America through our US‐based subsidiary, Advanced Steel and Crane Inc. The company is engaged in manufacturing transmission, sub‐sta�on and other structures at its plant in Tulsa, Oklahoma.
In Europe, our presence is emphasized through specialized manufacturing opera�ons of roller presses, catering to clients in oil and gas, mining and cement. Moreover, our projects business is a specialist in execu�ng EHV transmission line projects on turnkey basis.
To concentrate on the immense opportuni�es available in the railways business, our subsidiary, Quatro Rail Tech Solu�ons Ltd, par�cipates in several global railway infrastructure projects.
First-mover's advantage! We are the first Company in India to obtain the ISO cer�fica�on for our transmission lines business. We obtained our
ISO‐9001 cer�fica�on in 1997 and are also accredited with ISO‐14001 cer�fica�on by KVQA.
We are also accredited for occupa�onal health and safety management system with OHSAS‐18001 cer�fica�on by KVQA.
ParentageEMC is led by Mr. Manoj Toshniwal, a dynamic industry visionary with over 20 years of in‐depth experience in the global power industry.
RecognitionOur proac�ve ini�a�ve to manage the business in a focused way has enabled us to face industry challenges and emerge stronger thereby enhancing stakeholders value over the long term. During the year 2015‐16, the Company has been lauded for its excellence with MAXIMUM VOLUME OF WORK AWARD and MAXIMUM CAPITALIZATION AWARD by Power Grid.
2 3
Corporate Overview Corporate Overview

35
.10
34
.65
35
.88
27
.97
17
.25
EPS(`)
20
11
‐12
20
12
‐13
20
13
‐14
20
14
‐15
20
15
‐16
80
8.9
3
52
7.0
8
40
3.4
6
27
9.3
7
14
0.8
4
Networth(`crores)
20
11
‐12
20
12
‐13
20
13
‐14
20
14
‐15
20
15
‐16
Powering nations -
An eventful year2015-16
October 7, 2015 ASC (subsidiary of EMC) received an award for 'Manufacturing leadership 2015' from Governor of the State of Oklahoma.
Powering nations
throughour �nancialacumen.
October 27, 2015 Received order for supply, erec�on, tes�ng and commissioning of Monga ‐ Khulna 230 kV D/C transmission line on turnkey basis in Bangladesh from Power Grid Company, Bangladesh.
October 15, 2015 Successfully commissioned 308‐km of 765 kV D/C Dharamjaygarh‐Jabalpur transmission line, one of the largest in the highest voltage segment, for PGCIL.
Revenue from Operations(`crores)
20
11
‐12
20
12
‐13
20
13
‐14
20
14
‐15
20
15
‐16
41
21
.09
35
82
.68
32
24
.59
20
27
.40
12
06
.07
EBIDTA(`crores)
20
11
‐12
20
12
‐13
20
13
‐14
20
14
‐15
20
15
‐16
44
5.0
5
34
3.0
3
30
0.2
0
19
6.4
3
11
0.0
8
June 30, 2015 Acquired majority stake in McNally Bharat Engineering Company Limited that possesses strong exper�se in material handling, mechanical works and infrastructure.
June 15, 2015 Achieved a new milestone by successfully commissioning 765/400 kV GIS sub‐sta�on at Vadodara for PGCIL.
April 24, 2015 Received an award for 'Extraordinary achievement' towards the comple�on of transmission lines for the year 2014.
April 23, 2015 Received an apprecia�on le�er from Railway Electrifica�on, Danapur.
June 3, 2015 Bagged orders for 500 kV transmission line from Ksani to Stepantsminda (100‐km) in Georgia from JSC Georgia State Electrosystem.
Cash Pro�t(`crores)
20
11
‐12
20
12
‐13
20
13
‐14
20
14
‐15
20
15
‐16
17
7.2
2
14
5.0
8
15
0.9
8
10
6.0
3
61
.69
Net Pro�t(`crores)
20
11
‐12
20
12
‐13
20
13
‐14
20
14
‐15
20
15
‐16
15
9.6
7
12
8.2
2
13
2.7
4
92
.37
56
.91
Our clientele Power Grid Corpora�on of India Limited
Transmission Corpora�on of Andhra Pradesh
West Bengal State Electricity Transmission Company Limited
Maharashtra State Electricity Transmission Company Limited
Jammu and Kashmir Power Development
Central Organisa�on for Railway Electrifica�on
Maharashtra State Electricity Distribu�on Company Limited
South Bihar Power Distribu�on Company Limited
West Bengal State Electricity Distribu�on Company Limited
Indian Iron and Steel Company
NTPC Limited
Delhi Metro Rail Corpora�on Limited
Steel Authority of India Limited
Fingrid Oyj, Finland
Svenska Kra�nat, Sweden
Terna S.p.A., Italy
Rural Electrifica�on Authority, Kenya
4 5
Corporate Overview Corporate Overview
Game ChangerJanuary 27, 2016 Achieved single largest interna�onal contract in JV of about ` 2,000 crores at Oman, Muscat for providing Front End Engineering Design (Feed), Basic and Detail Engineering, Project Management, Procurement, Construc�on, Supervision, Mechanical Commissioning of 30,000 Barrels per day and 1,000,000 TPA Bitumen Refinery.

35
.10
34
.65
35
.88
27
.97
17
.25
EPS(`)
20
11
‐12
20
12
‐13
20
13
‐14
20
14
‐15
20
15
‐16
80
8.9
3
52
7.0
8
40
3.4
6
27
9.3
7
14
0.8
4
Networth(`crores)
20
11
‐12
20
12
‐13
20
13
‐14
20
14
‐15
20
15
‐16
Powering nations -
An eventful year2015-16
October 7, 2015 ASC (subsidiary of EMC) received an award for 'Manufacturing leadership 2015' from Governor of the State of Oklahoma.
Powering nations
throughour �nancialacumen.
October 27, 2015 Received order for supply, erec�on, tes�ng and commissioning of Monga ‐ Khulna 230 kV D/C transmission line on turnkey basis in Bangladesh from Power Grid Company, Bangladesh.
October 15, 2015 Successfully commissioned 308‐km of 765 kV D/C Dharamjaygarh‐Jabalpur transmission line, one of the largest in the highest voltage segment, for PGCIL.
Revenue from Operations(`crores)
20
11
‐12
20
12
‐13
20
13
‐14
20
14
‐15
20
15
‐16
41
21
.09
35
82
.68
32
24
.59
20
27
.40
12
06
.07
EBIDTA(`crores)
20
11
‐12
20
12
‐13
20
13
‐14
20
14
‐15
20
15
‐16
44
5.0
5
34
3.0
3
30
0.2
0
19
6.4
3
11
0.0
8
June 30, 2015 Acquired majority stake in McNally Bharat Engineering Company Limited that possesses strong exper�se in material handling, mechanical works and infrastructure.
June 15, 2015 Achieved a new milestone by successfully commissioning 765/400 kV GIS sub‐sta�on at Vadodara for PGCIL.
April 24, 2015 Received an award for 'Extraordinary achievement' towards the comple�on of transmission lines for the year 2014.
April 23, 2015 Received an apprecia�on le�er from Railway Electrifica�on, Danapur.
June 3, 2015 Bagged orders for 500 kV transmission line from Ksani to Stepantsminda (100‐km) in Georgia from JSC Georgia State Electrosystem.
Cash Pro�t(`crores)
20
11
‐12
20
12
‐13
20
13
‐14
20
14
‐15
20
15
‐16
17
7.2
2
14
5.0
8
15
0.9
8
10
6.0
3
61
.69
Net Pro�t(`crores)
20
11
‐12
20
12
‐13
20
13
‐14
20
14
‐15
20
15
‐16
15
9.6
7
12
8.2
2
13
2.7
4
92
.37
56
.91
Our clientele Power Grid Corpora�on of India Limited
Transmission Corpora�on of Andhra Pradesh
West Bengal State Electricity Transmission Company Limited
Maharashtra State Electricity Transmission Company Limited
Jammu and Kashmir Power Development
Central Organisa�on for Railway Electrifica�on
Maharashtra State Electricity Distribu�on Company Limited
South Bihar Power Distribu�on Company Limited
West Bengal State Electricity Distribu�on Company Limited
Indian Iron and Steel Company
NTPC Limited
Delhi Metro Rail Corpora�on Limited
Steel Authority of India Limited
Fingrid Oyj, Finland
Svenska Kra�nat, Sweden
Terna S.p.A., Italy
Rural Electrifica�on Authority, Kenya
4 5
Corporate Overview Corporate Overview
Game ChangerJanuary 27, 2016 Achieved single largest interna�onal contract in JV of about ` 2,000 crores at Oman, Muscat for providing Front End Engineering Design (Feed), Basic and Detail Engineering, Project Management, Procurement, Construc�on, Supervision, Mechanical Commissioning of 30,000 Barrels per day and 1,000,000 TPA Bitumen Refinery.

Powering nations
through our competitive strengths which drives our quest for electrifying the future and enabling newer possibilities.At EMC, our goal is to offer reliable, high‐quality and environment‐friendly energy supply infrastructure and
solu�ons that improve the well‐being of people, drive economic and social development of the communi�es
in which we operate and create sustainable value for our shareholders, customers, employees and suppliers.
In prepara�on of the energy transi�on to clean and efficient technologies to meet global commitments on
reducing emissions on the one hand and to capitalise on strong growth in world energy demand (30% increase
by 2040, according to forecasts by the Interna�onal Energy Agency) on the other, we are commi�ed to find
sustainable solu�ons that require greater simultaneous electrifica�on and de‐carbonisa�on of the global
economy.
The achievement of these goals is closely linked to our ability to leverage our inherent compe��ve advantages.
Our focus on technological innova�on will con�nue to be a priority in order to maintain our lead in the
development of new products, services and business models that transform the industry. In 2015‐16, we have
extensively focused towards clean energy, solar power, smart grids, digi�za�on and new product development
specifically rela�ng to the railways, which will allow us to con�nue mee�ng the energy and efficiency needs of
our customers, offering them new products and services to improve their profitability and well‐being.
This emphasis on innova�on pushes us to con�nue strengthening the ongoing high‐quality training of our
workforce. In the coming years, we will con�nue with the 'Electricity for all' programme to keep bringing
electric power to people without it in emerging and developing countries. As our focus on markets abroad
have increased, our non‐India revenues have also steadily grown from strength to strength.
Going into the future, leveraging our core engineering and construc�on capabili�es, our integrated end‐to‐end offerings, our focus on customer excellence through on‐schedule and cost‐effec�ve comple�on, our robust mul�‐year client rela�onships and our focus on interna�onal diversifica�on will not only enable us to augment our quality of earnings but also increasingly de‐risk our income profile while opening‐up new revenue streams.
Did you know?As many as 1.2 billion people, or 17% of the global popula�on, currently lack access to electricity and 2.7 billion people, or 38% of the global popula�on, put their health at risk by resor�ng to the tradi�onal use of solid biomass for cooking. An investment of around USD 7 trillion will be needed in OECD countries (USD 13 trillion in non‐OECD countries) through 2040 to sa�sfy the growing demand for electricity and to meet the goals of global energy policies.
Source: World Energy Outlook, 2015 – IEA
6 7
Corporate Overview Corporate Overview

At EMC, we are commi�ed to bring clean and compe��ve energy to light some of the darkest areas of the globe.
One of our biggest achievements of 2015‐16 comprised the bagging of our single‐largest order ever worth ` 2,048 crores from Sohar Bitumen LLC in Oman, jointly with McNally Bharat, in October 2015. The successful award of this project, a bitumen refinery, despite s�ff global compe��on reflects the success of our joint venture and paves the way for us bidding for and bagging other such large and complex projects not only in Oman but elsewhere in the world too. The execu�on �meline for this value‐accre�ve project is 24 months and we are confident of comple�on within the specified �meframe.
Some of the other pres�gious interna�onal projects bagged during the year include an order for 500 kV single‐circuit transmission line of 97 km in Georgia, USA, worth ` 157 crores and a 230 kV double‐circuit transmission line of 23‐km in Bangladesh, worth ` 97 crores. These projects will add a�rac�vely to our EBIDTA margins, going forward.
With a view to service our interna�onal customer requirements with speed and surety, we have created
Powering nations
by taking our time-tested Indian business practices across international shores.
dedicated resources and infrastructure, housed in our subsidiaries. Some of these include:
Advance Steel and Crane Inc., USA (100% ownership): Engaged in the manufacture of sub‐sta�on structures in tubular and la�ce, small transmission structures and distribu�on poles, primarily for the public u�lity industry.
Tecnolines S.R.L., Italy (90% ownership): Engaged in the produc�on of helicopter‐based tower erec�on and stringing with robust demonstrated experience.
CE Maschinenbau GMBH (90% ownership): Engaged in the manufacture of components and complete machines for engineering and plant construc�on for the cement industry.
Quarto Rail Tech Solu�ons Limited, India (60% ownership): Provides consultancy services to various na�onal and interna�onal companies in the fields of telecommunica�on, electrifica�on and signalling system solu�ons for mainline and metro‐line and is also engaged in the produc�on, assembly and system integra�on in the areas of safety and security.
EMC Tower Limited, India (100% ownership): This subsidiary is engaged in the business of fabricators, galvanizers, hot dip galvanizers, processing of ferrous and non‐ferrous metal including iron and steel and manufacture a wide range of transmission line towers and structures.
EMC Solar Limited, India (100% ownership): Established to conduct the business of genera�on, co‐genera�on, distribu�on, transmission and sale of all forms of energy/power, including se�ng‐up of facili�es to generate, acquire, purchase, develop and accumulate power by wind, solar, hydro, thermal, bio‐mass, coal, gas, geo‐thermal or any other conven�onal and/or non‐conven�onal sources and to transmit, distribute, sell and supply such power for cap�ve consump�on and other ac�vi�es.
8 9

At EMC, we are focusing on an exci�ng range of both established as well as sunrise businesses that are typically characterised by huge scope, con�nual opportunity and rela�vely strong entry barriers. Even as we con�nually evaluate new opportuni�es for growth, our railways and solar businesses are our current focus areas.
Railways
EMC par�cipates in railway infrastructure projects to capitalize on the immense opportuni�es available in the Indian Railways, one of the world's largest and oldest government‐owned ins�tu�ons. Interes�ngly, India possesses the fourth largest railway network in the world.
We operate in the railways business through our subsidiary, Quatro Rail Tech Solu�ons. The company offers best‐in‐class design, installa�on, tes�ng and commissioning of electronic signaling, telecommunica�on and OHE and TSS for railway networks, both mainline and mass transit systems. The company's founders and senior management team possess over 100 years of combined experience and represent a rare pool of talent and
Powering nations
through a diversi�ed and sustainable business model.
exper�se in railway signalling and communica�ons domain with superla�ve strategic project‐specific �e‐ups with reputed companies in the business.
Established in 2012, Quatro has established itself today as a renowned player in the railways sector within a short span and is embarking on an expansion of its opera�ons both in India and overseas.
Some of the company's key projects include the following:
Supply, installa�on, tes�ng and commissioning of indoor systems for four sta�ons ‐ Surajpur Road, Pasla, Sonpur and Ramanujnagar for signaling and telecommunica�on works of new BG line from Surajpur Road to Ramanujnagar in South East Central Railway in the state of Chha�sgarh
Design, supply, erec�on, tes�ng and commissioning of 25 kV, 50Hz, single phase overhead equipment including TSS, SCADA and electric general works on turnkey basis in Vizianagaram ‐ Singapur Road sec�on
Design, supply, erec�on, tes�ng and commissioning of 25 kV, 50 Hz, single phase overhead equipment including TSS, SCADA and electric general works on turnkey basis in Kumedpur – Old Malda & Old Malda ‐ Singhabad sec�on
Design, supply, erec�on, tes�ng and commissioning of 25 kV, 50 Hz, single phase overhead equipment including TSS, SCADA and electric general works on turnkey basis in Garwa Road‐Chopan‐Singarauli /Mahadia and Karalia–Shak�nagar sec�on
Solar power
At EMC, we are commi�ed to clean and green energy. Towards this extent, we successfully commissioned a 5 MW solar plant at Naini, Allahabad, on 4 March 2012 under the Government of India's Jawaharlal Nehru Na�onal Solar Mission (JNNSM).
This asset is the first‐of‐its‐kind in the state of U�ar Pradesh. We signed the power purchase agreement (PPA) with NTPC Vidyut Vyapar Nigam, ensuring con�nuous sale for the next 25 years.
Some interesting facts on solar energy!
Almost 170,000 billion wa�s from the sun hit the Earth every moment, much more than the planet's consump�on.
Solar energy is abundant and, unlike most energy sources, completely free.
It takes less than 10 minutes for light to travel more than 90 million miles from the sun to the Earth.
Solar energy is environmental friendly as it has zero emissions while genera�ng electricity or heat.
India is endowed with vast solar energy poten�al. About 5,000 trillion kWh per year of energy is incident over India's land area with most parts receiving 4‐7 kWh per sq. m per day.
At EMC, our environment-friendly plant in Naini provides sustainable and renewable energy that also earns carbon credits.
Corporate Overview Corporate Overview
1110

Powering nationsthrough empowering our human resource and energising our social responsibility practices.Our human capital An organiza�on's business strategy and its products and services can be copied. What cannot be easily copied however are an organiza�on's people, its culture and its competencies. The successful delivery of any business strategy depends on an organiza�on having available highly qualified and mo�vated employees as well as a strong and diverse talent pipeline. Great companies execute their people strategy with the same energy, vivacity and determina�on they apply to the business strategy.
At EMC, the primary objec�ve of our human capital and people strategy is to enhance our people's performance and leadership to power business success. Our strategy, which sets the frame for our HR work programs of the next three to five years, has five key success factors:
Preparing our people for the future.
Providing opportuni�es and recognizing performance.
Open thinking.
Mul�‐organisa�onal engagement.
Zero complacency.
Our people strategy is delivered by HR staff at all our units and in all our regions. To support it through their interac�ons with all employees, our HR staff is commi�ed to being customer‐oriented, con�nually improving HR services, working in partnership with employee representa�ves and keeping things simple.
One of the other facets of our human capital is that it fosters a diverse team of people who differ by na�onality, age, gender, religion and/or cultural and social background. Diversity is a key success factor. Numerous studies have indicated that heterogeneous teams outperform homogenous ones. Diversity is equally crucial in view of demographic trends. Going forward, only those companies that embrace diversity will be able to remain a�rac�ve employers and be less affected by the shortage of skilled workers. It is our strong belief that our Company is one of them.
As on 31st March 2016, EMC had around 1,300 employees worldwide in its payroll.
The Academy imparts training in different disciplines like environment management, civil design and quality control, power sector in transmission sub‐sta�on, planning of power systems, quality management, safety management and behavioural management, extending to students, industries and Government agencies.Apart from the open programmes, the Academy also aims to discuss and interact with industry and educa�onal ins�tu�ons to develop customized in‐house programmes to meet the specific requirements of the industry and educa�onal ins�tu�ons.
Currently, the Academy has four classrooms which are well‐equipped with all modern audio‐visual aids like LCD projectors, so�ware, hardware and online browsing, among others.EMC Academy is situated in the heart of Kolkata and easily accessible.
Environmental preservation The Company is commi�ed towards clean and green energy and its 5 MW solar plant at Naini, Allahabad, in March 2012 under the Government of India's Jawaharlal Nehru Na�onal Solar Mission is the first solar plant of its kind in U�ar Pradesh. In order to limit the environmental impact of our ac�vi�es, we con�nually strive to raise safety standards and also to meet our commitment to environmental preserva�on and sustenance we plant trees and engage in landscaping in and around our factories and offices.
Corporate sustainability Our many stakeholders—customers and suppliers, policymakers and government agencies, employees and trade unions, non‐governmental organiza�ons and regional interest groups, equity analysts and investors—have high expecta�ons from us and our industry. Foremost, they expect us to expand our sustainability ini�a�ves and develop new and innova�ve customer solu�ons.
As a large number of countries the world over transi�on to a low‐carbon future, this trend offers us many opportuni�es and we aim to seize them, while at the same �me proac�vely manage the a�endant risks. We monitor our progress by means of a sustainability work program, which is divided into a number of focus areas. Our commitment to transparency includes subjec�ng our sustainability performance to independent, detailed assessments by third‐party agencies. Our compliance with laws and regula�ons and with our own internal policies has a par�cularly significant impact on our reputa�on as a responsible company. We expect the same degree of compliance from of our suppliers.
EMC Academy The EMC Academy is our endeavour to establish a unique ins�tu�on that fosters professional development of engineers, supervisors and others to meet the growing need of trained manpower in the power sector.
12 13
Corporate Overview Corporate Overview

I have always believed that companies that successfully address and alleviate some of the most genuine pressures of a society and a na�on with futuris�c products and solu�ons create enduring higher order value. The era that we live in today is a testament of this convic�on.
Today, the world's largest car travel company does not own a single vehicle. A company that provides tourists lodging across thousands of ci�es the world over does not own a single cubic area of space. A company with billions of dollars of retail sales does not own a single retail shop. All these companies are built on the spirit of enterprise, the digi�sa�on and globalisa�on waves and, of course, the indisputable need to solve a real‐world problem.
The other megatrend that is most visible today is that more than ever before, companies across the globe are recognising the need to develop a business model that has embedded sustainability at the heart of its opera�ons. Notwithstanding the slowdown, the rise of the emerging countries is undisputed as they have been the flag‐bearers of global growth. With stellar GDP growth rates, India par�cularly, has outpaced Japan to become the world's third largest economy in terms of purchasing power parity. With a typically large popula�on pool, a�rac�ve demographics and rising aspira�ons, India is truly scrip�ng its own story of evolu�on and progress.
EMC � the big picture At EMC, we have always looked at the bigger picture with the singular objec�ve of serving the interests of the na�on.
We find extraordinary inspira�on in the Indian Government's clarion call of '24x7 Power for all' and the country's quest to bring this important lifeline to every home is what drives us to perform be�er every single day. Power is not only an essen�al ingredient for everyday life but is also the backbone of some of the Centre's ambi�ous ini�a�ves such as 'Make in India' and 'Digital India' pla�orms. As an enterprise that is deeply rooted in India's soil, we are commi�ed to bring the full value of our organisa�on in transforming the country's energy and infrastructure sectors and also apply our rich exper�se to some of the world's a�rac�vely growing markets, truly leveraging our branding of 'made in India, sold around the world'.
It is widely believed among most thought leaders and industry bodies that power and infrastructure are the two key sectors that are essen�al to sustain the country's economic growth. In fact, India's Hon'ble Finance Minister has o�en men�oned that these are essen�al
components to grow India's GDP to 8% in the near future. It is this recogni�on that has brought the Government to usher some landmark structural reforms in both these sectors that include quicker arbitra�on se�lement, new and risk‐efficient public‐private partnership models, financial restructuring of state electricity boards (SEBs), poten�al implementa�on of the game‐changing GST that will usher a unified taxa�on regime across the country and a renewed focus on power evacua�on through growing investments in electricity transmission and distribu�on.
India � the land of opportunity In a post‐Brexit world, India is a stable ship with steady economic growth. The country recorded a GDP growth of 7.6% in 2015‐16, which is the fastest‐growing among large na�ons of the world. Against expecta�ons, India has overtaken China and the World Economic Outlook of the Interna�onal Monetary Fund portrays India and the US as two pillars holding up a wobbling global economy.
Today, India is o�en referred to as a poten�al superpower by a wide‐range of interna�onal journals and the country is widely recognised as the only Asian power that can check China in the 21st century. In 1991, India was a member of the G77 group of developing countries. By 2016, the na�on is a proud member of the G20, an agglomera�on of the most powerful countries in the world.
Under a future‐facing leadership helmed by a dynamic Prime Minister Shri Narendra Modi, India is formula�ng a new architecture of policy‐making that is focused on an�cipa�ng challenges and proac�vely exploring solu�ons and remedies. It is in this essence that the Planning Commission has been replaced by a NITI Aayog, a forum that has been tasked with developing a 15‐year vision document that would blueprint the founda�on for the next century to take the country forward. It has also been mandated with the task of engaging collabora�vely with states so that solu�ons are found in the true spirit of coopera�ve federalism.
With a new energy that has recharged the country's ambi�on to achieve its true poten�al as an economic powerhouse, there have been several achievements in the realms of a large number of sectors. Take roads for instance. As per the NITI Aayog, of the total number of stuck projects of ` 3.8 lakh crores, the government has already unblocked ` 3.5 lakh crores worth of projects and, consequently, road construc�on has picked up pace from averaging 8.5‐km a day during the last two years to 16.5‐km in 2015‐16. Under railways, the average rate of track
Corporate Overview Corporate Overview
Dear shareholders, Managing Director�s perspective
14 15
Manoj Toshniwal, Managing Director, EMC LIMITED

(balance‐of‐plant) for both EHV sub‐sta�on and plant electrifica�on for integrated steel and power plants, manufacturing core railway infrastructure products and commissioning solar power projects.
For our core business of power transmission that contributes substan�ally to our annual revenues, we reported some major developments during the year under review. We bagged our single‐largest interna�onal contract to the tune of about ` 2,000 crores in Oman, Muscat, a reflec�on of our growing capabili�es and recogni�on in markets abroad. We also bagged projects in Georgia, US and Bangladesh worth ` 157 crores and ` 97 crores, respec�vely.
In India, we bagged prominent sub‐sta�on projects in the state of Sikkim. We are also close to successfully comple�ng and handing‐over India's largest 765 kV sub‐sta�on at Vemagiri, Andhra Pradesh. In yet another pres�gious acknowledgement of our capabili�es, we received an award from PGCIL for 'Maximum capitaliza�on and maximum volume of work in a year' for 2015.
Overall, we recorded an impressive growth of 81.62% in our order book which scaled from ` 2,311.27 crores as on 31 March 2015 to ` 4,197.63 crores as on 31 March 2016.
Outlook � the path ahead As an enterprise that is embedded in the country's energy sector, we expect to generate sustainable growth, thereby focusing on genera�ng consistent value for our shareowners and other stakeholders who work with us and depend upon us.
One of the key trends shaping our business today is that although awarded projects are becoming larger in �cket size, they are also becoming more difficult to implement, being located in challenging geographies and topographies and those regions that have a history of geo‐poli�cal strife. Companies that are yet to build capabili�es to work in these condi�ons will pave the way for larger and more respected players like us who have demonstrated the successful execu�on of such projects.
In the current year (2016‐17), we expect to finalise the scheme of amalgama�on with Kilburn Engineering and are pleased to state that we have already received an approval for the same from the Compe��on Commission of India.
On the overall, we expect to focus on bagging a larger number of foreign contracts to diversify our order book and risk profile and expect to generate a 10% growth in our topline in 2016‐17.
With my very best regards,
Manoj Toshniwal
Managing Director
16
Corporate Overview
We bagged our single-largest international contract in JV to the tune of about ` 2,000 crores in Oman, Muscat, a re�ection of our growing capabilities and recognition in markets abroad.
expansion has been scaled to 7‐km per day during 2015‐16 from 4.3‐km during the past several years and with the gravita�onal shi� to high‐speed trains and the expected merger of the Railway Budget with the Union Budget from 2017 onwards, one can expect significant structural upcoming opportuni�es for this na�onal ins�tu�on that has among the world's largest railway networks. Under solar power, during 2015‐16, 1.5 GW was added to enhance the capacity to 3.7 GW as on 31 March 2016. As many as 32 solar parks of 20 GW have been approved in 20 states with the expected opera�onalisa�on by 2019‐20.
Brightening horizons � a large and unprecedented power sector opportunityThe Indian government has ushered in a slew of reforms to revive the country's power sector in addi�on to launching several schemes and programmes that aim to debo�leneck the sector and unleash its true growth poten�al.
The Centre's imminent launch of a 20‐year plan for the transmission sector has been scripted such that it keeps pace with the growth in power genera�on in the country. The expected transmission network by the end of the 12th Plan in 2017 is projected at 360,000 ckm with around 113 GW of genera�on capacity likely to be added in the remaining period of the 12th Plan. A projected investment of USD 50 bn is an�cipated as India's spending in its T&D sector in the 12th Plan. Moreover, the 'Green Corridors' project, which entails an alternate transmission network for renewable energy is being revised, keeping up with the plan to augment renewable energy capacity to 175,000 MW.
Per capita energy consump�on in India is about 1,000 kVh which pales in comparison to some of the other countries and this itself represents a strong case for strengthening the power sector for a country that is among the fastest‐growing na�ons in the world. Besides, the present investment in power genera�on‐to‐transmission ra�o stands at about 1:0.5, which should be ideally 1:1 and it is only a ma�er of �me that T&D sector investments match that of power genera�on capacity. With the government launching the Integrated Power Development Scheme (IPDS) with the intent of arres�ng future distribu�on losses, several ini�a�ves including underground cabling and IT‐enabled energy accoun�ng are envisaged. Besides, the RGGVY (Rajiv Gandhi Gram Vidyu�karan Yojana) has envisioned extensive rural electrifica�on and UDAY (Ujwal Discom Assurance Yojana) seeks to reform debt‐laden SEBs to make them more credible buyers of electricity.
Shockingly, according to the latest data, 3.1 billion units of electricity were lost on power trading pla�orms due to transmission conges�on, in 2014‐15, resul�ng in sharp spikes in power deficit. Clearly therefore, the need of the hour is boos�ng of transmission capacity and this clearly is the next fron�er for growth in the country's power sector.
Global transmission sector opportunity According to the World Energy Outlook 2014 and World Bank es�mates, the T&D capex needs for FY2014‐35 for the Middle East stands at USD 225 billion, for Africa at USD 421 billion, for the US (Americas and Brazil included) at USD 2,114 billion and for Asia at a massive USD 3,128 billion, driven by interconnec�on and transmission for new genera�on capaci�es, replacement demand and rising electricity demand (IEA es�mate of 2.7% CAGR over 2009‐35), among others. Being a strong player with pre‐established creden�als in some of these markets, at EMC, we expect to capitalise on these opportuni�es by growing our interna�onal order book.
EMC � at the cusp of new beginnings With a rich track record of having successfully completed several large & pres�gious transmission line projects in India and abroad, world‐class turnkey engineering capabili�es, strong intellectual pool, deep commitment to quality and customer excellence and healthy Balance Sheet, we are at the cusp of new beginnings to become stronger and be�er poised to capitalise on the imminent opportuni�es thrown up by the manufacturing, energy and railways sectors.
Our proposed merger with the large & diversified BM Khaitan‐controlled Williamson Magor Group's engineering enterprise Kilburn Engineering, is being structured to create a large and dynamic engineering joint venture with unparalleled synergies that will not only strengthen the overall bouquet of offerings, thereby reinforcing customer value, but also drive down costs through common capabili�es, thereby enriching margins and profitability. Post all the regulatory approvals, the merged en�ty will emerge as a holis�c solu�ons provider for power plants as well as power transmission units, material handling industries and the specialised drying equipment sector.
2015-16 � a year of progress Established in 1953, EMC is one of the oldest and few turnkey EPC solu�ons providers for overhead transmission lines up to 765 kV and extra‐high voltage transmission lines with readiness in 1,200 kV transmission line projects. We possess demonstrated capabili�es in supply contracts as well as construc�on ac�vi�es, providing our clients with end‐to‐end transmission line solu�ons. We also enjoy world‐class exper�se in BoP
Corporate Overview
17

18
Annual Report 2015-16
Board & Management Reports
Table of contents:Management Discussion & Analysis 19-23Directors' Report & Annexures 24-40

Management Discussions & Analysis Annual Report 2015-16
19
GLOBAL ECONOMY
According to the World Economic Outlook Update 2016, the global economy declined to 3.1% in 2015 from 3.4% in 2014. This decelera on was caused primarily by a decline in global oil prices, below-expecta on growth in the Chinese economy, vola lity in the commodity and financial markets and declining global investments caused by tapering demand. Though Britain’s exit from the European Union grouping (Brexit) is expected to further impact the world economy, several bright spots indicate that the global economy will grow to 3.4% in 2016 and 3.6% in 2017.
A number of large global economies are already showing signs of improvement, thanks to the strengthening of the labour and housing markets and brightening investor sen ment. According to the same World Economic update, across advanced economies, economic growth is expected to increase to a modest 2.1% in 2016 and remain stable in 2017. In emerging economies, the growth is expected to augment from 4.3% in 2016 to 4.7% in 2017, driven by growth in the Indian and Chinese economies.
INDIAN ECONOMY
On the back of prudent fiscal policies and structural reforms ini ated across several sectors, the Indian economy has been able to withstand the global meltdown. Key and mely policy reforms have led to ac ve infla on-targe ng in India; besides, the lowering of fiscal and current account deficits has also contributed to economic stability. In fact, the Government has been able to achieve its fiscal deficit target of 3.9% with the WPI (Wholesale Price Index) remaining in the nega ve territory for 2015-16.
A number of posi ve developments have led to the improvement of the Indian economy with GDP scaling from 7.2% in 2014-15 to 7.6% in 2015-16 (CSO). The fall in global oil prices has given the much need impetus to the growth aspira ons of the country. This has led to savings of subsidy expenditure and has presented an opportunity to increase excise duty on petrol and diesel. Although a decline in global demand impacted Indian exports to some extent, the manufacturing and industrial sectors performed well. It must be men oned that the new Foreign Trade Policy (2015-20) aims to export goods and services to the tune of USD 900 billion by 2020.
At par monsoons for the current fiscal year has reversed the past two consecu ve years of drought and given the much-needed boost to the agriculture sector, leading to rural prosperity. Besides, the impact of the Seventh Pay Commission will drive demand across a number of sectors and the economy is expected to register a growth of 7.75-8% in 2016-17 (CSO es mates).
India’s GDP growth – accelera ng momentum
6.6%
FY 2014 FY 2015 FY 2016
7.8%7.6%7.4%7.2%7.0%6.8%6.6%6.4%6.2%6.0%
7.2%
7.6%
Source: CSO
The Central Government’s focus on growing infrastructure investments, formula ng appealing public-private partnership models like the hybrid annuity model (HAM) in road construc on, unlocking liquidity through speedy arbitra on se lement for infrastructure projects and structuring growth-oriented ini a ves like the Make in India, Start-up India, Smart Ci es, Digital India, Skill India and even the Swachh Bharat Abhiyan, have together created a conducive pla orm for sustainable economic and social growth for years to come.
With a view to augment financial resources for the infrastructure sector, the Government plans to for fy a funding pipeline through the Rs. 40,000 crores Na onal Investment and Infrastructure Fund (NIIF), which will give a fresh boost to the sector. This fund will have different sectoral heads and half the amount will come from the Government, thus mi ga ng risks to some extent. Moreover, the NIIF will commence opera ons by providing sectorally-dedicated funds aimed at clean energy and highways.
The poten al implementa on of the Goods and Services Tax (GST) in 2017 will also boost trade, crea ng a single unified taxable market throughout the country. This will streamline trade and commerce, unlock investments and promote structural growth. In fact, the implementa on of GST is perceived to add as much as 2% to the country’s GDP.
GLOBAL POWER SECTOR – TRANSMISSION AND DISTRIBUTION
Globally, investments in the transmission and distribu on industry are focused towards construc on of new transmission lines, establishment of new lines to especially support large industrial facili es and complexes and modernisa on and renewal of legacy infrastructure. On the other hand, transmission expansion in developing countries is mainly driven by making electricity accessible. Developing economies of Asia, Africa and La n America are expected to drive the power sector’s growth with an cipated investment es mates of over USD 1,070 billion. As much as 1,658 GW in genera on capacity has been planned or is expected to be added, requiring 1.04 million km of transmission lines that are expected to be built by 2020.
Global transmission line length (over 100 kV; lac km)
FY 2014 FY 2020
CAGR : 3.4%39.28
49.7460.00
50.0040.00
30.0020.0010.00
0.00
Source: Global Electricity Transmission Report 2014-20

20
Annual Report 2015-16 Management Discussions & Analysis
Cumula ve investment needs in power transmission and distribu on during 2015-40 (USD billion)
Region / country 2015-25 2026-40 Total 2015-40 Americas 447 645 1,092Europe 424 469 893East Europe / Eurasia 195 274 469Asia 1,514 2,269 3,783The Middle East 117 167 284Africa 241 583 824La n America 164 300 494World total 3,366 4,996 8,362 India 301 544 845
Source: Interna onal Energy Outlook
EUROPE – BRIEF INDUSTRY OVERVIEW
Across Europe, around €140 billion is required for the development of high voltage transmission systems, storage and smart grid applica ons, by 2020. Despite the nega vity in the Euro-zone’s investment climate, especially post Britain’s historic exit in early 2016, many countries s ll have plans to lay new lines or upgrade exis ng infrastructure. With growing environmental recogni on, most of the developed countries of Europe are looking to shi from coal and nuclear power to cleaner and renewable energy, which would necessitate the requirement for new lines to evacuate power to consumers.
NORTH AMERICA – BRIEF INDUSTRY OVERVIEW
According to an Elecrama report (2016), by 2040, the US electricity demand is expected to rise by 24% from 2012 and investment in renewable energy projects has grown at a CAGR of 37% over the past six years to cater to the growth in electricity demand. The report indicates that as much as 70% of transformers and transmission lines are over 25 years old and 60% of distribu on poles are between 30-50 years old, rela ve to their useful life of 20 years and 50 years, respec vely. The infrastructure investment is forecast to be higher than USD 49 billion in 2016 towards replacement, upgrada on, modernisa on and expansion. As in Europe, North America is also witnessing increasing use of renewable energy in a bid to switch to cleaner fuel sources. Besides, shi to renewable energy and the increasing importance of shale gas as an emerging energy alterna ve will demand an increase in new lines from new power plants. Reports indicate that about USD 160 billion worth of investments are expected in the North American power T&D space.
SOUTH AMERICA – BRIEF INDUSTRY OVERVIEW
The region’s electricity consump on is expected to grow at 2.9% per annum to about 2,500 TWh by 2035, almost double from current levels. It must be indicated that Brazil’s electricity market is the largest in South America. As the majority of power genera on in the country is hydropower-based, there is need for new power plants of various fuels to ensure uninterrupted power supply and diversifica on to new fuel sources. This necessitates new power transmission lines. Region-wise, Peru is expected to invest USD 470 million as part of its 2013-18 ‘Binding Plan’ for new and exis ng re-powering of power lines. Besides, countries like
Argen na, Chile, Colombia and Ecuador have also planned various new lines and upgrada on of exis ng lines.
ASIA – BRIEF INDUSTRY OVERVIEW
The Asia-Pacific region has steadily emerged as one of the key market for T&D players with rising ac vity in China, reforms in many markets, electrifica on mandates across several regions and a focus on renewable energy driving. With the con nent having some of world’s fastest growing economies, there is a constant demand and growth for power. However, demand shortages and poor infrastructure are the principal issues plaguing the electricity sector in this region, which also points to significant incipient market poten al. Demand for electricity in Asia is expected to grow 3.4% per year to as much as 15,000 TWh by 2035, nearly doubling from ~7,000 TWh in 2010. Besides, Asia will account for almost 60% of world electricity demand growth leading to 2035 and account for over 50% of global electricity demand.
As per a Frost & Sullivan report, an increase in grid investments is expected to drive the Asia-Pacific (APAC) T&D market that is es mated to surpass USD 24.11 billion in 2015. Efforts to extend the grid to remote areas in developing na ons like Vietnam, Indonesia and the Philippines will also lend momentum to the Asia Pacific T&D equipment as well as EPC industry.
MIDDLE EAST – BRIEF INDUSTRY OVERVIEW
The Middle East is among the most electricity-intensive regions globally with a per capita electricity consump on of more than double the global average. As per the Global Transmission Report 2013, the highest growth in genera on capacity of 8.1% was witnessed in the Middle East region over the past few years. The cumula ve investment in the power transmission segment is expected to be as much as USD 38.7 billion by 2020. At USD 14.5 billion, Saudi Arabia a racts 37.4% of aggregate investments. Qatar and the UAE are expected to invest almost similar levels in their transmission segments.
According to the Interna onal Energy Agency, the Middle East electricity consump on is expected to increase to 1,353 TWh by 2030 (recording a CAGR of about 4%). With 238 GW of capacity expected to power the region that is also now looking to de-risk its economic profile through increasing non-oil investments, a substan al demand for new and upgrading exis ng transmission lines is expected to follow. North Grid linking Saudi Arabia, Qatar, Kuwait and Bahrain has been completed under Phase I. In Phase II, UAE and Oman will be linked as part of the South Grid and Phase III with see the linking of the North and South Grids. On the overall, the Kingdom of Saudi Arabia is expected to invest about USD 140 billion in its power genera on and transmission infrastructure by 2020, throwing significant opportuni es for par cipants.
AFRICA – BRIEF INDUSTRY OVERVIEW
As per Africa Power Vision (APV), the con nent is expected to achieve an 80% residen al electrifica on rate by 2040 and 90% for industry/business with sufficient energy to deliver to those connected, while also implemen ng off-grid solu ons. The region’s installed capacity is expected to touch 240.6 GW by the end of 2020, recording a substan al 10.1% CAGR as compared to its 2014 capacity. Africa’s electricity consump on is expected to grow 5.7% per annum to 3,188 TWh by 2040. A number of inter-connec on projects have been planned as part of the EAPP cons tu ng

21
Management Discussions & Analysis Annual Report 2015-16
about 10,500-km of lines with a voltage range of 220-600 kV (including 500 kV and 600 kV HVDC bi-poles). ‘Powering Africa’, a 2015 McKinsey’s report es mates the sub-Sahara Africa region would require about USD 490 billion of capex for new genera ng capacity in addi on to another USD 345 billion for transmission and distribu on. Besides, the West African Power Pool (WAPP) and the South African Power Pool (SAPP) have been envisaged to connect energy sources to countries in these respec ve regions. Countries part of this project include Democra c Republic of the Congo, Angola, Namibia, Botswana, South Africa, Malawi, Mozambique, Zambia and Zimbabwe will also be brought under this project soon. WAPP encompasses about 3,000 km of 400 kV HVAC lines and is es mated to a ract an investment of about USD 6.5 billion. SAPP is expected to require a capex of USD 5.6 billion.
INDIAN TRANSMISSION AND DISTRIBUTION SECTOR
The power sector in India is among the most important cons tuents of the economy where even small ini a ves lead to appreciable growth. The sector today stands at the cusp of innova on. Besides, integra on with the latest technologies to overcome the geographical divide and distribu on capacity augmenta on will witness an increasing focus on renewable and clean energy.
The transforma on of the power sector in the country has been underlined by several ini a ves and reforms, including the strengthening of grids and their integra on, smart distribu on and connec on of renewable supply to the grids, switching to Extra High Voltage transmission and, in the absence of overhead transmission lines, the usage of gas-insulated lines. Also, innova ve ideas for funding, including infrastructure funds and pension funds, brighten prospects of the sector. These efforts are in consonance with the global focus on construc ng new transmission lines and systems and modernising exis ng infrastructure. Hence, there exists huge untapped investment poten al in the sector where a seamless and constant supply of power is required to fuel holis c growth – industrial, technological and digital.
The country’s power transmission sector has seen robust capacity addi on in 2015-16. As per the CEA, between April–November 2015, at a pan-India level, almost 15,721 ckm of transmission lines were added in the 220 kV voltage level and above as compared to around 18,000 ckm in 2014-15. As on September 2015, total transmission lines added (AC and HVDC) was 329,158 ckm. Moving ahead, the CEA has set a target of 364,921 ckm of new transmission lines for 2016-17.
In India, the transmission network is largely composed of 400-765 kV AC lines while HVDC networks are at 800 kV. However, the transmission sector is witnessing a steady shi towards 1,200 kV AC lines for seamless supply of power over long distances. Even so, the Government’s ‘24x7 Power for All’ vision would lead to investments worth Rs. 2.5 lakh crores over the next few years.
In India, the poten al of the transmission and distribu on sector to grow is immense. According to the CEA, the transmission and distribu on capacity of the country has only increased by 30% in the last five years, considering the increase in genera on capacity by over 50%, represen ng a growing mismatch that needs to be
corrected. The country today has a genera on capacity of over 298,000 MW, an installed transmission capacity of over 340,000 ckm and a sub-sta on transforma on capacity of around 659,000 MVA.
Going forward, the Indian power transmission and distribu on sector is expected to require an investment of Rs. 300,000 crores over the next five years, throwing-up huge opportuni es for frontline players like EMC.
UDAY – THE RAY OF LIGHT TO SEB REFORM
The Central Government has announced reforms targeted at debt-laden state electricity boards under UDAY (Ujwal Discom Assurance Yojna). The scheme intends to achieve four key ini a ves:
• Reduc on in interest cost of distribu on companies (discoms) principally through phased takeover of debt by state governments
• Improving opera onal efficiency of discoms
• Reduc on in the cost of power purchase
• Enforcing financial discipline on discoms through alignment with state finances
Overall, the scheme envisages a significant state government support mainly in the form of takeover of 75% of discom debt by the respec ve state governments and reduc on in interest rates for the balance 25% debt, which may be issued in the form of discom bonds backed by a state government guarantee.
RENEWABLE ENERGY – THE BRIGHT SPOT
Growth of renewable energy has been one of the foremost priori es of the Government’s agenda.
Renewable capacity genera on has been planned to increase to 75 GW by 2022, excluding a substan al solar energy genera on of 100 GW. This has the poten al to add more than 1 million jobs. Besides, the Jawaharlal Nehru Na onal Solar Mission (JNNSM) also envisages grid-connected solar power projects from 20 GW to 100 GW by 2022 with an es mated investment of Rs. 600,000 crores. Currently, the country’s solar power capacity stands at about 5,000 MW and the prospects for the sector are bright, considering that more than 10,000 MW of capacity is set to be installed in 2016-17.
The poten al for harnessing solar energy is rela vely higher than other renewable energy sources. Considering that India is grossly energy-deficit where import stands at around 80% of the country’s fossil fuel and 20% of the coal requirement. Recognising that solar energy is the only form of energy that can be consumed where it is produced, it can make power accessible and take it right to the hinterland.
Interes ngly, the country’s solar energy poten al using only barren land is more than 2,000 GW (the country taps only around 230 GW), more than the total energy produced by the US and China combined!

22
Annual Report 2015-16 Management Discussions & Analysis
Annual global solar installa ons (MW)
Year Capacity2009 7,8002010 18,3002011 28,4002012 30,7002013 39,9002014 45,0002015 56,000
2016 (E) > 68,0002017 (E) > 80,000
Source: IEA
There are several Government ini a ves on the anvil as well. The budgetary alloca on towards schemes in the power sector has been increased by over 50% to Rs 12,200 crores. This includes the implementa on and strengthening of the intra- and inter-state transmission Green Energy Corridors-I project and the integra on of renewable energy to the grid by 2021-22, through the Green Energy Corridors-II project.
Other policy changes which are good for the solar sector to thrive include quick forest, environmental and project clearances, proper land acquisi on compensa on, and easy availability of raw materials.
RAILWAYS – ROLLING IN THE RIGHT DIRECTION
Exci ng mes lie in store for the railways in the near future, thanks to prudent Government ini a ves and the significant expansion, upgrada on and modernisa on of the railways network.
The Railway Budget for 2016-17 has increased the capital outlay to Rs. 1.21 lakh crores. As many as 44 new projects have also been announced in addi on to commissioning of 7-km per day of broad gauge lines (increasing to 19-km per day by 2018-19) and electrifica on of around 20,000 km of railway lines. Other ancillary ini a ves like dynamic pricing (already implemented across select premium trains), focus on port connec vity and allotment me for projects to be reduced to eight months, among others, have given a strong push to the sector. Moreover, the capex outlined between 2016-20 is es mated at Rs. 8.56 trillion, which is 3.5
mes more than the previous five years.
Key highlights of the Railway Budget 2016-17
• Revenue genera on targeted at Rs. 1.84 trillion
• FY17 targeted opera ng ra o of 92%
• Capex pegged at Rs. 1.21 trillion; implementa on through joint ventures with states, new frameworks for PPP, etc
• FY17 targeted commissioning of 2,800 km of track, commissioning broad gauge lines at over 7-km/day
• Award of dedicated freight corridor (DFC) projects worth Rs. 24,000 crores; propose to take-up North-South, East-West and East Coast freight corridors through innova ve financing models
• Life Insurance Corpora on of India (LIC) has agreed to fund Rs.
1.5 lakh crores over the next five years for the construc on of new lines and route electrifica on
The introduc on of the bullet train to be opera onal ini ally in the Mumbai-Ahmedabad sector in associa on with the Government of Japan, tes ng of Spain’s Talgo trains and merging of the Railway Budget with the Union General Budget, among other ini a ves, spell good news for the sector as a whole.
Outlook
The global T&D segment will witness steady growth in the coming years due to higher energy demand. In India, the power T&D segment offers huge opportunity as large scale investments is expected both by the PGCIL and private sector players.
ICRA believes that the UDAY scheme is a significant posi ve for the power sector. The research and ra ng agency es mates that, under the scheme, the aggregate relief to discoms is likely to be around Rs 880 billion per year by 2018-19, which translates into a reduc on in losses by around Rs. 0.95 per unit on an all-India basis. This should enable distribu on u li es to break-even over the next 3-4 years.
Moreover, the budgetary alloca ons towards schemes in power sector are up by over 50% to Rs. 12,200 crores. Further, the Government’s support to discoms and the decision to create 100 smart ci es, the Rajiv Gandhi Grameen Vidyu karan Yojana (RGGVY), Restructured-Accelerated Power Development and Reforms Programme (R-APDRP) and North East India transmission investment would immensely enhance the poten al of the sector.
RISK MANAGEMENT
Risk management is an important aspect of your Company’s business model, enabling it to achieve sustainable growth. The prevalent economic environment, in combina on with significant growth ambi ons of the Company, carries with it an evolving list of risks. The Company counters these risks through adequate control mechanisms that define its risk appe te while at the same
me enabling it to capitalise on the prevalent set of opportuni es.
The Company ac vely deploys a well-defined standard opera ng procedure – from project planning to handover – and adheres to rigorous internal checks and balances with regard to every project. Most of the projects that the Company undertakes are long term and therefore involves a variety of implementa on risks, including construc on delays, delay or disrup on in supply of raw materials, delays in arranging the right of way, managing loca onal issues and availability of cost-effec ve and skilled manpower. Besides, bank guarantee encashment may also impact Company’s reputa on in the long run.
The Company’s business is significantly dependant on the cost-compe ve availability of quality raw materials and fuels for its construc on and development of projects. The principal resources include steel, zinc, aluminum conductors, copper, diesel oil, concrete, cement, ballasts, reinforcement bars, electrodes, nuts and bolts and valves, among others. Prices and supply of these vary on account of demand-supply, compe ve intensity, produc on levels and import du es etc. The Company counters this through engaging in long-term supply contracts, ac ve nego a ons, diversifying its vendor base, etc.

23
Management Discussions & Analysis Annual Report 2015-16
With a view to mi gate receivable and credit risks, while selec ng a project, the Company prefers customers with a good track record and credit history and projects that are supported by reputed financial ins tu ons. In its global por olio, the company prefers to work on projects that are backed by mul lateral funding agencies.
HUMAN RESOURCES
The key to organisa onal growth is employee sa sfac on. Interes ngly, the small kingdom of Bhutan does not follow the tradi onal GDP, but the concept of GNH, or Gross Na onal Happiness. It weighs its prosperity of the country in terms of the happiness of its people! At EMC, we also follow this concept, where the happiness of our employees is sacrosanct.
We at EMC firmly believe in employee empowerment, where we value the diligence and dedica on of our employees and recognise their efforts in driving growth in the Company. The programmes we host for our employees all intend to nurture and develop skills, build their abili es and align their aspira ons to the growth of the Company. Towards this extent, the Company is also focused on building a strong talent pool and a robust leadership hierarchy, leading to opera onal excellence and growth.
In order to develop and inculcate skills among employees in the infrastructure-engineering sector, the Company established the EMC Academy in 2011, with the objec ve of providing thorough theore cal and hands-on training to our employees at all levels, as well as to develop managerial skills in them, through experienced and well-renowned faculty of industry professionals and veteran academicians.
The HR policy of the Company stands tall on four key pillars:
i. Talent a rac on: The Company focuses on talent a rac on and acquisi on to fuel growth. Our holis c recruitment programme ensures that we employ the best professionals and strengthen our posi on as a dominant EPC player in the domes c as well as the global markets.
ii. Talent mo va on: The Company undertakes many ini a ves to mo vate our employee pool and add value to their por olio. Our HR and administra ve teams consist of seasoned industry professionals who constantly mo vate our employees and push them to further their horizons and be er their performance.
iii. Talent cul va on: The EMC Academy plays a vital role in this sphere. It provides a holis c curriculum to our employees at all levels, be it ground staff or supervisory. Our focus on skill development and learning out of the box, including hands-on experience, gives us the edge when it comes to employee growth and reten on.
iv. Talent well-being: Our foremost concern when it comes to our human resource is safety. Our business involves engineering ac vi es at the most advanced levels, some mes in very challenging terrain, thus calling out for safety and security of our employees. We review safety standards regularly and set benchmarks towards the same, to ensure our employees’ well-being at all mes.
ADEQUACY OF INTERNAL CONTROLS
The Company has a proper internal control system and follows relevant procedures towards the same. The efficiency of the internal controls is constantly monitored by the Company. The Company also appoints internal auditors for the purpose of providing the a clear picture to the Audit Commi ee and the Board of Directors in terms of an independent, objec ve and prac cal assurance of the effec veness and adequacy of the Company’s control, governance and risk management. This Commi ee also looks into the correc ve measures adopted by the Company, and the expansion of the processes a er being reviewed by the Company.
CAUTIONARY STATEMENT
Statements made in the Management Discussion and Analysis describing the Company’s objec ves, projec ons, es mates, expecta ons maybe ‘forward-looking statements’ within the meaning of applicable securi es laws and regula ons. However, actual results could differ from those expressed or implied. Important factors that could make a difference to the Company’s opera ons include economic condi ons affec ng demand-supply and price condi ons in the domes c and overseas markets where the Company operates, changes in Government regula ons, tax laws and other statutes and other incidental factors.

Annual Report 2015-16 Directors' Report
24
Dear Members,
The Board of Directors presents the Company’s Annual Report, together with the audited financial statements for the financial year ended March 31, 2016.
FINANCIAL RESULTS
The Company’s performance for the financial year ended 31st March, 2016 as per Standalone Financial Statements is summarized below –
2015-16 `
2014-15 `
INCOME
Income from Opera on 41,21,08,57,804 35,82,67,66,559
Other Income 14,27,81,279 13,76,80,625
41,35,36,39,083 35,96,44,47,185
EXPENDITURE
Manufacturing and Other Expenses 36,90,31,01,111 32,53,40,50,380
Interest 1,85,65,17,732 1,19,64,47,429
Deprecia on 17,55,08,518 16,85,55,606
38,93,51,27,361 33,89,90,53,415
Profit before Excep onal, Extraordinary Items and Taxa on 2,41,85,11,721 2,06,53,93,769
Add/Less: Excep onal / Extraordinary Items - -
Profit before Taxa on from con nuing opera ons 2,41,85,11,721 2,06,53,93,769
Tax Expenses 82,18,03,190 78,31,84,104
Profit a er Taxa on 1,59,67,08,531 1,28,22,09,665
FINANCIALS
The total income of your Company has increased from ` 35,96,44,47,185 to ` 41,35,36,39,083 during the financial year under considera on. The profit before tax (PBT) increased from ` 2,06,53,93,769 to ` 2,41,85,11,721. The profit a er tax for the current year is ` 1,59,67,08,531 as against ` 1,28,22,09,665 in the previous financial year.
AMALGAMATION OF THE COMPANY
Your Board of Directors on March, 31, 2016 has approved a Dra Scheme of Amalgama on of your Company for it to amalgamate, along with Mcnally Bharat Engineering Co. Ltd, Mcnally Sayaji Engineering Limited into Kilburn Engineering Limited. The core objec ve of the merged en ty will be to emerge as a total engineering solu on company with comprehensive construc ve and Resource Management Capability, which will not only improve its Marketability but also lead to mul ple opportunity crea on. The merged en ty will be a conglomerate that will have a robust business poten al which will provide end to end engineering and construc on solu on to its customers across sectors and geographies that individual companies were hitherto unable to.
Each cons tuent of the merged en ty will bring in to the common pool their list of unique clientele. Thus the common pool will be able to compile a combined list of niche customers who can now be approached with huge expanse of service range.
The scheme will facilitate a Crea on of a strong consolidated company which will have synergies like Compe ve edge over compe tors, higher capacity u liza on, engineering excellence, technological e-ups, wider geographical reach to enable faster execu on of projects etc.

Directors' Report Annual Report 2015-16
25
The dra scheme of Amalgama on has received approval from the Compe on Commission of India and is currently awai ng approvals from other regulatory bodies.
DIVIDEND
Your Board has recommended a Dividend of 0.50 Paise per Equity Share (5% per cent) for the financial year 2015-16 to the Equity shareholders of your Company.
TRANSFER TO GENERAL RESERVE
The Company proposes not to transfer any funds out of its total profit for the financial year to the General Reserve.
CONSOLIDATED FINANCIAL STATEMENT
The consolidated financial statement for all the subsidiary companies is enclosed.
CHANGE IN THE NATURE OF BUSINESS, IF ANY
There is no change in the nature of the business of the Company.
GOING CONCERN STATUS
No significant and material orders have been passed by the regulators or courts or tribunals impac ng the going concern status of the Company and its opera on in the future.
DETAILS OF SIGNIFICANT AND MATERIAL ORDERS PASSED BY THE REGULATORS OR COURTS OR TRIBUNALS IMPACTING THE GOING CONCERN STATUS AND COMPANY’S OPERATIONS IN FUTURE
There were no significant and material orders passed by regulators or courts or tribunals impac ng the going concern status and Company's opera ons in future.
MATERIAL CHANGES AND COMMITMENTS, IF ANY, AFFECTING THE FINANCIAL POSITION OF THE COMPANY WHICH HAVE OCCURRED BETWEEN THE END OF THE FINANCIAL YEAR OF THE COMPANY TO WHICH THE FINANCIAL STATEMENTS RELATE AND THE DATE OF THE REPORT
There were no material changes and commitments affec ng the financial posi on of the Company occurring between March 31, 2016 and the date of this Report of the Directors.
SUBSIDIARY / JOINT VENTURES
As on 31st March, 2016, your Company has Fi een subsidiary companies namely EMC Hardware Limited, EMC Solar Limited, EMC Tower Limited, EMC Forging Limited, EMC Logis cs Limited, EMC Academy Limited, EMC Overseas Limited, Quatro Rail Tech Solu ons Limited, Advanced Steel & Crane Inc., Tecnolines SRL, EMC West Asia DMCC, EMC East Asia Limited, Tecnolines Singapore Pte. Limited, EMC Saudi LLC and CE Maschinenbau GmbH (Formerly named as MBE Cologne Engineering GmbH).
A separate sec on on the performance and financial posi on of each of the subsidiaries, associates and joint venture companies in Form AOC-1 is part of the report. It is included in the consolidated financial statement.
SHARE CAPITAL
During the year 2015-16, the Company allo ed 1,00,00,000 equity shares of `10 each pursuant to preferen al allotment. Consequently, the paid up equity share capital of the Company stood at ` 47,00,00,000/- (Rupees Forty Seven Crore only) consis ng of 4,70,00,000 (Four Crore Seventy Lakh) equity shares of ` 10 each.
DEPOSITS
During the year under review the Company has not invited deposit from the public falling within the ambit of Sec on 73 of the Companies Act 2013 and the Companies (Acceptance of Deposits) Rules 2014.
PARTICULARS OF LOANS, GUARANTEES AND INVESTMENTS BY COMPANY
The details of Loans, Guarantees and Investments made under Sec on 186 of the Companies Act, 2013 are provided in the financial statement of the Company.
RELATED PARTY TRANSACTION
All RPTs, including those rela ng to the Company’s overseas direct/indirect subsidiaries, are done on an arm’s length basis and in the ordinary course of business. The Company presents a detailed landscape of all RPTs to the Audit Commi ee, specifying the nature, value and terms and condi ons of the transac on. Apart from the Related Party Transac ons in the ordinary course of business and at arm’s length basis, details of which are given in the notes to the financial statements, there were no other Related Party Transac ons requiring

Annual Report 2015-16 Directors' Report
26
disclosure in the Directors’ Report. Accordingly, the disclosure required u/s 134(3)(h) of the Act in Form AOC-2 is not applicable to the Company.
MEETINGS OF THE BOARD
Minimum four Board mee ngs are held annually. Addi onal Board mee ngs are convened by giving appropriate no ce to address the Company’s specific needs. In case of business exigencies or urgency of ma ers, resolu ons are passed by circula on.
During the financial year, Seven Board Mee ngs were convened and held and the intervening gap between the Mee ngs was within the period prescribed under the Companies Act, 2013.
EXTRACT OF ANNUAL RETURN
The details forming part of the extract of the Annual Return in Form MGT – 9 as required under Sec on 92 of the Companies Act 2013 is included in this Report as Annexure.
DIRECTORS AND KEY MANAGERIAL PERSONNEL
The Board of Directors on the recommenda on of the Nomina on and Remunera on Commi ee has appointed Mr. Biplab Shankar Bose (DIN: 01737400) as an Addi onal Director in the capacity of Whole Time Director, with effect from 4th July, 2016 for a period of two years on and from 4th July, 2016 to 3rd July, 2018, subject to the approval of shareholders and accordingly an ordinary resolu on is included in the No ce of Annual General Mee ng.
The service contracts of Mr. Manoj Toshniwal, Managing Director and Mr. Ramesh Chandra Bardia, Joint Managing Director were for a period of 3 years beginning from 23rd July, 2013 to 24th July, 2016 and 1st September, 2013 to 31st August, 2016 respec vely. The Board of Directors has re-appointed Mr. Manoj Toshniwal as Managing Director and Mr. Ramesh Chandra Bardia as Joint Managing Director for a further period of 3 years beginning from 24th July, 2016 to 23rd July, 2019 and 1st September, 2016 to 31st August, 2019, respec vely, subject to the approval of shareholders and accordingly separate ordinary resolu ons are included in the No ce of Annual General Mee ng for their re-appointment.
Mr. Saubir Bha acharyya resigned from the Board on 26th February, 2016 and Mr. Durga Prasad Sharma resigned from the Board on 30th June, 2016. The Board has placed on record their deep apprecia on for the valuable contribu on made by Mr. Saubir Bha acharyya and Mr. Durga Prasad Sharma during their uns nted tenure of services with the Company.
Mr. Sumit Kumar Surana, has been appointed as the Company Secretary of the Company with effect from 2nd November, 2015 in place of Mr. Chandra Sekhar Adhikary who has resigned as Company Secretary of the Company. The Nomina on and Remunera on Commi ee of the Board has recommended the said appointment to the Board of Directors.
All the Independent Directors have given their declara on of independence as required under Sec on 149(6) of the Companies Act, 2013;
In accordance with the provisions of the Ar cles of Associa on of the Company read with sec on 152 of the Companies Act, 2013, Mr. Manish Agarwal will re re by rota on in the forthcoming Annual General Mee ng and being eligible, offers himself for re-appointment.
The Company has devised a Policy for performance evalua on of Independent Directors, Board Commi ees and other Individual Directors which includes criteria for performance evalua on of the non-execu ve directors and execu ve directors. The Board was of the view that the performance of the Board as a whole was adequate and fulfilled the parameters s pulated in the evalua on framework in its pro growth ac vity. The Board also ensured that commi ees func oned adequately and independently in terms of the requirements of the Companies Act, 2013.
During the year under review your Company appointed the following persons as Key Managerial Person (KMP) –
Sl. No. Name Designa on
1. Mr. Manoj Toshniwal Managing Director
2. Mr. Ramesh Chandra Bardia Joint Managing Director
3. Mr. Arun Kumar Kedia Chief Financial Officer
4. Mr. Sumit Kumar Surana Company Secretary
MEETING OF INDEPENDENT DIRECTORS
A separate mee ng of Independent Directors was held on 31st March, 2016 to evaluate performance of the Chairman of the Board of the Directors and the Board as a whole and the same was found sa sfactory.
WHISTLE BLOWER POLICY
The Company has in place a robust vigil mechanism for repor ng genuine concerns through the Company’s Whistle Blower Policy. All

Directors' Report Annual Report 2015-16
27
Whistle Blower Cases are periodically presented and reported to the Audit Commi ee of the Company. All cases reported as part of whistle blower mechanism are taken to their logical conclusion within a reasonable meframe.
RISK MANAGEMENT
Our Risk Management Framework is designed to help the organiza on meet its objec ves through alignment of opera ng controls with the Company’s mission and vision.
The main objec ve of this policy is to ensure sustainable business growth with stability and to promote a pro-ac ve approach in repor ng, evalua ng and resolving risks associated with the business. In order to achieve the key objec ve, the policy establishes a structured and disciplined approach to Risk Management, in order to guide decisions on risk related issues.
REMUNERATION AND NOMINATION POLICY
The Board of Directors has framed a policy which lays down a framework in rela on to remunera on of Directors, Key Managerial Personnel and Senior Management of the Company. This policy also lays down criteria for selec on and appointment of Board Members.
STATUTORY AUDIT
The Statutory Auditors of the Company, M/s SRB & Associates, Chartered Accountants, hold office ll the conclusion of the ensuing Annual General Mee ng of the Company.
The Board of Directors on the recommenda on of the Audit Commi ee has proposed to re-appoint M/s SRB & Associates, Chartered Accountants, as the Company’s statutory auditors, who shall hold the office from the conclusion of the 60th Annual General Mee ng for a term of five consecu ve years, i.e., un l the conclusion of the 65th Annual General Mee ng (subject to ra fica on by members at every Annual General Mee ng, if required, under the prevailing law at that me). The Company has obtained a wri en consent from them to the effect that their re-appointment, if made, would be in terms of Sec on 139 of the Companies Act, 2013 and Rule 3 and 6 of Companies (Audit and Auditors) Rules, 2014 and that they are not disqualified for re-appointment within the meaning of Sec on 141 of the Companies Act, 2013 and Rule 4 of Companies (Audit and Auditors) Rules, 2014.
M/s. Acharyya Swapan & Co., Chartered Accountants are the Internal Auditors of the Company. They func on independently and submit their report to the Audit Commi ee.
Any query from the Auditors is being dealt with in the Notes to Accounts.
COST AUDIT
As per the requirement of Central Government and pursuant to Sec on 148 of the Companies Act, 2013 read with the Companies (Cost Records and Audit) Rules, 2014 as amended from me to me, the Company has been carrying out audit of cost records every year.
The Board of Directors on the recommenda on of Audit Commi ee has appointed M/s. N. Radhakrishnan & Co., Cost Accountants as Cost Auditors to audit the cost accounts of the Company for the financial year 2016-17. As required under the Companies Act, 2013 a resolu on seeking member’s approval for the remunera on payable to the Cost Auditor forms part of the No ce convening the Annual General Mee ng.
SECRETARIAL AUDIT
Pursuant to the provisions of the Sec on 204 of the Companies Act, 2013 and rules made thereunder, the Company has appointed A.K.Labh & Company, a firm of Company Secretaries in Prac ce (C. P. No. 3238) to undertake the Secretarial Audit of the Company. The Report of the Secretarial Audit for the Financial Year 2015-16 in the Form MR-3 is annexed herewith as ‘Annexure’. The Board has taken note of the observa ons made by the Secretarial Auditor and the same are being complied with.
INTERNAL CONTROL SYSTEMS AND THEIR ADEQUACY
The Board of Directors (Board) has devised systems, policies and procedures / frameworks, which are currently opera onal within the Company for ensuring the orderly and efficient conduct of its business, which includes adherence to Company’s policies, safeguarding assets of the Company, preven on and detec on of frauds and errors, accuracy and completeness of the accoun ng records and mely prepara on of reliable financial informa on. In line with best prac ces, the Audit Commi ee and the Board reviews these internal control systems to ensure they remain effec ve and are achieving their intended purpose. Where weaknesses, if any, are iden fied as a result of the reviews, new/revised standard opera ng procedures are put in place to strengthen controls. These controls are in turn reviewed at regular intervals.
The systems/frameworks include proper delega on of authority, opera ng philosophies, policies and procedures, effec ve IT systems aligned to business requirements, an internal audit framework, an ethics framework, a risk management framework and adequate segrega on of du es to ensure an acceptable level of risk.
The Company’s internal control system is commensurate with its size, scale and complexi es of its opera ons. The internal audit is

Annual Report 2015-16 Directors' Report
28
entrusted to M/s. Acharya Swapan & Co., Chartered Accountants. To enhance internal controls, the internal audit follows a stringent grading mechanism, focusing on the implementa on of recommenda ons of internal auditors. The internal auditors make periodic presenta ons on audit observa ons, including the status of follow-up to the Audit Commi ee.
Based on the informa on provided, nothing has come to the a en on of the Directors to indicate that any material breakdown in the func on of these controls, procedures or systems occurred during the year under review. There have been no significant changes in the Company’s internal financial controls during the year that have materially affected, or are reasonably likely to materially affect its internal financial controls.
There are inherent limita ons to the effec veness of any system of disclosure, controls and procedures, including the possibility of human error and the circumven on or overriding of the controls and procedures. Accordingly, even effec ve disclosure controls and procedures can only provide reasonable assurance of achieving their objec ves. Moreover, in the design and evalua on of the Company’s disclosure controls and procedures, the management was required to apply its judgment in evalua ng the cost-benefit rela onship of possible controls and procedures.
PARTICULARS OF EMPLOYEES
The statement containing employee informa on as required under Sec on 197(12) of the Act, read with Rule 5(2) of the Companies (Appointment and Remunera on of Managerial Personnel) Rules, 2014 forms part of this report. The Reports and Accounts are being sent to members and other en tled thereto, excluding the informa on on employee’s par culars which is available for inspec on by the members at the Registered Office of the Company during business hours on any working day. If any member is interested in obtaining a copy thereof, such member may write to Company Secretary in this regard.
CORPORATE SOCIAL RESPONSIBILITY
As a part of its Corporate Social Responsibility (CSR) your Company has formed a CSR Commi ee who looks into the various avenues according to the CSR Policy framed by the Commi ee wherein the Company can extend its ac vity for the society at large. The following are the members of the CSR Commi ee.
Name of Members Chairman / Member Category
Mr. Suraj Mall Singhi Chairman Independent Director
Mr. Ramesh Chandra Bardia Member Joint Managing Director
Mr. Manish Agarwal Member Non-Execu ve Director
The said Commi ee has been entrusted with the responsibility of formula ng and recommending to the Board, a Corporate Social Responsibility Policy (CSR Policy) indica ng the ac vi es to be undertaken by the Company, monitoring the implementa on of the framework of the CSR Policy and recommending the amount to be spent on CSR ac vi es.
The CSR Commi ee mee ng was held on 30th March, 2016 wherein the Commi ee discussed about CSR Ini a ves which the Company can undertake and the avenues to invest the funds of the Company as prescribed in the Act.
The Rules and regula ons of CSR being implemented recently, your Company would like to submit that it is under process of e-up with various associa ons/ organisa on/trust for pursuing the CSR ac vi es as envisaged in the CSR Policy. The process of iden fying ac vi es and various e ups delayed the CSR spend and hence the Company could not spend the amount of envisaged CSR expenditure. The Company is commi ed to the underlying intent of CSR and is op mis c of mee ng its commitment by spending higher amount in the coming financial year and thereby make a posi ve impact on the society.
DIRECTORS’ RESPONSIBILITY STATEMENT
The Board of Directors acknowledges the responsibility for ensuring compliance with the provisions of sec on 134(3)(c) read with sec on 134(5) of the Companies Act, 2013 in the prepara on of the annual accounts for the year ended on 31st March, 2016 and state that :
i. In the prepara on of the annual accounts, the applicable accoun ng standards have been followed along with proper explana on rela ng to material departures, if any ;
ii. the Directors have selected such accoun ng policies and applied them consistently and made judgments and es mates that are reasonable and prudent so as to give a true and fair view of the state of affairs of the Company at the end of the financial year and of the profit of the Company for that period;
iii. the Directors have taken proper and sufficient care for the maintenance of adequate accoun ng records in accordance with the provisions of this Act for safeguarding the assets of the Company and for preven ng and detec ng fraud and other irregulari es;
iv. the Directors have prepared the annual accounts on a going concern basis;

Directors' Report Annual Report 2015-16
29
v. there is a proper system to ensure compliance with the provisions of all applicable laws and that such systems are adequate and opera ng effec vely.
AUDIT COMMITTEE
Your Company is having an Audit Commi ee comprising of the following Directors –
Sl. No. Name Status Category1. Mr. Suraj Mall Singhi Chairman Non Execu ve & Independent Director2. Ms. Arundhu Dhar Member Non Execu ve & Independent Director3. Mr. Manish Agarwal Member Non Execu ve Director
Four Audit Commi ee Mee ngs were held during the financial year under considera on.
NOMINATION AND REMUNERATION COMMITTEE
Your Company is having a Nomina on and Remunera on Commi ee comprising of the following Directors -
Sl. No. Name Status Category1. Mr. Suraj Mall Singhi Chairman Non Execu ve & Independent Director2. Ms. Arundhu Dhar Member Non Execu ve & Independent Director3. Mr. Manish Agarwal Member Non Execu ve Director
Four Nomina on and Remunera on Commi ee Mee ngs were held during the financial year under considera on.
STAKEHOLDERS RELATIONSHIP COMMITTEE
Your Company is having a Stakeholder Rela onship Commi ee comprising of the following Directors –
Sl. No. Name Status Category1. Mr. Suraj Mall Singhi Chairman Non Execu ve & Independent Director2. Mr. Manoj Toshniwal Member Managing Director3. Mr. Ramesh Chandra Bardia Member Joint Managing Director
Necessary Stakeholder Rela onship Commi ee mee ngs were held during the F.Y 15-16 to approve the necessary transfer of shares.
ENERGY CONSERVATION, TECHNOLOGY ABSORPTION
Energy conserva on con nued to be an area of priority. Con nued efforts on ra onaliza on of demands in manufacturing loca ons and increase in produc on volume resulted in the saving of energy compared to the earlier years. Your Company has used modern technology to install solar power plants and thereby genera ng solar energy.
FOREIGN EXCHANGE EARNINGS AND OUTGO
Your Company has incurred ` 22,149.31 Lacs (previous year ` 22,843.77 Lacs), which includes investments made and advances given to foreign Subsidiaries, tour expenses etc., towards foreign exchange expenditure during the financial year under review and has earned ` 22,202.76 Lacs (previous year ` 22,593.06 Lacs) foreign exchange during the said period.
DISCLOSURES UNDER SEXUAL HARASSMENT OF WOMEN AT WORKPLACE (PREVENTION, PROHIBITION AND REDRESSAL) ACT, 2013
Your Company has endeavored to encourage women professionals by crea ng proper policies to tackle issues rela ng to safe and proper working condi ons, and create and maintain a healthy and conducive work environment that is free from discrimina on. This includes discrimina on on any basis, including gender, as well as any form of sexual harassment. Your Company has an Internal Complaints Commi ee in place in accordance with the requirements under the Sexual Harassment of Women at Workplace (Preven on, Prohibi on and Redressal) Act, 2013 which ensures implementa on and compliance with the Law as well as the policy at every unit and tackle issues rela ng to sexual harassment. The Internal Compliant Commi ee is formed with the following members –
Sl. No. Name Chairperson / Member1. Ms. Yamini More Chairperson2. Ms. Madhumita Bha acharyya Member3. Mr. Swapan Kumar Du a Member4. Mr. Apurva Roy – NGO Representa ve Member
There were no cases/ complaints reported in this regard during the year 2015-16 and no mee ngs were held during the year.

30
Annual Report 2015-16 Directors' Report
30
APPRECIATION
The Directors place on record their sincere apprecia on for the significant contribu on made by employees through their dedica on, hard work and commitment to ensure the Company’s long-term growth and sustainability.
The Board places on record its apprecia on for the support and coopera on your Company has received from its customers, vendors, suppliers, business partners, who are our partners in progress. The Directors acknowledge the support and assistance extended to us by the Government of India, various State Governments and government departments, financial ins tu ons, bankers, shareholders and all other statutory agencies at large and look forward to their support in our future endeavours.
For and on behalf of the Board
Manoj Toshniwal Ramesh Chandra BardiaPlace: Kolkata Managing Director Joint Managing DirectorDated: 31.08.2016 DIN : 00022787 DIN : 00374148

Annexure to the Directors' Report Annual Report 2015-16
3131
SECRETARIAL AUDIT REPORT[Pursuant to Sec on 204(1) of the Companies Act, 2013 and Rule No. 9 of the Companies (Appointment and
Remunera on of Managerial Personnel) Rules, 2014]
ToThe Members,EMC Limited“Constan a Office Complex”South Block, 8th Floor11, Dr. U. N. Brahmachari StreetKolkata - 700 017West Bengal
We have conducted the secretarial audit of the compliance of applicable statutory provisions and the adherence to good corporate prac ces by EMC Limited having its Registered Office at “Constan a Office Complex”, South Block, 8th Floor, 11, Dr. U. N. Brahmachari Street, Kolkata – 700 017, West Bengal (hereina er called the Company). Secretarial Audit was conducted in a manner that provided us a reasonable basis for evalua ng the corporate conducts/statutory compliances and expressing our opinion thereon.
Based on our verifica on of the books, papers, minute books, forms and returns filed and other records maintained by the Company and also the informa on provided by the Company, its officers, agents and authorized representa ves during the conduct of secretarial audit, we hereby report that in our opinion, the Company has, during the audit period covering the financial year ended 31.03.2016 complied with the statutory provisions listed hereunder and also that the Company has proper Board-processes and compliance-mechanism in place to the extent, in the manner and subject to the repor ng made hereina er.
AUDITORS’ RESPONSIBILITY
Maintenance of Secretarial Records is the responsibility of the management of the Company. Our responsibility is to express an opinion on existence of adequate Board process and compliance management system, commensurate to the size of the Company, based on these secretarial records as shown to us during the said audit and also based on the informa on furnished to us by the officers’ and the agents of the Company during the said audit.
We have followed the audit prac ces and processes as were appropriate to the best of our understanding to obtain reasonable assurance about the correctness of the contents of the secretarial records. The verifica on was done on test basis to ensure that correct facts are reflected in secretarial records. We believe that the processes and prac ces, we followed, provide a reasonable basis for our opinion.
We have not verified the correctness, appropriateness and basis of financial records, books of accounts and decisions taken by the Board and by various commi ees of the Company during the period under scru ny. We have checked the Board process and compliance management system to understand and to form an opinion as to whether there is an adequate system of seeking approval of respec ve commi ees of the Board, of the Board, of the members of the Company and of other authori es as per the provisions of various statutes as men oned hereina er.
Wherever required we have obtained the management representa on about the compliance of the laws, rules and regula ons and happening of events, etc.
The Compliance of the provisions of Corporate and other applicable laws, rules, regula ons and standards is the responsibility of the management. Our examina on was limited to the verifica on of compliance procedures on test basis.
Our report is neither an assurance as to the future viability of the Company nor of the efficacy or effec veness or accuracy with which the management has conducted the affairs of the Company.
We report that, we have examined the books, papers, minute books, forms and returns filed and other records maintained by the Company for the financial year ended 31.03.2016 according to the provisions of:
(i) The Companies Act, 2013 (the Act) and the rules made there under;
(ii) Secretarial Standards (SS – 1and SS-2) as issued by The Ins tute of Company Secretaries of India and which became effec ve from 01.07.2015.

32
Annual Report 2015-16 Annexure to the Directors' Report
32
(iii) The Depositories Act, 1996 and the Regula ons and Bye-laws framed there under;
(iv) Foreign Exchange Management Act, 1999 and the rules and regula on made there under to the extent of Foreign Direct Investment, Overseas Direct Investment and External Commercial Borrowings;
Further, to the best of our knowledge and understanding there are adequate systems and processes in the Company commensurate with its size and opera on to monitor and ensure compliances with applicable laws including general laws, labour laws, compe on law, environments laws, etc.
During the period under review the Company in general has complied with the provisions of the Act, Rules, Regula ons, Guidelines, Standards, etc. as men oned above, except that :
(a) the Company has not made the requisite expenditure towards the Corporate Social Responsibility (CSR) in terms of Sec on 135 of the Companies Act, 2013;
(b) the resolu on for the appointment of Company Secretary was not in terms with the provisions of Sec on 179(3) of the Companies Act, 2013;
(c) resolu on for making inter-corporate investment was not filed with the office of the Registrar of Companies.
The shares of the Company are not listed with any stock exchange.
We further report that :
(a) The Board of Directors of the Company is duly cons tuted with proper balance of Execu ve Directors, Non-Execu ve Directors and Independent Directors. The changes in the composi on of the Board of Directors that took place during the period under review were carried out in compliance with the provisions of the Act.
(b) Adequate no ce is given to all directors to schedule the Board Mee ngs, agenda and detailed notes on agenda were sent atleast seven days in advance, and a system exists for seeking and obtaining further informa on and clarifica ons on the agenda items before the mee ng and for meaningful par cipa on at the mee ng.
(c) Majority decision is carried through while the dissen ng members’ views are captured and recorded as part of the minutes.
(d) There are adequate systems and processes in the company commensurate with the size and opera ons of the company to monitor and ensure compliance with applicable laws, rules, regula ons and guidelines.
We further report that :
(a) issued 1,00,00,000 Equity Shares of ` 125 each (Including Premium of ` 115 Per Share) on preferen al basis on 25.05.2015;
(b) the Company has invested in EMC Saudi LLC and EMC MBE Contrac ng Co. LLC during the period under report.
For A. K. LABH & CO.Company Secretaries
CS A. K. LABHPlace : Kolkata Prac cing Company SecretaryDated : 31-08-2016 FCS – 4848 / CP No.- 3238
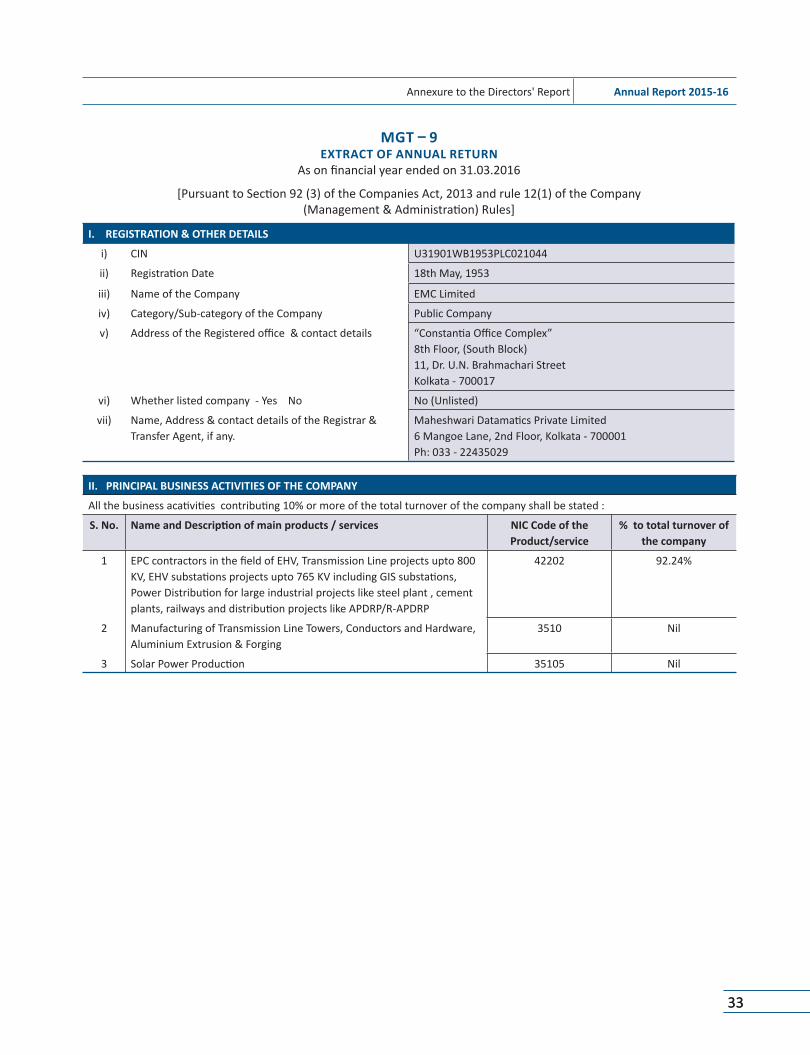
Annexure to the Directors' Report Annual Report 2015-16
3333
MGT 9EXTRACT OF ANNUAL RETURN
As on financial year ended on 31.03.2016
[Pursuant to Sec on 92 (3) of the Companies Act, 2013 and rule 12(1) of the Company(Management & Administra on) Rules]
I. REGISTRATION & OTHER DETAILS
i) CIN U31901WB1953PLC021044
ii) Registra on Date 18th May, 1953
iii) Name of the Company EMC Limited
iv) Category/Sub-category of the Company Public Company
v) Address of the Registered office & contact details “Constan a Office Complex”8th Floor, (South Block)11, Dr. U.N. Brahmachari StreetKolkata - 700017
vi) Whether listed company - Yes No No (Unlisted)
vii) Name, Address & contact details of the Registrar & Transfer Agent, if any.
Maheshwari Datama cs Private Limited6 Mangoe Lane, 2nd Floor, Kolkata - 700001Ph: 033 - 22435029
II. PRINCIPAL BUSINESS ACTIVITIES OF THE COMPANY
All the business aca vi es contribu ng 10% or more of the total turnover of the company shall be stated :
S. No. Name and Descrip on of main products / services NIC Code of the Product/service
% to total turnover of the company
1 EPC contractors in the field of EHV, Transmission Line projects upto 800KV, EHV substa ons projects upto 765 KV including GIS substa ons, Power Distribu on for large industrial projects like steel plant , cementplants, railways and distribu on projects like APDRP/R-APDRP
42202 92.24%
2 Manufacturing of Transmission Line Towers, Conductors and Hardware,Aluminium Extrusion & Forging
3510 Nil
3 Solar Power Produc on 35105 Nil

Annual Report 2015-16 Annexure to the Directors' Report
34
III. PARTICULARS OF HOLDING, SUBSIDIARY COMPANIESSl.
No.Name and Address of the Company
CIN/GLN Holding/
Subsidiary/Associate
% of shares held
ApplicableSec on
1 EMC Solar Limited51, Canal East Road, Kolkata - 700085
U40108WB2010PLC149583 Subsidiary 100% 2 (87)
2 EMC Tower Limited51, Canal East Road, Kolkata - 700085
U40107WB2010PLC149842 Subsidiary 100% 2 (87)
3 EMC Forging Limited51, Canal East Road, Kolkata - 700085
U40102WB2010PLC149843 Subsidiary 100% 2 (87)
4 EMC Logis cs Limited51, Canal East Road, Kolkata - 700085
U60230WB2010PLC150647 Subsidiary 100% 2 (87)
5 EMC Academy Limited51, Canal East Road, Kolkata - 700085
U80221WB2010PLC151754 Subsidiary 100% 2 (87)
6 EMC Overseas Limited51, Canal East Road, Kolkata - 700085
U40102WB2011PLC162101 Subsidiary 100% 2 (87)
7 EMC Hardware Limited51, Canal East Road, Kolkata - 700085
U24299WB1982PLC183166 Subsidiary 100% 2 (87)
8 Advanced Steel & Crane Inc.P.O. Box- 9187, Tulsa, OK 74132United States
- Subsidiary 100% 2 (87)
9 Tecnolines S.R.L Strada Pizzolese n. 46/A- I- 43100, Parma, Italy
02507970347 Subsidiary 70% 2 (87)
10 EMC West Asia DMCCUnit No. 2109, Jumeirah Bay Tower, Plot No. X2, Jumeirah Lakes Towers, Dubai, U.A.E.
JLT5180 Subsidiary 100% 2 (87)
11 Quatro Rail Tech Solu ons Ltd.756, (1st Floor), 80 Feet Road, 4th Block, Koramangala, Bangalore, Karnataka - 560034
U74900KA2012PTC064625 Subsidiary 60% 2 (87)
12 EMC East Asia Limited18th Floor, Unit 1803, Lemmi Centre50 Hoi Yuen Road, Kwun Tong,Kowloon, HongKong
62649163-000-01-14-7 Subsidiary 100% 2 (87)
13 Tecnolines Singapore Pte. Limited3, Philip Street, 17-01, Royal Group BuildingSingapore - 048693
204402856R Subsidiary 100% 2 (87)
14 CE Maschinenbau GmbH (Formerly named as MBE Cologne Engineering GmbH)Dillenburger Str. 63, 51105 Cologne , Germany
- Subsidiary 90% 2 (87)
15 EMC Saudi LLCRiyadh
1010441917 Subsidiary 60% 2 (87)

Annexure to the Directors' Report Annual Report 2015-16
35
IV. SHAREHOLDING PATTERN (Equity Share Capital Breakup as percentage of Total Equity)
i) Category-wise ShareholdingCategory of Shareholders No.of Shares held at the beginning of the year No.of Shares held at the end of the year % Change
duringthe year
Demat Physical Total % of TotalShare
Demat Physical Total % of TotalShares
A Promoters
(1) Indian
(a) Individual/HUF 12754300 0 12754300 34.4711 11954300 0 11954300 25.4347 9.0364(b) Central Government 0 0 0 0 0 0 0 0 0(c) State Government 0 0 0 0 0 0 0 0 0(d) Bodies Corporate 24161206 14 24161220 65.3006 34161520 0 34161520 72.6841 -7.3835(e) Banks/Fin.Ins tu on 0 0 0 0 0 0 0 0 0(f) Any Other 0 0 0 0 0 0 0 0 0 Sub-total (A)(1) : 36915506 14 36915520 99.7717 46115820 0 46115820 98.1188 1.6529
(2) Foreign
(a) NRIs - Individuals 0 0 0 0 0 0 0 0 0(b) Other - Individuals 0 0 0 0 0 0 0 0 0(c) Bodies Corporate 0 0 0 0 0 0 0 0 0(d) Banks/Fin.Ins tu on 0 0 0 0 0 0 0 0 0(e) Any Other 0 0 0 0 0 0 0 0 0
Sub-total (A)(2) : 0 0 0 0 0 0 0 0 0Total Shareholding of Promoter (A)= (A)(1)+(A)(2)
36915506 14 36915520 99.7717 46115820 0 46115820 98.1188 1.6529
B Public Shareholding
(1) Ins tu ons
(a) Mutual Funds 0 0 0 0 0 0 0 0 0
(b) Banks/Fin.Ins tu on 0 50 50 0.0001 0 50 50 0.0001 0
(c) Central Government 0 0 0 0 0 0 0 0 0
(d) State Govrnments 0 0 0 0 0 0 0 0 0
(e) Venture Capital Funds
0 0 0 0 0 0 0 0 0
(f) Insurance Companies 0 0 0 0 0 0 0 0 0
(g) FIIs 0 0 0 0 0 0 0 0
(h) Foreign Venture 0 0 0 0 0 0 0 0 0
Funds 0 0 0 0 0 0 0 0 0
(i) Others (Specify) 0 0 0 0 0 0 0 0 0
Sub-total (B)(1) : 0 50 50 0.0001 0 50 50 0.0001 0
(2) Non-Ins tu ons
(a) Bodies Corporate 1951 3250 5201 0.0141 1951 3250 5201 0.0111 0.003
(i) Indian 0 0 0 0 0 0 0 0 0
(ii) Overseas 0 0 0 0 0 0 0 0 0

Annual Report 2015-16 Annexure to the Directors' Report
36
(ii) Shareholding of PromotersSl.
No.Shareholder's Name Shareholding at the beginning of the
yearShareholding at the end of the year % change
in share-holding
during the year
No.ofShares
% of totalShares of
the company
% of SharesPledged /
encumberredto total shares
No.ofShares
% of totalShares of
the company
% of SharesPledged /
encumberredto total shares
1 Mr. Sunder Lal Dugar 199020 0.5379 0 199020 0.4234 0 0.11452 Mr. Manoj Toshniwal 1035683 2.7991 0 1035683 2.2036 0 0.59553 Mr. Ramesh Chandra Bardia 1909089 5.1597 0 1109089 2.3598 0 2.79994 Mr. Vinod Dugar 4318624 11.6720 0 4318624 9.1886 0 2.48345 Smt. Sheetal Dugar 4429145 11.9707 0 4429145 9.4237 0 2.5476 Smt. Kusum Devi Dugar 45962 0.1242 0 45962 0.0978 0 0.02647 Mr. Shree Kumar Toshniwal 532159 1.4383 0 532159 1.1323 0 0.3068 Smt. Sunita Bardia 284618 0.7692 0 284618 0.6056 0 0.16369 YMS Finance Private Limited 6040001 16.3243 0 6040001 12.8511 0 3.4732
10 Trinetra Electronics Limited 2448528 6.6176 0 2448528 5.2096 0 1.40811 Sharada Commerce Private Limited 1100000 2.973 0 1100000 2.3404 0 0.632612 Tamkore Investment Private Limited 2400000 6.4865 0 2400000 5.1064 0 1.380113 Subhas Impex Private Limited 3453252 9.3331 0 3453252 7.3473 0 1.985814 Statefield Trade Link Private Limited 1869425 5.0525 0 1869425 3.9775 0 1.07515 Metalind Private Limited 2850000 7.7027 0 2850000 6.0638 0 1.638916 MKN Investment Private Limited 4000014 10.8109 0 14000314 29.7879 0 -18.977
Total : 36915520 99.7717 0 46115820 98.1188 0 1.6529
Category of Shareholders No.of Shares held at the beginning of the year No.of Shares held at the end of the year % Changeduring
the yearDemat Physical Total % of Total
ShareDemat Physical Total % of Total
Shares(i) Individual
shareholders holding nominal sharecapital upto Rs.2 lakh
21947 57282 79229 0.2141 22057 56872 78929 0.1679 0.0462
(c) Others (Specify) 0 0 0 0 0 0 0 0 0
Sub-total (B)(2) : 23898 60532 84430 0.2282 824008 60122 884130 1.8811 -1.6529
Total PublicShareholding(B)=(B)(1)+(B)(2)
23898 60582 84480 0.2283 824008 60172 884180 1.8812 -1.6529
C Shares held by custodian for GDRs & ADRs
0 0 0 0 0 0 0 0 0
Grand Total (A+B+C) 36939404 60596 37000000 100 46939828 0 47000000 100 0

Annexure to the Directors' Report Annual Report 2015-16
37
(iv) Shareholding Pa ern of top ten Shareholders (other than Directors, Promoters and Holders of GDRs and ADRs):
Sl. No.
For Each of Top 10 Shareholders at the beginning of the year Date wise Increase/Decrease in Shareholding during the year specifying the reasons for increase/decrease e.g. allotment/transfer/bonus/sweat equity etc.):
Shareholding at the beginning of the year
Cumula ve Shareholding during the year
No. of Shares % of total Shares of the Company
No. of Shares % of total Shares of the Company
1 Shri Parasram Securi es Pvt. Ltd.At the beginning of the year 2950 0.0063 2950 0.0063At the end of the year 2950 0.0063
2 Pinakin Chimanlal ShahAt the beginning of the year 2750 0.0059 2750 0.0059At the end of the year 2750 0.0059
3 Dr. Ramsudhi GangulyAt the beginning of the year 1450 0.0031 1450 0.0031At the end of the year 1450 0.0031
4 Rajni Kan lal SanghviAt the beginning of the year 1150 0.0024 1150 0.0024At the end of the year 1150 0.0024
5 Prem BawariAt the beginning of the year 1000 0.0021 1000 0.0021At the end of the year 1000 0.0021
6 Dinesh Vrijlal LakhaniAt the beginning of the year 1000 0.0021 1000 0.0021At the end of the year 1000 0.0021
7 Shah Paresh ChimanlalAt the beginning of the year 900 0.0019 900 0.0019At the end of the year 900 0.0019
8 Mrs. Pushpa GoenkaAt the beginning of the year 900 0.0019 900 0.0019At the end of the year 900 0.0019
9 Shri Parasram Holdings Pvt. Ltd.At the beginning of the year 800 0.0017 800 0.0017At the end of the year 800 0.0017
10 Mrs. Maneckbai Kooverji GamadiaAt the beginning of the year 700 0.0015 700 0.0015At the end of the year 700 0.0015
(iii) Change in Promoters' Shareholding
Sl.No.
Name of the Promoter Shareholding at thebeginning of the year
Cumula ve Shareholdingduring the year
No.of Shares
% of total Shares of the Company
No.of Shares
% of total Shares of the Company
1 Mr. Ramesh Chandra BardiaAt the beginning of the year 1909089 5.1597 1909089 5.1597Transfer of 8,00,000 shares to Mr. Siddhartha Bardia 800000 1.7021 1109089 2.3598At the end of the Year 1109089 2.3598
2 MKN Investment Private LimitedAt the beginning of the year 4000014 10.8109 4000014 10.8109Increase during the year 10000300 21.2772 14000314 29.7879At the end of the Year 14000314 29.7879

Annual Report 2015-16 Annexure to the Directors' Report
38
(v) Shareholding of Directors and Key Managerial Personnel :Sl.
No.For Each of the Directors and KMP at the beginning of the year Date wise Increase/Decrease in Shareholding during the year specifying the reasons for increase/decrease e.g. allotment/transfer/bonus/sweat equity etc.):
Shareholding at the beginning of the year
Cumula ve Shareholding during the year
No. of Shares % of totalShares of the
Company
No. of Shares % of totalShares of the
Company1 Mr. Manoj Toshniwal
At the beginning of the year 1035683 2.7991 1035683 2.7991At the end of the Year 1035683 2.2036
2 Mr. Ramesh Chandra BardiaAt the beginning of the year 1909089 5.1597 1909089 5.1597Decrease during the year 800000 1.7021 1109089 2.3598At the end of the Year 1109089 2.3598
V. INDEBTEDNESS Secured Loans
Excluding DepositsUnsecured Loans Deposits Total Indebtedness
Indebtedness at the Beginning of the financial yeari) Principal Amount 56,63,19,092 2,58,60,00,000 - 3,15,23,19,092 ii) Interest due but not paid 94,93,271 1,37,11,607 - 2,32,04,878 iii) Interest Accrued but not due - - - Total : (I + ii + iii) 57,58,12,363 2,59,97,11,607 - 3,17,55,23,970 * Addi on 22,09,89,760 2,56,09,23,720 - 2,78,19,13,480 * Reduc on 20,45,22,471 49,97,11,607 - 70,42,34,078 Net Change 1,64,67,289 2,06,12,12,113 - 2,07,76,79,402 Indebtedness at the end of the financial yeari) Principal Amount 58,84,17,770 4,57,60,00,000 - 5,16,44,17,770 ii) Interest due but not paid 38,61,882 8,49,23,720 - 8,87,85,602 iii) Interest Accrued but not due - - Total : (I + ii + iii) 59,22,79,652 4,66,09,23,720 - 5,25,32,03,372

Annexure to the Directors' Report Annual Report 2015-16
39
B. Remunera on to other Directors Sl.
No.Par culars of Remunera on Name of Direc ors Total Amount
Mr. Suraj Mall Singhi
Mr. Saubir Bha acharyya
Ms. Arundhu Du a
Mr. Manish Agarwal
1 Independent Directors- Fee for a ending board commi ee mee ngs
1,05,000.00 70,000.00 85,000.00 70,000.00 3,30,000.00
- Commission - - - - - - Others, please specify - - - - - Total (1) 1,05,000.00 70,000.00 85,000.00 70,000.00 3,30,000.00
2 Other Non-Execu ve Directors- Fee for a nding board commi ee mee ngs
- - - - -
- Commission - - - - - - Others, please specify - - - - - Total (2) - - - - - Total (B) = (1 + 2) 1,05,000.00 70,000.00 85,000.00 70,000.00 3,30,000.00 Total Managerial Remunera on 2,82,93,000.00 Ceiling as per the Act 1% of Net ProfitOverall Ceiling as per the Act 11% of Net Profit
VI. REMUNERATION OF DIRECTORS AND KEY MANAGERIAL PERSONNEL
A. Remunera on to Managing Director, Whole- me Directors and/or Manager:Sl.
No.Par culars of Remunera on Name of MD/WTD/Manager Total Amount
Mr. Manoj Toshniwal
Mr. Ramesh Chandra Bardia
Mr. Durga Prasad Sharma
1 Gross salary(a) Salary as per provisions contained in sec on 17(1) of the Income Tax Act, 1961
1,18,80,000.00 1,18,80,000.00 42,03,000.00 2,79,63,000.00
(b) Value of perquisites u/s 17(2) Income Tax Act, 1961
- - - -
(c) Profits in lieu of salary under sec on 17(3) Income-tax Act, 1961
- - - -
2 Stock Op on - - - - 3 Sweat Equity - - - - 4 Commission
- as % of profit - - - - - others, specify - - - -
5 Others, specify - - - -TOTAL (A) 1,18,80,000.00 1,18,80,000.00 42,03,000.00 2,79,63,000.00 Ceiling as per the Act 10% of Net Profit

Annual Report 2015-16 Annexure to the Directors' Report
40
C. Remunera on to Key Managerial Personnel other than MD/Manager/WTDSl.
No.Par culars of Remunera on Key Managerial Personnel Total Amount
CFO CS1 Gross salary
(a) Salary as per provisions contained in sec on 17(1) of the Income Tax Act, 1961
58,73,766.00 11,43,699.00 - 70,17,465.00
(b) Value of perquisites u/s 17(2) Income Tax Act, 1961 - - - - (c) Profits in lieu of salary under sec on 17(3) Income-tax Act, 1961 - - - -
2 Stock Op on - - - - 3 Sweat Equity - - - - 4 Commission
- as % of profit - - - - - others, specify - - - -
5 Others, please specify - - - - Total 58,73,766.00 11,43,699.00 - 70,17,465.00
VI. PENALTIES / PUNISHMENT / COMPOUNDING OF OFFENCES
Type Sec on of theCompanies Act
Brief Descrip on Details of Penalty/
Punishment /Compoundingfees imposed
Authority [RD /NCLT/
COURT
Appeal madeif any give
details)
A. COMPANY
PenaltyPunishmentCompounding
B. DIRECTORS
PenaltyPunishmentCompounding
C. OTHER OFFICERS IN DEFAULT
PenaltyPunishmentCompounding
NIL

41
Annual Report 2015-16
StandaloneFinancialStatements
Table of contents:Independent Auditor's Report 42-47Balance Sheet 48Statement of Profit & Loss 49Cash Flow Statement 50Notes on standalone financial statements 51-63Significant Accoun ng Policies 64-66

Annual Report 2015-16 Independent Auditor's Report
42
To the members of EMC LIMITED
REPORT ON THE FINANCIAL STATEMENTS
We have audited the accompanying standalone financial statements of EMC Limited (the ‘’Company’’), which comprise the Balance Sheet as at March 31, 2016, the statement of Profit and Loss and the Cash Flow statement for the year then ended, and a summary of significant accoun ng policies and other explanatory informa on.
MANAGEMENT’S RESPONSIBILITY FOR THE FINANCIAL STATEMENTS
The Company’s Board of Directors is responsible for the ma ers stated in sec on 134(5) of the Companies Act, 2013 (‘’the Act’’) with respect to the prepara on and presenta on of these standalone financial statements that give a true and fair view of the financial posi on, financial performance and cash flows of the Company in accordance with the accoun ng principles generally accepted in India, including the Accoun ng Standards specified under Sec on 133 of the Act, read with rule 7 of the Companies (Accounts) Rules, 2014. This responsibility also includes maintenance of adequate accoun ng records in accordance with the provisions of the Act for safeguarding the assets of the Company and for preven ng and detec ng frauds and other irregulari es, selec on and applica on of appropriate accoun ng policies, making judgments and es mates that are reasonable and prudent and design, implementa on and maintenance of adequate internal financial controls, that were opera ng effec vely for ensuring the accuracy and completeness of the accoun ng records, relevant to the prepara on and presenta on of the financial statements that give a true and fair view and are free from material misstatement, whether due to fraud or error.
AUDITOR’S RESPONSIBILITY
Our responsibility is to express an opinion on these standalone financial statements based on our audit.
We have taken into account the provisions of the Act, the accoun ng and audi ng standards and ma ers that are required to be included in the audit report under the provisions of the Act and the Rules made there under.
We conducted our audit in accordance with the standards on audi ng specified under sec on 143 (10) of the Act, those standards require that we comply with ethical requirements and plan and perform the audit to obtain reasonable assurance about whether the financial statements are free from material misstatement.
An audit involves performing procedures to obtain audit evidence about the amounts and the disclosures in the financial statements. The procedures selected depend on the auditor’s judgment, including the assessment of the risks of material misstatement of the financial statements, whether due to fraud or error. In making those risk assessments, the auditor considers internal financial control relevant to the Company’s prepara on of the financial statements that give a true and fair view in order to design audit procedures that are appropriate in the circumstances. An audit also includes evalua ng the appropriateness of the accoun ng policies used and the reasonableness of the accoun ng es mates made by the Company’s Directors, as well as evalua ng the overall presenta on of the financial statements.
We believe that the audit evidence we have obtained is sufficient and appropriate to provide a basis for our audit opinion on the financial statements.
OPINION
In our opinion, and to the best of our informa on and according to the explana ons given to us, the aforesaid financial statements give the informa on required by the Act in the manner so required and give a true and fair view in conformity with the accoun ng principles generally accepted in India, of the state of affairs of the Company as at March 31, 2016, and its profits and its cash flows for the year ended on that date.
REPORT ON OTHER LEGAL AND REGULATORY REQUIREMENTS
1. As required by the Companies (Auditor’s Report) Order, 2016 (‘’the Order’’) issued by the Central Government of India in terms of sub-sec on (11) of sec on 143 of the Companies Act, 2013, we give in the ‘Annexure A’; a statement on the ma ers specified in the paragraph 3 and 4 of the said order, to the extent applicable.
2. As required by Sec on 143 (3) of the Act, we report that:
a. We have sought and obtained all the informa on and explana ons, which to the best of our knowledge and belief were necessary for the purposes of our audit.
b. In our opinion, proper books of account as required by law have been kept by the Company so far as it appears from our examina on of those books.
c. The Balance Sheet, the Statement of Profit and Loss and the Cash Flow statement dealt with by this report are in agreement with the books of account.

Independent Auditor's Report Annual Report 2015-16
43
d. In our opinion, the aforesaid standalone financial statements comply with the accoun ng standards specified under sec on 133 of the Act, read with rule 7 of the Companies (Accounts) Rules, 2014
e. On the basis of the wri en representa ons received from the Directors as on 31st March 2016, taken on record by the Board of Directors, none of the Directors are disqualified as on 31st March 2016 from being appointed as a Director in terms of sec on 164 (2) of the Act.
f. With respect to the adequacy of the internal financial controls over financial repor ng of the Company and the opera ng effec veness of such controls, refer to our separate Report in ‘Annexure B’;
g. With respect to the other ma ers to be included in the Auditor’s Report in accordance with rule 11 of the companies (Audit and Auditors) Rules, 2014, in our opinion and to the best of our informa on and according to the explana ons given to us:
i. The Company has disclosed the impact of pending li ga ons on its financial posi on in its financial statements (refer addi onal note-29 to the standalone financial statements).
ii. The Company has made provision, as required under the applicable law or accoun ng standard, for material foreseeable losses, if any on long-term contracts including deriva ve contracts.
iii. There has been no delay in transferring amounts, required to be transferred, to the Investor Educa on and Protec on Fund by the Company.
For SRB & ASSOCIATESChartered Accountants
Firm Registra on: No-310009E
Sanjeet PatraKolkata Partner31st August 2016 Membership No: 056121

Annual Report 2015-16 Annexure - A to the Independent Auditor's Report
44
(Referred to in paragraph 1 under ‘Report on Other Legal and Regulatory Requirements’ sec on of our report of even date)
The Annexure referred to in our Independent Auditor’s Report to the members of EMC Limited (the Company) on the standalone financial statements for the year ended March 31, 2016, we report that:
(i) (a) The Company has maintained proper records showing full par culars, including quan ta ve details and situa on of fixed assets.
(b) The Company has a regular programme of physical verifica on of its fixed assets, by which all fixed assets are verified in a phased manner over a period of two years. In our opinion, this periodicity of physical verifica on is reasonable having regard to the size of the Company and the nature of its assets. Pursuant to such program, a por on of fixed asset has been physically verified by the management during the year and no material discrepancies were no ced on such verifica on.
(c) In our opinion and according to the informa on and explana ons given to us, the tle deeds of immovable proper es are held in the name of the Company.
(ii) (a) The inventory has been physically verified by the management during the year. In our opinion, the frequency of such verifica on is reasonable.
(b) The discrepancies no ced on the aforesaid verifica on between the physical stocks and book records were not material.
(iii) (a) According to the informa on and explana ons given to us, the terms and condi ons in respect of the loans granted by the Company (secured/ unsecured loans) to companies/ firms/ limited liability partnerships or other par es covered in the register maintained under sec on 189 of the Act are not prima-facie prejudicial to the interest of the Company.
(b) In respect of the aforesaid loans, the par es are repaying the principal amounts as s pulated and are also regular in payment of interest, where applicable.
(c) In respect of the aforesaid loans, there is no overdue amount for a period exceeding 90 days.
(iv) In our opinion and according to the informa on and explana ons given to us, the Company has complied with the provisions of sec on 185 and 186 of the Act in respect of grant of loans, making investments and providing guarantees and securi es, as applicable.
(v) In our opinion and according to the informa on and explana ons given to us, the Company has not accepted any deposits and accordingly paragraph 3 (v) of the Order is not applicable.
(vi) We have broadly reviewed the books of account maintained by the Company pursuant to the rules prescribed by the Central Government for maintenance of cost records under sub-sec on (1) of sec on 148 of the Act and are of the opinion that, prima facie, the prescribed accounts and records have been made and maintained. However, we have not made a detailed examina on of the records.
(vii) (a) According to the informa on and explana ons given to us and on the basis of our examina on of the records of the Company, amounts deducted/accrued in the books of account in respect of undisputed statutory dues including provident fund, employees’ state insurance, income-tax, sales tax, service tax, duty of customs, duty of excise, value added tax, cess and other material statutory dues have been generally regularly deposited during the year by the Company with the appropriate authori es.
(b) According to the informa on and explana ons given to us, the following dues of sales tax, service tax & duty of excise have not been deposited by the Company on account of disputes:
Sl. No.
Name of the Statute Nature of the Dues
Year since pending
Forum where Disputes is pending Amount involved
1. Central Excise Act, 1944
Service Tax 2007-08 The CESTAT (Chennai) 26.012008-09 The CESTAT (Delhi) 4.442007-08 The CESTAT(Kolkata) 302.63
2. Central Sales Tax Act, 1956 & Sales Tax Act of Various States
Sales Tax/VAT and Entry Tax
2010-11 The Sales Tax Appeal, Revisional Board(WB) 108.342011-12 The Add. Commissioner Sales Tax Appeal(AP) 122.822011-12 The Sales Tax Appeal, Revisional Board(WB) 24.562012-13 The Add. Commissioner Sales Tax Appeal(MP) 378.942012-13 The Add. Commissioner Sales Tax Appeal(WB) 348.862012-13 The Sales Tax Appeal, Tribunal(Rajasthan) 51.392012-13 The Dy. Commissioner, Sales Tax Appeal(TN) 63.902013-14 The Add. Commissioner, Sales Tax Appeal(MP) 340.95

Annexure - A to the Independent Auditor's Report Annual Report 2015-16
45
(viii) In our opinion and according to the informa on and explana ons given to us, the Company has not defaulted in repayment of dues to any financial ins tu ons, bankers and government or debenture holders during the year.
(ix) In our opinion and according to the informa on and explana ons given to us, the term loans taken by the Company have been applied for the purpose for which they were raised. The Company has not raised any moneys by way of ini al public offer or further public offer (including debt instruments) during the year.
(x) According to the informa on and explana ons given to us, no fraud by the Company or on by its officers or employees has been no ced or reported during the course of our audit.
(xi) According to the informa on and explana ons given to us, managerial remunera on has been paid or provided in accordance with the requisite approvals mandated by the provisions of sec on 197 read with schedule V to the Companies Act.
(xii) In our opinion and according to the informa on and explana ons given to us, the Company is not a Nidhi Company. Accordingly, paragraph (xii) of the Order is not applicable.
(xiii) According to the informa on and explana ons given to us and based on our examina on of the records of the Company, transac ons with the related par es are in compliance with sec on 188 of the Companies Act, 2013 and the details of such transac ons have been disclosed in the financial statements of the Company as required by the applicable accoun ng standards.
(xiv) According to the informa on and explana ons given to us and based on our examina on of the records of the Company, the Company has made preferen al allotment of fully paid-up equity shares during the year under review in compliance with the requirements of Sec on 42 and 62 of the Companies Act and the amount so raised have been used for the purposes for which the funds were raised.
(xv) The Company has not entered into any non-cash transac ons with its directors or persons connected with him. Accordingly, the provisions of clause 3(xv) of the Order are not applicable to the Company.
(xvi) The Company is not required to be registered under sec on 45-IA of the Reserve Bank of India Act, 1934. Accordingly, the provisions of clause 3(xvi) of the order are not applicable to the Company.
For SRB & ASSOCIATESChartered Accountants
Firm Registra on: No-310009E
Sanjeet PatraKolkata Partner31st August 2016 Membership No: 056121

Annual Report 2015-16 Annexure - B to the Independent Auditor's Report
46
(Referred to in paragraph 2 (f) under ‘Report on Other Legal and Regulatory Requirements’ sec on of our report of even date)
REPORT ON THE INTERNAL FINANCIAL CONTROLS UNDER CLAUSE (I) OF SUB-SECTION 3 OF SECTION 143 OF THE COMPANIES ACT, 2013 (“THE ACT”)
We have audited the internal financial controls over financial repor ng of EMC Limited (“the Company”) as of March 31, 2016 in conjunc on with our audit of the financial statements of the Company for the year ended on that date.
MANAGEMENT’S RESPONSIBILITY FOR INTERNAL FINANCIAL CONTROLS
The Company’s management is responsible for establishing and maintaining internal financial controls based on the internal control over financial repor ng criteria established by the Company considering the essen al components of internal control stated in the guidance note on audit of internal financial controls over financial repor ng issued by the Ins tute of Chartered Accountants of India (‘ICAI’). These responsibili es include the design, implementa on and maintenance of adequate internal financial controls that were opera ng effec vely for ensuring the orderly and efficient conduct of its business, including adherence to company’s policies, the safeguarding of its assets, the preven on and detec on of frauds and errors, the accuracy and completeness of the accoun ng records, and the mely prepara on of reliable financial informa on, as required under the Companies Act, 2013.
AUDITORS’ RESPONSIBILITY
Our responsibility is to express an opinion on the Company’s internal financial controls over financial repor ng based on our audit. We conducted our audit in accordance with the guidance note on audit of internal financial controls over financial repor ng (the ‘Guidance Note’) and the standards on audi ng (the ‘Standards’) issued by ICAI and deemed to be prescribed under sec on 143 (10) of the Companies Act, 2013, to the extent applicable to an audit of internal financial controls. Those Standards and the Guidance Note require that we comply with ethical requirements and plan and perform the audit to obtain reasonable assurance about whether adequate internal financial controls over financial repor ng was established and maintained and if such controls operated effec vely in all material respects.
Our audit involves performing procedures to obtain audit evidence about the adequacy of the internal financial controls system over financial repor ng and their opera ng effec veness. Our audit of internal financial controls over financial repor ng included obtaining an understanding of internal financial controls over financial repor ng, assessing the risk that a material weakness exists, and tes ng and evalua ng the design and opera ng effec veness of internal control based on the assessed risk. The procedures selected depend on the auditor’s judgment, including the assessment of the risks of material misstatement of the financial statements, whether due to fraud or error.
We believe that the audit evidence we have obtained is sufficient and appropriate to provide a basis for our audit opinion on the Company’s internal financial controls over financial repor ng.
MEANING OF INTERNAL FINANCIAL CONTROLS OVER FINANCIAL REPORTING
A company's internal financial control over financial repor ng is a process designed to provide reasonable assurance regarding the reliability of financial repor ng and the prepara on of financial statements for external purposes in accordance with generally accepted accoun ng principles. A company's internal financial control over financial repor ng includes those policies and procedures that (i) pertain to the maintenance of records that, in reasonable detail, accurately and fairly reflect the transac ons and disposi ons of the assets of the company; (ii) provide reasonable assurance that transac ons are recorded as necessary to permit prepara on of financial statements in accordance with generally accepted accoun ng principles, and that receipts and expenditures of the company are being made only in accordance with authoriza ons of management and directors of the company; and (iii) provide reasonable assurance regarding preven on or mely detec on of unauthorized acquisi on, use, or disposi on of the company's assets that could have a material effect on the financial statements.
INHERENT LIMITATIONS OF INTERNAL FINANCIAL CONTROLS OVER FINANCIAL REPORTING
Because of the inherent limita ons of internal financial controls over financial repor ng, including the possibility of collusion or improper management override of controls, material misstatements due to error or fraud may occur and not be detected. Also, projec ons of any evalua on of the internal financial controls over financial repor ng to future periods are subject to the risk that the internal financial

Annexure - B to the Independent Auditor's Report Annual Report 2015-16
47
control over financial repor ng may become inadequate because of changes in condi ons, or that the degree of compliance with the policies or procedures may deteriorate.
OPINION
In our opinion, the Company has, in all material respects, an adequate internal financial controls over financial repor ng and such internal financial controls over financial repor ng were opera ng effec vely as at March 31, 2016, based on the internal control over financial repor ng criteria established by the Company considering the essen al components of internal control stated in the guidance note issued by the ICAI.
For SRB & ASSOCIATESChartered Accountants
Firm Registra on: No-310009E
Sanjeet PatraKolkata Partner31st August 2016 Membership No: 056121

Annual Report 2015-16 Standalone Balance Sheet as at 31st March, 2016
48
(`)NoteNo.
As at31.03.2016
As at31.03.2015
I. EQUITY & LIABILITIES
1 SHAREHOLDER'S FUNDS
a) Share capital 1 47,00,00,000 37,00,00,000
b) Share applica on Money - 1,25,00,00,000
c) Reserves & Surplus 2 7,61,93,44,527 8,08,93,44,527 4,90,08,28,480 6,52,08,28,480
2 NON-CURRENT LIABILITIES
a) Long term Borrowings 3 5,55,05,77,087 3,72,44,19,756
b) Deferred Tax Liabili es (Net) 4 1,29,01,58,032 14,66,61,618
c) Other Long term Liabili es 5 49,26,16,487 7,33,33,51,605 57,72,50,781 4,44,83,32,154
3 CURRENT LIABILITIES
a) Short term borrowings 6 9,25,35,46,569 6,68,51,76,404
b) Trade Payables 7 12,16,84,66,339 12,13,73,53,359
c) Other current Liabili es 8 1,40,31,61,472 73,39,48,213
d) Short term Provisions 9 4,89,98,673 22,87,41,73,053 68,93,85,753 20,24,58,63,729
38,29,68,69,186 31,21,50,24,363
II. ASSETS
4 NON-CURRENT ASSETS
a) Fixed Assets :- 10
(i) Tangible Asstes 1,67,36,20,532 1,82,29,71,924
(ii) Intangible Assets 51,31,398 44,62,691
(iii) Capital work-in-progress 22,00,217 62,81,929
b) Non-current Investments 11 2,18,83,68,431 71,19,03,531
c) Long term Loans & Advances 12 13,08,96,300 9,68,82,222
d) Other non-current Assets 13 42,96,68,080 4,42,98,84,958 31,79,21,712 2,96,04,24,009
5 CURRENT ASSETS
a) Inventories 14 1,34,88,47,878 1,38,49,90,001
b) Trade Receivables 15 17,59,08,38,893 15,41,84,52,983
c) Cash and cash Equivalents 16 1,43,03,26,747 1,00,95,49,690
d) Short term Loans & Advances 17 13,13,37,62,513 10,15,96,48,801
e) Other Current Assets 18 36,32,08,197 33,86,69,84,228 28,19,58,878 28,25,46,00,353
38,29,68,69,186 31,21,50,24,363
Significant Accoun ng Policies & Notes on Financial Statements
1 to 33
As per our Report of even date a achedFor SRB & AssociatesChartered Accountants (Firm Regn No 310009E)
Sanjeet Patra(Partner)Membership No. - 056121Kolkata, The day of 31st August, 2016
For and on behalf of the Board
Manoj Toshniwal Ramesh Chandra Bardia Managing Director Jt. Managing Director
Arun Kumar Kedia Sumit Kumar Surana Chief Financial Officer Company Secretary
Yamini MoreVP (Finance & Accounts)

Standalone Statement of Profit & Loss for the year ended 31st March, 2016 Annual Report 2015-16
49
(`)Note No.
For the Year Ended 31.03.2016
For the Year Ended 31.03.2015
I. INCOMERevenue From Opera ons 19 41,21,08,57,804 35,82,67,66,559
Other Income 20 14,27,81,279 13,76,80,625 Total 41,35,36,39,083 35,96,44,47,185
II EXPENDITURECost of Materials Consumed 21 30,85,88,21,346 28,14,35,63,496 Change in inventories of Finished goods work-in-progress and Stock-in Trade
22 8,40,98,621 (26,18,49,490)
Employee benefits Expense 23 76,82,74,815 76,67,72,423 Finance Costs 24 1,85,65,17,732 1,19,64,47,429 Deprecia on and Ammor sa on 25 17,55,08,518 16,85,55,606 Other Expenses 26 5,19,19,06,329 3,88,55,63,952 Total 38,93,51,27,361 33,89,90,53,415 Profit before Excep onal, Extraordinary items and Taxa on
2,41,85,11,721 2,06,53,93,769
Add/Less: Excep onal Items - - Profit before Extraordinary items and Taxa on 2,41,85,11,721 2,06,53,93,769 Add/Less: Extraordinary Items - - Profit before Taxa on from con nuing opera ons 2,41,85,11,721 2,06,53,93,769 Tax Expenses: - - - Current Tax (MAT/IT) 14,43,88,908 67,95,77,136
Tax adjustment of an earlier year (67,10,178) -Interest on Income tax - 8,11,56,762
- Deferred Tax (Expense)/Benefit-for Current Year 68,41,24,460 82,18,03,190 2,24,50,206 78,31,84,104 Profit a er Taxa on from con nuing opera ons for the year
1,59,67,08,531 1,28,22,09,665
- Deferred Tax (Expense)/Benefit-for Earlier Years - -(A) Profit a er Taxa on from con nuing opera ons 1,59,67,08,531 1,28,22,09,665
Profit before Taxa on from discon nuing opera ons - - Less: Tax Expense for discon nuing opera ons - -
(B) Profit a er Taxa on from discon nuing opera ons - - Profit a er Taxa on for the period (A+B) 1,59,67,08,531 1,28,22,09,665 Earnings per Equity Share (Face Value of ) 27- Basic 35.10 34.65 - Diluted 35.10 34.65
Significant Accoun ng Policies & Notes on Financial Statements
1 to 33
As per our Report of even date a achedFor SRB & AssociatesChartered Accountants (Firm Regn No 310009E)
Sanjeet Patra(Partner)Membership No. - 056121Kolkata, The day of 31st August, 2016
For and on behalf of the Board
Manoj Toshniwal Ramesh Chandra Bardia Managing Director Jt. Managing Director
Arun Kumar Kedia Sumit Kumar Surana Chief Financial Officer Company Secretary
Yamini MoreVP (Finance & Accounts)

Annual Report 2015-16 Standalone Cash Flow Statement for the year ended 31st March, 2016
50
(`) For the Year Ended
31.03.2016 For the Year Ended
31.03.2015A. CASH FLOW FROM OPERATING ACTIVITIES
Net Profit before Tax as per Profit and Loss Account 2,41,85,11,721 2,06,53,93,769 Adjusted for:Deprecia on/Amor sa on 17,55,08,518 16,85,55,606 Interest on Fixed Deposit (11,50,43,182) (10,01,78,048)Interest Expenses-Financial Cost 1,85,65,17,732 1,19,64,47,429 Profit on sale of Fixed Assets - - Opera ng Profit Before Working Capital Changes: 4,33,54,94,789 3,33,02,18,756 Adjusted for (Increase (-)/Decrease(+)) in:Inventories 3,61,42,123 (18,81,89,401)Sundry Debtors (2,22,17,96,760) (4,64,08,60,809)Loans and Advances (3,15,17,12,627) (3,19,84,54,263)Current Liabili es and Provisions 1,21,36,11,044 2,16,95,07,273
(4,12,37,56,220) (5,85,79,97,200)Cash Flow From Opera ng Ac vi es before Tax Payments 21,17,38,569 (2,52,77,78,443)Taxes Paid (29,64,29,655) (70,22,72,247)Cash Flow From Opera ng Ac vi es (A) (8,46,91,086) (3,23,00,50,690)
B. CASH FLOW FROM INVESTING ACTIVITIESFixed Asset Purchased (2,27,87,078) (4,45,38,404)Proceeds from Sale of Fixed Assets 26,624 Investment (1,47,64,64,900) (53,66,74,010)Sale of Current Investment - - Interest on Fixed Deposit 11,50,43,182 10,01,78,048 Cash Flow From Inves ng Ac vi es (B) (1,38,42,08,797) (48,10,07,741)
C. CASH FLOW FROM FINANCING ACTIVITIES Proceeds from Short Term Borrowings 1,63,78,75,432 2,56,81,22,797 Increase in Capital and Reserves 1,25,00,00,000 Proceeds from Long Term Borrowings 2,15,27,17,063 1,23,63,76,553 Interest Paid (1,85,65,17,732) (1,19,64,47,429)Dividend paid Including Tax (4,43,97,824) (4,32,88,150)Cash Flow From Financing Ac vi es (C) 1,88,96,76,939 3,81,47,63,770 Net Increase(+)/Decrease(-) in Cash and Cash Equivalents (A+B+C) 42,07,77,056 10,37,05,338 Opening Balance of Cash and Cash Equivalents 1,00,95,49,690 90,58,44,352 Closing Balance of Cash and Cash Equivalents 1,43,03,26,746 1,00,95,49,690 Notes:1. All figures in brackets are ou low.2. Cash and Cash Equivalent is as per Balance Sheet.
As per our Report of even date a achedFor SRB & AssociatesChartered Accountants (Firm Regn No 310009E)
Sanjeet Patra(Partner)Membership No. - 056121Kolkata, The day of 31st August, 2016
For and on behalf of the Board
Manoj Toshniwal Ramesh Chandra Bardia Managing Director Jt. Managing Director
Arun Kumar Kedia Sumit Kumar Surana Chief Financial Officer Company Secretary
Yamini MoreVP (Finance & Accounts)

Notes on Standalone Financial Statements for the year ended 31st March, 2016 Annual Report 2015-16
51
(`) As at 31.03.2016 As at 31.03.2015
NOTE - 1 SHARE CAPITALAuthorised7,50,00,000 Equity Shares of ` 10/-each 75,00,00,000 75,00,00,000
75,00,00,000 75,00,00,000 Issued, Subscribed and Paid-up4,70,00,000 Equity Shares of ` 10/- each fully paid-up 47,00,00,000 37,00,00,000
47,00,00,000 37,00,00,000
Reconcilia on of the no.of shares outstanding at the beginning and at the end of the yearNumber of Shares
As at 31.03.2016 As at 31.03.2015Number of shares outstanding at the beginning of the year 3,70,00,000 3,70,00,000 Add: Arising out of shares issued during the year 1,00,00,000 -
4,70,00,000 3,70,00,000 Less: Shares forfeited/brought back/cancelled during the year - - Number of shares outstanding at the end of the eyar 4,70,00,000 3,70,00,000
47,00,00,000 37,00,00,000
Note: Details of changes in Share Capital :- a) of the above share 4,32,51,180 shares are alloted as fully paid-up for payment in Cash.b) of the above shares 48,000 shares are allo ed as fully paid up pursuant to a contract without payments received in cash.c) of the above shares 6,90,000 shares are allo ed as fully paid up by way of bonus shares by capitaliza on of General Reserves.d) of the above 10,820 shares are allo ed as fully paid upon cancella on and conversion of 1082 cumula ve preference shares of
` 100/- each fully paid up. e) of the above 30,00,000 shares are allo ed fully paid upon cancella on and conversion of 30,00,000 non cumula ve redeemable
preference shares of ` 10/- each. f) Number of shares held by each share holder holding more than 5% shares in the company are as follows:
Par culars Number of Shares % of Shareholding
As at 31.03.2016
As at 31.03.2015
As at 31.03.2016
As at 31.03.2015
Equity Shares:i) MKN Investment Pvt.Ltd. 1,40,00,314 40,00,014 29.79 10.81
ii) YMS Finance Private Limited. 60,40,001 60,40,001 12.85 16.32 iii) Trinetra Electronics Ltd. 24,48,528 24,48,528 5.21 6.62 iv) Tamkore Investment Pvt.Ltd. 24,00,000 24,00,000 5.11 6.49 v) Metalind Private Ltd. 28,50,000 28,50,000 6.06 7.70
vi) Subhas Impex Pvt.Ltd. 34,53,252 34,53,252 7.35 9.33 vii) Vinod Dugar 43,18,624 43,18,624 9.19 11.67
viii) Sheetal Dugar 44,29,145 44,29,145 9.42 11.97 ix) Ramesh Chandra Bardia 11,09,089 19,09,089 2.36 5.16 x) Statefield Trade Link Pvt ltd 18,69,425 18,69,425 3.98 5.05

Annual Report 2015-16 Notes on Standalone Financial Statements for the year ended 31st March, 2016
52
(`) As at 31.03.2016 As at 31.03.2015
NOTE - 2 RESERVE & SURPLUSCapital ReservesAs per last Balance Sheet 14,51,991 14,51,991 Revalua on ReservesAs per last Balance Sheet 27,50,271 41,87,637 Add: Adjustment for Sale of old Assets - -
27,50,271 41,87,637 Less : Transferred to Deprecia on Account 42,958 27,07,313 14,37,366 27,50,271 Securi es Premium AccountAs per last Balance Sheet 73,00,00,000 73,00,00,000 Add: Premium on Shares issued during the year 1,15,00,00,000 1,88,00,00,000 - 73,00,00,000 Forfeiture Reserve AccountAs per last Balance Sheet 51,250 51,250SurplusAs per last Balance Sheet 4,16,65,74,968 2,92,88,97,632 Add: Profit a er tax earned during the period 1,59,67,08,531 1,28,22,09,665 Less: Proposed Dividend 2,35,00,000 3,70,00,000 Less: Dividend Distribu on Tax 47,84,031 75,32,329 Add: Adjustment for previous year 1,34,505 5,73,51,33,973 - 4,16,65,74,968
7,61,93,44,527 4,90,08,28,480
As at 31.03.2016 As at 31.03.2015NOTE - 3 LONG TERM BORROWINGS(i) Term Loan
SecuredFrom Banks 40,47,91,964 29,36,22,065 From Others (IRD. Govt. of W.B) 5,54,84,361 6,04,84,361 UnsecuredFrom Banks 33,32,00,000 - From Others 2,47,24,63,768 2,10,00,00,000
(ii) Car LoanSecuredFrom Banks 4,07,020 20,21,016
(iii) Other Loans & Advances 2,28,42,29,974 1,26,82,92,314 5,55,05,77,087 3,72,44,19,756
NOTE - 3.11 Term Loans from Punjab Na onal Bank and Oriental Bank of Commerce are secured by way of crea on of charge ranking Parri Passu on the Fixed
Assets of Solar Power Project and all other exis ng and future movable and immovable assets of the company. The loans are further secured by personal guarantees of some of the Directors of the Company.
2 Term Loans from Punjab Na onal Bank & Oriental Bank of Commerce are Repayable over 44 Quarterly Installments commencing from the quarter ending October 2012 and bears an Interest rate of BR + 2.5% from PNB & BR + 2.25% from OBC.
3 The Term Loan under Equipment Finance arrangement is repayable in 10 quarterly installments star ng from Quarter ending Sep, 14.4 Loan from Govt.of West Bengal is secured by way of Pari Passu charge ranking next only to the charges in favour of financial ins tu ons / Banks,
on the fixed assets of the company,both present as well as future.The Loan is repayable in fourteen equal annual installments (excluding interest) star ng from 31st March, 2013.The Loan carries interest of 8.75% p.a with a rebate of 2% p.a for mely repayment.Interest is paid as and when due.
5 Vehicle loans are secured by way of mortgage of vehicles. The loans are repayable by 2017-18.6 Term Loan from Karur Vysya Bank is secured by way of crea on of Mortgage on the commercial space being purchased by the company. The loans
are further secured by personal guarantees of some of the Directors of the Company. The loan is repayable in 19 quarterly instalments commencing from quarter ending March, 16 and bears an interest rate of BR + 2.25%.
7 Other Loans & Advances includes advances from par es.8 Unsecured Term Loan from banks (to the tune of ` 50 crores) was taken during the year, its repayment is star ng from the quarter ending June,
2016-2017 and bears an interest rate of BR + 2.30%.9 Unsecured Term Loan from others (to the tune of ` 300 crores) was taken during the year, its repayment is star ng from the quarter ending June
2016-2017 and bears an interest rate of BR + 3.00%.

Notes on Standalone Financial Statements for the year ended 31st March, 2016 Annual Report 2015-16
53
(`) As at 31.03.2016 As at 31.03.2015
NOTE - 4 DEFERRED TAX LIABILITIES (NET)Opening Balance 14,66,61,618 12,42,11,411 Add - Adjustment for current year 68,41,24,460 83,07,86,078 2,24,50,206 14,66,61,618 Add - Adjustment for previous years 45,93,71,954 -Closing Balance 1,29,01,58,032 14,66,61,618
As at 31.03.2016 As at 31.03.2015NOTE - 5 OTHER LONG TERM LIABILITIES
Trade Payables(payable beyond 12 months) 48,29,85,462 57,33,14,877 Other Liabili es 96,31,025 39,35,904
49,26,16,487 57,72,50,781
As at 31.03.2016 As at 31.03.2015NOTE - 6 SHORT TERM BORROWINGS
i) Working Capital Loan - Secured From Banks - repayable on demand 7,69,00,89,854 6,05,22,14,422 ii) Other Loans & Advances 1,56,34,56,715 63,29,61,982
9,25,35,46,569 6,68,51,76,404 NOTE - 6.1 Working Capital Facili es are secured by way of : 1 Hypotheca on on Pari Passu basis with the Working Capital Banks of the Company on the en re Stock in Trade, Book Debts and
any other current assets of the company, both present and future.2 First charge on the en re immovable and movable Fixed Assets of the Company and equitable mortgage on Landed proper es of
the Company at Naini (Allahabad) excluding OBC's share on Solar Power equipments and equipment purchased through equipment Loan present and future.
3 Personal guarantees of some of the Directors of the Company.
As at 31.03.2016 As at 31.03.2015NOTE - 7 TRADE PAYABLES
Sundry Creditors for goods & expenses 12,16,84,66,339 12,13,73,53,359 12,16,84,66,339 12,13,73,53,359
As at 31.03.2016 As at 31.03.2015NOTE - 8 OTHER CURRENT LIABILITIES
i) Current maturi es of long-term debt:Term Loan (Amount to be paid in one year) - Principal 82,04,56,662 50,87,71,215 Car Loan (Amount to be paid in one year) 16,13,995 82,20,70,657 14,20,436 51,01,91,651
ii) Unpaid Dividend 3,61,320 3,17,488 iii) Interest Accrued but not paid 4,45,19,834 2,98,39,108 iv) Other Liabili es 53,62,09,661 19,35,99,966
1,40,31,61,472 73,39,48,213
As at 31.03.2016 As at 31.03.2015NOTE - 9 SHORT TERM PROVISIONS
Provision for Income Tax (Net of advance tax) 37,91,921 62,19,14,800 Provision for Proposed Dividend 2,35,00,000 3,70,00,000 Provision for Dividend Distribu on Tax 47,84,031 75,32,329 Other Provision * 1,69,22,721 2,29,38,624
4,89,98,673 68,93,85,753 * Other provision represents liability for excise duty on goods lying as closing stock at factory premises.

Annual Report 2015-16 Notes on Standalone Financial Statements for the year ended 31st March, 2016
54
(`)
NO
TE -
10FI
XED
ASS
ETS
Par
cular
of A
sset
s
GRO
SS B
LOCK
D
EPRE
CIAT
ION
NET
BLO
CK
Gro
ss B
lock
as
on
01
.04.
2015
Add
ion
d
urin
g the
ye
ar
Sale
/Adj
ustm
ents
d
urin
g the
year
G
ross
Blo
ck
as o
n
31.0
3.20
16
Acc
umul
ated
D
epre
ciaon
up
to
01.0
4.20
15
Dep
recia
on
dur
ing t
he
year
Ded
ucon
/ A
djus
tmen
t d
urin
g the
ye
ar
Acc
umul
ated
D
epre
ciaon
up
to
31.0
3.20
16
As a
t
31.0
3.20
16
As a
t 31
.03.
2015
TANG
IABL
E ASS
ETS (
A)
FREE
HOLD
LAND
34,
50,2
80
- -
34,
50,2
80
- -
-
34,
50,2
80
34,
50,2
80
BUILD
INDG
& ST
RUCT
URES
9,
33,1
1,66
9 3
2,53
,577
-
9,
65,6
5,24
6 2,
72,3
6,09
9 5
8,08
,588
3,
30,4
4,68
7
6,35
,20,
559
6,
60,7
5,57
0
PLAN
T & M
ACHI
NERY
2,38
,98,
21,8
63
1,07
,01,
537
2,40
,05,
23,4
00
67,
18,0
7,03
2 1
5,59
,95,
296
82,
78,0
2,32
8 1,
57,2
7,21
,072
1,
71,80
,14,
831
VEHI
CLES
2,
18,0
8,72
2 3
8,14
,675
-
2,
56,2
3,39
7 1,
00,2
6,15
5 2
0,95
,739
1,
21,2
1,89
4
1,35
,01,
503
1,
17,8
2,56
7
FURN
ITURE
, FIX
TURE
&
EQUI
PMEN
T & C
OMPU
TER
6,
53,4
8,57
1 7
5,60
,081
7,29
,08,
652
4,16
,99,
895
1,07
,81,
639
5,24
,81,
534
2,
04,2
7,11
8
2,36
,48,
676
TOTA
L (A)
2,57
,37,
41,1
05
2,53
,29,
870
- 2,
59,9
0,70
,975
75
,07,
69,1
81
17,4
6,81
,262
-
92,
54,5
0,44
3 1,
67,3
6,20
,532
1,
82,2
9,71
,924
INTA
NGIB
LE A
SSET
S (B)
COM
PUTE
R SO
FTW
ARE,
LICEN
CES F
OR SO
FTW
ARE
71,
63,2
18
15,
38,9
21
- 8
7,02
,139
2
7,00
,527
8,
70,2
14
35,
70,7
41
51,
31,3
98
44,
62,6
91
TOTA
L (A+
B)2,
58,0
9,04
,323
2,
68,6
8,79
1 -
2,60
,77,
73,1
14
75,3
4,69
,708
17
,55,
51,4
76
- 9
2,90
,21,
184
1,67
,87,
51,9
30
1,82
,74,
34,6
15
PREV
IOUS
YEAR
2,54
,11,
43,9
99
3,97
,86,
948
26,
624
2,58
,09,
04,3
23
58,
34,7
6,73
6 1
6,99
,92,
972
- 7
5,34
,69,
708
1,82
,74,
34,61
5

Notes on Standalone Financial Statements for the year ended 31st March, 2016 Annual Report 2015-16
55
(`) As at 31.03.2016 As at 31.03.2015
NOTE - 11 NON CURRENT INVESTMENTSUnquoted at Cost 25,000 (P.Y: 25,000)Shares of ` 100/- each fully paid 15,00,000 15,00,000 in EMC Hardware Ltd.at cost 50,000 (P.Y: 50,000) Shares of ` 10/- each fully paid 5,00,000 5,00,000 in EMC Logis cs Ltd.at cost2,500 (P.Y: 2,500) Shares of ` 10/- each fully paid 25,000 25,000 in EMC Infrastructure Ltd.at cost50,000 (P.Y: 50,000) Shares of ` 10/- each fully paid 5,00,000 5,00,000 in EMC Forging Ltd.at cost 1,30,00,000 (P.Y: 1,30,00,000) Shares of ` 10/- each fully paid 13,00,00,000 13,00,00,000 in EMC Tower Ltd.at cost50,000 (P.Y: 50,000) Shares of ` 10/- each fully paid 5,00,000 5,00,000 in EMC Solar Ltd. at cost 50,000 (P.Y: 50,000) Shares of ` 10/- each fully paid 5,00,000 5,00,000 in EMC Academy Ltd.at cost15,00,000 (P.Y: 15,00,000) Shares of ` 10/- each fully paid-up 1,50,00,000 1,50,00,000 in EMC Overseas Ltd.at cost6,00,000 (P.Y: 6,00,000 ) Shares of ` 10/- each fully paid-up 60,00,000 60,00,000 in Quatro Rail Tech Solu ons Ltd.(Formerly named as Quatro Rail Tech Solu ons Pvt Ltd)Investment in BCPL - EMC - JV 2,45,000 15,47,70,000 2,45,000 15,47,70,000Quoted at Cost3,878 (P.Y: 3,878)Shares of ̀ 10/- each fully paid-up in PowergridCorpora on of India Ltd. (Market Value - ` 5,39,430, (PY ` 5,63,280)
3,49,020 3,49,020
1,42,87,689 Shares of ` 10/- each fully paid in MCNALLY Bharat Engineering Ltd (17,00,000 Shares out of 1,42,87,689 are pledge against a value of Rs 12,21,45,000) (Market Value - ` 1,08,58,64,364)
1,42,87,68,900 -
Foreign Subsidiary/Associates/Joint Ventures4,900 (P.Y: 4,900) shares of Advanced Steel & Crane Inc. 11,05,85,000 11,05,85,000 22,500 (P.Y: 22,500) Shares of Euro 1/- each fully paid up in CE Maschinenbau GmbH (Formerly named as MBE Cologne Engineering GmbH)
12,51,90,000 12,51,90,000
70% Quota of Tecnolines S.R.L 29,01,54,960 29,01,54,960 1,850 (PY : 1,850) shares of AED 1000/- each fully paid in EMC West ASIA DMCC
3,03,99,775 3,03,99,775
1,000 (PY : 1,000) shares of Singapore $1/- each, subscribed in Technolines Singapore PTE Ltd
49,231 49,231
87,500 shares of OMR 1/ each fully paid up in EMC MBE Contrac ng Co. LLC
1,51,97,000 -
1,800 Shares of SAR 1,000/- each, fully paid up in EMC Saudi LLC 3,24,99,000 - 51,000 (P.Y: 51,000) shares of HK $1/- each, fully paid up in EMC East Asia Ltd.
4,05,545 4,05,545
2,18,83,68,431 71,19,03,531
As at 31.03.2016 As at 31.03.2015NOTE - 12 LONG TERM LOANS & ADVANCES
(Unsecured, Considered Good)i) Advance Sales Tax 13,08,96,300 13,08,96,300 9,68,82,222 9,68,82,222
13,08,96,300 9,68,82,222
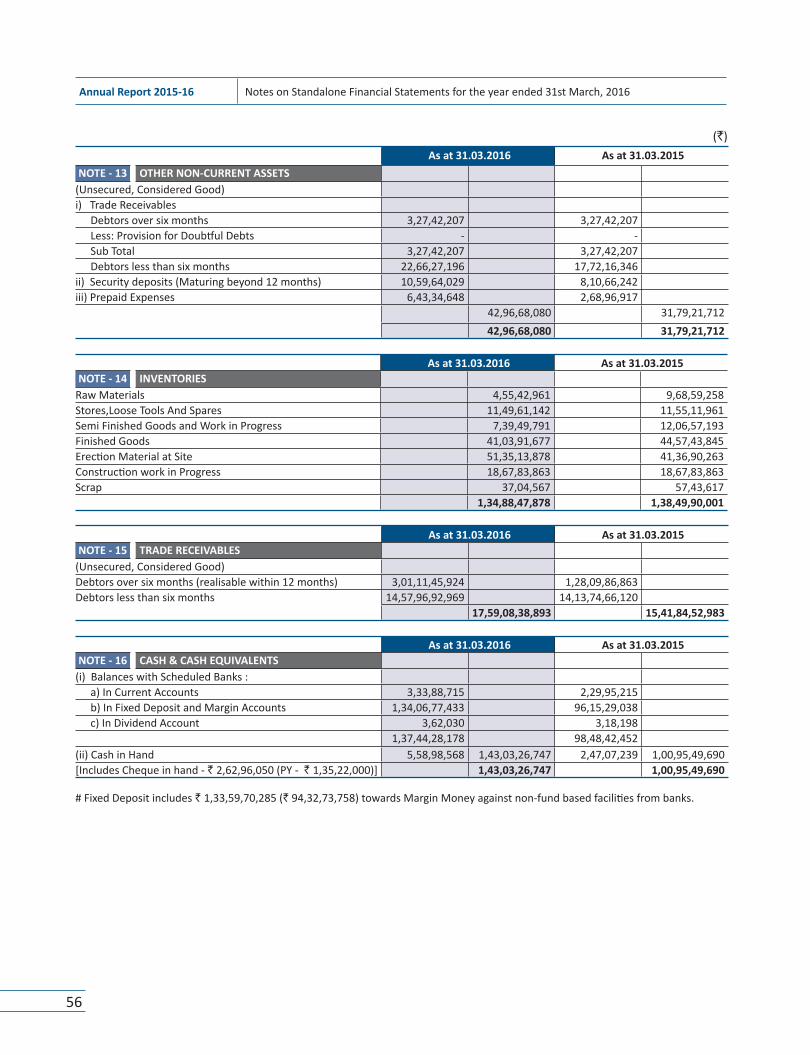
Annual Report 2015-16 Notes on Standalone Financial Statements for the year ended 31st March, 2016
56
(`) As at 31.03.2016 As at 31.03.2015
NOTE - 13 OTHER NON-CURRENT ASSETS(Unsecured, Considered Good)i) Trade Receivables
Debtors over six months 3,27,42,207 3,27,42,207 Less: Provision for Doub ul Debts - - Sub Total 3,27,42,207 3,27,42,207 Debtors less than six months 22,66,27,196 17,72,16,346
ii) Security deposits (Maturing beyond 12 months) 10,59,64,029 8,10,66,242 iii) Prepaid Expenses 6,43,34,648 2,68,96,917
42,96,68,080 31,79,21,712 42,96,68,080 31,79,21,712
As at 31.03.2016 As at 31.03.2015NOTE - 14 INVENTORIES
Raw Materials 4,55,42,961 9,68,59,258 Stores,Loose Tools And Spares 11,49,61,142 11,55,11,961 Semi Finished Goods and Work in Progress 7,39,49,791 12,06,57,193 Finished Goods 41,03,91,677 44,57,43,845 Erec on Material at Site 51,35,13,878 41,36,90,263 Construc on work in Progress 18,67,83,863 18,67,83,863 Scrap 37,04,567 57,43,617
1,34,88,47,878 1,38,49,90,001
As at 31.03.2016 As at 31.03.2015NOTE - 15 TRADE RECEIVABLES
(Unsecured, Considered Good)Debtors over six months (realisable within 12 months) 3,01,11,45,924 1,28,09,86,863 Debtors less than six months 14,57,96,92,969 14,13,74,66,120
17,59,08,38,893 15,41,84,52,983
As at 31.03.2016 As at 31.03.2015NOTE - 16 CASH & CASH EQUIVALENTS
(i) Balances with Scheduled Banks :a) In Current Accounts 3,33,88,715 2,29,95,215 b) In Fixed Deposit and Margin Accounts 1,34,06,77,433 96,15,29,038 c) In Dividend Account 3,62,030 3,18,198
1,37,44,28,178 98,48,42,452 (ii) Cash in Hand 5,58,98,568 1,43,03,26,747 2,47,07,239 1,00,95,49,690[Includes Cheque in hand - ` 2,62,96,050 (PY - ` 1,35,22,000)] 1,43,03,26,747 1,00,95,49,690
# Fixed Deposit includes ` 1,33,59,70,285 (` 94,32,73,758) towards Margin Money against non-fund based facili es from banks.

Notes on Standalone Financial Statements for the year ended 31st March, 2016 Annual Report 2015-16
57
(`) As at 31.03.2016 As at 31.03.2015
NOTE - 17 SHORT TERM LOANS & ADVANCES(Unsecured, Considered Good)i) Advance to Related Par es 35,60,52,605 13,93,68,988 ii) Advance Statutory Payments 1,11,83,442 5,06,24,871 iii) Advances to Employees 1,62,63,952 1,02,27,077 iii) Advances to Suppliers/others 12,75,02,62,514 13,13,37,62,513 9,95,94,27,866 10,15,96,48,801
13,13,37,62,513 10,15,96,48,801
Notes :-a) Loans & Advances
Debts due by Directors or other officers of the Company or from a Private Company in which Director of the Company is a Director / Member :i) Private Companies - -ii) Subsidiary Company 35,60,52,605 13,93,68,988
As at 31.03.2016 As at 31.03.2015NOTE - 18 OTHER CURRENT ASSETS
i) Security Deposits 6,29,95,901 5,88,50,661 ii) Prepaid Expenses & Others 30,02,12,296 22,31,08,217
36,32,08,197 28,19,58,878 36,32,08,197 28,19,58,878
For the Year Ended 31.03.2016 For the Year Ended 31.03.2015NOTE - 19 INCOME FROM OPERATIONS
a) Sale of Productsb) Sale of Services 37,40,10,88,095 33,05,71,98,192 c) Other Opera ng Revenue 4,14,18,01,008 2,94,71,50,938
1,68,23,335 6,47,46,874 41,55,97,12,438 36,06,90,96,004
Less: Du es & Taxes (34,88,54,634) 41,21,08,57,804 (24,23,29,445) 35,82,67,66,559 41,21,08,57,804 35,82,67,66,559
For the Year Ended 31.03.2016 For the Year Ended 31.03.2015NOTE - 20 OTHER INCOME
Interest 11,50,43,182 10,01,78,048 Miscellaneous Income 2,77,38,097 14,27,81,279 3,75,02,577 13,76,80,625
14,27,81,279 13,76,80,625

Annual Report 2015-16 Notes on Standalone Financial Statements for the year ended 31st March, 2016
58
NO
TE -
21.1
VA
LUE
OF
IMPO
RTED
AN
D IN
DIG
ENO
US
RAW
MAT
ERIA
LS, S
PARE
PAR
TS A
ND
CO
MPO
NEN
TS C
ON
SUM
ED F
or th
e Ye
ar E
nded
31.
03.2
016
For t
he Y
ear E
nded
31.
03.2
015
Valu
e (`
)Pe
rcen
tage
( %
)Va
lue
(`)
Perc
enta
ge (
% )
Impo
rted
2,1
8,76
,10,
265
7.09
2,2
2,38
,93,
807
7.90
Indi
geno
usly
obt
aine
d:
Raw
Mat
eria
ls28
,62,
29,4
8,72
0 92
.75
25,8
4,14
,77,
133
91.8
2
Stor
es,S
pare
Par
ts &
Com
pone
nts
4,8
2,62
,361
0.
16 7
,81,
92,5
55
0.28
30,8
5,88
,21,
346
100
28,1
4,35
,63,
496
100
(`)
NO
TE -
21M
ATER
IAL
CON
SUM
EDPa
rcu
lars
Ope
ning
Sto
ckG
oods
Pur
chas
edCo
nsum
pon
Clos
ing
Stoc
kAs
at
1st
April
, 201
5As
at
1st
April
, 201
4Fo
r the
yea
r en
ded
on 3
1st
Mar
ch, 2
016
For t
he y
ear
ende
d on
31s
t M
arch
, 201
5
For t
he y
ear
ende
d on
31s
t M
arch
, 201
6
For t
he y
ear
ende
d on
31s
t M
arch
, 201
5
As a
t 31
st
Mar
ch, 2
016
As a
t 31
st
Mar
ch, 2
015
Raw
Mat
eria
ls (A
)
Stee
l
7,1
3,75
,774
4,2
8,29
,945
4
8,20
,63,
919
47,
06,5
9,20
4 51
,49,
91,9
33
44,
21,1
3,37
5 3
,84,
47,7
60
7,1
3,75
,774
Alum
iniu
m
2,0
2,23
,962
67,9
5,68
4 8
6,95
,260
3,0
7,44
,239
2,35
,22,
331
1
,73,
15,9
60
53,9
6,89
1 2
,02,
23,9
62
Zinc
44
,19,
803
32
,65,
563
8,59
,65,
318
7
,64,
49,3
28
8,
94,6
3,36
0
7,5
2,95
,089
9
,21,
761
44,1
9,80
3
Oth
er M
ater
ials
8
,39,
719
3
,59,
919
46,
85,4
16
43,
73,6
97
47,4
8,58
6 3
8,93
,897
7
,76,
549
8,3
9,71
9
Tota
l (A)
9
,68,
59,2
58
5
,32,
51,1
11
58,
14,0
9,91
3 5
8,22
,26,
469
63,2
7,26
,210
5
3,86
,18,
322
4,5
5,42
,961
9
,68,
59,2
58
Stor
e, T
ools
& S
pare
s (B)
Stor
es &
Spa
res
11
,55,
11,9
61
12
,76,
92,0
58
4
,77,
11,5
42
6
,60,
12,4
59
4,
82,6
2,36
1
7,8
1,92
,555
11
,49,
61,1
42
11,5
5,11
,961
Tota
l (B)
11,
55,1
1,96
1
12,7
6,92
,058
4,7
7,11
,542
6,6
0,12
,459
4,82
,62,
361
7
,81,
92,5
55
11,4
9,61
,142
11
,55,
11,9
61
Erec
on M
ater
ials
(C)
Erec
on &
Con
cre
ng M
ater
ial
60
,04,
74,1
26
70
,55,
62,2
66
32,
41,5
2,17
7 3
8,81
,34,
782
41,1
1,12
,426
4
9,32
,22,
922
51,3
5,13
,878
60
,04,
74,1
26
Tota
l (C)
60,
04,7
4,12
6
70,5
5,62
,266
3
2,41
,52,
177
38,
81,3
4,78
2 41
,11,
12,4
26
49,
32,2
2,92
2 51
,35,
13,8
78
60,0
4,74
,126
Oth
er M
ater
ials
(D)
Proj
ect P
urch
ases
--
29,
76,6
7,20
,349
2
7,03
,35,
29,6
98
29,7
6,67
,20,
349
27,0
3,35
,29,
698
--
Tota
l (D
)-
- 2
9,76
,67,
20,3
49
27,
03,3
5,29
,698
29
,76,
67,2
0,34
9 27
,03,
35,2
9,69
8 -
-
Gra
nd T
otal
8
1,28
,45,
346
88
,65,
05,4
35
30,
71,9
9,93
,981
2
8,06
,99,
03,4
07
30,8
5,88
,21,
346
28,1
4,35
,63,
496
67,4
0,17
,981
81
,28,
45,3
46

Notes on Standalone Financial Statements for the year ended 31st March, 2016 Annual Report 2015-16
59
(`) For the Year Ended 31.03.2016 For the Year Ended 31.03.2015
NOTE - 22 CHANGES IN INVENTORIESOPENING STOCK :
Finished Goods 44,57,43,845 24,79,62,628 Semi Finished Goods and Work in Progress 12,06,57,193 6,00,89,389 Scrap Materials 57,43,617 57,21,44,655 22,43,148 31,02,95,165
CLOSING STOCK :Finished Goods 41,03,91,677 44,57,43,845 Semi Finished Goods and Work in Progress 7,39,49,791 12,06,57,193 Scrap Materials 37,04,567 48,80,46,034 57,43,617 57,21,44,655
INCREASE (-) / DECREASE (+) 8,40,98,621 (26,18,49,490)
For the Year Ended 31.03.2016 For the Year Ended 31.03.2015NOTE - 23 EMPLOYEE BENEFIT EXPENSES(a) Salary, Wages and Bonus 69,63,79,734 70,67,87,624 (b) Contribu on to Providend and Other Funds 2,58,02,114 2,14,84,654 (c) Workmen & Staff Welfare Expenses 1,43,34,578 1,41,08,683 (d) Directors' Remunera on 3,17,58,390 2,43,91,462
76,82,74,815 76,67,72,423
NOTE - 23.1As per Accoun ng standard 15 "Employee benefits", the disclosures as defined in the Accoun ng standard are given below :-Defined Benefit Plan The employees' gratuity fund scheme managed by a trust is a defined benefit plan.The Present Value of obliga ons is determined based on actuarial valua on using the Projected Unit Cost Method.
2015-16 2014-151) Change in Defined Benefit Obliga on :
Defined Benefit Obliga on at the beginning of the year 3,28,80,998 2,94,17,782Interest Cost 25,58,142 26,47,600Current Service Cost 43,87,650 41,75,062Benefits Paid (58,99,604) (32,85,648)Actuarial Gain / (Loss) on Obliga on 9,55,963 (73,798)Present Value of obliga on as at the end of the year 3,48,83,149 3,28,80,998
2) Change in Fair Value of the AssetFair Value of the plan assets at the beginning of the year 2,89,45,094 2,97,50,820Expected returns on plan assets 25,32,696 26,03,197Contribu ons - 21,273Benefits paid (58,99,604) (32,85,648)Actuarial Gain / (Loss) on plan assets (3,26,062) (1,44,548)Fair Value of Plan assets at the end of the year 2,52,52,124 2,89,45,094
3) Net Asset/(Liability) recognised in the Balance SheetFair Value of the Plan Assets 2,52,52,124 2,89,45,094Present Value of the obliga on as at the end of the year 3,48,83,149 3,28,80,998Amount recognized in Balance Sheet (96,31,025) (39,35,904)
4) Expenses recognised during the year(under the head contribu on to provident fund and other funds)Current Service Cost 43,87,650 41,75,062Interest Cost 25,58,142 26,47,600Expected Return from Plan Asset (25,32,696) (26,03,197)Net Actuarial Gain/(Loss) recognized in the year 12,82,025 70,750Expenses recognised in the statement of Profit and Loss 56,95,121 42,90,215

Annual Report 2015-16 Notes on Standalone Financial Statements for the year ended 31st March, 2016
60
(`) For the Year Ended 31.03.2016 For the Year Ended 31.03.2015
NOTE - 24 FINANCE COSTSInterest on Term Loan 51,92,07,472 23,28,43,540 Interest on Others 1,33,73,10,259 96,36,03,889
1,85,65,17,732 1,19,64,47,429
For the Year Ended 31.03.2016 For the Year Ended 31.03.2015NOTE - 25 DEPRECIATION & AMORTISATION EXPENSE
Deprecia on for the Period 17,55,51,476 16,99,92,972 Less: Transfer to Revalua on Reserve 42,958 14,37,366
17,55,08,518 16,85,55,606
For the Year Ended 31.03.2016 For the Year Ended 31.03.2015NOTE - 26 OTHER EXPENSES
Processing / Job Charges 2,85,88,62,984 1,43,08,75,310 Freight,Carriage & Transport 35,03,38,103 52,28,30,051 Power & Fuel 3,92,85,888 4,18,02,847 Rent 7,23,71,741 6,89,21,724 Insurance 8,53,75,812 5,98,36,807 Repairs & Renewals:
Plant & Machinery 40,46,639 39,43,634 Building 7,63,685 7,07,870 Others 67,29,980 1,15,40,304 68,64,723 1,15,16,228
Hire Charges 7,18,50,647 8,11,94,788 Travelling & Conveyance 4,83,24,858 4,16,72,330 Auditors Remunera on:Audit Fees 25,00,000 25,00,000 Internal Audit Fees 2,02,000 98,200 Tax Audit 50,000 50,000 Custom Duty 64,09,265 74,28,466 Excise Duty 1,69,22,721 3,59,63,029 Rates & Taxes 11,80,45,278 6,50,28,304 Communica on Expenses 1,63,85,825 94,77,638 Bank Commission and Charges 1,31,51,74,743 1,14,95,84,621 Miscellaneous Expenses (A) 19,05,49,491 32,25,53,114 Transla on Loss (1,39,59,932) 3,37,83,695 Loss on Contract Performance 16,76,601 4,46,800
5,19,19,06,329 3,88,55,63,952 (A) Miscellaneous Expenses
Legal Charges, Lis ng & Filing Fees 1,20,96,632 26,72,561 Sales Promo on & Adver sement Expenses 62,22,198 44,11,205 Tes ng Charges 95,00,258 73,83,327 Computer/R&D Charges 21,57,501 14,60,354 Entertainment Expenses 27,50,729 25,46,336 General Charges 93,30,140 90,27,731 Office Up-Keep 73,42,324 66,68,765 Prin ng & Sta onery 64,28,591 54,22,135 Subscrip on & Dona on 5,23,150 1,59,714 Professional fees & Service Charges 11,73,84,987 27,44,21,342 Motor Car Expenses 5,62,379 5,54,823 Mobilisa on Expenses 99,85,578 15,66,817 Tender Fees 20,98,916 30,08,631 Others 24,47,780 11,79,892 Rebate 15,39,779 18,70,248 Recruitment Expenses 1,78,550 1,99,232
19,05,49,491 32,25,53,114

Notes on Standalone Financial Statements for the year ended 31st March, 2016 Annual Report 2015-16
61
For the Year Ended 31.03.2016 For the Year Ended 31.03.2015
NOTE - 26.1 EXPENDITURE IN FOREIGN CURRENCYTour Expenses 75,90,718 47,02,120 Others 1,97,30,105 5,57,81,344
2,73,20,823 6,04,83,464
31st March 2016 31st March 2015
NOTE - 27 EARNINGS PER SHARE (EPS)i) Net Profit a er tax as per statement of Profit & Loss
a ributable to Equity Shareholders (`) 1,59,67,08,531 1,28,22,09,665
ii) Weighted Average number of equity shares used as denominator for calcula ng EPS
4,54,93,151 3,70,00,000
iii) Basic and Diluted Earnings per share (`) 35.10 34.65iv) Face Value per Equity Share (`) 10.00 10.00
Amount (` in lacs)31st March 2016 31st March 2015
NOTE - 28 EARNINGS IN FOREIGN EXCHANGEFOB Value of Exports 22,202.76 22,593.06
Amount (` in lacs)31st March 2016 31st March 2015
NOTE - 29.1 CONTINGENT LIABILITIESi. Guarantees given by Company's Bankers on behalf of the
Company. 1,91,019.46 1,19,660.83
ii. Claims against the Company not acknowledged as debts:a) Sales Tax 1,439.76 1,496.08 b) Service Tax 333.08 333.08
iii. Corporate Guarantees given by Company 11,603.78 6,481.85 However as per management percep on, the above liabili es will not devolve upon the company in future.
Amount (` in lacs)31st March 2016 31st March 2015
NOTE - 29.2 CAPITAL COMMITMENTSEs mated value of contracts in capital account remaining to be executed
700.05 1909.94
Amount (` in lacs)31st March 2016 31st March 2015
NOTE - 30 SEGEMENT REPORTING AS PER AS - 17Segment Revenue:Project Construc on Division 3,79,561.39 3,30,482.61 Tower Manufacturing Division 8,926.66 3,441.84 Aluminium Extrusion,Forging & Conductor Division 615.41 819.85 Solar Power Division 937.80 921.89 Others 22,067.32 22,601.48 Segment Total 4,12,108.58 3,58,267.67
(`)

Annual Report 2015-16 Notes on Standalone Financial Statements for the year ended 31st March, 2016
62
31st March 2016 31st March 2015Segment Results: Project Construc on Division 43,133.31 34,105.01 Tower Manufacturing Division 396.20 50.43 Aluminium Extrusion,Forging & Conductor Division 5.69 22.50 Solar Power Division 603.04 631.72 Segment Total 44,138.24 34,809.66 Unallocated income over expenses (1,387.95) (2,191.25)Profit Before Interest & Tax 42,750.29 32,618.41 Interest 18,565.18 11,964.47 Provision for Current Year Tax 8,218.03 7,831.84 Profit a er Current Year Tax 15,967.09 12,822.09
Amount (` in lacs)
Amount (` in lacs)Assets Liabili es
31st March 2016 31st March 2015 31st March 2016 31st March 2015NOTE - 30 SEGEMENT REPORTING AS PER AS - 17SEGMENT ASSETS & LIABILITIESProject Construc on Division 3,09,130.57 2,63,336.15 1,69,094.77 1,45,441.91 Tower Manufacturing Division 23,396.21 17,078.44 1,241.07 756.38 Aluminium Extrusion,Forging & Conductor Division 738.80 1,170.70 186.87 146.75 Solar Power Division 6,205.50 6,852.25 - 3.56 Unallocated Assets & Liabili es 43,497.61 23,712.70 77,235.82 62,870.68 Segment Assets & Liabili es: 3,82,968.69 3,12,150.24 2,47,758.53 2,09,219.28
NOTE - 31 RELATED PARTY DISCLOSURE AS PER AS - 18 Amount (` in lacs)Name Rela on Par culars Net Transac on
During the yearBalance as on
31.03.2016
EMC Hardware Ltd 100% SubsidiaryInvestment NIL 15.00
Advance 0.26 4.11 Interest 0.28 -
EMC Tower Ltd 100% SubsidiaryInvestment - 1,300.00
Advance 336.62 646.37 Interest 34.37 -
EMC Solar Ltd. 100% SubsidiaryInvestment NIL 5.00
Advance 0.18 (2.04)Interest (0.15) -
EMC Forging Ltd. 100% SubsidiaryInvestment NIL 5.00
Advance 0.28 (1.78)Interest (0.14) -
EMC Logis c Ltd. 100% SubsidiaryInvestment NIL 5.00
Advance 0.31 (2.01)Interest (0.15) -
EMC Overseas Ltd. 100% SubsidiaryInvestment NIL 150.00
Advance 1.39 (132.39)Interest (9.43) -
EMC Academy Ltd. 100% SubsidiaryInvestment NIL 5.00
Advance 2.28 112.76 Interest 7.97 -

Notes on Standalone Financial Statements for the year ended 31st March, 2016 Annual Report 2015-16
63
Name Rela on Par culars Net Transac on During the year
Balance as on 31.03.2016
Advanced Steel & Crane Inc. 100% Subsidiary Investment - 1,105.85
Tecnolines S.r.l 70% SubsidiaryInvestment - 2,901.55
Advance 489.89 489.89
EMC West Asia DMCC 100% SubsidiaryInvestment - 303.99
Advance 158.40 167.01 Interest 8.61 -
BCPL - EMC Joint Venture Joint VentureInvestment - 2.45
Sales 234.29 442.40 Advance (4.91) -
EMC - BCPL Joint Venture Joint Venture Sales 17.86 72.37
EMC - BCPL Subir Joint Venture Joint VentureInvestment - -
Sales 2,113.60 526.68 Advance (6.68) -
Quatro Rail Tech Solu ons Ltd. (Formerly named as Quatro Rail Tech Solu ons Pvt Ltd) 60% Subsidiary
Investment - 60.00 Advance 111.31 115.77 Interest 4.46 -
EMC MBE Contrac ng Co. LLC Joint Venture Investment 151.97 151.97 EMC Saudi LLC 60 % Subsidiary Investment 324.99 324.99 Fedders - EMC - Quatro JV
Joint VentureSales 842.19 (201.55)
Advance 1.33 1.33EMC East Asia Ltd
100% SubsidiaryInvestment - 4.06
Advance (2,646.97) (2,646.47)Tecnolines Singapore PTE Ltd.
100% SubsidiaryInvestment - 0.49
Advance 0.04 0.36CE Maschinenbau GmbH (Formerly named as MBE Cologne Engineering GmbH) 90% Subsidiary
Investment - 1,251.90 Advance 749.70 2,022.92Interest 273.40 -
Mr. Manoj Toshniwal Key Managerial Personnel
Salary 134.32 NIL Advance (50.00) (50.00)
Mr. Ramesh Ch.Bardia Key Managerial Personnel
Salary 134.47 NIL
Mr. Nikunj Toshniwal Rela ve of Key Managerial Personnel
Salary 27.16 NIL
Mr. Siddhartha Bardia Rela ve of Key Managerial Personnel
Salary 17.17 NIL
** Figures in Brackets indicate amounts payable to related par es
Amount (` in lacs) As at 31.03.16 As at 31.03.15
NOTE - 32 FINANCIAL HEDGING INSTRUMENTS
For hedging Currency Related Risks
- Forward Contracts - Outstanding Nominal Value 1,726.38 1,597.96
Figures for the previous year have been re-arranged and re-grouped wherever necessary.
Amount (` in lacs)

Annual Report 2015-16 Significant Accoun ng Policies
64
Note-33: Significant Accoun ng Policies forming part of Company’s Balance Sheet and Statement of Profit & Loss as at and for the year ended 31st March 2016
A) SIGNIFICANT ACCOUNTING POLICIES
i) Basis of Prepara on
The financial statements are prepared under the Historical cost conven on as on accrual basis of accoun ng in accordance with the Generally Accepted Accoun ng Principles, Accoun ng Standards no fied under Sce on 133 of the Companies Act, 2013 and the relavant provisions thereof.
ii) Revenue Recogni on
Revenue from sale of goods and services rendered is recognized upon transfer of tle and rendering of services to the customers.
iii) Fixed Assets
Fixed Assets are stated at cost of acquisi on inclusive of du es ( net of CENVAT/VAT), taxes, borrowing costs directly a ributable to acqusi on, incidental expenses and erec on / commissioning etc., upto the date, the asset is ready for its intended use.
iv) Impairment of Assets
The carrying amount of assets are reviewed at each balance sheet date to determine if there is any indica on of wherever the carrying amount of an asset exceeds it's recoverable amount which represents the impairment based on external/internal factor. An impairment loss is recognised greater of the net selling price and value in use of the assets. The es mated cash flows considered for determining the value in use, are discounted to the present value at weighted average cost of capital.
v) Foreign Currency Transac ons
a) Ini al Recogni on
Foreign currency transac ons are recorded in the repor ng currency, by applying to the foreign currency amount the exchange rate between the repor ng currency and the foreign currency at the date of the transac on.
b) Conversion
Foreign currency monetary items are reported using the closing rate. Non-monetary items which are carried in terms of historical cost denominated in a foreign currency are reported using the exchange rate at the date of the transac on; and non-monetary items which are carried at fair value or other similar valua on denominated in a foreign currency are reported using the exchange rates that existed when the values were determined.
c) Exchange Differences
Exchange differences arising on the se lement/conversion of monetary items are recognized as income or expenses in the year in which they arise.
The premium or discount arising at the incep on of forward exchange contracts is amor sed as expenses or income over the life of the respec ve contracts. Exchange differences on such contracts are recognised in the statement of profit and loss in the year in which the exchange rates change. Any profit or loss arising on cancella on or renewal of forward exchange contract is recognised as income or expense for the year.
vi) Deprecia on
a) Deprecia on on all Fixed Assets are calculated under Straight Line Method at the rates specified in Schedule II to the Companies Act, 2013
b) In case of impairment, if any, deprecia on is provided on the revised carrying amount of the assets over its remaining useful life.
c) Computer so ware costs capitalised are amor sed using the Straight Line Method over es mated useful life of 10 years, as es mated at the me of capitalisa on.
vii) Investments
Long term Investments are stated at Cost, short term investments are valued at cost or market price which ever is less
NOTE - 33

Significant Accoun ng Policies Annual Report 2015-16
65
viii) Inventories
Inventories are valued as under –
a) Raw materials, Stores spares, loose tools and Erec on materials materials are valued at cost
b) Cost of Semi Finished Goods and Finished Goods have been valued on Weighted Average basis.
c) Finished goods are stated at lower of Cost or Net Realisable Value
b) Saleable scraps, whose cost is not iden fiable, are valued at es mated realisable value.
ix) Research & Development
Research and development expenditure of revenue nature are charged to Statement of Profit & Loss.
x) Employee Benefits
i) Short term employee benefits are charged off at the undiscounted amount in the year in which the related services is rendered.
xi) Earning per Share
Basic earning per share is calculated by dividing the net Profit or Loss for the period a ributable to equity shareholders by the weighted average number of equity shares outstanding during the period.
For the purpose of calcula ng diluted earnings per share, the net profit or loss for the period a ributable to equity shareholders and the weighted average number of shares outstanding during the period are adjusted for the effects of all dilu ve poten al equity shares.
xii) Excise Duty and Custom Duty
Excise duty on finished goods stock lying at factories is accounted for at the point of manufacture of goods and accordingly, is considered for valua on of finished goods stock lying in the factories as on the Balance Sheet date. Similarly, Custom duty on imported material in transit / lying in bonded warehouse is accounted for at the me, the same are released from Customs/ Bonded warehouse.
Excise Duty pertaining to Sales is shown as a deduc on from Revenue and is included in the amount disclosed under Du es & Taxes (Note-19)
xiii) Borrowing Costs
Borrowing Costs rela ng to acquisi on / construc on of qualifying assets are capitalized un l the me all substan al ac vi es necessary to prepare the qualifying assets for their intended use are complete. A qualifying asset is one that necessarily takes substan al period of me to get ready for its intended use. All other borrowing costs are charged to revenue.
xiv) Taxa on
Tax expenses comprises of current and deferred tax. Current income tax is measured at the amount expected to be paid to the tax authori es in accordance with the Indian Income Tax Act, 1961. Deferred income taxes reflects the impact of current year ming differences between taxable income for the year and reversal of ming differences of earlier years.
The deferred tax for ming differences between the book and tax profits for the year is accounted for using the tax rates and laws that have been substan ally enacted as on the Balance Sheet date. Deferred tax assets are recognised only to the extent that there is reasonable certainty that sufficient future taxable income will be available against which such deferred tax assets can be realised. If the company has carry forward unabsorbed deprecia on and tax losses, deferred tax assets are recognised only to the extent there is virtual certainty supported by convincing evidence that sufficient taxable income will be available against which such deferred tax asset can be realized.
Reten on Money from Contractual revenue is offered to tax in the year of realisa on. However deferred tax liability is being created in the year of accrual of such income.
xv) Segment Repor ng
a) Iden fica on of segments
The company has iden fied its business segments as the primary segments . The company’s businesses are organized and managed separately according to the nature of products/ services, with each segment represen ng a strategic business unit that offers different product / services and serves different markets.

Annual Report 2015-16 Significant Accoun ng Policies
66
b) Alloca on of Common Costs
Common allocable costs are allocated to each segment on case to case basis applying the ra o, appropriate to each relevant case. Revenue and expenses, which relate to the enterprise as a whole and are not allocable to segment on a reasonable basis, have been included under the head “ Unallocated”.
xvi) Sales
Resul ng from the nature of business of the Company, bills rela ng to price varia on ,excess suplies and extra works etc. are raised by the Company on the basis of the terms of the contract and are accounted for in the books only a er the same has been accepted by the customers during the course or at the end of the contract. As such only those bills which are acceptable by the customers are accounted for in the books of accounts.
xvii) Provision, Con ngent Liabili es and Con ngent Assets
Provisions involving substan al degree of es ma on in measurement are recognised when there is a present obliga on as a result of past events and it is probable that there will be an ou low of resources. Con ngent Liabili es are not recognised but are disclosed in the notes. Con ngent Assets are neither recognised nor disclosed in the financial statements.
As per our Report of even date a achedFor SRB & AssociatesChartered Accountants Firm Regn No 310009E
Sanjeet PatraPartnerMembership No. - 056121Kolkata, The day of 31st August, 2016
For and on behalf of the Board
Manoj Toshniwal Ramesh Chandra Bardia Managing Director Jt. Managing Director
Arun Kumar Kedia Sumit Kumar Surana Chief Financial Officer Company Secretary
Yamini MoreVP (Finance & Accounts)

67
Annual Report 2015-16
ConsolidatedFinancialStatements
Table of contents:Independent Auditor's Report 68-71Conslidated Balance Sheet 72Consolidated Statement of Profit & Loss 73Consolidated Cash Flow Statement 74Notes on consolidated financial statements 75-92

Annual Report 2015-16 Independent Auditor's Report
68
To the members of EMC Limited
REPORT ON THE CONSOLIDATED FINANCIAL STATEMENTS
We have audited the accompanying consolidated financial statements of EMC Limited (hereina er referred to as “the Holding Company”) and its subsidiaries (together referred to as “the Group”) its comprising of the Consolidated Balance Sheet as at 31st March, 2016, the Consolidated Statement of Profit and Loss, the Consolidated Cash Flow Statement for the year then ended, and a summary of the significant accoun ng policies and other explanatory informa on (hereina er referred to as “the Consolidated Financial statements”).
MANAGEMENT’S RESPONSIBILITY FOR THE CONSOLIDATED FINANCIAL STATEMENTS
The Holding Company’s Board of Directors is responsible for the prepara on of these consolidated financial statements in terms of the requirements of the Companies Act, 2013 (hereina er referred to as ‘’the Act”) that give a true and fair view of the consolidated financial posi on, consolidated financial performance and consolidated cash flows of the Group in accordance with the accoun ng principles generally accepted in India, including the Accoun ng Standards specified under Sec on 133 of the Act, read with Rule 7 of the Companies (Accounts) Rules, 2014. The respec ve Board of Directors of the companies included in the Group are responsible for maintenance of adequate accoun ng records in accordance with the provisions of the Act for safeguarding the assets of the Group and for preven ng and detec ng frauds and other irregulari es, the selec on and applica on of appropriate accoun ng policies, making judgments and es mates that are reasonable and prudent, and the design, implementa on and maintenance of adequate internal financial controls, that were opera ng effec vely for ensuring the accuracy and completeness of the accoun ng records, relevant to the prepara on and presenta on of the financial statements that give a true and fair view and are free from material misstatement, whether due to fraud or error, which have been used for the purpose of prepara on of the consolidated financial statements by the Directors of the Holding Company, as aforesaid.
AUDITOR’S RESPONSIBILITY
Our responsibility is to express an opinion on these consolidated financial statements based on our audit.
While conduc ng the audit, we have taken into account the provisions of the Act, the accoun ng and audi ng standards and ma ers which are required to be included in the audit report under the provisions of the Act and the Rules made there under.
We conducted our audit in accordance with the Standards on Audi ng specified under Sec on 143(10) of the Act. Those Standards require that we comply with ethical requirements and plan and perform the audit to obtain reasonable assurance about whether the consolidated financial statements are free from material misstatement.
An audit involves performing procedures to obtain audit evidence about the amounts and the disclosures in the consolidated financial statements. The procedures selected depend on the auditor’s judgment, including the assessment of the risks of material misstatement of the consolidated financial statements, whether due to fraud or error. In making those risk assessments, the auditor considers internal financial control relevant to the Holding Company’s prepara on of the consolidated financial statements that give a true and fair view in order to design audit procedures that are appropriate in the circumstances. An audit also includes evalua ng the appropriateness of the accoun ng policies used and the reasonableness of the accoun ng es mates made by the Holding Company’s Board of Directors, as well as evalua ng the overall presenta on of the consolidated financial statements.
We believe that the audit evidence obtained by us and the audit evidence obtained by the other auditors in terms of their reports referred to in sub-paragraph (a) of the Other Ma ers paragraph below, are sufficient and appropriate to provide a basis for our audit opinion on the consolidated financial statements.
OPINION
In our opinion and to the best of our informa on and according to the explana ons given to us, the aforesaid consolidated financial statements give the informa on required by the Act in the manner so required and give a true and fair view in conformity with the accoun ng principles generally accepted in India, of the consolidated state of affairs of the Group, as at 31st March, 2016, and their consolidated profit and their consolidated cash flows for the year ended on that date.
OTHER MATTERS
(a) We did not audit the financial statements / financial informa on of eleven subsidiaries, whose financial statements / financial informa on reflect total assets of Rs. 6,46,30,02,902 as at 31st March, 2016, total revenues of Rs. 8,46,09,68,457 and net cash flows amoun ng to Rs. 28,31,94,755 for the year ended on that date, as considered in the consolidated financial statements. These financial statements / financial informa on have been audited by other auditors whose reports have been furnished to us by the Management and our opinion on the consolidated financial statements, in so far as it relates to the amounts and disclosures included in respect of these subsidiaries, and our report in terms of sub-sec ons (3) and (11) of Sec on 143 of the Act, insofar as it relates to the aforesaid subsidiaries, is based solely on the reports of the other auditors.

Independent Auditor's Report Annual Report 2015-16
69
(b) Consolidated financial statements and other financial informa on includes the Company’s propor onate share in four jointly controlled companies total assets of Rs.23,43,27,502 as at 31st March, 2016, total revenues of Rs. 66,21,44,406 and net cash flows amoun ng to Rs. 3,34,22,789 for the year ended on that date, as considered in the consolidated financial statements. These financial statements/financial informa on have been audited by other auditors whose reports have been furnished to us by the Management.
(c) The financial statements/financial informa on of one Jointly Controlled Company out of five Jointly Controlled Companies have not been audited by any auditors whose reports have been furnished to us by the management. The financial statements/ financial informa on reflect total assets of Rs. 4,29,83,496 as at 31st March, 2016 for the year ended on that date, as considered in the consolidated financial statements.
(d) The financial statements/financial informa on of four subsidiaries out of fi een subsidiaries have not been audited by any auditors whose reports have been furnished to us by the management. The financial statements / financial informa on reflect total assets of Rs. 3,30,50,73,583 as at 31st March, 2016, total revenues of Rs. 2,50,73,56,801 and net cash flows amoun ng to Rs. 6,04,10,480/- for the year ended on that date, as considered in the consolidated financial statements.
Our opinion on the consolidated financial statements, and our report on Other Legal and Regulatory Requirements below, is not modified in respect of the above ma ers with respect to our reliance on work done and the reports of the other auditors and the financial statement/ financial informa on cer fied by the management.
REPORT ON OTHER LEGAL AND REGULATORY REQUIREMENTS
1. As required by Sec on143 (3) of the Act, we report, to the extent applicable, that:
(a) We have sought and obtained all the informa on and explana ons which to the best of our knowledge and belief were necessary for the purposes of our audit of the aforesaid consolidated financial statements.
(b) In our opinion, proper books of account as required by law rela ng to prepara on of the aforesaid consolidated financial statements have been kept so far as it appears from our examina on of those books and the reports of the other auditors.
(c) The Consolidated Balance Sheet, the Consolidated Statement of Profit and Loss, and the Consolidated Cash Flow Statement dealt with by this Report are in agreement with the relevant books of account maintained for the purpose of prepara on of the consolidate financial statements.
(d) In our opinion, the aforesaid consolidated financial statements comply with the Accoun ng Standards specified under Sec on 133 of the Act, read with Rule 7 of the Companies (Accounts) Rules, 2014
(e) On the basis of the wri en representa ons received from the Directors of the Holding Company as on 31st March, 2016 taken on record by the Board of Directors of the Holding Company and the reports of the statutory auditors of its subsidiary companies incorporated in India, none of the Directors of the Group companies, incorporated in India is disqualified as on 31st March, 2016 from being appointed as a Director in terms of Sec on 164 (2) of the Act.
(f) With respect to the adequacy of the internal financial controls over financial repor ng of the Company and the opera ng effec veness of such controls, refer to our separate Report in ‘Annexure A’;
(g) With respect to the other ma ers to be included in the Auditor’s Report in accordance with Rule 11 of the Companies (Audit and Auditor’s) Rules, 2014, in our opinion and to the best of our informa on and according to the explana ons given to us:
i. The Company has disclosed the impact of pending li ga ons on its financial posi on in its financial statements (Refer Note-29 on Consolidated Financial statements).
ii. The Group did not have any material foreseeable losses on long-term contracts including deriva ve contracts.
iii. There were no amounts which were required to be transferred to the Investor Educa on and Protec on Fund by the Holding Company, and its subsidiary companies incorporated in India.
For SRB & AssociatesChartered Accountants
Firm Registra on: No-310009E
Sanjeet PatraKolkata Partner31st August 2016 Membership No: 056121

Annual Report 2015-16 Annexure - A to the Independent Auditor's Report
70
(Referred to in paragraph 1 (f) under ‘Report on Other Legal and Regulatory Requirements’ sec on of our report of even date)
REPORT ON THE INTERNAL FINANCIAL CONTROLS UNDER CLAUSE (I) OF SUB-SECTION 3 OF SECTION 143 OF THE COMPANIES ACT, 2013 (“THE ACT”)
We have audited the internal financial controls over financial repor ng of EMC Limited (“the Holding Company”) as of March 31, 2016 in conjunc on with our audit of the consolidated financial statements of the Company for the year ended on that date.
MANAGEMENT’S RESPONSIBILITY FOR INTERNAL FINANCIAL CONTROLS
The Holding Company’s management is responsible for establishing and maintaining internal financial controls based on the internal control over financial repor ng criteria established by the Holding Company considering the essen al components of internal control stated in the guidance note on audit of internal financial controls over financial repor ng issued by the Ins tute of Chartered Accountants of India (‘ICAI’). These responsibili es include the design, implementa on and maintenance of adequate internal financial controls that were opera ng effec vely for ensuring the orderly and efficient conduct of its business, including adherence to Holding Company’s policies, the safeguarding of its assets, the preven on and detec on of frauds and errors, the accuracy and completeness of the accoun ng records, and the mely prepara on of reliable financial informa on, as required under the Companies Act, 2013.
AUDITORS’ RESPONSIBILITY
Our responsibility is to express an opinion on the Holding Company’s internal financial controls over financial repor ng based on our audit. We conducted our audit in accordance with the guidance note on audit of internal financial controls over financial repor ng (the ‘Guidance Note’) and the standards on audi ng (the ‘Standards’) issued by ICAI and deemed to be prescribed under sec on 143 (10) of the Companies Act, 2013, to the extent applicable to an audit of internal financial controls. Those Standards and the Guidance Note require that we comply with ethical requirements and plan and perform the audit to obtain reasonable assurance about whether adequate internal financial controls over financial repor ng was established and maintained and if such controls operated effec vely in all material respects.
Our audit involves performing procedures to obtain audit evidence about the adequacy of the internal financial controls system over financial repor ng and their opera ng effec veness. Our audit of internal financial controls over financial repor ng included obtaining an understanding of internal financial controls over financial repor ng, assessing the risk that a material weakness exists, and tes ng and evalua ng the design and opera ng effec veness of internal control based on the assessed risk. The procedures selected depend on the auditor’s judgment, including the assessment of the risks of material misstatement of the financial statements, whether due to fraud or error.
We believe that the audit evidence we have obtained is sufficient and appropriate to provide a basis for our audit opinion on the Holding Company’s internal financial controls over financial repor ng.
MEANING OF INTERNAL FINANCIAL CONTROLS OVER FINANCIAL REPORTING
A company's internal financial control over financial repor ng is a process designed to provide reasonable assurance regarding the reliability of financial repor ng and the prepara on of financial statements for external purposes in accordance with generally accepted accoun ng principles. A company's internal financial control over financial repor ng includes those policies and procedures that (i) pertain to the maintenance of records that, in reasonable detail, accurately and fairly reflect the transac ons and disposi ons of the assets of the company; (ii) provide reasonable assurance that transac ons are recorded as necessary to permit prepara on of financial statements in accordance with generally accepted accoun ng principles, and that receipts and expenditures of the company are being made only in accordance with authoriza ons of management and Directors of the Company; and (iii) provide reasonable assurance regarding preven on or mely detec on of unauthorized acquisi on, use, or disposi on of the company's assets that could have a material effect on the financial statements.
INHERENT LIMITATIONS OF INTERNAL FINANCIAL CONTROLS OVER FINANCIAL REPORTING
Because of the inherent limita ons of internal financial controls over financial repor ng, including the possibility of collusion or improper management override of controls, material misstatements due to error or fraud may occur and not be detected. Also, projec ons of any evalua on of the internal financial controls over financial repor ng to future periods are subject to the risk that the internal financial control over financial repor ng may become inadequate because of changes condi ons, or that the degree of compliance with the policies or procedures may deteriorate.
OPINION
In our opinion, the Holding Company has, in all material respects, an adequate internal financial controls over financial repor ng and such internal financial controls over financial repor ng were opera ng effec vely as at March 31, 2016, based on the internal control over financial repor ng criteria established by the Holding Company considering the essen al components of internal control stated in the guidance note issued by the Ins tute of Chartered Accountant of India.

Annexure - A to the Independent Auditor's Report Annual Report 2015-16
71
OTHER MATTERS
Our aforesaid report under sec on 143(3)(1) of the Act on the adequacy and opera ng effec veness of the Internal Financial Control Over Financial Repor ng insofar as it relates to 8 Subsidiary Companies & 4 Joint Ventures, which are companies incorporated in India. Our opinion is not qualified in respect of this ma er.
For SRB & AssociatesChartered Accountants
Firm Registra on: No-310009E
Sanjeet PatraKolkata Partner31st August 2016 Membership No: 056121

Annual Report 2015-16 Significant Accoun ng PoliciesAnnual Report 2015-16 Consolidated Balance Sheet as at 31st March, 2016
72
(`)NoteNo.
As at31.03.2016
As at31.03.2015
I. EQUITY & LIABILITIES
1 SHAREHOLDER'S FUNDS
a) Share capital 1 47,00,00,000 37,00,00,000
b) Share applica on Money - 1,25,00,00,000
c) Reserves & Surplus 2 8,39,46,75,009 8,86,46,75,009 5,11,67,79,810 6,73,67,79,810
2 MINORITY INTEREST 4,04,03,968 2,18,17,237
3 NON-CURRENT LIABILITIES
a) Long term Borrowings 3 6,29,39,53,128 4,23,18,75,027
b) Deferred Tax Liabili es (Net) 4 1,30,85,58,348 14,67,00,232
c) Other Long term Liabili es 5 49,37,56,813 8,09,62,68,289 57,72,50,781 4,95,58,26,040
4 CURRENT LIABILITIES
a) Short term borrowings 6 9,26,78,77,895 7,10,20,31,688
b) Trade Payables 7 18,20,27,50,667 13,79,97,56,104
c) Other current Liabili es 8 1,95,56,75,424 96,33,44,625
d) Short term Provisions 9 5,79,12,919 29,48,42,16,905 69,22,17,933 22,55,73,50,350
46,48,55,64,172 34,27,17,73,437
II. ASSETS
5 NON-CURRENT ASSETS
a) Fixed Assets :- 10
(i) Tangible Asstes 2,53,32,08,770 2,62,56,01,612
(ii) Intangible Assets 53,43,93,988 19,61,80,372
(iii) Capital work-in-progress 5,52,99,513 36,48,96,499
b) Goodwill on Consolida on 34,56,44,079 31,24,07,837
c) Non-current Investments 11 1,42,91,42,920 3,74,020
d) Long term Loans & Advances 12 34,71,46,979 9,68,82,222
e) Other non-current Assets 13 43,08,21,330 5,67,56,57,579 31,90,46,962 3,91,53,89,524
6 CURRENT ASSETS
a) Inventories 14 1,77,14,22,998 1,69,88,78,731
b) Trade Receivables 15 23,77,51,86,798 16,98,87,65,110
c) Cash and cash Equivalents 16 1,83,15,98,294 1,22,69,85,664
d) Short term Loans & Advances 17 12,96,14,24,227 10,11,08,66,414
e) Other Current Assets 18 47,02,74,276 40,80,99,06,593 33,08,87,994 30,35,63,83,912
46,48,55,64,172 34,27,17,73,437
Significant Accoun ng Policies & Notes on Financial Statements
1 to 34
As per our Report of even date a achedFor SRB & AssociatesChartered Accountants (Firm Regn No 310009E)
Sanjeet Patra(Partner)Membership No. - 056121Kolkata, The day of 31st August, 2016
For and on behalf of the Board
Manoj Toshniwal Ramesh Chandra Bardia Managing Director Jt. Managing Director
Arun Kumar Kedia Sumit Kumar Surana Chief Financial Officer Company Secretary
Yamini MoreVP (Finance & Accounts)

Consolidated Statement of Profit & Loss for the year ended 31st March, 2016 Annual Report 2015-16
73
(`)Note No.
For the Year Ended 31.03.2016
For the Year Ended 31.03.2015
I. INCOMERevenue From Opera ons 19 51,75,97,12,923 45,15,44,18,101
Other Income 20 36,80,01,340 18,30,45,739 Total 52,12,77,14,263 45,33,74,63,840
II EXPENDITURECost of Materials Consumed 21 39,46,96,15,368 35,85,34,23,647 Change in inventories of Finished goods work-in-progress and Stock-in Trade
22 4,21,97,512 (39,76,48,160)
Employee benefits Expense 23 1,46,75,52,994 1,34,68,42,334 Finance Costs 24 1,89,63,62,446 1,23,75,46,930 Deprecia on and Ammor sa on 25 28,14,21,805 25,08,34,977 Other Expenses 26 6,22,65,52,912 4,84,35,47,313 Total 49,38,37,03,037 43,13,45,47,040 Profit before Excep onal, Extraordinary items and Taxa on
2,74,40,11,226 2,20,29,16,800
Add/Less: Excep onal Items - - Profit before Extraordinary items and Taxa on 2,74,40,11,226 2,20,29,16,800 Add/Less: Extraordinary Items - - Profit before Taxa on from con nuing opera ons 2,74,40,11,226 2,20,29,16,800 Tax Expenses: - - - Current Tax (MAT/IT)
[Includes share of Joint Venture ` 1,11,24,906/- (PY - ` 62,26,284/-)]
21,17,20,648 69,83,19,057
Tax adjustment of an earlier year (67,47,019) (7,581)Interest on Income tax - 8,11,56,762
- Deferred Tax (Expense)/Benefit-for Current Year 68,40,89,440 88,90,63,069 2,25,51,103 80,20,19,341 Profit a er Taxa on from con nuing opera ons for the year
1,85,49,48,157 1,40,08,97,459
- Deferred Tax (Expense)/Benefit-for Earlier Years 3,16,333 -(A) Profit a er Taxa on from con nuing opera ons 1,85,49,48,157 1,40,05,81,126
Profit before Taxa on from discon nuing opera ons - - Less: Tax Expense for discon nuing opera ons - -
(B) Profit a er Taxa on from discon nuing opera ons - - Profit a er Taxa on for the period (A+B) ( before adjustment for Minority Interest)
1,85,49,48,157 1,40,05,81,126
Add- Share of (Profit) transferred for Minority Interest) 13,66,677 9,68,740 Profit a er Taxa on for the period (a er adjustment for Minority Interest)
1,85,63,14,834 1,40,15,49,866
Earnings per Equity Share (Face Value of ) 27- Basic 40.80 37.88 - Diluted 40.80 37.88
Significant Accoun ng Policies & Notes on Financial Statements
1 to 34
As per our Report of even date a achedFor SRB & AssociatesChartered Accountants (Firm Regn No 310009E)
Sanjeet Patra(Partner)Membership No. - 056121Kolkata, The day of 31st August, 2016
For and on behalf of the Board
Manoj Toshniwal Ramesh Chandra Bardia Managing Director Jt. Managing Director
Arun Kumar Kedia Sumit Kumar Surana Chief Financial Officer Company Secretary
Yamini MoreVP (Finance & Accounts)

Annual Report 2015-16 Significant Accoun ng PoliciesAnnual Report 2015-16 Consolidated Cash Flow Statement for the year ended 31st March, 2016
74
(`) For the Year Ended
31.03.2016 For the Year Ended
31.03.2015A. CASH FLOW FROM OPERATING ACTIVITIES
Net Profit before Tax as per Profit and Loss Account 2,74,40,11,226 2,20,29,16,800 Adjusted for:Deprecia on/Amor sa on 28,14,21,805 25,22,98,968 Interest on Fixed Deposit (9,72,81,486) (9,29,25,082)Interest Expenses-Financial Cost 1,89,63,62,446 1,23,75,46,930 Profit on sale of Fixed Assets - - Opera ng Profit Before Working Capital Changes: 4,82,45,13,991 3,59,98,37,616 Adjusted for (Increase (-)/Decrease(+)) in:Inventories (7,25,44,267) (40,35,82,661)Sundry Debtors (6,83,58,32,538) (5,75,45,18,213)Loans and Advances and other assets (3,33,58,08,612) (3,65,78,26,619)Current Liabili es and Provisions 5,22,97,40,244 3,45,23,86,810
(5,01,44,45,174) (6,36,35,40,684)Cash Flow From Opera ng Ac vi es before Tax Payments (18,99,31,183) (2,76,37,03,068)Taxes Paid (34,54,13,545) (72,85,48,551)Cash Flow From Opera ng Ac vi es (A) (53,53,44,728) (3,49,22,51,619)
B. CASH FLOW FROM INVESTING ACTIVITIESFixed Asset Purchased (21,76,88,551) (78,70,71,327)Proceeds from Sale of Fixed Assets 26,624 Investment (1,42,87,68,900) 4,75,000 Sale of Current Investment - - Interest on Fixed Deposit 9,72,81,486 9,29,25,082 Cash Flow From Inves ng Ac vi es (B) (1,54,91,75,965) (69,36,44,621)
C. CASH FLOW FROM FINANCING ACTIVITIES Proceeds from Short Term Borrowings 1,75,20,26,201 2,63,14,88,706 Increase in Capital and Reserves 31,98,60,764 1,21,72,20,284 Proceeds from Long Term Borrowings 2,55,81,41,133 1,67,91,36,525 Interest Paid (1,89,63,62,446) (1,23,75,46,930)Dividend paid Including Tax (4,45,32,329) (4,32,88,150)Cash Flow From Financing Ac vi es (C) 2,68,91,33,323 4,24,70,10,435 Net Increase(+)/Decrease(-) in Cash and Cash Equivalents (A+B+C) 60,46,12,630 6,11,14,195 Opening Balance of Cash and Cash Equivalents 1,22,69,85,664 1,16,58,71,468 Closing Balance of Cash and Cash Equivalents 1,83,15,98,293 1,22,69,85,663 Notes:1. All figures in brackets are ou low.2. Cash and Cash Equivalent is as per Balance Sheet.
As per our Report of even date a achedFor SRB & AssociatesChartered Accountants (Firm Regn No 310009E)
Sanjeet Patra(Partner)Membership No. - 056121Kolkata, The day of 31st August, 2016
For and on behalf of the Board
Manoj Toshniwal Ramesh Chandra Bardia Managing Director Jt. Managing Director
Arun Kumar Kedia Sumit Kumar Surana Chief Financial Officer Company Secretary
Yamini MoreVP (Finance & Accounts)

Notes on Consolidated Financial Statements for the year ended 31st March, 2016 Annual Report 2015-16
75
(`) As at 31.03.2016 As at 31.03.2015
NOTE - 1 SHARE CAPITALAuthorised7,50,00,000 Equity Shares of ` 10/-each 75,00,00,000 75,00,00,000
75,00,00,000 75,00,00,000 Issued, Subscribed and Paid-up4,70,00,000 Equity Shares of ` 10/- each fully paid-up 47,00,00,000 37,00,00,000
47,00,00,000 37,00,00,000
Reconcilia on of the no.of shares outstanding at the beginning and at the end of the yearNumber of Shares
As at 31.03.2016 As at 31.03.2015Number of shares outstanding at the beginning of the year 3,70,00,000 3,70,00,000 Add: Arising out of shares issued during the year 1,00,00,000
4,70,00,000 3,70,00,000 Less: Shares forfeited/brought back/cancelled during the year - - Number of shares outstanding at the end of the year 4,70,00,000 3,70,00,000
47,00,00,000 37,00,00,000
Note: Details of changes in Share Capital :- a) of the above share 4,32,51,180 shares are allo ed as fully paid-up for payment in Cash.b) of the above shares 48,000 shares are allo ed as fully paid up pursuant to a contract without payments received in cash.c) of the above shares 6,90,000 shares are allo ed as fully paid up by way of bonus shares by capitaliza on of General Reserves.d) of the above 10,820 shares are allo ed as fully paid upon cancella on and conversion of 1082 cumula ve preference shares of
` 100/- each fully paid up. e) of the above 30,00,000 shares are allo ed fully paid upon cancella on and conversion of 30,00,000 non cumula ve redeemable
preference shares of ` 10/- each. f) Number of shares held by each share holder holding more than 5% shares in the company are as follows:
Par culars Number of Shares % of Shareholding
As at 31.03.2016
As at 31.03.2015
As at 31.03.2016
As at 31.03.2015
Equity Shares:i) MKN Investment Pvt. Ltd. 1,40,00,314 40,00,014 29.79 10.81
ii) YMS Finance Pvt. Ltd. (Formerly, Pyramid Sales Pvt. Ltd.) 60,40,001 60,40,001 12.85 16.32 iii) Trinetra Electronics Ltd. 24,48,528 24,48,528 5.21 6.62 iv) Tamkore Investment Pvt. Ltd. 24,00,000 24,00,000 5.11 6.49 v) Metalind Private Ltd. 28,50,000 28,50,000 6.06 7.70
vi) Subhas Impex Pvt. Ltd. 34,53,252 34,53,252 7.35 9.33 vii) Vinod Dugar 43,18,624 43,18,624 9.19 11.67
viii) Sheetal Dugar 44,29,145 44,29,145 9.42 11.97 ix) Ramesh Chandra Bardia 11,09,089 19,09,089 2.36 5.16 x) Statefield Trade Link Pvt. Ltd. 18,69,425 18,69,425 3.98 5.05

Annual Report 2015-16 Significant Accoun ng PoliciesAnnual Report 2015-16 Notes on Consolidated Financial Statements for the year ended 31st March, 2016
76
(`) As at 31.03.2016 As at 31.03.2015
NOTE - 2 RESERVE & SURPLUSCapital ReservesAs per last Balance Sheet 32,95,617 32,95,617Exchange Fluctua on ReserveAs per last Balance Sheet (5,60,32,526) 1,89,30,578 Add - During the year 15,19,24,038 9,58,91,512 (7,49,63,103) (5,60,32,526)Revalua on ReservesAs per last Balance Sheet 27,50,271 41,87,637 Less : Transferred to Deprecia on Account 42,958 27,07,313 14,37,366 27,50,271 Statutory & Other ReservesAs per last Balance Sheet 12,77,98,032 6,35,06,572 Add - During the year (1,15,67,159) 11,62,30,873 6,42,91,460 12,77,98,032 Securi es Premium AccountAs per last Balance Sheet 73,00,00,000 73,00,00,000 Add: Premium on Shares issued during the year 1,15,00,00,000 1,88,00,00,000 - 73,00,00,000 Forfeiture Reserve AccountAs per last Balance Sheet 51,250 51,250SurplusAs per last Balance Sheet 4,10,00,41,984 2,95,67,32,214 Add: Profit a er tax earned during the period 1,60,95,36,422 1,19,62,23,999 Less - Adjustment During the year (15,72,96,369)Less - Transferred to Statutory Reserve (1,15,67,159) 83,81,899 Less: Proposed Dividend 2,35,00,000 3,70,00,000 Less: Dividend Distribu on Tax 46,49,526 5,85,02,92,408 75,32,329 4,10,00,41,984
7,94,84,68,973 4,90,79,04,629 Surplus Brought Forward for Joint Ventures 20,88,75,181 35,49,314 Share of Joint Venture - Note no 32.2 23,73,30,855 20,53,25,867
8,39,46,75,009 5,11,67,79,810
As at 31.03.2016 As at 31.03.2015NOTE - 3 LONG TERM BORROWINGS(i) Term Loan
SecuredFrom Banks 1,12,95,65,587 80,10,77,336 From Others (IRD. Govt. of W.B) 5,54,84,361 6,04,84,361 UnsecuredFrom Banks 33,32,00,000 - From Others 2,47,24,63,768 2,10,00,00,000
(ii) Car LoanSecuredFrom Banks 4,07,020 20,21,016
(iii) Other Loans & Advances 2,30,28,32,392 1,26,82,92,314 6,29,39,53,128 4,23,18,75,027

Notes on Consolidated Financial Statements for the year ended 31st March, 2016 Annual Report 2015-16
77
(`) As at 31.03.2016 As at 31.03.2015
NOTE - 4 DEFERRED TAX LIABILITIES (NET)Opening Balance 14,67,00,232 12,41,49,129 Add - Adjustment for current year 70,24,86,162 84,91,86,394 2,25,51,103 14,67,00,232 Add - Adjustment for previous years 45,93,71,954 Closing Balance 1,30,85,58,348 14,67,00,232
As at 31.03.2016 As at 31.03.2015NOTE - 5 OTHER LONG TERM LIABILITIES
Trade Payables (payable beyond 12 months) 48,29,85,462 57,33,14,877 Other Liabili es 1,07,71,351 39,35,904
49,37,56,813 57,72,50,781
As at 31.03.2016 As at 31.03.2015NOTE - 6 SHORT TERM BORROWINGS
i) Working Capital Loan - Secured From Banks - repayable on demand 7,86,76,06,532 6,11,55,80,331 ii) Other Loans & Advances 1,40,02,71,363 98,64,51,357
9,26,78,77,895 7,10,20,31,688 NOTE - 6.1 Working Capital Facili es are secured by way of : 1 Hypotheca on on Pari Passu basis with the Working Capital Banks of the Company on the en re Stock in Trade, Book Debts and
any other current assets of the company, both present and future.2 First charge on the en re immovable and movable Fixed Assets of the Company and equitable mortgage on Landed proper es of
the Company at Naini (Allahabad) excluding OBC's share on Solar Power equipments and equipment purchased through equipment loan present and future.
3 Personal guarantees of some of the Directors of the Company. As at 31.03.2016 As at 31.03.2015
NOTE - 7 TRADE PAYABLESSundry Creditors for goods & expenses 18,16,30,70,573 13,74,41,14,516
18,16,30,70,573 13,74,41,14,516 Share of Joint Venture - Note no 32.2 3,96,80,094 5,56,41,588
18,20,27,50,667 13,79,97,56,104
NOTE - 3.11 Term Loans from Punjab Na onal Bank and Oriental Bank of Commerce are secured by way of crea on of charge ranking Parri Passu
on the Fixed Assets of Solar Power Project and all other exis ng and future movable and immovable assets of the company. The loans are further secured by personal guarantees of some of the Directors of the Company.
2 Term Loans from Punjab Na onal Bank & Oriental Bank of Commerce are Repayable over 44 Quarterly Installments commencing from the quarter ending October 2012 and bears an Interest rate of BR + 2.5% from PNB & BR + 2.25% from OBC.
3 The Term Loan under Equipment Finance arrangement is repayable in 10 quarterly installments star ng from Quarter ending September, 2014.
4 Loan from Govt. of West Bengal is secured by way of Pari Passu charge ranking next only to the charges in favour of financial ins tu ons / Banks, on the fixed assets of the company, both present as well as future. The Loan is repayable in fourteen equal annual installments (excluding interest) star ng from 31st March, 2013.The Loan carries interest of 8.75% p.a. with a rebate of 2% p.a for mely repayment. Interest is paid as and when due.
5 Vehicle loans are secured by way of mortgage of vehicles. The loans are repayable by 2017-18.6 Term Loan from Karur Vysya Bank is secured by way of crea on of Mortage on the commercial space being purchased by the
company. The loans are further secured by personal guarantees of some of the Directors of the Company. The loan is repayable in 19 quarterly instalments commencing from quarter ending March'16 and bears an interest rate of BR + 2.25%
7 Other Loans & Advances includes advances from par es 8 Unsecured Term Loan from others (to the tune of ̀ 210 crores) was taken during the year, its repayment is star ng from the quarter
ending June 2016-2017 and bears an interest rate of BR + 3.00% 9 Unsecured Term Loan from banks (to the tune of ` 50 crores) was taken during the year, its repayment is star ng from the quarter
ending June 2016-2017 and bears an interest rate of BR + 2.30% 10 Foreign term loans related to foreign subsidiaries are secured by the guarantees given by Holding Company.
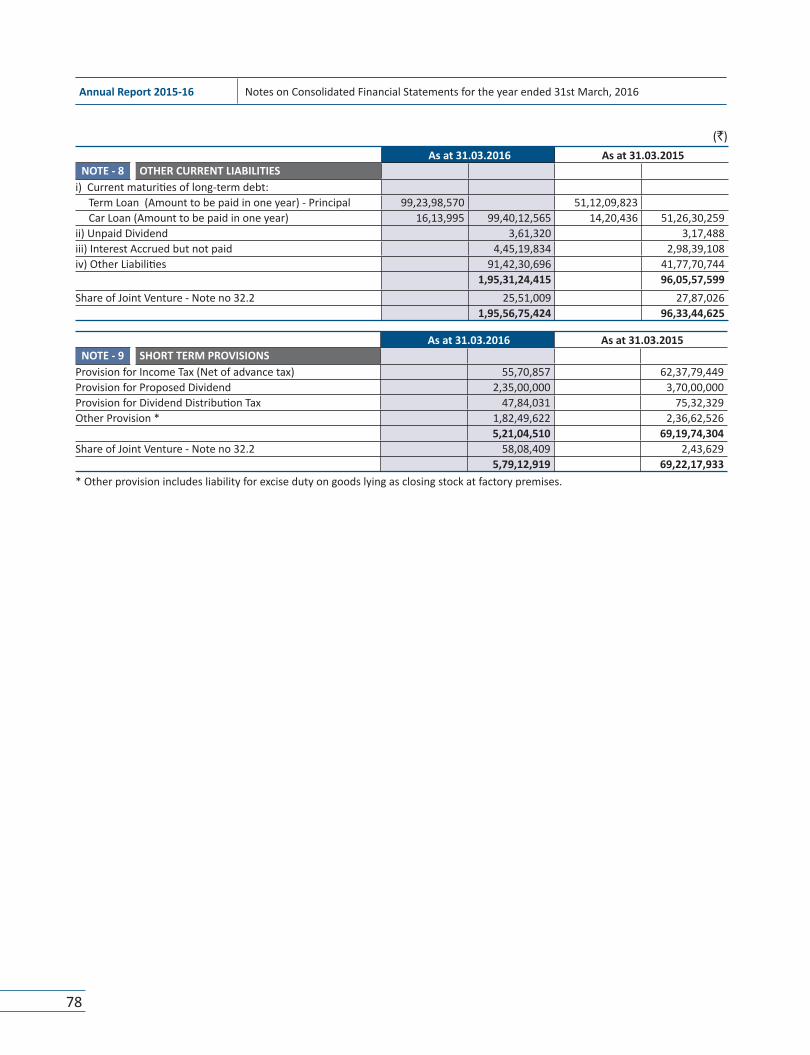
Annual Report 2015-16 Significant Accoun ng PoliciesAnnual Report 2015-16 Notes on Consolidated Financial Statements for the year ended 31st March, 2016
78
(`) As at 31.03.2016 As at 31.03.2015
NOTE - 8 OTHER CURRENT LIABILITIESi) Current maturi es of long-term debt:
Term Loan (Amount to be paid in one year) - Principal 99,23,98,570 51,12,09,823 Car Loan (Amount to be paid in one year) 16,13,995 99,40,12,565 14,20,436 51,26,30,259
ii) Unpaid Dividend 3,61,320 3,17,488 iii) Interest Accrued but not paid 4,45,19,834 2,98,39,108 iv) Other Liabili es 91,42,30,696 41,77,70,744
1,95,31,24,415 96,05,57,599 Share of Joint Venture - Note no 32.2 25,51,009 27,87,026
1,95,56,75,424 96,33,44,625
As at 31.03.2016 As at 31.03.2015NOTE - 9 SHORT TERM PROVISIONS
Provision for Income Tax (Net of advance tax) 55,70,857 62,37,79,449 Provision for Proposed Dividend 2,35,00,000 3,70,00,000 Provision for Dividend Distribu on Tax 47,84,031 75,32,329 Other Provision * 1,82,49,622 2,36,62,526
5,21,04,510 69,19,74,304 Share of Joint Venture - Note no 32.2 58,08,409 2,43,629
5,79,12,919 69,22,17,933 * Other provision includes liability for excise duty on goods lying as closing stock at factory premises.

Notes on Consolidated Financial Statements for the year ended 31st March, 2016 Annual Report 2015-16
79
(`)
NO
TE -
10FI
XED
ASS
ETS
Par
cular
of A
sset
s
GRO
SS B
LOCK
D
EPRE
CIAT
ION
NET
BLO
CK
Gro
ss B
lock
as
on
01
.04.
2015
Add
ion
d
urin
g the
ye
ar
Sale
/Adj
ustm
ents
d
urin
g the
year
G
ross
Blo
ck
as o
n
31.0
3.20
16
Acc
umul
ated
D
epre
ciaon
up
to
01.0
4.20
15
Dep
recia
on
dur
ing t
he
year
Ded
ucon
/ A
djus
tmen
t d
urin
g the
ye
ar
Acc
umul
ated
D
epre
ciaon
up
to
31.0
3.20
16
As a
t
31.0
3.20
16
As a
t 31
.03.
2015
TANG
IABL
E ASS
ETS (
A)
FREE
HOLD
LAND
6,70
,45,
738
83,8
9,29
4 -
7,54
,35,
032
1,99
,728
1,
88,9
37
- 3,
88,6
65
7,50
,46,
367
6,68
,46,
010
BUILD
INDG
& ST
RUCT
URES
49,4
1,44
,038
2,
31,9
8,75
9 (3
,63,
47,3
63)
55,3
6,90
,160
12
,87,
03,1
22
2,03
,90,
599
(98,
09,5
38)
15,8
9,03
,259
39
,47,
86,9
01
36,5
4,40
,916
PLAN
T & M
ACHI
NERY
2,61
,93,
54,9
10
2,09
,92,
442
(2,5
8,05
,989
) 2,
66,6
1,53
,341
78
,35,
78,2
72
18,1
1,22
,842
96
,47,
01,1
14
1,70
,14,5
2,22
7 1,
83,5
7,76
,638
VEHI
CLES
2,58
,56,
710
81,7
4,63
9 -
3,40
,31,
349
1,24
,89,
990
32,6
0,63
4 1,
57,5
0,62
4 1,
82,8
0,72
5 1,
33,6
6,72
0
FURN
ITURE
, FIX
TURE
&
EQUI
PMEN
T & C
OMPU
TER
55,4
1,11
,964
1,
97,9
7,25
8 (3
,80,
74,7
77)
61,1
9,83
,999
20
,99,
40,6
36
5,21
,66,
331
(62,
34,4
82)
26,8
3,41
,449
34
,36,
42,5
50
34,41
,71,
328
TOTA
L (A)
3,76
,05,
13,3
60
8,05
,52,
392
(10,
02,2
8,12
9) 3,
94,1
2,93
,881
1,
13,4
9,11
,748
25
,71,
29,3
43
(1,6
0,44
,020
) 1,
40,8
0,85
,111
2,
53,3
2,08
,770
2,
62,5
6,01
,612
INTA
NGIB
LE A
SSET
S (B)
COM
PUTE
R SO
FTW
ARE,
LICEN
CES F
OR SO
FTW
ARE
25,4
4,89
,010
35
,87,
35,5
99
(1,0
3,09
,603
) 62
,35,
34,2
12
5,83
,08,
638
2,43
,35,
420
(64,
96,1
66)
8,91
,40,
224
53,4
3,93
,988
19
,61,8
0,37
2
TOTA
L (A+
B) 4,
01,5
0,02
,370
43
,92,
87,9
91
(11,
05,3
7,73
2) 4,
56,4
8,28
,093
1,
19,3
2,20
,386
28
,14,
64,7
63
(2,2
5,40
,186
) 1,
49,7
2,25
,335
3,
06,7
6,02
,758
2,
82,1
7,81
,984
PREV
IOUS
YEAR
3,43
,81,
81,8
86
64,0
4,33
,130
6,
36,1
2,64
6 4,
01,5
0,02
,370
78
,91,
96,4
52
25,2
2,72
,343
(1
5,17
,51,
591)
1,19
,32,
20,38
6 2,
82,1
7,81
,984
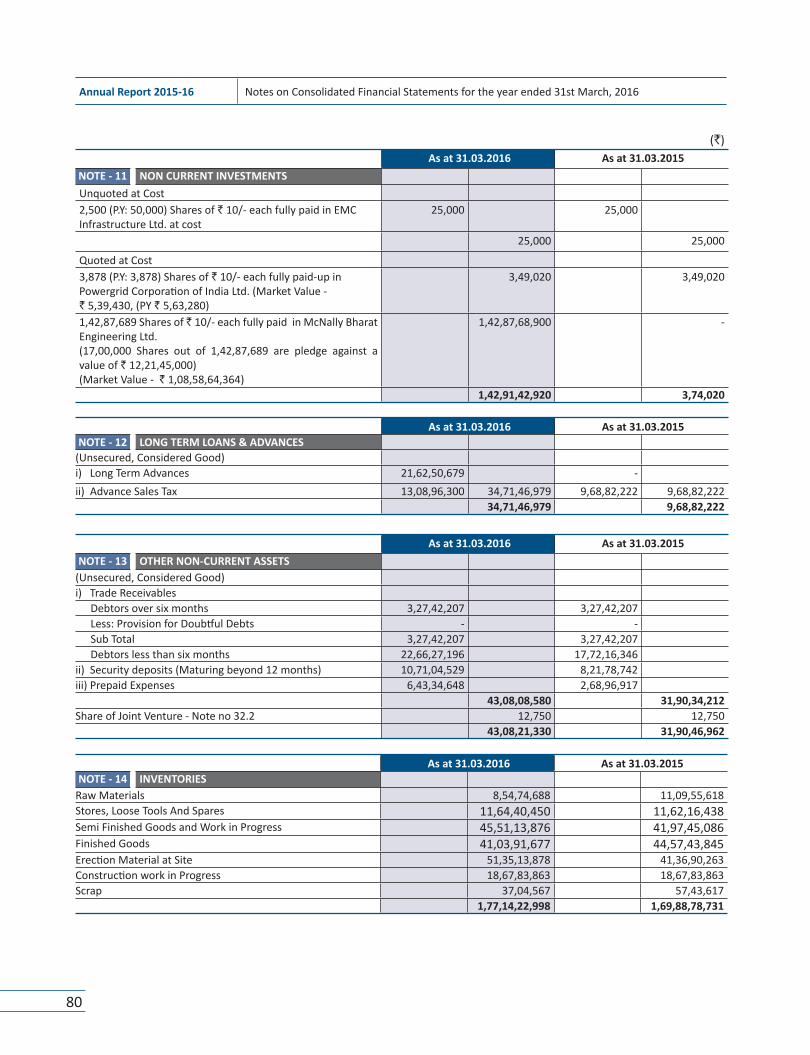
Annual Report 2015-16 Significant Accoun ng PoliciesAnnual Report 2015-16 Notes on Consolidated Financial Statements for the year ended 31st March, 2016
80
(`) As at 31.03.2016 As at 31.03.2015
NOTE - 11 NON CURRENT INVESTMENTSUnquoted at Cost 2,500 (P.Y: 50,000) Shares of ` 10/- each fully paid in EMC Infrastructure Ltd. at cost
25,000 25,000
25,000 25,000
Quoted at Cost3,878 (P.Y: 3,878) Shares of ` 10/- each fully paid-up in Powergrid Corpora on of India Ltd. (Market Value - ` 5,39,430, (PY ` 5,63,280)
3,49,020 3,49,020
1,42,87,689 Shares of ` 10/- each fully paid in McNally Bharat Engineering Ltd. (17,00,000 Shares out of 1,42,87,689 are pledge against a value of ` 12,21,45,000)(Market Value - ` 1,08,58,64,364)
1,42,87,68,900 -
1,42,91,42,920 3,74,020
As at 31.03.2016 As at 31.03.2015NOTE - 12 LONG TERM LOANS & ADVANCES
(Unsecured, Considered Good)i) Long Term Advances 21,62,50,679 - ii) Advance Sales Tax 13,08,96,300 34,71,46,979 9,68,82,222 9,68,82,222
34,71,46,979 9,68,82,222
As at 31.03.2016 As at 31.03.2015NOTE - 13 OTHER NON-CURRENT ASSETS
(Unsecured, Considered Good)i) Trade Receivables
Debtors over six months 3,27,42,207 3,27,42,207 Less: Provision for Doub ul Debts - - Sub Total 3,27,42,207 3,27,42,207 Debtors less than six months 22,66,27,196 17,72,16,346
ii) Security deposits (Maturing beyond 12 months) 10,71,04,529 8,21,78,742 iii) Prepaid Expenses 6,43,34,648 2,68,96,917
43,08,08,580 31,90,34,212 Share of Joint Venture - Note no 32.2 12,750 12,750
43,08,21,330 31,90,46,962
As at 31.03.2016 As at 31.03.2015NOTE - 14 INVENTORIES
Raw Materials 8,54,74,688 11,09,55,618 Stores, Loose Tools And Spares 11,64,40,450 11,62,16,438 Semi Finished Goods and Work in Progress 45,51,13,876 41,97,45,086 Finished Goods 41,03,91,677 44,57,43,845 Erec on Material at Site 51,35,13,878 41,36,90,263 Construc on work in Progress 18,67,83,863 18,67,83,863 Scrap 37,04,567 57,43,617
1,77,14,22,998 1,69,88,78,731

Notes on Consolidated Financial Statements for the year ended 31st March, 2016 Annual Report 2015-16
81
(`) As at 31.03.2016 As at 31.03.2015
NOTE - 15 TRADE RECEIVABLES(Unsecured, Considered Good)Debtors over six months (realisable within 12 months) 3,01,46,91,273 1,28,19,37,330 Debtors less than six months 20,65,07,98,550 15,61,11,95,277
23,66,54,89,823 16,89,31,32,607 Share of Joint Venture - Note no 32.2 10,96,96,975 9,56,32,503
23,77,51,86,798 16,98,87,65,110
As at 31.03.2016 As at 31.03.2015NOTE - 16 CASH & CASH EQUIVALENTS
(i) Balances with Scheduled Banks :a) In Current Accounts 39,94,59,861 21,96,18,838 b) In Fixed Deposit and Margin Accounts 1,36,26,73,963 96,30,38,586 c) In Dividend Account 3,62,030 3,18,198
1,76,24,95,854 1,18,29,75,622 (ii) Cash in Hand[Includes Cheque in hand - ` 2,62,96,050 (PY - ` 1,35,22,000)]
5,92,03,041 2,76,39,290
1,82,16,98,896 1,21,06,14,913Share of Joint Venture - Note no 32.2 98,99,398 1,63,70,751
1,83,15,98,294 1,22,69,85,664
# Fixed Deposit includes ` 1,33,59,70,285 (` 94,32,73,758) towards Margin Money against non-fund based facili es from banks.
As at 31.03.2016 As at 31.03.2015NOTE - 17 SHORT TERM LOANS & ADVANCES
(Unsecured, Considered Good)i) Advance to Related Par es 34,600 5,20,789 ii) Advance Statutory Payments 5,32,85,430 8,96,66,159 iii) Advances to Employees 1,80,45,698 1,13,95,407 iii) Advances to Suppliers/others 12,87,03,13,811 10,00,04,93,353
12,94,16,79,539 10,10,20,75,707 Share of Joint Venture - Note no 32.2 1,97,44,688 87,90,707
12,96,14,24,227 10,11,08,66,414
As at 31.03.2016 As at 31.03.2015NOTE - 18 OTHER CURRENT ASSETS
i) Security Deposits 6,35,43,643 5,93,86,944 ii) Prepaid Expenses & Others 40,66,21,302 27,11,02,151
47,01,64,945 33,04,89,095 Share of Joint Venture - Note no 32.2 1,09,331 3,98,899
47,02,74,276 33,08,87,994

Annual Report 2015-16 Significant Accoun ng PoliciesAnnual Report 2015-16 Notes on Consolidated Financial Statements for the year ended 31st March, 2016
82
(`) For the Year Ended 31.03.2016 For the Year Ended 31.03.2015
NOTE - 19 INCOME FROM OPERATIONSa) Sale of Products [Includes share of Joint Venture `36,27,74,734/- (PY - ` 37,20,40,424/-)]
46,37,14,62,405 41,26,04,92,526
b) Sale of Services [Includes share of Joint Venture ` 10,37,64,331/- (PY - ` 1,40,01,234/-)]
5,72,87,62,029 4,08,04,77,393
c) Other Opera ng Revenue 1,68,23,335 6,47,46,874 52,11,70,47,769 45,40,57,16,793
Less: Du es & Taxes [Includes share of Joint Venture ` 84,80,212/- (PY - ` 89,69,247/-)]
(35,73,34,846) 51,75,97,12,923 (25,12,98,692) 45,15,44,18,101
51,75,97,12,923 45,15,44,18,101
For the Year Ended 31.03.2016 For the Year Ended 31.03.2015NOTE - 20 OTHER INCOME
Interest 9,72,81,486 9,29,25,082 Miscellaneous Income 27,06,32,550 36,79,14,036 9,00,34,621 18,29,59,703 Share of Joint Venture - Note no 32.2 87,304 86,036
36,80,01,340 18,30,45,739

Notes on Consolidated Financial Statements for the year ended 31st March, 2016 Annual Report 2015-16
83
(`)
NO
TE -
21M
ATER
IAL
CON
SUM
EDPa
rcu
lars
Ope
ning
Sto
ckG
oods
Pur
chas
edCo
nsum
pon
Clos
ing
Stoc
kAs
at
1st
April
, 201
5As
at
1st
April
, 201
4Fo
r the
yea
r en
ded
on 3
1st
Mar
ch, 2
016
For t
he y
ear
ende
d on
31s
t M
arch
, 201
5
For t
he y
ear
ende
d on
31s
t M
arch
, 201
6
For t
he y
ear
ende
d on
31s
t M
arch
, 201
5
As a
t 31
st
Mar
ch, 2
016
As a
t 31
st
Mar
ch, 2
015
Raw
Mat
eria
ls (A
)
Stee
l 7
,94,
22,4
20
4,2
8,29
,945
4
8,20
,63,
919
47,
87,0
5,85
0 5
1,52
,49,
756
44,
21,1
3,37
5 4
,62,
36,5
83
7,9
4,22
,420
Alum
iniu
m 2
,02,
23,9
62
67,
95,6
84
86,
95,2
60
3,0
7,44
,239
2
,35,
22,3
31
1,7
3,15
,960
5
3,96
,891
2
,02,
23,9
62
Zinc
44,
19,8
03
32,
65,5
63
8,5
9,65
,318
7
,64,
49,3
28
8,9
4,63
,360
7
,52,
95,0
89
9,2
1,76
1 4
4,19
,803
Othe
r Mat
eria
ls 8
,39,
719
3,5
9,91
9 4
1,67
,43,
120
62,
46,8
2,89
7 4
1,68
,06,
290
62,
42,0
3,09
7 7
,76,
549
8,3
9,71
9
Tota
l (A)
10,
49,0
5,90
4 5
,32,
51,1
11
99,
34,6
7,61
7 1
,21,
05,8
2,31
5 1
,04,
50,4
1,73
7 1
,15,
89,2
7,52
2 5
,33,
31,7
84
10,
49,0
5,90
4
Stor
e, To
ols &
Spa
res (
B)
Stor
es &
Spa
res
11,
62,1
6,43
8 1
2,76
,92,
058
4,8
6,95
,286
1
0,38
,06,
217
4,8
4,71
,274
1
1,52
,81,
836
11,6
4,40
,450
1
1,62
,16,
438
Tota
l (B)
11,
62,1
6,43
8 1
2,76
,92,
058
4,8
6,95
,286
1
0,38
,06,
217
4,8
4,71
,274
1
1,52
,81,
836
11,6
4,40
,450
1
1,62
,16,
438
Erec
on M
ater
ials
(C)
Erec
on &
Con
cre
ng M
ater
ial
60,
04,7
4,12
6 7
0,55
,62,
266
32,
41,5
2,17
7 3
8,81
,34,
782
41,
11,1
2,42
6 4
9,32
,22,
922
51,3
5,13
,878
6
0,04
,74,
126
Tota
l (C)
60,
04,7
4,12
6 7
0,55
,62,
266
32,
41,5
2,17
7 3
8,81
,34,
782
41,
11,1
2,42
6 4
9,32
,22,
922
51,3
5,13
,878
6
0,04
,74,
126
Oth
er M
ater
ials
(D)
Proj
ect P
urch
ases
60,
49,7
14
37,
80,6
8,63
,514
3
3,93
,71,
23,7
61
37,
78,0
7,70
,324
33
,93,
10,7
4,04
7 3
,21,
42,9
04
60,
49,7
14
Tota
l (D)
60,
49,7
14
-
37,
80,6
8,63
,514
3
3,93
,71,
23,7
61
37,
78,0
7,70
,324
33
,93,
10,7
4,04
7 3
,21,
42,9
04
60,
49,7
14
Shar
e of
Join
t Ven
ture
- No
te n
o 32
.2 1
8,42
,19,
607
15,
49,1
7,32
0 1
8,42
,19,
607
15,
49,1
7,32
0
Gran
d To
tal
82,
76,4
6,18
3 8
8,65
,05,
435
39,
35,7
3,98
,201
3
5,79
,45,
64,3
94
39,
46,9
6,15
,368
35
,85,
34,2
3,64
7 71
,54,
29,0
16
82,
76,4
6,18
3

Annual Report 2015-16 Significant Accoun ng PoliciesAnnual Report 2015-16 Notes on Consolidated Financial Statements for the year ended 31st March, 2016
84
(`) For the Year Ended 31.03.2016 For the Year Ended 31.03.2015
NOTE - 22 CHANGES IN INVENTORIESOPENING STOCK :
Finished Goods 44,57,43,845 24,79,62,628 Semi Finished Goods and Work in Progress 12,06,57,193 6,00,89,389 Scrap Materials 57,43,617 57,21,44,655 22,43,148 31,02,95,165
CLOSING STOCK : Finished Goods 41,03,91,677 44,57,43,845 Semi Finished Goods and Work in Progress 7,39,49,791 12,06,57,193 Scrap Materials 37,04,567 57,43,617 Change in Inventory of Subsidiary 4,19,01,109 52,99,47,143 13,57,98,670 70,79,43,325
INCREASE (-) / DECREASE (+) 4,21,97,512 (39,76,48,160)
For the Year Ended 31.03.2016 For the Year Ended 31.03.2015NOTE - 23 EMPLOYEE BENEFIT EXPENSES(a) Salary,Wages and Bonus 1,28,15,90,661 1,15,09,93,077 (b) Contribu on to Provident and Other Funds 12,28,61,968 15,41,71,878 (c) Workmen & Staff Welfare Expenses 3,13,41,976 1,72,85,917 (d) Directors' Remunera on 3,17,58,390 2,43,91,462
1,46,75,52,994 1,34,68,42,334
NOTE - 23.1As per Accoun ng standard 15 "Employee benefits", the disclosures as defined in the Accoun ng standard are given below :-Defined Benefit Plan The employees' gratuity fund scheme managed by a trust is a defined benefit plan.The Present Value of obliga ons is determined based on actuarial valua on using the Projected Unit Cost Method. (`)
2015-16 2014-151) Change in Defined Benefit Obliga on :
Defined Benefit Obliga on at the beginning of the year 3,28,80,998 2,94,17,782Interest Cost 25,58,142 26,47,600Current Service Cost 43,87,650 41,75,062Benefits Paid (58,99,604) (32,85,648)Actuarial Gain / (Loss) on Obliga on 9,55,963 (73,798)Present Value of obliga on as at the end of the year 3,48,83,149 3,28,80,998
2) Change in Fair Value of the AssetFair Value of the plan assets at the beginning of the year 2,89,45,094 2,97,50,820Expected returns on plan assets 25,32,696 26,03,197Contribu ons - 21,273Benefits paid (58,99,604) (32,85,648)Actuarial Gain / (Loss) on plan assets (3,26,062) (1,44,548)Fair Value of Plan assets at the end of the year 2,52,52,124 2,89,45,094
3) Net Asset/(Liability) recognised in the Balance SheetFair Value of the Plan Assets 2,52,52,124 2,89,45,094Present Value of the obliga on as at the end of the year 3,48,83,149 3,28,80,998Amount recognized in Balance Sheet (96,31,025) (39,35,904)

Notes on Consolidated Financial Statements for the year ended 31st March, 2016 Annual Report 2015-16
85
2015-16 2014-154) Expenses recognised during the year
(under the head contribu on to provident fund and other funds)Current Service Cost 43,87,650 41,75,062Interest Cost 25,58,142 26,47,600Expected Return from Plan Asset (25,32,696) (26,03,197)Net Actuarial Gain/(Loss) recognized in the year 12,82,025 70,750Expenses recognised in the statement of Profit and Loss 56,95,121 42,90,215
For the Year Ended 31.03.2016 For the Year Ended 31.03.2015NOTE - 24 FINANCE COSTS
Interest on Term Loan 52,23,13,706 23,56,96,375 Interest on Others 1,37,40,25,115 1,00,17,38,966
1,89,63,38,822 1,23,74,35,341 Share of Joint Venture - Note no 32.2 23,624 1,11,589
1,89,63,62,446 1,23,75,46,930
For the Year Ended 31.03.2016 For the Year Ended 31.03.2015NOTE - 25 DEPRECIATION & AMORTISATION EXPENSE
Deprecia on for the Period 28,14,64,763 25,22,72,343 Less: Transfer to Revalua on Reserve 42,958 14,37,366
28,14,21,805 25,08,34,977
For the Year Ended 31.03.2016 For the Year Ended 31.03.2015NOTE - 26 OTHER EXPENSES
Processing / Job Charges 3,66,52,67,570 1,96,84,03,311 Freight, Carriage & Transport 35,49,97,555 52,80,20,397 Power & Fuel 6,28,38,346 8,98,16,046 Rent 11,22,72,405 28,23,80,177 Insurance 8,56,61,139 9,29,43,871 Repairs & Renewals:
Plant & Machinery 40,46,639 39,43,634 Building 7,63,685 7,07,870 Others 2,63,96,463 3,12,06,787 1,88,03,704 2,34,55,209
Hire Charges 10,15,37,773 8,17,58,836 Travelling & Conveyance 6,17,12,576 4,92,90,082 Auditors Remunera on:Audit Fees 39,00,682 29,81,586 Internal Audit Fees 2,02,000 98,200 Tax Audit 50,000 50,000 Custom Duty 64,09,265 74,28,466 Excise Duty 1,69,22,721 3,59,63,029 Rates & Taxes 10,32,90,070 7,97,09,319 Communica on Expenses 3,78,31,650 1,23,09,351 Bank Commission and Charges 1,31,70,27,742 1,15,04,71,520 Miscellaneous Expenses (A) 26,03,91,043 39,36,86,343 Transla on Loss (1,38,83,913) 3,37,57,384 Loss on Contract Performance 29,17,893 4,46,800
6,21,05,53,304 4,83,29,69,927 Share of Joint Venture - Note no 32.2 1,59,99,608 1,05,77,386
6,22,65,52,912 4,84,35,47,313
(`)

Annual Report 2015-16 Significant Accoun ng PoliciesAnnual Report 2015-16 Notes on Consolidated Financial Statements for the year ended 31st March, 2016
86
31st March 2016 31st March 2015
NOTE - 27 EARNINGS PER SHARE (EPS)i) Net Profit a er tax as per statement of Profit & Loss
a ributable to Equity Shareholders (`) 1,85,63,14,834 1,40,15,49,865
ii) Weighted Average number of equity shares used as denominator for calcula ng EPS
4,54,93,151 3,70,00,000
iii) Basic and Diluted Earnings per share (`) 40.80 37.88iv) Face Value per Equity Share (`) 10.00 10.00
Amount (` in lacs)31st March 2016 31st March 2015
NOTE - 28 EARNINGS IN FOREIGN EXCHANGEFOB Value of Exports 22,202.76 22,593.06
Amount (` in lacs)31st March 2016 31st March 2015
NOTE - 29 CONTINGENT LIABILITIESi. Guarantees given by Company's Bankers on behalf of the
Company. 1,91,021.14 1,19,662.50
ii. Claims against the Company not acknowledged as debts:a) Sales Tax 1,439.76 1,496.08 b) Service Tax 333.08 333.08
iii. Corporate Guarantees given by Company 11,603.78 6,481.85 However as per management percep on, the above liabili es will not devolve upon the company in future.
Amount (` in lacs)31st March 2016 31st March 2015
NOTE - 29.1 CAPITAL COMMITMENTSEs mated value of contracts in capital account remaining to be executed
700.05 1909.94
For the Year Ended 31.03.2016 For the Year Ended 31.03.2015(A) Miscellaneous Expenses
Legal Charges, Lis ng & Filing Fees 1,36,76,089 87,26,219 Sales Promo on & Adver sement Expenses 76,79,369 67,60,370 Tes ng Charges 95,24,708 73,83,327 Computer/R&D Charges 21,93,109 14,60,354 Entertainment Expenses 29,96,374 33,80,952 General Charges 93,30,140 90,71,219 Office Up-Keep 57,01,894 1,16,77,341 Prin ng & Sta onery 66,82,527 55,68,828 Subscrip on & Dona on 20,62,362 14,71,747 Professional fees & Service Charges 14,86,21,264 29,78,55,887 Motor Car Expenses 14,09,165 29,01,733 Mobilisa on Expenses 99,85,578 15,66,817 Tender Fees 26,05,466 30,08,631 Others 3,62,04,670 3,07,83,437 Rebate 15,39,779 18,70,248 Recruitment Expenses 1,78,550 1,99,232
26,03,91,043 39,36,86,343
(`)

Notes on Consolidated Financial Statements for the year ended 31st March, 2016 Annual Report 2015-16
87
Amount (` in lacs)31st March 2016 31st March 2015
NOTE - 30 SEGEMENT REPORTING AS PER AS - 17Segment Revenue:Project & Services 3,99,426.23 3,43,968.23 Manufacturing 21,155.91 16,111.75 Others 97,014.99 91,464.20 Segment Total 5,17,597.13 4,51,544.18 Segment Results:Project & Services 47,932.73 34,309.21 Manufacturing 1,393.79 1,051.22 Others (1,365.36) 824.13 Segment Total 47,961.16 36,184.56 Unallocated income over expenses (1,557.42) (1,779.92)Profit Before Interest & Tax 46,403.74 34,404.64 Interest 18,963.62 12,375.47 Provision for Current Year Tax 8,890.63 8,020.19 Profit a er Current Year Tax 18,549.48 14,008.97 Adjustment for previous year taxes - 3.16 Profit a er Tax 18,549.48 14,005.81 Adjustment for Minority Interest 13.67 9.69 Pro a er tax for Minority Interest 18,563.15 14,015.50
Amount (` in lacs)Assets Liabili es
31st March 2016 31st March 2015 31st March 2016 31st March 2015NOTE - 30 SEGEMENT REPORTING AS PER AS - 17SEGMENT ASSETS & LIABILITIESProject Construc on Division 3,32,175.97 2,76,427.61 1,74,571.68 1,50,109.51 Tower Manufacturing Division 43,136.94 36,932.21 6,150.03 10,942.46 Others 89,542.73 29,357.91 1,31,539.39 71,236.72 Segment Assets & Liabili es: 4,64,855.64 3,42,717.73 3,12,261.10 2,32,288.69
Amount (` in lacs) RELATED PARTY DISCLOSURE AS PER AS - 18Mr. Manoj Toshniwal
EMC Limited Key Managerial Personnel
Salary 134.32 NIL Advance (50.00) (50.00)
Mr. Ramesh Ch. Bardia
EMC Limited Key Managerial Personnel
Salary 134.47 NIL
Mr. Nikunj Toshniwal
EMC Limited Rela ve of Key Managerial Personnel
Salary 27.16 NIL
Mr. Siddhartha Bardia
EMC Limited Rela ve of Key Managerial Personnel
Salary 17.17 NIL
Mr. Sarbananda Lahiri
Quatro Rail Tech Solu ons Ltd Director Salary 59.00 NIL
Mr. Partho Mullick Quatro Rail Tech Solu ons Ltd Director Salary 34.72 NIL Mr. Amitava Majumdar
Quatro Rail Tech Solu ons Ltd Director Salary 34.15 NIL
Mr. Subroto Chaudhury
Quatro Rail Tech Solu ons Ltd Director Salary 23.46 NIL
Annual Report 2015-16 Significant Accoun ng PoliciesAnnual Report 2015-16 Notes on Consolidated Financial Statements for the year ended 31st March, 2016
88
Note-31: Significant Accoun ng Policies forming part of Company’s Balance Sheet and Statement of Profit & Loss as at and for the year ended 31st March 2016
A) SIGNIFICANT ACCOUNTING POLICIES
i) Basis of Prepara on
The financial statements are prepared under the Historical cost conven on as on accrual basis of accoun ng in accordance with the Generally Accepted Accoun ng Principles, Accoun ng Standards no fied under Sec on 133 of the Companies Act, 2013 and the relevant provisions thereof.
B) PRINCIPLES OF CONSOLIDATION
The Consolidated Financial Statements consist of EMC Limited (“the Company”) and its subsidiary companies (collec vely referred to as “the Group”). The Consolidated Financial Statements have been prepared on the following basis:
a) The financial statements of the Company and its subsidiary companies have been combined on a line-by-line basis by adding together the book values of like items of assets, liabili es, income and expenses, a er fully elimina ng intra-group balances and intra-group transac ons resul ng in unrealised profits or losses as per Accoun ng Standard 21 – “Consolidated Financial Statements” no fied by Companies (Accoun ng Standards) Rules, 2006.
b) In case of foreign subsidiaries, being non-integral opera ons, revenue items are consolidated at the average rate prevailing during the year. All assets and liabili es are converted at the rates prevailing at the end of the year. Any exchange difference arising on consolida on is recognised in the “Foreign Currency Transla on Reserve”.
c) The difference between the cost of investment in the subsidiaries and joint ventures, and the Group’s share of net assets at the me of acquisi on of shares in the subsidiaries and joint ventures is recognised in the financial statements as Goodwill or Capital Reserve as the case may be.
Minority interest in the net assets of consolidated subsidiaries consists of:
1) The amount of equity a ributable to minority at the date on which investment in a subsidiary is made; and
2) The minority share of movements in equity since the date the parent subsidiary rela onship came into existence
d) Minority Interest in the net assets of consolidated subsidiaries is iden fied and presented in the Consolidated Balance Sheet separately from liabili es and equity of the Company’s shareholders.
e) Minority's share of net profit for the year of consolidated subsidiaries is iden fied and adjusted against the Profit A er Tax of the Group
f) Interests in Joint Ventures have been accounted by using the propor onate consolida on method as per Accoun ng Standard 27 – "Financial Repor ng of Interests in Joint Ventures" no fied by Companies (Accoun ng Standards) Rules, 2006.
g) The financial statements of the subsidiaries, associates and joint ventures used in the consolida on are drawn up to the same repor ng date as that of the Company i.e. 31st March, 2016,
C) OTHER SIGNIFICANT ACCOUNTING POLICIES
These are set out under " Significant Accoun ng Policies" as given in the Company's separate financial statements
NOTE - 31

Notes on Consolidated Financial Statements for the year ended 31st March, 2016 Annual Report 2015-16
89
NOTE - 32.1 Enterprises consolidated as subsidiary in accordance with accoun ng standard 21- consolidated financial statements
Name of the Enterprise
Country of Incorpora on
Percentage of Ownership
Interest (%) as at 31.03.2016
Percentage of Ownership
Interest (%) as at 31.03.2015
Advanced Steel & Crane Inc. U.S.A 100% 100%Tecnolines S.r.l Italy 70% 70%EMC West Asia DMCC U.A.E 100% 100%EMC East Asia Limited China 100% 100%Quatro Rail Tech Solu ons Limited India 60% 60%(Formerly named as Quatro Rail Tech Solu ons Pvt. Ltd.)Tecnolines Singapore PTE Limited Singapore 100% 100%CE Maschinenbau GmbH Germany 90% 90%(Formerly named as MBE Cologne Engineering GmbH)EMC Saudi LLC U.A.E 60% - EMC Tower Limited India 100% 100%EMC Hardware Limited India 100% 100%EMC Solar Limited India 100% 100%EMC Forging Limited India 100% 100%EMC Logis cs Limited India 100% 100%EMC Overseas Limited India 100% 100%EMC Academy Limited India 100% 100%
NOTE - 32.2 Enterprises consolidated as Joint Ventures in accordance with accoun ng standard 27 - consolidated financial statements
Name of the Enterprise
Country of Incorpora on
Percentage of Ownership
Interest (%) as at 31.03.2016
Percentage of Ownership
Interest (%) as at 31.03.2015
EMC - BCPL Joint Venture India 51% 51%BCPL - EMC Joint Venture India 49% 49%FEDDERS - EMC - QUATRO Joint Venture India 74% - EMC MBE Contrac ng Co. LLC Oman 35% - EMC - BCPL Subir Joint Venture India 71% 71%

Annual Report 2015-16 Significant Accoun ng PoliciesAnnual Report 2015-16 Notes on Consolidated Financial Statements for the year ended 31st March, 2016
90
NO
TE -
33Sa
lient
Fea
ture
s of F
inan
cial
Sta
tem
ents
of S
ubsi
diar
y as
per
Com
pani
es A
ct ,
2013
A) S
UBSID
IARI
ESSr.
No
.Na
me o
f Sub
sidiar
y Co
mpa
nyRe
por
ng
Curre
ncy
Shar
e Cap
ital
Rese
rves
&
Surp
lus
Tota
l Ass
ets
Tota
l Liab
ilies
In
vest-
men
ts Tu
rnov
er /
Tota
l Inco
me
Profi
t Bef
ore
Taxa
on
Prov
ision
fo
r Tax
aon
Pr
ofit A
er
Taxa
on
Prop
osed
Di
viden
d %
of
Shar
ehold
ing1
EMC W
est A
sia D
MCC
INR
3,3
3,31,2
65
31,28
,49,56
0 2,7
1,01,7
0,850
2
,36,39
,90,02
5
- 2,
65,02
,71,94
1 20
,28,94
,724
-
20,28
,94,72
4
- AE
D 1
8,50,0
00
1,73,6
4,228
15,04
,23,81
6
13,12
,09,58
8
-
15,14
,87,39
3 1,1
6,01,1
93
-
1,16
,01,19
3
- 10
0.00%
2Ad
vanc
ed St
eel &
Cran
e Inc
.IN
R
3,24,2
59
21,59
,66,04
4
41,48
,30,21
1
19,85
,39,90
8
-
58,44
,12,77
9 11
,56,97
,971
4,15
,67,64
1 7
,41,30
,330
-
USD
4,9
00
32,6
3,546
62,68
,660
30
,00,21
4
-
90,95
,157
18,3
9,566
6
,46,91
3 11
,92,65
3
- 10
0.00%
3Te
cnoli
nes S
.R.L
INR
75,3
6,736
40
,77,02
,426
2,10,9
0,51,9
39
1,69
,38,12
,777
-
1,54
,85,41
,991
73,3
3,876
1
,09,83
,604
(3
6,49,7
28)
-
EURO
1,0
0,000
5
4,09,5
33
2,79,8
3,624
2
,24,74
,091
-
2,17
,59,32
2
1,42,7
84
1,54
,336
(1
1,552
)
- 70
.00%
4Te
cnoli
nes S
ingap
ore P
TE
Limite
dIN
R 5
1,897
2
8,14,8
13
39
,48,26
,047
39
,19,59
,337
-
37
,88,50
,684
22,8
2,480
-
22
,82,48
0
-
USD
784
4
2,536
59,66
,369
59
,23,04
9
-
58,96
,015
35,5
22
-
35,52
2
- 10
0.00%
5EM
C Eas
t Asia
Ltd
INR
4,3
5,499
3
2,45,6
98
2,99,6
5,94,3
80
2,99
,29,13
,183
-
5,01
,99,08
,126
32,0
6,279
3
,29,41
5 28
,76,86
4
- US
D
6,581
4
9,047
4,5
2,82,6
99
4,52
,27,07
1
- 7
,81,24
,324
49,8
99
5,09
8 44
,801
-
100.0
0%
6CE
Mas
chine
nbau
Gm
bH
INR
18,8
4,184
(1
,20,38
,429)
73
,00,64
,040
74
,02,18
,285
-
57
,99,64
,126
(2,91
,17,11
6) -
(2
,91,17
,116)
-
(Form
erly
nam
ed as
MBE
Co
logne
Engin
eerin
g Gm
bH)
EURO
25,0
00
(1
,59,73
0)
96,86
,740
98
,21,47
0
-
81,49
,360
(1,59
,730)
-
(1,59
,730)
-
90.00
%
7EM
C Sau
di LL
CIN
R
5,29,3
4,187
7,1
1,31,5
57
1,81
,97,37
0 -
-
-
-
SAR
30,0
0,000
-
40
,31,32
0
10,31
,320
-
- -
- 60
.00%
8Qu
atro
Rail T
ech S
oluon
s Ltd
.IN
R
1,00,0
0,000
1,4
8,40,8
79
12
,43,83
,247
9,95
,42,36
8
-
20,52
,46,40
7 9
5,51,2
85
29
,51,35
0 65
,99,93
5
- 60
.00%
(Form
erly
nam
ed as
Qua
tro
Rail T
ech S
oluon
s Pvt
Ltd)
9EM
C Sola
r Ltd
.IN
R
5,00,0
00
(2
,59,65
7)2,4
5,343
5
,000
-
17
,117
(6,45
8) -
(6
,458)
-
100.0
0%10
EMC O
verse
as Lt
d.IN
R
1,50,0
0,000
(1
6,75,2
04)
1,34,1
7,571
92,77
5
-
10,48
,153
10,1
0,721
3
,02,96
3 7
,07,75
8
- 10
0.00%
11EM
C Log
iscs
Ltd.
INR
5,0
0,000
(2,62
,643)
2,42,3
57
5,00
0
-
17,27
6 (2
0,315
) -
(20,3
15)
-
100.0
0%12
EMC H
ardw
are L
td.
INR
25,0
0,000
(1
2,13,0
04)
17
,37,94
3 4
,50,94
7
-
31,11
1 (2
6,298
) -
(26,2
98)
-
100.0
0%13
EMC F
orgin
g Ltd
.IN
R
5,00,0
00
(2
,75,84
2)2,2
9,158
5
,000
-
15
,547
(12,8
88)
-
(1
2,888
)
- 10
0.00%
14EM
C Tow
er Lt
d.IN
R 1
3,00,0
0,000
(2
,89,42
,129)
20
,09,23
,800
9,98
,65,92
9
- -
(1
,80,48
,859)
-
(1,80
,48,85
9)
- 10
0.00%
15EM
C Aca
demy
Ltd.
INR
5,0
0,000
(1
,17,11
,934)
2,28,0
42
1,14
,39,97
6
- -
(9
,18,48
1) -
(9
,18,48
1)
- 10
0.00%
As on
31.03
.2016
: EUR
O - 7
5.367
4, US
D - 6
6.175
3, AE
D - 1
8.016
9, SA
R - 17
.6447
, OM
R - 17
1.839
3As
on 31
.03.20
15: E
URO
- 66.9
663,
USD
- 62.3
355,
AED
- 16.9
731
(`)

Notes on Consolidated Financial Statements for the year ended 31st March, 2016 Annual Report 2015-16
91
NOTE - 33 Salient Features of Financial Statements of Subsidiary as per Companies Act , 2013B) JOINT VENTURESStatement pursuant to Sec on 129 (3) of the Companies Act , 2013 related to Associate Companies and Joint Ventures
Sr. No.
Name of Associates/Joint Ventures
Shares of Associate/Joint Ventures held by the company on the year end
Profit/Loss for the year
Latest audited Balance
Sheet Date
Amount of Investment in
Associates/ Joint Venture
Networth a ributable to
Shareholding as per latest audited
Balance Sheet
Considered in Consolida on
Not Considered in Consolida on
Descrip on of how there is significant
influence
Reason why the
associate/ joint venture is not consolidated
1 EMC-BCPL Subir JV 31.03.2016 - 1,09,71,621.00 77,89,851 31,81,770 71% - 2 BCPL-EMC JV 31.03.2016 2,45,000 1,26,18,098.00 61,82,868 64,35,230 49% - 3 EMC-BCPL JV 31.03.2016 - 1,19,07,612.00 60,72,882 58,34,730 51% - 4 FEDDERS - EMC - QUATRO JV 31.03.2016 2,50,43,227.00 1,27,72,046 1,22,71,181 74% - 5 EMC MBE Contrac ng Co.
LLC- 1,51,97,000 - - - 35% -
NOTE - 34Sr.
No.Name of the Enterprise Net Assets i.e total Assets minus total liabili es Share in profit or loss
As % of consolidated Net Assets
Amount in ` As % of consolidated of Consolidated profit
& loss
Amount in `
Parent CompanyEMC Limited 84.27% 7,47,06,53,494 72.88% 1,35,29,57,111 SubsidiariesIndian
1 Quatro Rail Tech Solu ons Limited 0.41% 3,64,18,284 0.38% 70,95,427 2 EMC Tower Limited 1.87% 16,56,94,890 -0.77% (1,42,29,722)3 EMC Hardware Limited 0.02% 16,97,637 0.00% 4,731 4 EMC Solar Limited 0.00% 35,899 0.00% (23,575)5 EMC Forging Limited 0.00% 45,689 0.00% (28,435)6 EMC Logis cs Limited 0.00% 36,400 0.00% (37,591)7 EMC Overseas Limited 0.00% 85,930 -0.02% (3,40,395)8 EMC Academy Limited 0.00% 64,420 0.00% (33,314)
Foreign1 Tecnolines Singapore PTE Limited 0.04% 35,46,843 0.12% 22,84,600 2 CE Maschinenbau GmbH 4.26% 37,80,41,010 -0.67% (1,24,44,439)3 Advanced Steel & Crane Inc. 1.69% 15,01,15,049 3.99% 7,41,30,330 4 Tecnolines S.r.l 9.78% 86,71,17,259 21.45% 39,81,34,928 5 EMC West Asia DMCC -1.27% (11,29,79,136) -10.86% (20,15,63,265)6 EMC Saudi LLC 0.76% 6,76,02,611 0.00% -7 EMC East Asia Limited -3.33% (29,53,28,869) 0.12% 22,63,354
Minority Interest in all Subsidiaries 0.46% 4,04,03,968 0.07% 13,66,677
(`)

92
Annual Report 2015-16 Significant Accoun ng PoliciesAnnual Report 2015-16 Notes on Consolidated Financial Statements for the year ended 31st March, 2016
92
NOTE - 34Sr.
No.Name of the Enterprise Net Assets i.e total Assets minus total liabili es Share in profit or loss
As % of consolidated Net Assets
Amount in ` As % of consolidated of Consolidated profit
& loss
Amount in `
Joint VenturesIndian
1 EMC - BCPL Joint Venture 0.11% 97,63,880 0.12% 21,71,527 2 BCPL - EMC Joint Venture 0.32% 2,81,05,490 0.63% 1,16,87,265 3 FEDDERS - EMC - QUATRO Joint Venture 0.03% 26,20,842 4.36% -4 EMC MBE Contrac ng Co. LLC 0.06% 57,49,442 0.00% -5 EMC - BCPL Subir Joint Venture 0.51% 4,51,83,977 8.19% 15,20,65,275
Total 100.00% 8,86,46,75,009 100.00% 1,85,63,14,834
As per our Report of even date a achedFor SRB & AssociatesChartered Accountants (Firm Regn No 310009E)
Sanjeet Patra(Partner)Membership No. - 056121Kolkata, The day of 31st August, 2016
For and on behalf of the Board
Manoj Toshniwal Ramesh Chandra Bardia Managing Director Jt. Managing Director
Arun Kumar Kedia Sumit Kumar Surana Chief Financial Officer Company Secretary
Yamini MoreVP (Finance & Accounts)

9393
Annual Report 2015-16
NOTES

94
Annual Report 2015-16
NOTES

Annual Report 2015-16
95
NOTES

Annual Report 2015-16
96
NOTES


France
Spain
GermanyPoland
FinlandSweden
Egypt
Libya
Chad
Italy
Georgia
Canada
USA
Mexico
POWERINGN A T I O N S
EMC LIMITEDAnnual Report 2015-16
EMC LIMITEDConstantia Ofce Complex, 11, Dr. U. N. Brahmachari Street
8th Floor (South Block), Kolkata - 700 017Tel. : _91-33-22893122-24 / 40158888 | Fax : +91-33-22893121
Email : [email protected] | Website : www.emcpower.com


