Embed Size (px)
Citation preview

POLL7 @ssrs_research | 484.840.4300 | www.ssrs.com | 1
1 Braxton Way Suite 125 Glen Mills, PA 19342
484-840-4300 www.ssrs.com
The study was conducted for CNN via telephone by SSRS, an independent research company. Interviews were conducted from August 09, 2018 to August 12, 2018 among a sample of 1,002 respondents. The landline total
respondents were 397 and there were 605 cell phone respondents. The margin of sampling error for total respondents is +/-3.9 at the 95% confidence level. The design effect is 1.59. More information about SSRS can be
obtained by visiting www.ssrs.com. Unless otherwise noted, results beginning with the March 31-April 2, 2006 survey and ending with the April 22-25, 2017 survey are from surveys conducted by ORC International. Results
before March 31, 2006 are from surveys conducted by Gallup.
EMBARGOED FOR RELEASE: Thursday, August 16 at 1:00 p.m.

POLL7 @ssrs_research | 484.840.4300 | www.ssrs.com | 2
1 Braxton Way Suite 125 Glen Mills, PA 19342
484-840-4300 www.ssrs.com
Q2. (A2) Do you approve or disapprove of the way Donald Trump is handling (INSERT ITEM)? (Half Sample A Respondents, N=496)
The economy Approve Disapprove No opinion August 09-12, 2018* 49% 47% 4%
June 14-17, 2018 49% 43% 9%
May 02-05, 2018 52% 42% 6%
March 22-25, 2018 48% 45% 7%
February 20-23, 2018 46% 47% 7%
January 14-18, 2018 49% 43% 8%
December 14-17, 2017 44% 49% 6%
November 2-5, 2017 45% 46% 9%
September 17-20, 2017 45% 47% 8%
August 03-06, 2017 45% 47% 8%
April 22-25, 2017 49% 47% 4%
March 1-4, 2017* 55% 41% 4%
Jan. 31 - Feb. 2, 2017 49% 43% 9%
* Asked of half sample
Immigration Approve Disapprove No opinion
August 09-12, 2018 37% 58% 4% June 14-17, 2018 35% 59% 6%
May 02-05, 2018 40% 55% 5%
February 20-23, 2018 36% 60% 5%
January 14-18, 2018 38% 57% 5%
November 2-5, 2017 37% 57% 6%
October 12-15, 2017 37% 59% 5%
September 17-20, 2017 36% 60% 4%
August 03-06, 2017* 40% 55% 5%
April 22-25, 2017 41% 57% 2%
March 1-4, 2017 44% 55% 1%
Jan. 31 - Feb. 2, 2017 42% 56% 2%
* Asked of half sample

POLL7 @ssrs_research | 484.840.4300 | www.ssrs.com | 3
1 Braxton Way Suite 125 Glen Mills, PA 19342
484-840-4300 www.ssrs.com
Q2. (A2) Do you approve or disapprove of the way Donald Trump is handling (INSERT ITEM)? (CONTINUED)
Taxes Approve Disapprove No opinion
August 09-12, 2018 45% 46% 9%
January 14-18, 2018 42% 46% 12%
December 14-17, 2017 34% 57% 9% November 2-5, 2017 35% 51% 14%
October 12-15, 2017 36% 50% 14%
September 17-20, 2017 34% 47% 19%
August 03-06, 2017* 34% 48% 18%
March 1-4, 2017* 43% 48% 9%
* Asked of half sample
Environmental policy Approve Disapprove No opinion
August 09-12, 2018 31% 58% 11%
October 12-15, 2017 32% 56% 12%
March 1-4, 2017 42% 52% 5%
(Half Sample B Respondents N=506)
Foreign trade Approve Disapprove No opinion
August 09-12, 2018* 38% 50% 12% June 14-17, 2018 39% 50% 11%
May 02-05, 2018 43% 46% 11%
March 22-25, 2018 38% 50% 12%
* Asked of half sample

POLL7 @ssrs_research | 484.840.4300 | www.ssrs.com | 4
1 Braxton Way Suite 125 Glen Mills, PA 19342
484-840-4300 www.ssrs.com
Q9. As you may know, Brett Kavanaugh is the federal judge nominated to serve on the Supreme Court. Would you like to see the Senate vote in favor of Kavanaugh serving on the Supreme Court, or not?
Vote in favor Not vote in favor No opinion
August 09-12, 2018 37% 40% 22%
CNN/OPINION RESEARCH CORPORATION AND CNN/USA TODAY/GALLUP TRENDS FOR COMPARISON
Yes, vote in favor No, not No opinion Neil Gorsuch* 2017 Jan 31 -Feb 2 49% 36% 15% Merrick Garland* 2016 Apr. 28-May 1 52% 33% 15% 2016 Mar. 17-20 52% 33% 15% Elana Kagan** 2010 Jul 16-21 54% 34% 12% 2010 Jun 16 44% 39% 17% 2010 May 21-23 54% 36% 11% Sonia Sotomayor* 2009 July 31-Aug 3 51% 36% 14% 2009 June 26-28 47% 40% 13% Samuel Alito* 2006 Jan 20-22 54% 30% 16% 2006 Jan 6-8 49% 30% 21% 2005 Dec 9-11 49% 29% 22% 2005 Nov 7-10 50% 25% 25% Harriet Miers** 2005 Oct 21-23 42% 43% 15% 2005 Oct 13-16 44% 36% 20% John Roberts*** 2005 Sep 16-18 60% 26% 14% 2005 Sep 8-11 58% 27% 15% 2005 Aug 28-30 52% 26% 22% 2005 Aug 5-7 51% 28% 21% 2005 Jul 22-24 59% 22% 19% Ruth Bader Ginsburg* 1993 Jun 18-21 53% 14% 33% Clarence Thomas* 1991 Jul 11-14 52% 17% 31% Robert Bork* 1987 Sep 1-13 38% 35% 26% 1987 Aug 24-Sep 2 31% 25% 44%
TRENDS SINCE 2009 FROM CNN/OPINION RESEARCH CORPORATION POLL. ALL OTHERS FROM CNN/USA TODAY/GALLUP POLLS. *QUESTION WORDING FOR GORSUCH, GARLAND, SOTOMAYOR, ALITO, GINSBURG, THOMAS AND BORK: As you may know, NAME is the federal judge nominated to serve on the Supreme Court. Would you like to see the Senate vote in favor of NAME serving on the Supreme Court, or not? **QUESTION WORDING FOR ELENA KAGAN, HARIET MIERS: As you may know, [NAME] is the person nominated to serve on the Supreme Court. Would you like to see the Senate vote in favor of [NAME] serving on the Supreme Court, or not? ***QUESTION WORDING FOR ROBERTS IN JULY AND AUGUST, 2005: As you may know, John Roberts is a federal judge nominated to serve on the Supreme Court. Would you like to see the Senate vote in favor of Roberts serving on the Supreme Court, or not? IN SEPTEMBER, 2005: As you may know, John Roberts is a federal judge nominated to serve as chief justice on the Supreme Court. Would you like to see the Senate vote in favor of Roberts serving as chief justice on the Supreme Court, or not?

POLL7 @ssrs_research | 484.840.4300 | www.ssrs.com | 5
1 Braxton Way Suite 125 Glen Mills, PA 19342
484-840-4300 www.ssrs.com
Q10. How would you describe your first impressions of him? Would you say they are …
Very positive
Somewhat positive
Neither positive nor
negative
Somewhat negative
Very negative No opinion
August 09-12, 2018 17% 16% 27% 14% 15% 11%
CNN/ORC AND CNN/USA TODAY/GALLUP TRENDS FOR COMPARISON
Very positive
Some- what
positive
Neither positive
nor negative
Some- what
negative Very
negative No
opinion Neil Gorsuch 2017 Jan 31-Feb 2 21% 18% 31% 16% 8% 5% Merrick Garland 2016 Mar 17-20 18% 27% 34% 10% 4% 7% Judge John Roberts 2005 Jul 20 26% 28% 21% 8% 7% 10% **NOTE: Trends since 2016 From CNN/ORC polls. Trend from 2005 from CNN/USA TODAY/GALLUP poll.
Q12. Based on what you have heard or read about him, do you think Brett Kavanaugh's views on important issues are in the mainstream, or do you think they are too extreme?
Mainstream Too extreme No opinion
August 09-12, 2018 42% 35% 23%
CNN/ORC AND CNN/USA TODAY/GALLUP TRENDS FOR COMPARISON
Mainstream Too extreme No opinion Elena Kagan 2010 May 21-23 54% 36% 10% Samuel Alito 2006 Jan 6-8* 52% 30% 19% 2005 Nov 1*** 51% 26% 23% * Asked of a half sample **NOTE: Trend from 2010 From CNN/ORC polls. Trends from 2005 and 2006 from CNN/USA TODAY/GALLUP polls. ***Polls conducted entirely in one day, such as this one, are subject to additional error or bias not found in polls conducted over several days.

POLL7 @ssrs_research | 484.840.4300 | www.ssrs.com | 6
1 Braxton Way Suite 125 Glen Mills, PA 19342
484-840-4300 www.ssrs.com
Q13. Democrats in the Senate say that they need to see more documents from Brett Kavanaugh’s career in government before they are willing to vote on his nomination. Do you think that the federal government should have to provide Senate Democrats with more documents, or do you think the Senate Democrats have enough information now to vote? If you have No opinion, please just say so.
Should provide more
documents
Senate Democrats have enough information
No opinion Refused
August 09-12, 2018 41% 27% 31% 1%
NBC/WSJ TREND FOR COMPARISON
Should provide more
documents
Senate Democrats
have enough information
No opinion
Not sure John Roberts 2005 September 9-12 41% 31% 25% 3% QUESTION WORDING: Democrats in the Senate say that they need to see more documents from John Roberts' career in government before they are willing to vote on his nomination. Do you think that the White House should have to provide Senate Democrats with more documents, or do you think the Senate Democrats have enough information now to vote? If you have No opinion, please just say so.
Q15. Do you, personally, think that the Congress elected in November should be the one to confirm the justice who will fill the seat, or do you think that the current Congress should handle the confirmation?
Congress elected in November
Current Congress No opinion
August 09-12, 2018 44% 45% 11%
CNN/ORC TREND FOR COMPARISON
President Obama
The president elected in November
Depends on who is elected in Nov. (vol.) No opinion
2016 March 17-20 57% 40% 1% 2% QUESTION WORDING: And how about you, do you, personally, think that (the president elected in November) should be the one to appoint the justice who will fill the seat, or do you think that (President Obama) should make the appointment?

POLL7 @ssrs_research | 484.840.4300 | www.ssrs.com | 7
1 Braxton Way Suite 125 Glen Mills, PA 19342
484-840-4300 www.ssrs.com
Q24. When immigrants and their children are detained at the U.S. border for coming into the country illegally, do you think the U.S. should do everything it can to keep such families together, even if it means that fewer face criminal prosecution, or should the U.S. do everything it can to prosecute immigrants entering illegally, even if it means their families are separated?
Do everything it can to keep families together
Do everything it can to prosecute immigrants
entering illegally No opinion
August 09-12, 2018 66% 27% 7%
Q25. As you may know, a judge has ordered the Trump administration to reunite parents and children who were separated at the border. Do you approve or disapprove of the way the Trump administration has handled the reunifications so far?
Approve Disapprove No opinion
August 09-12, 2018 39% 53% 8%
POLL7 @ssrs_research | 484.840.4300 | www.ssrs.com | 8
1 Braxton Way Suite 125 Glen Mills, PA 19342
484-840-4300 www.ssrs.com
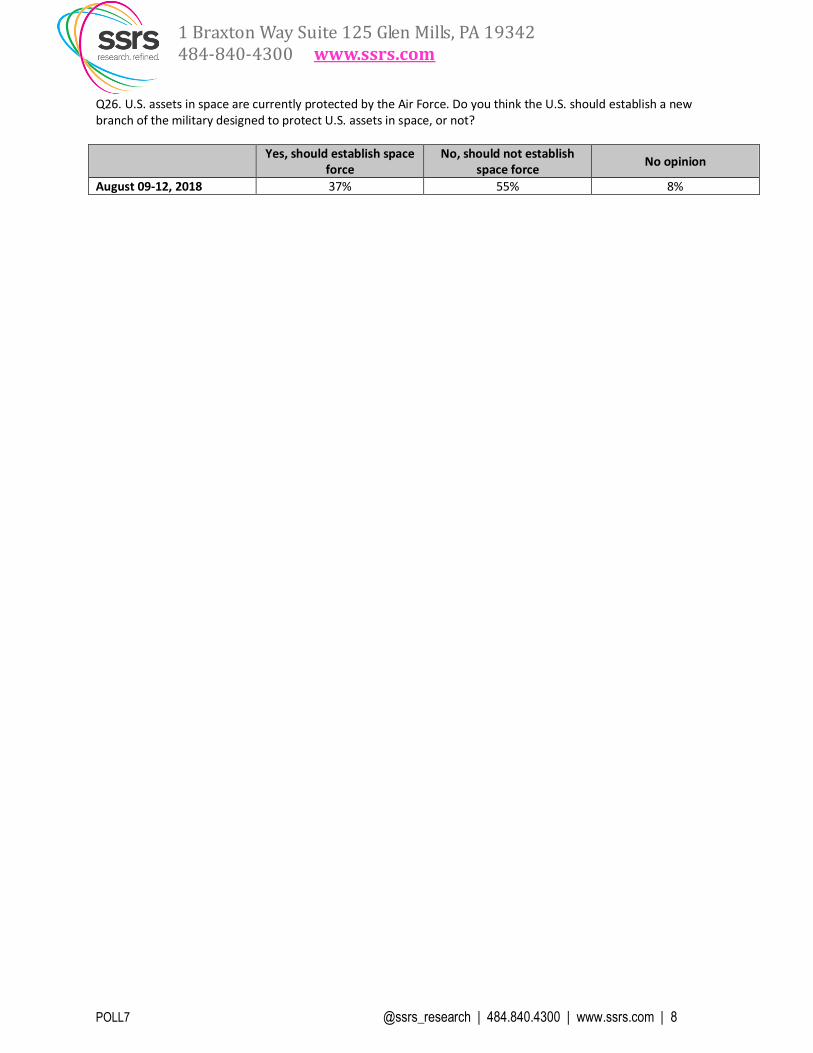
Q26. U.S. assets in space are currently protected by the Air Force. Do you think the U.S. should establish a new branch of the military designed to protect U.S. assets in space, or not?
Yes, should establish space force
No, should not establish space force
No opinion
August 09-12, 2018 37% 55% 8%

POLL7 @ssrs_research | 484.840.4300 | www.ssrs.com | 9
1 Braxton Way Suite 125 Glen Mills, PA 19342
484-840-4300 www.ssrs.com
MORE ON METHODOLOGY A total of 1,002 adults were interviewed by telephone nationwide by live interviewers calling both landline and cell phones. Interviews were conducted in English and Spanish. Among the entire sample, 33% described themselves as Democrats, 26% described themselves as Republicans, and 41% described themselves as independents or members of another party. All respondents were asked questions concerning basic demographics, and the entire sample was weighted to reflect national Census figures for gender, race, age, education, region of country, and telephone usage. Results for the full sample have a margin of sampling error of +/- 3.9 percentage points. For the sample of 921 registered voters and adults who plan to register to vote before Election Day, it is +/- 4.1 percentage points. Crosstabs on the following pages only include results for subgroups with enough unweighted cases to produce a sampling error of +/-8.5 percentage points or less once adjusted for design effect. Some subgroups represent too small a share of the national population to produce crosstabs with an acceptable sampling error. Interviews were conducted among these subgroups, but results for groups with a design-effect adjusted sampling error larger than +/-8.5 percentage points are not displayed and instead are denoted with "N/A".

POLL7 @ssrs_research | 484.840.4300 | www.ssrs.com | 10
1 Braxton Way Suite 125 Glen Mills, PA 19342
484-840-4300 www.ssrs.com
CNN/SSRS Poll -- August 09, 2018 to August 12, 2018
TABLE 002
2A. Do you approve or disapprove of the way Donald Trump is handling The economy?
Base: Respondents who are in half sample A
Trump Trump
Non- ap- disap
Total Men Women White white prove prove
===== ===== ===== ===== ===== ===== =====
Approve 49% 57% N/A 58% N/A N/A 16%
Disapprove 47% 41% N/A 38% N/A N/A 79%
Don't know/Undecided/Refused 4% 2% N/A 4% N/A N/A 5%
Sampling Error (+/-) 5.6 7.1 6.6 7.5
Total 18-34 35-49 50-64 65+ <45 45+
===== ===== ===== ===== ===== ===== =====
Approve 49% N/A N/A N/A N/A N/A 47%
Disapprove 47% N/A N/A N/A N/A N/A 50%
Don't know/Undecided/Refused 4% N/A N/A N/A N/A N/A 3%
Sampling Error (+/-) 5.6 6.5
Non- White White
coll. Coll. non- coll.
Total <$50K $50K+ grad grad. coll. grad.
===== ===== ===== ===== ===== ===== =====
Approve 49% N/A 47% 50% 47% N/A N/A
Disapprove 47% N/A 48% 47% 49% N/A N/A
Don't know/Undecided/Refused 4% N/A 5% 3% 5% N/A N/A
Sampling Error (+/-) 5.6 7.0 7.2 7.7
Indep Con
Demo- endnt Repub Lib- Mode- serva
Total crat Other lican eral rate tive
===== ===== ===== ===== ===== ===== =====
Approve 49% N/A N/A N/A N/A N/A N/A
Disapprove 47% N/A N/A N/A N/A N/A N/A
Don't know/Undecided/Refused 4% N/A N/A N/A N/A N/A N/A
Sampling Error (+/-) 5.6
Lean Lean
Demo- Repub Reg.
Total crat lican voter
===== ===== ===== =====
Approve 49% 19% 87% 49%
Disapprove 47% 77% 10% 48%
Don't know/Undecided/Refused 4% 4% 3% 3%
Sampling Error (+/-) 5.6 7.8 8.4 5.7

POLL7 @ssrs_research | 484.840.4300 | www.ssrs.com | 11
1 Braxton Way Suite 125 Glen Mills, PA 19342
484-840-4300 www.ssrs.com
CNN/SSRS Poll -- August 09, 2018 to August 12, 2018
TABLE 003
2E. Do you approve or disapprove of the way Donald Trump is handling Immigration?
Base: Total Respondents
Trump Trump
Non- ap- disap
Total Men Women White white prove prove
===== ===== ===== ===== ===== ===== =====
Approve 37% 44% 31% 45% 22% 82% 4%
Disapprove 58% 51% 65% 52% 72% 14% 94%
Don't know/Undecided/Refused 4% 4% 4% 3% 6% 4% 1%
Sampling Error (+/-) 3.9 5.0 6.0 4.7 7.1 5.8 5.5
Total 18-34 35-49 50-64 65+ <45 45+
===== ===== ===== ===== ===== ===== =====
Approve 37% N/A 39% 45% 37% 32% 42%
Disapprove 58% N/A 55% 53% 58% 63% 54%
Don't know/Undecided/Refused 4% N/A 6% 2% 5% 5% 4%
Sampling Error (+/-) 3.9 8.3 6.8 7.0 6.6 4.6
Non- White White
coll. Coll. non- coll.
Total <$50K $50K+ grad grad. coll. grad.
===== ===== ===== ===== ===== ===== =====
Approve 37% 35% 39% 39% 34% 49% 38%
Disapprove 58% 60% 57% 56% 63% 47% 59%
Don't know/Undecided/Refused 4% 4% 4% 5% 3% 3% 3%
Sampling Error (+/-) 3.9 6.5 5.0 5.1 5.5 6.4 6.4
Indep Con
Demo- endnt Repub Lib- Mode- serva
Total crat Other lican eral rate tive
===== ===== ===== ===== ===== ===== =====
Approve 37% 5% 42% 79% 11% 28% 68%
Disapprove 58% 92% 54% 17% 86% 69% 27%
Don't know/Undecided/Refused 4% 3% 5% 5% 2% 4% 5%
Sampling Error (+/-) 3.9 7.0 6.2 7.4 8.2 6.2 6.7
Lean Lean
Demo- Repub Reg.
Total crat lican voter
===== ===== ===== =====
Approve 37% 7% 75% 39%
Disapprove 58% 91% 19% 57%
Don't know/Undecided/Refused 4% 2% 6% 4%
Sampling Error (+/-) 3.9 5.6 5.8 4.1

POLL7 @ssrs_research | 484.840.4300 | www.ssrs.com | 12
1 Braxton Way Suite 125 Glen Mills, PA 19342
484-840-4300 www.ssrs.com
CNN/SSRS Poll -- August 09, 2018 to August 12, 2018
TABLE 005
2I. Do you approve or disapprove of the way Donald Trump is handling Taxes?
Base: Total Respondents
Trump Trump
Non- ap- disap
Total Men Women White white prove prove
===== ===== ===== ===== ===== ===== =====
Approve 45% 55% 35% 50% 34% 86% 13%
Disapprove 46% 39% 53% 40% 57% 8% 77%
Don't know/Undecided/Refused 9% 6% 12% 9% 9% 6% 10%
Sampling Error (+/-) 3.9 5.0 6.0 4.7 7.1 5.8 5.5
Total 18-34 35-49 50-64 65+ <45 45+
===== ===== ===== ===== ===== ===== =====
Approve 45% N/A 47% 47% 41% 46% 45%
Disapprove 46% N/A 47% 44% 50% 45% 46%
Don't know/Undecided/Refused 9% N/A 6% 10% 9% 9% 9%
Sampling Error (+/-) 3.9 8.3 6.8 7.0 6.6 4.6
Non- White White
coll. Coll. non- coll.
Total <$50K $50K+ grad grad. coll. grad.
===== ===== ===== ===== ===== ===== =====
Approve 45% 43% 47% 46% 44% 53% 45%
Disapprove 46% 49% 45% 44% 50% 37% 47%
Don't know/Undecided/Refused 9% 9% 8% 11% 6% 10% 8%
Sampling Error (+/-) 3.9 6.5 5.0 5.1 5.5 6.4 6.4
Indep Con
Demo- endnt Repub Lib- Mode- serva
Total crat Other lican eral rate tive
===== ===== ===== ===== ===== ===== =====
Approve 45% 10% 53% 84% 18% 38% 74%
Disapprove 46% 81% 37% 9% 73% 50% 21%
Don't know/Undecided/Refused 9% 8% 9% 7% 9% 13% 5%
Sampling Error (+/-) 3.9 7.0 6.2 7.4 8.2 6.2 6.7
Lean Lean
Demo- Repub Reg.
Total crat lican voter
===== ===== ===== =====
Approve 45% 16% 83% 44%
Disapprove 46% 75% 10% 48%
Don't know/Undecided/Refused 9% 9% 7% 8%
Sampling Error (+/-) 3.9 5.6 5.8 4.1
POLL7 @ssrs_research | 484.840.4300 | www.ssrs.com | 13
1 Braxton Way Suite 125 Glen Mills, PA 19342
484-840-4300 www.ssrs.com
CNN/SSRS Poll -- August 09, 2018 to August 12, 2018
TABLE 006
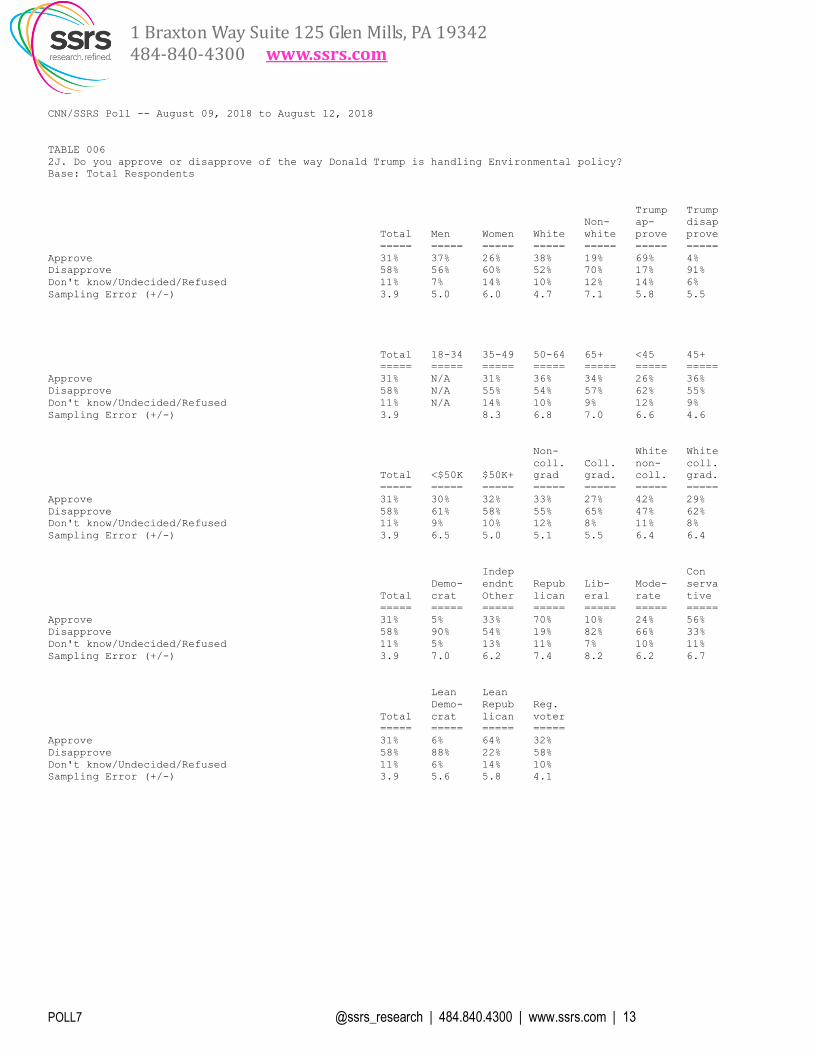
2J. Do you approve or disapprove of the way Donald Trump is handling Environmental policy?
Base: Total Respondents
Trump Trump
Non- ap- disap
Total Men Women White white prove prove
===== ===== ===== ===== ===== ===== =====
Approve 31% 37% 26% 38% 19% 69% 4%
Disapprove 58% 56% 60% 52% 70% 17% 91%
Don't know/Undecided/Refused 11% 7% 14% 10% 12% 14% 6%
Sampling Error (+/-) 3.9 5.0 6.0 4.7 7.1 5.8 5.5
Total 18-34 35-49 50-64 65+ <45 45+
===== ===== ===== ===== ===== ===== =====
Approve 31% N/A 31% 36% 34% 26% 36%
Disapprove 58% N/A 55% 54% 57% 62% 55%
Don't know/Undecided/Refused 11% N/A 14% 10% 9% 12% 9%
Sampling Error (+/-) 3.9 8.3 6.8 7.0 6.6 4.6
Non- White White
coll. Coll. non- coll.
Total <$50K $50K+ grad grad. coll. grad.
===== ===== ===== ===== ===== ===== =====
Approve 31% 30% 32% 33% 27% 42% 29%
Disapprove 58% 61% 58% 55% 65% 47% 62%
Don't know/Undecided/Refused 11% 9% 10% 12% 8% 11% 8%
Sampling Error (+/-) 3.9 6.5 5.0 5.1 5.5 6.4 6.4
Indep Con
Demo- endnt Repub Lib- Mode- serva
Total crat Other lican eral rate tive
===== ===== ===== ===== ===== ===== =====
Approve 31% 5% 33% 70% 10% 24% 56%
Disapprove 58% 90% 54% 19% 82% 66% 33%
Don't know/Undecided/Refused 11% 5% 13% 11% 7% 10% 11%
Sampling Error (+/-) 3.9 7.0 6.2 7.4 8.2 6.2 6.7
Lean Lean
Demo- Repub Reg.
Total crat lican voter
===== ===== ===== =====
Approve 31% 6% 64% 32%
Disapprove 58% 88% 22% 58%
Don't know/Undecided/Refused 11% 6% 14% 10%
Sampling Error (+/-) 3.9 5.6 5.8 4.1

POLL7 @ssrs_research | 484.840.4300 | www.ssrs.com | 14
1 Braxton Way Suite 125 Glen Mills, PA 19342
484-840-4300 www.ssrs.com
CNN/SSRS Poll -- August 09, 2018 to August 12, 2018
TABLE 008
2R. Do you approve or disapprove of the way Donald Trump is handling Foreign trade?
Base: Respondents who are in half sample B
Trump Trump
Non- ap- disap
Total Men Women White white prove prove
===== ===== ===== ===== ===== ===== =====
Approve 38% 46% 31% 43% N/A 80% 7%
Disapprove 50% 43% 56% 44% N/A 4% 87%
Don't know/Undecided/Refused 12% 11% 13% 14% N/A 16% 6%
Sampling Error (+/-) 5.5 7.1 8.3 6.6 8.0 7.9
Total 18-34 35-49 50-64 65+ <45 45+
===== ===== ===== ===== ===== ===== =====
Approve 38% N/A N/A N/A N/A N/A 42%
Disapprove 50% N/A N/A N/A N/A N/A 46%
Don't know/Undecided/Refused 12% N/A N/A N/A N/A N/A 11%
Sampling Error (+/-) 5.5 6.5
Non- White White
coll. Coll. non- coll.
Total <$50K $50K+ grad grad. coll. grad.
===== ===== ===== ===== ===== ===== =====
Approve 38% N/A 40% 38% 39% N/A N/A
Disapprove 50% N/A 50% 47% 54% N/A N/A
Don't know/Undecided/Refused 12% N/A 10% 15% 7% N/A N/A
Sampling Error (+/-) 5.5 7.1 7.3 7.8
Indep Con
Demo- endnt Repub Lib- Mode- serva
Total crat Other lican eral rate tive
===== ===== ===== ===== ===== ===== =====
Approve 38% N/A N/A N/A N/A N/A N/A
Disapprove 50% N/A N/A N/A N/A N/A N/A
Don't know/Undecided/Refused 12% N/A N/A N/A N/A N/A N/A
Sampling Error (+/-) 5.5
Lean Lean
Demo- Repub Reg.
Total crat lican voter
===== ===== ===== =====
Approve 38% 10% 75% 40%
Disapprove 50% 81% 9% 49%
Don't know/Undecided/Refused 12% 9% 16% 11%
Sampling Error (+/-) 5.5 8.0 8.0 5.8

POLL7 @ssrs_research | 484.840.4300 | www.ssrs.com | 15
1 Braxton Way Suite 125 Glen Mills, PA 19342
484-840-4300 www.ssrs.com
CNN/SSRS Poll -- August 09, 2018 to August 12, 2018
TABLE 039
9. As you may know, Brett Kavanaugh is the federal judge nominated to serve on the Supreme Court. Would you
like to see the Senate vote in favor of Kavanaugh serving on the Supreme Court, or not?
Base: Total Respondents
Trump Trump
Non- ap- disap
Total Men Women White white prove prove
===== ===== ===== ===== ===== ===== =====
Vote in favor 37% 47% 28% 44% 25% 70% 12%
Not vote in favor 40% 35% 46% 36% 50% 8% 68%
Don't know/Undecided/Refused 22% 18% 26% 20% 25% 22% 20%
Sampling Error (+/-) 3.9 5.0 6.0 4.7 7.1 5.8 5.5
Total 18-34 35-49 50-64 65+ <45 45+
===== ===== ===== ===== ===== ===== =====
Vote in favor 37% N/A 33% 41% 43% 32% 42%
Not vote in favor 40% N/A 41% 40% 39% 43% 38%
Don't know/Undecided/Refused 22% N/A 26% 19% 18% 25% 20%
Sampling Error (+/-) 3.9 8.3 6.8 7.0 6.6 4.6
Non- White White
coll. Coll. non- coll.
Total <$50K $50K+ grad grad. coll. grad.
===== ===== ===== ===== ===== ===== =====
Vote in favor 37% 35% 41% 37% 39% 44% 43%
Not vote in favor 40% 42% 42% 38% 46% 33% 42%
Don't know/Undecided/Refused 22% 22% 18% 26% 16% 23% 15%
Sampling Error (+/-) 3.9 6.5 5.0 5.1 5.5 6.4 6.4
Indep Con
Demo- endnt Repub Lib- Mode- serva
Total crat Other lican eral rate tive
===== ===== ===== ===== ===== ===== =====
Vote in favor 37% 12% 38% 74% 19% 31% 62%
Not vote in favor 40% 67% 38% 7% 64% 46% 19%
Don't know/Undecided/Refused 22% 21% 24% 19% 17% 23% 20%
Sampling Error (+/-) 3.9 7.0 6.2 7.4 8.2 6.2 6.7
Lean Lean
Demo- Repub Reg.
Total crat lican voter
===== ===== ===== =====
Vote in favor 37% 13% 70% 40%
Not vote in favor 40% 66% 10% 41%
Don't know/Undecided/Refused 22% 21% 21% 20%
Sampling Error (+/-) 3.9 5.6 5.8 4.1
POLL7 @ssrs_research | 484.840.4300 | www.ssrs.com | 16
1 Braxton Way Suite 125 Glen Mills, PA 19342
484-840-4300 www.ssrs.com
CNN/SSRS Poll -- August 09, 2018 to August 12, 2018
TABLE 040
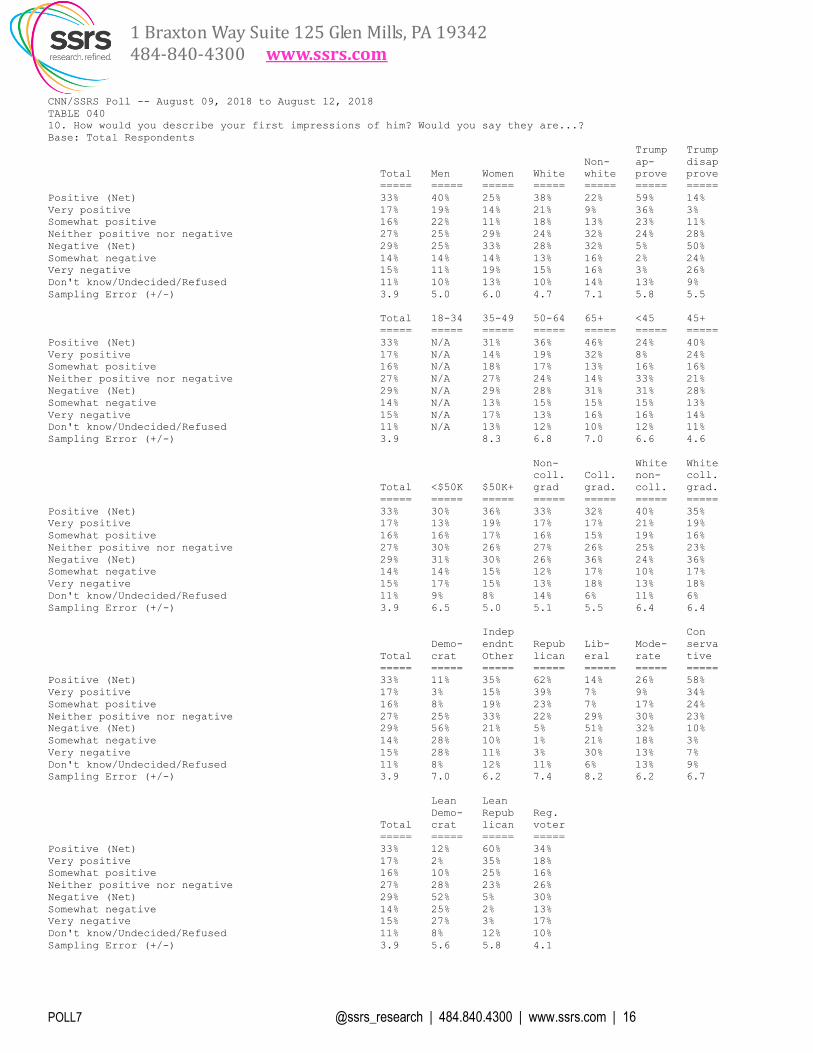
10. How would you describe your first impressions of him? Would you say they are...?
Base: Total Respondents
Trump Trump
Non- ap- disap
Total Men Women White white prove prove
===== ===== ===== ===== ===== ===== =====
Positive (Net) 33% 40% 25% 38% 22% 59% 14%
Very positive 17% 19% 14% 21% 9% 36% 3%
Somewhat positive 16% 22% 11% 18% 13% 23% 11%
Neither positive nor negative 27% 25% 29% 24% 32% 24% 28%
Negative (Net) 29% 25% 33% 28% 32% 5% 50%
Somewhat negative 14% 14% 14% 13% 16% 2% 24%
Very negative 15% 11% 19% 15% 16% 3% 26%
Don't know/Undecided/Refused 11% 10% 13% 10% 14% 13% 9%
Sampling Error (+/-) 3.9 5.0 6.0 4.7 7.1 5.8 5.5
Total 18-34 35-49 50-64 65+ <45 45+
===== ===== ===== ===== ===== ===== =====
Positive (Net) 33% N/A 31% 36% 46% 24% 40%
Very positive 17% N/A 14% 19% 32% 8% 24%
Somewhat positive 16% N/A 18% 17% 13% 16% 16%
Neither positive nor negative 27% N/A 27% 24% 14% 33% 21%
Negative (Net) 29% N/A 29% 28% 31% 31% 28%
Somewhat negative 14% N/A 13% 15% 15% 15% 13%
Very negative 15% N/A 17% 13% 16% 16% 14%
Don't know/Undecided/Refused 11% N/A 13% 12% 10% 12% 11%
Sampling Error (+/-) 3.9 8.3 6.8 7.0 6.6 4.6
Non- White White
coll. Coll. non- coll.
Total <$50K $50K+ grad grad. coll. grad.
===== ===== ===== ===== ===== ===== =====
Positive (Net) 33% 30% 36% 33% 32% 40% 35%
Very positive 17% 13% 19% 17% 17% 21% 19%
Somewhat positive 16% 16% 17% 16% 15% 19% 16%
Neither positive nor negative 27% 30% 26% 27% 26% 25% 23%
Negative (Net) 29% 31% 30% 26% 36% 24% 36%
Somewhat negative 14% 14% 15% 12% 17% 10% 17%
Very negative 15% 17% 15% 13% 18% 13% 18%
Don't know/Undecided/Refused 11% 9% 8% 14% 6% 11% 6%
Sampling Error (+/-) 3.9 6.5 5.0 5.1 5.5 6.4 6.4
Indep Con
Demo- endnt Repub Lib- Mode- serva
Total crat Other lican eral rate tive
===== ===== ===== ===== ===== ===== =====
Positive (Net) 33% 11% 35% 62% 14% 26% 58%
Very positive 17% 3% 15% 39% 7% 9% 34%
Somewhat positive 16% 8% 19% 23% 7% 17% 24%
Neither positive nor negative 27% 25% 33% 22% 29% 30% 23%
Negative (Net) 29% 56% 21% 5% 51% 32% 10%
Somewhat negative 14% 28% 10% 1% 21% 18% 3%
Very negative 15% 28% 11% 3% 30% 13% 7%
Don't know/Undecided/Refused 11% 8% 12% 11% 6% 13% 9%
Sampling Error (+/-) 3.9 7.0 6.2 7.4 8.2 6.2 6.7
Lean Lean
Demo- Repub Reg.
Total crat lican voter
===== ===== ===== =====
Positive (Net) 33% 12% 60% 34%
Very positive 17% 2% 35% 18%
Somewhat positive 16% 10% 25% 16%
Neither positive nor negative 27% 28% 23% 26%
Negative (Net) 29% 52% 5% 30%
Somewhat negative 14% 25% 2% 13%
Very negative 15% 27% 3% 17%
Don't know/Undecided/Refused 11% 8% 12% 10%
Sampling Error (+/-) 3.9 5.6 5.8 4.1

POLL7 @ssrs_research | 484.840.4300 | www.ssrs.com | 17
1 Braxton Way Suite 125 Glen Mills, PA 19342
484-840-4300 www.ssrs.com
CNN/SSRS Poll -- August 09, 2018 to August 12, 2018
TABLE 041
12. Based on what you have heard or read about him, do you think Brett Kavanaugh's views on important issues are
in the mainstream, or do you think they are too extreme?
Base: Total Respondents
Trump Trump
Non- ap- disap
Total Men Women White white prove prove
===== ===== ===== ===== ===== ===== =====
Mainstream 42% 50% 35% 47% 35% 68% 24%
Too extreme 35% 31% 38% 33% 40% 8% 57%
Don't know/Undecided/Refused 23% 19% 27% 21% 26% 24% 19%
Sampling Error (+/-) 3.9 5.0 6.0 4.7 7.1 5.8 5.5
Total 18-34 35-49 50-64 65+ <45 45+
===== ===== ===== ===== ===== ===== =====
Mainstream 42% N/A 39% 40% 44% 42% 43%
Too extreme 35% N/A 35% 41% 34% 33% 36%
Don't know/Undecided/Refused 23% N/A 26% 19% 22% 25% 21%
Sampling Error (+/-) 3.9 8.3 6.8 7.0 6.6 4.6
Non- White White
coll. Coll. non- coll.
Total <$50K $50K+ grad grad. coll. grad.
===== ===== ===== ===== ===== ===== =====
Mainstream 42% 42% 45% 41% 44% 46% 47%
Too extreme 35% 36% 36% 32% 39% 30% 38%
Don't know/Undecided/Refused 23% 23% 19% 26% 16% 24% 15%
Sampling Error (+/-) 3.9 6.5 5.0 5.1 5.5 6.4 6.4
Indep Con
Demo- endnt Repub Lib- Mode- serva
Total crat Other lican eral rate tive
===== ===== ===== ===== ===== ===== =====
Mainstream 42% 21% 47% 69% 25% 36% 66%
Too extreme 35% 60% 27% 10% 59% 39% 15%
Don't know/Undecided/Refused 23% 19% 26% 21% 16% 25% 19%
Sampling Error (+/-) 3.9 7.0 6.2 7.4 8.2 6.2 6.7
Lean Lean
Demo- Repub Reg.
Total crat lican voter
===== ===== ===== =====
Mainstream 42% 24% 68% 45%
Too extreme 35% 57% 9% 36%
Don't know/Undecided/Refused 23% 19% 22% 20%
Sampling Error (+/-) 3.9 5.6 5.8 4.1

POLL7 @ssrs_research | 484.840.4300 | www.ssrs.com | 18
1 Braxton Way Suite 125 Glen Mills, PA 19342
484-840-4300 www.ssrs.com
CNN/SSRS Poll -- August 09, 2018 to August 12, 2018
TABLE 042
13. Democrats in the Senate say that they need to see more documents from Brett Kavanaugh's career in government
before they are willing to vote on his nomination. Do you think that the federal government should have to
provide Senate Democrats with more documents, or do you think the Senate Democrats have enough information now
to vote? If
you have no opinion, please just say so.
Base: Total Respondents
Trump Trump
Non- ap- disap
Total Men Women White white prove prove
===== ===== ===== ===== ===== ===== =====
Should provide more documents 41% 37% 44% 36% 50% 15% 62%
Senate Democrats have enough information 27% 34% 20% 33% 16% 49% 10%
No opinion 31% 28% 34% 31% 31% 34% 28%
Refused 1% 1% 2% 1% 3% 1% 1%
Sampling Error (+/-) 3.9 5.0 6.0 4.7 7.1 5.8 5.5
Total 18-34 35-49 50-64 65+ <45 45+
===== ===== ===== ===== ===== ===== =====
Should provide more documents 41% N/A 42% 40% 41% 44% 38%
Senate Democrats have enough information 27% N/A 24% 33% 34% 20% 33%
No opinion 31% N/A 33% 27% 24% 34% 28%
Refused 1% N/A 2% 1% 1% 1% 1%
Sampling Error (+/-) 3.9 8.3 6.8 7.0 6.6 4.6
Non- White White
coll. Coll. non- coll.
Total <$50K $50K+ grad grad. coll. grad.
===== ===== ===== ===== ===== ===== =====
Should provide more documents 41% 43% 40% 39% 45% 32% 43%
Senate Democrats have enough information 27% 24% 30% 27% 27% 34% 30%
No opinion 31% 32% 29% 33% 27% 33% 26%
Refused 1% 1% 1% 2% 1% 1% *
Sampling Error (+/-) 3.9 6.5 5.0 5.1 5.5 6.4 6.4
Indep Con
Demo- endnt Repub Lib- Mode- serva
Total crat Other lican eral rate tive
===== ===== ===== ===== ===== ===== =====
Should provide more documents 41% 64% 39% 11% 60% 48% 19%
Senate Democrats have enough information 27% 8% 27% 58% 12% 20% 48%
No opinion 31% 28% 33% 30% 27% 32% 31%
Refused 1% * 2% * 2% * 1%
Sampling Error (+/-) 3.9 7.0 6.2 7.4 8.2 6.2 6.7
Lean Lean
Demo- Repub Reg.
Total crat lican voter
===== ===== ===== =====
Should provide more documents 41% 61% 16% 41%
Senate Democrats have enough information 27% 10% 51% 29%
No opinion 31% 28% 33% 29%
Refused 1% 1% 1% 1%
Sampling Error (+/-) 3.9 5.6 5.8 4.1

POLL7 @ssrs_research | 484.840.4300 | www.ssrs.com | 19
1 Braxton Way Suite 125 Glen Mills, PA 19342
484-840-4300 www.ssrs.com
CNN/SSRS Poll -- August 09, 2018 to August 12, 2018
TABLE 043
15. Do you, personally, think that the Congress elected in November should be the one to confirm the justice who
will fill the seat, or do you think that the current Congress should handle the confirmation?
Base: Total Respondents
Trump Trump
Non- ap- disap
Total Men Women White white prove prove
===== ===== ===== ===== ===== ===== =====
Congress elected in November 44% 40% 47% 41% 52% 17% 65%
Current Congress 45% 53% 38% 49% 38% 72% 24%
Don't know/Undecided/Refused 11% 7% 15% 11% 11% 10% 11%
Sampling Error (+/-) 3.9 5.0 6.0 4.7 7.1 5.8 5.5
Total 18-34 35-49 50-64 65+ <45 45+
===== ===== ===== ===== ===== ===== =====
Congress elected in November 44% N/A 41% 39% 45% 48% 41%
Current Congress 45% N/A 46% 49% 41% 44% 47%
Don't know/Undecided/Refused 11% N/A 13% 12% 14% 9% 13%
Sampling Error (+/-) 3.9 8.3 6.8 7.0 6.6 4.6
Non- White White
coll. Coll. non- coll.
Total <$50K $50K+ grad grad. coll. grad.
===== ===== ===== ===== ===== ===== =====
Congress elected in November 44% 49% 41% 44% 44% 41% 40%
Current Congress 45% 41% 50% 44% 49% 47% 52%
Don't know/Undecided/Refused 11% 10% 9% 13% 7% 12% 7%
Sampling Error (+/-) 3.9 6.5 5.0 5.1 5.5 6.4 6.4
Indep Con
Demo- endnt Repub Lib- Mode- serva
Total crat Other lican eral rate tive
===== ===== ===== ===== ===== ===== =====
Congress elected in November 44% 72% 38% 16% 65% 46% 26%
Current Congress 45% 19% 52% 75% 23% 43% 67%
Don't know/Undecided/Refused 11% 9% 11% 9% 12% 11% 7%
Sampling Error (+/-) 3.9 7.0 6.2 7.4 8.2 6.2 6.7
Lean Lean
Demo- Repub Reg.
Total crat lican voter
===== ===== ===== =====
Congress elected in November 44% 68% 18% 44%
Current Congress 45% 21% 74% 46%
Don't know/Undecided/Refused 11% 11% 8% 10%
Sampling Error (+/-) 3.9 5.6 5.8 4.1
POLL7 @ssrs_research | 484.840.4300 | www.ssrs.com | 20
1 Braxton Way Suite 125 Glen Mills, PA 19342
484-840-4300 www.ssrs.com
CNN/SSRS Poll -- August 09, 2018 to August 12, 2018
TABLE 068
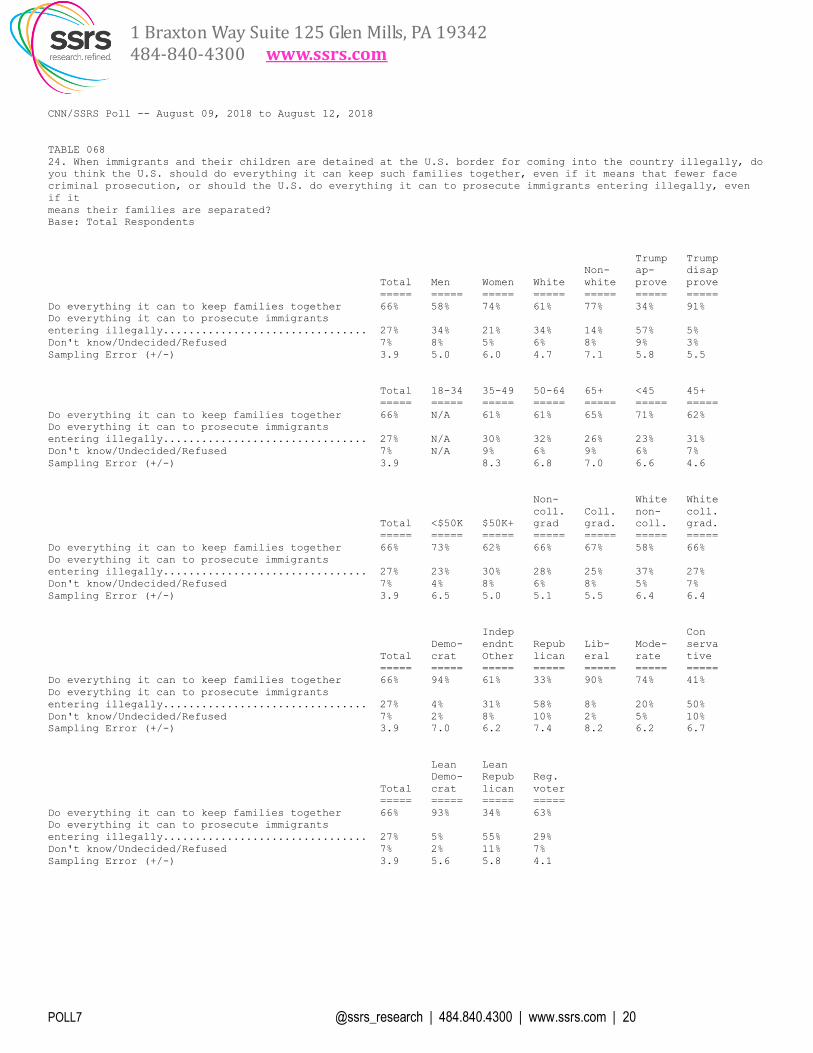
24. When immigrants and their children are detained at the U.S. border for coming into the country illegally, do
you think the U.S. should do everything it can keep such families together, even if it means that fewer face
criminal prosecution, or should the U.S. do everything it can to prosecute immigrants entering illegally, even
if it
means their families are separated?
Base: Total Respondents
Trump Trump
Non- ap- disap
Total Men Women White white prove prove
===== ===== ===== ===== ===== ===== =====
Do everything it can to keep families together 66% 58% 74% 61% 77% 34% 91%
Do everything it can to prosecute immigrants
entering illegally................................ 27% 34% 21% 34% 14% 57% 5%
Don't know/Undecided/Refused 7% 8% 5% 6% 8% 9% 3%
Sampling Error (+/-) 3.9 5.0 6.0 4.7 7.1 5.8 5.5
Total 18-34 35-49 50-64 65+ <45 45+
===== ===== ===== ===== ===== ===== =====
Do everything it can to keep families together 66% N/A 61% 61% 65% 71% 62%
Do everything it can to prosecute immigrants
entering illegally................................ 27% N/A 30% 32% 26% 23% 31%
Don't know/Undecided/Refused 7% N/A 9% 6% 9% 6% 7%
Sampling Error (+/-) 3.9 8.3 6.8 7.0 6.6 4.6
Non- White White
coll. Coll. non- coll.
Total <$50K $50K+ grad grad. coll. grad.
===== ===== ===== ===== ===== ===== =====
Do everything it can to keep families together 66% 73% 62% 66% 67% 58% 66%
Do everything it can to prosecute immigrants
entering illegally................................ 27% 23% 30% 28% 25% 37% 27%
Don't know/Undecided/Refused 7% 4% 8% 6% 8% 5% 7%
Sampling Error (+/-) 3.9 6.5 5.0 5.1 5.5 6.4 6.4
Indep Con
Demo- endnt Repub Lib- Mode- serva
Total crat Other lican eral rate tive
===== ===== ===== ===== ===== ===== =====
Do everything it can to keep families together 66% 94% 61% 33% 90% 74% 41%
Do everything it can to prosecute immigrants
entering illegally................................ 27% 4% 31% 58% 8% 20% 50%
Don't know/Undecided/Refused 7% 2% 8% 10% 2% 5% 10%
Sampling Error (+/-) 3.9 7.0 6.2 7.4 8.2 6.2 6.7
Lean Lean
Demo- Repub Reg.
Total crat lican voter
===== ===== ===== =====
Do everything it can to keep families together 66% 93% 34% 63%
Do everything it can to prosecute immigrants
entering illegally................................ 27% 5% 55% 29%
Don't know/Undecided/Refused 7% 2% 11% 7%
Sampling Error (+/-) 3.9 5.6 5.8 4.1

POLL7 @ssrs_research | 484.840.4300 | www.ssrs.com | 21
1 Braxton Way Suite 125 Glen Mills, PA 19342
484-840-4300 www.ssrs.com
CNN/SSRS Poll -- August 09, 2018 to August 12, 2018
TABLE 069
25. As you may know, a judge has ordered the Trump administration to reunite parents and children who were
separated at the border. Do you approve or disapprove of the way the Trump administration has handled the
reunifications so far?
Base: Total Respondents
Trump Trump
Non- ap- disap
Total Men Women White white prove prove
===== ===== ===== ===== ===== ===== =====
Approve 39% 44% 34% 45% 27% 75% 13%
Disapprove 53% 49% 57% 48% 63% 15% 84%
Don't know/Undecided/Refused 8% 8% 9% 7% 11% 10% 3%
Sampling Error (+/-) 3.9 5.0 6.0 4.7 7.1 5.8 5.5
Total 18-34 35-49 50-64 65+ <45 45+
===== ===== ===== ===== ===== ===== =====
Approve 39% N/A 40% 44% 34% 37% 41%
Disapprove 53% N/A 50% 49% 57% 54% 52%
Don't know/Undecided/Refused 8% N/A 10% 7% 9% 9% 8%
Sampling Error (+/-) 3.9 8.3 6.8 7.0 6.6 4.6
Non- White White
coll. Coll. non- coll.
Total <$50K $50K+ grad grad. coll. grad.
===== ===== ===== ===== ===== ===== =====
Approve 39% 39% 38% 42% 32% 52% 34%
Disapprove 53% 53% 54% 49% 61% 41% 60%
Don't know/Undecided/Refused 8% 8% 7% 9% 7% 7% 7%
Sampling Error (+/-) 3.9 6.5 5.0 5.1 5.5 6.4 6.4
Indep Con
Demo- endnt Repub Lib- Mode- serva
Total crat Other lican eral rate tive
===== ===== ===== ===== ===== ===== =====
Approve 39% 11% 44% 72% 21% 32% 63%
Disapprove 53% 81% 48% 18% 73% 62% 28%
Don't know/Undecided/Refused 8% 7% 8% 10% 7% 6% 9%
Sampling Error (+/-) 3.9 7.0 6.2 7.4 8.2 6.2 6.7
Lean Lean
Demo- Repub Reg.
Total crat lican voter
===== ===== ===== =====
Approve 39% 15% 71% 40%
Disapprove 53% 80% 19% 52%
Don't know/Undecided/Refused 8% 6% 11% 8%
Sampling Error (+/-) 3.9 5.6 5.8 4.1

POLL7 @ssrs_research | 484.840.4300 | www.ssrs.com | 22
1 Braxton Way Suite 125 Glen Mills, PA 19342
484-840-4300 www.ssrs.com
CNN/SSRS Poll -- August 09, 2018 to August 12, 2018
TABLE 070
26. U.S. assets in space are currently protected by the Air Force. Do you think the U.S. should establish a new
branch of the military designed to protect U.S. assets in space, or not?
Base: Total Respondents
Trump Trump
Non- ap- disap
Total Men Women White white prove prove
===== ===== ===== ===== ===== ===== =====
Yes, should establish space force 37% 40% 33% 35% 40% 50% 26%
No, should not establish space force 55% 53% 56% 57% 52% 40% 67%
Don't know/Undecided/Refused 8% 6% 10% 8% 8% 10% 7%
Sampling Error (+/-) 3.9 5.0 6.0 4.7 7.1 5.8 5.5
Total 18-34 35-49 50-64 65+ <45 45+
===== ===== ===== ===== ===== ===== =====
Yes, should establish space force 37% N/A 33% 37% 36% 36% 37%
No, should not establish space force 55% N/A 57% 57% 51% 56% 54%
Don't know/Undecided/Refused 8% N/A 9% 5% 13% 7% 9%
Sampling Error (+/-) 3.9 8.3 6.8 7.0 6.6 4.6
Non- White White
coll. Coll. non- coll.
Total <$50K $50K+ grad grad. coll. grad.
===== ===== ===== ===== ===== ===== =====
Yes, should establish space force 37% 42% 33% 42% 26% 40% 25%
No, should not establish space force 55% 51% 58% 50% 67% 52% 67%
Don't know/Undecided/Refused 8% 7% 8% 9% 7% 9% 8%
Sampling Error (+/-) 3.9 6.5 5.0 5.1 5.5 6.4 6.4
Indep Con
Demo- endnt Repub Lib- Mode- serva
Total crat Other lican eral rate tive
===== ===== ===== ===== ===== ===== =====
Yes, should establish space force 37% 28% 37% 50% 27% 35% 47%
No, should not establish space force 55% 65% 55% 44% 63% 59% 45%
Don't know/Undecided/Refused 8% 8% 8% 6% 10% 6% 8%
Sampling Error (+/-) 3.9 7.0 6.2 7.4 8.2 6.2 6.7
Lean Lean
Demo- Repub Reg.
Total crat lican voter
===== ===== ===== =====
Yes, should establish space force 37% 27% 50% 36%
No, should not establish space force 55% 65% 44% 56%
Don't know/Undecided/Refused 8% 7% 7% 8%
Sampling Error (+/-) 3.9 5.6 5.8 4.1