Embed Size (px)
Citation preview

BUDGETING
EMBA PresentationOctober 20, 2013
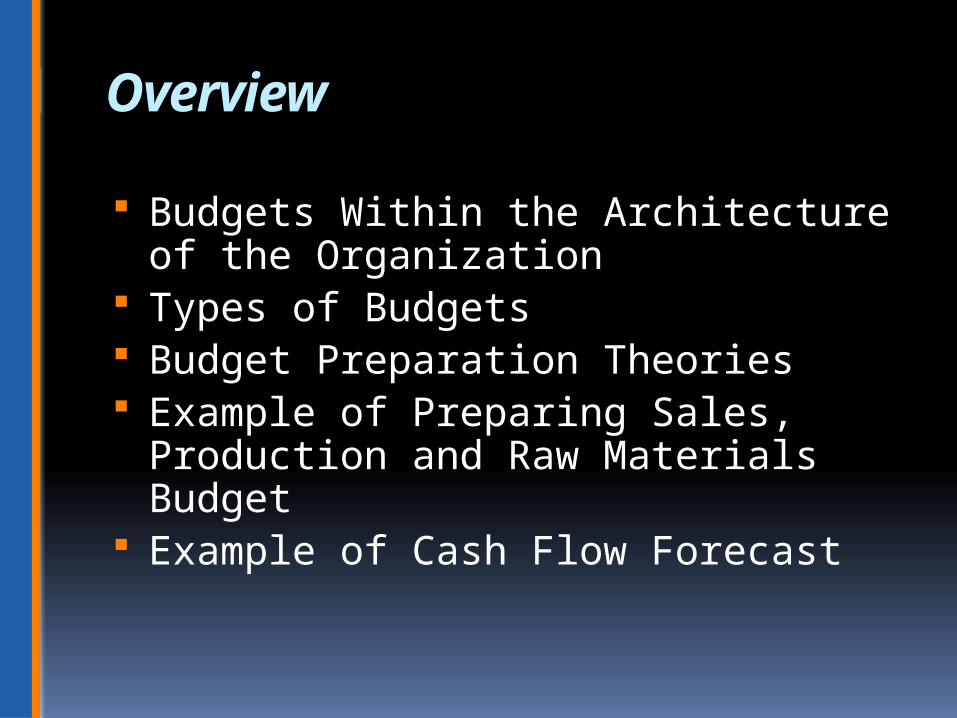
Overview
Budgets Within the Architecture of the Organization
Types of Budgets Budget Preparation Theories Example of Preparing Sales,
Production and Raw Materials Budget Example of Cash Flow Forecast
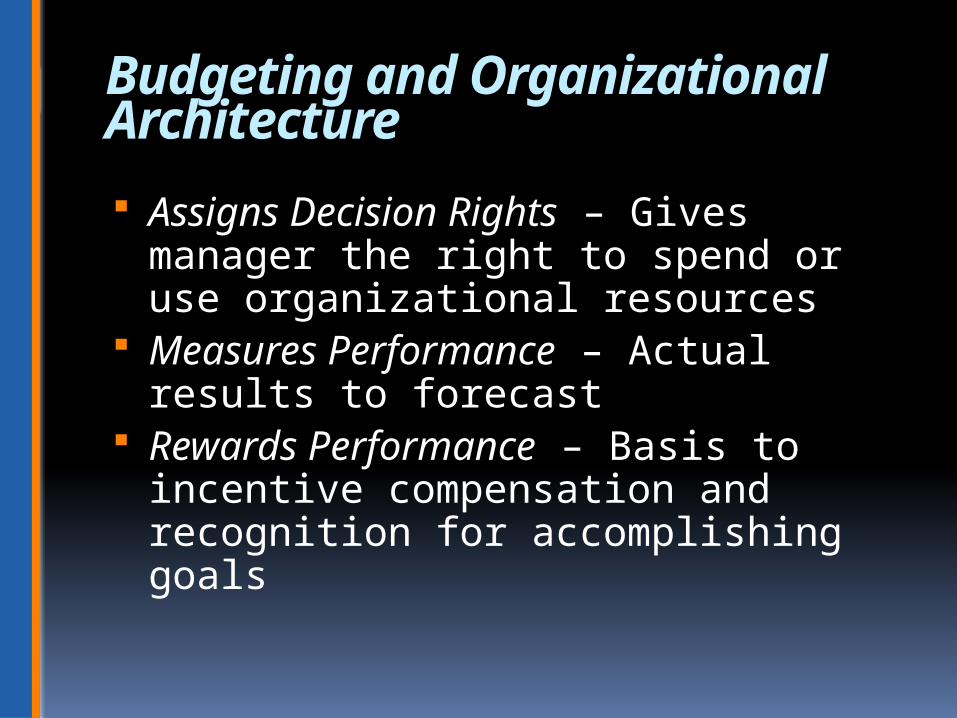
Budgeting and Organizational Architecture Assigns Decision Rights – Gives
manager the right to spend or use organizational resources
Measures Performance – Actual results to forecast
Rewards Performance – Basis to incentive compensation and recognition for accomplishing goals

Types of Budgets
Strategic Plan Long Term Budget Operating Budget
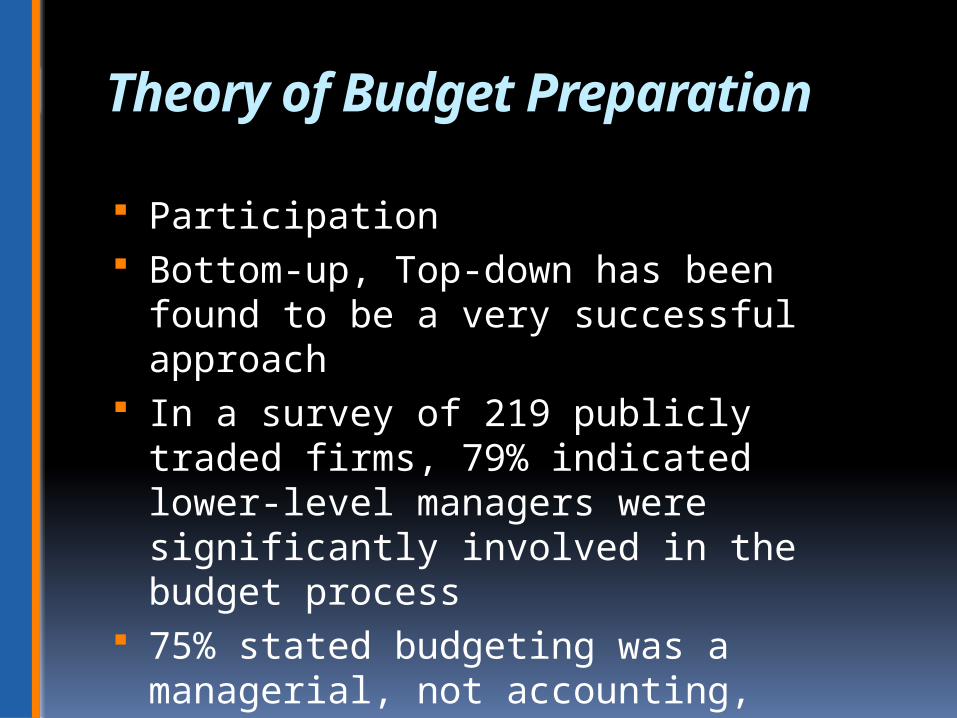
Theory of Budget Preparation Participation Bottom-up, Top-down has been found to
be a very successful approach In a survey of 219 publicly traded firms,
79% indicated lower-level managers were significantly involved in the budget process
75% stated budgeting was a managerial, not accounting, function
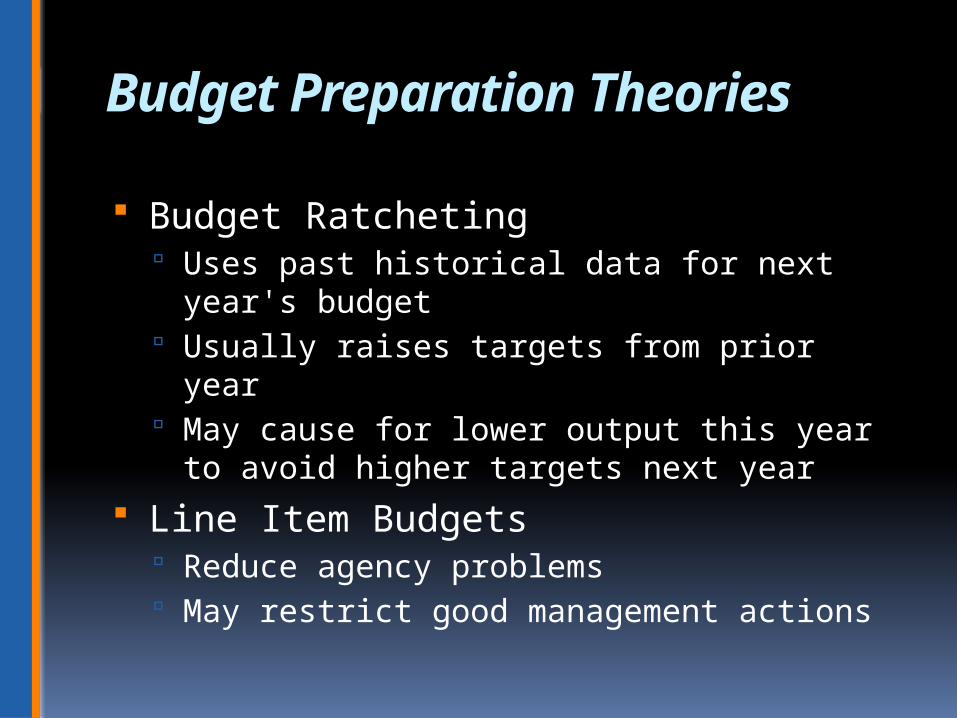
Budget Preparation Theories Budget Ratcheting
Uses past historical data for next year's budget
Usually raises targets from prior year May cause for lower output this year to
avoid higher targets next year
Line Item Budgets Reduce agency problems May restrict good management actions
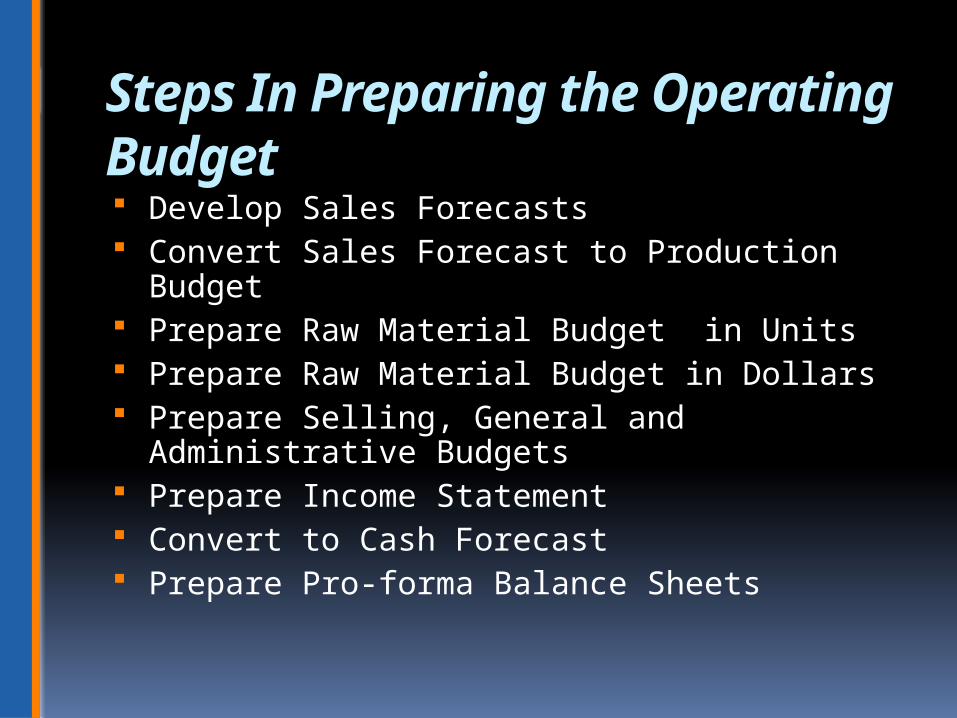
Steps In Preparing the Operating Budget Develop Sales Forecasts Convert Sales Forecast to Production Budget Prepare Raw Material Budget in Units Prepare Raw Material Budget in Dollars Prepare Selling, General and Administrative
Budgets Prepare Income Statement Convert to Cash Forecast Prepare Pro-forma Balance Sheets

PREPARATION OF THE SALES BUDGET
The First Step to Proper Planning of Production
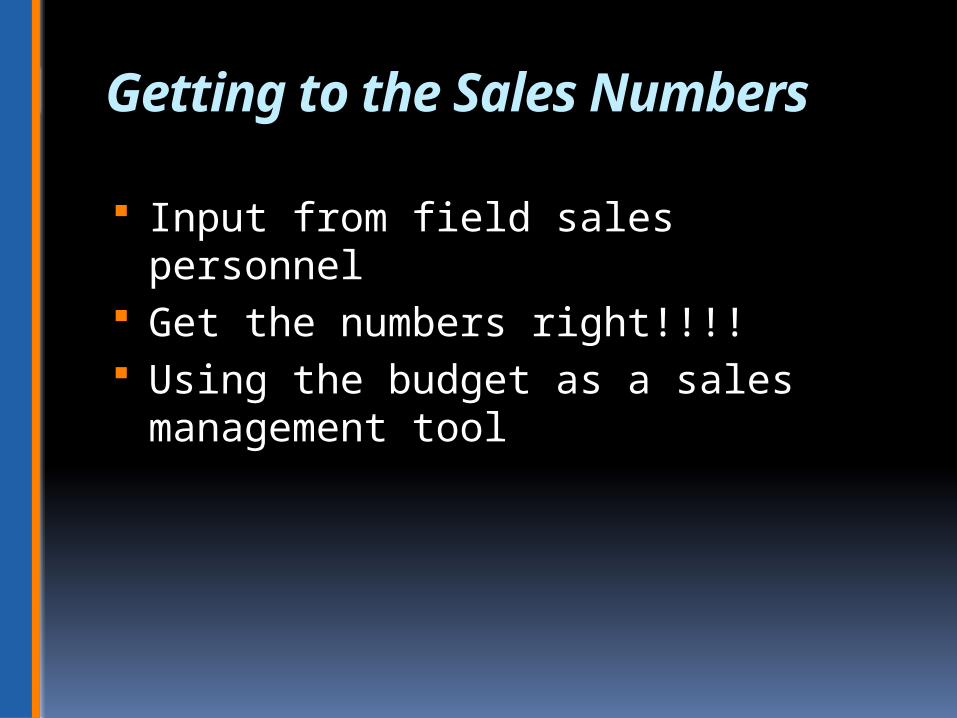
Getting to the Sales Numbers Input from field sales personnel Get the numbers right!!!! Using the budget as a sales
management tool
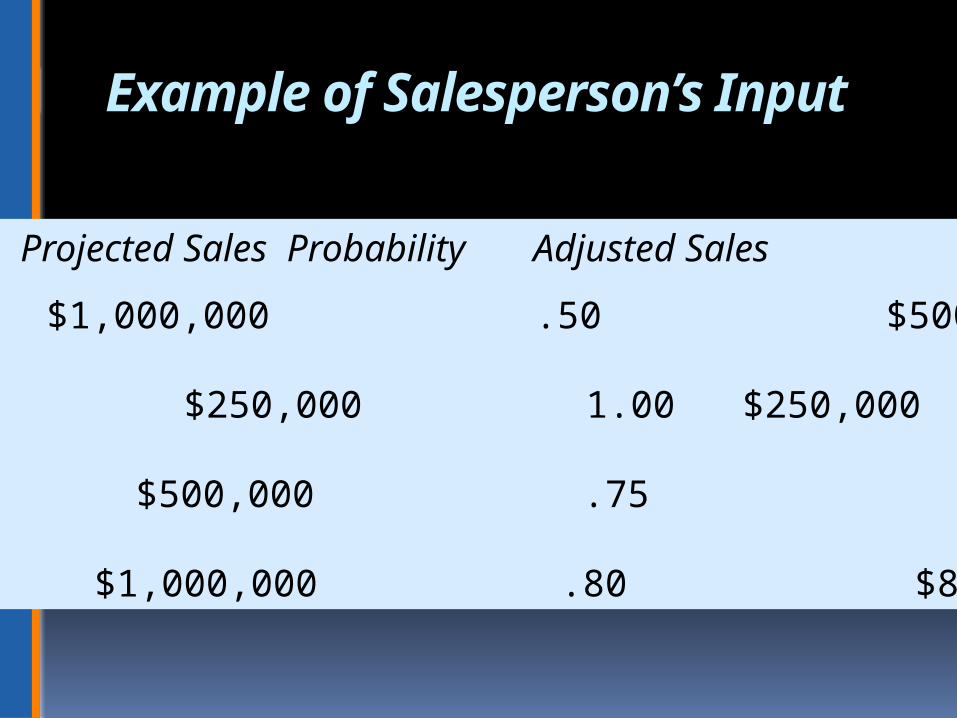
Example of Salesperson’s Input
Customer Projected Sales Probability Adjusted Sales
A $1,000,000 .50 $500,000
B $250,000 1.00 $250,000
C $500,000 .75 $375,000
Misc. $1,000,000 .80 $800,000

Sales Projections for Production Budget
January 5,000 Units February 6,000 Units March 8,000 Units April 7,000 Units May 6,000 Units
Production Assumptions
Require 30% of next month’s sales on hand at beginning of month
Project to have 1,000 units on hand at beginning of January
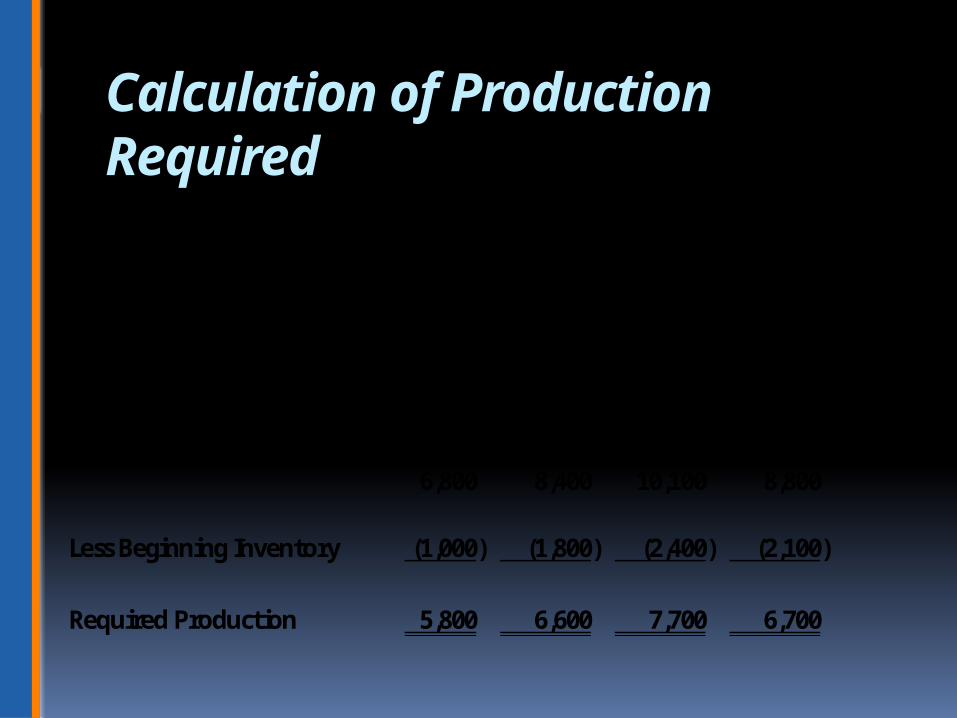
Calculation of Production Required
Production BudgetJan - Apr 2013
Jan Feb Mar Apr MayProjected Sales in Units 5,000 6,000 8,000 7,000 6,000
Projected Ending Inventory 1,800 2,400 2,100 1,800 6,800 8,400 10,100 8,800
Less Beginning Inventory (1,000) (1,800) (2,400) (2,100)
Required Production 5,800 6,600 7,700 6,700
Additional Assumptions
10% of next month’s raw materials must be on hand at beginning of month
Project 5,000 units on hand at begining Production process uses 5 units of raw
product for each unit of finished product Raw product costs $10.00 per unit Direct labor cost is $15.00/hour and it takes
one hour to make each finished product Overhead is applied at $4.00 per DLH
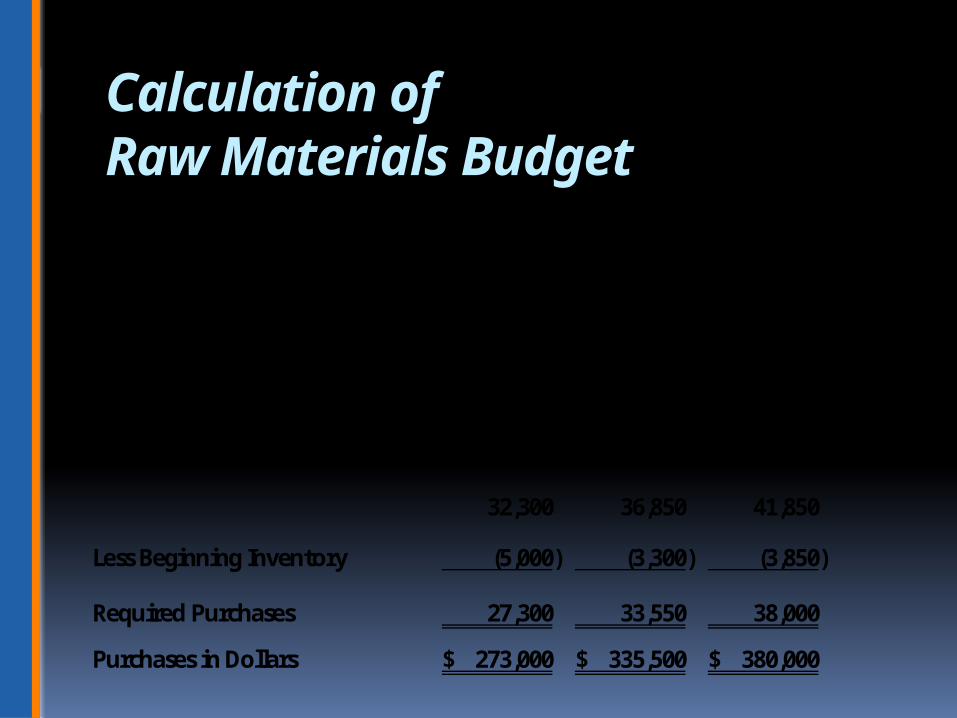
Calculation of Raw Materials Budget
Raw Materials BudgetJan - Apr 2013
Jan Feb Mar AprRequired Production 5,800 6,600 7,700 6,700
Raw Materials 29,000 33,000 38,500 33,500
Projected Ending Inventory 3,300 3,850 3,350
32,300 36,850 41,850
Less Beginning Inventory (5,000) (3,300) (3,850)
Required Purchases 27,300 33,550 38,000
Purchases in Dollars 273,000$ 335,500$ 380,000$
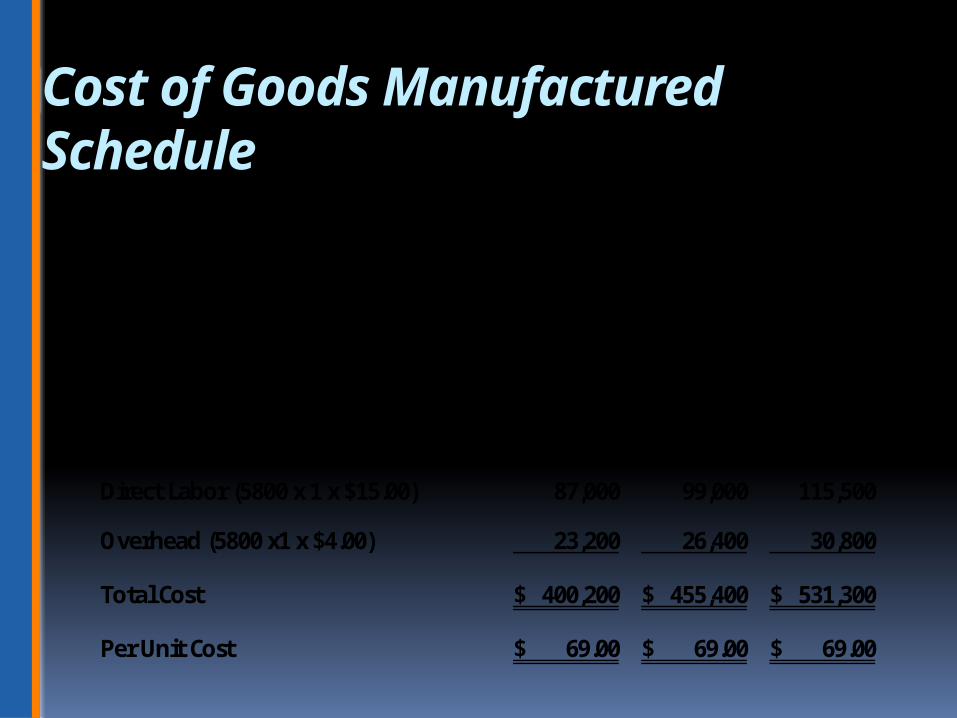
Cost of Goods Manufactured Schedule
Cost of Goods Manufactured ScheduleJan - Mar
Jan Feb MarUnits Produced 5,800 6,600 7,700
Cost of Units Produced:
Raw Material (5800 x 5 x $10) 290,000$ 330,000$ 385,000$
Direct Labor (5800 x 1 x $15.00) 87,000 99,000 115,500
Overhead (5800 x1 x $4.00) 23,200 26,400 30,800
Total Cost 400,200$ 455,400$ 531,300$
Per Unit Cost 69.00$ 69.00$ 69.00$

PREPARING THE CASH FORECAST
Must Be Done Prior to Preparation of Pro-forma
Balance Sheets
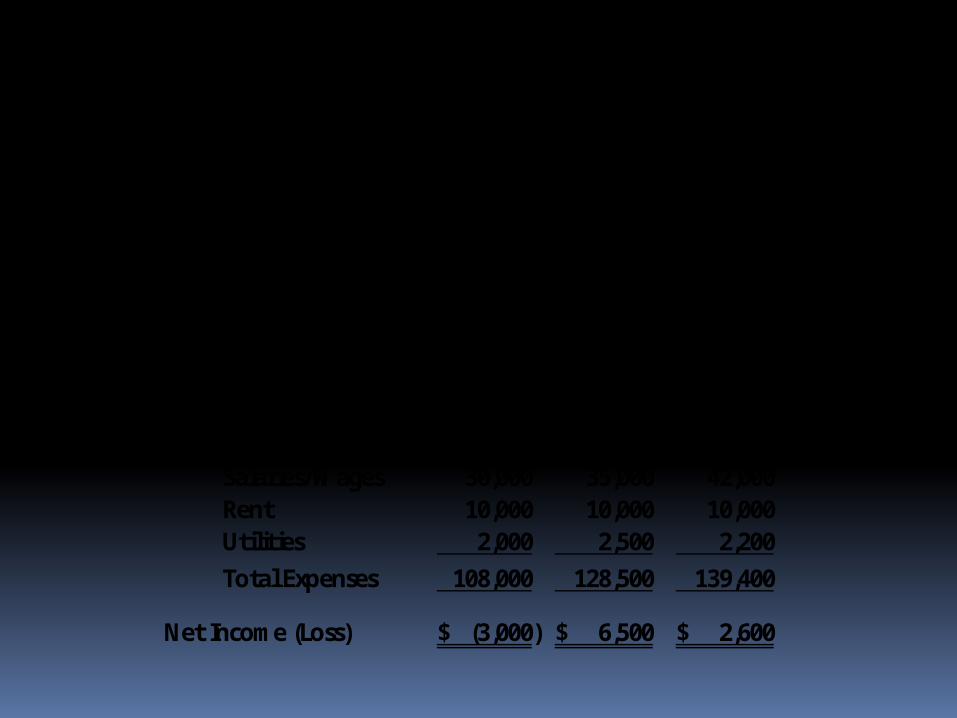
Harry's HabadasheryProjected Income StatementsThree Months Ending August 31, 2013
Jun Jul AugSales
Cash Sales 5,000$ 10,000$ 12,000$ On Account Sales 100,000 125,000 130,000 Total Sales 105,000 135,000 142,000
Expenses:Cost of Goods Sold 66,000 81,000 85,200 Salaries/Wages 30,000 35,000 42,000 Rent 10,000 10,000 10,000 Utilities 2,000 2,500 2,200 Total Expenses 108,000 128,500 139,400
Net Income (Loss) (3,000)$ 6,500$ 2,600$
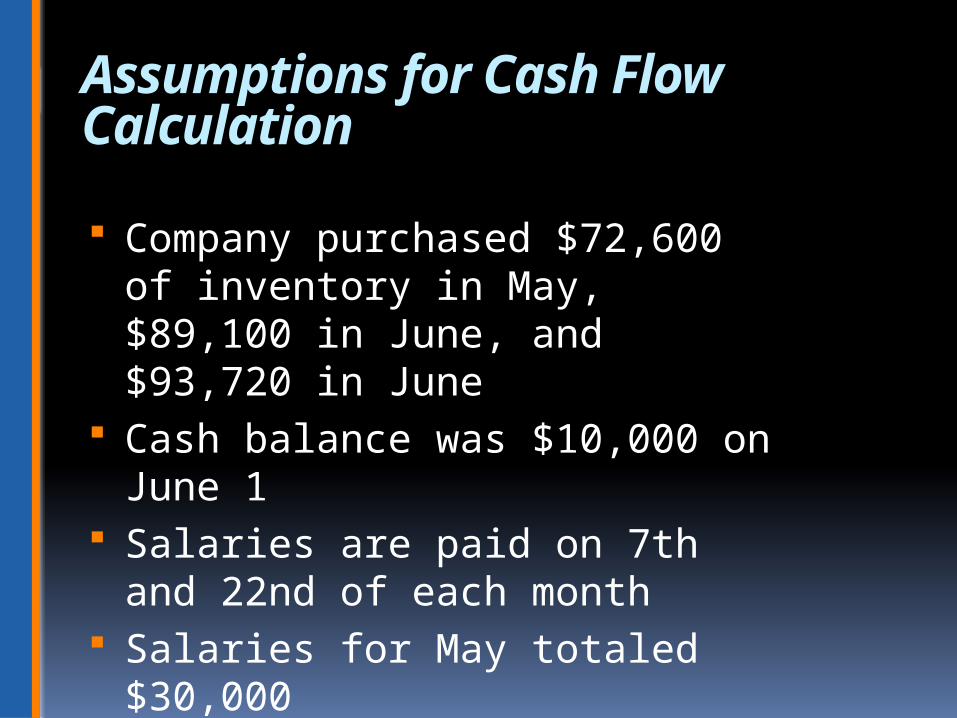
Assumptions for Cash Flow Calculation
Company purchased $72,600 of inventory in May, $89,100 in June, and $93,720 in June
Cash balance was $10,000 on June 1
Salaries are paid on 7th and 22nd of each month
Salaries for May totaled $30,000
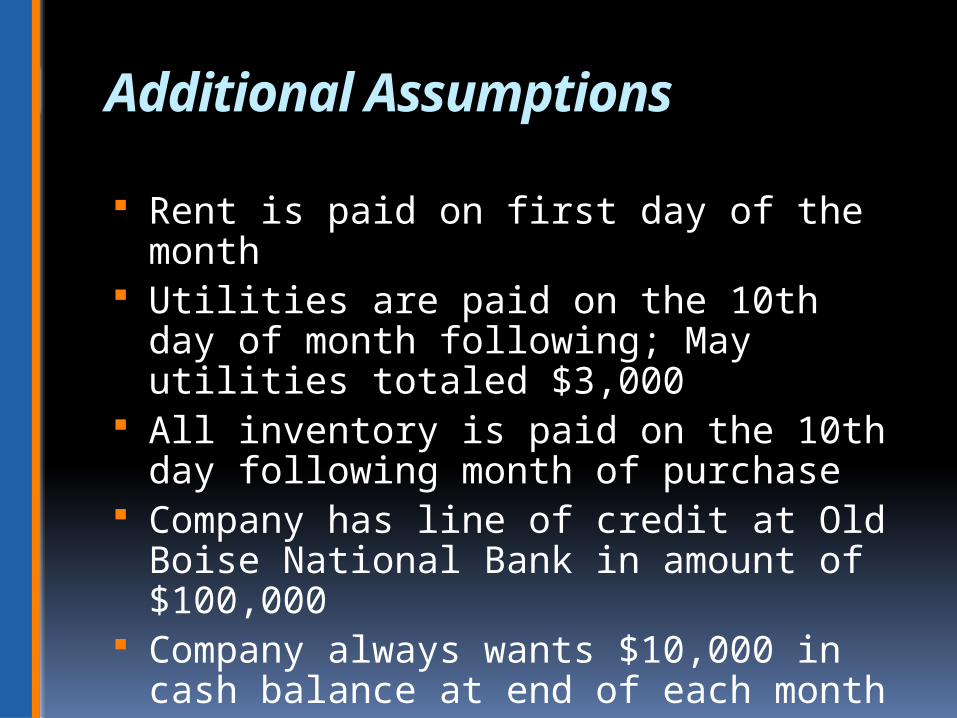
Additional Assumptions
Rent is paid on first day of the month Utilities are paid on the 10th day of
month following; May utilities totaled $3,000
All inventory is paid on the 10th day following month of purchase
Company has line of credit at Old Boise National Bank in amount of $100,000
Company always wants $10,000 in cash balance at end of each month
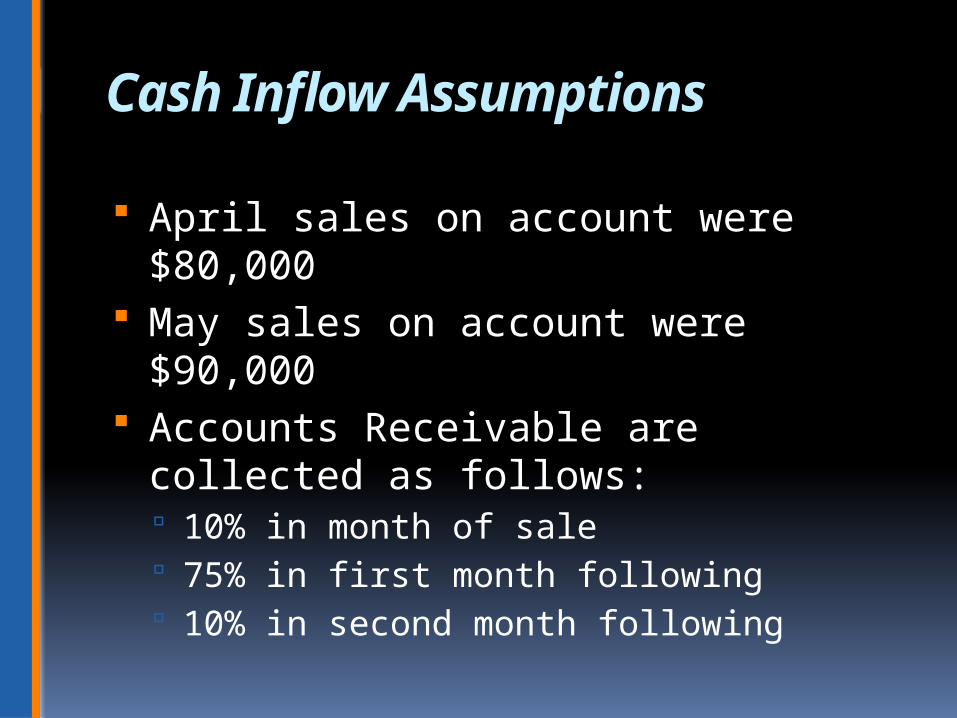
Cash Inflow Assumptions
April sales on account were $80,000 May sales on account were $90,000 Accounts Receivable are collected as
follows: 10% in month of sale 75% in first month following 10% in second month following
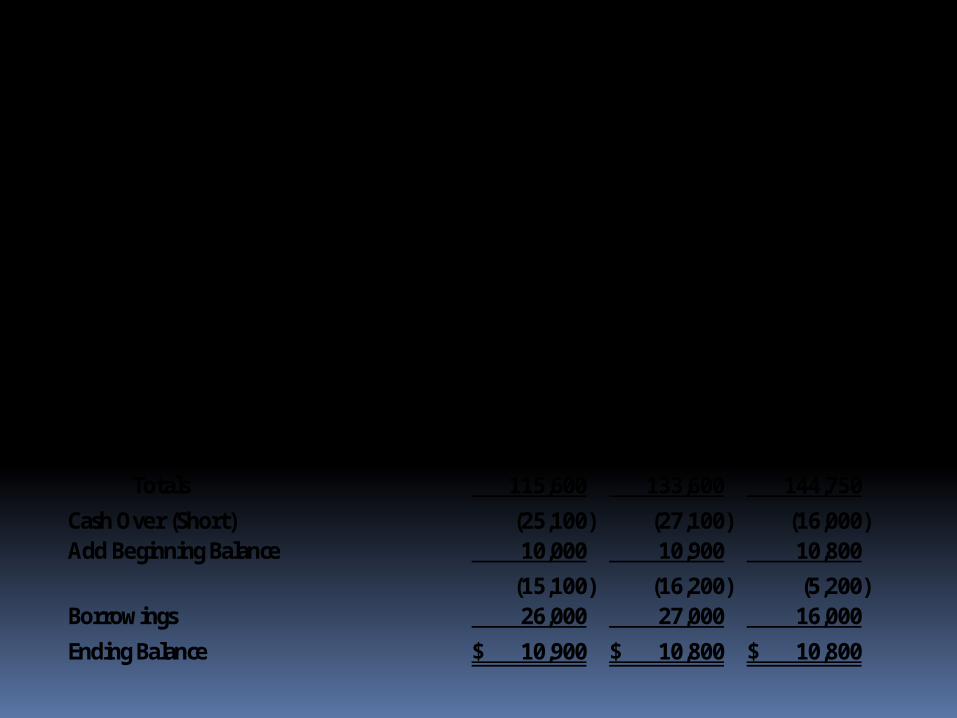
Cash Flow ForecastJun - Aug 2013
Jun Jul Aug
Cash Inflows:Cash Sales 5,000$ 10,000$ 12,000$ Sales on Account 85,500 96,500 116,750
Totals 90,500 106,500 128,750
Cash Outflows:Rent 10,000 10,000 10,000 Utilities 3,000 2,000 2,500 Salaries and wages 30,000 32,500 38,500 Inventory 72,600 89,100 93,720
Totals 115,600 133,600 144,750
Cash Over (Short) (25,100) (27,100) (16,000) Add Beginning Balance 10,000 10,900 10,800
(15,100) (16,200) (5,200) Borrowings 26,000 27,000 16,000
Ending Balance 10,900$ 10,800$ 10,800$
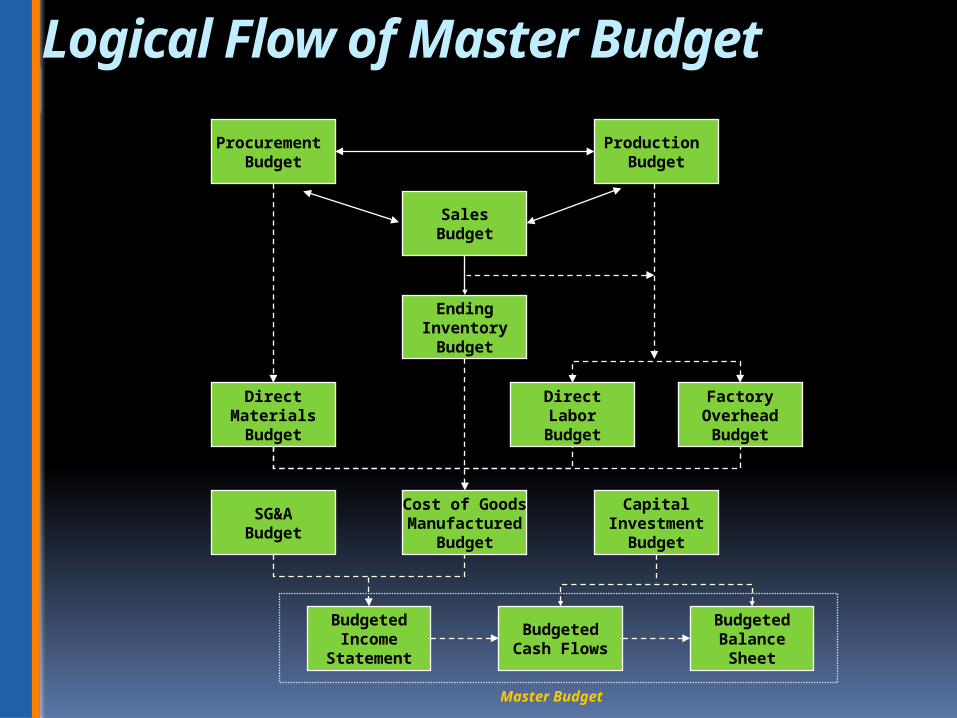
Logical Flow of Master Budget
Procurement Budget
SalesBudget
Production Budget
EndingInventory
Budget
DirectMaterials
Budget
DirectLaborBudget
FactoryOverhead
Budget
SG&ABudget
Cost of GoodsManufactured
Budget
CapitalInvestment
Budget
BudgetedIncome
Statement
BudgetedBalance
Sheet
BudgetedCash Flows
Master Budget

Copyright by Frank Ilett, 2012