Embed Size (px)
Citation preview

1
Quality Assessment of Drilled Shaft Foundations at the Jane Byrne Interchange
Elvis Ishimwe, Ph.D.1 and Travis Coleman, P.E.2
1GRL Engineers, Inc., 6677 Lincoln Avenue, Lincolnwood, IL 60712; Phone: 331-625-0202, email: [email protected]
2GRL Engineers, Inc., 6677 Lincoln Avenue, Lincolnwood, IL 60712; Phone: 847-593-0992, email: [email protected]
ABSTRACT:
Currently, more than 400 drilled shafts have been constructed by various contractors at the
I-90/94 and I-290 Jane Byrne (Circle) Interchange, located near downtown Chicago, Illinois.
Cross-Hole Sonic Logging (CSL) and Thermal Integrity Profiling (TIP) tests were performed to
evaluate the integrity and concrete quality of the drilled shafts installed at this project. For Phase I
of the project the shafts were tested using CSL methods, and the shaft integrity was identified by
analyzing the First Arrival Time (FAT) and the signal strength (energy) measurements. For the
major portion of Phase II, the Illinois Department of Transportation (IDOT) accepted TIP testing
as a substitute for CSL at the request of the contractors. The CSL testing results indicated 54
percent of the tested shafts had anomalies, and 78 percent of these anomalies were located within
the lower three diameters of the shafts. To date, TIP testing results indicated the shaft integrity
was as expected and acceptable for the all 34 tested shafts. A review of the testing results and a
discussion of the detected anomalies are presented. In addition, a comparison of both TIP and CSL
measurements is presented in this paper.
Keyword: Drilled Shafts, Cross Hole Sonic Logging, Thermal Integrity Profiling, Anomalies.
INTRODUCTION
Drilled shafts are typically used to transfer large loads for heavy structures (e.g., multi-
story buildings and large-span bridges) to competent soil layers when unfavorable soil and
groundwater conditions or liquefiable layers are encountered. Construction issues in drilled shafts,
such as cracks, necking, bulging, honeycombing, soil inclusion and loss of concrete cover, can
significantly affect the performance of a drilled shaft. To assess the condition of concrete within
the shafts, there are a number of Non-Destructive Testing (NDT) integrity test methods available

2
as an important part of the overall quality assurance (QA) and quality control (QC) during the
foundation construction process. These methods include: Cross-hole Sonic Logging (CSL), Low
Strain (PIT, Sonic Echo or Impulse Response) Gamma-Gamma, and Thermal Integrity Profile
Testing methods. Utilization of these tests may vary by region. In general, for drilled shafts on
larger private and DOT projects the norm is for CSL and/or TIP methods to evaluate the integrity
of drilled shafts.
CROSS-HOLE SONIC LOGGING (CSL) METHOD
CSL is the most commonly specified integrity test method and is typically performed in
accordance with ASTM D6760. CSL test is typically performed within 3 to 15 days after concrete
placement. The test is performed using tubes that are tied to the reinforcing cage prior to concrete
placement. The CSL access tubes can be PVC pipes (Schedule 80 or Schedule 40 for short shafts)
or steel tubes (Schedule 40). PVC pipes are less expensive but tend to debond more rapidly from
concrete than steel tubes (Mullins et al. 2007). Most cold weather states, including Illinois, only
allow steel tubes. The number of access tubes installed within the shafts should be at least one
tube for each foot of shaft diameter spaced evenly around the reinforcing cage diameter.
The CSL test is performed by lowering and raising transmitter and receiver probes in
vertical access tubes that are filled with water. The Cross-Hole Analyzer (CHA) testing system
generates electrical signals that are converted into ultrasonic vibrations by the transmitter probe.
These pulses generate sonic waves that travel from the transmitter through concrete and to the
receiver probes, causing a slight vibration of the receiver. The receiver probe then converts this
vibration back to an electrical signal. Both the time required for the generated sonic waves, referred
as “First Arrival Time (FAT)” and the relative signal strength (energy) are measured. The FAT is
the inverse of the concrete wave speed based on tube to tube measurements. The spacing measured
at the top of the shaft is generally assumed to be uniform from bottom to the top shaft, although it
is common to observe some variation in the tube location over the length of a shaft.
CSL Criteria
The rating criteria for CSL results normally consists of FAT and signal energy
measurements. The Federal Highway Administration provides rating criteria known as Concrete
Condition Rating Criteria (CCRC) that is based on velocity reduction alone. From CCRC, the
CSL results with a velocity reduction from 10 to 20 percent (FAT delay of 11 to 25 percent) are
3
rated Questionable and velocity decreases greater than 20 percent is rated Poor/Defect. The authors
have historically defined a “Flaw” as an increase in the first arrival time of between 21 and 30
percent or a signal energy reduction of 9 to 12 decibels (dB) and a “Defect” is defined by an
increase in arrival time greater than 30 percent of the first arrival time or a decrease in relative
signal energy greater than 12 dB.
As reported by Sellountou et al. (2019), there are some opinions in industry indicating that
the term “defect” should not be used until an anomaly or irregularity has been proven likely to
significantly reduce the resistance capacity and the durability of the shafts. The DFI white paper
on CSL terminology and evaluation by Sellountou et al. (2019) recommended ceasing use of the
terms “Flaw” and “Defect,” and provided revised rating criteria. The criteria classified data with
a FAT delay less than 15 percent and an energy decrease less than 9 dB as Class A, a FAT delay
between 15 and 30 percent or an energy decrease between 9 and 12 dB as Class B, and a FAT
delay greater than 30 percent or an energy decrease greater than 12 dB as Class C. Class A data
is considering within normal or acceptable range, and Class B and C have specific
recommendations. It is noted that these classifications are to be applied to specific locations and
not the shaft as a whole. A shaft is not identified as Class B, though a specific depth in between
specific tubes can be identified as Class B.
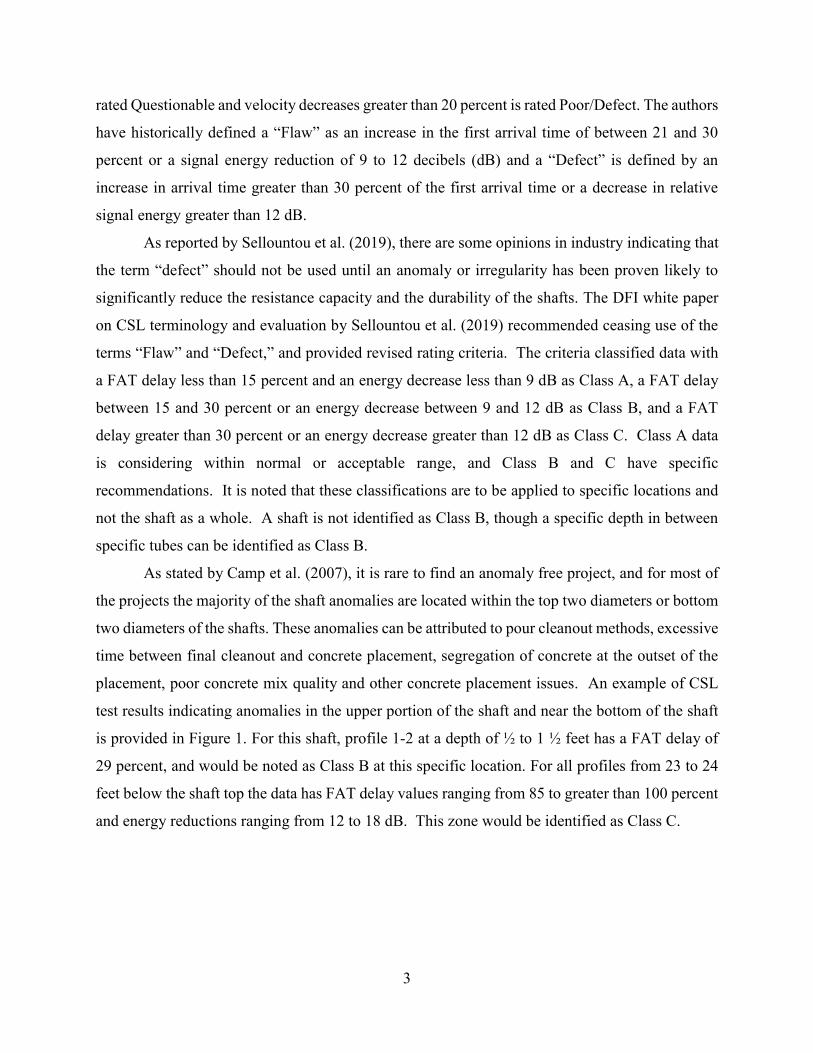
As stated by Camp et al. (2007), it is rare to find an anomaly free project, and for most of
the projects the majority of the shaft anomalies are located within the top two diameters or bottom
two diameters of the shafts. These anomalies can be attributed to pour cleanout methods, excessive
time between final cleanout and concrete placement, segregation of concrete at the outset of the
placement, poor concrete mix quality and other concrete placement issues. An example of CSL
test results indicating anomalies in the upper portion of the shaft and near the bottom of the shaft
is provided in Figure 1. For this shaft, profile 1-2 at a depth of ½ to 1 ½ feet has a FAT delay of
29 percent, and would be noted as Class B at this specific location. For all profiles from 23 to 24
feet below the shaft top the data has FAT delay values ranging from 85 to greater than 100 percent
and energy reductions ranging from 12 to 18 dB. This zone would be identified as Class C.
4
Figure 1. An example of CSL test results “waterfall” with anomalies located at the upper portion and bottom of the shaft, respectively (GRL report).
Thermal Integrity Profile (TIP) Method
TIP testing is a more recent available non-destructive test method. This method consists of
monitoring the temperature generated during the concrete curing process to assess the integrity
and the concrete quality of cast-in-place deep foundations in general accordance with ASTM
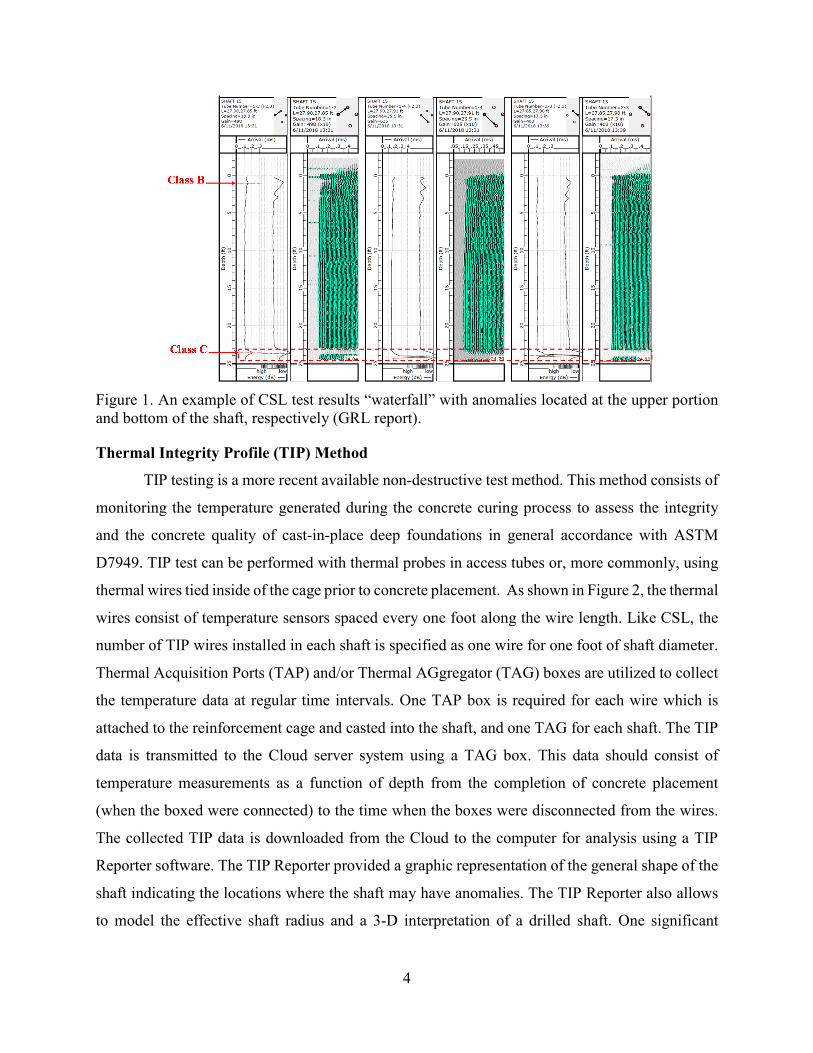
D7949. TIP test can be performed with thermal probes in access tubes or, more commonly, using
thermal wires tied inside of the cage prior to concrete placement. As shown in Figure 2, the thermal
wires consist of temperature sensors spaced every one foot along the wire length. Like CSL, the
number of TIP wires installed in each shaft is specified as one wire for one foot of shaft diameter.
Thermal Acquisition Ports (TAP) and/or Thermal AGgregator (TAG) boxes are utilized to collect
the temperature data at regular time intervals. One TAP box is required for each wire which is
attached to the reinforcement cage and casted into the shaft, and one TAG for each shaft. The TIP
data is transmitted to the Cloud server system using a TAG box. This data should consist of
temperature measurements as a function of depth from the completion of concrete placement
(when the boxed were connected) to the time when the boxes were disconnected from the wires.
The collected TIP data is downloaded from the Cloud to the computer for analysis using a TIP
Reporter software. The TIP Reporter provided a graphic representation of the general shape of the
shaft indicating the locations where the shaft may have anomalies. The TIP Reporter also allows
to model the effective shaft radius and a 3-D interpretation of a drilled shaft. One significant
5
advantage of TIP testing is the data is analyzed at or slightly before peak concrete temperature,
which generally occurs one or two days after placement.
(a) (b)
Figure 2. (a) A schematic of a thermal wire assembly attached to a reinforcement cage, and (b) TAP and TAG boxes (photo courtesy of Pile Dynamics, Inc).
While the CSL testing assesses the concrete between tubes inside of the cage, thermal
methods allow to detect the anomalies both inside and outside of reinforcing cage. From the TIP
results, the size and the location of bulges, necks, variations in concrete cover, and the cage
alignment or shifting can be determined. The shaft integrity evaluation using TIP results involves
modeling the temperature readings as a function of time based on the placed concrete volume,
shaft properties and the soil profile. A shaft is considered to be uniform shape or in normal
condition when the measured temperature as a function of depth is consistent. An increase and
decrease of measured temperature indicate a bulge and a neck, respectively. A decrease of local
temperature in TIP results can also indicate the areas of a void or soil intrusion (no heat). The cage
shifting can be identified if two diametrically opposing wires have temperature readings that are
higher and lower than the average temperature. For TIP testing, the authors defined anomalous
shaft as a shaft that has a reduction of at least 6% of the shaft radius. Figure 3 shows an example
of TIP results for a shaft that has a bulge from 25 to 35 feet below the shaft top and a reduction in
diameter at the bottom of the shaft by which the effective radius for all wires is less than the cage
radius. At the bottom of the shaft, the average shaft temperature dropped significantly with an
average temperature of approximately 60 degrees Fahrenheit.

6
Figure 3. An example of Temperature versus Depth graph for a four wired drilled shaft with irregularities and anomalies.
PROJECT OVERVIEW
The I-90/94 and I-290 at Jane Byrne Interchange formerly known as “Circle Interchange”
project is located near downtown Chicago, Illinois. The reconstruction of this interchange began
in late 2013 and the first drilled shaft was tested in 2014. To date more than 400 drilled shafts have
been installed by a number of drilled shaft contractors. The majority of the shafts were poured in
the wet and the concrete was placed using a pump truck and tremie pipe. The project soil profile
consists of principally clay and the shafts bear within weathered rock and hard rock at
approximately 90 feet. For Phase I of the project the shafts were assessed using CSL methods.
For the major portion of Phase II, IDOT accepted TIP testing as an acceptable substitute for CSL
at the request of the contractors. To date a total of 92 and 34 drilled shafts were tested using CSL
and TIP methods, respectively, by the authors. A summary of the number of the tested shafts along
with the shaft diameter for CSL and TIP tests is shown in Figures 4 and 5, respectively.

7
Figure 4. Shafts tested using CSL method.
Figure 5. Shafts tested using TIP method.
TESTING RESULTS
CSL Test Results
The authors followed the CSL criteria previously discussed to characterized the anomalies
for each tested shaft. The CSL results indicated that 50 shafts, or 54 percent of the tested shafts,
had anomalies and can be classified following the CSL rating criteria described by Sellountou et
al. (2019). Specifically, 9 and 41 shafts had zones classified as Class B and C, respectively. Most
importantly, 39 shafts or 78 percent of the tested shafts with anomalies were located within the
lower three diameters of the shafts. These were the issues that were the mostly costly and time
consuming to investigate.
During this project, the authors recommended coring for shafts that had anomalous zones
with a large vertical and/or horizontal extent. These cores were extended to: 1) provide a direct
3, 2
3.5, 12
4, 18
4.5, 5 5, 6
5.5, 18
6, 25
7, 3 9, 3
0
5
10
15
20
25
30
3 3.5 4 4.5 5 5.5 6 7 9
Num
ber
of D
rille
d S
haft
s
Diameter, D, [ft]
3, 2
3.5, 4
4, 7
4.5, 35, 4
6, 11
7, 18, 2
0
2
4
6
8
10
12
3 3.5 4 4.5 5 6 7 8
Num
ber
of D
rille
d S
haft
s
Diameter, D, [ft]

8
visual observation of concrete, 2) locate defects within the reinforcing cage, and 3) determine the
cause of the detected defects. A summary of core logs was not provided to the authors but a number
of cores were visually observed to be free of anomalous zones. For some of these shafts, extended
cores were unsuccessful due to the reinforcing cage obstructions. For a number of shafts, dynamic
load tests were proposed and performed to confirm the shaft bearing capacity. Dynamic load tests
were performed on a four and six foot diameter drilled shaft, referred to as “Shaft A” and “Shaft
B,” respectively. Both shafts had significant anomalies near the shaft bottom. The CSL results for
Shaft A and Shaft B are shown in Figures 6 and 7, respectively. For Shaft A, the anomalies were
located in the lower foot of the shaft in five of the six profiles (Figure 6). For Shaft B, the CSL
results showed a complete loss of signal in the lower two feet of the shaft in all ten profiles, as
shown in Figure 7. In both cases the shafts could be classified as Class C in the noted zones and
the authors recommended cores to delineate the defects within the shaft.
Shaft A had a required nominal shaft resistance of 1,504 kips. CAse Pile Wave Analysis
Program (CAPWAP) analyses were performed on the acquired dynamic load test results and the
shaft had an ultimate capacity of 2,640 kips, with 1,525 kips of toe resistance. For Shaft B, a
factored nominal resistance of 2,853 kips was required. The shaft had a CAPWAP ultimate
capacity of 3,620 kips, with 1,000 kips of toe resistance. Despite the presence of significant
anomalies at the bottom of these shafts in the CSL results, the required nominal resistance was met
and exceed for both shafts.
Figure 6. CSL results for Shaft A, with anomalies in the lower foot of the shaft.

9
(a)
(b)
Figure 7. (a) and (b) CSL results for Shaft B, with anomaly in the lower two feet of the shaft.
TIP Test Results
Since 2019 the IDOT has approved TIP testing as a substitute of CSL on this project. For
all the tested shafts TIP data was monitored during curing/ hydration process. The results were
analyzed after each tested shaft reaches peak temperature, approximately 20 to 40 hours after
concrete placement. TIP results for each tested shaft including a representative model of estimated
radius as a function of depth were obtained and reported. In addition, a 3-D interpretation of each
shaft with reinforcement cage for each shaft was determined and presented. Based on normal
thermal data variations, general acceptability of thermal data, the overall signature of the curve in
the temperature as a function of depth graphs and the qualitative information on integrity (e.g.,
concrete cover, cage alignment, and shaft shape) the quality of shaft concrete of all the 34 drilled
shafts appeared as expected and acceptable.

10
Figure 8. TIP results of a six wired drilled shaft at Jane Byrne Interchange: (a) Measured temperature as a function of depth, (b) Estimated radius as a function of depth and (c) A 3-D interpretation of the shaft with reinforcing cage displayed.
TIP and CSL Testing Comparison
TIP and CSL measurements can generally be comparable in terms of identifying significant
anomalies within a shaft, with TIP providing the additional benefit of assessment of concrete cover
and cage alignment. Both tests have limitations which are evident in identification of minor
anomalies. Phase I of the Jane Byrne Project indicated a significant portion of shafts that had
anomalies near the shaft toe per CSL results. These results were not correlated upon further
investigation. In fact, it was the opposite, with cores showing no anomalies and dynamic test
results indicating significant end bearing capacities. Graham and Axtell (2019) discussed how
CSL anomalies can be issues that are located along the shaft perimeter for tremie placed concrete.
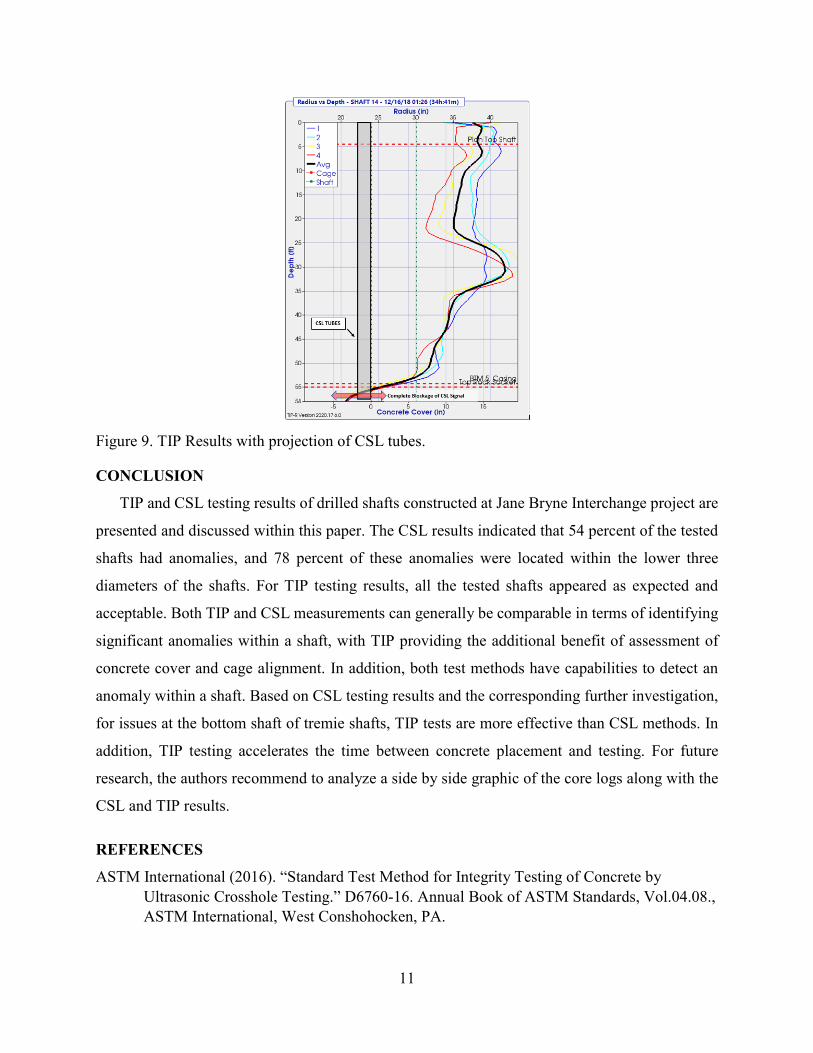
Refer to the TIP example presented earlier. If a CSL tube was attached to the reinforcing
cage in correct location, as shown in Figure 9, the CSL results would indicate a significant or even
complete loss of signal at the bottom of the shaft. Likewise, TIP results would exceed the radius
reduction percentage threshold and be identified as anomalous near the shaft bottom. However,
TIP results present the issue as it is thought to manifest, with a reduction near the outside of the
shaft diameter. The TIP model indicates the shaft has a rock socket with a diameter of
approximately 40 inches. While less than the nominal diameter of 54 inches, this information may
be further evaluated by the engineer of record to assess suitability.
11
Figure 9. TIP Results with projection of CSL tubes.
CONCLUSION
TIP and CSL testing results of drilled shafts constructed at Jane Bryne Interchange project are
presented and discussed within this paper. The CSL results indicated that 54 percent of the tested
shafts had anomalies, and 78 percent of these anomalies were located within the lower three
diameters of the shafts. For TIP testing results, all the tested shafts appeared as expected and
acceptable. Both TIP and CSL measurements can generally be comparable in terms of identifying
significant anomalies within a shaft, with TIP providing the additional benefit of assessment of
concrete cover and cage alignment. In addition, both test methods have capabilities to detect an
anomaly within a shaft. Based on CSL testing results and the corresponding further investigation,
for issues at the bottom shaft of tremie shafts, TIP tests are more effective than CSL methods. In
addition, TIP testing accelerates the time between concrete placement and testing. For future
research, the authors recommend to analyze a side by side graphic of the core logs along with the
CSL and TIP results.
REFERENCES
ASTM International (2016). “Standard Test Method for Integrity Testing of Concrete by Ultrasonic Crosshole Testing.” D6760-16. Annual Book of ASTM Standards, Vol.04.08., ASTM International, West Conshohocken, PA.

12
ASTM International (2014). “Standard Test Method for Thermal Integrity Profiling of Concrete Deep Foundations.” D7949-14. Annual Book of ASTM Standards, Vol.04.08., ASTM International, West Conshohocken, PA.
Brown, D. A., Turner, J.P. and Castelli R.J. (2010). “Drilled Shafts: Construction Procedures and LRFD Design Methods.” FHWA-NHI-10-016, Geotechnical Engineering Circular (GEC) No. 10. U.S. Dept. of Transportation, Federal Highway Administration, 970 p.
Camp III, W. M., Holley, D. W., and Canivan, G. J. (2007). “Crosshole Sonic Logging of South Carolina Drilled Shafts.” A five Year Summary.” ASCE Geo Denver, Denver Co.
Graham, D. S., and Axtel, P.J. (2019). “Case History: Comparison of CSL Results to Physical Observations.” 2019 Deep Foundations Institute.
Illinois Modified ASTM D6760: “Integrity Testing of Concrete Deep Foundations by ultrasonic Crosshole Testing.” http://www.idot.illinois.gov/Assets/uploads/files/Doing-Business/Manuals-Guides-&-Handbooks/Highways/Bridges/Bridge-Special-Provisions/GBSP91.pdf
Mullins, G. (2010) “Thermal Integrity Testing of Drilled Shafts.” The Journal of Deep Foundations Institute. Vol. 4. No. 2 November 2010.
Mullins, G., Johnson, K and Winters, D. (2007). “Thermal Integrity Testing of Drilled Shafts.” Tallahassee, FL: Florida Department of Transportation.
Likins, G., Rausche, F., Webster, K., and Klesney., A. (2007). “Defect Analysis for CSL Testing.” GSP 158 Contemporary Issues in Deep Foundations.
Sellountou, E. A., Amir, J., Canivan, G., Chernauskas, L., Hertlein., B., Kandaris, P., Kavacs, T., Likins, G. (2019). “Terminology and Evaluation Criteria of Crosshole Sonic Logging (CSL) as Applied to Deep Foundations.” 2018 Deep Foundations Institute.