Embed Size (px)
Citation preview
Elsevier Editorial System(tm) for Polymer Testing Manuscript Draft Manuscript Number: Title: Effect of Nanoclay on Optical Properties of PLA/Clay Composite Films Article Type: Original Paper Keywords: ellipsometry, composites, nanoparticles and polylactide Corresponding Author: Prof. Suprakas Sinha Ray, Corresponding Author's Institution: DST/CSIR National Centre for Nanosctructured Materials First Author: Suprakas Sinha Ray Order of Authors: Suprakas Sinha Ray Suggested Reviewers: Jasim Ahmed [email protected] One of the cited author Bhesh Bhandari [email protected] one of the expert in this field Emmanuel Rotimi SADIKU [email protected] one of the expert in this field Opposed Reviewers:
Feb 3rd 2014 Editor Polymer Testing Dear Editor, We wish to submit our recent article entitled as “ Effect of Nanoclay on Optical Properties of PLA/Clay Composite Films” for possible publication in Polymer Testing as a regular article.
The objective of this study was to investigate the effect of organically modified montmorillonite (OMMT) clay loadings on the optical properties of PLA. To date, studies investigating the use of PLA for microcantilever applications have not been reported. The surface morphology of the PLA/clay composite was studied using scanning electron microscopy (SEM) and atomic force microscopy (AFM). Transmission electron microscopy (TEM) was used to study the dispersion of the silicate layers in the PLA matrix. The dispersion of nanoparticles is important for optical studies to understand the interaction between light and the surface of the polymer composite. The optical properties of the PLA were studied using spectroscopic ellipsometry and supplemented with ultra-violet visible spectroscopy.
It would be the greatest pleasure for us if the work could be accepted for publication in such an eminent journal as yours. The manuscript is original and not submitted previously for publication in any form. Thanking you in advance for favorable consideration. I am looking forward to hearing from you at your earliest convenience. With best regards, Sincerely yours, Professor Suprakas Sinha Ray On behalf of all authors
Cover Letter

1 2 3 4 5 6 7 8 9 10 11 12 13 14 15 16 17 18 19 20 21 22 23 24 25 26 27 28 29 30 31 32 33 34 35 36 37 38 39 40 41 42 43 44 45 46 47 48 49 50 51 52 53 54 55 56 57 58 59 60 61 62 63 64 65
1
Effect of Nanoclay on Optical Properties of PLA/Clay Composite Films H.M. Cele,a, b V. Ojijo,a H. Chen,a S. Kumar,a K. Land,a T. Joubert,a M.F.R. de Villiers,a S. S. Ray* a, b, c
a Material Science and Micro-Manufacturing, Council for Scientific and Industrial Research, 1-Meiring Naude Road, Brummeria, Pretoria 0001, South Africa b Department of Applied Chemistry, University of Johannesburg, Doornforntein 2018, Johannesburg, South Africa cDST/CSIR National Centre for Nanostructured Materials, Council for Scientific and Industrial Research, 1-Meiring Naude Road, Brummeria, Pretoria 0001, South Africa
ABSTRACT
This article reports the modification of optical properties of biodegradable/biocompatible
polylactide (PLA) using organically modified montmorillonite (OMMT) for microcantilever
applications. PLA/OMMT composite films with various OMMT loadings (3, 5 and 7 wt%) were
prepared using solvent casting. The surface morphologies of the PLA/OMMT composites were
examined using scanning electron and atomic force microscopes. The morphological results
indicated that the surface roughness increases as a function the clay load. The optical properties
of the PLA/OMMT composites were studied using variable angle spectroscopic ellipsometry
(VASE) and ultra-violet (UV-Vis) spectroscopy. VASE revealed that the refractive index and
extinction coefficient (n and k) positively correlated with the thickness of the film. UV-Vis
spectroscopy also demonstrated that the absorption of light by PLA/OMMT composite films
positively correlated with the clay content in the visible range of the electromagnetic spectrum.
To enhance the reflectivity, PLA/OMMT films were coated with a gold layer.
Keywords: ellipsometry, composites, nanoparticles and polylactide
*ManuscriptClick here to view linked References
1 2 3 4 5 6 7 8 9 10 11 12 13 14 15 16 17 18 19 20 21 22 23 24 25 26 27 28 29 30 31 32 33 34 35 36 37 38 39 40 41 42 43 44 45 46 47 48 49 50 51 52 53 54 55 56 57 58 59 60 61 62 63 64 65
2
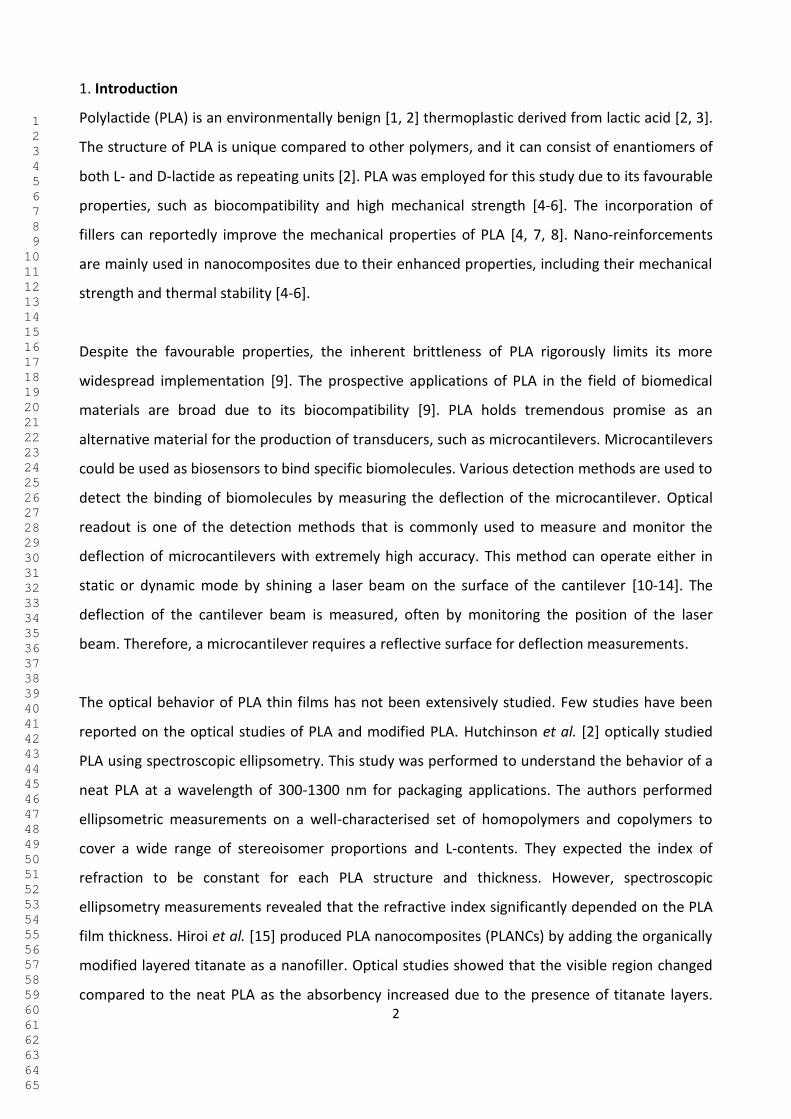
1. Introduction
Polylactide (PLA) is an environmentally benign [1, 2] thermoplastic derived from lactic acid [2, 3].
The structure of PLA is unique compared to other polymers, and it can consist of enantiomers of
both L- and D-lactide as repeating units [2]. PLA was employed for this study due to its favourable
properties, such as biocompatibility and high mechanical strength [4-6]. The incorporation of
fillers can reportedly improve the mechanical properties of PLA [4, 7, 8]. Nano-reinforcements
are mainly used in nanocomposites due to their enhanced properties, including their mechanical
strength and thermal stability [4-6].
Despite the favourable properties, the inherent brittleness of PLA rigorously limits its more
widespread implementation [9]. The prospective applications of PLA in the field of biomedical
materials are broad due to its biocompatibility [9]. PLA holds tremendous promise as an
alternative material for the production of transducers, such as microcantilevers. Microcantilevers
could be used as biosensors to bind specific biomolecules. Various detection methods are used to
detect the binding of biomolecules by measuring the deflection of the microcantilever. Optical
readout is one of the detection methods that is commonly used to measure and monitor the
deflection of microcantilevers with extremely high accuracy. This method can operate either in
static or dynamic mode by shining a laser beam on the surface of the cantilever [10-14]. The
deflection of the cantilever beam is measured, often by monitoring the position of the laser
beam. Therefore, a microcantilever requires a reflective surface for deflection measurements.
The optical behavior of PLA thin films has not been extensively studied. Few studies have been
reported on the optical studies of PLA and modified PLA. Hutchinson et al. [2] optically studied
PLA using spectroscopic ellipsometry. This study was performed to understand the behavior of a
neat PLA at a wavelength of 300-1300 nm for packaging applications. The authors performed
ellipsometric measurements on a well-characterised set of homopolymers and copolymers to
cover a wide range of stereoisomer proportions and L-contents. They expected the index of
refraction to be constant for each PLA structure and thickness. However, spectroscopic
ellipsometry measurements revealed that the refractive index significantly depended on the PLA
film thickness. Hiroi et al. [15] produced PLA nanocomposites (PLANCs) by adding the organically
modified layered titanate as a nanofiller. Optical studies showed that the visible region changed
compared to the neat PLA as the absorbency increased due to the presence of titanate layers.

1 2 3 4 5 6 7 8 9 10 11 12 13 14 15 16 17 18 19 20 21 22 23 24 25 26 27 28 29 30 31 32 33 34 35 36 37 38 39 40 41 42 43 44 45 46 47 48 49 50 51 52 53 54 55 56 57 58 59 60 61 62 63 64 65
3
However, the material properties of PLANCs, including the degradability, significantly improved
when exposed to sunshine.
In this work, considerable efforts have been made to modify the optical properties of PLA using
nanofillers to suit the microcantilever applications. The incorporation of nanoclay could positively
alter the optical properties of PLA in various applications, such as microcantilevers, where the
reflection is needed. Therefore, studying the effect of clay nanoparticles on the optical properties
of PLA is necessary.
The objective of this study was to investigate the effect of organically modified montmorillonite
(OMMT) clay loadings on the optical properties of PLA. To date, studies investigating the use of
PLA for microcantilever applications have not been reported. The surface morphology of the
PLA/clay composite was studied using scanning electron microscopy (SEM) and atomic force
microscopy (AFM). Transmission electron microscopy (TEM) was used to study the dispersion of
the silicate layers in the PLA matrix. The dispersion of nanoparticles is important for optical
studies to understand the interaction between light and the surface of the polymer composite.
The optical properties of the PLA were studied using spectroscopic ellipsometry and
supplemented with ultra-violet visible spectroscopy.
2. Experimental
2.1. Materials
The PLA used in this study was of commercial grade (PLA 2002D) with a D-isomer content of
approximately 4 % and was obtained from Natureworks, LLC (USA). The average molecular
weight, density, glass transition temperature and melting temperature of the PLA were 235
Kg.mol-1, 1.24 g.cm-3, approximately 60 °C and 153 °C, respectively. The filler used for this
experiment was an OMMT (commercially known as Cloisite®30B, C30B), which was purchased
from Southern Clay Products, USA. According to the supplier, the pristine MMT was modified
with 30 wt% of methyl tallow bis (2-hydroxyethyl) quaternary ammonium salt. The chloroform
used in this study was purchased from Sigma Aldrich, South Africa.

1 2 3 4 5 6 7 8 9 10 11 12 13 14 15 16 17 18 19 20 21 22 23 24 25 26 27 28 29 30 31 32 33 34 35 36 37 38 39 40 41 42 43 44 45 46 47 48 49 50 51 52 53 54 55 56 57 58 59 60 61 62 63 64 65
4
2.2. Sample Preparation
2.2.1. Neat PLA thin film
The polymeric solutions were prepared from PLA pellets using chloroform. A known weight of
PLA (10 g) was dissolved in 200 ml of chloroform at room temperature for 5 h. The viscosity of
the polymeric solution was controlled by varying the volume of the solvent. The polymeric thin
films were prepared by casting a polymer solution on a glass slide using a spin coater, model G3P-
8 (specialty coating systems, USA). The calibration of the spin curves was investigated at different
rotation speeds (100-6000 rpm). The solvent was evaporated at room temperature for 12 h.
2.2.2. PLA/C30B composite film
For consistency, a similar experiment using the method described above was performed with the
incorporation of C30B particles. Different concentrations (3, 5 and 7 wt.%) of C30B of the total
weight (WPLA and WC30B) were incorporated into a PLA solution, which were then ultrasonically
mixed for 3 h at 40 °C. A non-homogeneous solution was obtained from this experiment, and a
magnetic stirrer was used to improve the homogeneity of the solution. The homogenous PLA-
C30B solutions were then spin coated at 1000 rpm for 2 min and dried at room temperature.
Samples were labelled as PLA-3C30B, PLA-5C30B and PLA-7C30B for 3, 5 and 7 wt.% of C30B
loading, respectively.
2.2.3. Gold coating
A gold (Au) layer (55 ± 2 nm) was deposited on the PLA-C30B films using the AJA International,
Inc sputtering system (AJA International, USA). Au coating was performed to prevent PLA from
transmitting or absorbing light and to increase the reflectivity.
2.3. Characterisation methods
The surface morphology of neat PLA (reference film), PLA-C30B and Au-coated PLA-C30B films
was studied using SEM (FIB-SEM Auriga Zeiss). Surface roughness of PLA/C30B films was
measured using a Multimode AFM Nano Scope Version IV (Bruker, USA). A tip with a radius
curvature of less than 10 nm was used for imaging. The tip was mounted on a 125 μm long
cantilever with a spring constant of 40 N/m and was employed in the tapping mode experiment.
Both the height and phase images were obtained using a scan rate of 0.5 Hz and tip frequencies
ranging from 280 – 310 kHz.
1 2 3 4 5 6 7 8 9 10 11 12 13 14 15 16 17 18 19 20 21 22 23 24 25 26 27 28 29 30 31 32 33 34 35 36 37 38 39 40 41 42 43 44 45 46 47 48 49 50 51 52 53 54 55 56 57 58 59 60 61 62 63 64 65
5
Variable angle spectroscopic ellipsometry (VASE) measurements were performed using a J.A.
Woollam M200SE (USA) with an auto-retarder (rotating analyser ellipsometer with a computer-
controlled Berck wave plate, which removes the errors in Δ encountered near 0 and 180). The
data were obtained between 300 and 1000 nm in 5 nm steps and incident angles (AOI) of 65, 70
and 75. For data analysis, the films were regarded as a homogeneous material with a film
thickness modelled using a Cauchy model [16]. A B-Spline model [17, 18] was then used to
extract the refractive index (n) and extinction coefficient (k) over the absorption range from 300
to 1000 nm.
An ultra violet visible spectrophotometer (Perkin-Elmer Lambda 750S, USA) was used to
characterise the absorption properties of the PLA and PLA composite films in the 200–900 nm
wavelength range at room temperature.
3. Results and Discussion
3.1. Surface morphology studies
Figure 1 shows SEM images of the neat PLA and PLA-C30B composite films. The SEM image of the
neat PLA film in Figure 1a shows a uniformly deposited film with a smooth surface. Part (a) to (d)
of Figure 1 show the SEM images of composite films that were prepared from the ultrasonically
mixed PLA-C30B solution. The SEM images of these PLA-C30B composites showed that some clay
nanoparticles lay on the surface of the film. The particles seemed to be agglomerated on the
surface of the composite film. The clustering of clay particles was randomly distributed [19],
suggesting that the sizes of clusters were irregular. Agglomerated nanoparticles were also
observed, but the number of C30B nanoparticles on the surface was expected to increase as the
C30B concentration increased. Despite the variation in the C30B concentration, the SEM images
showed a similar surface morphology for all the PLA/C30B composite films. This similarity
indicates that the particles cluster at different areas of the film, which may be due to the mixing
process. In this case, the incorporation of C30B particles affects the mechanical properties of the
entire film [20]. Well dispersed clay particles are extremely important for the consistency of
mechanical properties for microcantilever applications. However, undesirable bubbles were also
obtained due to the mixing process. These bubbles should be avoided by not spin coating the PLA
solution immediately after mixing to obtain a uniform film, which is also favourable for

1 2 3 4 5 6 7 8 9 10 11 12 13 14 15 16 17 18 19 20 21 22 23 24 25 26 27 28 29 30 31 32 33 34 35 36 37 38 39 40 41 42 43 44 45 46 47 48 49 50 51 52 53 54 55 56 57 58 59 60 61 62 63 64 65
6
microcantilever applications. The surface morphology of PLA-C30B films covered in an Au layer
was also inspected using AFM. The resultant images showed a smooth surface.
Figure 1. SEM images of PLA composite prepared by spin coating (a) neat PLA), (b) PLA-3C30B, (c) PLA-5C30B and (d) PLA-7C30B.
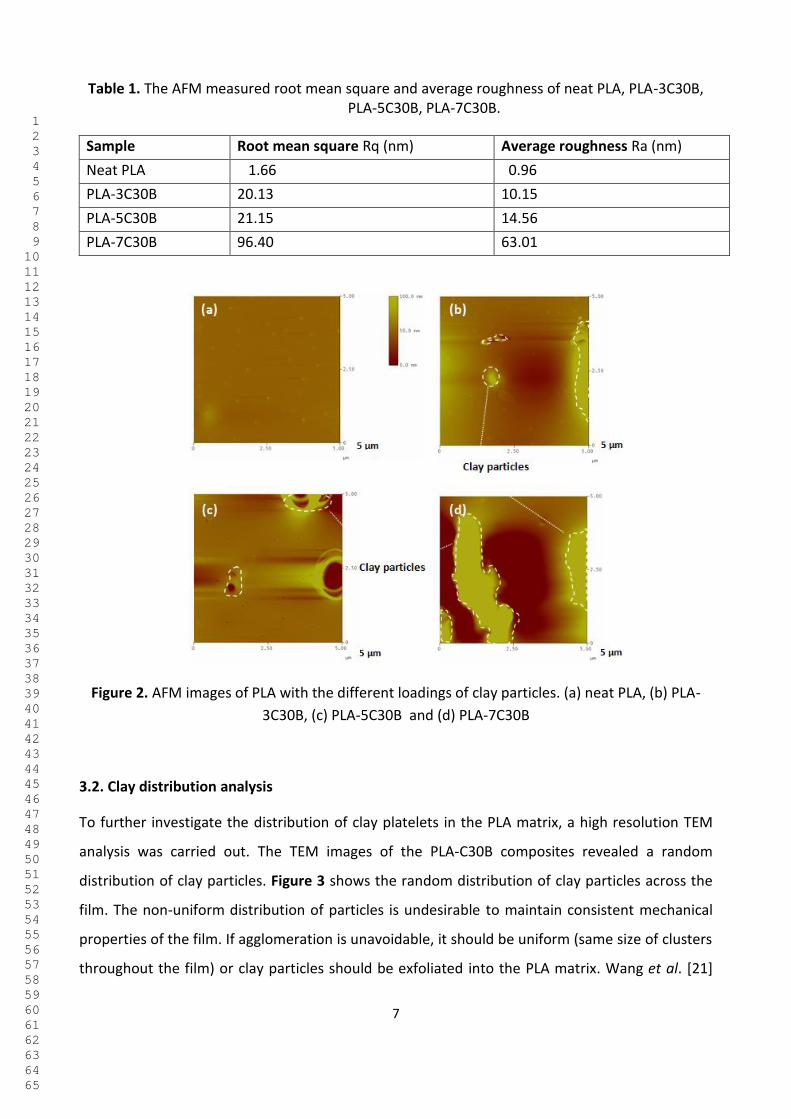
To supplement the SEM analysis, the average surface roughness of PLA and PLA-C30B composite
films was measured directly from the surface of the film using AFM. The average roughness of a
neat PLA was found to be 0.963 nm. However, the surface roughness of the PLA-3C30B, PLA-
5C30B and PLA-7C30B composite films increased as depicted in Table 1 upon the addition of
C30B particles. AFM analysis revealed that the surface roughness is directly proportional to the
concentration of clay particles. These findings are consistent with those of Xu et al. [21]. The AFM
images in Figures 2(b-d) show brighter regions with dotted circles that represent the clay
particles closer to the AFM tip. However, the surface roughness was not uniform throughout the
entire film, which confirms that the particle sizes differed. Therefore, surface imaging was
performed at different areas of the film. An increase in the surface roughness of the PLA-C30B
composite is associated with agglomerated clay particles.
Clay particles
2 μm
(a)
2 μm
(b)
2 μm
(c)
2 μm
(d)
1 2 3 4 5 6 7 8 9 10 11 12 13 14 15 16 17 18 19 20 21 22 23 24 25 26 27 28 29 30 31 32 33 34 35 36 37 38 39 40 41 42 43 44 45 46 47 48 49 50 51 52 53 54 55 56 57 58 59 60 61 62 63 64 65
7
Table 1. The AFM measured root mean square and average roughness of neat PLA, PLA-3C30B, PLA-5C30B, PLA-7C30B.
Sample Root mean square Rq (nm) Average roughness Ra (nm)
Neat PLA 1.66 0.96
PLA-3C30B 20.13 10.15
PLA-5C30B 21.15 14.56
PLA-7C30B 96.40 63.01
Figure 2. AFM images of PLA with the different loadings of clay particles. (a) neat PLA, (b) PLA-
3C30B, (c) PLA-5C30B and (d) PLA-7C30B
3.2. Clay distribution analysis
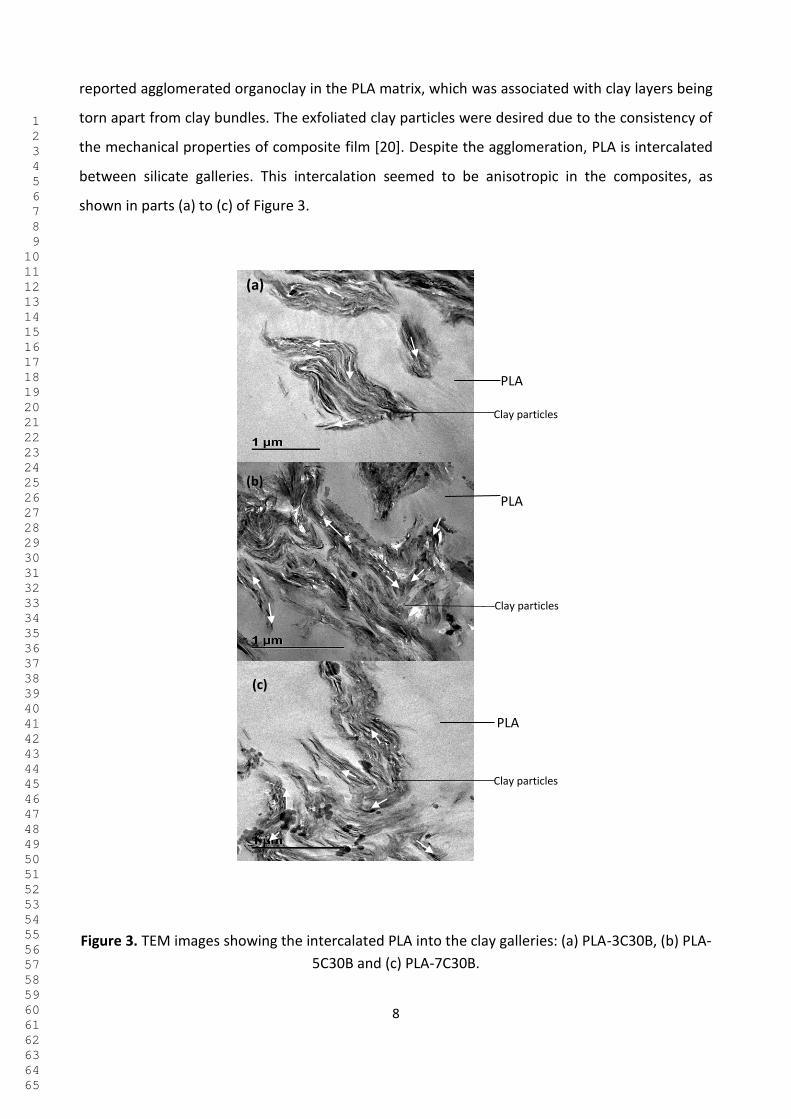
To further investigate the distribution of clay platelets in the PLA matrix, a high resolution TEM
analysis was carried out. The TEM images of the PLA-C30B composites revealed a random
distribution of clay particles. Figure 3 shows the random distribution of clay particles across the
film. The non-uniform distribution of particles is undesirable to maintain consistent mechanical
properties of the film. If agglomeration is unavoidable, it should be uniform (same size of clusters
throughout the film) or clay particles should be exfoliated into the PLA matrix. Wang et al. [21]
1 2 3 4 5 6 7 8 9 10 11 12 13 14 15 16 17 18 19 20 21 22 23 24 25 26 27 28 29 30 31 32 33 34 35 36 37 38 39 40 41 42 43 44 45 46 47 48 49 50 51 52 53 54 55 56 57 58 59 60 61 62 63 64 65
8
(a)
(b)
Clay particles
Clay particles
Clay particles
PLA
PLA
PLA
(c)
reported agglomerated organoclay in the PLA matrix, which was associated with clay layers being
torn apart from clay bundles. The exfoliated clay particles were desired due to the consistency of
the mechanical properties of composite film [20]. Despite the agglomeration, PLA is intercalated
between silicate galleries. This intercalation seemed to be anisotropic in the composites, as
shown in parts (a) to (c) of Figure 3.
Figure 3. TEM images showing the intercalated PLA into the clay galleries: (a) PLA-3C30B, (b) PLA-
5C30B and (c) PLA-7C30B.
1 2 3 4 5 6 7 8 9 10 11 12 13 14 15 16 17 18 19 20 21 22 23 24 25 26 27 28 29 30 31 32 33 34 35 36 37 38 39 40 41 42 43 44 45 46 47 48 49 50 51 52 53 54 55 56 57 58 59 60 61 62 63 64 65
9
(b)
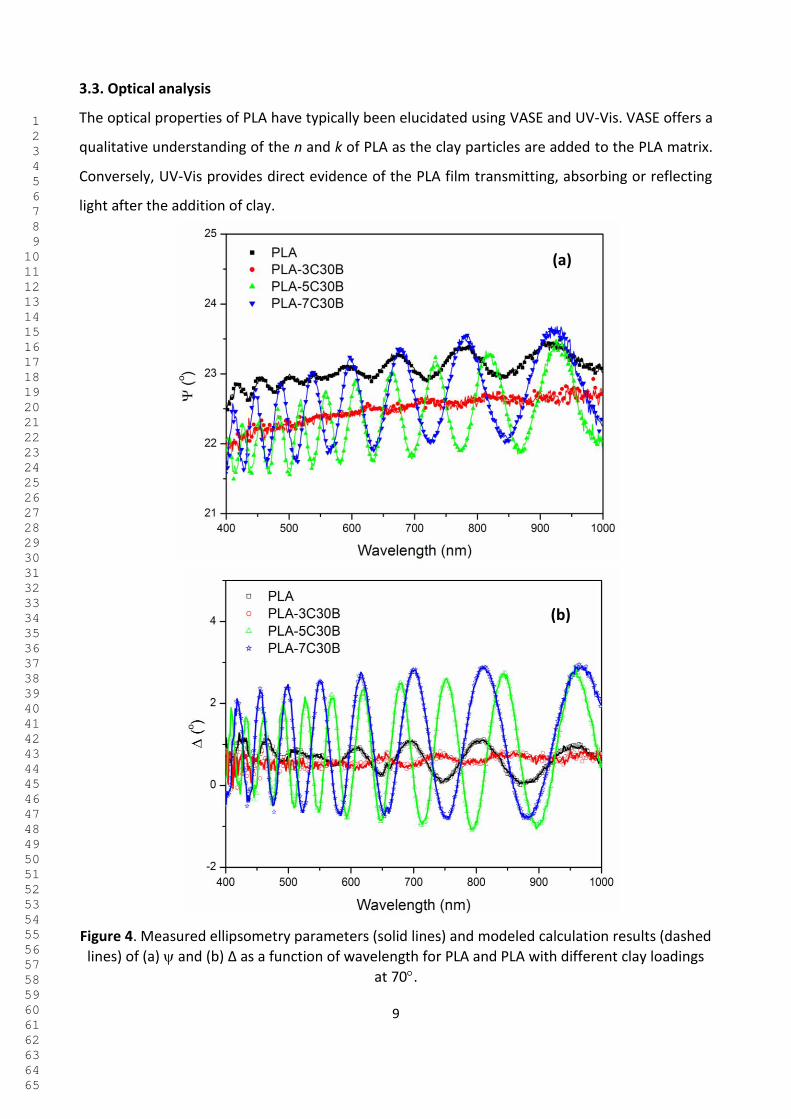
3.3. Optical analysis
The optical properties of PLA have typically been elucidated using VASE and UV-Vis. VASE offers a
qualitative understanding of the n and k of PLA as the clay particles are added to the PLA matrix.
Conversely, UV-Vis provides direct evidence of the PLA film transmitting, absorbing or reflecting
light after the addition of clay.
Figure 4. Measured ellipsometry parameters (solid lines) and modeled calculation results (dashed
lines) of (a) and (b) Δ as a function of wavelength for PLA and PLA with different clay loadings
at 70.
(a)

1 2 3 4 5 6 7 8 9 10 11 12 13 14 15 16 17 18 19 20 21 22 23 24 25 26 27 28 29 30 31 32 33 34 35 36 37 38 39 40 41 42 43 44 45 46 47 48 49 50 51 52 53 54 55 56 57 58 59 60 61 62 63 64 65
10
To obtain the optical constants (n and k) of the PLA-C30B composite films, the ellipsometry
parameters and Δ were experimentally measured as a function of the wavelength at a 70 AOI.
Figure 4 shows that the fits of model calculation (solid lines) closely approximated the
experimental data (dotted lines). Figure 4a demonstrates that the value of increased upon the
addition of clay to the PLA matrix. We attribute this increase to the improved crystallisation of
PLA as observed in the UV-vis results (Figure 8), which showed a red shift and a more intense
peak; these changes confirm the phase transition to a crystalline ordering state. The changes
observed from the ellipsometric spectra upon the incorporation of clay reflected the changes in
the electronic structure of the material. These changes might be induced by the electrical forces
(the strong electrical field at the vicinity of PLA/C30B interfaces), which in turn modify the optical
properties of the composite.
Figure 5. Index of refraction of PLA with different clay loadings.
To further investigate the effect of clay nanoparticles on the optical properties, the refractive
index was measured with respect to various clay loads. Figure 5 depicts the extracted n values of

1 2 3 4 5 6 7 8 9 10 11 12 13 14 15 16 17 18 19 20 21 22 23 24 25 26 27 28 29 30 31 32 33 34 35 36 37 38 39 40 41 42 43 44 45 46 47 48 49 50 51 52 53 54 55 56 57 58 59 60 61 62 63 64 65
11
the PLA and PLA-C30B composite films as a function of energy. Figure 5 shows that the n values
of the PLA film increased from 1.1 to 1.41 between 3.75 and 1.2 eV. This increase in the n values
of the PLA-C30B composite films could be due to the partial crystallisation induced by clay, which
results in a reorganisation of the polymer chains due to the shift in the UV-vis spectrum (Figure
8). Figure 5 indicates that the clay nanoparticles enhance the crystallisation of PLA and the
absorption of light by PLA-C30B. The C30B load did not affect the refractive index. This behaviour
of composites could be due to the slight variation in the thickness (Table 2), i.e., thicker films
could result in a significant variation of the refractive index. For microcantilever applications, the
clay concentration should be minimised to obtain stable and flexible cantilever beams.
Table 2. Films parameters extracted from both PVD and SE analysis
Films Thickness determined from the thickness monitor (nm)
Thickness from SE (nm)
MSE Thickness from FIB SEM
Au 55.32 55.54 8.13 -
PLA - 2315.4 0.437 1400
PLA-3C30B - 2319.0 5.803 e-9 1600
PLA-5C30B - 2324.6 0.122 1700
PLA-7C30B - 2325.0 1.434 -
PLA-5C30B-Au
PLA - 2324.6 0.430 -
Au 55.3 55.50 8.001 -
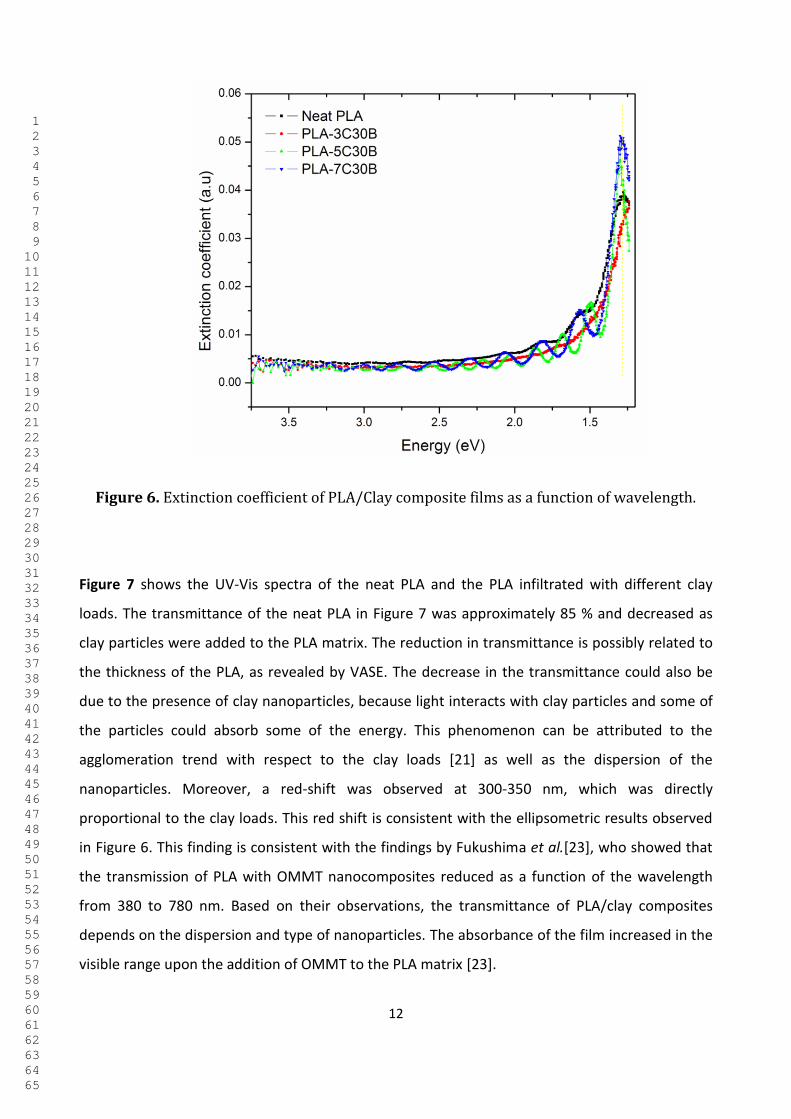
Figure 6 indicates that the extinction coefficient of the PLA film at 3.75-1.2 eV increases as the
clay load increases. The intensity of the absorption peak also increases as the energy decreases
(3.75 to 1.2 eV), and the strongest optical absorptions occurs at 1.3 eV [22]. A red shift near 1.625
eV and an increase in the absorption peaks were observed when the clay particles infiltrated the
PLA matrix. These changes might be the result of the self-organisation and crystallisation of PLA
molecules into an extended molecular conformation that increases the electronic conjugation
length. Moreover, the number of interference fringes also increased as clay nanoparticles were
added to the PLA matrix. The increase in the amplitude of interference fringes is associated with
an improvement in the k values.
1 2 3 4 5 6 7 8 9 10 11 12 13 14 15 16 17 18 19 20 21 22 23 24 25 26 27 28 29 30 31 32 33 34 35 36 37 38 39 40 41 42 43 44 45 46 47 48 49 50 51 52 53 54 55 56 57 58 59 60 61 62 63 64 65
12
Figure 6. Extinction coefficient of PLA/Clay composite films as a function of wavelength.
Figure 7 shows the UV-Vis spectra of the neat PLA and the PLA infiltrated with different clay
loads. The transmittance of the neat PLA in Figure 7 was approximately 85 % and decreased as
clay particles were added to the PLA matrix. The reduction in transmittance is possibly related to
the thickness of the PLA, as revealed by VASE. The decrease in the transmittance could also be
due to the presence of clay nanoparticles, because light interacts with clay particles and some of
the particles could absorb some of the energy. This phenomenon can be attributed to the
agglomeration trend with respect to the clay loads [21] as well as the dispersion of the
nanoparticles. Moreover, a red-shift was observed at 300-350 nm, which was directly
proportional to the clay loads. This red shift is consistent with the ellipsometric results observed
in Figure 6. This finding is consistent with the findings by Fukushima et al.[23], who showed that
the transmission of PLA with OMMT nanocomposites reduced as a function of the wavelength
from 380 to 780 nm. Based on their observations, the transmittance of PLA/clay composites
depends on the dispersion and type of nanoparticles. The absorbance of the film increased in the
visible range upon the addition of OMMT to the PLA matrix [23].

1 2 3 4 5 6 7 8 9 10 11 12 13 14 15 16 17 18 19 20 21 22 23 24 25 26 27 28 29 30 31 32 33 34 35 36 37 38 39 40 41 42 43 44 45 46 47 48 49 50 51 52 53 54 55 56 57 58 59 60 61 62 63 64 65
13
Figure 7. UV-Vis measurements (transmittance) of PLA, PLA-3C30B, PLA-5C30B, PLA-7C30B
and Au/PLA-5C30B.
Au-coated PLA shows a peak at 511 nm and a shoulder near 345 nm. The intense peak indicates
the presence of an Au layer that is normally found at a wavelength of 520 nm due to the surface
plasmon [24]. Similar results were found by Siegel et al.[25], who showed an absorption peak of
Au film (<20 nm thick) at 500 nm. The peak could slightly shift to the high or low wavelengths,
depending on the film thickness. Therefore, the absorption band is broadened as the thickness of
the Au layer increases due to a wider particle size distribution [25].
Figure 8 shows the extrapolations of the optical band gap of PLA as a function of the clay load in
the PLA matrix. The direct band gap obtained for the neat PLA in Table 3 is 4.513 eV. The band
gap was expected to decrease linearly as the weight percentage of C30B increased because more
electrons can jump to the conduction band within a small energy change as more C30B is added.
The decrease in the band gap of composites shows that the conductivity of PLA decreases as the
clay nanoparticles are incorporated. Nevertheless, the conductivity of the polymer is not that
crucial for microcantilever applications when using optical readout. The conductivity of the
polymer could be essential in other forms of the readout, such as the piezoresistive or capacitive

1 2 3 4 5 6 7 8 9 10 11 12 13 14 15 16 17 18 19 20 21 22 23 24 25 26 27 28 29 30 31 32 33 34 35 36 37 38 39 40 41 42 43 44 45 46 47 48 49 50 51 52 53 54 55 56 57 58 59 60 61 62 63 64 65
14
deflection readout [11]. Moreover, the effect of clay nanoparticles on the conductivity of PLA
seemed to be very minimal at low concentrations. These values indicate that the clay load had
influenced the experimental band gap value of PLA-C30B composite films.
Figure 8. Direct gap graphs ((αhv)2 vs. hv) of PLA/Clay composite.
Table 3: Direct band gap of PLA/Clay composite thin films.
Clay loading (wt%) Band-gap (eV)
0 4.51
3 4.48
5 4.44
7 4.40
The indirect band-gap values are shown in Table 4 and demonstrate a behaviour similar to that of
the direct band-gap for 0 to 7 wt.% loads. The indirect band gap plot (Figure 9) indicates a slight
variation of the band gap, which can be associated with the dispersion of nanoparticles. The
mixing process could have had an influence on the dispersion rate of clay nanoparticles inside the
PLA matrix, which affects the band gap of the PLA-C30B composite film. The band gap of PLA

1 2 3 4 5 6 7 8 9 10 11 12 13 14 15 16 17 18 19 20 21 22 23 24 25 26 27 28 29 30 31 32 33 34 35 36 37 38 39 40 41 42 43 44 45 46 47 48 49 50 51 52 53 54 55 56 57 58 59 60 61 62 63 64 65
15
evidently decreases as the concentration of C30B increases when clay nanoparticles are
incorporated into the PLA matrix.
Table 4 : Indirect band gap for PLA/Clay composite thin films
Clay loading (wt%) Band-gap (eV)
0 3.74
3 3.72
5 3.71
7 3.70
Figure 9. Indirect band gap graphs ((αhv)1/2 vs. hv) of PLA/Clay composite.
The reflectance of PLA upon the addition of clay nanoparticles was measured to supplement the
transmittance results. Figure 10a depicts the reflectance spectra of PLA, PLA-C30B and Au-PLA-
C30B films. Interference fringes were observed in PLA and PLA-C30B films, as shown in the
magnified spectra in Figure 10b. These interference fringes could be due to the interaction of the
reflected light from the PLA surface with the reflected light from the substrate. The UV-Vis
spectra showed the most intense PLA peak at a wavelength of 311 nm, which indicates that a

1 2 3 4 5 6 7 8 9 10 11 12 13 14 15 16 17 18 19 20 21 22 23 24 25 26 27 28 29 30 31 32 33 34 35 36 37 38 39 40 41 42 43 44 45 46 47 48 49 50 51 52 53 54 55 56 57 58 59 60 61 62 63 64 65
16
neat PLA is reflecting light in this range. Red-shift near 345 nm is observed at low concentrations
of C30B (3 and 5 wt.%), and the peak reflection decreases as the clay concentration increases.
Blue-shift is observed as the clay concentration was increased to 7 wt.%. The sharpness of the
sub-peak of PLA from the visible range also decreased after the incorporation of clay. Therefore,
clay particles increase the absorption of light by PLA in the visible range. After coating the
PLA/C30B composite with a 55 Au layer, an intense peak was found at 678 nm, which is
associated with the reflection of light by the Au layer. The Au layer improved the reflectivity of
the composite at the visible range.
Figure 10. UV-vis reflectance as a function of wavelength. (a) Reflectance of PLA with different
clay loadings and Au coated PLA/Clay composite (b) the magnified reflectance of PLA and
PLA/Clay composites.
(a)
(b)

1 2 3 4 5 6 7 8 9 10 11 12 13 14 15 16 17 18 19 20 21 22 23 24 25 26 27 28 29 30 31 32 33 34 35 36 37 38 39 40 41 42 43 44 45 46 47 48 49 50 51 52 53 54 55 56 57 58 59 60 61 62 63 64 65
17
4. Conclusions
PLA-clay composite films were prepared by the incorporation of modified clay particles into PLA
solutions. SEM images show that the surface of neat PLA is smooth compared to the PLA-clay
composite. The AFM analysis revealed that the surface roughness of the PLA-clay film increases
as the clay concentration increases. A non-uniform surface roughness was obtained, which was
associated with the aggregation of clay particles. Furthermore, high resolution TEM revealed
anisotropic intercalated PLA chains between the clay galleries.
The refractive index, n, and the extinction coefficient, k, were determined using the Cauchy
model. Spectroscopic ellipsometry revealed that optical constants depend on the thickness of the
film. The UV-Vis measurements showed that a neat PLA transmits light in the visible light region.
As nanoparticles were added to the matrix, a red-shift and reduction in transmittance were
obtained. The reduction in the transmittance is due to the absorption of light by clay particles.
However, the UV-Vis measurements revealed that the transmittance and reflectance significantly
depended on the thickness of the composite films. After Au-coating, both the VASE and UV-Vis
measurements demonstrated the improvement in the reflective property of the polymer
composite. Therefore, these films can be used to fabricate biosensors (e.g. microcantilevers). For
cantilever beams, exfoliated clay particles are suggested to improve the thermal and mechanical
properties. Finally, developing a method that will produce exfoliated nanoparticles to improve
the surface morphology and surface reflectance remains a challenge.
Acknowledgments
The financial support by Department of Science and Technology (DST, South Africa), Council for
Scientific and Industrial Research (CSIR, South Africa) and Technology Innovation Agency (TIA,
South Africa) is gratefully acknowledged. We also thank D.E. Motaung, G.F. Malgas and T.
Malwela for the helpful discussions.
References
[1] S. S. Ray, K. Yamada, M. Okamotoa, K. Ueda, Polymer 44 (2003) 857–866.
[2] M.H. Hutchinson, J.R. Dorgan, D.M. Knauss, S.B. Hait, J. Polym. Environ. 14 (2006) 119–124.
[3] A. Jasim, V. K. Sunil, Intern. J. Food Propert. 14 (2011) 37-58.

1 2 3 4 5 6 7 8 9 10 11 12 13 14 15 16 17 18 19 20 21 22 23 24 25 26 27 28 29 30 31 32 33 34 35 36 37 38 39 40 41 42 43 44 45 46 47 48 49 50 51 52 53 54 55 56 57 58 59 60 61 62 63 64 65
18
[4] V. Ojijo, H. Cele, S. S. Ray, Macromol. Mater. Eng. 296 (2011) 865-877.
[5] S. S. Ray, M. Bousmina, Prog. Mater. Sc. 50 (2005) 962-1079.
[6] S. S. Ray, M. Okamoto, Prog. Polym. Sci. 28 (2003) 1539-1641.
[7] S. S. Ray, K. Yamada, M. Okamoto, A. Ogami, K. Ueda, Chem. Mater. 15 (2003) 1456-1465.
[8] S. S. Ray, M. Bousmina, Macromol. Rapid. Communs. 26 (2005) 1639-1646.
[9] L. Feng, X. Bian, Z. Chen, G. Li, X. Chen, Polym. Degrad. Stabil. 98 (2013) 1591-1600.
[10] L.G.V. Torrijo, Development of Cantilevers for Biomolecular Measurements, in, Universitat
Autonoma de Barcelona, 2006, pp. 1-261.
[11] A. Boisen, S. Dohn, S.S. Keller, S. Schmid, M. Tenje, Reports Prog. Phys. 74 (2011) 036101.
[12] M. Nordström, S. Keller, M. Lillemose, A. Johansson, S. Dohn, D. Haefliger, G. Blagoi, M.
Havsteen-Jakobsen, A. Boisen, Sensors, 8 (2008) 1595-1612.
[13] A.W. McFarland, Production and Analysis of Polymer Microcantilever Parts, in: George W.
Woodru® School of Mechanical Engineering, Georgia Institute of Technology, 2004, pp. 1-307.
[14] P. Urwyler, H. Schift, J. Gobrecht, O. Häfeli, M. Altana, F. Battiston, B. Müller, Sensors and
Actuators A: Physical, 172 (2011) 2-8.
[15] R. Hiroi, S.S. Ray, M. Okamoto, T. Shiroi, Macromol. Rapid Communs. 25 (2004) 1359-1364.
[16] U. Zhokhavets, G. Gobsch, H. Hoppe, N.S. Sariciftci, Synth. Met. 143 (2004) 113-117.
[17] J.W. Weber, T.A.R. Hansen, M.C.M.v.d. Sanden, R. Engeln, J. Appl. Phys. 106 (2009) 123503-
123503.
[18] B. Johs, J.S. Hale, Phys. Status Solidi A, 205 (2008) 715-719.
[19] S. S. Ray, K. Yamada, M. Okamoto, Y. Fujimoto, A. Ogami, K. Ueda, Polymer 44 (2003) 6633-
6646.
[20] Q.T. Nguyen, D.G. Baird, Adv. Polym. Technol. 25 (2006) 270–285.
[21] S. Wang, Y. Zhang, W. Ren, Y. Zhang, H. Lin, Polym. Test. 24 (2005) 766-774.
[22] Y.W. Jung, J.S. Byun, Y.H. Cha, Y.D. Kim, Synth. Met. 160 (2010) 651-654.
[23] K. Fukushima, A. Fina, F. Geobaldo, A. Venturello, G. Camino, eXPRESS Polym. Letts. 6 (2012)
914–926.
[24] S. SRIVASTAVA, M. HARIDAS, J.K. BASU, Indian Academy Sci. 31 (2008) 213–217.
[25] J. Siegel, O. Lyutakov, V. Rybka, Z. Kolská, V. Švorčík, Nanoscale Res. Letts. 6 (2011) 1-9.