Embed Size (px)
Citation preview

DRAFT: Not for Citation or Distribution Laguna de Bay
1
Experience and Lessons Learned Brief for 1 Laguna de Bay 2
3 Adelina Santos-Borja, Chief, Research and Development Division 4
Dolora N. Nepomuceno, Assistant General Manager 5 Laguna Lake Development Authority 6
Introduction 7
Laguna de Bay is the largest and most important lake in the Philippines. Its watershed is 8 host to 66 Local Government Units (LGUs), which are grouped into 5 provinces, 49 9 municipalities and 12 cities with an estimated population of 6 million people. The creation 10 of the Laguna Lake Development Authority (LLDA) in 1966 started with a vision of the 11 political leaders from the provinces of Rizal and Laguna to cultivate the potential of the 12 lake and its environs for further development and at the same time, control its 13 environmental degradation. It also reflects the wisdom of the lawmakers in creating a 14 separate agency to manage the lake amidst the multiple political jurisdictions in the 15 watershed. A unique feature of the jurisdictional area of the LLDA is that it goes beyond 16 the lake’s watershed. 17 18 The existence of an Authority in the basin puts the Laguna de Bay in the best position in 19 terms of conservation and management compared to the other lakes in the Philippines 20 and perhaps, to some of the lakes within the Asian Region. The current state of Laguna 21 de Bay is brought about by the actions taken by the different stakeholders, thus, every 22 one is accountable, but most of the responsibility goes to the LLDA. It is within this 23 context that the experiences and lessons learned in managing the Laguna de Bay Basin 24 are presented. 25
The lake is a multiple use resource but its dominant use is for fishery. The introduction of 26 fishpen technology in the lake has brought a lot of economic benefits but it has become a 27 source of serious conflict on resource utilization and access that necessitated the action 28 of the President of the Philippines. It took 15 years to finally come out with a feasible 29 and accepted management plan to address this concern. Rapid urbanization and 30 industrialization have greatly increased the demand for environmetal goods and services 31 and mirrors the challenges that the LLDA has to face to sustainably manage the lake 32 basin. 33
The LLDA carries a developmental and regulatory mandate, but with more emphasis on 34 the latter due to its present structure and financial capability. Although it is yet to 35 assume a more developmental, it has already laid the ground work to carry the task. It is 36 an agency with a very broad mandate but with limited resources, thus, at present some 37 of its mandates are not yet exercised. Given this predicament, the Authority was able to 38 pioneer the Environmental User Fee System in the Laguna de Bay Region. Banking on its 39 experience, the EUFS will be implemented by the Department of Environment and 40 Natural Resources in the entire country. 41
The trust and cooperation of a substantial proportion of the stakeholders, donor agencies 42 and international organizations that the LLDA now enjoys did not come easy. It was and 43 still is a work in progress. 44
2. Background 45
2.1 Biophysical Features 46
Laguna de Bay used to be an “arm of the sea” (Wolfe and Self 1983; Adams 1910; and 47 Gervasio 1964). Scenarios on the evolution of the lake was further refined by the 48

DRAFT: Not for Citation or Distribution Laguna de Bay
2
identification of at least three major paleosalinity shifts that occurred since 6,000 yBP 1 (Jaraula 2001). Sea-level changes and tectonism controlled the evolution of the lake 2 from a brackish to a marine and finally to a fresh body of water that now lies at 14o 3 10’~14°35’N, 121°~121o30’E, specifically in the island of Luzon, the biggest of the 7,100 4 islands of the Philippine archipelago. 5
6 The surface area of the lake is 900 km 2, making it as the largest among the 216 lakes 7 recorded in the country (Santos-Borja 2001) and one of the largest lakes in Southeast Asia. 8 Perhaps it is also one of the shallowest at an average depth of 2.5 meters. It carries a water 9 volume of 2.25 x 10⁹ m3. The high surface area to volume ratio accounts for the 10 characteristic turbidity of the lake. The retention time is approximately 8 months. Its 11 shoreline of 285 km clearly delineates the three distinct bays namely, the West Bay, Central 12 Bay and East Bay that converge towards the south resembling a large bird foot. A South 13 Bay is also being referred to along the southwestern towns of Laguna Province. The West 14 and Central Bays are separated by Talim Island, the largest and most populated of the nine 15 islands within the lake. 16 17 The watershed area is 2920 km2, which is approximately 1.3% of the country’s land area 18 of 300,000 km2. It is occupied in whole or in part by the National Capital Region, and the 19 provinces of Rizal, Laguna, Cavite, Batangas and Quezon, consisting of 8 cities and 49 20 municipalities of which 27 are lakeshore towns and 2 are lakeshore cities. More than 100 21 streams flow into its drainage area, which is divided into 24 sub-basins. There is only one 22 outlet, the 27 km Pasig River, which drains to Manila Bay. During conditions when the lake 23 level is lower than Manila Bay and when there is sufficient tidal fluctuation that could push 24 the entry of saltwater into the lake, Pasig River becomes a tributary. Thus, during 25 backflow of the Pasig River, Laguna de Bay becomes a brackish water lake. The extent of 26 saline water intrusion depends on the duration of the backflow and the prevailing climatic 27 condition. The normal chloride concentration ranges from 250 to 350 mg/L but could 28 reach to 4,000 mg/L at sustained backflow of the Pasig River. The fishermen and 29 aquaculture operators favor this phenomenon because higher salinity improves the 30 transparency of the lake. Subsequently, abundance of phytoplankton followed. (Santos-31 Borja 1994). 32
The lake provides a variety of environmental goods and services to the surrounding 33 communities, which also extend to other stakeholders within and outside the basin. It 34 provides food, water for irrigation, power supply, cooling of industrial equipment and 35 lately, as a source of raw water for domestic supply. The lake is a convenient transport 36 route for people and products, a receptacle for floodwaters coming from Metropolitan 37 Manila and a sink for treated and untreated liquid wastes. At present its dominant use is 38 for fishery, which includes both open water and aquaculture type of fishery. 39
The least recognized use of the lake is as a medium for the growth of other aquatic life 40 and as part of the flyway of migratory birds, a convenient place for shelter and food. Its 41 full potential as a place for recreation and nature appreciation has not been given much 42 importance. This maybe due to the environmental degradation observed in some parts of 43 the lake, especially the areas closer to Metropolitan Manila. 44
The lives of the people in the lakeshore towns are closely linked with the lake. Religious 45 rites such as baptism is observed either in the lakeshore areas, while in some towns, 46 fluvial parade is held during the feast of the patron saint. The town of Calamba in 47 Laguna Province is the home of the Philippines’ national hero, Dr. Jose P. Rizal. The 48 significance of the lake and Pasig River in the daily lives of people was reflected in one of 49 his novels. 50
The Laguna de Bay watershed is also gifted with natural and cultural scenic spots. Among 51 them are Mt. Makiling and Pagsanjan Falls and the century old churches in the towns of 52
DRAFT: Not for Citation or Distribution Laguna de Bay
3
Pakil, Pangil and Majayjay in Laguna Province. The Angono petroglyphs located in the 1 lakeshore town of Binangonan Rizal is one of world’s cultural heritage site. 2
From the currently available land use map (Figure 1), there is a very minimal forest 3 cover of only 5%, mainly represented by Mt. Makiling. It is considered as the microcosm 4 of the only remaining forested environment in the Laguna de Bay Basin (Sly 1993) and is 5 one of the 18 centers of plant biodiversity in the Philippines (DENR/UNEP 1997). Such 6 status could be attributed to the Philippine Government’s early intervention by declaring 7 it as a Forest Reserve in 1910. 8
See Figure 1 9
A large portion of approximately 1990 km 2 or 52% of the land area, is being used 10 for agricultural purposes, mainly for livestock raising and farming of coconut, fruit trees 11 and rice. Industrial and urban areas account for 29% while defrosted areas consisting of 12 grass and bushland comprise 14 %. There is a need to update the land use map due to 13 rapid land conversion for industrial and residential uses in the past 20 years. 14
2.2 Political and Socio-economic Features 15
The watershed and the Laguna de Bay Region 16
In 1983, the term Laguna de Bay Region was introduced through Executive Order 927, 17 Further Defining Certain Functions and Powers of the Laguna Lake Development 18 Authority. Aside from the political units within the watershed, the cities of Quezon, 19 Manila, Kalookan and Pasay, all of which are located outside the watershed area but 20 within the National Capital Region (NCR), were made part of the Laguna de Bay Region 21 which delineates the areas where the Laguna Lake Development Authority can exercise 22 its mandate (Figure 2). 23
See Figure 2 24
Technically, the Laguna de Bay Region is not synonymous to the lake’s watershed. This 25 reflects the lack of appreciation by the lawmakers of that time, on the use of the 26 watershed as the management unit in the environmental protection of Laguna de Bay. 27 The inclusion of areas outside the watershed appeared to be more of a political 28 accommodation. The city of Makati, which is the Philippine’s prime financial district 29 together with the cities of Mandaluyong and San Juan, were curved out of the continuous 30 mass of land in the National Capital Region. The extension of the LLDA’s management 31 unit outside of the watershed has become an irritant and source of confusion in the 32 exercise of its mandate. 33
With the Laguna de Bay Region so defined, there is a need to always classify between 34 the LLDA’s geographical jurisdiction, referring to the 2920 km2 watershed and its 35 administrative jurisdiction, referring to the Laguna de Bay Region with a total area of 36 about 3880 km2. Unless specified, all other facts and figures in the preceding sections will 37 refer to the Laguna de Bay Region which is composed of the National Capital Region, 5 38 provinces, 51 municipalities, and 10 cities, which altogether consists of 66 local 39 government units. 40
Demography 41
The total population in the watershed is 5,840,240 of which 18.3 % reside in the National 42 Capital Region (NSO,2000). The growth rate is 2.25 per cent, which is slightly higher 43 than the average national growth rate of 2.02 per cent. Population density is at 20 per 44 hectare. 45

DRAFT: Not for Citation or Distribution Laguna de Bay
4
The growth and distribution of the population is strongly influenced by the proximity of 1 some lakeshore towns to Metropolitan Manila. The more densely populated municipalities 2 are located within or close to Manila. The high population growth rate is largely attributed 3 to in-migration from the other regions of the country which results mainly from the 4 perceived economic opportunities in Metropolitan Manila (Francisco 1985). 5
Economy 6
In terms of economic output, the Laguna de Bay Region produces a Gross Regional 7 Domestic Product of P101.3 billion and a potential labor force of 6.1 million in 1990 8 (LLDA 1995). Agriculture still retains considerable economic importance, considering it is 9 the dominant land use in the watershed. 10
Industrial establishments used to be concentrated in the Metropolitan Manila area but 11 have expanded in the last 20 years to other cities and municipalities. Within the basin are 12 some 4,351 industrial establishments (LLDA-Pollution Control Division’s record as of July 13 2003). Based on the industry sub-sector classification, majorities are on food 14 manufacturing, livestock raising, chemical and pharmaceuticals, metals, minerals and 15 non-metals. If lumped together, business establishments involve in real estate and 16 housing, shopping centers and recreational facilities, constitute the highest number. 17
The aquaculture industry is very much alive in the Laguna de Bay Region. Ownership is 18 classified into corporation, cooperative and individual operator. Other sectors benefit 19 from this industry like the hired fish pen and fish cage caretakers, service contractors 20 that construct the enclosures, suppliers of materials and fish vendors. Ironically, socio-21 economic studies on such an important industry was not given much attention, thus the 22 lack of accurate information on its economic benefits. Another factor is the reluctance of 23 fish pen operators to disclose their harvest and earnings. Among their apprehensions is 24 that their disclosre will be used as basis for determining their tax obligation and can also 25 serve as basis for increasing the fish pen fee. Thus, the fish production in the lake is 26 estimated by the LLDA based on the stocking density, mortality rate and average size of 27 harvestable fish. In 2002 the estimated harvest was 60,000 tons per hectare. 28 29
2.3 Institutional and Managerial Features 30
The Laguna Lake Development Authority and its Evolution 31 32 The potential of the lake and its environs for further development and the perceived 33 threats from the rapidly changing character of the lake region, prompted the political 34 leaders in the area to seek in the early sixties the enactment of legislation to manage the 35 lake and its resources and control environmental degradation. Their move was precisely 36 intended to create an instrument to facilitate rational utilization of the lake resources. It 37 was perceived that the creation of an “Authority” would facilitate cooperation and 38 coordination and a pooling of resources among national government agencies, local 39 governments and the private sector (Francisco 1985). On July 18, 1966 the Laguna Lake 40 Development Authority was created through Republic Act 4850: An Act Creating the 41 Laguna Lake Development Authority, Prescribing Its Powers, Functions, and Duties, 42 Providing Funds Thereof and for Other Purposes. Its mandate is “ to promote and 43 accelerate the development and balanced growth of the Laguna Lake area and the 44 surrounding provinces, cities and towns … with due regard and adequate provisions for 45 environmental management and control, preservation of the quality of human life and 46 ecological systems, and the prevention of undue ecological disturbances, deterioration 47 and pollution.” It took three years after the enactment of R.A.4850, for the LLDA to be 48 organized as a semi-government corporation. Presidential Decree (P.D.) 813 of 1975 49 further expanded LLDA’s mandate to address environmental concerns and conflicts over 50 jurisdiction and control of the lake. This was followed by Executive Order (E.O.) 927 of 51
DRAFT: Not for Citation or Distribution Laguna de Bay
5
1983 which further strengthened the institutional, financial and administrative 1 responsibilities of the Authority including its regulatory functions in industrial pollution. 2 3 The General Manager is the Chief Executive of the Authority, while the corporate power is 4 vested on the Board of Directors. An operational subsidy of One Million Pesos 5 (P1,000,000.00) was appropriated annually for five years from the general fund of the 6 National Government. Thereafter, the LLDA became a self-sustaining organization. Its 7 operation is financed through its income from regulatory fees and fines, laboratory 8 services, resource user’s fee (aquaculture operation and water abstraction), and from its 9 corporate investments and marketable securities. 10 11 In 1993, the LLDA was placed under the administrative supervision of the Department of 12 Environment and Natural Resources (DENR) through Executive Order 149. As such, it 13 maintains its separate policy-making functions through the Board of Directors. The LLDA 14 acts and decides upon policy matters; not all are necessarily elevated to the DENR 15 Secretary for final approval. 16 17 Laguna de Bay remains as the only lake in the Philippines that is managed by a special 18 agency of the Philippine Government. Although LLDA is mandated by law to perform its 19 function as a basin-wide authority, it does not have control over all projects affecting the 20 lake and its region, due to overlapping areas of jurisdiction with other government agencies 21 (Santos-Borja 1990). They exercise their respective mandates in the region on policy and 22 planning, regulation and infrastructure development. The Local Government Units also 23 exercise their mandate on environmental protection and management, which was further 24 strengthened by Republic Act 7160 or the Local Government Code. The existence of 25 many players, majority of which are government institutions, has become a liability in 26 the management of the Laguna de Bay Region (refer to section 3.3). 27 28
3. Biophysical Environment 29
3.1 Past and Current Conditions 30
Biodiversity and fishery 31
Laguna de Bay is traditionally used as a communal fishing ground for daily sustenance 32 and livelihood. This explains why the earliest recorded study on the lake focused mostly 33 on fisheries (Mane, 1929, Villadolid and Sulit 1931, Villadolid 1934,1939, Mane and 34 Villaluz, 1939). Concerns were already raised on the use of destructive fishing gear, 35 over-fishing, decline in the population of native species and pollution of the Pasig River. 36 37 Studies on the fish population of Laguna de Bay from 1960 to 1964 (Delmendo and 38 Bustillo,1968) showed that there were 23 species of fish belonging to 16 families and 19 39 genera. The most dominant and important species were Therapon plumbeus and 40 Glossogobius giurus (white goby). Most of the stock were migratory species but were 41 scarce in distribution due to the pollution of the Pasig River, suggesting high mortality of 42 migrating fry. Stocking the lake with milkfish was reported to be in practice since 1959 43 and this is one of the identified reasons for the accidental introduction of other species. 44 The practice went on since milkfish command a higher price in the market. 45 46 During the same period, there was an alarming decline in the population of the sea 47 catfish (Arius manilensis), which used to constitute the fishery of Laguna de Bay. This 48 was attributed to the decrease in snail (Thiara,sp.) population through rampant dredging 49 in order to sustain the duck farming industry, notably in the eastern towns of Rizal 50 Province. Connected with this industry is the making of “balut,” a native delicacy of 51 boiled unhatched duck embryo. Almost twenty years after, there was a tremendous 52 decrease in the number of duck farms. 53
DRAFT: Not for Citation or Distribution Laguna de Bay
6
1 Few years after the introduction of aquaculture In the early seventies, the population of 2 catfish started to increase. It has slowly increassed its population and is now the most 3 commonly caught fish in the lake. This fish thrives near the fish pen areas where they 4 seek shelter. The decline in population in the previous years could be more due to habitat 5 destruction that the decline in the snail population. 6 7 Aquaculture became a very lucrative business in the lake and this encouraged the culture 8 of other species like tilapia and the bighead carp, Hypopthamichthys nobilis . The stock 9 assessment of major fishery resources done by Palma and Pol from 1995-1996 showed 10 that the open water catch is composed of 13 species, including the shrimp commonly 11 found in the lake. Of the fish species, the most commonly caught were Tilapia sp., H. 12 nobilis and A. manilensis . 13 14 In 2002, an alarming population of janitor fish, Hypostamus was observed in the lake 15 and the tributary rivers. This fish is a common site in aquarium, because of their ability 16 to “clean” it of organic debris. Maintenance of aquarium became a very popular hobby in 17 the late nineties became a very common fixture in homes, offices and business 18 establishments. Businessmen ventured in the culture of aquarium fishes along the 19 lakeshore and near the rivers. Escapement of janitor fish from this operation was 20 believed to have caused its introduction. 21 22 The most common phytoplankton in the lake are the blue-green algae and diatoms. The 23 former is composed mostly of Anabaena, Anabaenopsis, Microsystis and Oscillatoria. The 24 diatom population is dominated by Stephanodiscus but other genera like Coscinodiscus 25 and Melosira are consistently found throughout the year. Representative genera of the 26 green algae include Scenedesmus, Hormidium, Closterium and Pediastrum. 27 Dinoflagellates like Glenodinium and Ceratium are rarely present. Abundance of 28 phytoplankton are generally observed from May to September. Algal blooms which 29 sometimes reach alarming level occur during these months and is often dominated by 30 Microcystis sp. 31 32 The zooplankton consist of rotifers like Brachionus angularis, Brachionus calyciflorus, 33 Branchionus urceolaris, Brachionus forficula, Brachionus falcatus, Keratella sp. 34 Trichocerca sp., Filinia sp. Asplanchna sp. and Hexartha sp. The cladocerans are 35 composed of Diaphanosoma, Bosmina, Ceriodaphnia, and Moina. The identifiable 36 copepods include the adult forms of Mesocyclops sp., Thermocyclops sp. and 37 Arctodiaptomus sp. 38 39 The benthic fauna is composed of mollusks like Corbicula, Melanoides and Thiara; 40 oligochaetes like Branchiura, Limnodrilus, and Naididae; the ostracod Cypricercus sp.; 41 and the dipterans represented by chironomid larvae. 42 43 At present, there are no recorded endemic species in Laguna de Bay, probably because it 44 is a very young lake, formed some 6,000 years ago. Likewise, its link to Manila Bay and 45 the introduction of non-native specie s could have contributed to this phenomenon. 46 47 Water Quality 48
Critical levels of pollution were already detected in the lake in 1973 (SOGREAH 1974). 49 About 5,000 tons of nitrogen were estimated to have entered the lake, 26% of which was 50 domestic, 36% from livestock and poultry, 5% from industrial sources, 11% from 51 fertilizers and 22% from the Pasig River backflow. The average nitrate concentration was 52 150 µg/L and the total nitrogen was assumed to be between 900 to 1,000 µg/L. 53 Inorganic phosphate was below 40 µg/L and the total phosphate was below 100 µg/L. 54 The focus on N was due to the initial findings that N limits algal growth in the lake. A 55 follow-up study conducted from 1975 to 1977 also indicated that nitrogen appeared to be 56
DRAFT: Not for Citation or Distribution Laguna de Bay
7
the most likely limiting factor which control algal growth in the complex interaction of 1 nutrient supply, light penetration, water temperature, and lake turbidity. 2 3 The reassessment of the status of Laguna de Bay done in 1984 (BCEOM 1984) showed 4 that nitrogen can still be considered as the main factor of eutrophication, although there 5 were also times when light (at times of high turbidity) and temperature (during the 6 cooler months when blue green algae numbers were low) seemed to be limiting. It was 7 reported that the Laguna de Bay was not yet at the upper end of the ladder of 8 eutrophication. Recent estimate (year 2000) generated through the use of the Laguna de 9 Bay waste load model showed a total input of 13,800 tons N/yr of which 79% came from 10 domestic sources, 16.5% from agricultural activities, 4.5% from industrial effluent and 11 0.5% from other sources. 12 13 Laguna de Bay is classified as a Class C inland water (DENR 1990), which means it is 14 suitable for fishery. Assessment of its water quality is based on the criteria for different 15 parameters such as dissolved oxygen, biochemical oxygen demand, nitrate, phosphate, 16 dissolved solids, suspended solids, etc. Values of some selected parameters are 17 presented in Figures 3A to 3F, which reflect that the lake’s water quality is within the 18 Class C criteria, except for chloride. The phosphate concentration exceeded the 19 maximum limit in 1997, which was an El Nino year (LLDA 1990-1999). 20 21
See Figure 3A to 3F 22 23 Due to its eutrophic character, algal bloom is a common occurrence in the lake. Lake-24 wide algal bloom of Microcystis sp. with concentration of up to one million algae per 25 milliliter was recorded in 1973. Its most damaging effect in aquaculture was in 1975 26 (June-July), killing about 5 million of milkfish. Localized fishkill due to the collapse of 27 blue-green algal bloom are also experience in the lake. 28 29 Total coliforms and fecal coliforms in the lake seldom exceed the allowable limit for Class 30 C water of 5,000 MPN/100 ml and 200 MPN/100 ml, respectively, but since the sampling 31 stations are in the open water, the same findings may not be true near the lakeshore 32 areas. This is in consideration of the lack of sewerage system in the drainage basin. What 33 are common are individual septic tanks in residential areas. 34 35 Heavy metals such as cadmium (Cd), chromium (Cr +6), lead (Pb), Copper (Cu), iron 36 (Fe), nickel (Ni) , and zinc (Zn) are regularly monitored in the lake. The first three in the 37 line are included in the list of parameters for the assessment of Class C water and their 38 respective concentration (LLDA,1999) were below the set criteria of 0.01, 0.05 and0.0g 39 mg/L, respectively. Lead and Nickel were below the detection limit while Zn concentration 40 ranges from 0.10 to 0.03 mg/L. The concentration of Fe is normally high at an average of 41 1.986 mg/L. Preliminary studies (NEDO, LLDA, JEMAI 2000) showed that the level of 42 arsenic in the lake ranged from 0.022 to .030 mg/L as compared to the criteria of 0.05 43 mg/L. 44 45 The heavy metal concentrations in the sediments of the lake are very low, only up to 46 twice the average shale values, except for Ni which has concentrations in the range of 2 47 to 12 times the average shale values. Based on the assessment done by the National 48 Institute of Geological Sciences (1999), the lake’s overall pollution levels derived from 49 the sediment data, can still be described as very low, corresponding to Igeo 0 to 2 which 50 is interpreted as unpolluted to moderately polluted. 51 52 3.2 History of Lake Degradation 53
The root causes of rapid deterioration of the resources in the lake and its watershed are 54 (well documented in various studies: SOGREAH (1991), Sly (1993), Orbeta and Indab 55

DRAFT: Not for Citation or Distribution Laguna de Bay
8
(1994), LLDA (1995), USAID (1996), LLDA and ERDB (2000), LLDA and Delft Hydraulics 1 (2000-2002).) These are: 2 3
• Intensified economic activities resulting in increased urbanization and 4 industrialization and population pressure mostly in the western zone of the 5 basin, thus exacerbating the environmental quality in the urban sector and 6 degradation of forest and fishery resources of the lake and its watershed; 7
• Open access to natural resources use; 8 • Lack of economic resource pricing policies; 9 • Lack of a common policy objective for the management and development of 10
the resources of the lake and its watershed 11 12 These can be further classified into urbanization, industrialization and resource 13 extraction. 14 15 Urbanization and industrialization 16 17 The impact of rapid population growth, urbanization and industrialization as well as the 18 concomitant real estate development is causing severe stress on the lake environment 19 and the watershed area. The lake is getting shallower from an average depth of 3 20 meters in the seventies to the current average of 2.5 meters. Rapid denudation of the 21 forested areas and land conversion have further aggravated this problem. Flash floods 22 and mud slides have become frequent in recent times resulting to loss of property and 23 death. 24 25 The rapid migration in urban centers and the uncontrolled human settlement along river 26 banks and lakeshore areas contributed to the growing problem of solid and liquid wastes. 27 Domestic waste of a majority of the 6 million population in the watershed finds its way to 28 the Lake. The trend of population migration, industrialization, and urbanization certainly 29 is not toward moving away from the lake and its watershed. From an estimated BOD load 30 contribution of 26% from domestic wastes in 1976, (WHO,UNDP,LLDA 1978), it increased 31 to 68 % in 2000 (LLDA 2001) . Unfortunately, the government has no serious program to 32 treat domestic wastes. Except for newly developed housing and commercial subdivisions, 33 there is no centralized sewerage system, Primary treatment through septic tanks are 34 common in urban residential areas but not in rural areas and in places occupied by 35 informal settlers, usually along the river banks and lakeshore. Solid waste collection and 36 disposal has always been a problem by the LGUs. Waste segregation and recycling is 37 practiced in some places but indiscriminate open dumping of wastes is a common 38 practice. Laguna de Bay serves as the receptacle of treated, partially treated and 39 untreated liquid waste and that is discharged into the lake. This lake use directly 40 conflicts with all other uses and poses the greatest challenge to the LLDA and all other 41 agencies and stakeholders. 42 43 Industrial pollution contributes about 30.35% of the total pollution load coming into the 44 lake. The number of industrial firms in the region has increased five-fold since 1970. It 45 was estimated that there were about 1,538 in 1994. Based on LLDA’s most record, there 46 are now some 3,881 industrial establishments in the basin situated mostly in the western 47 side of the lake. Of this number, about 26% make use of dry processes, 23% generate 48 wastewater through wet processes, while 45% involve both wet and dry processes. The 49 remaining 6% is still unclassified. Of those firms with wet and dry processes, 34% have 50 installed wastewater treatment facilities, while others have adopted full recycling 51 practices. 52 53 Resource extraction 54 55 Illegal fishing practices has been observed in the lake since the 1930’s. A decline in open 56 water fishery was already reported in the early seventies (Shimura and Delmendo 1969; 57

DRAFT: Not for Citation or Distribution Laguna de Bay
9
Delmendo and Gedney 1974) but the effects were manifested clearly in the 1980’s, thus 1 it became difficult to convince fishermen that their common fishing practice is causing 2 the decline in their fish catch. The destruction of the lake bed, especially near the littoral 3 areas was suspected to be the reason for the decline in the population of some native 4 aquatic macrophytes like Hydrilla sp. 5 6 Snail dredging used to support the duck raising industry in some lakeshore towns. The 7 practice continued to be unabated in the mid-eighties to the nineties. Truckloads of snails 8 are being hauled from the lake to support land-based duck raising industry and prawn 9 culture in earthen ponds outside of the lake basin. The income from snails seemed to be 10 high since most fishermen and boatmen in the lakeshore towns shift to snail gathering 11 during peak season. This kind of livelihood is no longer observed in recent times. 12 Unfortunately, this economic activity was not given due attention in terms of 13 documentation and research, especially on the impacts of excessive snail gathering on 14 the lake’s ecology. 15 16 Aquaculture operation started in a commercial scale in the early seventies. The cultured 17 fish, Chanos chanos or milkfish rely on the natural food from the lake. Two croppings per 18 year was the practice, thus the return of investment was fast . The business attracted a 19 lot of businessmen such that aquaculture structures occupy almost 2/3 of the lake’s 20 surface area in 1983. A decline in harvest was observed due to depletion of natural food, 21 aside from the obstruction of water movement caused by the unorderly arrangement of 22 fishpen structures. Likewise, water hyacinth infestation became serious especially in 23 areas where they are trapped within the structures. Other fish species were introduced in 24 the lake for the purpose of aquaculture without an assessment of their impacts to the 25 lake’s ecology. Unfortunately, the organic load from fishpen and fish cage operation has 26 not been monitored. 27 28 The denudation of the forest and the siltation of the lake and the tributary rivers in the 29 Rizal Province area is being blamed on quarry operation and extraction of limestone. 30 Often, the communities complain not only on air and noise pollution but on the unusual 31 coloration of the rivers. 32
3.3 Lake and Drainage Basin Resource Conflicts 33
The Institutional Re-engineering Studies undertaken by Tetra Tech EM Inc. and PNB 34 Capital and Investment Corporation for the LLDA under the World Bank/Japan PHRD 35 funded project came out with a detailed analysis of root causes of conflicts in the Laguna 36 de Bay Region and are presented in the succeeding sections. 37 38 Conflict among Institutions 39 40 The institutions within the Laguna de Bay Region can be grouped into: (1) regulators; (2) 41 policy makers, planners, and coordinators; (3) developers (land and water including 42 infrastructure development and provision of basic services); (4) research and 43 development institutions; (5) resource users; and (6) Local Government Units (LGUs). 44 The existing institutional arrangements are complex. There is no coherent and integrated 45 environmental or development governance system, which led to a series of separately 46 formulated and separately implemented policies, mandates, and programs each striving 47 to meet the relatively narrow and stand-alone goals. Such arrangement have been 48 inefficient in: (1) creating a widely accepted common objective over the management of 49 the natural resources of the Lake and its watershed; (2) balancing the different political, 50 economic, and social interests; and (3) focusing the government, private sector, and 51 citizen resources on the management of this ecosystem. The factors causing and 52 exacerbating the institutional inefficiency include: 53 54
DRAFT: Not for Citation or Distribution Laguna de Bay
10
• The fragmented and often conflicting policies in environmental and natural 1 resources management of the Lake and its watershed 2
3 • Limited capacities in environmental management particularly at LGUs 4
5 • Exhausted administrative and civil service and a weak political will in central 6
and regional environmental agencies that prevent these agencies from 7 expeditiously addressing the conflicting institutional arrangements in the 8 region 9
10 • Slow devolution of responsibilities and resources from central agencies to 11
LGUs and inadequate effort to strengthen the governance and the capabilities 12 of LGUs to assume a greater responsibility in fulfilling their mandates 13
14 • Lack of, or at best, narrow opportunities for community and private sector 15
participation in the management and sustainable use of the natural resources 16 in the region 17
18 The LLDA re-engineering study also came out with the observation that limited 19 overlapping of mandates and responsibilities is often not a hindrance. The conflict arises 20 when the objectives of the policies and laws creating those mandates contradict. 21 Further, the conflicts become deeper when the resource base in question is delicate and 22 has limited carrying capacity to satisfy all the mandates. 23 24 Conflict Among Users 25 26 Almost all the previous studies about Laguna Lake highlight the conflict among the 27 various users, infrastructure developers, and regulators and policy makers. Most of the 28 current and foreseen problems in the management of the Lake and its watershed are 29 attributed to these conflicts. A set of case studies exists that clearly reflect the root 30 causes of conflicts among the lake users. Among these cases the following are 31 representatives of the conflict issues: 32 33
• Development projects to improve the use of lake water for irrigation is faced 34 with increasing salinity and contamination from the Pasig River that will make 35 the lake water unsuitable for agriculture. Pollution from industries, household 36 waste, and transportation within the lake also threatens the agricultural 37 enterprises. Although LLDA has started to implement strict regulations against 38 effluent discharged by industries, the lake's role as a waste receptacle is not 39 likely to decrease. 40
41 • The Napindan Hydraulic Control Structure (NHCS) has been the cause of 42
conflict between the Department of Public Works and Highways (DPWH) and 43 the fishing community. The NHCS's purpose to regulate backflow from the 44 Pasig River has been ignored in favor of fishermen who need the brackish 45 water for the productivity of the aquatic resources of the Lake . The role of the 46 lake as a buffer against flooding along the Marikina and Pasig Rivers has 47 exacerbated the conflicts by the impact of a flooded lake on farms, fishpens, 48 and lakeshore development. 49
50 • Use of the lake by fishpen owners constitutes another level of conflict. From 51
38 hectares in 1970s, fishpens grew to more than 30,000 hectares in 1983, 52 seriously reducing the areas for open fishing and impeding navigation. To 53 reduce the adverse impact of fishpen on fish production, LLDA implemented a 54 zoning plan that reduced the fishpen areas to 10,000 hectares and fish cage 55 areas to 5,000 hectares. Still the fishermen, fishpen operators, the Bureau of 56 Fisheries and Aquatic Resources, and LLDA continue to argue the wisdom, 57
DRAFT: Not for Citation or Distribution Laguna de Bay
11
size, location, and the benefits of these structures. Compounding the problem 1 is the weak enforcement of fisheries Laws on the fishing boat registration, 2 illegal fishing, and the role of LGUs in the enforcement of these laws. 3
4 • The Lake's potential, as a key source of drinking water cannot be ignored. The 5
two previous administrations in the Philippines proclaimed this goal for the 6 Laguna de Bay. Increasing emphasis on the role of the lake as a source of 7 drinking water supply will challenge all other uses of the lake. 8
9 • Quarry operations around the lake and in its watershed is another resource 10
use that potentially contributes considerably to pollution and sedimentation of 11 the lake. Currently, the Mines and Geosciences Bureau (MGB) an office under 12 the DENR, regulates quarries over 5 hectares while the Provincial Governors 13 control the smaller quarries. The authorities for permitting, clearance, and 14 enforcement among DENR, LGUs, and LLDA have not been streamlined. In 15 addition, there are illegal small-scale mining operations in the region. 16
17 • A large portion of the population in the region are informal settlers who 18
typically cluster in the flood and pollution-prone locations such as shorelands, 19 river banks, embankments, and other areas subject to severe flooding. Most 20 of these areas are in fact the environmentally sensitive areas. The solid waste 21 generated by this large population are carried by the rivers to the lake. 22
23 • Attempts to protect the lake as primarily a protected site has long been 24
abandoned in favor of unavoidable demand for water and fish. However, a 25 small-scale tourism still struggles to survive amidst the lake traffic. Visitors 26 take historic tours and boat rides to remote pockets where swimming is 27 considered safe. 28
29
4.Management Environment 30
4.1 Lake Management Programs and Processes 31
The more serious and systematic approach to the integrated management of the Laguna 32 de Bay Region was the formulation of the Laguna de Bay Master Plan in 1995 and 33 approval in 1996 by the President of the Philippines. While a water resources 34 development master plan was formulated in 1974 as a result of the Water Resources 35 Development Studies in 1972-1974, the 1996 Master Plan took cognizance of the 36 interacting relationship between and among the various uses of land and water resources 37 and the conflicts among alternative production activities as well as uses of the lake water 38 and surrounding related land resources particularly those dictated by urbanization and 39 industrialization. The Master Plan prescribes strategic policies, institutional reforms 40 action programs and management measures to harmonize, integrated and strike a 41 balance between downstream and upstream activities in the watershed, true to a lake-42 basin management approach. 43 44 The Master Plan places heavy emphasis on the identification, formulation and elaboration 45 of priority programs and projects in order to attain the goals of sustainable development 46 of the Laguna de Bay Region. Thus, the Master Plan represents the most explicit action 47 towards the strengthening of the integrated lake basin management approach in the lake 48 basin. Four flagship programs are currently being pursued namely environmental 49 management, watershed management, fisheries development and institutional reform and 50 development. 51

DRAFT: Not for Citation or Distribution Laguna de Bay
12
Environmental management program 1
a. Water quality monitoring 2
This activity started in 1973 with initial focus on lake water quality. When the mandate of 3 the LLDA was expanded to include pollution control, monitoring of industrial effluent also 4 became a regular activity. The LLDA, through its Environmental Quality Management 5 Division is operating its own water quality laboratory. It has gradually built up its 6 capability through the acquisition of state of the art laboratory instruments either from 7 the LLDA’s operating cost or through grants and research cooperation with reputable 8 international institutions. A pool of well-trained staff runs the laboratory and performs 9 both the collection and analysis of lake and river water samples. The laboratory also 10 services external client and generate income for the Authority. 11 12 The lake and the tributary rivers are monitored regularly on a monthly basis. Industrial 13 effluents are collected by inspectors from the Pollution Control Division who are trained 14 on the collection and handling of samples during delivery to the laboratory. The results of 15 laboratory analysis become the basis for evaluating the compliance of industrial 16 establishments to the existing rules and regulations on effluent discharge. Data on the 17 lake and tributary rivers are published annually. The monthly status of the water quality 18 of the lake and the tributary rivers is also posted in the LLDA website using the Water 19 Mondriaan (refer to section 5.7). 20
b. Environmental user fee system (EUFS) 21
Implementation of the EUFS started in January 1997 as Phase 1 of the National Program. 22 It was designed in a manner that integrates and harmonizes command and control (CAC) 23 and economic instruments with the objective of generating mechanism to improve 24 environmental enforcement and compliance status of firms located in the Laguna de Bay 25 region. The system now forms an integral part of LLDA’s Environmental Management 26 Program. 27
28 The EUFS is primarily aimed at reducing the pollution loading into the Laguna de Bay. It 29 makes all dischargers of liquid waste directly accountable for environmental damages 30 brought about by their day-to-day operations by internalizing the cost of environmental 31 degradation and enhancement into their business decisions and actions. Eventually, the 32 foremost goal of the EUFS is to limit point sources wastewater discharges to a level that 33 would ensure that water bodies within the Laguna de Bay system would be protected and 34 made suitable for their intended uses. 35 36 The fee system is composed of a fixed fee and a variable fee. The fixed fee covers the 37 administrative costs of implementing the system based on volumetric rate of discharge, 38 while the variable fee depends on whether the BOD concentration is above or below the 39 concentration threshold which corresponds to the existing effluent standard for BOD of 40 50 mg/L, regardless of total BOD load. This scheme has induced firms to be more cost 41 effective in trying to comply with standards and in effect made the EUFS a model of 42 mixed regulatory and economic instrument. An enterprise is required to obtain a 43 Discharge Permit (DP), renewable annually, from the LLDA. The DP is a legal 44 authorization for the enterprise to discharge their wastewater of acceptable concentration 45 set under DENR DAO 35 to the lake or its tributary rivers. 46 47 The EUFS is planned to cover all water pollution sources from industrial, commercial, 48 domestic and even agricultural sources. As a matter of strategy LLDA cautiously 49 implemented the EUFS by stages. A budget of about P27 M taken from LLDA’s corporate 50 funds was initially allocated to support implementation requirements including acquisition 51 of additional fleet of vehicles and some laboratory equipment. 52 53

DRAFT: Not for Citation or Distribution Laguna de Bay
13
In 1997, the first year of EUFS implementation, imposition of user fee was based only on 1 the BOD content of industrial wastewater and was applied to around 120 industrial firms 2 located within the LLDA’s area of jurisdiction. These firms belong to five industrial sub-3 sectors that were estimated to account for nearly 90% of the total organic load into the 4 lake: food-processing firms, pig farms and slaughterhouses, beverage manufacturers, 5 firms engaged in dyes and textiles, and paper and pulp mills. 6 7 The following year, all industries that generate process wastewater were covered and on 8 1999 which was the third year of implementation, residential subdivisions and 9 commercial establishments including food chains and restaurants that discharge 10 wastewater into the environment were likewise, covered. 11 12 The EUFS is being implemented by LLDA through its Pollution Control Division (PCD) as 13 the lead unit with the support from the Environmental Quality Management Division for 14 the analysis of the wastewater samples collected by the inspectors. A Public Hearing 15 Committee (PHC), whose secretariat is the Legal Division of the LLDA, gives support in 16 the adjudication and litigation of cases including cases related to non-payment of 17 environmental user fees. Studies are underway on the use of other water quality 18 parameters as basis for the imposition of user fee. 19 20 Aside from the EUFS, the traditional regulatory system of the LLDA is still in place. All 21 industrial establishments are required to register and those with wastewater discharge 22 are required to have a Pollution Control Officer that shall be accredited by the Authority. 23 The LLDA has developed a training program for PCOs for accreditation purposes, which 24 includes lectures such as on clean technologies, . Aside from generating a modest income 25 for the Authority, it has also become a vehicle for disseminating the plans and programs 26 of the Authority and the pollution laws being implemented in the Laguna de Bay Region. 27 This program has gained wide acceptance from the industrial sector and there are a 28 number of cases where they themselves request for a special training schedule. 29 30 Shoreland Management Program 31
32 It took almost thirty years for the LLDA to assert its mandate on the management of its 33 140 km 2 shoreland.. The first action taken was the issuance in 1995 of Board Resolution 34 No. 10, Series of 1995 asserting LLDA’s authority and exclusive jurisdiction over Laguna 35 de Bay and banning reclamation projects and disallowing any non-environmentally 36 feasible activities in the lake. A year after, the rules and regulations on the 37 use/occupancy of Laguna de Bay shoreland areas was approved by the LLDA Board on 38 December 14, 1996. It took another two years to create a new unit at the LLDA, the 39 Special Concerns Office which later became the Special Concerns Division, to take the 40 lead in implementing the rules. In 1999, the guidelines on the lease of the shoreland 41 were also prepared and implemented. 42 43 Under these rules, it is the declared policy of the LLDA, pursuant to RA 4850 as amended 44 to: (i) properly manage and control the use and/or occupancy of the shoreland areas of 45 Laguna de Bay, within the context of national socio-economic development plans and 46 policies and environmental concerns; (ii) maintain all shoreland areas lying below 47 elevation 12.50 meters as buffer zones in consonance with the Authority’s policies, plans 48 and programs for the management of the water quality and protection and conservation 49 of the water resources of Laguna de Bay; (iii) exercise administrative and regulatory 50 control on the land use and/or occupancy of the shoreland areas within the context of the 51 plans and programs of the LLDA, and to manage such uses and occupancy along 52 desirable environmental considerations; and (iv) provide an administrative system 53 whereby the rights of legitimate titleholders shall be respected. 54 55

DRAFT: Not for Citation or Distribution Laguna de Bay
14
The LLDA is looking into the effectiveness of the current policy instruments for shoreland 1 management and control due to a number of implementation and enforcement issues: 2
• Development projects/activities have overtaken regulation and control 3 (the law, P.D. 813, defining the shoreland was enacted in 1975, while 4 the policy guidelines were issued in 1996); 5
• Lack of resources to monitor shoreland activities and enforce the rules 6 and regulations; 7
• Indifference of lakeshore LGUs manifested in citing of illegal open 8 dumpsites on shoreland and riverbanks; proceeding with local 9 development activities/projects without the needed environmental 10 clearances and permits from the DENR and LLDA.; 11
• While the policy tools are existing (Shoreland Occupancy Permits, 12 Notice of Violation, Ex-Parte Orders and Cease and Desist Orders), they 13 are insufficient for the purpose of shoreland restoration and 14 environmental regulation and control. 15
16 Watershed development program 17 18 a. Reforestation and tree planting 19 20 The watershed area is three times the size of the lake where 66 local government units 21 exercise their respective political mandate. Added to this is the responsibility to protect 22 and manage the environment in their areas of jurisdiction as stipulated in the Local 23 Government Code. With these realities the LLDA started to link closely with the local 24 officials and the communities as an entry point to a meaningful and practical watershed 25 development program. 26 27 Almost all LGUs have a reforestation or tree planting program in response to the massive 28 CLEAN and GREEN campaign of the national governement. To respond to the needs for 29 more seedlings and to enhance the desire of the LLDA to cooperate with the 30 environmental program of the LGUs, the LLDA embarked on the maintenance of a plant 31 nursery to support reforestation program of different towns within the watershed. Similar 32 support is being given to socio-civic organizations and NGOs. 33 34 b. River Rehabilitation Program 35 36 In 1996, the LLDA started a River Rehabilitation Program for the rivers and streams 37 flowing through the 24 sub-basins or micro-watershed of the Laguna de Bay basin. This 38 program has evolved from a mere physical clean-up of rivers to a more comprehensive 39 and sustainable approach by encourging broad multi-sectoral involvement and support. 40 Various stakeholders within each sub-basin such as local government officials, academic 41 institutions, industrial and commercial establishments, religious groups, NGO’s, PO’s 42 (people’s organization) civic organizations, homeowners, etc. were organized to a River 43 Rehabilitation and Protection Council (RRPC). A systematic approach is being followed by 44 the Council which includes mapping the watershed, comprehensive survey of the river 45 system and its watershed and development of a vision for a healthy river system and 46 watershed and based on this vision, formulate a River Rehabilation and Protection Plan 47 for the river in focus. 48 49 River clean-up campaigns are also being sustained and this involves the physical clean-50 up of rivers. The LLDA has organized the Hukbong Pangkapaligiran or “Environmental 51 Army,” a volunteer organization consisting mainly of fisherfolk and farmers, to lead the 52 activity. The men and women of the Environmental Army are exemplars of volunteerism 53 who play a vital role in raising environmental awareness and heightening motivation 54 among various sectors to be involved in the rehabilitation effort. The program was so 55

DRAFT: Not for Citation or Distribution Laguna de Bay
15
successful that led the LLDA to institutionalize the RRPC. A seed money of P50,000 or a 1 little under US $1000.00 was given as seed money to support their activity or their 2 registration as a foundation. 3 4 The involvement of the industrial sector in the RRPC has narrowed the gap between them 5 and the community especially those who has a preconceived idea that industrial 6 establishments pollute the environment. Most of the successful and active RRPCs are 7 those with active members from this sector, whose representatives are often elected to 8 higher position in the council. 9 10 All the RRPC were federated on June 26, 2001 to serve as an umbrella organization of 11 the River Councils around the Laguna de Bay Region. The members elected the first set 12 of officers among themselves. A conference of the RRPC/F is held every year where each 13 council or foundation present their accomplishments and update the other councils or 14 foundations on their present projects and future plans and programs. Likewise it serve as 15 an occasion for enriching their knowledge through lectures by invited resource person on 16 matters concerning solid and liquid waste management, waste exchange, and other 17 topics of interest and concern geared towards enhancing the capabilities of the members 18 to perform their tasks. 19 20 Fisheries Development Program 21 22 a. Aquaculture Operation 23 24 Regulation of aquaculture operation is based on the Zoning and Management Plan 25 (ZOMAP) of the lake, which by far is considered as the most feasible management 26 system for the equitable allocation of the lake’s fishery resource. Fishpen belts and fish 27 cage belts were delineated with a total area of 100 km2 and 50 km2, respectively (Figure 28 4). Limits were set on the maximum area that can be occupied for fishpen operation, i.e. 29 0.05 for a corporation, .01 for a cooperative and 0.005 for an individual owner. The 30 maximum area for fish cage is .001 km2. A permit is issued annually in which the fishpen 31 owner pays P6,000.00 per hectare (.001 km) and a fishcage owner pays P4,200.00 per 32 hectare. Vacant areas within the fishpen belt is awarded to an operator by bidding. The 33 fish cages are still on the process of being transferred to the fish cage belt. 34 35
See Figure 4 36 37 In keeping with the provision of RA 4850 on the distribution of benefits from fishery to 38 the LGUs, the fishpen fee collected by the LLDA is shared in the following scheme. From 39 a fishpen fee of P6000.00 (US $ ), every lakeshore municipality receives a share of 15% 40 and an additional 20 % if there are fish pens and fish cages off their shore (Figure 5). 41 The LLDA specifies that their share should be used to finance environmental projects. 42 43
See Figure 5 44
b. The Fisheries and Aquatic Resource Management Council (FARMC) 45
In 1995 the President of the Philippines issued Executive Order 240 “Creating the 46 Fisheries and Aquatic Resources Management Councils in Barangays, Cities, and 47 Municipalities and their composition and functions.” This is in accordance with the policy 48 of the Philippine Government to ensure that the management and control over fisheries 49 and aquatic resources shall be effected by the Philippine Government through the active 50 and extensive participation of people directly affected. The law also called for the 51 empowerment of the subsistence fisherfolk through meaningful participation in the 52 management, development and protection of fisheries and aquatic resources for 53 sustainable productivity. Republic Act 8550 known as the Fisheries Code of 1998 further 54 strengthened the important role of the FARMC by specifying the composition of the 55

DRAFT: Not for Citation or Distribution Laguna de Bay
16
FARMC and the responsibility of concerned government agencies in ensuring that the 1 functions of the FARMC are recognized and institutionalized. The FARMC is composed of 2 representatives from the Department of Agriculture, LGU, NGO, and fisherfolks including 3 women and representative from the youth sector. Representation from the LGU is given 4 due importance to ensure that the plans and programs will be incorporated in the 5 municipal or city development plan and given due priority. 6 7 The Executive Order is directed to the Department of Agriculture, but in recognition of 8 the exclusive mandate of the LLDA in the Laguna de Bay Region, the task was 9 transferred to the LLDA through a Memorandum Agreement. 10 11 Even before the passage of these laws, the LLDA have already established links with 12 fishermen organization and have rendered financial and technical assistance in their 13 operation. Support came in the way of financing their training as Bantay Lawa (Lake 14 Guard) and deputation of qualified fishermen as Fish Warden in coordination with the 15 Bureau of Fisheries and Aquatic Resources Funds are also being given to implement 16 clean-up activities in the lake, and in the surveillance of illegal fishing activities. 17 18 Institutional reform and development program 19 20 The proposed reorganization of the LLDA is consistent with the Public Sector Reform 21 Program and the Water Resources Sector Policies and Directions as embodied in the 22 Philippine Medium-Term Development Plan 2002-2004, which stipulate that “the 23 government shall support the strengthening of existing and efficiently operating 24 river/lake basin authorities. 25 26 a. Re-engineering the LLDA 27 28 Since the creation of the LLDA in 1966, new tasks and demands have emerged. It must 29 now confront new challenges such as a rapidly growing demand for lake water to serve 30 the needs of an expanding metropolis and lakeshore towns. It needs to properly 31 coordinate infrastructure development and regulate the multiplicity of resource uses by 32 various sectors. It addition, it has to facilitate interaction among various stakeholders, 33 among which there are conflicting interests amidst alarming threats on the sustainability 34 of the lake. 35
As early as 1983, the LLDA was authorized through Executive Order 927, to undertake a 36 thorough corporate reorganization. Likewise, the Laguna de Bay Master Plan calls for the 37 institutional and organizational reforms in the LLDA. The envisioned reorganization was 38 not implemented by the LLDA due to changes in the political environment in the country 39 and the accompanying administrative and financial constraints. The last 15 years 40 witnessed the growing concern for more active protection of the lake, given the rapid 41 increase in population, settlements, industrial establishments, and other economic 42 activities in the basin. Current population estimates put it at close to 6 million. 43
In the year 2000-2001, the Re-engineering study for the LLDA was conducted through a 44 grant from the World Bank. It is a self-directed effort of the Authority to transform itself 45 into an expanded and effective organization in order to fully discharge its mandated 46 powers and functions. Its purpose is to develop the most appropriate institutional model 47 and the associated planning and policy framework to enable LLDA to become an effective 48 development authority while maintaining its regulatory mandate. This calls for re-49 structuring the LLDA organization and staffing, streamlining its functions and building 50 political and social acceptability especially among its stakeholders. An integrated water 51 resources management and development institutional model was recommended (Figure 52 6). This was also the optimal option acceptable to all the stakeholders given the 53 challenges in the Laguna de Bay Region. 54 55

DRAFT: Not for Citation or Distribution Laguna de Bay
17
See Figure 6 1 2 The main characteristics of the institutional model are as follows: 3
• The primary mandate of the re-engineered LLDA will be policy making, 4 planning and implementing a integrated water resources management and 5 development for the lake and its river systems including enhancing water 6 quality and quantity, expanding the regulatory responsibilities for 7 monitoring compliance with water standards, expanding the EUFS; 8
• The scope includes the overall management of Laguna de Bay and its river 9 tributaries, shorelands and aquatic resources and expanding it to include 10 groundwater in the future. Included in this scope is raw water pricing 11 development and implementation, environmental infrastructure 12 development and coordination of land use planning in collaboration with 13 LGUs; 14
• The level of autonomy will expand from its current status as a Government 15 Owned and Controlled Corporation (GOCC)relying solely on operating 16 revenues to an investment-oriented development organization through the 17 proposed Laguna de Bay Development Corporation 18
• The LLDA becomes the apex body in the Laguna de Bay Region with the 19 responsibility for coordinating integrated watershed management and 20 development program . 21
In this model, the LLDA Board remains as the policy-making body of the Authority. In 22 order to make the decision-making process more inclusive, two advisory groups shall 23 support the Board: the Technical Council and the Watershed Management Council. The 24 Technical Council will serve as a permanent advisory council to LLDA for making policy 25 for resolving issues related to institutional arrangements in the Laguna de Bay Region 26 including harmonization and resolution of conflicting and overlapping functions, activities, 27 policies and plans that exist or arise between and among the LLDA and other government 28 agencies and GOCCs in the region. 29 30 The Watershed Management Council will be a multi-sectoral advisory council to support 31 policy and planning activities in the lake watershed among the sectors with stakes in the 32 region. The Council will serve as a convergence point for the review of sectoral policies 33 and programs that have implications on watershed resources. 34 35 b. Capacity Building 36 37 The Sustainable Development of the Laguna de Bay Environment Project which has just 38 ended this August (2003) is supported by a grant from the Netherlands Government. The 39 three-year project was carried out to ensure the sustainable development of the 40 resources of the lake based upon a sound knowledge of the functioning of the system, its 41 users and the institutional setting. It is specifically directed at capacity building and 42 developing practical and realistic solutions for current problems and issues in the lake 43 basin. Among the achievements of the project were the establishment of an Integrated 44 Water Resources Management Unit and the establishment of an appropriate 45 GIS/database and state-of-the-art modeling system to support decision-making. All of 46 these are geared towards the transformation of the LLDA into an Integrated Water 47 Resources Management and Development Authority. 48 49 c. Local and international partnerships and cooperation 50 51 Conservation of Laguna de Bay Environment and Resources (CLEAR) 52

DRAFT: Not for Citation or Distribution Laguna de Bay
18
1 CLEAR is a tripartite partnership formed by the LLDA, Unilever Philippines and the 2 Society for Conservation of Philippine Wetlands with a common objective of pursuing the 3 lake’s membership in the Living Lakes Network. A Memorandum of Agreement was 4 signed in June 2000 to ensure the continuity of efforts to conserve the lake’s resources 5 and empower and educate the communities within the watershed. 6 7 As private sector partner, Unilever provides funding support for advocacy initiatives and 8 activities that influence and mobilize the business sector towards corporate responsibility. 9 As a collaborating agency, the LLDA coordinates the tripartite partnership’s activities and 10 provide funding support for biodiversity studies on the lake and environmental education 11 projects. As the NGO partner, SCPW has been tasked to design and implement advocacy 12 activities for lake conservation, coordinate with other environmental NGOs in the lake 13 region and be the focal point for coordination with other Living Lakes partners throughout 14 the world. 15 16 The idea of joining the network started in November 1999 during Unilever’s meeting on 17 Sustainable Water and Integrated Catchment Management (SWIM) in Liverpool, England. 18 The lake’s candidacy was formalized in November 2000 during the 5th Living Lakes 19 Conference in Lake Biwa, Japan. 20 21 Laguna de Bay was accepted as the 18th member of the Living Lakes Network in August 22 2001, during the 6th Living Lakes Conference held in the Lake Baikal area in Ulan Ude, 23 Siberia. Its admission to the network was a “breakthrough for Laguna de Bay and a 24 milestone for Philippine environmental history” (Jerry Esplanada, Philippine Daily 25 Inquirer). More importantly, it brings the conservation of the lake to the attention of the 26 international community, which can serve as a positive pressure on the government to 27 take serious actions on preventing the deterioration of the lake environment. 28 29 Parnership with U.S. Agencies, Chesapeake Bay and Tha Chin River (Thailand) 30 31 In August 2002, the LLDA forged a partnership with United States agencies (US-AEP, 32 USEPA, USAID, etc.) on sharing of knowledge, experiences, and best practices on 33 community-based environmental management and resource conservation in Chesapeake 34 Bay in eastern United States, as well as with the Pollution Control Department of the 35 Kingdom of Thailand on Integrated Watershed and Water Quality Management and Public 36 Participation in the Tha Chin River Basin. LLDA’s River Rehabilitation Program and its 37 partnership with the River Councils in the river systems in the lake region was cited as 38 one of the best practices on community-based resource management scheme during the 39 international workshop that was held in August 2002 in Manila. 40 41 4.2 Reduction of lake stresses 42 43 A snap shot analysis of the result of concerted efforts in the environmental protection of 44 the Laguna de Bay is the maintenance of its Class C status, inspite of the growing threats 45 on the lake. The orderly arrangement of fishpens as a result of the implementation of the 46 revised Zoning and Management Plan of the lake resulted to better water movement in 47 between the structures and lessen the hazard of water hyacinth accumulation. Not to be 48 discounted is the resolution of conflict between the fishpen operators and the fishermen. 49 Improvement in the fish production due to the ZOMAP implementation seem to be 50 difficult to assess due to other environmental factors that affect production and the lack 51 of cooperation from the fishpen operators to disclose their harvest per cropping season. 52 They still have to appreciate the importance of their information in the evaluation of the 53 program and in the assessment of the lake’s productivity. 54 55 A more objective assessment can be presented in terms of the implementation of the 56 Environmental User Fee System (EUFS). After the three-year introductory phase of the 57

DRAFT: Not for Citation or Distribution Laguna de Bay
19
EUFS and into its regular implementation, the total number of firms covered as of 1 December 2002 was 914. There has been significant reduction in the BOD loading into 2 the lake from 1997 to 2002 as shown in Table 1. 3 4
See Table 1 5 6
The significant reduction in the BOD loading in the lake from 1997 to 1999 coincided with 7 the introductory phase of the EUF and is a reflection of its successful implementation. 8 The reduction in the BOD loading was due to several factors: (a) increased efforts among 9 the regulated sources to treat their wastewater by putting up new or improving their 10 existing treatment facilities, (b) wastewater recycling activities, (c) waste minimization, 11 and (d) voluntary closure or plant relocation. This was greatly influenced by the 12 strengthened monitoring activity complemented by faster resolution of pollution cases. 13
14 The actual impact to ambient lake water quality condition of the BOD loading reduction 15 from point sources as a result of EUFS implementation is still undetermined. The LLDA 16 intends to apply its newly developed Decision Support Systems and modeling tools to 17 achieve full coupling of the results of laboratory analysis database on industrial pollution 18 loads to the waste load model and the GIS-generated information. 19 20 Enabling Environment 21
22 Regulatory Powers and Functions 23 24 The all-encompassing powers of the LLDA are shown in its authority to pass, approve, or 25 disapprove all plans, programs, and projects proposed by all LGUs and public and private 26 corporations. It also has exclusive jurisdiction to issue permits and collect fees for the 27 use of the lake water. The LLDA has the authority to earmark revenues generated for its 28 own activities. 29 30 The LLDA exercises police powers. In case of violations of the laws, rules and regulations, 31 the violator can be held administratively, civilly and criminally liable. 32 In addition to the criminal liability, LLDA may pursue a separate civil action for damages 33 resulting from the violation of the law. As specifically provided by law, damages 34 recovered by this civil action shall be earmarked for environmental management. 35 36 LLDA’s mandate allows it to introduce a wide range of innovative policies. It was the first 37 agency in the Philippines to apply concepts of natural resource pricing in the form of 38 fishpen fees and, more recently, the imposition of wastewater discharge fees. The 39 experience of LLDA in resource pricing is setting the stage for a comprehensive national 40 implementation of a similar policy by the Department of Environment and Natural 41 Resources (DENR). LLDA’s venture into raw water pricing is set to establish another 42 policy precedent that could have wider national application. 43 44 A list of the numerous laws, rules and regulations on the protection of the lake 45 environment is presented in Table 2. 46 47
See Table 2 48 49 Improved track record and experienced workforce 50 51 About ten years ago and beyond, there was a persistent clamour for the abolition of the 52 LLDA due to the impression that it is doing nothing to combat pollution and to address 53 the conflicts among the different lake users. This is due to the very limited financial and 54 human resources of the Authority compared to the enormity of its mandate. Partly, this 55 could be attributed to the lack of an appropriate vehicle for information dissemination 56 and for reaching out to the different stakeholders. Improvement in the revenue of the 57

DRAFT: Not for Citation or Distribution Laguna de Bay
20
Authority, external funding assistance through grants from international donor agencies, 1 opportunities for further studies and training, and timely implementation of meaningful 2 programs enhanced the capability of the LLDA. Coupled with a more aggressive 3 information dissemination campaign, networking and linkage with different local and 4 international institutions, and successful implementation of projects with foreign funding, 5 the credibility of the LLDA improved. In spite of the fast turnover in the leadership of the 6 LLDA, it was able to sustain its program due the pool of experienced and well-trained 7 senior staffs and managers. 8 9 Cooperation of stakeholders 10 11 With the build up of trust on the Authority, there is better and wider stakeholder 12 participation in the plans and programs of the LLDA. A concrete example is the 13 involvement of citizens in reporting pollution violations either by telephone, letter or 14 personal visit to the office. Consultation meetings are well attended as compared in the 15 past. The LLDA has also built its capacity in public consultation and participation using 16 popular and widely adopted methods such as the Pair-Wise Comparison and Multi-Criteria 17 Analysis. 18 19 5. Lessons Learned, Recommended Initiatives and Actions Taken 20
21
“ Efforts of LLDA is an effort. But what is it achieving? 22 What’s being learned? LLDA must not only be a model 23 for the country, but for the lessons that can be 24 learned. ” 25
CODE-NGO, 2003 26
27
The existence of an Authority in the basin puts the Laguna de Bay in the best position in 28 terms of conservation and management compared to the other lakes in the Philippines 29 and perhaps, to some of the lakes within the Asian Region. Likewise, in terms of 30 accountability, be it on a positive or negative light, the public easily identifies the 31 Authority. In reality, the current state of Laguna de Bay is brought about by the actions 32 taken by the different stakeholders, including the Laguna Lake Development Authority. It 33 is within this context that the experiences and lessons learned in managing the Laguna 34 de Bay Basin are presented. 35
The LLDA has gradually exercised its mandate in the Laguna de Bay Region from 1969 to 36 the present and in the process has gradually evolved into a more responsive and less 37 reactive agency. The experiences of 35 years have definitely taught many lessons, but 38 for a more focused sharing of these gains, only the key experiences and lessons are 39 presented. 40
5.1. Legislated actions on environmental protection are time-tested support to 41 sustainable lake management. 42
One of the best things that happened to Laguna de Bay is the creation by the Philippine 43 Government of a management authority with specific mandate on the development and 44 environmental protection of the lake and the Laguna de Bay Region. Succeeding 45 amendments to the LLDA Charter (RA 4850) through Presidential Decree 813 and 46 Executive Order 927 further strengthened the mandate of LLDA in environmental 47 protection and regulation. In spite of these, the exclusive authority of the LLDA to issue 48 permits for the enjoyment of fishery privileges, specifically in the operation of fish cage 49
DRAFT: Not for Citation or Distribution Laguna de Bay
21
and fish pen was challenged in court by some fish pen operators and mayors of certain 1 lakeshore municipalities. They invoke the provisions of Republic Act 7160 or the Local 2 Government Code of 1991, which has granted the municipalities the exclusive authority 3 to grant fishery privileges to erect fish corrals, etc. within a definite zone of municipal 4 waters. The case reached up to the Supreme Court of the Philippines, which ruled in 5 favor of the Laguna Lake Development Au thority. A specific paragraph on the decision of 6 Justice Hermosisima Jr. on December 8, 1995, reflected his appreciation of the lake 7 environment, quoted as follows: 8 9
“Laguna de Bay therefore cannot be subjected to fragmented 10 concepts of management policies where lakeshore local 11 government units exercise exclusive dominion over specific 12 portions of the lake water. The garbage thrown or sewage 13 discharged into the lake, abstraction of water therefrom or 14 construction of fish pens by enclosing its certain area, affect not 15 only that specific portion but the entire 900 km2 of lakewater. The 16 implementation of a cohesive and integrated lake water resource 17 management policy, therefore, is necessary to conserve, protect 18 and sustainably developed Laguna de Bay.” 19
20 This phrase has become a famous quotation for advocating integrated resource 21 management and sustainable development and serves an inspiration for LLDA. 22 23 The LLDA was also able to assert its mandate on environmental regulation when it was 24 sued by a private firm for issuing to them a cease and decease order for violation of 25 LLDA’s rules and regulations. The court affirmed LLDA’s action as a “practical matter of 26 procedure under the circumstances of the case, and is a proper exercise of its power and 27 authority under its charter and its amendatory laws.” Again, this case further 28 strengthened the regulatory role of the LLDA in the region. 29 30
5.2. Politics in Lake Governance 31
The policy-making power of the LLDA is vested upon its Board of Directors. Of its ten 32 members, two (2) are ex-officio representatives from the National Economic and 33 Development Authority and the Department of Trade and Industry, four (4) are elective 34 officials, namely the Governors of the Rizal and Laguna Provinces, and the Presidents of 35 the Mayors’ League of Rizal and Laguna; four (4) are Presidential appointees such as the 36 General Manager of LLDA, the Chairman of the Metropolitan Manila Development 37 Authority, representative of the Office of the President, and the representative of Private 38 Investors. The latter is supposed to be chosen from among the private stockholders of 39 the LLDA, but most often is chosen by the President of the Philippines. Furthermore, the 40 Board Chairperson who should be elected from among the members of the Board, is 41 almost always designated by the Philippine President. Relevant sectors and lake users 42 have no direct representation in the Board. This indicates how politics could influence 43 policy decision-making process at the Board level. 44
To cite a specific example, the Office of the President issued Executive Order No. 75 on 45 March 4, 2002 to create a Board of Advisors for the LLDA consisting of three (3) fisher 46 folk representatives from the Laguna de Bay, supposedly to broaden the participation of 47 various resource users in the management of the lake. A proposal to amend this 48 executive issuance was submitted to the LLDA Board of Directors recognizing other 49 sectors, aside from fishery, whose concerns and interests should be represented in the 50 policy decision-making process. Unfortunately, the LLDA Board decided to defer 51 submission of the proposed amendment in deference to the President. 52

DRAFT: Not for Citation or Distribution Laguna de Bay
22
The frequent shifts in the top management of the LLDA have affected the implementation 1 of flagship programs. The General Manager of the LLDA is appointed by the President of 2 the Philippines, thus, he serves at the pleasure of the President. The processing of his 3 appointment and his tenure at the topmost post in the agency are subject to political 4 underpinnings. For the last 34 years, the LLDA has been managed by twelve (12) 5 General Managers or an average of three years for every appointee. 6
This frequent changes in the General Managership of the Authority, in addition to the 7 presence of political appointees in the LLDA Board who also sit at the pleasure of the 8 President, have resulted in shifting of policy and program directions, thus posing serious 9 implications to the sustainability of the development efforts in lake resources 10 management (Nepomuceno 1996). It is the desire of the LLDA workforce and most of 11 the stakeholders that the LLDA Manager be a career professional whose tenure is 12 dependent on performance. 13
A worthy initiative of the Department of Environment and Natural Resources is 14 advocating Good Environmental Governance. The program, which started this year, 15 requires key officials and middle managers of the different bureaus and agencies under 16 its supervision to undergo for two days a facilitated training workshop on Good 17 Environmental Governance. One of the components that are being stressed is 18 accountability to the people and to the environment. The commitments of all participants 19 are recorded for future monitoring. 20
21 5.3 Institutionalization of a Re-engineered LLDA is needed to respond to its 22 expanded mandate 23 24 The lost opportunities to re-organize on time has prompted the LLDA to be more 25 aggressive in the pursuit of its reorganization based on an institutional model which 26 builds on a fully integrated water resources management and development institution. 27 One of its strengths is the proposed wider representation and participation of the 28 stakeholders through the Technical Council and the Watershed Management Council. The 29 model was adopted by its Board of Directors on 25 January 2001 through Board 30 Resolution No. 157, Series of 2001. Representations were already made to the 31 Legislative Branch of the Philippine Government that resulted to the filing of House Bill 32 4252, a draft bill to strengthen the LLDA. No less than President Gloria Macapagal-Arroyo 33 has expressed support to the re-engineering of LLDA to make it more responsive in 34 carrying out its mandates, considering the impact of its operations on the lives of millions 35 of people living in its watershed. 36
Although it is still a long way to go, the LLDA has already been operating on the 37 principle of integrated watershed management. Adoption of a framework that is 38 focused on integrated water resources management has been imperative due to a 39 number of factors: strategic location and economic-environmental significance of Laguna 40 de Bay, multiple use of the lake water and watershed resources; and inefficiency of the 41 institutional arrangements. 42
5.4 Community Networking and Co-Management for Lake Watershed 43 Development 44
With a wide area of jurisdiction and with limited staff to carry out effectively its mandate, 45 the LLDA has long acknowledged that partnership is a key element in managing the 46 resources of the lake (Santos-Borja 2002). The formation of strategic alliance with the 47 Local government units, people’s organizations and non-government organizations is 48 needed to gain wide support in the implementation of its plans and programs and in the 49 implementation of its rules and regulations within the region. 50

DRAFT: Not for Citation or Distribution Laguna de Bay
23
The shifting of management orientation towards stakeholders as co-managers of the lake 1 water resources augurs well for value reorientation (common value and shared vision) 2 and sense of ownership, as a prerequisite to the desired lake ecosystem orientation 3 among stakeholders. Already the LLDA and Laguna de Bay are reaping the early fruits 4 from the shift in the lake management paradigm as indicated from the experience with 5 the River Rehabilitation and Protection Councils, the Fisheries and Aquatic Resource 6 Management Councils, and the tripartite partnership CLEAR among others. 7
5.5 Financing environmental protection and social development projects 8
The LLDA experience shows that there is no way that environmental improvement will 9 take place solely through soft approaches. The competing demands for scarce water 10 resources of the Lake and its river system will require a comprehensive infrastructure 11 development plan. It is the LLDA position that an infrastructure development plan should 12 ensure that the water quality of the Lake is enhanced and maintained at an optimal level 13 and the development needs are addressed in an equitable and economically efficient 14 manner. A concrete example is the problem on domestic wastes, particularly sewage. 15 Without infrastructure support such as the establishment of sanitary sewer facilities, 16 pollution from this source will not be abated and is likely to get serious due to the 17 increasing demand for water by a growing population. 18 19 Inherent in the LLDA charter is the developmental function for water resources 20 development purposes, but at present the LLDA is performing more of its regulatory 21 function that its planning and development roles. This overarching mandate of LLDA has 22 not been realized because of lack of capacity and appropriate mechanisms to enable the 23 Authority to initiate and involve the private sector in capitalintensive infrastructure 24 development projects in the region. Further, the financial flexibility of LLDA and other 25 government owned corporations, in terms of sourcing finances and utilization, has largely 26 been constrained by the Philippine Government’s multi-layered approval process for fund 27 solicitation. 28 29
It is clear that the regulatory function of the Authority should be segregated from 30 development activities to enable a more effective implementation of its intended 31 mandate. The LLDA will need to develop the capability to leverage and facilitate private 32 sector participation for augmenting large-scale water-related infrastructure projects. 33 Likewise, the LLDA has realized that building institutional capacities for undertaking 34 large-scale infrastructure project in the region requires that the regulatory and policy-35 making function of LLDA is balanced with a strong, but segregated, development 36 function. 37
38 A component of the Integrated Water Resources Management and Development 39
Model for the re-engineering of the LLDA is the provision of a special project trust fund 40 and an infrastructure financing facility, to wit: 41 42 • Environmental Trust Fund – consists of a certain percentage of the operating 43
revenue of the LLDA set up in trust exclusively for the support of LLDA to the 44 implementation of environmental management projects and activities at the sub-45 basin or LGU level and at other environmentally concerned research and academic 46 institutions and NGOs. 47
48 • Laguna de Bay Development Corporation (LBDC) – a facility to be established 49
for the purpose of planning, programming, financing and investing in environmental 50 and other infrastructure development projects. Although LBDC will be in charge of 51 the development investment of LLDA, the implementation and execution shall be 52 contracted out to the private sector. 53
54
DRAFT: Not for Citation or Distribution Laguna de Bay
24
Committed to continually espouse the sustainable development of the Laguna de Bay 1 basin, the LLDA developed the Laguna de Bay Institutional Strengthening and 2 Community Participation (LISCOP) Project. To be implemented over a five year 3 period, the project will be financed out of loan proceeds from the World Bank and an 4 equivalent grant from the Netherlands Government. With the proposed initiative, the 5 LLDA hopes to be able to fully optimize the level of interaction of the environmental, 6 economic, and institutional dimensions of resource use and management, through a 7 combination the following strategic interventions, which also form the integral 8 components of the LISCOP. These are a) co-managed investments for watershed 9 development (component 1); and b) strengthening institutions and instruments 10 (component 2). 11 12 Specifically, under the LISCOP, the LLDA will be restructured and strengthened to 13 establish it as an effective watershed management agency in planning, regulatory 14 actions, and enforcement as well as facilitating investments in environmental 15 infrastructure. Regulatory incentives will be improved and combined with strengthening 16 the capacity of watershed users. River Councils and communities will be engaged in 17 implementing interventions through a fund that provides financing to supporting small-18 scale investments for improving watershed environmental quality. A full scale follow-on 19 investment project is also planned. This would seek to improve the environmental quality 20 of the Laguna de Bay watershed to enable the sustainable and equitable use of resources 21 to different users. The end-goal is to secure sustainability in effective basin water 22 resources management, institutional building, and poverty alleviation in the area. 23 The project has already passed the due diligence requirement of the Philippine 24 Government is now waiting approval from the Executive Branch. 25 26 Parallel with the LISCOP Project is the development of a proposal for GEF funding 27 through the World Bank for project implementation (PDF Block A) of the “Integrated 28 Ecosystems Management of the Laguna de Bay Region”. 29
The general objective of the proposed project is to sustainably manage the Laguna de 30 Bay Region for the continuous promotion of its ecological, economic and social functions 31 and services. The project’s specific aims are: 32 33
i) To integrate the management and development of the Laguna de Bay and Mt. 34 Makiling watersheds including appropriate policies and regulations with active 35 community participation: 36
ii) To conserve and sustainably use the species and genetic diversity of the 37 region; 38
iii) To strengthen the institutional capability and enhance participation of various 39 stakeholders to ensure environmental health, social empowerment and 40 economic productivity; 41
iv) To improve water quality through limiting pollution from domestic, industrial, 42 and agricultural sources; 43
v) To improve air quality within the region by limiting carbon emission from the 44 use of fossil fuel in power generation; and 45
vi) To establish mitigating measures to control or reduce land degradation and 46 lake siltation. 47
48 5.6. Integrated and demand-driven monitoring and research 49
After the Water Resources Study and the Comprehensive Water Quality Management 50 Program (1971-1978), the monitoring of the lake and the tributary rivers became a 51 routine activity. Data piled up and the comprehensive assessment of the water quality 52 water was set aside. No additional parameters were added and the sampling stations 53 remain the same in spite of the fast-paced development in the watershed. This was the 54 basis for the criticism that the LLDA only focus on the lake and not on the entire basin. 55
DRAFT: Not for Citation or Distribution Laguna de Bay
25
Fishpens and fish cages proliferated in the lake and became a very important source of 1 revenue for the LLDA through the collection of fishpen fee. Unfortunately, there was no 2 monitoring program developed to assess its impact on the lake’s ecology and water 3 quality, and on the economy in the region. Thus, when the first zoning and management 4 plan was prepared, there was very little quantitative information to assess the impacts. 5 In this case, the precautionary principle was applied. 6
One of the limitations for pursuing a more demand-driven monitoring program and 7 research in the lake is the lack of additional funds and personnel to pursue this activity. 8 Although the LLDA has a pool of trained personnel, the enormity of the task to monitor 9 the lake and the major tributaries and at the same time do the water quality analyses, 10 including those coming from industrial effluents and outside clients, have given them less 11 time to do a comprehensive assessment of the state of the lake. 12
To address this concern, research collaboration with international and local academic and 13 research institutions. The LLDA has also started to assume its role as a “clearing house” 14 for research in the lake to avoid duplication and to market the research needs of the 15 authority. 16
With the credibility that the LLDA has established through the years, local research 17 institutions have taken cognizance of the capability of the LLDA. At present it is an active 18 partner of the University of the Philippines-Environmental Forestry Program in the 19 implementation of the Philippine Millennium Ecosystem Sub-Global Assessment with 20 focus on the Laguna de Bay ecosystem. 21
22
5.7 Developing and Sharing Knowledge 23
The LLDA has produced a “gold mine” of data on Laguna de Bay since 1973. After the 24 comprehensive water quality assessment report of 1974 and 1978, the water quality of 25 the lake and the tributary rivers was reported on a monthly, quarterly and annual basis 26 with very little efforts on assessment that would guide management on planning and 27 decision-making. Likewise, most of these reports are only for office use. As more 28 students and researchers became interested in the lake, the demand for water quality 29 data also increased. In 1986, the LLDA started its publication of the annual water quality 30 of the lake and the tributary rivers. A few years after, the publication improved through 31 the addition of more parameters and a written report per parameter. The assessment of 32 water quality is always based on compliance with the National Criteria (DENR-DAO 34) 33 for Class C water (suited for fishery). A comprehensive ecological assessment of the lake 34 has not yet been published by the LLDA. 35
Through the Sustainable Development of the Laguna de Bay Environment Project, funded 36 by the Royal Netherlands Government, from year 2000-2003, the “mined” data was 37 extracted and transformed into different sets of information that were used in the 38 development of a Decision Support System for Laguna de Bay. Training of personnel in 39 hydrology, ecological and water quality modeling and GIS was vigorously pursued with 40 the vision of making LLDA a credible center of information on the lake. One of the 41 outcomes of this project is the presentation of water quality data into a simple schematic 42 diagram that can be easily understood by non-technical people. It was inspired by the 43 work of a famous Dutch painter, Piet Mondriaan whose simple lines and colors were 44 adopted to present technical information to an easily understandable format. By looking 45 at colors, people would know the current state of the lake and the tributary rivers. The 46 Water Mondriann as it is now called is posted in the LLDA website (Figure 7). This has 47 somehow addressed the criticism thrown at LLDA by the fish operators in the lake, which 48 is the lack of advice on the condition of the lake that could help them in making crucial 49
DRAFT: Not for Citation or Distribution Laguna de Bay
26
decisions in operating their business. A more aggressive approach in disseminating water 1 quality information like publication in newspapers or through leaflets is needed. 2
See Figure 7 3
5.8 Lessons learned from program implementation 4
The Environmental user fee system (EUFS) 5
The LLDA’s experience in the implementation of the EUFS taught two important 6 lessons: (i) start simple and build experience; and (ii) the battle cry should be “READY, 7 FIRE, AIM” rather than “READY, AIM, FIRE” (Nepomuceno, 2001). Thus, it is better 8 to start simple, just fine tune as experience builds up. 9
10 The right way forward for pollution charges/ user fees that eme rged are: 11
12 • Simple, modest approach; 13 • Sector-based pilot run to help in understanding feasibility aspects, 14
administrative convenience, institutional arrangements, acceptability by all 15 stakeholders; 16
• Pick one to two controllable parameters; 17 • Revise charges based on results of monitoring; 18 • Strong and credible regulatory arm with multi-stakeholder orientation; 19 • Pollution charges at all levels from zero discharge and increasing above the 20
effluent standards. 21 22 The Environmental User Fee System has created a strong incentive for regulated firms to 23 reduce the BOD concentration of wastewater discharged into the lake. Unfortunately, it 24 has also created an incentive for firms to dilute their discharges. This is a potential 25 weakness of the system, and it suggests the importance of properly pricing input water 26 to avoid perverse responses to EUFS. 27
Since the EUFS is implemented to complement the existing command and control 28 approach for pollution control and abatement, administering the system vis-a-vis the 29 existing regulatory system was administratively complex and difficult to enforce. In 30 response to this concern, the LLDA had to introduce policy refinements and clarifications 31 into the existing rules and regulations to ensure effective implementation of the System 32 and enforcement of existing policies and regulations. 33 34 It is the policy position of LLDA that Market Based Instruments (MBIs) should not replace 35 traditional regulatory systems. Rather, they are to be used as complementary tools for 36 promoting efficient use of resources. To leverage its unique experience in MBIs, the 37 strategy is for LLDA is to expand the Environmental User Fee System (EUFS) using four 38 strategies: 39 40
• Revising the existing formula for industrial EUFS by introducing other parameters 41 in addition to Biochemical Oxygen Demand (BOD) 42
43 • Exploring arrangements to include the households in the coverage of the EUFS 44
45 • Exploring the opportunities for introducing EUFS for raw water extracted from the 46
Lake 47 48
• Public Disclosure Program 49 50
Drawing on international and local experiences, a public disclosure program will be in 51 place to create incentives for pollution control and improve the environmental 52
DRAFT: Not for Citation or Distribution Laguna de Bay
27
performance of industrial polluters. This program is aimed to introduce the concept of 1 public disclosure to LGUs and include them in a program of monitoring and disclosure of 2 environmental performance that will encourage them to invest in improving their 3 environmental management performance. 4 5
Shoreland Management 6
In spite of LLDA’s assertiveness in the field of regulation, it was not able to exercise on 7 time its critical mandate on the 140 km2 shoreland area. The thirty years gap from the 8 enactment of the LLDA charter to the time that the LLDA was able to take action on the 9 shoreland had become a window of opportunity for people to claim the shore land for 10 socio-economic benefits. By the time that the necessary action took off the ground, the 11 LLDA was and is still is, faced with the following problems: reclamation of shoreland 12 areas, construction of illegal structures, dumping of solid wastes and spoils from 13 construction work. Informal settlers have also found it convenient to settle in the shore 14 land where all their wastes can be conveniently thrown into the lake. This is where the 15 big problem lies since it would be very difficult to uproot the informal settlers. 16
The delayed action also made it difficult for people, specially the Local Government Units 17 to understand why that part of the lake within their municipality which remains dry at 18 certain times of the year are not under their jurisdiction. In spite of the dissemination of 19 the Laguna de Bay Shoreland Policy, LGUs still continue giving permits for the use of the 20 shoreland, which by law, is the sole responsibility of the LLDA. 21
A very critical but sensitive issue is the interpre tation of other agencies of government on 22 what is the shoreland. By law, the shore land is a public land. However, other agencies 23 of the government in charge of land management, surveys and land titling classify these 24 areas along the shore land as alienable and disposable lands in spite of the fact that 25 DENR Administrative Order No. 97-95 Series of 1995 has been approved to prevent such 26 situation from happening. This requires action and political will by the top executives of 27 the agencies involved. 28 29 In 1999, the LLDA Board allowed the qualified individuals or peoples association to lease 30 a portion of the shoreland areas pursuant to the allowable use as long as the area is still 31 untitled and not covered by any government development plans, programs and projects. 32 33 The LLDA’s shoreland regulation is a very glaring example of a case wherein development 34 projects/activities have overtaken regulation and control. A lot of people, including the 35 Local Government Units have already put their stake in these areas. After the 36 delineation of the shore land areas and the inventory of its status, there is a need to 37 review the policy on the use of the shoreland and revise the existing rules, not in a way 38 to adopt the existing situation but more so, to adapt the rules without compromising the 39 objective of protecting the shoreland and the lake from further deterioration. 40 41 The Fishpen Controversy 42 43 The conflicts brought about by the use of the lake for aquaculture has taught the LLDA 44 many lessons in policy-making and program implementation. The ensuing discussion is 45 based on the analysis presented in Pacardo et al. (1988). 46 47 The introduction of fishpen technology in the lake is an illustration of ill-conceived policy-48 making and implementation common to many public agencies. This type of aquaculture 49 operation was introduced in the lake in the early seventies with a very noble aim of 50 improving the lives of fishermen. Eventually, it ended up in the hands of businessmen 51 because of the failure to quickly implement the necessary financial assistance program to 52
DRAFT: Not for Citation or Distribution Laguna de Bay
28
enable the fishermen to construct the fishpen enclosures. The LLDA failed to set policies 1 to protect the scheme and the lake from speculators. 2 3 The benefits from the industry proved very impressive and have gained the approval of 4 politicians, businessmen, and even the Authority itself. Aside from the steady supply of 5 fish in the region, it provided a source of revenue for the Authority through the collection 6 of fishpen fees. While the policies have been drawn, the policy-makers remained 7 confident and unsuspecting of what was actually happening in the fishpens. They 8 underestimated the complexity and difficulty of coordinating the tasks involved in 9 implementing the program. Illegal operation and expansion of fishpens were not 10 controlled to the detriment of marginal fishermen who rely on open water fishing. In 11 1983, the conflict was already in a critical situation that led to loss of lives and 12 properties. The fishpen controversy raised two essential issues in resource management: 13 (1)the level of “efficiency” in developing and using the resources of the lake; and (2) the 14 issue of “equity” among those who receive the benefit and those who pay for the 15 consequences of environmental actions (Craine 1971). The proliferation of fishpens also 16 took its toll on the lake. Fish production in the lake was negatively affected and fish 17 harvest declined. The livelihood of marginal fishermen was severely affected. 18 19 The fishpen controversy caught national attention that led the President of the Philippines 20 to issue instructions to demolish illegal fishpens and rationalize the use of the lake. In 21 1983 the first Zoning and Management Plan of Laguna de Bay was formulated but the 22 implementation failed due to non-cooperation of the fishpen operators and the 23 intervention of the local officials. In 1996, the ZOMAP was revised and a more organized 24 implementation scheme was developed. Unlike in the previous plan where fishpens can 25 be constructed anywhere within the fishpen belt, a definite area with specified size is 26 allotted to prevent expansion (Santos-Borja 1997). The strong political will of the General 27 Manager and the implementing unit were instrumental in the successful implementation 28 of the revised ZOMAP. To augment the manpower needed to monitor the lake, the LLDA 29 organized fishermen group and deputized them as wardens. Later the Fisheries and 30 Aquatic Resource Management Councils were formed and became one of the partners of 31 the LLDA in resource management. To sustain their efforts, minimal allowance is given to 32 the President of the FARMC. A one-hectare area in the fishcage belt in each of the 33 lakeshore municipality is also allotted to the municipal FARMCs to generate income which 34 they can use to sustain their activities in the lake. However, this privilege is not yet fully 35 explored by the FARMC pending the finalization of the implementing guidelines by the 36 Authority. The task of maintaining the area for aquaculture is always challenged by the 37 request of prospective fishpen owners to increase the area for operation so that they can 38 be given the chance to do business in the lake. The vigilance of fishermen and the 39 fishpen operators themselves is something that needs to be encouraged for in the long 40 run, they stand to lose if the capacity of the lake to sustain fisheries is surpassed. 41 42 One of the areas where the LLDA is unsuccessful is in the control of illegal fishing. The 43 task is enormous considering the size of the lake and the manpower required. Assistance 44 of the LGUs through the maritime police, the FARMC and the Fish Wardens are essential 45 but the activity could not be sustained due to lack of financial support. One of the 46 recurring complaints is the intervention of local officials whenever there is apprehension 47 of illegal fishermen, especially if he happens to be a constituent. Due to lack of 48 alternative source of livelihood and the responsibility to earn a living for the family make 49 it difficult to convince the fishermen of the negative consequences of their illegal practice. 50 A cosmetic approach being adopted by the local officials and the LLDA is seeding the lake 51 with fingerlings. An effective mechanism and institutional arrangement to address this 52 problem is yet to developed. The necessary behavioral change is still to take its roots. 53 54 The shares in the fishpen fee of the LGUs are not dole outs but are supposed to support 55 environmental projects. Attempts were made to monitor its utilization, but most LGUs do 56
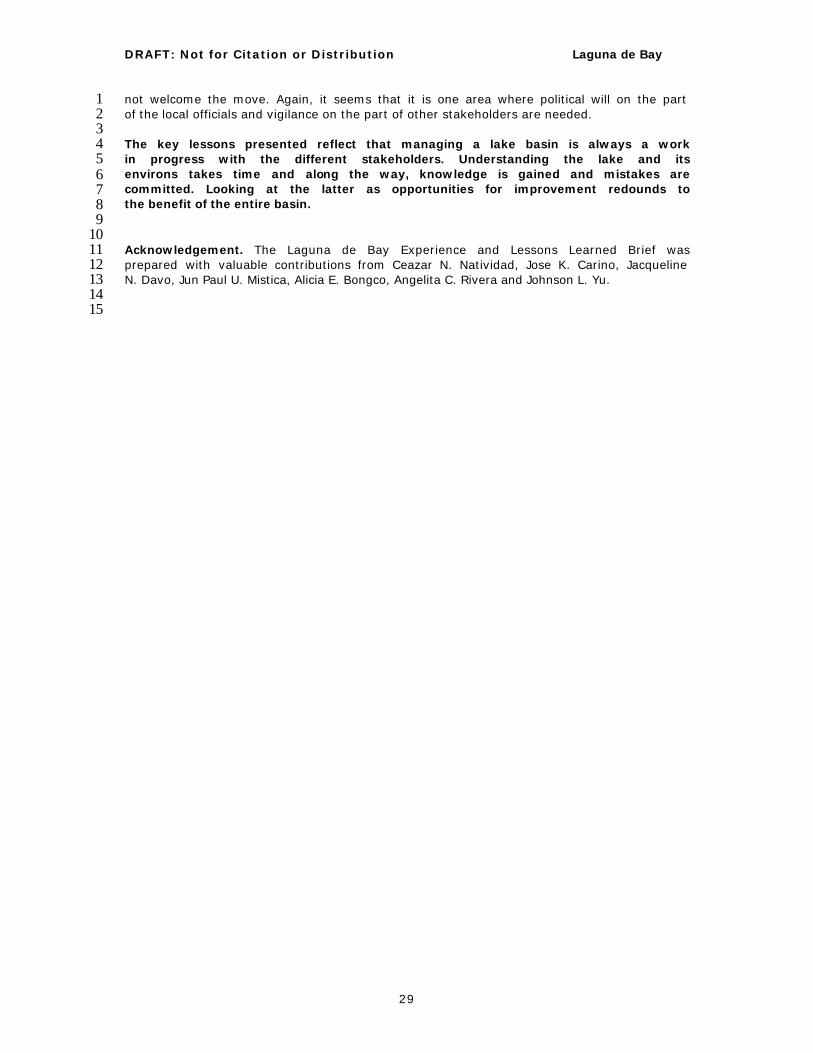
DRAFT: Not for Citation or Distribution Laguna de Bay
29
not welcome the move. Again, it seems that it is one area where political will on the part 1 of the local officials and vigilance on the part of other stakeholders are needed. 2 3 The key lessons presented reflect that managing a lake basin is always a work 4 in progress with the different stakeholders. Understanding the lake and its 5 environs takes time and along the way, knowledge is gained and mistakes are 6 committed. Looking at the latter as opportunities for improvement redounds to 7 the benefit of the entire basin. 8 9 10 Acknowledgement. The Laguna de Bay Experience and Lessons Learned Brief was 11 prepared with valuable contributions from Ceazar N. Natividad, Jose K. Carino, Jacqueline 12 N. Davo, Jun Paul U. Mistica, Alicia E. Bongco, Angelita C. Rivera and Johnson L. Yu. 13 14
15

DRAFT: Not for Citation or Distribution Laguna de Bay
30
Figure 1. Watershed Land Use
5%
52%29%
14%
Forested Areas 19,100 has
Open Areas 59, 480 has.
Built-up/Industrial Areas 110,780 has.
Agricultural Areas 198, 640 has.
Figure 1. Watershed Land Use
5%
52%29%
14%
Forested Areas 19,100 has
Open Areas 59, 480 has.
Built-up/Industrial Areas 110,780 has.
Agricultural Areas 198, 640 has.
1 2
3

DRAFT: Not for Citation or Distribution Laguna de Bay
31
1
2 3

DRAFT: Not for Citation or Distribution Laguna de Bay
32
1
0.00
1.00
2.00
3.00
4.00
5.00
6.00
7.00
8.00
1990 1991 1992 1993 1994 1995 1996 1997 1998 1999 2000
Figure 3A: Biochemical oxygen demand in Laguna de Bay.
BO
D (
mg/
L)
West Bay
Central Bay
East Bay
max limit
2 3
0
200
400
600
800
1000
1200
1400
1990 1991 1992 1993 1994 1995 1996 1997 1998 1999 2000
Figure 3B: Chloride concentration in Laguna de Bay.
Cl- (
mg/
L)
West Bay
Central Bay
East Bay
max limit
4 5
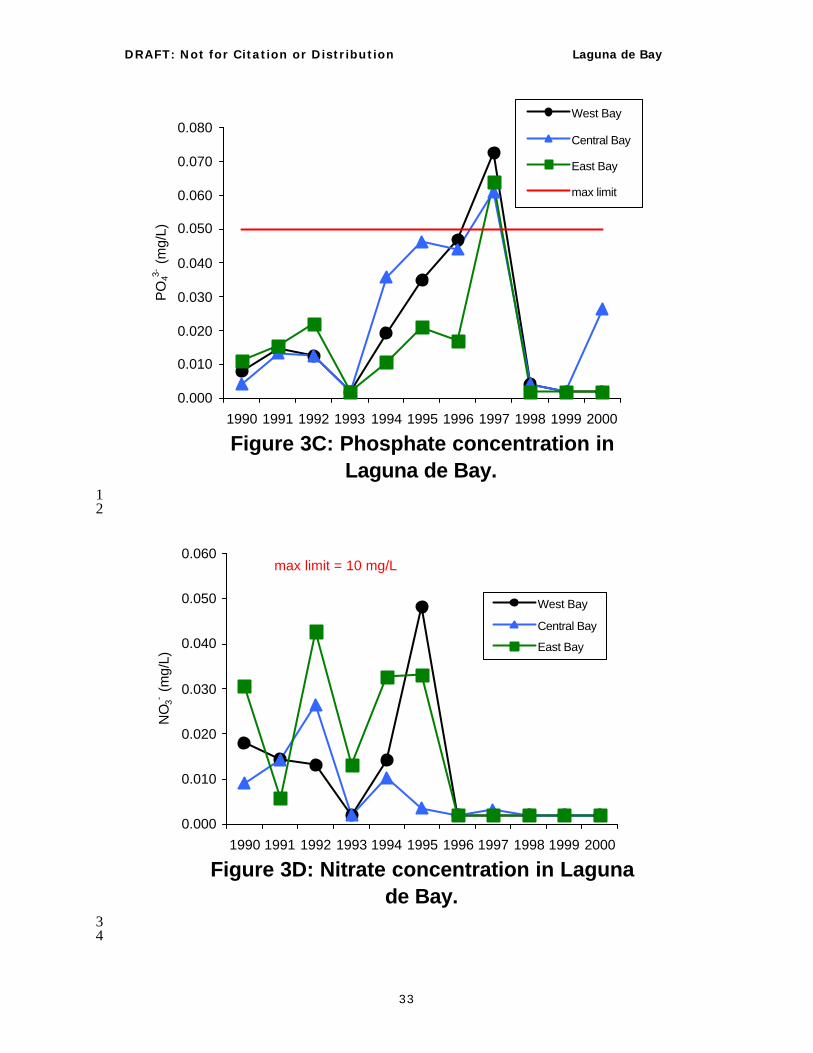
DRAFT: Not for Citation or Distribution Laguna de Bay
33
0.000
0.010
0.020
0.030
0.040
0.050
0.060
0.070
0.080
1990 1991 1992 1993 1994 1995 1996 1997 1998 1999 2000
Figure 3C: Phosphate concentration in Laguna de Bay.
PO
43- (
mg/
L)
West Bay
Central Bay
East Bay
max limit
1 2
0.000
0.010
0.020
0.030
0.040
0.050
0.060
1990 1991 1992 1993 1994 1995 1996 1997 1998 1999 2000
Figure 3D: Nitrate concentration in Laguna de Bay.
NO
3- (m
g/L)
West Bay
Central Bay
East Bay
max limit = 10 mg/L
3 4
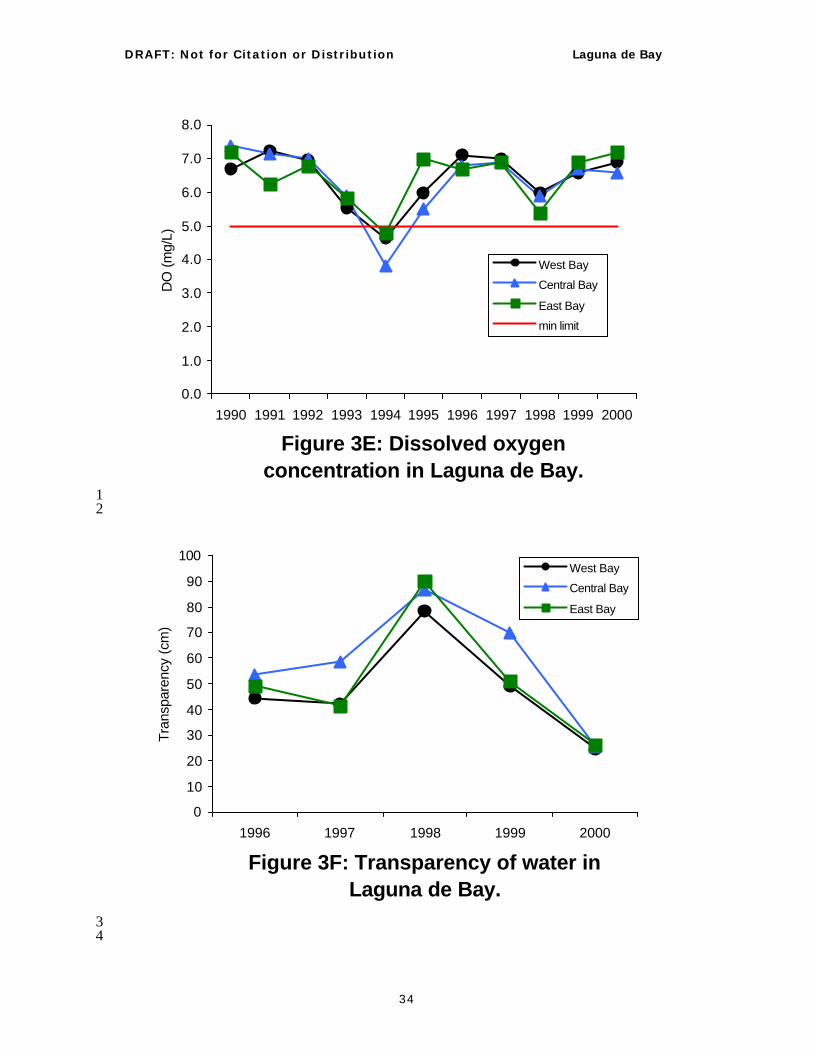
DRAFT: Not for Citation or Distribution Laguna de Bay
34
0.0
1.0
2.0
3.0
4.0
5.0
6.0
7.0
8.0
1990 1991 1992 1993 1994 1995 1996 1997 1998 1999 2000
Figure 3E: Dissolved oxygen concentration in Laguna de Bay.
DO
(m
g/L)
West Bay
Central Bay
East Bay
min limit
1 2
0
10
20
30
40
50
60
70
80
90
100
1996 1997 1998 1999 2000
Figure 3F: Transparency of water in Laguna de Bay.
Tra
nspa
renc
y (c
m)
West Bay
Central Bay
East Bay
3 4

DRAFT: Not for Citation or Distribution Laguna de Bay
35
1
2 3 Figure 4. The Zoning Plan for Fisheries in Laguna de Bay (LLDA) 4
5
DRAFT: Not for Citation or Distribution Laguna de Bay
36
1
2 3 Figure 5. Sharing scheme for fish pen and fish cage fees (Santos-Borja 2002) 4 5
6
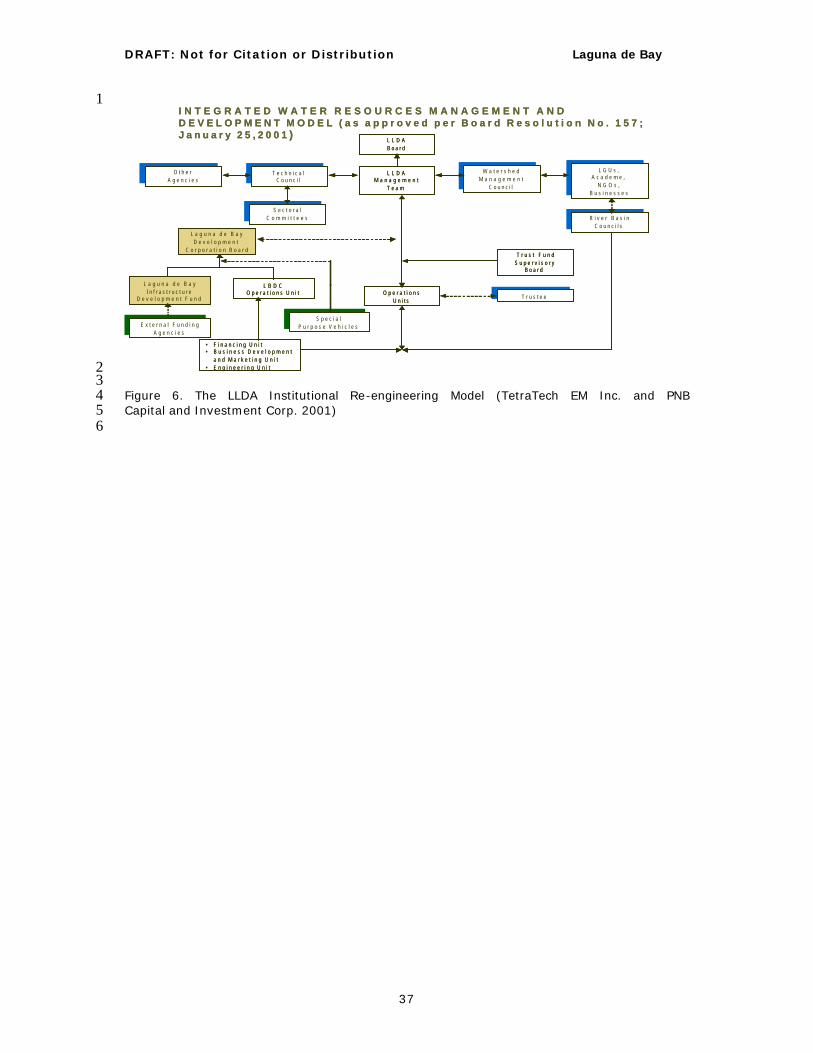
DRAFT: Not for Citation or Distribution Laguna de Bay
37
1 I N T E G R A T E D W A T E R R E S O U R C E S M A N A G E M E N T A N D D E V E L O P M E N T M O D E L ( a s a p p r o v e d p e r B o a r d R e s o l u t i o n N o . 1 5 7 ; J a n u a r y 2 5 , 2 0 0 1 )
L L D A B o a r d
L L D A M a n a g e m e n t
T e a m
T e c h n i c a l C o u n c i lT e c h n i c a l
C o u n c i l
O t h e r A g e n c i e s
O t h e r A g e n c i e s
W a t e r s h e d M a n a g e m e n t
C o u n c i l
W a t e r s h e d M a n a g e m e n t
C o u n c i l
L G U s , A c a d e m e ,
N G O s , B u s i n e s s e s
L G U s , A c a d e m e ,
N G O s , B u s i n e s s e s
R i v e r B a s i n C o u n c i l sR i v e r B a s i n
C o u n c i l s
S e c t o r a l C o m m i t t e e s
S e c t o r a l C o m m i t t e e s
L a g u n a d e B a y D e v e l o p m e n t
C o r p o r a t i o n B o a r dT r u s t F u n d
S u p e r v i s o r y B o a r d
T r u s t e eT r u s t e e
O p e r a t i o n s U n i t s
L a g u n a d e B a y I n f r a s t r u c t u r e
D e v e l o p m e n t F u n d
L B D C O p e r a t i o n s U n i t
E x t e r n a l F u n d i n g A g e n c i e s
E x t e r n a l F u n d i n g A g e n c i e s
S p e c i a l P u r p o s e V e h i c l e s
S p e c i a l P u r p o s e V e h i c l e s
• F i n a n c i n g U n i t• B u s i n e s s D e v e l o p m e n t
a n d M a r k e t i n g U n i t• E n g i n e e r i n g U n i t
I N T E G R A T E D W A T E R R E S O U R C E S M A N A G E M E N T A N D D E V E L O P M E N T M O D E L ( a s a p p r o v e d p e r B o a r d R e s o l u t i o n N o . 1 5 7 ; J a n u a r y 2 5 , 2 0 0 1 )
L L D A B o a r d
L L D A M a n a g e m e n t
T e a m
T e c h n i c a l C o u n c i lT e c h n i c a l
C o u n c i l
O t h e r A g e n c i e s
O t h e r A g e n c i e s
W a t e r s h e d M a n a g e m e n t
C o u n c i l
W a t e r s h e d M a n a g e m e n t
C o u n c i l
L G U s , A c a d e m e ,
N G O s , B u s i n e s s e s
L G U s , A c a d e m e ,
N G O s , B u s i n e s s e s
R i v e r B a s i n C o u n c i l sR i v e r B a s i n
C o u n c i l s
S e c t o r a l C o m m i t t e e s
S e c t o r a l C o m m i t t e e s
L a g u n a d e B a y D e v e l o p m e n t
C o r p o r a t i o n B o a r dT r u s t F u n d
S u p e r v i s o r y B o a r d
T r u s t e eT r u s t e e
O p e r a t i o n s U n i t s
L a g u n a d e B a y I n f r a s t r u c t u r e
D e v e l o p m e n t F u n d
L B D C O p e r a t i o n s U n i t
E x t e r n a l F u n d i n g A g e n c i e s
E x t e r n a l F u n d i n g A g e n c i e s
S p e c i a l P u r p o s e V e h i c l e s
S p e c i a l P u r p o s e V e h i c l e s
• F i n a n c i n g U n i t• B u s i n e s s D e v e l o p m e n t
a n d M a r k e t i n g U n i t• E n g i n e e r i n g U n i t 2
3 Figure 6. The LLDA Institutional Re-engineering Model (TetraTech EM Inc. and PNB 4 Capital and Investment Corp. 2001) 5
6
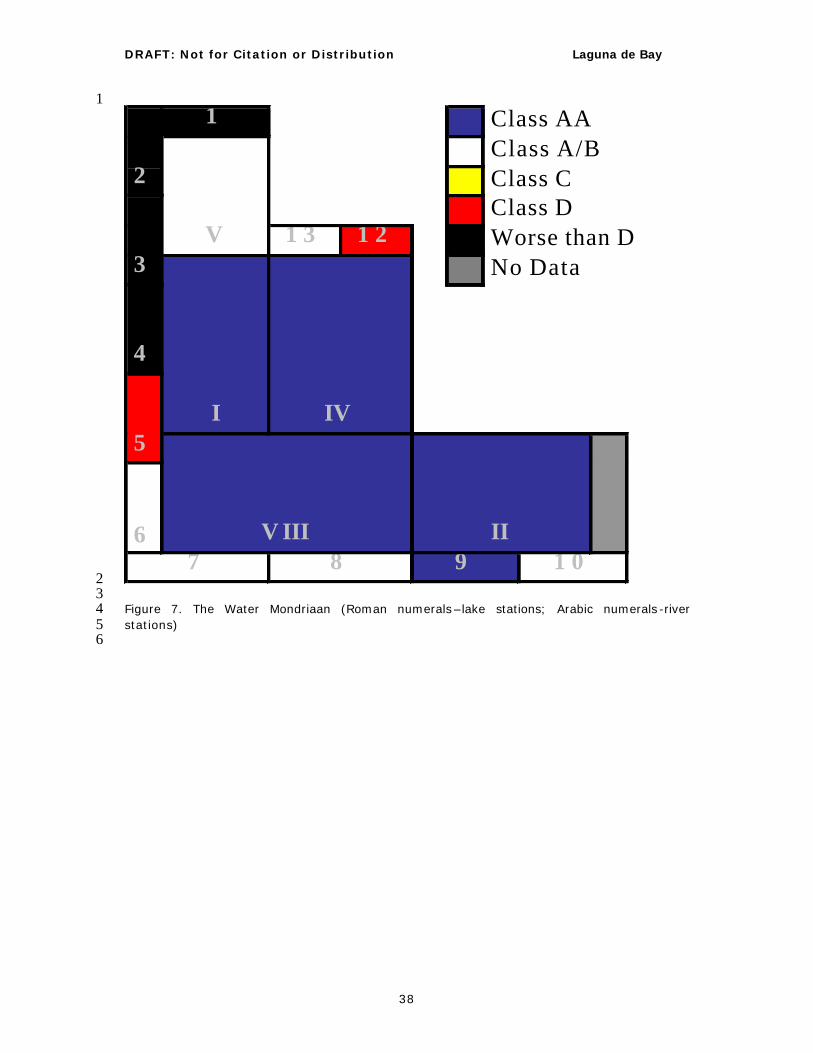
DRAFT: Not for Citation or Distribution Laguna de Bay
38
1
Class AAClass A/BClass CClass DWorse than DNo Data3
4
2
1
V III67
I
9II
1 0
1 3
8
V 1 2
IV5
2 3 Figure 7. The Water Mondriaan (Roman numerals–lake stations; Arabic numerals -river 4 stations) 5
6
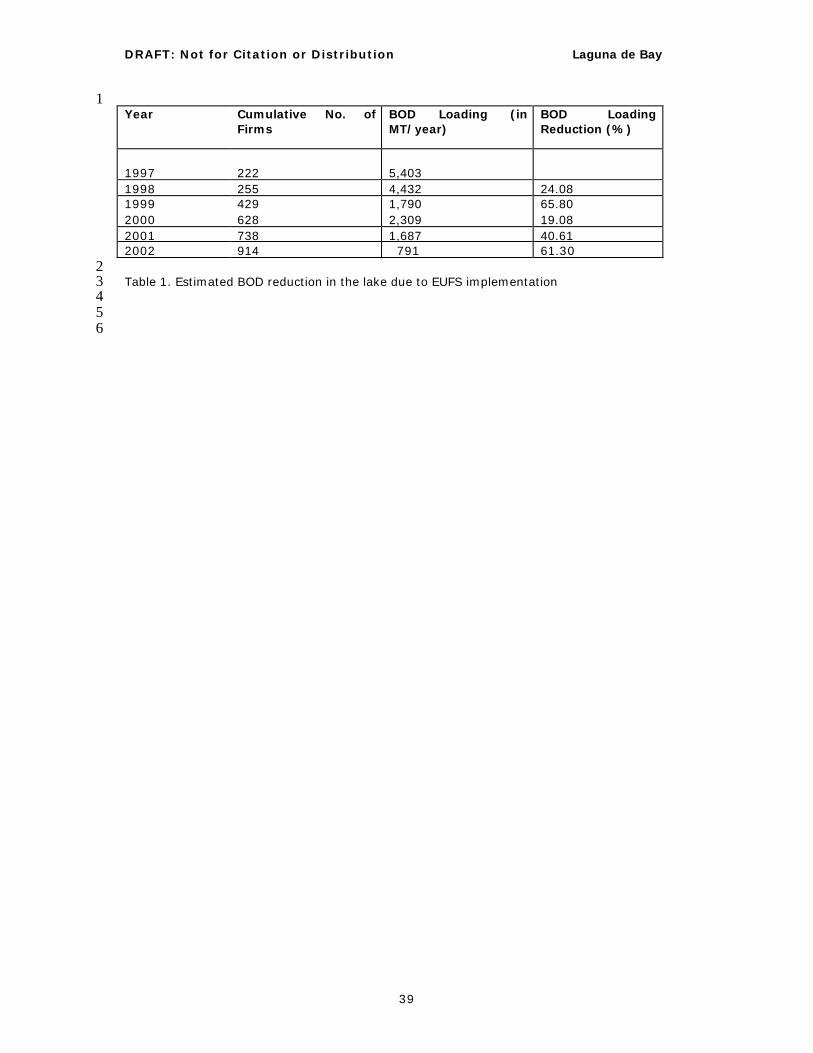
DRAFT: Not for Citation or Distribution Laguna de Bay
39
1 Year Cumulative No. of
Firms BOD Loading (in MT/year)
BOD Loading Reduction (%)
1997
222
5,403
1998 255 4,432 24.08 1999 429 1,790 65.80 2000 628 2,309 19.08 2001 738 1,687 40.61 2002 914 791 61.30 2 Table 1. Estimated BOD reduction in the lake due to EUFS implementation 3 4 5
6
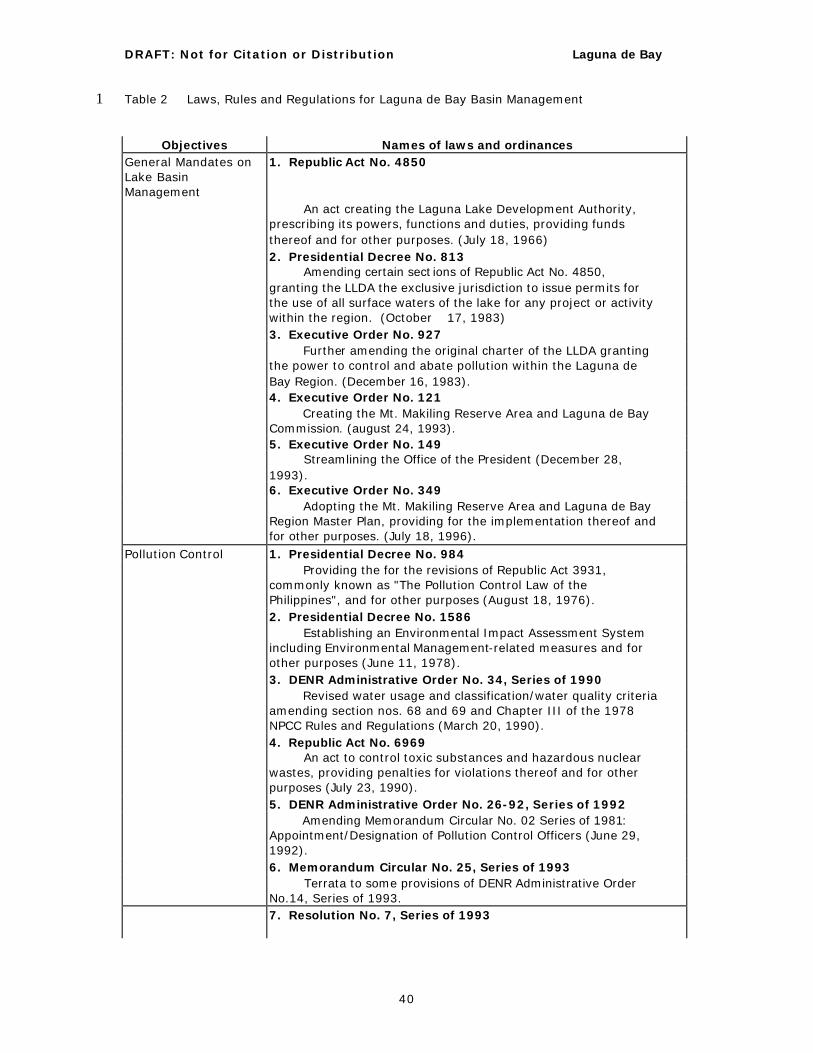
DRAFT: Not for Citation or Distribution Laguna de Bay
40
Table 2 Laws, Rules and Regulations for Laguna de Bay Basin Management 1
Objectives Names of laws and ordinances
General Mandates on Lake Basin Management
1. Republic Act No. 4850
An act creating the Laguna Lake Development Authority, prescribing its powers, functions and duties, providing funds thereof and for other purposes. (July 18, 1966)
2. Presidential Decree No. 813 Amending certain sect ions of Republic Act No. 4850,
granting the LLDA the exclusive jurisdiction to issue permits for the use of all surface waters of the lake for any project or activity within the region. (October 17, 1983)
3. Executive Order No. 927 Further amending the original charter of the LLDA granting
the power to control and abate pollution within the Laguna de Bay Region. (December 16, 1983).
4. Executive Order No. 121 Creating the Mt. Makiling Reserve Area and Laguna de Bay
Commission. (august 24, 1993). 5. Executive Order No. 149 Streamlining the Office of the President (December 28,
1993). 6. Executive Order No. 349 Adopting the Mt. Makiling Reserve Area and Laguna de Bay
Region Master Plan, providing for the implementation thereof and for other purposes. (July 18, 1996).
Pollution Control 1. Presidential Decree No. 984 Providing the for the revisions of Republic Act 3931,
commonly known as "The Pollution Control Law of the Philippines", and for other purposes (August 18, 1976).
2. Presidential Decree No. 1586 Establishing an Environmental Impact Assessment System
including Environmental Management-related measures and for other purposes (June 11, 1978).
3. DENR Administrative Order No. 34, Series of 1990 Revised water usage and classification/water quality criteria
amending section nos. 68 and 69 and Chapter III of the 1978 NPCC Rules and Regulations (March 20, 1990).
4. Republic Act No. 6969 An act to control toxic substances and hazardous nuclear
wastes, providing penalties for violations thereof and for other purposes (July 23, 1990).
5. DENR Administrative Order No. 26-92, Series of 1992 Amending Memorandum Circular No. 02 Series of 1981:
Appointment/Designation of Pollution Control Officers (June 29, 1992).
6. Memorandum Circular No. 25, Series of 1993 Terrata to some provisions of DENR Administrative Order
No.14, Series of 1993. 7. Resolution No. 7, Series of 1993

DRAFT: Not for Citation or Distribution Laguna de Bay
41
Approving new schedule of processing fees for environmental permit/clearance (November 4, 1993).
8. DENR Administrative Order No. 35-91, Series of 1993 Revised effluent regulations of 1990 revising and amending
the effluent regulations of 1982 (December 9, 1993). 9. DENR Administrative Order No. 14A-93, Series of 1993
Amendment to Administrative order No. 14 Series of 1993 and clarifying its coverage and scope. (December 9, 1993).
10. Resolution No. 24, Series of 1996 Adoption of Department Administrative Order (DAO) no.30,
section 3, paragraph 3.3 (C) of the Department of Environment and Natural Resources (DENR) as part of the policy of the Laguna Lake Development Authority (LLDA) (September 26, 1996).
11. Resolution No. 25, Series of 1996 Implementation of the Environmental User Fee System in
the Laguna de Bay Region and approval of its work and financial plan for CY1997. (November 19, 1996).
12. Resolution No. 33, Series of 1996 Approving the rules and regulations implementing the
Environmental User Fee System in the Laguna de Bay Region (December 19, 1996).
13. Resolution No. 41, Series of 1997 Adoption of the definition of development activities per DENR
Administrative Order No. 96-37 and integration of said definition in the LLDA rules and regulations thereby clarifying further the development activities required to secure LLDA clearance.
(March 21, 1997). 14. Resolution No. 42, Series of 1997 Approving the administrative fines for violations of LLDA
Rules and Regulations (March 21, 1997). 15. Memorandum Circular No. 2, Series of 1997 Inspection and investigation of establishments compliance
to environmental quality standards and pollution control rules and regulations (May 2, 1997).
16. Resolution No. 64, Series of 1997
Prescribing new schedule of processing fees and other fees for environmental permits/clearances within the Laguna de Bay Region. (December 23, 1997).
17. Memorandum Circular No. 98-8 Ensuring safe navigation in specified lake areas (December
10, 1998). 18. Resolution No. 104, Series of 1999 Adoption of Department Administrative Order No. 51,
Series of 1998, pertaining to the Industrial Ecowatch System and its implementing guidelines, of the Department of Environment and Natural Resources (DENR) as part of the policy of the
Laguna Lake Development Authority (LLDA) (March 25, 1999). 19. Memorandum Circular No. 99-02
Amendment of certain provisions of Memorandum Order No. 97-84, Series of 1997, concerning the simplified requirements for Accrediting Pollution Control Officers (March 29, 1999).
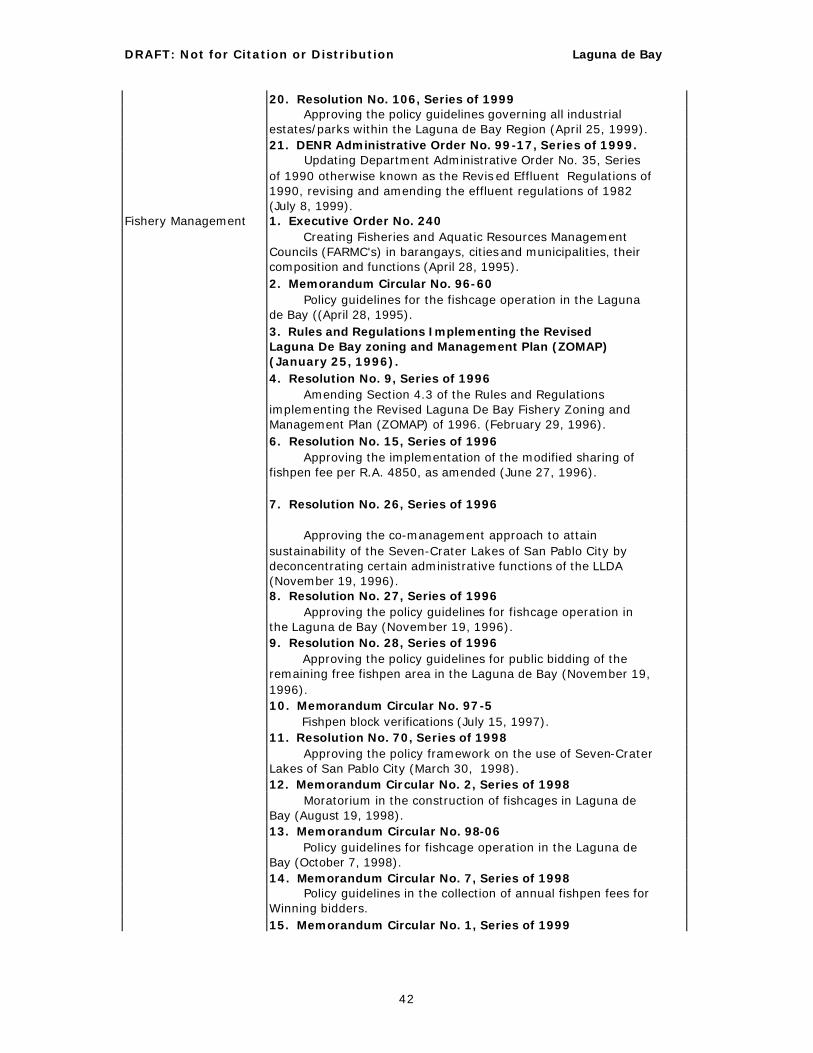
DRAFT: Not for Citation or Distribution Laguna de Bay
42
20. Resolution No. 106, Series of 1999 Approving the policy guidelines governing all industrial
estates/parks within the Laguna de Bay Region (April 25, 1999). 21. DENR Administrative Order No. 99-17, Series of 1999. Updating Department Administrative Order No. 35, Series
of 1990 otherwise known as the Revised Effluent Regulations of 1990, revising and amending the effluent regulations of 1982 (July 8, 1999).
Fishery Management 1. Executive Order No. 240 Creating Fisheries and Aquatic Resources Management
Councils (FARMC's) in barangays, cities and municipalities, their composition and functions (April 28, 1995).
2. Memorandum Circular No. 96-60 Policy guidelines for the fishcage operation in the Laguna
de Bay ((April 28, 1995). 3. Rules and Regulations Implementing the Revised
Laguna De Bay zoning and Management Plan (ZOMAP) (January 25, 1996).
4. Resolution No. 9, Series of 1996 Amending Section 4.3 of the Rules and Regulations
implementing the Revised Laguna De Bay Fishery Zoning and Management Plan (ZOMAP) of 1996. (February 29, 1996).
6. Resolution No. 15, Series of 1996 Approving the implementation of the modified sharing of
fishpen fee per R.A. 4850, as amended (June 27, 1996). 7. Resolution No. 26, Series of 1996
Approving the co-management approach to attain sustainability of the Seven-Crater Lakes of San Pablo City by deconcentrating certain administrative functions of the LLDA (November 19, 1996).
8. Resolution No. 27, Series of 1996 Approving the policy guidelines for fishcage operation in
the Laguna de Bay (November 19, 1996). 9. Resolution No. 28, Series of 1996 Approving the policy guidelines for public bidding of the
remaining free fishpen area in the Laguna de Bay (November 19, 1996). 10. Memorandum Circular No. 97-5 Fishpen block verifications (July 15, 1997). 11. Resolution No. 70, Series of 1998
Approving the policy framework on the use of Seven-Crater Lakes of San Pablo City (March 30, 1998).
12. Memorandum Circular No. 2, Series of 1998 Moratorium in the construction of fishcages in Laguna de
Bay (August 19, 1998). 13. Memorandum Circular No. 98-06 Policy guidelines for fishcage operation in the Laguna de
Bay (October 7, 1998). 14. Memorandum Circular No. 7, Series of 1998 Policy guidelines in the collection of annual fishpen fees for
Winning bidders. 15. Memorandum Circular No. 1, Series of 1999
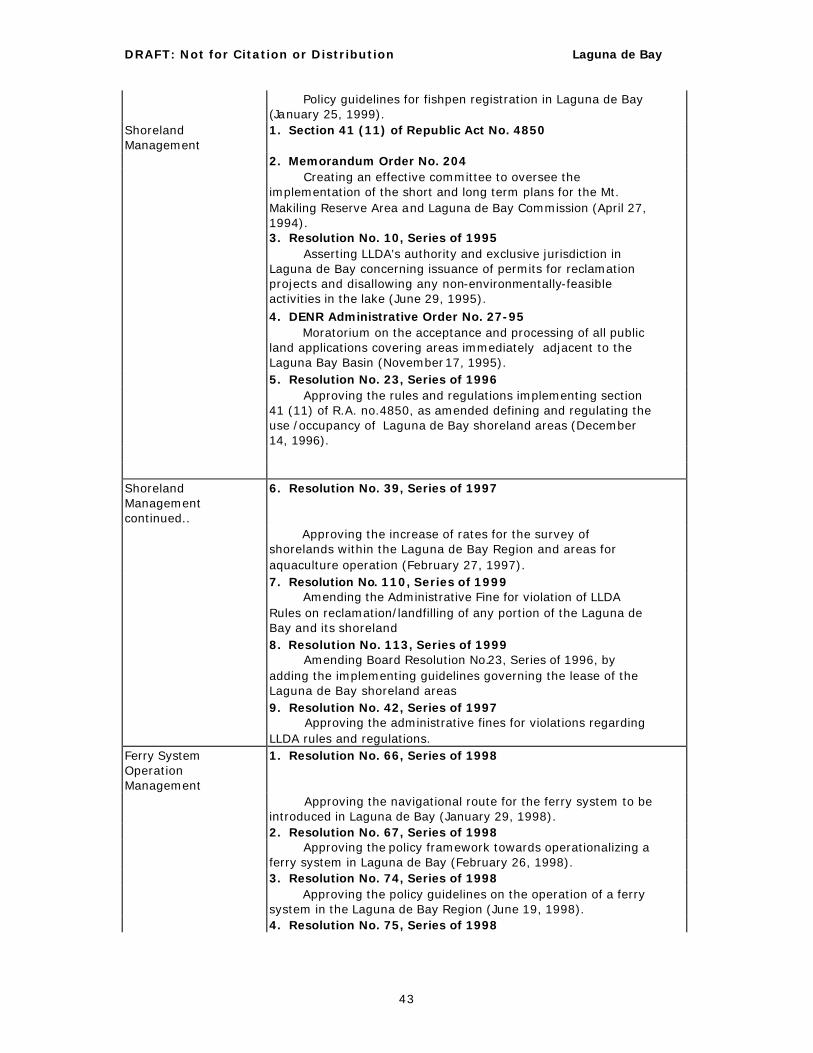
DRAFT: Not for Citation or Distribution Laguna de Bay
43
Policy guidelines for fishpen registration in Laguna de Bay (January 25, 1999).
Shoreland Management
1. Section 41 (11) of Republic Act No. 4850
2. Memorandum Order No. 204 Creating an effective committee to oversee the
implementation of the short and long term plans for the Mt. Makiling Reserve Area and Laguna de Bay Commission (April 27, 1994).
3. Resolution No. 10, Series of 1995 Asserting LLDA's authority and exclusive jurisdiction in
Laguna de Bay concerning issuance of permits for reclamation projects and disallowing any non-environmentally-feasible activities in the lake (June 29, 1995).
4. DENR Administrative Order No. 27-95 Moratorium on the acceptance and processing of all public
land applications covering areas immediately adjacent to the Laguna Bay Basin (November 17, 1995).
5. Resolution No. 23, Series of 1996 Approving the rules and regulations implementing section
41 (11) of R.A. no.4850, as amended defining and regulating the use /occupancy of Laguna de Bay shoreland areas (December 14, 1996).
Shoreland Management continued..
6. Resolution No. 39, Series of 1997
Approving the increase of rates for the survey of shorelands within the Laguna de Bay Region and areas for aquaculture operation (February 27, 1997).
7. Resolution No. 110, Series of 1999 Amending the Administrative Fine for violation of LLDA
Rules on reclamation/landfilling of any portion of the Laguna de Bay and its shoreland
8. Resolution No. 113, Series of 1999 Amending Board Resolution No.23, Series of 1996, by
adding the implementing guidelines governing the lease of the Laguna de Bay shoreland areas
9. Resolution No. 42, Series of 1997 Approving the administrative fines for violations regarding
LLDA rules and regulations. Ferry System Operation Management
1. Resolution No. 66, Series of 1998
Approving the navigational route for the ferry system to be introduced in Laguna de Bay (January 29, 1998).
2. Resolution No. 67, Series of 1998 Approving the policy framework towards operationalizing a
ferry system in Laguna de Bay (February 26, 1998). 3. Resolution No. 74, Series of 1998 Approving the policy guidelines on the operation of a ferry
system in the Laguna de Bay Region (June 19, 1998). 4. Resolution No. 75, Series of 1998

DRAFT: Not for Citation or Distribution Laguna de Bay
44
Ratification of policy guidelines on the operation of a ferry system in the Laguna de Bay (July 2, 1998).
5. Resolution No. 81, Series of 1998 Approving the implementing rules and regulations
governing the operation of a ferry system in the Laguna de Bay Region (September 12, 1998).
1


