Embed Size (px)
Citation preview

Eliminating Code Gridlock in Canada’s Health Care System
2015 Wait timE allianCE REpoRt CaRd
2 Eliminating Code Gridlock in Canada’s Health Care System // 2015 Wait timE allianCE REpoRt CaRd
IntroductionFor the past decade, the Wait Time Alliance (WTA) has been reporting on Canada’s progress to reduce medical wait times. Over this period, much has been learned about the causes of wait times and the variety of strategies that can be employed to address them, including greater use of operations research (the use of interdisciplinary science including mathematical modelling, statistics and algorithms), and the adoption of process improvement methods such as LEAN and the Theory of Constraints.1 It is clear that reducing wait times requires a systems-based approach.
“Code gridlock” is a term used by hospitals for a system-wide situation where patients can’t move. Patients in the emergency department (ED) can’t go to an in-patient bed because those beds are full. Ambulances are unable to offload patients into the ED because there is no space, even in the hallways. Elective surgeries are cancelled because of a lack of available in-patient beds. Transfers from regional facilities to the referring hospital are put on hold.2
From a patient perspective, code gridlock can mean that patients who no longer require acute care continue to occupy hospital beds because of a lack of access to more appropriate community-based resources, such as their home (with the necessary supports) or a residential care facility. These patients, the majority of whom are seniors, are referred to as alternate level of care (ALC) patients.
Code gridlock also affects a much wider range of patients, such as those waiting in the ED for an in-patient bed and those waiting for elective surgery. For these reasons, WTA has previously stated that the ALC issue represents the single biggest challenge to improving wait times across the health care system.
An issue that involves so many parts of the health care system clearly requires a system-wide solution. The WTA
has repeatedly called for efforts to reduce wait times for all components of the patient’s journey across the health care system. But when it comes to wait times, much of the attention has focused on the hospital component. While hospital-based efforts to improve patient flow and to centralize the intake of surgical patients are making a difference, they represent improvements to only one part of the system, particularly from the patient’s perspective. A few provinces have begun extending the reporting of wait times to other important components, including primary care, specialty care and home care.
There have been reductions in wait times for the initial five areas identified in the 2004 Health Accord (hip and knee replacement, cataract, bypass surgery, radiation therapy and diagnostic imaging), even as health care systems have faced increased demand for care. But despite these encouraging signs, there are more areas in need of attention, such as primary care, mental health services, home care, long-term care and palliative care, if wait times across the system are to be reduced on a sustained basis.
New for 2015With the need for a systems-based approach, the 2015 WTA report card highlights timely access on two broader system-related issues: seniors care and care provided to populations falling under federal jurisdiction (i.e., First Nations, refugees, veterans, Canadian Forces and inmates in federal prisons).
In previous years, the WTA report card provided grades using both government wait-time benchmarks and WTA benchmarks. This year’s report grades wait times using only the WTA benchmarks, given that the WTA believes these are more appropriate benchmarks with which to assess performance than the government benchmarks.
Eliminating Code Gridlock in Canada’s Health Care System
3 Eliminating Code Gridlock in Canada’s Health Care System // 2015 Wait timE allianCE REpoRt CaRd
For instance:
§ The WTA benchmark for coronary artery bypass graft (CABG) is six weeks for patients awaiting elective surgery whereas the government pan-Canadian benchmark is 26 weeks.
§ The WTA benchmark to access radiation therapy is 10 days whereas the government pan-Canadian benchmark is four weeks.
§ Through the efforts of the Canadian Association of Radiologists, the WTA has set a national benchmark of eight weeks (60 days) to access a MRI or CT scan.3
A full list of WTA benchmarks can be found at www.waittimealliance.ca/wait_times.htm.
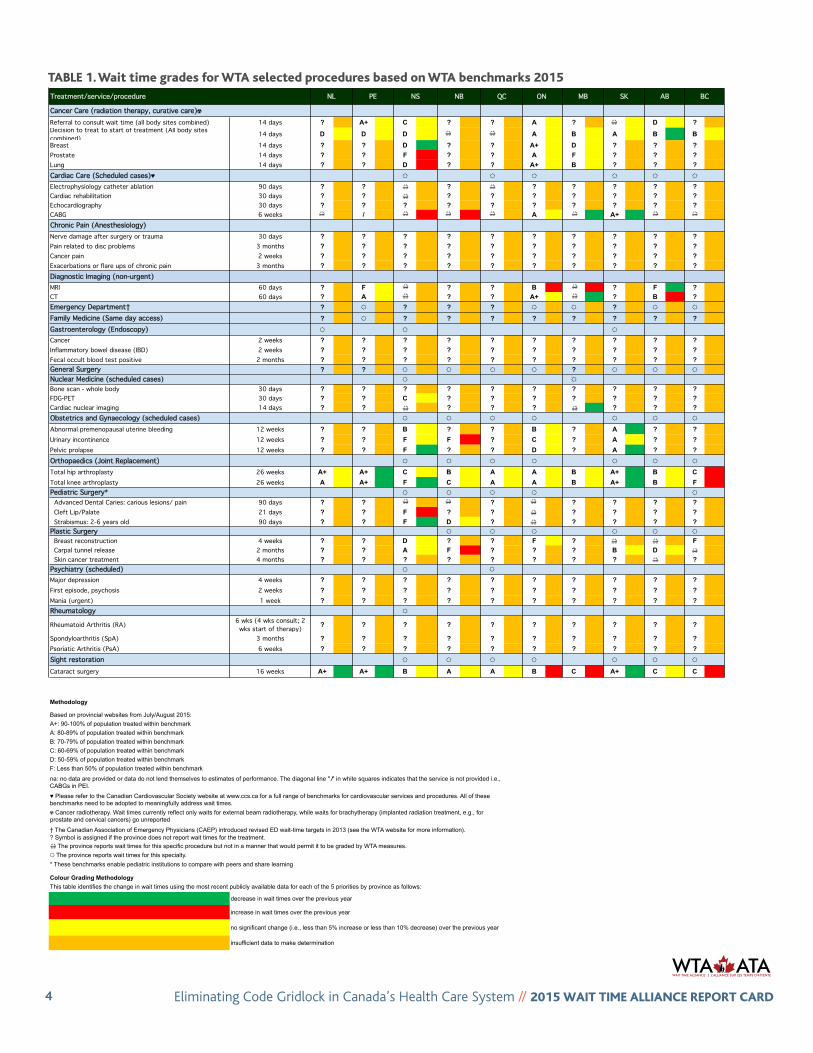
Results for 2015Wait-time data were taken from provincial wait-time websites in the spring and early summer of 2015. The 2015 grades for each province are presented in Table 1.4
Nationally, the picture of timely access has not changed significantly from the previous year. The provinces that did well in 2014 continue to be the best performers in 2015—Saskatchewan, Ontario and Newfoundland and Labrador. Saskatchewan continues to improve the most and reports the lowest wait times for the procedures that could be graded using the WTA benchmarks. Ontario is also a strong performer, as is Newfoundland and Labrador, although the latter reports on a more limited range of procedures.
Saskatchewan’s performance is particularly impressive when looking at the 90th percentile of patients treated, in other words, the amount of time it takes before 90% of patients get their treatment. In the past, Saskatchewan had a number of patients who waited a year or longer for surgery. Now, 99% of patients are offered or have received their surgery within six months and the percentage of patients waiting more than six months dropped by 96% between 2010 and 2015 despite higher volumes of surgeries.5 Equally important, these positive results have been achieved across the province—seven of the 10 health regions that offer
surgery report having fewer than five patients waiting more than three months.
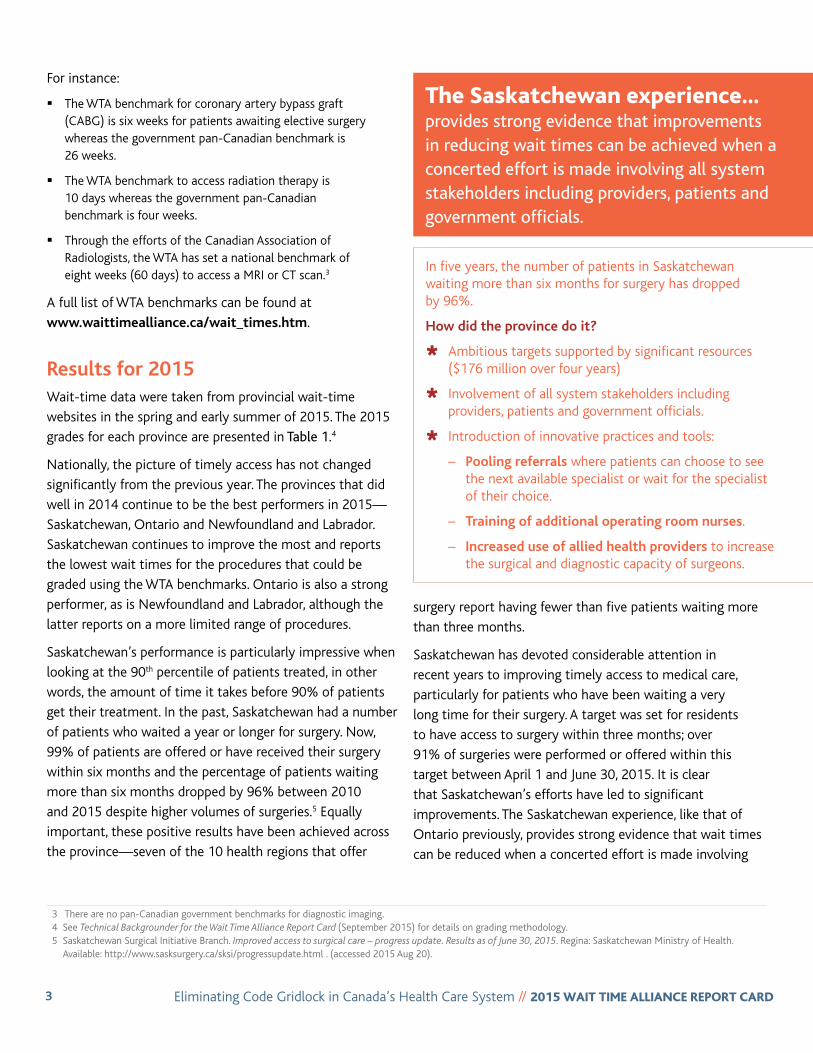
Saskatchewan has devoted considerable attention in recent years to improving timely access to medical care, particularly for patients who have been waiting a very long time for their surgery. A target was set for residents to have access to surgery within three months; over 91% of surgeries were performed or offered within this target between April 1 and June 30, 2015. It is clear that Saskatchewan’s efforts have led to significant improvements. The Saskatchewan experience, like that of Ontario previously, provides strong evidence that wait times can be reduced when a concerted effort is made involving
the Saskatchewan experience… provides strong evidence that improvements in reducing wait times can be achieved when a concerted effort is made involving all system stakeholders including providers, patients and government officials.
In five years, the number of patients in Saskatchewan waiting more than six months for surgery has dropped by 96%.
How did the province do it?
Ù Ambitious targets supported by significant resources ($176 million over four years)
Ù Involvement of all system stakeholders including providers, patients and government officials.
Ù Introduction of innovative practices and tools:
– Pooling referrals where patients can choose to see the next available specialist or wait for the specialist of their choice.
– Training of additional operating room nurses.
– Increased use of allied health providers to increase the surgical and diagnostic capacity of surgeons.
3 There are no pan-Canadian government benchmarks for diagnostic imaging. 4 See Technical Backgrounder for the Wait Time Alliance Report Card (September 2015) for details on grading methodology. 5 Saskatchewan Surgical Initiative Branch. Improved access to surgical care – progress update. Results as of June 30, 2015. Regina: Saskatchewan Ministry of Health.
Available: http://www.sasksurgery.ca/sksi/progressupdate.html . (accessed 2015 Aug 20).
4 Eliminating Code Gridlock in Canada’s Health Care System // 2015 Wait timE allianCE REpoRt CaRd
TABLE 1. Wait time grades for WTA selected procedures based on WTA benchmarks 2015
Treatment/service/procedure
Cancer Care (radiation therapy, curative care)☢Referral to consult wait time (all body sites combined) 14 days ? A+ C ? ? A ? 👓👓 D ?Decision to treat to start of treatment (All body sites combined) 14 days D D D 👓👓 👓👓 A B A B BBreast 14 days ? ? D ? ? A+ D ? ? ?Prostate 14 days ? ? F ? ? A F ? ? ?Lung 14 days ? ? D ? ? A+ B ? ? ?Cardiac Care (Scheduled cases)♥ ☼ ☼ ☼ ☼ ☼ ☼
Electrophysiology catheter ablation 90 days ? ? 👓👓 ? 👓👓 ? ? ? ? ?Cardiac rehabilitation 30 days ? ? 👓👓 ? ? ? ? ? ? ?Echocardiography 30 days ? ? ? ? ? ? ? ? ? ?CABG 6 weeks 👓👓 / 👓👓 👓👓 👓👓 A 👓👓 A+ 👓👓 👓👓
Chronic Pain (Anesthesiology)Nerve damage after surgery or trauma 30 days ? ? ? ? ? ? ? ? ? ?Pain related to disc problems 3 months ? ? ? ? ? ? ? ? ? ?Cancer pain 2 weeks ? ? ? ? ? ? ? ? ? ?Exacerbations or flare ups of chronic pain 3 months ? ? ? ? ? ? ? ? ? ?Diagnostic Imaging (non-urgent)MRI 60 days ? F 👓👓 ? ? B 👓👓 ? F ?CT 60 days ? A 👓👓 ? ? A+ 👓👓 ? B ?Emergency Department† ? ☼ ? ? ? ☼ ☼ ? ☼ ☼
Family Medicine (Same day access) ? ☼ ? ? ? ? ? ? ? ?Gastroenterology (Endoscopy) ☼ ☼ ☼
Cancer 2 weeks ? ? ? ? ? ? ? ? ? ?Inflammatory bowel disease (IBD) 2 weeks ? ? ? ? ? ? ? ? ? ?Fecal occult blood test positive 2 months ? ? ? ? ? ? ? ? ? ?General Surgery ? ? ☼ ☼ ☼ ? ☼ ☼ ☼Nuclear Medicine (scheduled cases) ☼ ☼Bone scan - whole body 30 days ? ? ? ? ? ? ? ? ? ?FDG-PET 30 days ? ? C ? ? ? ? ? ? ?Cardiac nuclear imaging 14 days ? ? 👓👓 ? ? ? 👓👓 ? ? ?Obstetrics and Gynaecology (scheduled cases) ☼ ☼ ☼ ☼ ☼ ☼ ☼
Abnormal premenopausal uterine bleeding 12 weeks ? ? B ? ? B ? A ? ?Urinary incontinence 12 weeks ? ? F F ? C ? A ? ?Pelvic prolapse 12 weeks ? ? F ? ? D ? A ? ?Orthopaedics (Joint Replacement) ☼ ☼ ☼ ☼ ☼ ☼ ☼
Total hip arthroplasty 26 weeks A+ A+ C B A A B A+ B CTotal knee arthroplasty 26 weeks A A+ F C A A B A+ B FPediatric Surgery* ☼ ☼ ☼ ☼ ☼ Advanced Dental Caries: carious lesions/ pain 90 days ? ? 👓👓 👓👓 ? 👓👓 ? ? ? ? Cleft Lip/Palate 21 days ? ? F ? ? 👓👓 ? ? ? ? Strabismus: 2-6 years old 90 days ? ? F D ? 👓👓 ? ? ? ?Plastic Surgery ☼ ☼ ☼ ☼ ☼ ☼ Breast reconstruction 4 weeks ? ? D ? ? F ? 👓👓 👓👓 F Carpal tunnel release 2 months ? ? A F ? ? ? B D 👓👓
Skin cancer treatment 4 months ? ? ? ? ? ? ? ? 👓👓 ?Psychiatry (scheduled) ☼
Major depression 4 weeks ? ? ? ? ? ? ? ? ? ?First episode, psychosis 2 weeks ? ? ? ? ? ? ? ? ? ?Mania (urgent) 1 week ? ? ? ? ? ? ? ? ? ?Rheumatology ☼
Rheumatoid Arthritis (RA) 6 wks (4 wks consult; 2 wks start of therapy) ? ? ? ? ? ? ? ? ? ?
Spondyloarthritis (SpA) 3 months ? ? ? ? ? ? ? ? ? ?Psoriatic Arthritis (PsA) 6 weeks ? ? ? ? ? ? ? ? ? ?Sight restoration ☼ ☼ ☼ ☼ ☼ ☼ ☼
Cataract surgery 16 weeks A+ A+ B A A B C A+ C C
A+: 90-100% of population treated within benchmark
† The Canadian Association of Emergency Physicians (CAEP) introduced revised ED wait-time targets in 2013 (see the WTA website for more information).
This table identifies the change in wait times using the most recent publicly available data for each of the 5 priorities by province as follows:
B: 70-79% of population treated within benchmark
A: 80-89% of population treated within benchmark
no significant change (i.e., less than 5% increase or less than 10% decrease) over the previous year
insufficient data to make determination
PE
Colour Grading Methodology
decrease in wait times over the previous year
increase in wait times over the previous year
* These benchmarks enable pediatric institutions to compare with peers and share learning
☼ The province reports wait times for this specialty.
? Symbol is assigned if the province does not report wait times for the treatment.
👓👓 The province reports wait times for this specific procedure but not in a manner that would permit it to be graded by WTA measures.
SK BCNS NBNL AB
Methodology
Based on provincial websites from July/August 2015:
ON QC MB
☢ Cancer radiotherapy. Wait times currently reflect only waits for external beam radiotherapy, while waits for brachytherapy (implanted radiation treatment, e.g., for prostate and cervical cancers) go unreported
na: no data are provided or data do not lend themselves to estimates of performance. The diagonal line " ⁄" in white squares indicates that the service is not provided i.e., CABGs in PEI.
♥ Please refer to the Canadian Cardiovascular Society website at www.ccs.ca for a full range of benchmarks for cardiovascular services and procedures. All of these benchmarks need to be adopted to meaningfully address wait times.
C: 60-69% of population treated within benchmark
F: Less than 50% of population treated within benchmark
D: 50-59% of population treated within benchmark
tablE 1. Wait time grades for Wta selected procedures based on Wta benchmarks 2015
☼
☼
5 Eliminating Code Gridlock in Canada’s Health Care System // 2015 Wait timE allianCE REpoRt CaRd
all system stakeholders, including providers, patients and government officials. The key will be whether these improvements can be sustained over time and whether other waits that patients experience, including the wait to see a specialist, can also be improved.
The ED is often the “canary in the coal mine” for problems with the health system. As such, it is important to collect and report on ED wait times with the understanding that they provide an assessment of the performance of the broader health care system. The number of provinces reporting ED wait times continues to grow. Prince Edward Island and British Columbia (for six facilities) are the latest to report ED wait times in approximate real time (updated every five minutes). The estimated wait time is approximately how long it will take from the time a patient is registered to the time the patient is seen by a physician. No cumulative data are provided, so grading could not be done.
It can be concluded that wait times in the ED remain much shorter for patients with minor or uncomplicated conditions than for patients with complex needs (e.g., requiring more time for diagnosis) and particularly for those who require admission to a hospital bed. For instance, Ontario reports that the maximum amount of time that nine out of 10 patients with complex needs spent to complete their ED visit and be admitted to the hospital was 25.7 hours (June 2015). The maximum amount of time that nine out of 10 patients with minor or uncomplicated conditions stayed in the ED was 4 hours. As outlined in previous WTA reports, many of the factors responsible for the lengthy waits to be admitted to a hospital bed are system-wide failures such as highnumbers of ALC patients and a lack of community-based supports.6
With respect to primary care, which is another important component of the health system, Prince Edward Island now reports wait times to access a family physician, the first province to do so. This is a voluntary service that measures the third next routine available appointment (TNAA) as a gauge to assess access to primary care.7 Wait times are reported for each of the five regional primary care networks in the province. The average wait time for an appointment between January and March 2015 was 23 days, ranging from 0 to 72 days. 8
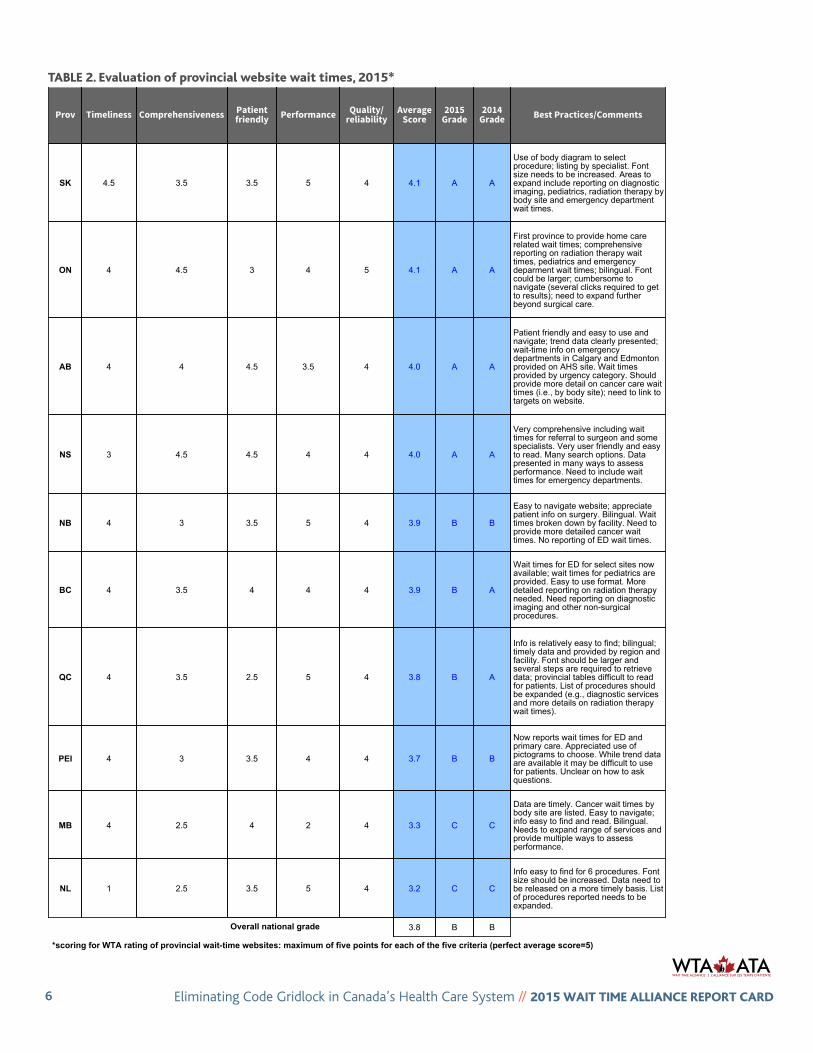
Grading provincial wait-time websitesPublic reporting of wait times is an important component of enabling timely access to care for patients as well as tracking wait times for quality improvement purposes. The provincial wait-time websites are linked to the websites of provincial ministries of health. The WTA’s annual assessment of provincial wait-time websites includes five dimensions: timeliness, comprehensiveness, patient friendliness/accessibility, performance, and quality/reliability. Patient groups were invited to provide input on their use of the websites and have offered constructive feedback.9
The results for 2015 are listed in Table 2. While the national grade of “B” for 2015 has not changed from 2014, there continue to be improvements among many of the provincial websites. Four provinces received a grade of “A”: Saskatchewan, Ontario, Alberta and Nova Scotia. However, there is no perfect website and every province has room to improve. For instance, only a few provinces, particularly Ontario, Nova Scotia and Manitoba, report wait times for
6 Affleck A, Parks P, Drummond A, Rowe BH, Ovens HJ. Emergency department overcrowding and access block [Canadian Association of Emergency Physicians position statement]. CJEM 2013;15(6):359–70. Available: http://caep.ca/sites/caep.ca/files/caep/PositionStatments/edoc_document_final_eng.pdf (accessed 2015 Aug 31).
7 TNAA is the average length of time in days between the day a patient makes a request for an appointment with a physician and the third available appointment for a new patient physical, routine examination or return visit examination. The “third next available” appointment is used rather than the “next available” appointment because it is a more sensitive reflection of true appointment availability. For example, an appointment may be open at the time of a request because of a cancellation or other unexpected event. Using the “third next available” appointment eliminates these chance occurrences from the measure of availability. (www.ihi.org/resources/Pages/Measures/ThirdNextAvailableAppointment.aspx).
8 Health PEI. Access to family physicians. Prince Edward Island: Government of Prince Edward Island, 2015. Available: http://www.healthpei.ca/index.php3?number=1052095&lang=E(accessed 2015 Aug 17).
9 The WTA thanks the Canadian Cancer Society and the National Association of Federal Retirees for reviewing and providing comments on all of the provincial wait-time websites.
6 Eliminating Code Gridlock in Canada’s Health Care System // 2015 Wait timE allianCE REpoRt CaRd
Prov Timeliness Comprehensiveness Patientfriendly Performance Quality/
reliabilityAverage
Score2015
Grade2014
Grade Best Practices/Comments
SK 4.5 3.5 3.5 5 4 4.1 A A
Use of body diagram to selectprocedure; listing by specialist. Fontsize needs to be increased. Areas toexpand include reporting on diagnosticimaging, pediatrics, radiation therapy bybody site and emergency departmentwait times.
ON 4 4.5 3 4 5 4.1 A A
First province to provide home carerelated wait times; comprehensivereporting on radiation therapy waittimes, pediatrics and emergencydeparment wait times; bilingual. Fontcould be larger; cumbersome tonavigate (several clicks required to getto results); need to expand furtherbeyond surgical care.
AB 4 4 4.5 3.5 4 4.0 A A
Patient friendly and easy to use andnavigate; trend data clearly presented;wait-time info on emergencydepartments in Calgary and Edmontonprovided on AHS site. Wait timesprovided by urgency category. Shouldprovide more detail on cancer care waittimes (i.e., by body site); need to link totargets on website.
NS 3 4.5 4.5 4 4 4.0 A A
Very comprehensive including waittimes for referral to surgeon and somespecialists. Very user friendly and easyto read. Many search options. Datapresented in many ways to assessperformance. Need to include waittimes for emergency departments.
NB 4 3 3.5 5 4 3.9 B B
Easy to navigate website; appreciatepatient info on surgery. Bilingual. Waittimes broken down by facility. Need toprovide more detailed cancer waittimes. No reporting of ED wait times.
BC 4 3.5 4 4 4 3.9 B A
Wait times for ED for select sites nowavailable; wait times for pediatrics areprovided. Easy to use format. Moredetailed reporting on radiation therapyneeded. Need reporting on diagnosticimaging and other non-surgicalprocedures.
QC 4 3.5 2.5 5 4 3.8 B A
Info is relatively easy to find; bilingual;timely data and provided by region andfacility. Font should be larger andseveral steps are required to retrievedata; provincial tables difficult to readfor patients. List of procedures shouldbe expanded (e.g., diagnostic servicesand more details on radiation therapywait times).
PEI 4 3 3.5 4 4 3.7 B B
Now reports wait times for ED andprimary care. Appreciated use ofpictograms to choose. While trend dataare available it may be difficult to usefor patients. Unclear on how to askquestions.
MB 4 2.5 4 2 4 3.3 C C
Data are timely. Cancer wait times bybody site are listed. Easy to navigate;info easy to find and read. Bilingual.Needs to expand range of services andprovide multiple ways to assessperformance.
NL 1 2.5 3.5 5 4 3.2 C C
Info easy to find for 6 procedures. Fontsize should be increased. Data need tobe released on a more timely basis. Listof procedures reported needs to beexpanded.
3.8 B B
Table 2: 2015 rating of provincial wait-time websites*
Overall national grade
*scoring for WTA rating of provincial wait-time websites: maximum of five points for each of the five criteria (perfect average score=5)
tablE 2. Evaluation of provincial website wait times, 2015*
7 Eliminating Code Gridlock in Canada’s Health Care System // 2015 Wait timE allianCE REpoRt CaRd
radiation therapy (cancer) by body site. Patient groups reported that the font size on some websites is too small. They identified the Manitoba wait-times website as among the easiest sites to navigate.
There remains a need for all provinces to report on a broader array of important health care services. As previously noted, more provinces are reporting ED wait times; however, insufficient cumulative data are reported for the WTA to be able to assess trends. A few provinces, notably Nova Scotia, list wait times for many procedures and services beyond surgical services and Ontario is the first province to report on wait times to access home care.
However, no province reports wait times for psychiatric care, for anesthesiology for chronic pain or for rheumatology. Three provinces report on gastroenterology services but to a limited degree. While cardiac care was one of the original five areas identified for the development of benchmarks in the 2004 Health Accord, considerable variation remains in how wait times for cardiac care procedures are defined and reported across the country.
Timely access to seniors careImproving timely and appropriate care for seniors is a major issue for Canada’s health system. The proportion of seniors (65 years and over) in Canada is growing and the proportion of those 85 years and over, many of whom have multiple chronic diseases including dementia, is expected to increase four-fold.10 The first wave of baby boomers began turning 65 in 2011 and analysis shows the number of seniors is expected to continue rising for the next two decades. By 2030, all baby boomers will be 65 years or older. Statistics Canada’s population projections show that by 2063 the number of seniors will range between 11.1 million and 15.1 million, depending on the growth scenario used; in 2013, there were 5.4 million seniors.11
Health systems need to properly care for and support increasing numbers of people with one or more chronic
conditions through integrated care delivery models, adequate social supports and assistance to informal caregivers. If we can improve how we care for our seniors, we will go a long way toward creating a high-performing health care system, thereby benefiting all patients.
Few data are available on access to care specifically for seniors. No provinces report wait times for specialty care for seniors (e.g., geriatric medicine, care of the elderly, geriatric psychiatry). These specialties care for seniors who are at high risk for prolonged avoidable hospitalizations (often resulting in ALC and premature placement in long-term care) because of issues such as dementia combined with other chronic diseases.
According to Commonwealth Fund surveys comparing quality of care for older adults among 11 countries:
§ older Canadians are more likely to have access to afamily physician than the general population;
§ 53% of Canadians 55 years and older waited two daysor longer to see a family physician or nurse the last timethey were sick or needed medical attention (comparedwith the 11-country average of 32%); and
§ 25% of Canadians 55 years and older waited at leasttwo months to see a specialist (compared with the11-country average of 15%).12
Statistics Canada’s population projections show that, by 2063, the number of seniors in our country will range between 11.1 million and 15.1 million.
10 Canadian Study of Health and Aging 1991-2001. N.p.: Canadian Study of Health and Aging; 2002. Available: http://www.csha.ca/ (accessed 2015 Nov 30).. 11 National Population Projections Team. Population projections for Canada (2013 to 2063), provinces and territories (2013 to 2038). 2015 May 26. Statistics Canada
Catalogue. No. 91-520-XOttawa, Ontario. p. 17. Available: http://www.statcan.gc.ca/pub/91-520-x/91-520-x2014001-eng.htm (accessed 2015 May 26). 12 Canadian Institute for Health Information. How Canada compares: results from the Commonwealth Fund 2014 international health policy survey of older adults. Ottawa:
The Institute.2014 June 13. Available: http://www.statcan.gc.ca/daily-quotidien/140613/dq140613c-eng.htm (accessed 2015 Jun 13).
thE ConfEREnCE boaRd of Canada haS foRECaSt a 71 pERCEnt inCREaSE in dEmand foR ContinuinG CaRE SERviCES by SEnioRS bEtWEEn 2011 and 2026.
8 Eliminating Code Gridlock in Canada’s Health Care System // 2015 Wait timE allianCE REpoRt CaRd
Current demand for home care and long-term care is not being met and this gap will increase. In 2012, 25% of seniors 75 years and older and 13% of those aged 64–74 years received home care.13 Unfortunately, about a quarter of those 65 years and older (24%) needed care but did not receive it.14 The Conference Board of Canada has forecast a 71% increase in demand for continuing care services (including both paid services and unpaid caregiving) by seniors between 2011 and 2026.15
Data on wait times to receive home care or to enter a long-term care facility are scarce. Many of the provincial and territorial government websites provide information to seniors describing the many services available to them. However, Ontario is the only province that provides data publicly on wait times for home care and for long-term care (2013–2014). The data on home care waits consist of:
§ the percentage of home care patients who received theirfirst nursing visit within five days of the date they wereauthorized for nursing services (94%); and
§ the percentage of patients with complex needs waitingfor personal support services (84%).
With respect to long-term care, the “median number of days to long-term care home placement” in Ontario was 108 days. In a report for the Canadian Medical Association, the Conference Board of Canada identified long-term care wait times for nine of 10 provinces. While data are reported differently across the country, the report highlights the fact that waits for long-term care vary significantly not only among the provinces but also among regions and communities within each province.
Ontario reports additional information on the quality of care received at care homes, using a wide range of indicators, including cognitive function, incontinence, falls, drug safety, restraints and many more. The Canadian Institute for Health Information’s (CIHI) web tool called Your Health System enables Canadians to review the performance of a hospital, city region, province or territory. It also includes long-term care organizations, and this year, for the first time, CIHI has incorporated individual care facilities along with performance indicators.19
Measuring ALC rates
A serious problem affecting timely access for both seniors and other patients is that high numbers of patients occupy ALC beds while waiting for placement in home care, a rehabilitation facility, long-term care (i.e., nursing home or chronic care facility) or a residential facility. While the term ALC is commonly used to refer to a patient who continues to occupy an acute care hospital bed after they no longer require one,20 there remains no pan-Canadian definition that is consistently used at the moment. This makes it difficult to compare rates across the country. In Ontario, there were 3,812 ALC patients waiting in an acute or post-acute care bed as of May 31, 2015.21 As well, 41% of ALC patients in those beds were waiting for a long-term care placement. In April 2015, 13.7% of the in-patient beds in the province were occupied by ALC patients. The rates ranged across the regions from a low of 6% to a high of 27%.
13 Statistics Canada. Study: receiving care at home, 2012. The Daily. 2014 June 13. 14 Statistics Canada. Study: Canadians with unmet home care needs, 2012. The Daily 2014 Sept 9. Available:
http://www.statcan.gc.ca/daily-quotidien/140909/dq140909a-eng.htm (accessed 2015 Sep 9). 15 Hermus G, Stonebridge C, Edenhoffer K. Future care for Canadian seniors: a status quo forecast. Ottawa: Conference Board of Canada; 2015. [Continuing care supports
include health supports, personal and social supports, accommodation supports, voluntary donations and services.] 16 Health Quality Ontario. Public reporting. Home care. Toronto: Queen’s Printer for Ontario; 2015. Available:
www.hqontario.ca/public-reporting/home-care?_ga=1.118678410.2061823438.1438710844 (accessed 2015 Aug 17). 17 Verbeeten D, Astles P, Prada G. Understanding health and social services for seniors in Canada. Ottawa: Conference Board of Canada; 2015. 18 Canadian Institute for Health Information. Your health system. Ottawa: The Institute; 2015. Available: yourhealthsystem.cihi.ca/hsp/indepth?lang=en#/
(accessed 2015 July 15). 19 Canadian Institute for Health Information. Performance of 1,000 Canadian long-term care facilities now publicly available [media release]. Ottawa: The Institute; 2015
June 10. Available: https://www.cihi.ca/en/health-system-performance/performance-reporting/international/performance-of-1000-canadian-long-term (accessed 2015 Jun 10).
20 Canadian Institute for Health Information. Alternate level of care in Canada. Analysis in Brief. Ottawa: The Institute; 2009 January 14. Available: https://secure.cihi.ca/free_products/ALC_AIB_FINAL.pdf (accessed 2015 Aug 14).
21 Ontario Hospital Association. Access to care. Alternate level of care (ALC). Report prepared by Access to Care for the Ontario Hospital Association. Toronto: Ontario Hospital Association; 2015 May. Available: www.oha.com/CurrentIssues/Issues/eralc/Documents/ALC%20Report%20-%20May%202015%20data.pdf (accessed 2015 Aug 18).

9 Eliminating Code Gridlock in Canada’s Health Care System // 2015 Wait timE allianCE REpoRt CaRd
The English National Health Service reports monthly ALC rates as delayed transfers of care. The data include the causes of delay by region and facility.22, 23 Adopting this type of comprehensive reporting in Canada would greatly assist efforts to tackle the ALC issue.
Dementia is a common diagnosis among ALC patients. Dementia usually results in hospitalization and escalates ALC rates when persons with dementia have other chronic diseases (90% of community-dwelling persons with dementia have two or more chronic diseases). A study of two hospitals in New Brunswick illustrates the problem. It found that 33% of the hospital beds were occupied by ALC patients, of whom 63% had been diagnosed with dementia.24 The study found their mean length of stay was 379.6 days, with 86% of these patients waiting for a bed in a long-term care facility; many of the patients’ health declined while they were in the hospital. Such high-risk seniors cannot wait long to be seen: long wait times translate into missed opportunities to keep them safely in the community and hence to avoid long admissions to hospital and ALC (if not premature admissions to long-term care). Previously, the WTA has called for Canada to adopt a national dementia plan like many other countries. A national dementia plan should tie together and support provincial dementia plans to create synergies that maximize/optimize efficiencies.
There are many reasons for the high rates of ALC patients, including a lack of community supports to both prevent ALC hospitalizations and to return patients to a more appropriate setting after they receive hospital care. Unnecessary deterioration and deconditioning of ALC patients can occur in hospitals, a situation that particularly affects frail seniors and persons with dementia, leading to longer hospitalizations, increased ALC stays, premature
long-term care placement and code gridlock. Adequate attention to seniors care, such as having the necessary health human resources (e.g., in geriatric medicine, care of the elderly, geriatric psychiatry), keeping and treating seniors where they live thereby preventing unnecessary ED visits and hospitalizations (e.g., through ED/hospital diversion programs), and collaborative care models, are key to reducing the numbers of ALC patients.
Seniors care is a national issue
The Canadian Alliance for Long Term Care released a poll, conducted by Nanos Research, indicating that Canadians are worried about long-term care in Canada.25 At the top of the list of concerns was patients waiting too long for long-term care placements (93%); 91% of respondents were concerned that long-term care homes won’t be staffed properly to meet the needs of seniors. As well, there was concern about the high level of care needed by the rising number of dementia patients (91%) and that there are not enough beds to meet future needs (91%).
Respondents supported several proposed initiatives with respect to federal government involvement in long-term care issues. First and foremost, 93% said that the federal government should work with the provinces to ensure that all Canadians have the same level of access and quality of services, regardless of where they live. As well, 89% said that the federal government should lead the development of a national strategy (including benchmarks) to address the inequities and funding issues related to long-term care.
89% said that the federal government should lead in the development of a national strategy to address the inequities and the funding issues related to long-term care.
—Canadian Alliance for Long-Term Care poll, August 2015
dEmEntia iS a Common diaGnoSiS amonG alC patiEntS.
22 A delayed transfer of care from acute or non-acute (including community and mental health) care occurs when a patient is ready to depart from such care and is still occupying a bed.
23 NHS England. Delayed transfers of care statistics for England 2014/15. 2014/15 annual report. London: NHS England; 2015 May 29. Available: www.england.nhs.uk/statistics/wp-content/uploads/sites/2/2013/04/2014-15-Delayed-Transfers-of-Care-Annual-Report.pdf (accessed 2015 Sept 11).
24 McCloskey R, Jarrett P, Stewart C, Nicholson P. Alternate level of care patients in hospitals: What does dementia have to do with this? Can Geriatr J 2014;17(3):88–94. 25 Canadian Alliance for Long-Term Care. New study shows Canadians are concerned about the long term care needs of seniors [media release]. N.p.: The Alliance; 2015
Aug 24. Available: http://www.newswire.ca/news-releases/new-study-shows-canadians-are-concerned-about-the-long-term-care-needs-of-seniors-522705761.html (accessed 2015 Aug 24).
10 Eliminating Code Gridlock in Canada’s Health Care System // 2015 Wait timE allianCE REpoRt CaRd
Respondents also thought that the federal government needed to be involved in developing a national dementia strategy (85%).The poll results indicate a growing concern and unease over Canada’s direction on seniors-related care. The lack of confidence in the strength of the system to cope with the growing demand is particularly worrisome. Moreover, there are significant variations in timely access to care for Canada’s seniors across the country and among regions within provinces. Not surprisingly, there is strong support for federal government involvement in the form of leading a national seniors strategy.
Timely access to care for patients under federal jurisdictionThe federal government is the fifth largest provider of health care in Canada in terms of dollars spent.26 Total spending by the federal government was $4.5 billion in 2014–2015. Its major health programs include the following:
§ Health Canada’s Non-Insured Health Benefits program covers registered First Nations and recognized Inuit whodo not fall under private insurance plans or provincialand territorial health and social programs.27
§ Veterans Affairs Canada has several health-related programsfor veterans and other qualified individuals to maintain orenhance their physical, mental and social well-being.28
§ The Department of National Defence delivers healthservices to military personnel wherever they are posted.29
§ Correctional Service Canada is responsible “for providingessential health services and reasonable access to non-essential mental health services that will contribute tothe inmate’s rehabilitation and successful reintegrationinto communities.”30
§ Citizenship and Immigration Canada’s Interim Federal Health Program (IFHP) is a “discretionary program thatprovides limited, temporary coverage of health care costsfor specific groups of people including protected persons,refugee claimants, rejected refugee claimants, andcertain persons detained under IRPA [the Immigrationand Refugee Protection Act].”31
In view of this significant role of the federal government, the WTA calls for public reporting of timely access to health services for individuals falling under federal jurisdiction.
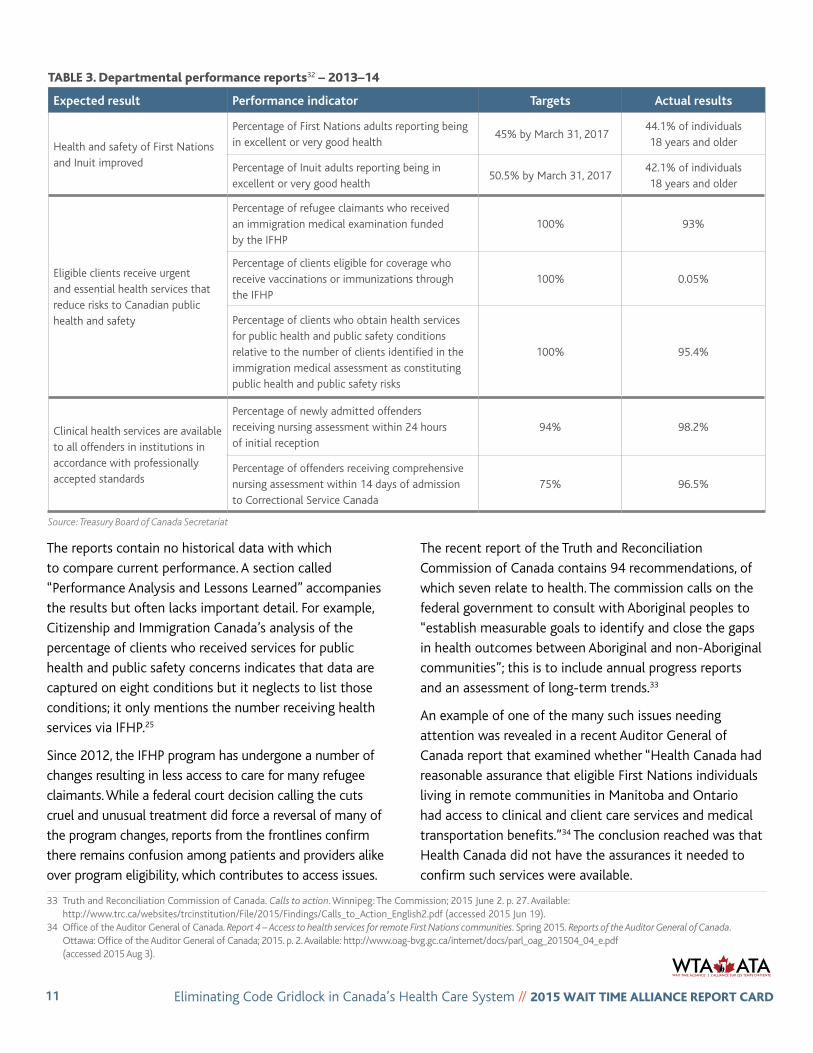
Lack of reportingIn contrast to the availability of data on provincial websites, it is not easy to locate data on how well these federal departments perform with respect to providing their respective health services. The respective departmental performance reports used to evaluate their work were found via the Treasury Board of Canada website; they are the only pieces of information available publicly on performance.32 The reports tend to focus on certain departmental tasks and their related administrative targets. The lack of transparency with respect to the location of the federal performance data and the opaque nature of the little information that is available makes it difficult for clients, their families and the larger public to assess the quality and value of the services. Table 3 illustrates the types of information the departments provide.
The Wait Time Alliance calls for public reporting of timely access for health services for individuals falling under federal jurisdictions.
26 Advisory Panel on Healthcare Innovation. Unleashing innovation: excellent healthcare for Canada. Ottawa: Health Canada; 2015 July. Available: http://www.healthycanadians.gc.ca/publications/health-system-systeme-sante/report-healthcare-innovation-rapport-soins/index-eng.php (accessed 2015 Jun 17).
27 Ambrose, Hon. Rona, Minister of Health. Correspondence from Hon. Rona Ambrose, Minister of Health, to CMA President Dr. Christopher Simpson, 2015 July 10. 28 Veterans Affairs Canada. 2013–14 Department Performance Report. Ottawa: Veterans Affairs Canada; 2014. Available:
http://www.veterans.gc.ca/pdf/deptReports/dpr-rmr/2013-2014/vac-acc-web-pdf-eng.pdf (accessed 2015 Aug 4). 29 Department of National Defence, Canadian Armed Forces. Report on plans and priorities 2015–2016. Ottawa: Department of National Defence; 2015. p. 89. Available:
http://www.forces.gc.ca/en/about-reports-pubs-report-plan-priorities/2015-toc.page (accessed 2015 Aug 4). 30 Correctional Service Canada 2013–14 Departmental Performance Report. Ottawa: Correctional Service Canada; 2014. p. 30. Available:
http://www.csc-scc.gc.ca/publications/005007-4500-2013-2014-eng.shtml (accessed 2015 Aug 4). 31 Citizenship and Immigration Canada. Departmental Performance Report for the period ending March 31, 2014. Ottawa: Citizenship and Immigration Canada; 2014.
Available: http://www.cic.gc.ca/english/resources/publications/dpr/2014/dpr.asphttp://www.cic.gc.ca/english/pdf/pub/dpr-2014.pdf (accessed 2015 Aug 4). 32 Treasury Board of Canada Secretariat. 2013–14 Part III – departmental performance reports (DPR). Ottawa: Treasury Board of Canada Secretariat; 2014. Available:
www.tbs-sct.gc.ca/dpr-rmr/2013-2014/index-eng.asp#N (accessed 2015 Aug 4).
11 Eliminating Code Gridlock in Canada’s Health Care System // 2015 Wait timE allianCE REpoRt CaRd
The reports contain no historical data with which to compare current performance. A section called “Performance Analysis and Lessons Learned” accompanies the results but often lacks important detail. For example, Citizenship and Immigration Canada’s analysis of the percentage of clients who received services for public health and public safety concerns indicates that data are captured on eight conditions but it neglects to list those conditions; it only mentions the number receiving health services via IFHP.25
Since 2012, the IFHP program has undergone a number of changes resulting in less access to care for many refugee claimants. While a federal court decision calling the cuts cruel and unusual treatment did force a reversal of many of the program changes, reports from the frontlines confirm there remains confusion among patients and providers alike over program eligibility, which contributes to access issues.
The recent report of the Truth and Reconciliation Commission of Canada contains 94 recommendations, of which seven relate to health. The commission calls on the federal government to consult with Aboriginal peoples to “establish measurable goals to identify and close the gaps in health outcomes between Aboriginal and non-Aboriginal communities”; this is to include annual progress reports and an assessment of long-term trends.33
An example of one of the many such issues needing attention was revealed in a recent Auditor General of Canada report that examined whether “Health Canada had reasonable assurance that eligible First Nations individuals living in remote communities in Manitoba and Ontario had access to clinical and client care services and medical transportation benefits.”34 The conclusion reached was that Health Canada did not have the assurances it needed to confirm such services were available.
tablE 3. departmental performance reports32 – 2013–14
Expected result Performance indicator Targets Actual results
Health and safety of First Nations and Inuit improved
Percentage of First Nations adults reporting being in excellent or very good health
45% by March 31, 201744.1% of individuals 18 years and older
Percentage of Inuit adults reporting being in excellent or very good health
50.5% by March 31, 201742.1% of individuals 18 years and older
Eligible clients receive urgent and essential health services that reduce risks to Canadian public health and safety
Percentage of refugee claimants who received an immigration medical examination funded by the IFHP
100% 93%
Percentage of clients eligible for coverage who receive vaccinations or immunizations through the IFHP
100% 0.05%
Percentage of clients who obtain health services for public health and public safety conditions relative to the number of clients identified in the immigration medical assessment as constituting public health and public safety risks
100% 95.4%
Clinical health services are available to all offenders in institutions in accordance with professionally accepted standards
Percentage of newly admitted offenders receiving nursing assessment within 24 hours of initial reception
94% 98.2%
Percentage of offenders receiving comprehensive nursing assessment within 14 days of admission to Correctional Service Canada
75% 96.5%
Source: Treasury Board of Canada Secretariat
33 Truth and Reconciliation Commission of Canada. Calls to action. Winnipeg: The Commission; 2015 June 2. p. 27. Available: http://www.trc.ca/websites/trcinstitution/File/2015/Findings/Calls_to_Action_English2.pdf (accessed 2015 Jun 19).
34 Office of the Auditor General of Canada. Report 4 – Access to health services for remote First Nations communities. Spring 2015. Reports of the Auditor General of Canada. Ottawa: Office of the Auditor General of Canada; 2015. p. 2. Available: http://www.oag-bvg.gc.ca/internet/docs/parl_oag_201504_04_e.pdf (accessed 2015 Aug 3).
12 Eliminating Code Gridlock in Canada’s Health Care System // 2015 Wait timE allianCE REpoRt CaRd
Indeed, as the Advisory Panel on Healthcare Innovation recently pointed out, “First Nations living both on and off reserve must traverse a patchwork of health systems that includes multiple federal departments (Health Canada, Aboriginal Affairs and Northern Development Canada), provincial/territorial governments, and sometimes inter-provincial/territorial health authorities. The result is that the endemic lack of coordination in Canada’s healthcare systems is exacerbated by jurisdictional ambiguity and inconsistencies.”35
Another group that experiences difficulties is the families of Canadian military personnel. Members of the military move on a fairly regular basis, meaning that their families (who are not covered by the Armed Forces’ health care plan) can face considerable challenges in finding a physician with each new posting, particularly if they are moving to a new province. Organizations like the Canadian Medical Association have been providing assistance where they can to help families connect with a physician when they relocate.36 To date, over 50 family physicians have answered the call in four provinces.
In his recent report, Veterans Ombudsman Guy Parent said that “the gap between Veterans’ programs and Veterans’ needs has been narrowed but not closed.”37 He noted a range of issues still requiring attention, including the
continuum of care received by veterans, the need to link the long-term care, assisted living, and independence programs, the non-economic reparation for pain and suffering, and many more.
WTA recognizes that many of the populations falling under federal jurisdiction receive care from provincial and territorial health care systems to varying degrees. Nevertheless, system quality performance metrics, including timely access to care, should be regularly reported and used for the purposes of improved system accountability and quality improvement.
Future role of the federal government in reducing wait timesAs a significant provider of funds to the provinces and territories and as a major manager of health services to its clients, the federal government has an interest in seeing wait times reduced, as do all Canadians. Since 2004 the federal government has contributed to reducing provincial wait times through funding in the Health Accord, through the appointment of a federal advisor on wait times and by lending support to create a patient wait-time guarantee in each province and territory.38
The Senate Standing Committee on Social Affairs, Science and Technology, in reviewing the 2004 Accord, found that significant progress had been made in reducing wait times. The committee also recognized that federal government leadership was needed to encourage a review of the
“First Nations living both on and off reserve must traverse a patchwork of health systems that includes multiple federal departments, provincial/territorial governments, and sometimes interprovincial/territorial health authorities.”
— Advisory Panel on Healthcare Innovation, 2015
Organizations like the Canadian Medical Association have been providing assistance where it can to help military families connect with a physician when they relocate.
35 Advisory Panel on Healthcare Innovation. Unleashing innovation: excellent healthcare for Canada. Ottawa: Health Canada; 2015 July. Available: http://www.healthycanadians.gc.ca/publications/health-system-systeme-sante/report-healthcare-innovation-rapport-soins/index-eng.php (accessed 2015 Jul 17).
36 Sullivan P. Family physicians sought to help nomadic military families get medical care [news release]. Ottawa: Canadian Medical Association; 2015 Apr 28. Available: https://www.cma.ca/En/Pages/fps-sought-to-help-nomadic-military-families-get-medical-care.aspx (accessed 2015 Aug 3).
37 Parent G. My five years as veterans ombudsman – narrowing the gap for veterans and their families. 2010–2015. Ottawa: Veterans Ombudsman; 2015 July. p. 39. Available: http://www.ombudsman-veterans.gc.ca/eng/about-us/ombudsman/guyparent-2010-2015 (accessed 2015 Aug 4).
38 Wait Time Alliance. Position paper on the occasion of the 10th anniversary of the 2004 10-Year Plan to Strengthen Health Care in Canada. Timely access to care for all Canadians: the role of the federal government. Ottawa: The Alliance; 2014 Sept 23. Available: http://www.waittimealliance.ca/wta-reports/federal-role-health-care-wait-times-in-canada/ (accessed 2015 Aug 4).

13 Eliminating Code Gridlock in Canada’s Health Care System // 2015 Wait timE allianCE REpoRt CaRd
current wait-time benchmarks, create benchmarks in new
areas of specialty care and develop a cross-Canada vision
statement that crafts a culture of patient-centred care
across the nation.39
More recently, the Advisory Panel on Healthcare Innovation
recommended in its report that Ottawa needs to provide a
“different model for federal engagement in health care—
one that depends on an ethos of partnership, and on a
shared commitment to scale up existing innovations and
make fundamental changes.”40
The importance of the federal government’s involvement
and leadership in helping to reduce wait times will grow in
significance as our population continues to age.41 Statistics
Canada reports that, for the first time, there were more
people aged 65 years and older than there were children
aged 0–14 years.42 As seniors age the likelihood that they
will develop multiple chronic conditions escalates, which
means that there will be a demand for more and more
resources and increased stress on wait times.
The federal government can lead in the development of
a robust national seniors strategy that will reduce waste,
ease costs and improve access through the coordination of
complex care in the community instead of in an expensive
hospital setting. It can also help ensure comparable levels
of service across the country. The commitment to meeting
and negotiating a new health accord with the provinces
and territories is an excellent place to start the process.
39 Standing Senate Committee on Social Affairs, Science and Technology. Time for transformative change: a review of the 2004 Health Accord. Ottawa: Senate of Canada; 2012 March. Available: www.parl.gc.ca/content/sen/committee/411/soci/rep/rep07mar12-e.pdf (accessed 2015 Oct 27).
40 Advisory Panel on Healthcare Innovation. Unleashing innovation: excellent healthcare for Canada. Ottawa: Health Canada; 2015. Available: http://www.healthycanadians.gc.ca/publications/health-system-systeme-sante/report-healthcare-innovation-rapport-soins/index-eng.php (accessed 2015 Jul 17).
41 For more on how the federal government can play a leadership role, see Health Action Lobby. The Canadian way: accelerating innovation and improving health system performance. A consensus statement by the Health Action Lobby. 2014 Dec. Available: http://healthactionlobby.ca/images/stories/publications/2014/HEAL_TheCanadianWay_EN_NoEmbargo.pdf (accessed 2015 Nov 15 Nov).
42 Statistics Canada. Canada’s population estimates: age and sex, July 1, 2015. The Daily 2015 Sept 29. Available: http://www.statcan.gc.ca/daily-quotidien/151102/dq151102c-eng.htm (accessed 2015 Sep 29).