Embed Size (px)
Citation preview

ELIKHULU PROJECT PRESENTATION DECEMBER 2016

2
PRESENTATION STRUCTURE
• Project overview
• Mineral resources and reserves
• Project design • Environmental and social impact
• Project execution plan
• Financial overview

PROJECT OVERVIEW
4
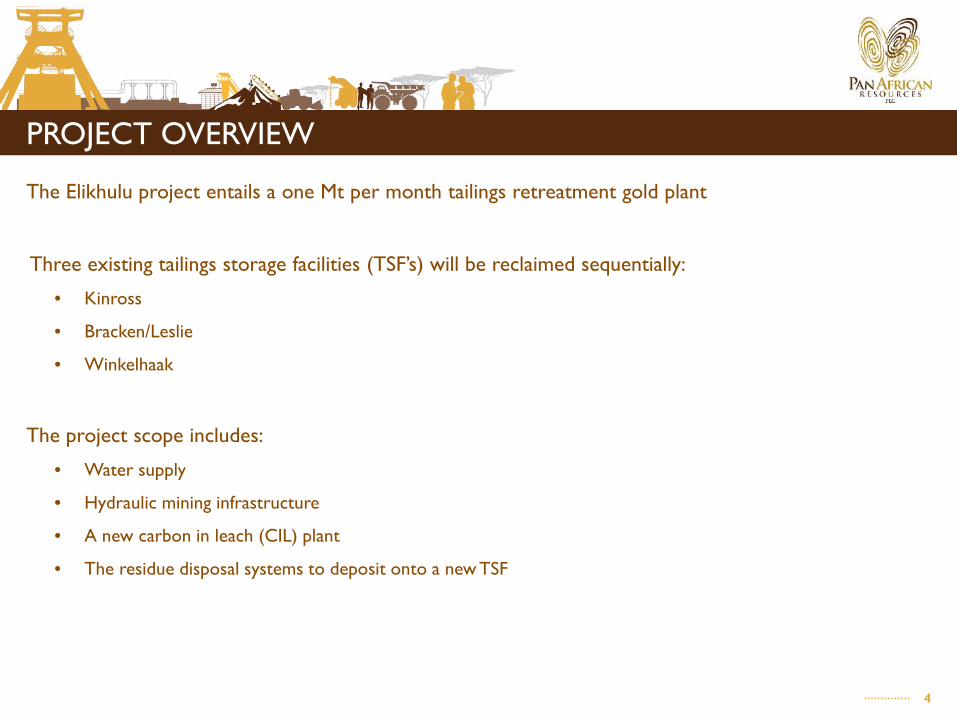
PROJECT OVERVIEW
The Elikhulu project entails a one Mt per month tailings retreatment gold plant
Three existing tailings storage facilities (TSF’s) will be reclaimed sequentially:
• Kinross
• Bracken/Leslie
• Winkelhaak
The project scope includes:
• Water supply
• Hydraulic mining infrastructure
• A new carbon in leach (CIL) plant
• The residue disposal systems to deposit onto a new TSF

5
PROJECT OVERVIEW

6
PROJECT TIMING
The major project milestone dates are listed below:
• Detail engineering starts Quarter 4 2016
• Procurement starts Quarter 2 2017
• Environmental and Social Impact Assessment approval Quarter 3 2017
• Issue of Integrated Water Usage Licence Quarter 3 2017
• Construction start* Quarter 3 2017
• Construction complete Quarter 3 2018
• Process plant cold commissioning complete Quarter 4 2018
• Process plant hot commissioning complete Quarter 4 2018
• Commercial production achieved Quarter 4 2018
• Phase 2 hydraulic mining – Leslie TSF begins Quarter 4 2021
• Phase 3 hydraulic mining – Winkelhaak TSF begins
Note:
* Dependant on environmental approvals
Quarter 3 2026
MINERAL RESOURCES AND RESERVES

8
MINERAL RESOURCES A mineral resources statement in accordance with SAMREC guidelines was completed by SRK in December 2015
Mineral Resources Statement – TSF’s (Indicated)
TSF Name Tonnes (Mt)
Au (g/t)
Au (kg)
Au (Moz)
Kinross 52.67 0.31 16 568 0.533
Bracken/Leslie 70.07 0.32 22 178 0.713
Winkelhaak 69.94 0.24 16 994 0.546
Total 192.69 0.29 55 739 1.792
Mineral Resources Statement – Soil Material (Inferred)
TSF Name Tonnes (Mt)
Au (g/t)
Au (kg)
Au (oz)
Kinross 9.23 0.33 3 045 97 914
Bracken/Leslie 8.02 0.27 2 148 69 064
Winkelhaak 4.57 0.53 2 408 77 420
Total 21.83 0.33 7 601 244 398

9
MINERAL RESERVES
A SAMREC Mineral Reserves Estimate was reported by DRA in October 2016
The SRK resource statement was amended for depletion of the Kinross TSF by the ETRP and the Kinross material left as new TSF starter wall
Mineral Reserves Estimation – All Probable
TSF Name Tonnes (Mt)
Au (g/t)
Au (Moz)
Kinross 47.0 0.31 0.47
Bracken/Leslie 70.1 0.32 0.71
Winkelhaak 70.0 0.24 0.55
Total 187.1 0.29 1.73

PROJECT DESIGN

11
PROJECT - FLOWSHEET
The flow sheet selected in the Elikhulu plant design is as follows:

12
HYDRAULIC MINING • Same mining method as the existing ETRP operations
• Combined hydraulic mining will produce 1.16 Mtpm (0.2 Mtpm to ETRP and 0.96 Mtpm to Elikhulu together with the 0.04 Mtpm of RoM tailings, Elikhulu total throughput is 1 Mtpm)
13
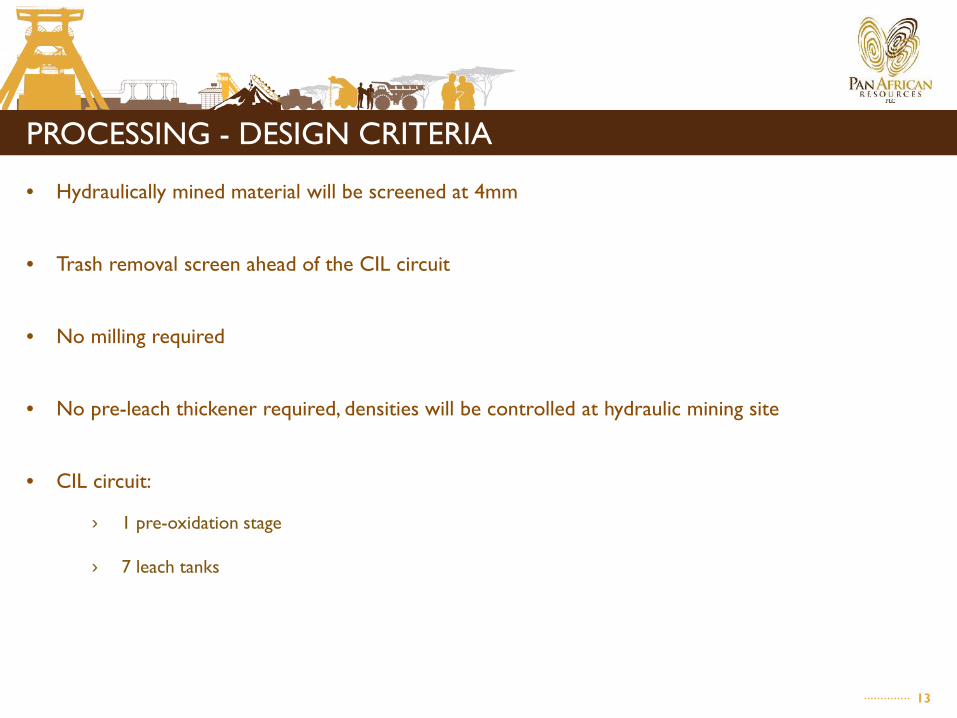
PROCESSING - DESIGN CRITERIA
• Hydraulically mined material will be screened at 4mm
• Trash removal screen ahead of the CIL circuit
• No milling required
• No pre-leach thickener required, densities will be controlled at hydraulic mining site
• CIL circuit:
› 1 pre-oxidation stage
› 7 leach tanks

14
PROCESSING - TEST WORK
• The Elikhulu resource has a long history of metallurgical test work
• Test work conducted by SGS was used as the design basis (15 samples from Kinross, 21 samples from
Bracken/Leslie and 16 samples from Winkelhaak)
• The ETRP operation is achieving planned recoveries as predicted by the test work and serves as a “big pilot
plant”
• Additional test work conducted by Mintek and Maelgwyn confirm:
› CIL process appropriate
› Fast Leaching Ore (kinetics / retention time)
› Reagent consumptions
› Recovery ranges
• Design assumptions, recoveries and process design criteria reviewed by PAR and a suitably qualified
independent consultant

15
PROCESSING – SGS TEST WORK RESULTS
TSF Name Reserve
Tonnages (Mt)
Gold Recoveries per Laboratory Tests
(%)
Carbon and Solution Losses
(%)
Overall consensus recovery
(%)
Kinross 47.0 51.7 3.1 48.6
Bracken/Leslie 70.1 47.2 3.4 43.8
Winkelhaak 70.0 54.7 4.1 50.6
Total 187.1 51.4 3.6 47.8

16
TSF - DESIGN
TSF design was done to maximize tailings deposition on selected site. Highlights of this design are as
follows:
• Cyclone deposition has been selected
• Typical industry rates of rise of 4 – 5 m/yr
• Design rate of rise is 4.5 m/yr
• Initial deposition rate of 1.0 Mt/mth
• ETRP tailings deposition to continue on Winkelhaak (4 years)
• Thereafter the TSF deposition rate onto the new footprint increases to 1.25 Mt/mth to include ETRP
and ROM tailings

17
TSF - SITE SELECTION

18
TSF CAPACITY
• The current TSF design can accommodate 168 Mt (11 years)
• LOM tailings tonnages of 181.2 Mt will be deposited (157.0 Mt ex Elikhulu and 24.2 Mt ex ETRP)
• Options to increase the total deposition capacity:
› During detail engineering optimise the existing footprint to increase capacity
› The Bracken/Leslie TSF footprint can also be re-used – will be available after hydraulic mining of this TSF

19
PROCESS WATER
TOTAL WATER REQUIREMENT 15.2 Ml/day
• Water sourced directly from underground (6.7 Ml/day)
• Make-up water from Leeuwpan evaporation dam (8.5 Ml/day)
› Leeuwpan is situated approximately 10 km south-west of the Kinross TSF
› Pumped via the existing Leslie holding dam pipeline
› A new pump station will be installed at the holding dam to pump the make-up water to the process plant
› A detailed water balance and survey of Leeuwpan confirms adequate supply

20
POWER SUPPLY
Installed capacity sufficient for the life of the project
Notes: Phase 1 – Kinross mining operation Phase 2 – Bracken/Leslie mining operation Phase 3 – Winkelhaak mining operation
Description Installed Power Running Power
MVA MW MVA
Total Project Phase 1 22.1 9.9 16.6
Total Project Phase 2 23.1 10.2 17.3
Total Project Phase 3 23.1 10.2 17.4

EMPLOYEES

22
EMPLOYEES
The total number of employees once in full production will be 245
Process Plant
Management 1
Process 39
Engineering 22
Materials management 1
Administration 2
Services 2
Total 67
Hydraulic Mining (HM) and Deposition Operations (DO)
HM DO
General workers and operators 74 89
Supervisors 4 4
Site manager 2 1
Safety manager 1 1
Elikhulu manager 1 1
Total 82 96

PRODUCTION PROFILE
24
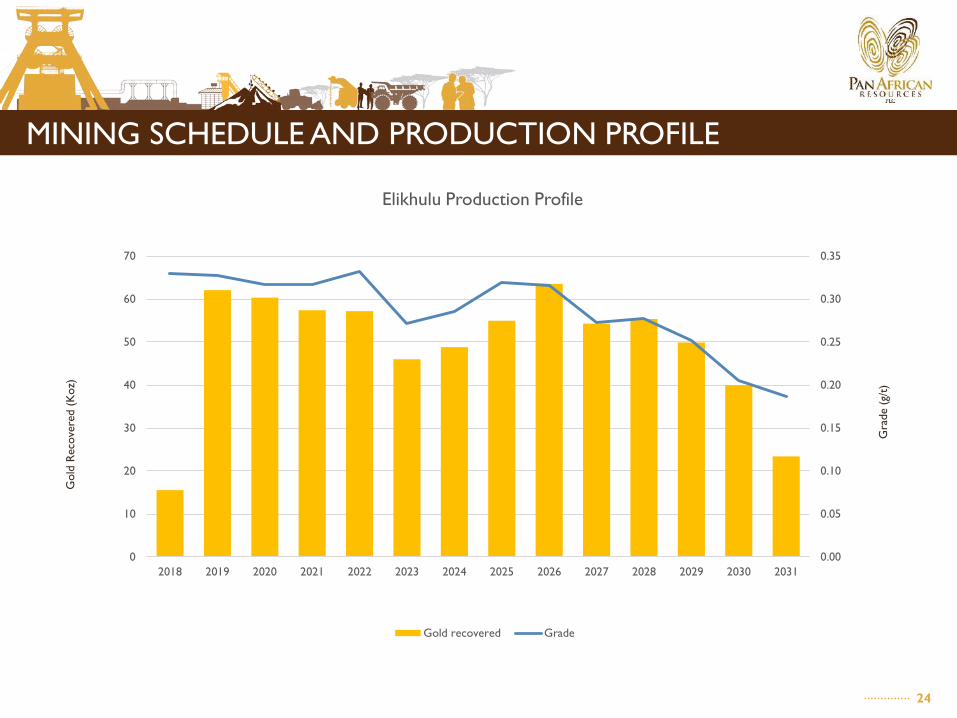
MINING SCHEDULE AND PRODUCTION PROFILE
0.00
0.05
0.10
0.15
0.20
0.25
0.30
0.35
0
10
20
30
40
50
60
70
2018 2019 2020 2021 2022 2023 2024 2025 2026 2027 2028 2029 2030 2031
Elikhulu Production Profile
Gold recovered Grade
Gol
d Re
cove
red
(Koz
)
Gra
de (g
/t)

25
L.O.M PRODUCTION SCHEDULING RESULTS SUMMARY
Unit Total ETRP Elikhulu
Tailings Treated * Mt 193.2** 36.1 157.0
Average feed grade g/t Au 0.29 0.29 0.29
Ounces mined Moz 1.79 0.35 1.44
Ounces recovered Moz 0.86 0.17 0.69
L.O.M Years 13 13 13
Notes: * Excludes soil material – inferred resources (0.2 Moz) ** Includes fines from current arisings

ENVIRONMENTAL AND SOCIAL IMPACT

27
ENVIRONMENTAL AND SOCIAL IMPACT • Environmental Impact Assessment process
• The Environmental Impact Assessment process has been kicked off and Department of Mineral Resources approval is expected by Quarter 3 2017
• Activities completed as of 1December 2016:
› Background information document (bid) - was issued to the Department of Mineral Resources
› Pre-application meeting with the Department of Mineral Resources on 29 August 2016
› NEMA application submitted on 21 September 2016
› Scoping report has been issued to the Department of Mineral Resources
› 1ST Public participation meeting was held on 19 October 2016
› Other than dust baseline study all required specialist studies have been completed

28
ENVIRONMENTAL AND SOCIAL IMPACT
The Integrated Water Usage License application process has kicked off and Department of
Water Affairs approval is expected by Quarter 3 2017
Activities that have been completed as of 1 December 2016:
• Pre-application meeting was held with the Department of Water Affairs on 6 October 2016
• The required specialist studies have been completed

PROJECT EXECUTION PLAN

30
PROJECT EXECUTION PLAN • A PEP is the processes and strategies to be employed by PAR and the project management team to
ensure the project is completed on time and that the facilities designed and constructed will satisfy the project functional requirement
• The PEP addresses the following:
› Project organisation and staffing
› Project controls
› Project management
› Engineering scope and deliverables
› Construction
› Operational readiness
› Safety, environmental and sustainable development
› Procurement and contracting
› Document control and records

31
KEY ROLE PLAYERS
The key role players in executing the project are:
• Pan African Resources Owner’s Team
• DRA Projects SA Team for EPC
• Cabanga Concepts as the Environmental Assessment Practitioner
• EXM Advisory Services for Water Usage License Application
• SLR Consulting for the new TSF Design
• Department of Mineral Resources and Department of Water Affairs for Regulatory approval

32
TARGET PRICE CONTRACTING PHILOSOPHY
• PAR will execute the project through a “target price” contracting philosophy
• This contracting philosophy is based on a shared risk/reward basis and is essentially executed on a
cost plus basis with a variable DRA Projects SA fee, capped at 4% of the project value
• Any savings on the target price (R1.548 Bn) during implementation would be shared as follows:
› 50% of the savings to PAR
› 30% to DRA Projects SA. Any payment made to DRA Projects SA from savings is capped at 2% of the project value
› 20% to be used to fund other project incentives (schedule, quality, safety etc.)
• Any project over runs are carried 50:50 between PAR and DRA Projects SA and the DRA Projects
SA portion deducted from their 4% fee (over run is capped at 4 %)
• Based on an open book approach by DRA Projects SA, the direct involvement of the PAR technical
team and a suitably qualified independent consultant - PAR is satisfied with the project design and
associated costs

FINANCIAL OVERVIEW
34
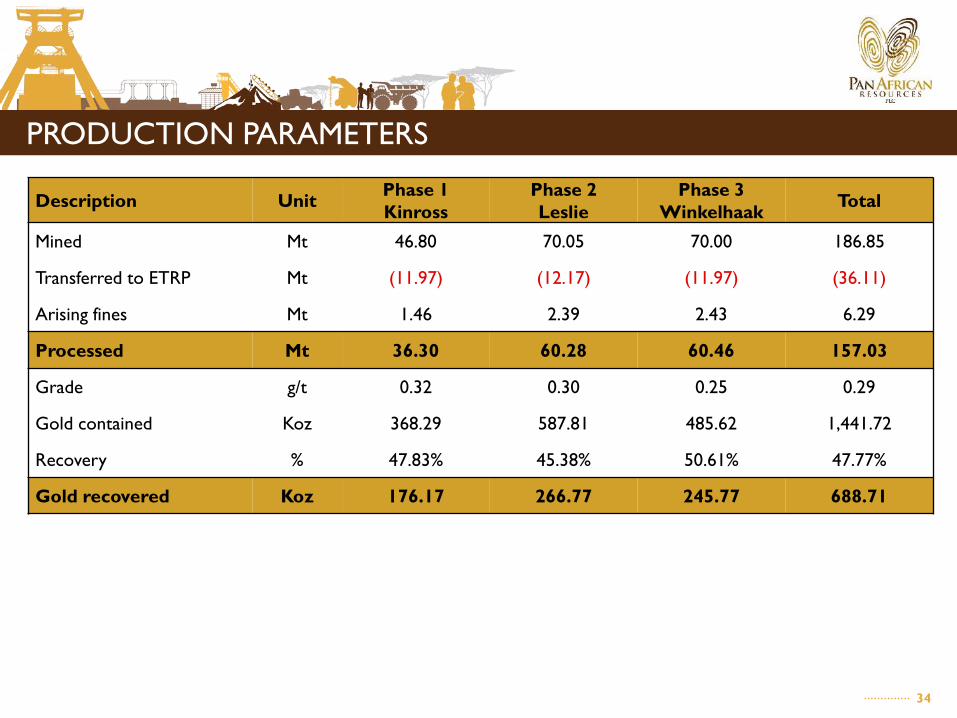
PRODUCTION PARAMETERS
Description Unit Phase 1 Kinross
Phase 2 Leslie
Phase 3 Winkelhaak Total
Mined Mt 46.80 70.05 70.00 186.85
Transferred to ETRP Mt (11.97) (12.17) (11.97) (36.11)
Arising fines Mt 1.46 2.39 2.43 6.29
Processed Mt 36.30 60.28 60.46 157.03
Grade g/t 0.32 0.30 0.25 0.29
Gold contained Koz 368.29 587.81 485.62 1,441.72
Recovery % 47.83% 45.38% 50.61% 47.77%
Gold recovered Koz 176.17 266.77 245.77 688.71

35
CAPITAL COSTS
R’million Phase 1 - Kinross
Phase 2 - Leslie
Phase 3 - Winkelhaak Total
Process Plant 683.18 - - 683.18
TSF 707.78 138.38 - 846.17
Overland Piping 75.76 29.76 47.94 153.46
Hydraulic Mining 56.58 125.90 58.43 240.91
Design & development 91.21 18.99 6.63 116.83
Pre-production costs 24.51 - - 24.51
PAR Contingency 100.00 - - 100.00
Sub-total 1,739.02 313.03 112.99 2,165.04
Sustaining capital 831.60
Hydraulic mining 18.93
Process plant 812.67
Total 2,977.71

36
OVERALL COST ANALYSIS
Description R’million R/t R/oz US$/oz
Remining 742.97 4.73 1,078.79 74.40
Tailings deposition 300.62 1.91 436.49 30.10
Processing 3,357.56 21.38 4,875.14 336.22
Refining 21.42 0.14 31.10 2.14
G&A 77.50 0.49 112.53 7.76
Sub-total 4,500.06 28.66 6,534.05 450.62
Cost recoveries (106.02) (0.68) (153.93) (10.62)
Sub-total 4,394.05 27.98 6,380.11 440.01
Sustaining capital 831.59 5.30 1,207.46 83.27
Royalties 35.23 0.22 51.15 3.53
Sub-total 5,260.87 33.50 7,638.72 526.81
Debt(1) 1,088.86 17.89 4,017.78 277.09
Total 6,349.73 51.39 11,656.50 803.90
(1) Includes tonnes and ounces for the period whilst the debt is in existence only

37
FREE CASH FLOW
R’million 31-Dec-17 31-Dec-18 31-Dec-19 31-Dec-20 31-Dec-21 31-Dec-22 Thereafter Total
Revenue - 265.91 1,061.92 1,032.06 981.95 978.40 7,461.45 11,781.70 Operating costs - (83.41) (332.55) (335.72) (339.37) (336.75) (2,966.24) (4,394.05) Capital costs (704.04) (1,051.07) (64.38) (168.72) (273.07) (64.38) (670.96) (2,996.64) Royalties & Tax - (0.24) (0.96) (0.93) (46.43) (175.87) (1,160.70) (1,385.13) Total (704.04) (868.81) 664.03 526.69 323.08 401.40 2,663.55 3,005.88

38
INVESTMENT METRICS
Description US$ 1,180/oz @ R 14.50:US$ 1 US$ 1,250/oz @ R 14.50:US$ 1 Project NPV • 7% R 1,386 million R 1,681 million • 8% R 1,232 million R 1,509 million • 9% R 1,091 million R 1,352 million • 10% R 963 million R 1,209 million
Project RATIRR% 23.1% 26.1% Payback (post commissioning) 41 months 37 months Peak debt ratio 53% 53% Shareholder RATIRR% 34.3% 39.5%

39
SENSITIVITY ANALYSIS @ US$ 1,180/OZ + R 14.50:US$ 1 + 9% REAL DISCOUNT RATE
R’million -20% -10% Base case +10% +20%
Gold price / R:US$ / Recoveries 182 637 1,091 1,543 1,975
Operating costs 771 936 1,091 1,246 1,401
Capital costs 726 906 1,091 1,265 1,447
% -20% -10% Base case +10% +20%
Gold price / R:US$ / Recoveries 15.7% 25.1% 34.3% 42.9% 51.1%
Operating costs 27.9% 31.1% 34.3% 37.4% 40.3%
Capital costs(1) 23.2% 28.0% 34.3% 42.5% 57.7%
NPV
SHAREHOLDER RATIRR%
(1) Impact magnified as impacts effective debt ratio too (given that debt fraction is fixed at R1 billion)

THANK YOU

DISCLAIMER This presentation is provided on a confidential basis. The name 'Presenter' refers to Pan African Resources PLC and its advisors, subsidiaries or affiliated companies. This presentation has not been filed, lodged, registered or approved in any jurisdiction and recipients of this document should keep themselves informed of and comply with and observe all applicable legal and regulatory requirements. Statements or assumptions in this presentation as to future matters may prove to be incorrect. The Presenter makes no representation or warranty as to the accuracy of such statements or assumptions. Circumstances may change and the contents of this presentation may become outdated as a result, and the Presenter has no obligation to update the presentation or correct any inaccuracies or omissions in this presentation. Recipients should not treat this presentation as advice relating to legal, taxation or investment matters and are advised to consult their own professional advisers. This presentation may not be reproduced in whole or in part, nor may any of its contents be divulged to any third party without the prior consent in writing of the Presenter. The recipient acknowledges that neither it nor the Presenter intends that the Presenter act or be responsible as a fiduciary to the recipient, its management, stockholders, creditors or any other person. Each of the recipient and the Presenter, by accepting and providing this presentation respectively, expressly disclaims any fiduciary relationship and agrees that the recipient is responsible for making its own independent judgments with respect to any transaction and any other matters regarding this presentation. Furthermore, the information contained in this presentation may also qualify as “inside information” as defined in the Securities Services Act, 36 of 2004 (“SSA”). In terms of the SSA, it is a criminal offence for a person who knows that he or she has inside information to –
• deal directly or indirectly or through an agent for his or her own account, or for the account of another person, in listed securities to which the inside information relates; • disclose the inside information to another other than in the proper course of a person’s employment, profession or duties; and • encourage or cause another person to deal or discourage or stop another person from dealing in the listed securities to which the inside information relates.
The Presenter makes no representations as to the actual value which may be received in connection with a transaction nor the legal, tax or accounting effects of consummating a transaction. Unless the expressly contemplated hereby, the information in this presentation does not take into account the effects of a possible transaction or transactions involving an actual or potential change of control, which may have significant valuation and other effects. The Presenter shall not have any liability for any loss suffered due to reliance being placed on this presentation the information contained herein or the oral presentations referred to. Furthermore, the information contained in this presentation may also qualify as “inside information” as defined in the Market Abuse Regulation (“MAR”). It is a breach of MAR where a person possesses inside information and : • uses that information by acquiring or disposing of, for its own account or for the account of a third party, directly or indirectly, financial instruments to which that information relates; or • discloses that information to any other person, except where the disclosure is made in the normal exercise of an employment, a profession or duties This presentation is for information purposes only and does not constitute an offer or invitation to subscribe for or purchase any securities, and neither this presentation nor anything contained therein nor the fact of its distribution shall form the basis or be relied on in connection with or act as any inducement to enter into any contract or commitment whatsoever. Some or all of the information contained in these slides and this presentation (and any other information which may be provided) may be inside information relating to the securities of the Presenter within the meaning of the Criminal Justice Act 1993 and the Market Abuse Regulation (EU/596/2014) (“MAR”). Recipients of this information shall not disclose any of this information to another person or use this information or any other information to deal, or to recommend or induce another person to deal in the securities of the Presenter (or attempt to do so). Recipients of this information shall ensure that they comply or any person to whom they disclose any of this information complies with this paragraph and also with MAR. The term “deal” is to be construed in accordance with the Criminal Justice Act 1993 and with MAR. Recipients of these slides and the presentation should not therefore deal in any way in ordinary shares in the capital of the Presenter (“Ordinary Shares”) until the date of a formal announcement by the Presenter in connection with the preliminary results of the Presenter for the year ended 30 June 2016. Dealing in Ordinary Shares in advance of this date may result in civil and/or criminal liability. Neither these slides nor any copy of them may be taken or transmitted into the United States of America or its territories or possessions (“United States”), or distributed, directly or indirectly, in the United States, or to any U.S. Person as defined in Regulation S under the Securities Act 1933 as amended, including U.S. resident corporations, or other entities organised under the laws of the United States or any state of the United States, or non-U.S. branches or agencies of such corporations or entities. Neither these slides nor any copy of them may be taken or transmitted into or distributed in Canada, Australia, Japan, or the Republic of Ireland, or any other jurisdiction which prohibits such taking in, transmission or distribution, except in compliance with applicable securities laws. Any failure to comply with this restriction may constitute a violation of United States or other national securities laws.