Embed Size (px)
Citation preview

Elevating EHS Leading Indicators: From Defining to Designing
John DonyDirector, Campbell Institute
National Safety Council

Who is the National Safety Council?

A preventable death occurs every
F URMINUTES
The Crisis

PREVENTABLEDEATHSELIMINATINGIN OUR LIFETIME,
WE ARE COMMITTED
TO
Our Vision

OUR PRIORITIES CUT ACROSS ALL AREAS OF EVERYDAY LIFE
AT HOME & IN THECOMMUNITY
ON THE ROAD
ATWORK
Safety 24/7

Drug overdose is the leading cause of death;
Opioid use leading contributor
Employer engagement is the #1
channel to reach individuals on and off
the clock
Crashes are #1 cause of death
In the workplace and among young drivers
OUR PRIORITIES ARE BASED ON ACHIEVING THE GREATEST IMPACT
REDUCE OPIOID OVERDOSE
MOTOR VEHICLE SAFETY
EMPLOYERENGAGEMENT
Our Priorities

# of
Com
pani
es
EHS Performance
Compliance Driven
RiskDriven
SystemDriven
ValuesDriven
Workplace by the Numbers
The Global EHS Center of Excellence
Values-Driven Organizations

As of 10/15/2016
Participants
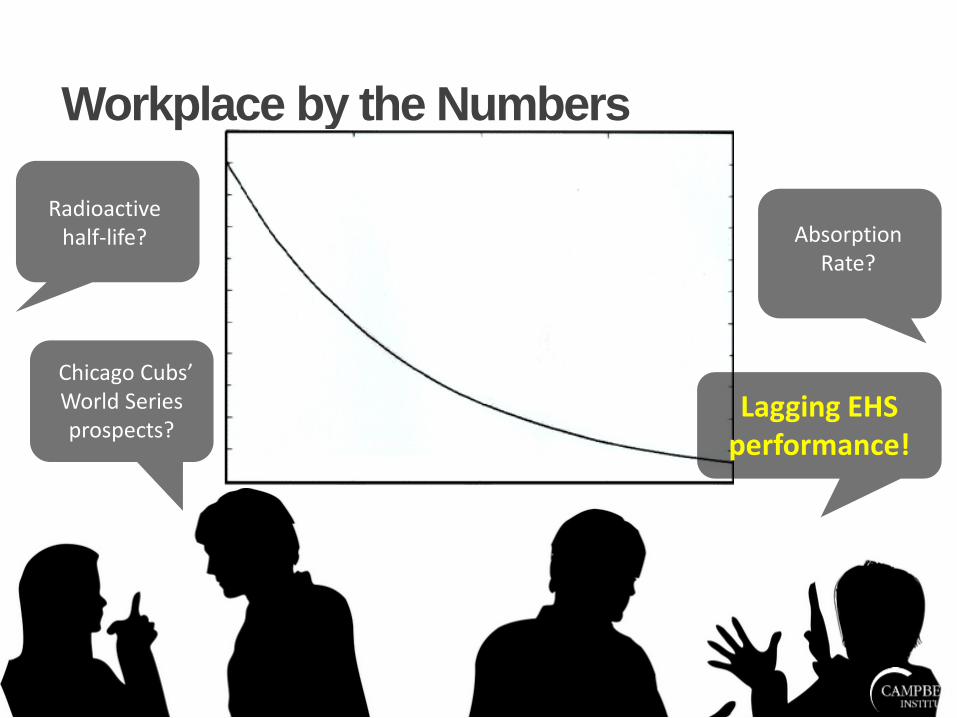
Workplace by the Numbers
Radioactive half-life?
Chicago Cubs’ World Series prospects?
Absorption Rate?
Lagging EHS performance!
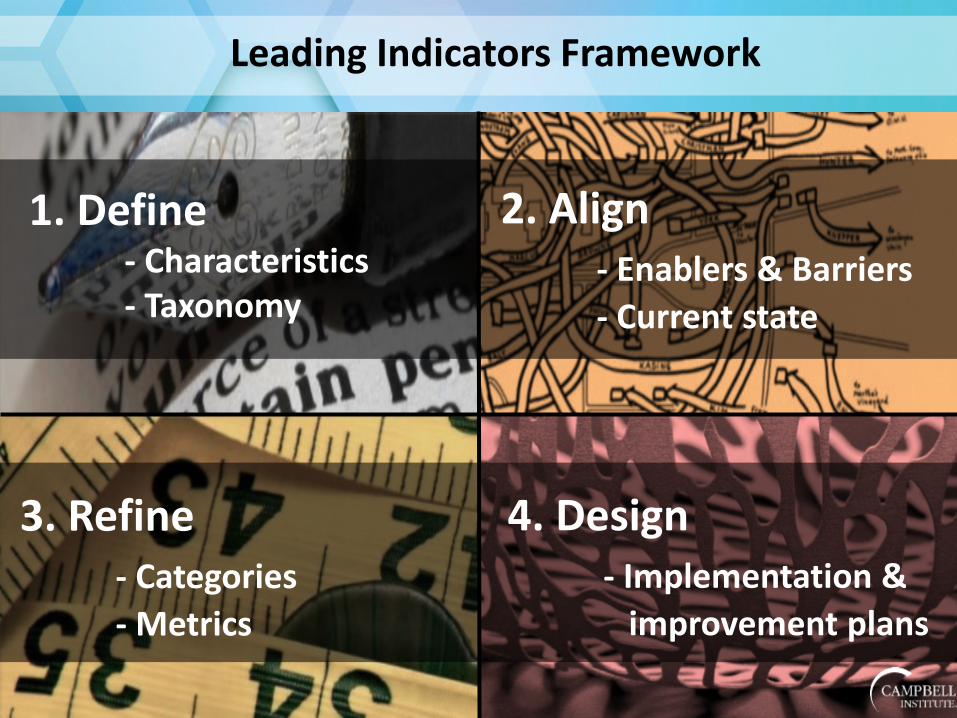
Leading Indicators Framework
1. Define- Characteristics- Taxonomy
2. Align- Enablers & Barriers- Current state
3. Refine- Categories- Metrics
4. Design- Implementation &
improvement plans

Mixed-Method Approach
Expert Panel Survey Workgroups Interviews

Leading indicator = proactive + preventive + predictive
A Definition

The Critical Characteristics
Robust Leading Indicators:• Actionable• Achievable• Explainable• Meaningful• Timely• Transparent• Useful• Valid

Enablers to Implementation
Executive buy-in (not technical knowledge)
Corporate-level roll-up and
tracking
Predictive value communicated & understood
Targeted collection toward
specific outcomes

Barriers to Implementation
Inability to develop consistently
actionable metrics
Continued C-suite reliance on
lagging indicators
Lack of reliable, consistent
relationship
Sporadic, infrequent, non-standard benchmarking

“What We Need is a Map!”

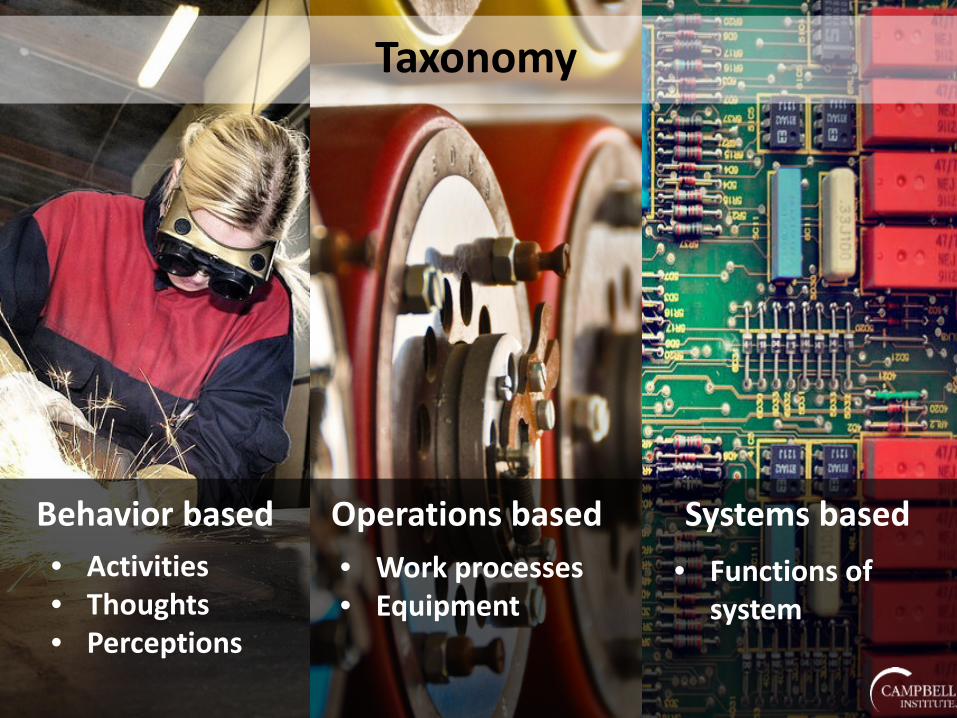
Taxonomy
Behavior based Operations based Systems based• Activities• Thoughts• Perceptions
• Work processes• Equipment
• Functions of system
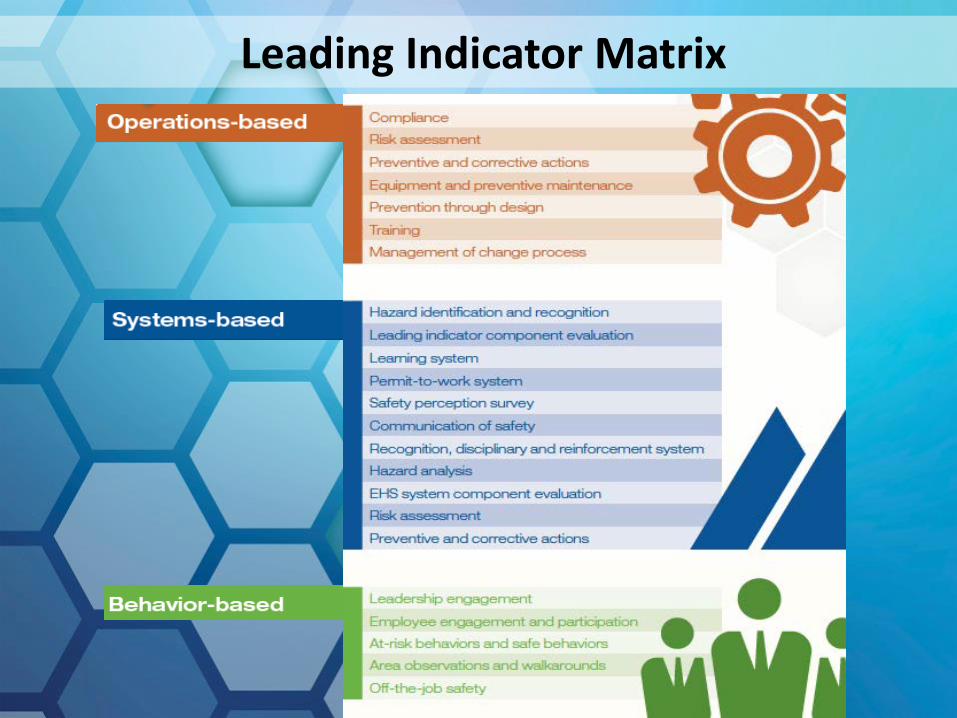
Leading Indicator Matrix

Leading Indicator Program Design
Choosing, tracking, & analyzing leading indicators
What is already being tracked?
The “bottom up” approach
Start simply and small
Does the indicator provide meaningful
information?

Leading Indicator Program Design
Gaining support; roles & responsibilities
Obtain leadership buy-in
Find the right pitch; hone the language
Involve multiple departments &
functions
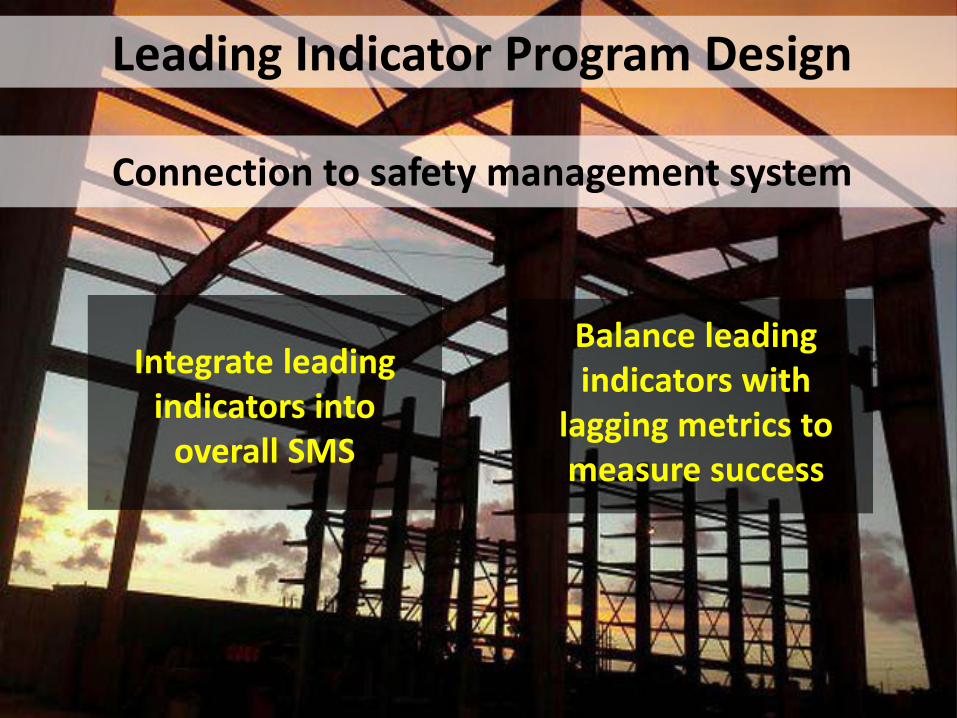
Leading Indicator Program Design
Connection to safety management system
Integrate leading indicators into
overall SMS
Balance leading indicators with
lagging metrics to measure success

Leading Indicator Program Implementation
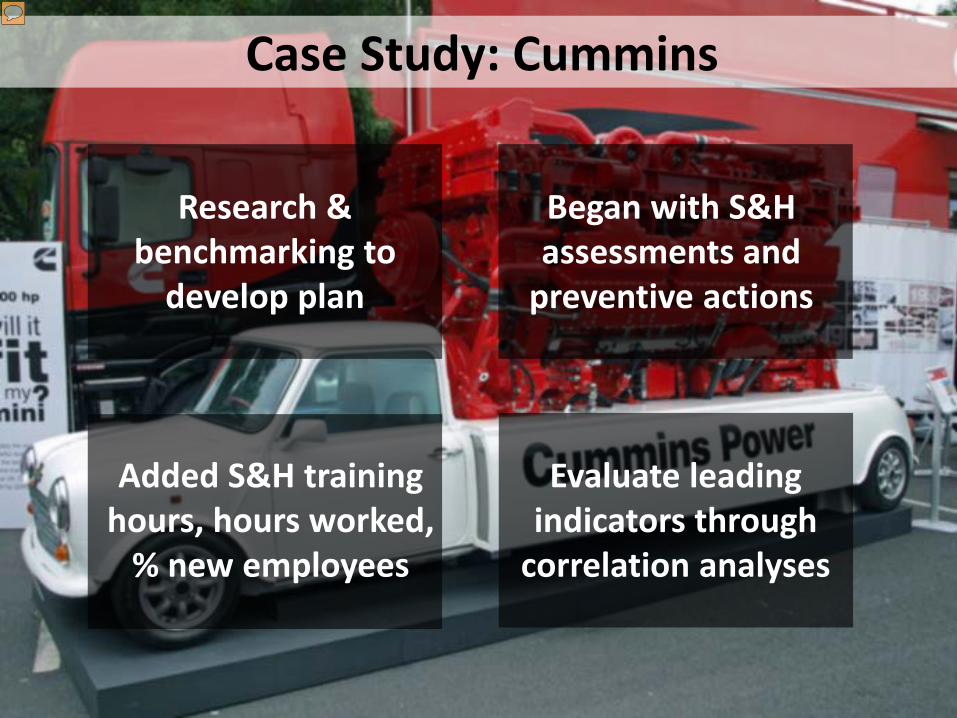
Case Study: Cummins
Research & benchmarking to
develop plan
Began with S&H assessments and
preventive actions
Added S&H training hours, hours worked,
% new employees
Evaluate leading indicators through
correlation analyses

Case Study: Schneider Electric
Started leading indicators at the site
level
Began tracking training hours
Started tracking effectiveness of
training
Celebrates leading indicator milestones
to gain support

Case Study: Owens Corning
Started with system of “yellow flags” for
soft risk
Began correlating yellow flags with lagging metrics
“Yellow flag” system basis for corporate leading indicators
Involves several functional areas to
build support
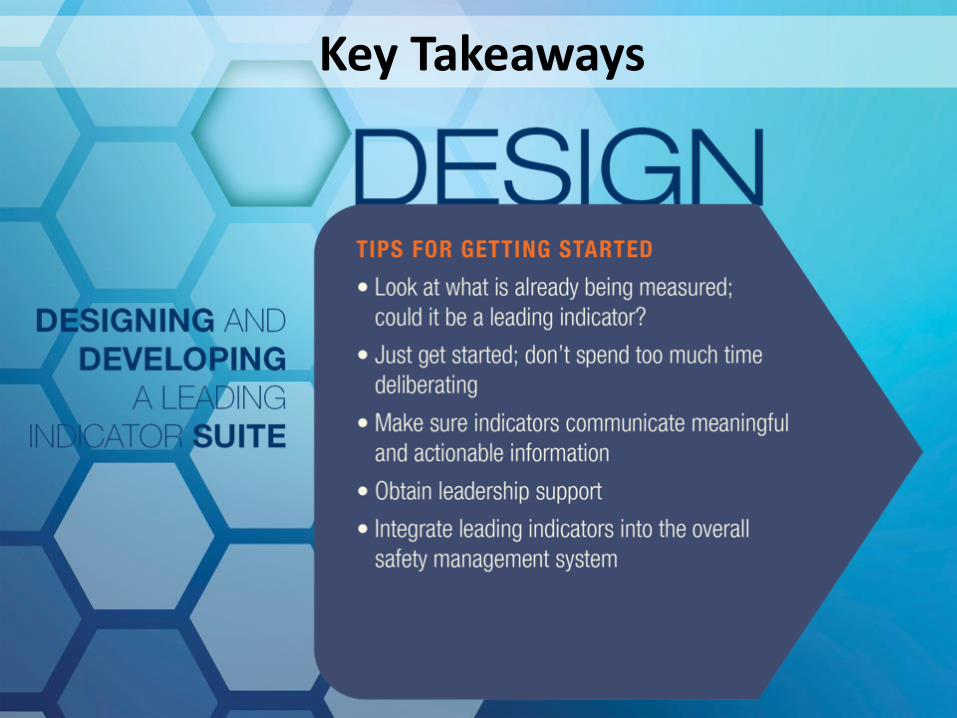
Key Takeaways

How can I use this research?
1. Lead with framework & taxonomy to start discussions
2. Pull real-life examples from Campbell Institute white papers
3. Find resources on the Campbell Library

Find the Institute’s Research
www.thecampbellinstitute.org/research

“Campbell Institute” @RWCInstitute

Finding 6: Leading Indicator Matrix
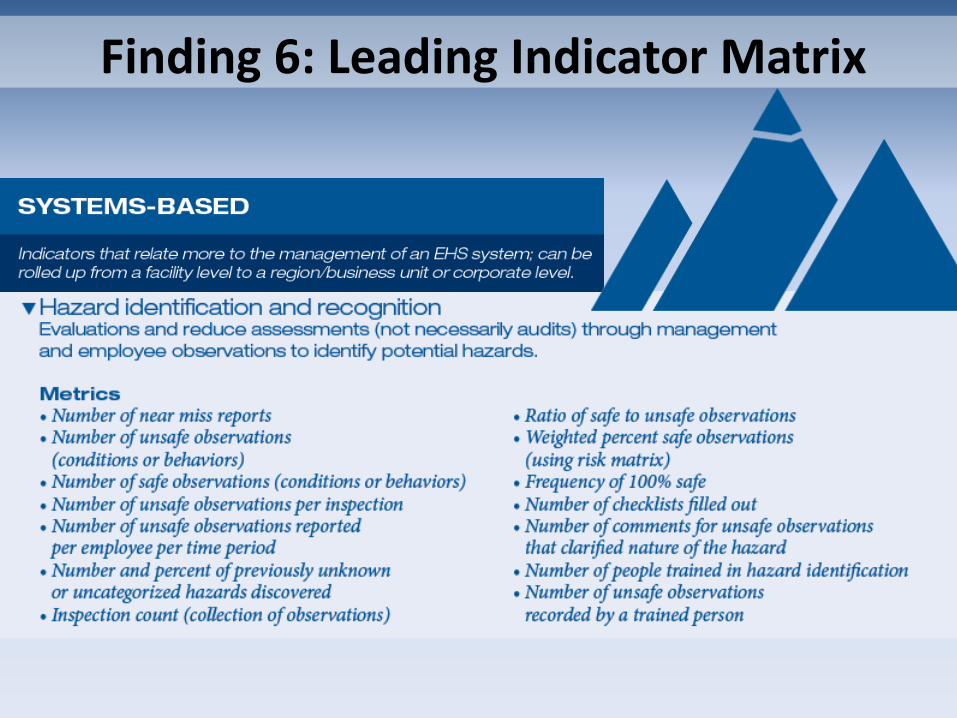
Finding 6: Leading Indicator Matrix

Finding 6: Leading Indicator Matrix