Embed Size (px)
Citation preview

E4896 Music Signal Processing (Dan Ellis) 2014-05-05 - /19
Lecture 15: Research at LabROSA
!
!
!
!
Dan Ellis Dept. Electrical Engineering, Columbia University
[email protected] http://www.ee.columbia.edu/~dpwe/e4896/1
1. Sources, Mixtures, & Perception 2. Spatial Filtering 3. Time-Frequency Masking 4. Model-Based Separation
ELEN E4896 MUSIC SIGNAL PROCESSING
E4896 Music Signal Processing (Dan Ellis) 2014-05-05 - /19
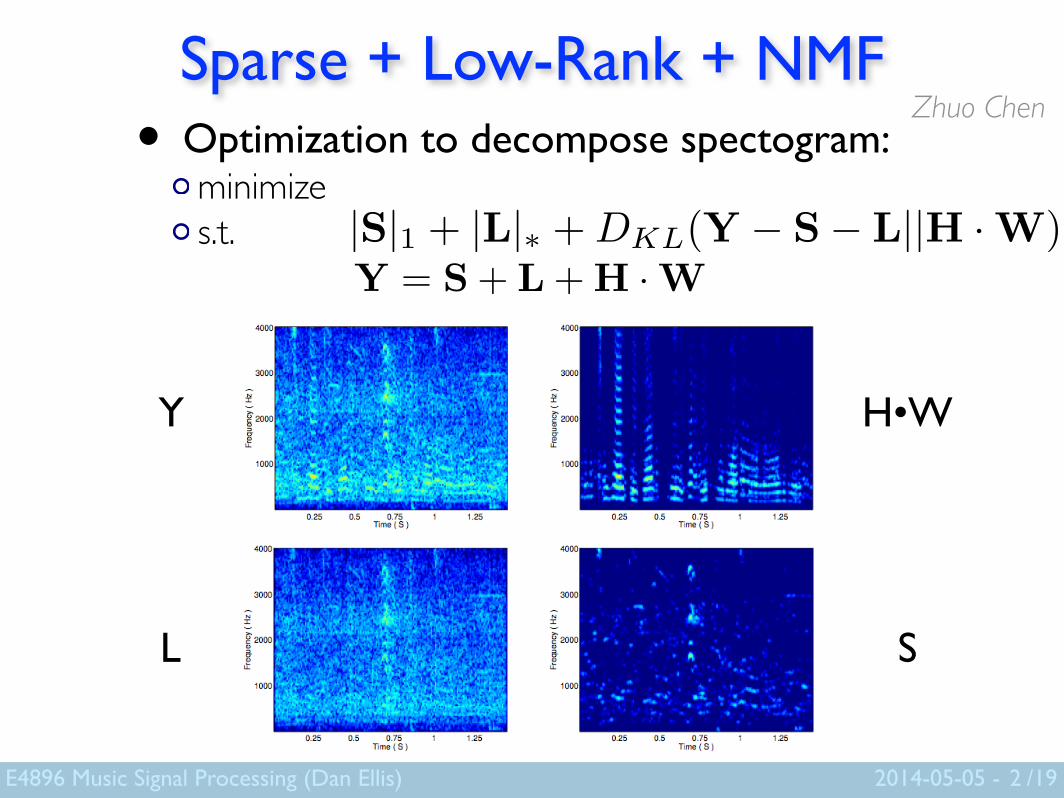
Sparse + Low-Rank + NMF• Optimization to decompose spectogram:
minimize s.t.
2
Y = S + L + H · W|S|1 + |L|� + DKL(Y � S� L||H · W)
Y
L
H•W
S
Zhuo Chen
E4896 Music Signal Processing (Dan Ellis) 2014-05-05 - /19
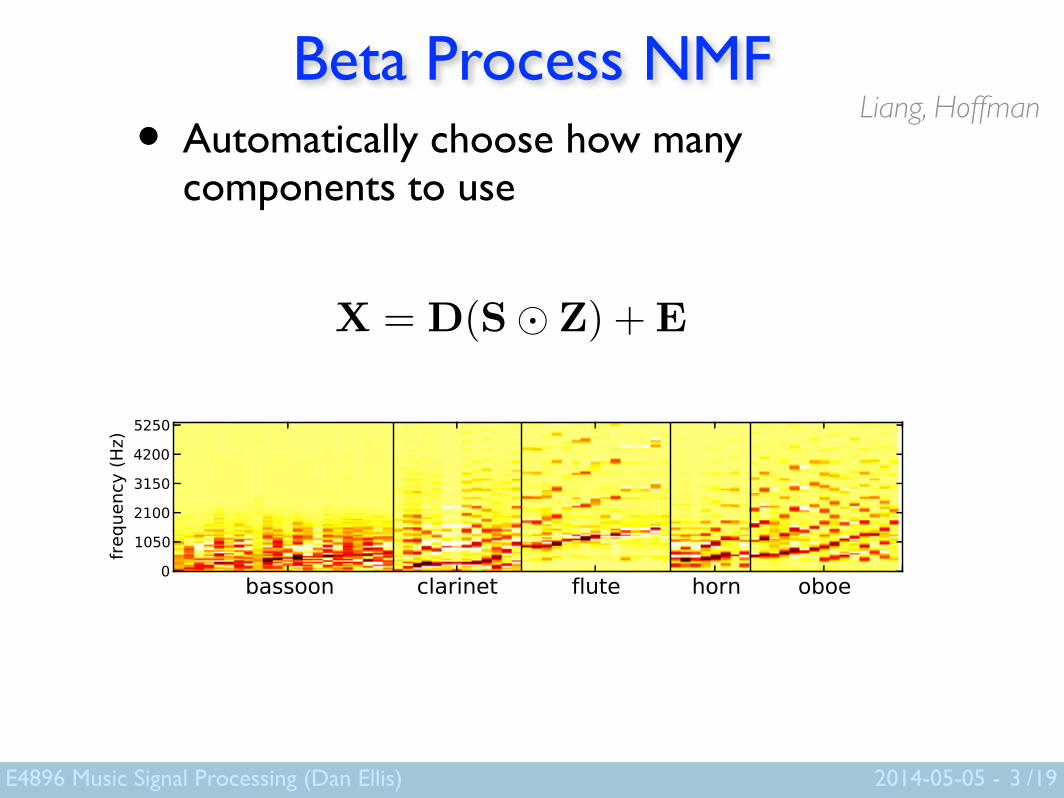
Beta Process NMF• Automatically choose how many
components to use
3
Liang, Hoffman
BETA PROCESS SPARSE NONNEGATIVE MATRIXFACTORIZATION FOR MUSIC
Dawen LiangLabROSA, EE Dept.Columbia University
Matthew D. HoffmanAdobe Research
Adobe Systems [email protected]
Daniel P. W. EllisLabROSA, EE Dept.Columbia University
ABSTRACT
Nonnegative matrix factorization (NMF) has been widelyused for discovering physically meaningful latent compo-nents in audio signals to facilitate source separation. Mostof the existing NMF algorithms require that the number oflatent components is provided a priori, which is not alwayspossible. In this paper, we leverage developments from theBayesian nonparametrics and compressive sensing litera-ture to propose a probabilistic Beta Process Sparse NMF
(BP-NMF) model, which can automatically infer the propernumber of latent components based on the data. Unlikeprevious models, BP-NMF explicitly assumes that theselatent components are often completely silent. We derivea novel mean-field variational inference algorithm for thisnonconjugate model and evaluate it on both synthetic dataand real recordings on various tasks.
1. INTRODUCTION
Nonnegative matrix factorization (NMF) [9] has been ex-tensively applied to analyze audio signals, since the ap-proximate decomposition of the audio spectrogram into theproduct of 2 nonnegative matrices X ⇡ WH provides aphysically meaningful interpretation. We can view eachcolumn of X, which represents the power density acrossfrequencies at a particular time, as a nonnegative linearcombination of the columns of W, determined by the col-umn of activation H. Thus W can be considered as a dic-tionary, where each column acts as a component. This canbe particularly useful for audio source separation, wherethe goal is to find out the individual sources from mixedsignal.
Audio source separation poses a meaningful and chal-lenging problem, which has been actively studied for thelast few decades. One of the obstacles which makes sourceseparation difficult is that the number of sources is gener-ally not known. For example, when we listen to a piece ofpolyphonic music, it is difficult and tedious to figure outhow many notes or instruments are being played. How-
Permission to make digital or hard copies of all or part of this work forpersonal or classroom use is granted without fee provided that copies arenot made or distributed for profit or commercial advantage and that copiesbear this notice and the full citation on the first page.c� 2013 International Society for Music Information Retrieval.
ever, most existing NMF algorithms require the number ofcomponents to be provided as input, based on the assump-tion that there exists a certain mapping between the learnedcomponents and real sources. To address this issue, wepropose BP-NMF, a nonparametric Bayesian NMF modelthat uses a beta process prior. The model automaticallydetermines how many sources it needs to explain the dataduring posterior inference.
1.1 Related Work
NMF has been applied to many music analysis problemssuch as music transcription [1,12], music analysis [5], andmusic source separation [10, 15].
On the other hand, most of the literature on nonpara-metric Bayesian latent factor models focuses on conjugatelinear Gaussian models, for example, beta process factoranalysis [11] which is the main inspiration for BP-NMF.However, such models are not appropriate for audio spec-trograms as they do not impose nonnegativity constraints.To address this limitation, [7] proposed a nonparametricBayesian NMF model based on the gamma process.
BP-NMF extends the standard NMF model in two ways:
• BP-NMF can explicitly and completely silence la-tent components when they should not be active. Thiscaptures the intuition that a note which appears fre-quently during one phrase may not contribute any-thing in another phrase, and most notes are silentmost of the time.
• The number of latent components, which is difficultto set a priori, is inferred by the model.
Both of these issues have been addressed in previous work,but to the authors’ knowledge, BP-NMF is the first modelto combine them.
2. BP-NMF
We adopt the notational conventions that upper case boldletters (e.g. X,D, S and Z) denote matrices and lowercase bold letters (e.g. x, d s, and z) denote vectors. f 2{1, 2, · · · , F} is used to index frequency. t 2 {1, 2, · · · , T}is used to index time. k 2 {1, 2, · · · ,K} is used to indexdictionary components.
BP-NMF is formulated as:
X = D(S� Z) +E (1)
(a) The selected components learned from single-track instru-ment. For each instrument, the components are sorted by approx-imated fundamental frequency. The dictionary is cut off above5512.5 Hz for visualization purposes.
(b) The box-and-whisker plot for the correlations from both BP-NMF matching and random matching. A paired Wilcoxon signed-rank test shows that they are significantly different.
Figure 4: The results from the proposed evaluation.
Therefore, this evaluation mechanism can also be appliedto determine a range for the “proper” number of compo-nents to describe the data.
5. CONCLUSION
In this paper, we propose BP-NMF, a Bayesian nonpara-metric extension of nonnegative matrix factorization, whichcan automatically infer the number of latent components.BP-NMF explicitly assumes that some of the componentsare often completely silent. BP-NMF performs well underexisting metrics and under a novel evaluation mechanism.
6. ACKNOWLEDGMENTS
The authors thank the reviewers for comments and the help-ful discussion with Brian McFee and Colin Raffel. Thiswork was supported by the NSF under grant IIS-1117015.
7. REFERENCES
[1] Samer A. Abdallah and Mark D. Plumbley. Polyphonicmusic transcription by non-negative sparse coding ofpower spectra. In Proceedings of the 5th International
Society for Music Information Retrieval Conference,pages 10–14, 2004.
[2] Dhananjay Bansal, Bhiksha Raj, and Paris Smaragdis.Bandwidth expansion of narrowband speech using nonnegative matrix factorization. In 9th European Confer-
ence on Speech Communication (Eurospeech), 2005.
[3] Christopher M. Bishop. Pattern Recognition and Ma-
chine Learning (Information Science and Statistics).Springer-Verlag New York, Inc., 2006.
[4] Finale Doshi-Velez, Kurt T. Miller, Jurgen Van Gael,and Yee Whye Teh. Variational inference for the Indianbuffet process. In International Conference on Artifi-
cial Intelligence and Statistics, 2009.
[5] Cedric Fevotte, Nancy Bertin, and Jean-Louis Dur-rieu. Nonnegative matrix factorization with the Itakura-Saito divergence: with application to music analysis.Neural Computation, 21(3):793–830, 2009.
[6] Nils Lid Hjort. Nonparametric bayes estimators basedon beta processes in models for life history data. The
Annals of Statistics, pages 1259–1294, 1990.
[7] Matthew D. Hoffman, David M. Blei, and Perry R.Cook. Bayesian nonparametric matrix factorization forrecorded music. In Proceedings of the 27th Annual In-
ternational Conference on Machine Learning, pages439–446, 2010.
[8] Michael I. Jordan, Zoubin Ghahramani, Tommi S.Jaakkola, and Lawrence K. Saul. An introduction tovariational methods for graphical models. Machine
learning, 37(2):183–233, 1999.
[9] Daniel D. Lee and H. Sebastian Seung. Algorithms fornon-negative matrix factorization. Advances in Neural
Information Processing Systems, 13:556–562, 2001.
[10] Alexey Ozerov and Cedric Fevotte. Multichannel non-negative matrix factorization in convolutive mixturesfor audio source separation. Audio, Speech, and Lan-
guage Processing, IEEE Transactions on, 18(3):550–563, 2010.
[11] John Paisley and Lawrence Carin. Nonparametric fac-tor analysis with beta process priors. In Proceedings of
the 26th Annual International Conference on Machine
Learning, pages 777–784, 2009.
[12] Paris Smaragdis and Judith C. Brown. Non-negativematrix factorization for polyphonic music transcrip-tion. In Applications of Signal Processing to Audio and
Acoustics, 2003 IEEE Workshop on., pages 177–180.IEEE, 2003.
[13] Romain Thibaux and Michael I. Jordan. Hierarchicalbeta processes and the Indian buffet process. In In-
ternational Conference on Artificial Intelligence and
Statistics, 2007.
[14] Emmanuel Vincent, Remi Gribonval, and CedricFevotte. Performance measurement in blind audiosource separation. Audio, Speech, and Language Pro-
cessing, IEEE Transactions on, 14(4):1462–1469,2006.
[15] Tuomas Virtanen. Monaural sound source separationby nonnegative matrix factorization with temporal con-tinuity and sparseness criteria. Audio, Speech, and Lan-
guage Processing, IEEE Transactions on, 15(3):1066–1074, 2007.
[16] Chong Wang and David M. Blei. Variational inferencein nonconjugate models. Journal of Machine Learning
Research, 14:899–925, 2013.
[17] Frank Wilcoxon. Individual comparisons by rankingmethods. Biometrics bulletin, 1(6):80–83, 1945.

E4896 Music Signal Processing (Dan Ellis) 2014-05-05 - /19
Music Complexity• How can we capture musical patterns in the
Million Song Dataset?
• Network analysis of quantized simultaneities after Serrà et al. 2012
4
points towards a great degree of conventionalism in the creationand production of this type of music. Yet, we find three importanttrends in the evolution of musical discourse: the restriction of pitchsequences (with metrics showing less variety in pitch progressions),the homogenization of the timbral palette (with frequent timbresbecoming more frequent), and growing average loudness levels(threatening a dynamic richness that has been conserved untiltoday). This suggests that our perception of the new would be essen-tially rooted on identifying simpler pitch sequences, fashionable tim-bral mixtures, and louder volumes. Hence, an old tune with slightlysimpler chord progressions, new instrument sonorities that were inagreement with current tendencies, and recorded with modern tech-niques that allowed for increased loudness levels could be easilyperceived as novel, fashionable, and groundbreaking.
ResultsTo identify structural patterns of musical discourse we first need tobuild a ‘vocabulary’ of musical elements (Fig. 1). To do so, we encodethe dataset descriptions by a discretization of their values, yieldingwhat we call music codewords20 (see Supplementary Information, SI).In the case of pitch, the descriptions of each song are additionallytransposed to an equivalent main tonality, such that all of them areautomatically considered within the same tonal context or key. Next,
to quantify long-term variations of a vocabulary, we need to obtainsamples of it at different periods of time. For that we perform aMonte Carlo sampling in a moving window fashion. In particular,for each year, we sample one million beat-consecutive codewords,considering entire tracks and using a window length of 5 years (thewindow is centered at the corresponding year such that, for instance,for 1994 we sample one million consecutive beats by choosing fulltracks whose year annotation is between 1992 and 1996, bothincluded). This procedure, which is repeated 10 times, guarantees arepresentative sample with a smooth evolution over the years.
We first count the frequency of usage of pitch codewords (i.e. thenumber of times each codeword type appears in a sample). Weobserve that most used pitch codewords generally correspond towell-known harmonic items21, while unused codewords correspondto strange/dissonant pitch combinations (Fig. 2a). Sorting the fre-quency counts in decreasing order provides a very clear patternbehind the data: a power law17 of the form z / r2a, where z corre-sponds to the frequency count of a codeword, r denotes its rank (i.e. r5 1 for the most used codeword and so forth), and a is the power lawexponent. Specifically, we find that the distribution of codewordfrequencies for a given year nicely fits to P(z) / (c 1 z) 2b for z .zmin, where we take z as the random variable22, b 5 1 1 1/a as theexponent, and c as a constant (Fig. 2b). A power law indicates thata few codewords are very frequent while the majority are highly
Figure 1 | Method schematic summary with pitch data. The dataset contains the beat-based music descriptions of the audio rendition of a musical pieceor score (G, Em, and D7 on the top of the staff denote chords). For pitch, these descriptions reflect the harmonic content of the piece15, and encapsulate allsounding notes of a given time interval into a compact representation11,12, independently of their articulation (they consist of the 12 pitch class relativeenergies, where a pitch class is the set of all pitches that are a whole number of octaves apart, e.g. notes C1, C2, and C3 all collapse to pitch class C). Alldescriptions are encoded into music codewords, using a binary discretization in the case of pitch. Codewords are then used to perform frequency counts,and as nodes of a complex network whose links reflect transitions between subsequent codewords.
www.nature.com/scientificreports
SCIENTIFIC REPORTS | 2 : 521 | DOI: 10.1038/srep00521 2
Colin Raffel
from Serrà, Corral, Boguña, Haro, & Arcos, 2012

E4896 Music Signal Processing (Dan Ellis) 2014-05-05 - /19
Large-Scale Cover Recognition 1• How can we find covers in 1M songs?
@ 1 sec / comparison, one search = 11.5 CPU-days full N2 mining = 16,000 CPU-years
• Need a hashing technique landmark-based description of chroma patches !!!!!!Euclidean space projection?
5
Thierry Bertin-Mahieux

E4896 Music Signal Processing (Dan Ellis) 2014-05-05 - /19
Large-Scale Cover Recognition 2
• 2D Fourier Transform Magnitude (2DFTM) fixed-size feature to capture “essence” of chromagram:
!
• First results on finding covers in 1M songs
6
Average rank meanAP
random 500,000 0.000
jumpcodes 2 308,369 0.002
2DFTM (50 PC) 137,117 0.020
Thierry Bertin-Mahieux

E4896 Music Signal Processing (Dan Ellis) 2014-05-05 - /19
Jazz Discography Project• How can MIR help organize jazz collections?
our tools are quite genre-specific e.g. beat tracker is fine for pop, useless for Jazz
7
10203040
84 86 88 90 92 94 96 98020406080
E4896 Music Signal Processing (Dan Ellis) 2014-05-05 - /19
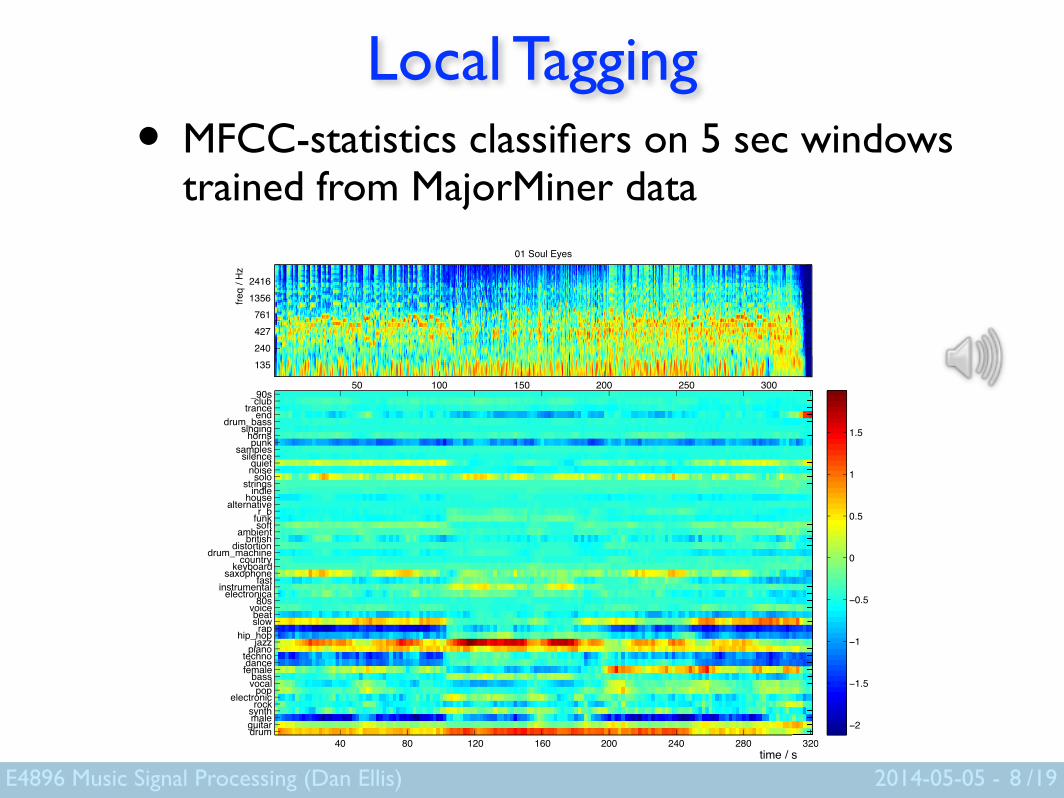
Local Tagging• MFCC-statistics classifiers on 5 sec windows
trained from MajorMiner data
8
40 80 120 160 200 240 280 320drumguitarmalesynthrockelectronicpopvocalbassfemaledancetechnopianojazzhip_hoprapslowbeatvoice80selectronicainstrumentalfastsaxophonekeyboardcountrydrum_machinedistortionbritishambientsoftfunkr_balternativehouseindiestringssolonoisequietsilencesamplespunkhornssingingdrum_bassendtranceclub_90s
320−2
−1.5
−1
−0.5
0
0.5
1
1.5
01 Soul Eyes
50 100 150 200 250 300
time / s
freq
/ Hz
135240427761
13562416

E4896 Music Signal Processing (Dan Ellis) 2014-05-05 - /19
Onset Correlation• “Ahead of” or “behind” the beat?
9
Brian McFee
Tony Williams Elvin Jones

E4896 Music Signal Processing (Dan Ellis) 2014-05-05 - /19
Structural Similarity• Self-similarity shows
repeating structure in music
• Can we find similar pieces by finding similar structures?
10
Diego Silva Helene Papadopoulos
2020 IEEE TRANSACTIONS ON AUDIO, SPEECH, AND LANGUAGE PROCESSING, VOL. 19, NO. 7, SEPTEMBER 2011
Fig. 5. Comparison of recurrence plots for two performances of W. A.Mozart’s Symphony # 40, movement 3. The figures illustrate how beat-trackinginconsistencies lead to dissimilarities in the RP.
TABLE IICENS FEATURES: RESULTS ON THE TRAINING SET FOR VARIATIONS
OF FEATURE RATE AND SEQUENCE LENGTH
TABLE IIICRP FEATURES: RESULTS ON THE TRAINING SET FOR VARIATIONS
OF FEATURE RATE AND SEQUENCE LENGTH
filtered version of the first. Fixing after beat tracking doesnothing to address the resulting difference in topology, which isbound to increase the distance between the plots and thereforereduce the accuracy of retrieval. Octave errors are unavoidable,even with state-of-the-art beat-tracking systems such as the oneused. Thus, the remainder of these experiments are performedwithout beat-synchronous analysis.
C. Feature Type
Tables II and III, compare performance over variations ofand for the two chroma variants discussed in Section III-A:CENS and CRP, respectively. Both sets of results show improve-ment over the use of chroma features. In the case of the CENSfeatures, each combination sees an average net improve-ment of 0.26 in MAP, with a 0.197 increase in best performancefor . For CRP features, the net increase in best per-formance, for , is of 0.233 upon chroma features and0.036 upon CENS features. Fig. 4 shows the differences withchroma features to be significant, while the differences betweenCRP and CENS features are not.
Fig. 6. Retrieval accuracy on the training set for variations of embedding di-mension and delay .
In both tables, best results (gray shaded) tend to appeartowards the top-right corner and worst results are mostlyconcentrated on bottom-left cells. The trend shows that, whilesmoothing is necessary to reduce the effect of short-termevents, excessive amounts produced by using low andvalues have a negative impact on retrieval. Notably, results ob-tained using CENS features, where downsampling is an activepart of their design, are best for maximum and mid-rangevalues. Conversely, CRP results are best for maximum (nodownsampling) and mid-range values.
More importantly, the removal of timbral content partlyachieved through quantization in the CENS, or via the zeroingof low DCT coefficients in the CRP, has the largest positiveimpact on performance. We conjecture that, at least for thetraining set, structural similarity is better characterized byharmonic than by timbral information in the signal, and thatthe “coloring” introduced by the sound’s spectral envelopeis unwanted for this task. This is consistent with preliminaryexperiments where chroma features outperform MFCCs forstructural-based similarity [7], and with the wide use of chromafeatures for music structure analysis in the literature.
D. Recurrence Plot
Besides feature extraction, the choice of time-delay embed-ding variables, and the strategy used in the computation of therecurrence plots, have an impact on the accuracy of retrieval.Fig. 6 depicts results in the testing set using and
, for and .The leftmost point of all curves correspond to a MAP of
0.863 for . It is readily observed that choosingbrings about and increase of MAP, with the majority of resultsin the [0.90, 0.94] range. Most curves peak somewhere between
, showing a slight decline after that. Best perfor-mance of , for and , is significantlybetter than for the case of no embedding (see Fig. 4).
The trend, however, is far from clear for variations of , withodd delay-values showing better performance for most . Un-like in [29], we fail to see a clear correspondence between resultsobtained using same values of , e.g., forand . This may be due to the small size ofour training set, which creates the distinct possibility of over-fitting. However, it is worth noting that variations of for agiven result in statistically insignificant differences of less
from
Bel
lo 2
011

E4896 Music Signal Processing (Dan Ellis) 2014-05-05 - /19
Ordinal LDA Segmentation• Low-rank decomposition of skewed self-
similarity to identify repeats
• Learned weightingof multiple factorsto segment Linear DiscriminantAnalysis between adjacentsegments
11
McFee
0 55 110 165 220 275 330Beat
0
55
110
165
220
275
330
Beat
Self-similarity
0 55 110 165 220 275 330Beat
-330
-220
-110
0
110
220
330
Lag
Skewed self-sim.
0 55 110 165 220 275 330Beat
-330
-220
-110
0
110
220
330La
g
Filtered self-sim.
0 55 110 165 220 275 330Beat
0
1
2
3
4
5
6
7
Fact
or
Latent repetition

E4896 Music Signal Processing (Dan Ellis) 2014-05-05 - /19
Lyric Recognition• Speech Recognition for Songs
lots of interference atypical speech
12
Polyphonic Audio
Freq
uenc
y (k
Hz)
0 2 4 6 8
4
3
2
1
0
Acapella Audio
0 2 4 6 8
4
3
2
1
0
Natural Speech
Time (seconds)
Freq
uenc
y (k
Hz)
0 1 2 3 4 5 6
4
3
2
1
0
Synthesized Speech
Time (seconds)0 1 2 3 4 5 6 7
4
3
2
1
0
Figure 1: Comparison of vocal types used in this paper, example clip ‘This Love’, Levine-Carmichael. Top row: fullpolyphonic audio (including vocals, two electric guitars, bass guitar, piano and drums), Acapella audio (voice only). Bottomrow: Natural speech performed by the authors, synthesized speech using the ‘say’ command in Mac OSX.
level. An example alignment compared to the word-levelground truth created by the authors of [14] is shown in Fig.2
In some cases, the acoustic model provided a poor matchto the acapella audio and an alignment between the lyricsand audio could not be found, which numbered ?? in total,leaving us with ?? acapella tracks with time-stamped lyricsand the word and phoneme level. Example output for thisprocedure is shown in Figure 2, for a song where the wordonsets were manually entered by the authors of [13].
4. EXPERIMENTS
In this section, we provide a first attempt at extraction oflyrics from audio, using the alignments from Section 3.2 tovalidate our results. We have tested three freely-availablesystems for the recognition: pocketsphinx, sphinx4, andthe google voice API. We describe these systems below.
4.1 ASR Models investigated
Pocketsphinx is a lightweight ASR system suitable fordeployment on mobile devices [9], developed at the Lan-guage Technologies Institute at Carnegie Mellon Univer-sity and capable of both live (continuous) and batch (pre-recorded) speech processing. We equipped pocketsphinxwith the HUB4 broadcast news acoustic and language mod-els, along with the CMU pronounciation dictionary of 131,000words.
Sphinx4 is a state-of-the-art speech recognition system writ-ten in Java. It was created via a joint collaboration be-tween the Sphinx group at Carnegie Mellon University,
Sun Microsystems Laboratories, Mitsubishi Electric Re-search Labs, and Hewlett Packard, with contributions fromthe University of California at Santa Cruz and the Mas-sachusetts Institute of Technology. The language model,acoustic model and dictionary used with Sphinx4 were asused above in pocketsphinx.
Google Voice API is the system used by google to tran-scribe voicemail messages. We were able to post audio tothis server by a wget command and were returned a tran-scription. Being an API, we had very little control over theparameters of this model and could therefore not specifyan acoustic or language model. A further drawback to theAPI is that the returned transcriptions lack onset times.
4.2 Audio used
As seen in Section 1, polyphonic audio has large amountsof background noise and we expect will be extremely chal-lenging to perform recognition on. However, performingrecognition on the acapella audio may be an easier goal.We can also synthesize audio using text-to-speech (TTS)techniques, which may give insights into how the languagemodels vary. Therefore, we investigated the following threeaudio examples:
Synthesized Audio. We synthesized the lyrics obtainedfrom Section 3.2 using OSX ‘say’ command. Line breaksin the lyrics were converted to periods to give sentencestructure to the TTS system.
Acapella. These are the acapella discussed in Section 3.1.
Matt McVicar

E4896 Music Signal Processing (Dan Ellis) 2014-05-05 - /19
Singing ASR• Speech recognition adapted to singing
needs aligned data
• Align scraped “acapellas” and full mix including jumps!
13
McVicar

E4896 Music Signal Processing (Dan Ellis) 2014-05-05 - /19
“Remixavier"• Optimal align-and-cancel of mix and acapella
timing and channel may differ
14
Raffel

E4896 Music Signal Processing (Dan Ellis) 2014-05-05 - /19
Million Song Dataset• Many Facets
Echo Nest audio features + metadata Echo Nest “taste profile”user-song-listen count Second Hand Song covers musiXmatch lyric BoW last.fm tags !
• Now with audio? resolving artist / album / track / duration against what.cd
15
Bertin-Mahieux McFee

E4896 Music Signal Processing (Dan Ellis) 2014-05-05 - /19
MIDI-to-MSD• Aligned MIDI to Audio is a nice transcription
!
!
!
!
!
!
!
!
!
16
Raffel Shi
E4896 Music Signal Processing (Dan Ellis) 2014-05-05 - /19
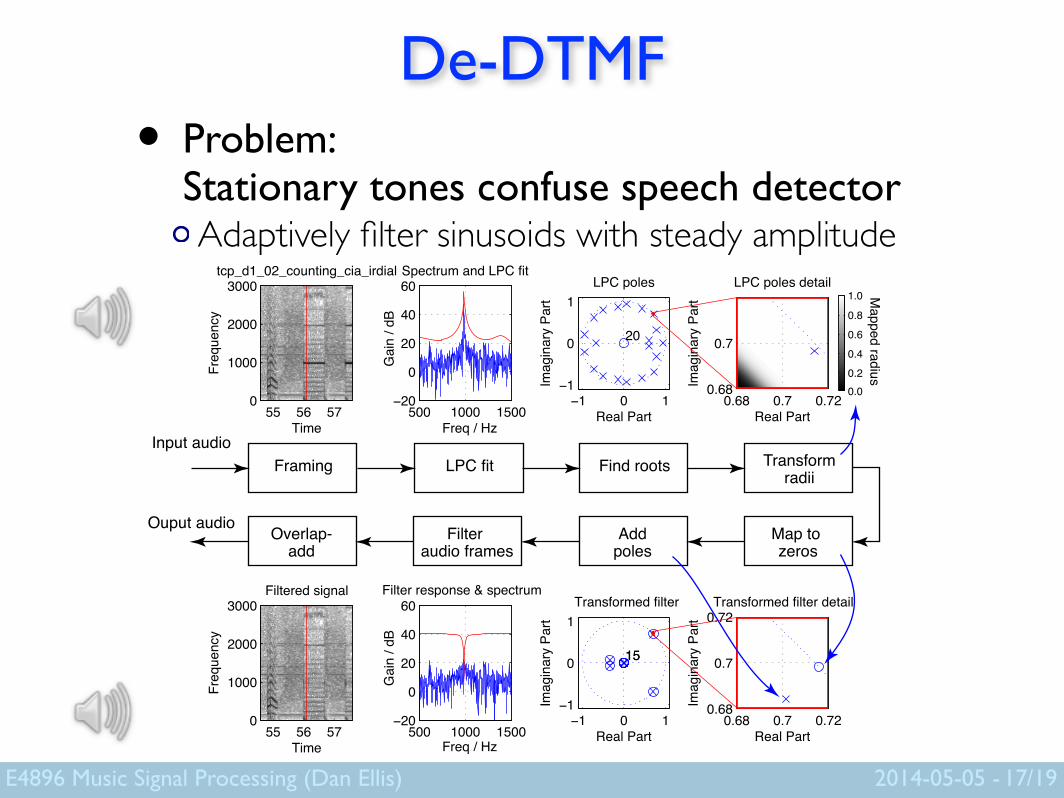
De-DTMF• Problem:
Stationary tones confuse speech detector Adaptively filter sinusoids with steady amplitude
17
Time Freq / Hz
Freq / Hz
Freq
uenc
y
Gain
/ dB
Gain
/ dB
tcp_d1_02_counting_cia_irdial
55 56 570
1000
2000
3000
500 1000 1500−20
0
20
40
60Spectrum and LPC fit
−1 0 1−1
0
1
20
Real Part
Imag
inary
Par
t
LPC poles
0.68 0.7 0.720.68
0.7
Real Part
Imag
inary
Par
Mapped radius
t
LPC poles detail
−1 0 1−1
0
1
1515
Real Part
Imag
inary
Par
t
Transformed filter
0.68 0.7 0.720.68
0.7
0.72
Real Part
Imag
inary
Par
t
Transformed filter detail
500 1000 1500−20
0
20
40
60Filter response & spectrum
Time
Freq
uenc
y
Filtered signal
55 56 570
1000
2000
3000
FramingInput audio
Ouput audio
LPC fit Find roots Transformradii
Map to zeros
Addpoles
Filter audio frames
Overlap-add
0.0.0
1.0
20.40.60.8

E4896 Music Signal Processing (Dan Ellis) 2014-05-05 - /19
Pitch-based Filtering• Resample to flatten pitch, then filter
18

E4896 Music Signal Processing (Dan Ellis) 2014-05-05 - /19
Summary• Signal Separation
NMF, RPCA, cancellation, filtering !
• Music Information Beat tracking, segmentation Large datasets Indexing & retrieval !
• Speech Lyric recognition Speech detection & enhancement
19

E4896 Music Signal Processing (Dan Ellis) 2014-05-05 - /19
References[Bello 2011] J P Bello, “Measuring structural similarity in music”, IEEE Tr. Audio, Speech, & Lang., 19(7): 2013-2025, 2011. [Serra et al. 2012] J Serrà, A Corral, M Boguña, M. Haro, & J. Arcos, “Measuring the evolution of contemporary western popular music”, Scientific Reports, 2:521, 2012.
20


![An Iterative Array Signal Segregation Algorithm · 2019-05-22 · niques such as multiple signal classification (MUSIC)[17]–[24] or estimation of signal parameters via rotational](https://img.dokumen.tips/doc/110x75/5f8ce6481a20566ac6297e84/an-iterative-array-signal-segregation-algorithm-2019-05-22-niques-such-as-multiple.jpg)