Embed Size (px)
Citation preview

University of Central Florida University of Central Florida
STARS STARS
Electronic Theses and Dissertations, 2004-2019
2009
Elementary School Student Achievement: An Analysis Of School Elementary School Student Achievement: An Analysis Of School
Size And Student Achievement Size And Student Achievement
Natalie Odom University of Central Florida
Part of the Educational Leadership Commons
Find similar works at: https://stars.library.ucf.edu/etd
University of Central Florida Libraries http://library.ucf.edu
This Doctoral Dissertation (Open Access) is brought to you for free and open access by STARS. It has been accepted
for inclusion in Electronic Theses and Dissertations, 2004-2019 by an authorized administrator of STARS. For more
information, please contact [email protected].
STARS Citation STARS Citation Odom, Natalie, "Elementary School Student Achievement: An Analysis Of School Size And Student Achievement" (2009). Electronic Theses and Dissertations, 2004-2019. 3883. https://stars.library.ucf.edu/etd/3883
ELEMENTARY SCHOOL STUDENT ACHIEVEMENT: AN ANALYSIS OF SCHOOL SIZE AND STUDENT ACHIEVEMENT
by
NATALIE M. ODOM B.S. Clemson University, 2003
M.A.T. Clemson University, 2006 Ed.S. University of Central Florida, 2008
A dissertation submitted in partial fulfillment of the requirements for the degree of Doctor of Education
in the Department of Educational Research, Technology and Leadership in the College of Education
at the University of Central Florida Orlando, Florida
Fall Term 2009
Major Professor: Kenneth Murray

ii
© 2009 Natalie M. Odom
iii
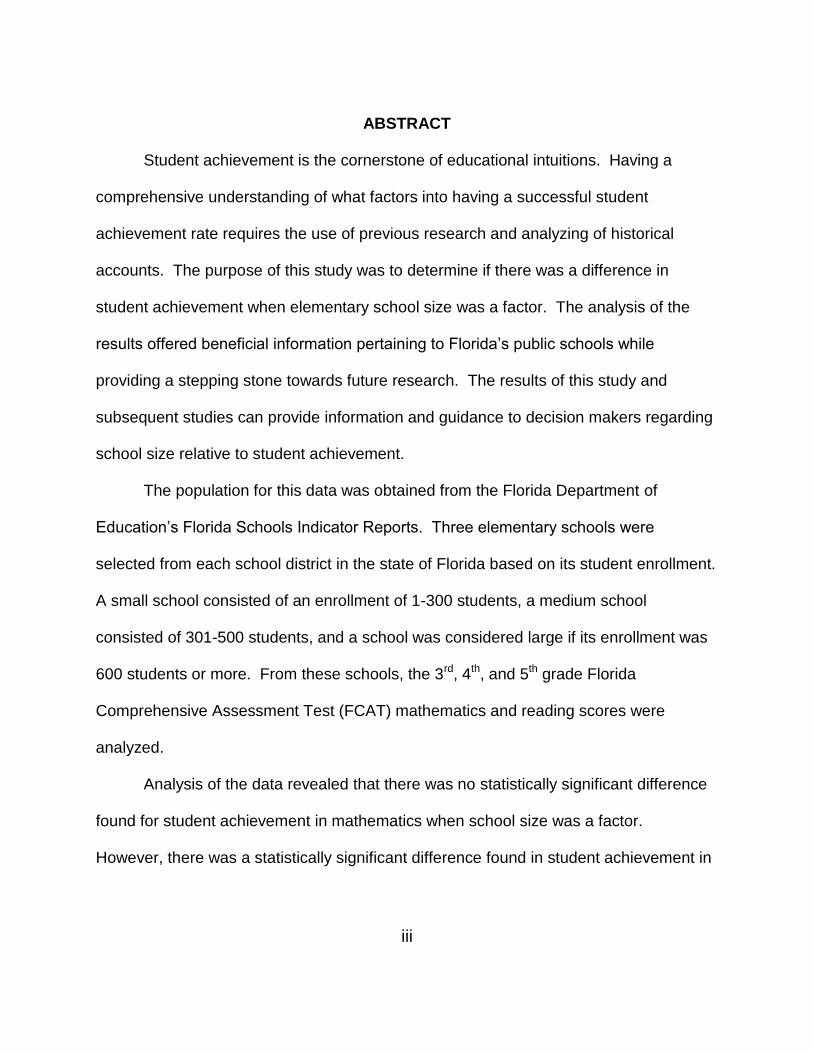
ABSTRACT
Student achievement is the cornerstone of educational intuitions. Having a
comprehensive understanding of what factors into having a successful student
achievement rate requires the use of previous research and analyzing of historical
accounts. The purpose of this study was to determine if there was a difference in
student achievement when elementary school size was a factor. The analysis of the
results offered beneficial information pertaining to Florida‘s public schools while
providing a stepping stone towards future research. The results of this study and
subsequent studies can provide information and guidance to decision makers regarding
school size relative to student achievement.
The population for this data was obtained from the Florida Department of
Education‘s Florida Schools Indicator Reports. Three elementary schools were
selected from each school district in the state of Florida based on its student enrollment.
A small school consisted of an enrollment of 1-300 students, a medium school
consisted of 301-500 students, and a school was considered large if its enrollment was
600 students or more. From these schools, the 3rd, 4th, and 5th grade Florida
Comprehensive Assessment Test (FCAT) mathematics and reading scores were
analyzed.
Analysis of the data revealed that there was no statistically significant difference
found for student achievement in mathematics when school size was a factor.
However, there was a statistically significant difference found in student achievement in

iv
reading. The significance was found to lie between medium and large schools, with
large schools scoring significantly better than medium schools.

v
This work is dedicated to my grandparents. Your presence in Heaven lets me know that
I have four wonderful angels watching over me.

vi
ACKNOWLEDGMENTS
My sincere appreciation goes to Dr. Kenneth Murray, from our first advising
conversation, I knew we would be a great fit. You have been a tremendous help
throughout this experience. To Dr. Barbara Murray, you saw something in me that I did
not even know existed. Thank you for encouraging me over the years and for being so
resourceful. You two are an excellent team!! The University of Central Florida is
blessed to have you both. To Dr. Doherty and Dr. Hutchinson, thank you for your time
and effort. Working with you both has truly been a pleasure. To Elayne Reiss, thank
you for your patience and expertise.
To Oliver W. Pough, IV, my future husband, I am so excited to start this chapter
of my life with you and I thank you for supporting me and encouraging me.
To my parents, without your continued support this would not have been
possible. Thank you for always loving me, supporting me, and spoiling me!!! To my
siblings, watching you both made me a better person and a better student. Thank you
for your guidance and setting a path for me.
To my late Great Uncle Ed ―Buddy‖ Davis, I believe everything about the work I
have completed speaks volumes to you and our relationship. When I was a little girl,
you would ask me, ―did you get your lesson today?‖ At that time, I had no clue what you
were talking about, but as I have grown I have remembered those conversations and
realized how important my education was to you. I hope I have made you proud.
To Mr. & Mrs. Pough, you have welcomed me into your family and given
unselfishly to our future and our personal endeavors. I can never repay you for all that

vii
you have done, but I will do everything in my power to continue to make your son
happy.
To my Lord and Savior, thank you for everything! I carry You in my heart with
every step that I take. When my time on earth is done, I hope to meet You and hear the
words ―Well done, My Child‖.

viii
TABLE OF CONTENTS
LIST OF FIGURES ................................................................................................ xi
LIST OF TABLES ................................................................................................. xii
CHAPTER 1 PROBLEM STATEMENT AND RESEARCH DESIGN .................... 1
Introduction ........................................................................................................ 1
Statement of the Problem .................................................................................. 2
Purpose of the Study ......................................................................................... 3
Research Question ............................................................................................ 3
Hypotheses ........................................................................................................ 3
Population and Sample ...................................................................................... 3
Data Collection .................................................................................................. 4
Data Analysis ..................................................................................................... 4
Significance of the Study ................................................................................... 4
Limitations .......................................................................................................... 5
Delimitations ...................................................................................................... 5
Organization of the Study .................................................................................. 5
CHAPTER 2 REVIEW OF LITERATURE.............................................................. 7
Introduction ........................................................................................................ 7
The Historical Impact of School Size ................................................................. 7
School Size ........................................................................................................ 9

ix
School Reform ................................................................................................. 17
Florida School Reform Efforts .......................................................................... 22
Student Achievement ....................................................................................... 26
Effects of School Reform ................................................................................. 29
Summary ......................................................................................................... 33
CHAPTER 3 METHODOLOGY ........................................................................... 34
Introduction ...................................................................................................... 34
Statement of the Problem ................................................................................ 34
Population and Sample .................................................................................... 34
Data Collection ................................................................................................ 35
Dependent and Independent Variables ........................................................... 35
Data Analysis ................................................................................................... 35
Research Question 1 ................................................................................... 36
Research Question 2 ................................................................................... 36
CHAPTER 4 ANALYSIS OF DATA ..................................................................... 37
Introduction ...................................................................................................... 37
Description of Population ................................................................................. 37
Research Question 1 ................................................................................... 46
Research Question 2 ................................................................................... 47
Summary ......................................................................................................... 48
CHAPTER 5 SUMMARY AND RECOMMENDATIONS ...................................... 49

x
Introduction ...................................................................................................... 49
Statement of Problem ...................................................................................... 49
Methodology .................................................................................................... 49
Population .................................................................................................... 49
Data Collection ............................................................................................. 50
Data Analysis ................................................................................................... 50
Summary and Discussion of Findings ............................................................. 50
Conclusion ....................................................................................................... 51
Recommendations for Practice ........................................................................ 52
Recommendations for Future Research .......................................................... 53
APPENDIX A MAP OF FLORIDA SCHOOL DISTRICTS ................................... 55
APPENDIX B FCAT READING DATA FOR GRADE 3 ...................................... 57
APPENDIX C FCAT READING DATA FOR GRADE 4 ....................................... 71
APPENDIX D FCAT READING DATA FOR GRADE 5 ...................................... 85
APPENDIX E FCAT MATH DATA FOR GRADE 3 ............................................ 99
APPENDIX F FCAT MATH DATA FOR GRADE 4 ........................................... 113
APPENDIX G FCAT MATH DATA FOR GRADE 5 .......................................... 127
LIST OF REFERENCES ................................................................................... 139

xi
LIST OF FIGURES
Figure 1: Theory of action - Chicago High School Redesign Initiative ................ 19
Figure 2: Map of Florida School Districts ............................................................ 56

xii
LIST OF TABLES
Table 1 Elementary Schools Studied ................................................................. 39
Table 2 Descriptive Statistics of FCAT Math Proficiency Based on School Size47
Table 3 Descriptive Statistics of FCAT Reading Proficiency Based on School
Size ..................................................................................................................... 48
Table 4 FCAT Reading data for Grade 3 ........................................................... 58
Table 5 FCAT Reading data for Grade 4 ........................................................... 72
Table 6 FCAT Reading data for Grade 5 ........................................................... 86
Table 7 FCAT Math data for Grade 3 ............................................................... 100
Table 8 FCAT Math data for Grade 4 ............................................................... 114
Table 9 FCAT Math data for Grade 5 ............................................................... 128
1
CHAPTER 1 PROBLEM STATEMENT AND RESEARCH DESIGN
Introduction
School systems provide information on student achievement on an annual basis
using statewide standardized test data. This study analyzed student achievement in the
state of Florida when school size is a factor.
There is published research that indicates that school size has little to no effect
on student achievement, while there is also contradictory research established. Much
of the research debates the advantages and disadvantages of small schools versus
larger schools, such as school safety and graduation rates; while earlier studies
specifically examined the appropriate enrollment range of a school to reach its optimal
size for student achievement. Research indicates that small schools offer more
personable experiences and stronger learning environments for their students. Raywid
(1997) stated ―small schools are especially beneficial in each of these regards for
disadvantaged or at-risk students, who appear to depend to a greater extent on school
size and organization for succeeding than do more fortunate youngsters‖ (p. 18). Jon
Bailey (2000) found that ―out of 22 major studies examining academic achievement by
school size, none finds that large schools are superior to small schools. Fourteen
studies find equivalent achievement, and 8 studies find small schools superior‖ (p. 4).
Bailey‘s findings offer general conclusions; however, the goal of this study is to provide
detailed information that specifies the difference in student achievement when
elementary school size is a factor.

2
Each year in the state of Florida, elementary students in grades 3 – 5 are tested
based on the Sunshine State Standards (SSS) in reading, mathematics, science and
writing. This information, along with student academic grades, is then utilized to
differentiate the students into their learning environments for the upcoming school year.
The results are also used to provide teachers with data that shows evidence of success
and where growth is needed.
The Florida Comprehensive Assessment Test (FCAT) is the standardized test
administered throughout the state of Florida annually. According to the Florida
Department of Education (2008), the purpose of the FCAT is to ―access student
achievement of the Sunshine State Standards benchmarks in reading, mathematics,
science, and writing (p. 2). The Florida Department of Education (2008) further details
that the FCAT ―includes norm-reference tests (NRT) in reading comprehension and
mathematics problem solving, which allow for comparing the performance of Florida
students with students across the nation‖ (p. 2). This information was analyzed and
expressed as a comparison between schools of different sizes to see whether or not
school size is a factor of student success in an elementary school educational setting.
Statement of the Problem
While there has been sufficient research on the effects of school size on student
achievement, there is limited information, to date, regarding the effects of school size on
student achievement in Florida public schools. This study attempted to determine if
differences exist in student achievement at the elementary level when school size is a
factor.

3
Purpose of the Study
The purpose of this study was to discover whether there is a difference in student
achievement in the state of Florida based on Math and Reading FCAT Sunshine State
Standard scores when elementary school size is a factor.
Research Question
The study was guided by the following research questions:
1. What differences, if any, exist in student achievement, based on the school-wide
FCAT Math assessment at the elementary level, when school size is a factor?
2. What differences, if any, exist in student achievement, based on the school-wide
FCAT Reading assessment at the elementary level, when school size is a factor?
Hypotheses
The proposed research hypotheses were as follows:
H1: There is a statistically significant difference in student achievement on the
FCAT Math when school size is a factor.
H2: There is a statistically significant difference in student achievement on the
FCAT Reading when school size is a factor.
Population and Sample
The population for this study was comprised of three elementary schools from
each of the sixty-seven school districts in the state of Florida. The elementary schools
were divided into three categories based on the population of each school. The
categories were as follows:

4
A school with 1 – 300 students was considered small.
A school with 301 – 599 students was considered medium.
A school with 600 or more students was considered large.
The sample for this study included the school-based data that was collected for each
school. This information included the number of students, the 2006 – 2007 FCAT Math
scores for grades 3 - 5, and the 2006 – 2007 FCAT Reading scores for grades 3 - 5. At
the time of this study, the 2007 – 2008 FCAT results were not available.
Data Collection
All of the data used in this study was compiled from the Florida Indicator Reports
generator and school accountability reports available on the Florida Department of
Education website.
Data Analysis
A One-way ANOVA statistical analysis was used to discover whether there was a
statistically significant difference in student achievement on the FCAT when school size
is a factor.
Significance of the Study
This study included data from the sixty-seven school districts in the state of
Florida. The data will demonstrate the similarities and differences of the Florida school
districts through an in-depth analysis of student achievement on the FCAT and school
size. The results of this study will provide information and guidance to school and
school district decision makers regarding school size relative to student achievement.

5
Limitations
There are factors which could limit the validity of this research. One of those
factors could be the variations of school district size in Florida that will limit the likelihood
of having an elementary school to fit each of the three school size parameters. The
reality that some schools may or may not report all of the information being analyzed
was taken into consideration. The study is limited to the accuracy of the reported data
on the Florida School Indicators Report. Additionally, schools may be small due to
outside factors, including school choice, the needs of the school district, and the
location of the school.
Delimitations
This study is delimited to reported data of FCAT scores and student population
on the Florida School Indicators Report for the 2006-2007 school year. This study is
delimited to one school for each of the three set school size parameters. The focus of
this study is placed solely on elementary school size, therefore, middle school and high
school information, for each of the school districts, has been excluded for the purpose of
this study.
Organization of the Study
Chapter 1 of this study has provided the general background of the study,
introduced the problem, the components, the research questions, and the methodology
used to acquire and analyze the data for this study. Chapter 2 contains a review of the
relevant literature to school size and student achievement. Chapter 3 includes the

6
methods and procedures used to collect and analyze the data for this study. Data
analysis and the results of this study are presented in Chapter 4. Chapter 5 provides a
summary of the findings, conclusions, recommendations for practice, and
recommendations for future research.

7
CHAPTER 2 REVIEW OF LITERATURE
Introduction
This chapter is a review of related literature pertaining to the main subjects of this
study: school size and student achievement. Other variables, such as school operation
costs, per-pupil expenditures, socio-economic status, school location, and school
culture, are presented in the review of literature as they pertain to different studies. The
review of literature is presented with six subtitles: a) The Historical Impact of School
Size, b) School Size, c) School Reform Efforts, d) Florida School Reform Efforts, e)
Student Achievement, and f) Effects of School Reform.
The Historical Impact of School Size
With the continuous efforts to effectively improve school districts and to
restructure schools, researchers have closely studied the evolution of public education.
According to Cotton (1996), between the years of 1940 to 1990 the number of school
districts throughout the country declined by 87% from 117,108 to 15,367. Cotton (1996)
further stated ―between 1940 and 1990, the total number of elementary and secondary
public schools declined 69 percent—from approximately 200,000 to 62,037—despite a
70 percent increase in the U.S. population. Consequently, the average school
enrollment rose more than five times—from 127 to 653‖ (p. 1). These changes would
impact the course of public education for decades to follow.
Lee and Smith (1993) researched the differences in school structures while
focusing on historical accounts that over time have proven to may have been the more

8
effective manner of operating a public school system. Lee and Smith (1993) wrote
―changes toward larger, more efficient, and more differentiated comprehensive high
schools have led to the alienation of a considerable number of students‖ (p. 166). Lee
and Smith (1993) also found adverse effects to the declination of the number of schools.
Lee and Smith (1993) wrote ―besides inducing alienation, differentiation of functions and
an emphasis on instruction that is grouped by ability – important features of
bureaucratically organized schools – magnify the social distribution of achievement‖ (p.
166).
School size and the declination of public school districts and schools has been
an ongoing challenge for education. As with any major organization or entity, the
impact of one issue brings awareness to other issues. Thompson (1996) wrote ―when
we reduce the number of schools in favor of a few large ones that fits the nation‘s cry for
efficiency‖ (p. 6). The cry for efficiency that Thompson (1996) wrote about was
answered with the No Child Left Behind Act of 2001. Since the development and
implementation of NCLB, many public school districts have been inundated with
uncertainties towards how to improve student achievement while focusing on
accountability. Gallucci (2008) states the ―NCLB and other contemporary education
policies, in taking aim on the quality of instructional experiences for public school
students in the United States, pose learning challenges for educators across levels of
the system‖ (p. 541). NCLB‘s academic accountability tool is simply too narrow to
measure students‘ mastery of these skills (Sofo, 2008). Sofo (2008) also stated the
following:

9
Instead, the 2001 legislation defines appropriate student achievement as
scoring above a proficient score on a single standardized test, and both
the test and the score are chosen independently by each of the fifty states.
Furthermore, the tests are not designed to measure performance in any
areas other than content knowledge and skills related to math and
reading. Finally, the current law does not address each student‘s
academic growth or decline from year to year.
With the implementation of NCLB, researchers have found areas as to which the
legislation could be improved to offer a more definite way of tracking student
achievement and accountability. Those research efforts interconnect other pressing
educational matters, such as school size.
School Size
Since the mid 1800s, historical accounts ensure that school size has been a
perpetual concern in education. Since evolving from the single teacher, one-room
school house of the 1800s to the large school buildings of today, researchers have
found considerable evidence that small schools offer more advantages to students and
academic success than large schools. There have been studies performed that both
support and dispute these findings. Within this section is an overview of different
studies that analyze school size based on various factors and variables. The studies
also offer recommendations for optimal student membership.
Meier (1995) wrote of her experiences with school reform and found replacing
larger schools with smaller schools has proven to be a great success in East Harlem‘s

10
District 4. Meier (1995) found that since opening The Central Park East Secondary
School (CPESS), a inner-city school that educates approximately 450 students in
grades 7-12, over 95 percent of the students have received their diplomas, and 90
percent of those students went on to attend college. Statistics show that prior to the
opening of CPESS, the citywide average graduation rate was only 50 percent. Meier
(1995) further promotes school reform for Julia Richman High School, which was
classified as a failing school, by transforming the large school into six autonomous small
schools, all located within the same facility, and finding great success with all six small
schools.
Vander Ark (2002) found ―studies show that small schools have higher
attendance rates and lower dropout rates, their students have higher grade point
averages, and students and teachers report greater satisfaction with the school
experience‖ (p. 55). Vander Ark (2002) stated that the Bill & Melinda Gates Foundation
has ―invested more than $250 million in grants nationwide for creating new small
schools and transforming large high schools through the schools-within-a-school model‖
(p. 55). In recent years through this initiative, The Gates Foundation has ―learned some
lessons from its investments in pathbreaking schools‖ (Alter, 2008). The Gates
Foundation has found that ―rigorous accountability is the only option‖ and the creating of
path breaking schools proved ―insufficient without major changes in personnel‖ (Alter,
2008). Consequently, Wainer and Zwerling (2006) found that in 2005, after awarding
nearly $1.7 billion in grants for school reform, The Gates Foundation decided to move
―away from its emphasis on converting large high schools into smaller ones and instead
giving grants to specially selected school districts with a track record of academic

11
improvement and effective leadership‖ (p. 303). Wainer and Zwerling (2006) further
stated that The Gates Foundation believed that ―improving classroom instruction and
mobilizing the resources of an entire district were more important first steps to improving
high schools than breaking down the size‖ (p. 303).
Overbay (2003) agreed with The Gates Foundation initiative in its earlier stages
by stating ―it may be possible to achieve the desired student outcomes by reorganizing
school populations or by creating small learning communities within existing facilities‖
(p.1). Overbay (2003) also found the following:
After examining, 9,812 sets of records for the same students across grade
levels, Lee and Smith (1997) found a curvilinear relationship between high
school size and achievement. According to their findings, high school
achievement rises as enrollment rises to 600, remains steady up to about
900, and then drops with increasing school size.
The most recent metanalysis of production-function studies (Andrews et
al., 2002) resonates with these findings, indicating that high schools above
1,000 students and elementary schools above 600 students may
experience diminishing returns; that is student performance and school
services appear to decline relative to increasing inputs (e.g. the number of
teachers, administrators, and support staff). Thus, some available
evidence suggests that schools can be too small, but that some schools
(high schools, especially) may be too large. Still, Andrews et al. caution
readers that methodological oversights in many available studies can
make comparing their results somewhat problematic.‖ (p. 3).

12
Overbay (2003) constructed a table within her research that offered a brief
overview of many frequently cited studies on optimal school size. In 1984, one study
performed by Eberts, Key, Hole, and Stone focused on 287 elementary schools where
the dependent variable was achievement scores, and the independent variables
included school size and student, teacher, principal, and school-climate characteristics
(Overbay, 2003). Overbay (2003) stated that Eberts, Key, Hole, and Stone found that
small schools (under 200 students) and medium schools (400-600 students) had
minimal impact on student performance; however, student performance exhibited a
significant decline as student population grew towards 800 students. Overbay (2003)
also stated that a key limitation in Eberts, Key, Hole, and Stone‘s study was the
exclusion of control for school location.
Overbay (2003) included a 1982 study by Lindsay that investigated 14,668
students in 328 elementary schools in which the dependent variables included
extracurricular participation rates, student satisfaction and attendance. The
independent variables were school size, socio-economic status, student ability, and
location. Overbay (2003) states that Lindsay found ―schools with 100 pupils or less in
both urban and rural areas had higher extra-curricular participation rates, student
satisfaction, and attendance, controlling for socio-economic status and ability‖ (p. 4).
Overbay (2003) found the limitation to this study included the exclusion of a variable for
suburban schools.
Lee and Smith (1997) studied 9,812 sets of student records from 789 high
schools. The dependent variables included reading and mathematics achievement and
the independent variables included school size and socio-economic status. The study

13
was based off of three research questions: a) Which size high school is most effective
for student learning?, b) In which size high school is learning most equitably
distributed?, and c) Are size effects consistent across high schools defined by their
social compositions? Lee and Smith (1997) found that in terms of the effectiveness of
student learning, enrollment should fall between 600 and 900 students. Lee and Smith
(1997) also found that ―in schools smaller than this, students learn less, those in large
high schools (especially over 2,100) learn considerably less‖ (p. 205). ―Learning is
more equitable in very small schools, with equity defined by the relationship between
learning and student socioeconomic status (SES)‖ (Lee & Smith, 1997). Lee and Smith
(1997) found the following:
An important finding from the study is that the influence of school size on
learning is different in schools that enroll students of varying SES and in
schools with differing proportions of minorities. Enrollment size has a
stronger effect on learning in schools with lower-SES students and also in
schools with high concentrations of minority students. (p. 205)
With the number of studies performed on school size, there are different
limitations that would allow for the variation in results. Hylden (2004) found
discrepancies while researching what is considered the optimal size for small schools.
Hylden (2004) found that in a 2002 report commissioned by the Rural School and
Community Trust, that an effective high school would have an upper limit of 300
students, whereas, The Cross City Campaign for Urban School Reform recommends
capping enrollment in high schools at 500 students. Through research in rural North
Dakota, which was used to encourage the continuation of operation of small schools in

14
the area versus closing them to create one large school, Hylden (2004) found that
smaller schools, with enrollments of under 50 students, outperformed schools with over
500 students by wide margins. Hylden (2004) further encouraged policymakers to keep
the doors of the smaller schools open and focus on providing the resources to continue
to have the smaller learning environments which have proven to be beneficial to its
students.
In an earlier study, ―Conant (1959) determined that in order to offer the best
possible college preparatory curriculum, a high school should have at least 100
students in its graduating class‖ (Bard et al, 2006). In support of large schools, Conant
further stated ―that the most outstanding problem in education was the small high
school, and that the elimination of small high schools would result in increased cost-
effectiveness and greater curricular offerings‖ (Bard et al, 2006).
Craig Howley and Robert Bickel (1999), Mary Anne Raywid (1999) and Karen
Irmsher (1997) have all researched school size extensively. Their studies offer different
views on the topic of school size and provide in-depth findings that further support the
need for close observations of school size in public education. Comparing and
contrasting these studies will further support the need for performing a study that
combines the variables: school size and student achievement, with a focus on Florida
schools.
The Matthew Report, a study that evolved from a series of previous studies,
tested the ―negative influence of poverty on academic achievement in California,
Alaska, and West Virginia‖ (Howley, Bickel 1999). The Matthew Report also included
the states of Ohio, Georgia, Texas and Montana to further research the variables of

15
socio-economic status and school size. The report provided ―strong evidence that a
one-best, everywhere ‗optimal‘ school size is a figment. The appropriate size for a
school, when the aim is to maximize aggregate student achievement, depends on
community circumstance, operationalized here as aggregated SES [socio-economic
status]‖ (Howley, Bickel 1999). The Matthew Report showed that although there is no
optimal school size that ―schools can be so large as not to serve anyone very well‖
(Howley, Bickel 1999). The report encourages the establishment of an ―upper limit of
school size‖ (Howley, Bickel 1999).
Raywid (1999) analyzed the benefits of small schools while determining, through
previous research, what population size impact a small school. Based on the financial
aspect of small schools, Raywid (1999) found the following:
When viewed on a cost-per-student-enrolled basis, they are somewhat
more expensive. But when examined on the basis of the number of
students they graduate, they are "less" expensive than either medium-
sized or large high schools. (These findings hold true for the small
academic and alternative schools, but not for the more costly "last chance"
alternative or vocational schools.) (p. 3)
Much of Raywid‘s findings delivered an understanding that smaller schools
create better climates and educational environments for students. A look into some of
New York District 3 and District 4 schools determined that dropout rates had
significantly decreased through the creation of small schools.
Irmsher (1997) conducted research that examined whether or not larger schools
have ―produced greater academic success at lower costs‖ (p.2). The findings showed

16
the contrary - larger high schools did not produce greater academic success at lower
costs. Irmsher stated ―although large schools offer greater curricular variety, only a
small percentage of students take advantage of advanced and alternative classes‖ (p.
2).
Irmsher‘s study further detailed which groups benefited from small school sizes.
A higher percentage of students, across all socioeconomic levels, are
successful when they are part of smaller, more intimate learning
communities. Females, nonwhites, and special-needs students, whether
at risk, gifted, exceptional, or disadvantaged, are all better served by small
schools. Security improves and violence decreases, as does student
alcohol and drug abuse. (p.3)
Through the number of research efforts on school size, there is evidence that
shows there is no difference in student achievement in large or small schools. There
were also studies that show student achievement in small schools out performed
student achievement in large schools. However, the studies provide no evidence that
large schools were superior to small schools. Even with the conflicting results, the
relationship between school size and student achievement is relatively too small to
distinguish.
Although the results of the previously stated studies vary by the numerical value
of each of the enrollment ranges, each study concludes that school size should remain
relatively small. The review of the literature builds a solid foundation for the purpose of
this study based on the variations of optimal school size. Previous studies show that
there is no true optimal size for a school, however, through continued research;
17
parameters can be set to find the appropriate size based on the geographic area of
each school district.
Although the studies offer rationale supporting smaller schools, the findings
articulate the need for more studies to be conducted that can show a relationship
between school size and student achievement specifically in the state of Florida. The
results from the aforementioned studies all contribute community and socio-economic
status as variables that enable or interrupt student achievement. With the extreme
variations of socio-economic status and school size in the school districts in Florida, it is
necessary to examine the state to find what can be done, if anything, to improve student
achievement based on school size and factors contributing to school size.
School Reform
Kahne, Sporte, and Easton (2005) conducted a study on school reform in
Chicago based on a recognized need for reform in the urban public high schools. The
researchers found ―only 54 percent of the 2000-01 freshman cohort graduated in four
years‖ (Kahne et al, 2006). Only 36% of Chicago‘s eleventh graders met the 2004
Prairie State Achievement Exam standards in reading and only 28% in Math, which was
significantly lower than the state of Illinois‘ average for reading and math; 57% and
52%, respectively. The researchers also found ―only 6.5 percent of those who started
as thirteen-year-olds in Chicago‘s public high schools in 1998 or 1999 had earned a
bachelor‘s degree by the time they were 25. Only about 3 percent of male African-
American and Latino students did so‖ (Kahne et al, 2006).
18
Kahne, Sporte de la Torre and Easton (2006) detailed that their study consisted
of an quantitative analysis of ―how small schools compare to the rest of Chicago Public
Schools, taking into account individual- and school-level characteristics.‖ The first
phase of the study was based on three questions: ―How is Chicago‘s effort to
implement small schools on a large scale proceeding? Are small schools creating the
contexts for principals, teachers, and students that reformers believe will ultimately lead
to desired reform and improved outcomes? And what are early indications of the small
schools‘ impact on student outcomes?‖ (Kahne et al, 2005). To respond to these
questions, the researchers developed a theory of change, as detailed in Figure 1. The
framework ―was developed through consideration of relevant literature, analysis of
documents related to the initiative, and through interviews and discussions with key
stakeholders‖ (Kahne et al, 2005). Kahne, Sporte, and Easton (2005) explained that the
framework ―portrays the mechanisms through which various features of small school
reform are thought to promote desired contexts for students and teachers. It also details
how these contexts, in the presence of district, state and federal influence, can promote
both curricular change and desired outcomes‖ (p. 10).

19
Figure 1: Theory of action - Chicago High School Redesign Initiative

20
Kahne, Sporte, de la Torre, and Easton (2006) detailed many of their findings of
this study. Although the researchers found that juniors at the Chicago High School
Redesign Initiative (CHSRI) schools did not score differently on the Prairie State
Achievement Exam than their non-CHSRI counterparts, they did find that first-time
freshmen at CHSRI attended school more than their peers at other Chicago public high
schools. Another finding detailed the following:
First-time freshmen at CHSRI schools were more likely to be on-track to graduate than
similar students at similar schools in all three years, but the difference was not large
enough to be statistically significant. The difference ranged from about 9 percentage
points for academic year 2002-03 to about three percentage points in 2004-05. (p. 2).
Kahne, Sporte de la Torre and Easton (2006) found, later in the study, that
smaller schools are fostering more personal learning environments for students and
healthier work environments for teachers. ―These differences may be related to the
differences in dropout rates and absences that we found in our analysis, but they do not
appear to be spurring increased instructional reform activity, differing instructional
practices, or improved student achievement test scores‖ (p. 2).
Haenn (2002) conducted research on class size and student success through
three lab schools and two traditional elementary schools. The lab schools were created
to decrease the number of students in a given inner city school, however, they were not
associated with any university nor were they used to experiment with innovative
pedagogical methods. The two traditional schools were selected due to their
adjustments to their budget to create more space for smaller class sizes. The purpose
of this study was based on of previous research conducted by Glass and Smith (1978).

21
―The primary catalyst of the debate over class size was a meta-analysis of the research
on class size research that indicated that student improvements were relatively small for
class sizes of about 20 students, but significantly improved for classes with fewer than
15 students‖ (p. 4).
Haenn (2002) found that lab schools were making positive impacts on student
achievement in primary grades, but each grade level performed differently. Haenn
(2002) stated that students in kindergarten, first grade, and second grade outperformed
their counterparts in the traditional schools. However, one of the three lab schools
outperformed their traditional school counterparts in grade 4. In third and fifth grades,
the Lab School students did not show higher achievement than the students in the
traditional schools.
Sharing the same opinion with researchers who believed reducing class size is a
way to improve student achievement, Graham (2009) stated ―reduced class size is a
necessary strategy to close the achievement gap and address inequalities in public
school education caused by years of neglect‖ (p. 1).
In 1996, the state of California initiated school reform that reduced the size of K-3
classes across the state by approximately 10 students per class. The efforts held
financial obligations that surpassed one billion dollars, which proved beneficial for
researchers who found significant conclusions from this initiative. Jepsen and Rivken
(2007) found that ―the ten-student reduction in class size raised school average
mathematics and reading achievement by roughly 0.10 and 0.06 standard deviations of
the school average test score distribution, respectively, holding other factors constant‖
(p. 224).

22
Although no study has produced significant numbers to defend one size school
over the other, reforms should continue and future researchers should incorporate other
variables into their studies to solidify any findings in favor of small schools or large
schools.
Florida School Reform Efforts
Conroy and Arguea (2002) stated ―the state of Florida‘s A-Plus plan for education
included provisions to ‗(set) high standards and provide adequate funding, and then
hold schools and educators accountable for the performance of the students they are
entrusted to educate‘‖ (p. 656). Among these provisions was the class size amendment
of 2002.
McNeil (2008) states, in reference to the Florida Legislature‘s class size
amendment, ―the new requirements mean that districts must reduce pupil-teacher ratios
in every classroom to 18-to-1 in prekindergarten though 3rd grade, 22-to-1 in grades 4-
8, and 25-to-1 in high school, or face financial penalties from the state department of
education‖ (p. 1).
On the basis of class size reduction, Harris (2004) recommended that the Florida
Legislature fund an external review of class size reduction costs and benefits ―to provide
a steady source of objective information as the amendments are implemented‖. Porter
and Soper (2003) state the offerings of a class size reduction plan:
A carefully designed class size reduction (CSR) plan offers a systematic
approach to school wide improvement that incorporates every aspect of a
school, from curriculum and instruction to school management; a program

23
and a process designed to enable all students to meet challenging
academic content and performance goals; a plan for using research to
direct the move from multiple, fragmented educational programs to a
unified plan with a single focus: academic achievement; incentives and
direction for long-term, collaborative efforts among school staff, parents
and district staff (p. 4).
Harris (2004) believes that the class size amendment ―can be funded without
changing Florida‘s status as a low-tax state‖ (p. 11.12). Harris (2004) further states that
the actual costs of class size reduction will be lower than even the lowest estimates
being considered by the Florida Legislature while finding ambiguity about ―what costs
will be incurred‖ (p. 11.12).
While further researching the effects of the class size amendment, McNeil (2008)
found that starting with the 2008-09 school year, Florida school districts must meet ―new
size caps in each classroom, robbing school officials of the wiggle room they enjoyed
during the phase-in period, when school systems were allowed to use district-wide and
then school wide averages in calculating class sizes‖ (p. 1). McNeil (2008) reported
―officials warn that the mandate will mean hiring more teachers and building more
classrooms at a time when the state is facing an ongoing $2 billion budget deficit and
new pressures from a recently approved constitutional amendment cutting property
taxes‖ (p. 2).
There is a growing need to learn how large Florida‘s public schools should
recruit, and how education funds in the state of Florida are being allocated in support of
student achievement. The National Education Association (2007) stated that in fall of
24
2005, the state of Florida was ranked fourth in the nation in total public school
enrollment, however, it ranked 41st in the number of school districts. In regards to the
amount of money spent on public education, Florida ranked 50th in per capita
expenditures of state and local governments for all education (National Education
Association, 2007).
In an effort to emphasize the need for legislative reform on school funding in
Florida, Harris (2004) reported that funding for education in the state of Florida has
increased at a slower rate than the rest of the nation of 1.4% annually between the
years of 1981-2001. Harris (2004) further states that ―like businesses, schools compete
with other organizations in the private sector to attract employees‖ as a basis for Florida
to continue to increase spending to improve education throughout the state. Harris
(2004) continues with the following:
It is possible to place too much emphasis on financial responsibilities as a
factor affecting education quality, especially in a budgetary analysis such
as this. More so than most states, Florida has engaged in a wide variety of
other reforms, from high-stakes testing to charter schools, that are all part
of the state‘s efforts to improve education. Combined with the state‘s
relatively low spending, it is therefore clear that Florida‘s school
improvement efforts have focused on accountability rather than on
enhancing resources. The recent votes approving constitutional
amendments that enshrine a standard of quality suggest that the public
may demand a more balanced approach (p. 11.3).

25
While funding Florida public education comes from both state and local sources,
the state has seen an increase in funds since the initiation of the Florida Education
Finance Program (FEFP) in 1973-73 (U.S. Department of Education, 2001). The FEFP
bases public education‘s financial support and financial resources on the number of
participating students in educational programs throughout the state (U.S. Department of
Education, 2001). State funds for public school support are provided primarily through
the FEFP, while the major source of revenue for state support of public schools is the
state sales tax and the major source of revenue for local support of public schools is
property tax (U.S. Department of Education, 2001).
As Harris (2004) and others aim towards protecting public schools in Florida, the
National Education Association (2003) found that although all 50 states offer either
abatements or tax increment financing (TIF) or both, Florida is one of only two states
that shield school revenues from both abatements and TIF. The National Education
Association (2003) states that tax increment financing is defined as the process of
granting long-term diversions of certain districts‘ property taxes to corporations making
investments in those districts. The National Education Association (2003) also stated
that the ―state law requires votes of each county to approve an enabling referendum
before county officials can start awarding property tax abatements‖ (p. 22). This state
law grants the public full involvement in the funding decisions for public schools. This
information can be interpreted to show that school enrollment and school funding are
elements that perpetuate overcrowded schools and classrooms, which is directly related
to student success.

26
Student Achievement
Fulton (1996) reported that for years policymakers, educators and community
members have been working towards improving student achievement through school
reform. According to Fulton (1996), ―policymakers must continue to ask for evidence
and to push the research community to provide the types of information they need to
make sound laws. Building these practices into the policymaking process will increase
the chance that education reforms will lead to improved student performance‖ (Fulton,
p. 8).
The Florida Comprehensive Assessment Test (FCAT) is the standardized test
administered throughout the state of Florida annually. The purpose of the FCAT is to
access student achievement in the third grade through the eleventh grade in reading,
mathematics, science and writing based on their knowledge of the Sunshine State
Standards (SSS). The FCAT includes norm-reference tests that allow for the
performance of Florida students to be compared to that of the performance of students
nationally in reading comprehension and mathematics problem solving. Smith (2004)
states the following:
The Florida Comprehensive Assessment Test (FCAT) is the principal
instrument to measure proficiency: a ―proficiency standard‖ is set for each
grade level. Students scoring above the cutoff score advance to the next
grade. The students scoring below the cutoff are targeted for intensive
remediation of their low achievement in reading, math, and writing.
Schools must identify students whose results are below the proficiency

27
standard and concentrate their resources on remediation. The state must
monitor and enforce school compliance (p. 3.1).
Smith (2004) further states:
The FCAT proficiency standard makes no allowance for the standard error
(the normal variation around any score on a test) of FCAT scores or for
the cutoff score. This combination of one absolute standard, the strict
monitoring, and the tight enforcement make the Florida policy one of the
most stringent in the nation (p. 3.1).
According to the Success for All Foundation (2006), elementary schools in the
state of Florida have steadily shown significant increases on the FCAT Reading
assessments.
The Learning First Alliance (2004) states that educators and parents want
children to attend safe, supportive schools that use sound methods to enhance
students‘ academic, social, emotional, and ethical growth. On the other hand, Porter
and Soper (2003) find that ―conventional wisdom maintains that American public
schools are in crisis – they are not adequately preparing our youth to be successful and
economically productive in the future‖ (p. 2). Porter and Soper (2003) further state the
measures needed to take toward comprehensive school reform that will assist in
developing safe and supportive learning environments with much of the research
grounded in class size reduction. Those measures include encouraging schools and
districts to complete ―a thorough needs assessment to determine their own strengths
and weaknesses, and to find the strategy that best fits the needs, culture and climate of
their schools‖ (p. 9), acquiring the support from the community and the school system,

28
and to ―work hard to ready themselves and the community prior to implementation‖ (p.
9) of the comprehensive school reform.
According to Mosteller (1995), students who begin their education in smaller
class settings continued to perform better than students from larger class settings with
or without a teacher‘s aide. In other research pertaining to small schools and student
achievement, Gamoran (1996) found the following:
Students with average reading scores who entered magnet schools by
lottery tended to improve their reading achievement more than otherwise
similar students who, because they were unsuccessful in the magnet-
school lottery, attended comprehensive schools. The magnet-school
"lottery winners" also earned more credit toward graduation and were less
likely to drop out prior to high school (p. 4).
Porter and Soper (2003) analyzed piecemeal school reform attempts and failures
in Tennessee and California. The study examined Tennessee‘s success with the
overall school reform process and California‘s policymakers enactment of a voluntary
class size reduction plan due to Tennessee‘s success. Porter and Soper (2003) found
the following:
Single focus reform efforts cannot, by themselves, sufficiently change the
overall culture and academic climate of our most troubled schools. As
useful as smaller classes had been shown to be in Tennessee, in
California they could not solve – but rather highlighted – problems of
teacher qualification and severe shortages in resources. (p. 2)

29
In reference to school size, Friedkin and Necochae (1988) found that ―in the
empirical literature on the relationship between the size and performance of school
systems one finds reports of negative, negligible, and positive associations‖ (p. 237).
Friedkin and Necochea (1988) went on to ―examine the relationship for both schools
and school districts in light of the new hypotheses about the mechanisms through which
the size of a school system influences system performance‖ (p.237). Friedkin and
Necochea (1988) discovered that ―school system size has strong negative effects on
performance that are eliminated, but not strongly reversed, in high socioeconomic
status settings‖ (p. 237).
In 1968, Herbert J. Kiesling conducted a study that investigated ―the question of
school characteristics and achievement‖ (Kiesling, 1968, as cited in Fowler, Walberg,
1991). The findings displayed a ―negative relationship between achievement tests
(math and verbal ability tests) and school size‖ (Kiesling, 1968, as cited in Fowler,
Walberg, 1991).
Current literature on school size and student achievement exposes different
findings under each category. Studies have been conducted that discuss the
importance of school size in relation to student achievement, whereas much of the
research is in support of small schools and investigating the enrollment parameters that
define small schools.
Effects of School Reform
Research showed that schools and school districts are constantly seeking new
methods of providing the level of school reform necessary to improve student

30
achievement. Examining current school reform efforts will allow for future researchers
to compare and contrast previous undertakings to current and future efforts to improve
student achievement.
Rubenstien (2007) studied the Chugach School District, in South Central Alaska.
In the early 1990s, the Chugach School District had students who could barely read,
graduates struggling to maintain employment, and the district only produced a few
college graduates over the course of two decades. In 1994, the school district saw a
need for reform based on their low graduation rates, the high teacher turnover, and
through complaints from business leaders that the graduates of the Chugach School
District lacked the basic skills. The school district created a Quality School Model. The
Quality School Model is an individualized standards-based model where the students
take control of their education. A student can advance through the academic levels at
any given time throughout their academic career. The outcome of this model has
proven that school reform, when implemented correctly, can benefit all involved parties.
Rubenstien (2007) found the following
Now, more than 80 percent of Chugach students who took the state's
third-grade and ninth-grade exams last year passed in reading, and more
than 60 percent passed in math. Of the twenty-five graduates the district
has tracked since 2001, fifteen are enrolled in college or have already
graduated, five work full time, two are in the military, and two are stay-at-
home moms. Chugach can legally fund enrollment for students until age
twenty-one, though every student over eighteen counts against the
graduation rate under the No Child Left Behind Act. (p. 29).
31
Sunderman et al (2004) found common results when studying two groups of
educators from urban school districts in Fresno, California and Richmond, Virginia. One
recommendation found was that ―schools need additional resources, but not just more
money‖ (Sunderman et al, 2004). The teachers in both school districts recommended
that more supplemental educational services be available to assist in ―developing
coherent instructional programs‖ (Sunderman et al, 2004). In a similar study, Sofo
(2008) researched school district reform that took place in the Freedom Area School
District in Freedom, Pennsylvania. This research detailed how one school district
modified its instructional model to focus on ―The New 4 R‘s of rigor, relevance,
relationships, and reflection‖ and took a ―classroom-level intervention to support
struggling learners‖ to facilitate its major components of its reform. Although Freedom
Area School Districts‘ efforts began in the classroom, the effects of the initiative are
recognized throughout the schools and the school district.
Ford (2008) witnessed school reform first-hand as a principal of Johnsview
Village School. Johnsview Village School serviced a heavily transient community which
often made school reform difficult to prepare for. Over the course of three years,
Johnsview Village School was able to create and implement an instructional plan that
benefited all students and, ―as a result, managed a steady, incremental rise in reading,
writing, and mathematics‖ (Ford, 2008).
The desire for school reform can directly be connected to the enactment of the
No Child Left Behind Act of 2001 (NCLB). Fursarelli (2004) stated ―NCLB establishes a
comprehensive framework of standards, testing, and accountability absent in previous
federal legislation, and in the process, it removes some discretion from local education

32
authorities in determining what the goals and outcomes of education should be‖ (p. 72).
Fursarelli (2004) studied the potential impact of NCLB on minority groups and found that
―the promise of NCLB to enhance equity and opportunity by reducing the achievement
gap will likely remain unfulfilled due to insufficient funding and an overly simplistic
definition of the achievement gap‖ (p. 71). Mathis (2003) carried similar sentiments in
his study. Mathis (2003) found the following:
The primary promised benefit of NCLB is that 95% of all student groups
will reach their state test standards by 2014. Obviously, we don't know if
that goal can or will be reached. But if the system is not adequately
funded, then reaping that benefit is a remote and forlorn hope (p. 683).
Fursarelli and Mathis both agreed that NCLB holds a negative outlook on student
success based on funding issues; however, the American Federation of Teachers had a
more optimistic approach to curving the complexities of NCLB. The American Teacher
(2009) states the American Federation of Teachers plans to do the following:
Providing universal early childhood education, starting with low-income
households; preparing young people for high-skill, high-demand ―green
jobs‖; providing a boost to high-achieving students from low-income
households; offering high-quality educational choices within the public
school system; focusing intensely on improving low-performing schools;
establishing community schools that serve the neediest children by
bringing together services that they and their families need; ensuring that
every school facility is a place where teachers can teach and students can
learn; expanding teacher induction so that new teachers are not left to sink

33
or swim; creating an online teacher resource network with information on
curriculum, lesson plans, and source documents to enhance teaching; and
offering every student a well-rounded education that would stand in stark
contrast to the ―standardized test score competition‖ that has resulted from
NCLB (p. 6).
Summary
The purpose of this chapter was to provide a review of related literature and
present other relevant studies that would support the directive of this study. This
chapter provided information on previous studies that were conducted to focus on the
advantages and disadvantages of school size and how it directly affects student
achievement. The review of related literature offered substantial information that
confirmed that there is no optimal school size; however, studies have been performed to
determine where the enrollment parameters should be set to benefit student
achievement in specific geographic areas of the nation. It also presented studies that
have benefited student achievement based on the geographic areas‘ need, therefore,
further presenting evidence that there is no universal remedy available to increase
student achievement. Chapter 2 explained the findings of relevant research pertaining
to large schools and small schools while focusing on the many different endeavors
taking place across the country to improve student achievement.

34
CHAPTER 3 METHODOLOGY
Introduction
Chapter 3 provides an overview of the methodology utilized to study the
differences in student achievement when elementary school size is a factor. The
chapter includes the following sections: a) statement of the problem, b) population and
sample, c) data collection, d) data analysis, and e) summary.
Statement of the Problem
While there has been sufficient research on the effects of school size on student
achievement and student personal growth, there is limited information, to date,
regarding the effects of school size on student achievement in Florida public schools.
This study attempted to determine if differences exists in student achievement at the
elementary level when school size is a factor.
Population and Sample
The population for this study consisted of the elementary schools in the state of
Florida. The sample was comprised of three elementary schools from each of the sixty-
seven school districts in the state of Florida. For the purpose of this study, the
parameters that determined the size of the school were as follows:
A school with 1 - 300 students was considered small.
A school with 301 – 599 students was considered medium.
A school with 600 or more students was considered large.

35
Based on the parameters, there were a total of 130 schools within the sample.
Data Collection
The data collected for each school in the population included the number of
students, the 2006 – 2007 FCAT Math scores for grades 3, 4, and 5, and the 2006 –
2007 FCAT Reading scores for grades 3, 4, and 5. At the time of this study, the 2007 –
2008 FCAT results were not available. All of the data used in this study was compiled
from the Florida Indicator Reports generator and school accountability reports available
on the Florida Department of Education website.
Dependent and Independent Variables
The dependent variables for each of the tests were the percent of proficient
mathematics scores and the percent of proficient reading scores for the third, fourth and
fifth grade students. The independent variable was school size.
Data Analysis
Analysis of the data was completed by the researcher. The findings are further
discussed in Chapter 4.
In order to analyze the collected data, a one-way ANOVA statistical analysis was used
to discover whether there was a difference in student achievement on the FCAT when
school size is a factor.

36
Research Question 1
Research Question 1 asked what differences, if any, exist in student
achievement, based on the school-wide FCAT Math assessment at the elementary
level, when school size is a factor. A one-way ANOVA test was performed to determine
if a significant difference existed between student achievement and school size. The
dependent variable was the percent proficient in math for the third, fourth, and fifth
grades. The independent variable was school size.
Research Question 2
Research Question 2 asked what differences, if any, exist in student
achievement, based on the school-wide FCAT Reading assessment at the elementary
level, when school size is a factor. A one-way ANOVA test was performed to determine
if a significant difference existed between student achievement and school size. The
dependent variable was the percent proficient in reading for the third, fourth, and fifth
grades. The independent variable was school size.
Summary
Chapter 3 described the methodology and procedures used to analyze the
difference in student achievement on the FCAT standardized tests when public
elementary school size is a factor. Chapter 4 includes the data analysis and the
presentation of results for this study.

37
CHAPTER 4 ANALYSIS OF DATA
Introduction
This study investigated standardized test scores in mathematics and reading of
students in grades 3, 4, and 5, and public elementary school size in all 67 school
districts in the state of Florida. The data was compiled from the Florida School Indicator
Reports available at http://data.fldoe.org/fsir/. This chapter addresses the research
questions and presents the statistical findings.
Description of Population
The population for this study consisted of the elementary schools in the state of
Florida. The sample was comprised of three elementary schools from each of the 67
school districts in the state of Florida. However, the parameters set for this study
eliminated 71 schools based on data not being reported for the 2006-2007 school year
and multiple schools falling into one or more parameter. In the event that a school
district had two or more schools fall under one parameter, the median population was
found. That school was chosen to represent the parameter for that school district. For
the purpose of this study, the parameters that determined the size of the school were as
follows:
A school with 1 - 300 students was considered small.
A school with 301 – 599 students was considered medium.
A school with 600 or more students was considered large.
Based on the parameters, there were a total of 130 schools within the sample.

38
All of the data used in this study was compiled from the Florida Indicator Reports
generator and school accountability reports available on the Florida Department of
Education website.

39
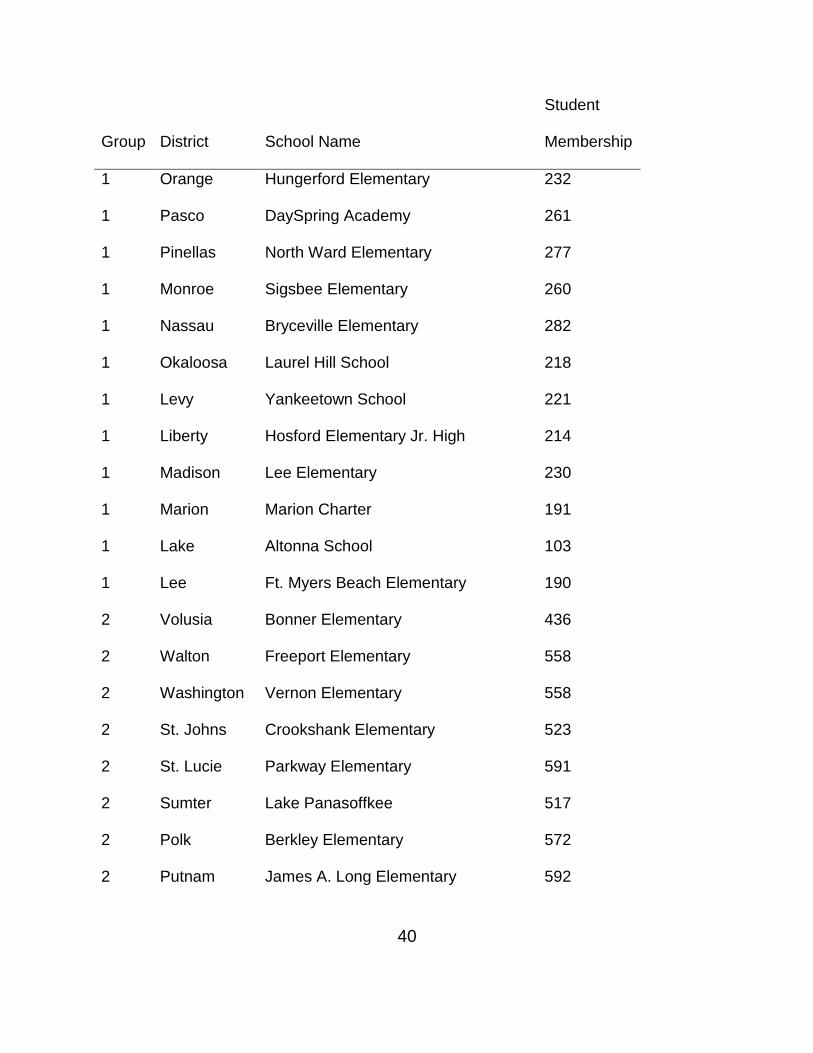
Table 1
Elementary Schools Studied
Group District School Name
Student
Membership
1 Alachua Chester Shell Elementary 245
1 Bradford Hampton Elementary 191
1 Brevard Robert L. Stevenson Elem 261
1 Calhoun Carr Elementary School 197
1 Dade Liberty City Elementary 264
1 Duval Arlington Elementary School 293
1 Escambia George S. Hallmark Elementary 260
1 Franklin H.G. Brown Elementary School 224
1 Gadsden Gadsden Elementary School 149
1 Glades West Glades Elementary 254
1 Hamilton South Hamilton Elementary 175
1 Holmes Poplar School 165
1 Walton Bay Elementary 274
1 Volusia Ortona Elementary 277
1 St. Lucie Ft. Pierce Magnet 290
1 Sumter North Sumter Intermediate 252
1 Putnam William D. Moseley Elementary 281
1 Santa Rosa Chumuckla Elementary 267
40
Group District School Name
Student
Membership
1 Orange Hungerford Elementary 232
1 Pasco DaySpring Academy 261
1 Pinellas North Ward Elementary 277
1 Monroe Sigsbee Elementary 260
1 Nassau Bryceville Elementary 282
1 Okaloosa Laurel Hill School 218
1 Levy Yankeetown School 221
1 Liberty Hosford Elementary Jr. High 214
1 Madison Lee Elementary 230
1 Marion Marion Charter 191
1 Lake Altonna School 103
1 Lee Ft. Myers Beach Elementary 190
2 Volusia Bonner Elementary 436
2 Walton Freeport Elementary 558
2 Washington Vernon Elementary 558
2 St. Johns Crookshank Elementary 523
2 St. Lucie Parkway Elementary 591
2 Sumter Lake Panasoffkee 517
2 Polk Berkley Elementary 572
2 Putnam James A. Long Elementary 592

41
Group District School Name
Student
Membership
2 Sarasota Englewood Elementary 451
2 Seminole Geneva Elementary 502
2 Orange Aloma Elementary 469
2 Osceola P.M. Wells Charter Academy 486
2 Palm Beach Allamanda Elementary 521
2 Pasco Trinity Oaks Elementary 553
2 Pinellas Azalea Elementary 599
2 Martin Hobe Sound Elementary 592
2 Nassau Atlantic Elementary 369
2 Okaloosa Annette P. Edwins Elementary 435
2 Levy Williston Elementary 498
2 Liberty W.R. Tolar K-8 434
2 Manatee Ballard Elementary 530
2 Marion South Ocala Elementary 546
2 Lafayette Lafayette Elementary 554
2 Lake Eustis Elementary 525
2 Lee Alva Elementary 461
2 Leon Woodville Elementary 475
2 Alachua Alachua Elementary 429
2 Baker MacClenny Elementary 511

42
Group District School Name
Student
Membership
2 Bradford Lawtey Community School 308
2 Brevard Coquina Elementary 449
2 Broward Dania Elementary School 555
2 Charlotte Peace River Elementary School 539
2 Citrus Homosassa Elementary School 366
2 Clay Clay Hill Elementary School 496
2 Collier Avalon Elementary School 562
2 Columbia Niblack Elementary School 339
2 Dixie James M. Anderson Elementary 579
2 Duval Arlington Heights Elementary School 582
2 Escambia Allie Yniestra Elementary School 441
2 Gadsden Greensboro Elementary School 435
2 Glades Moore Haven Elementary School 440
2 Hamilton Central Hamilton Elementary 546
2 Hardee Wauchula Elementary 585
2 Hendry Eastside Elementary 596
2 Highlands Lake Country Elementary 559
2 Hillsborough Broward Elementary 525
2 Holmes Ponce De Leon Elementary 384
2 Indian River Thompson Elementary 419

43
Group District School Name
Student
Membership
2 Gulf Port St. Joe Elementary 525
2 Jackson Sneads Elementary 541
3 Alachua C.W. Norton Elementary 703
3 Baker J Franklyn Keller Elementary 693
3 Bay Patronis Elementary 916
3 Bradford Southside Elementary 620
3 Brevard Discovery Elementary 960
3 Broward Challenger Elementary School 1221
3 Calhoun Blountstown Elementary School 630
3 Charlotte Vineland Elementary School 910
3 Citrus Citrus Springs Elementary School 958
3 Clay Lake Asbury Elementary School 1384
3 Collier Laurel Oak Elementary School 1196
3 Columbia Summers Elementary School 877
3 DeSoto Memorial Elementary School 939
3 Duval Sabal Palm Elementary School 1259
3 Escambia Hellen Caro Elementary School 858
3 Flagler Belle Terre Elementary School 1383
3 Gadsden
George W. Munroe Elementary
School 815

44
Group District School Name
Student
Membership
3 Hendry Country Oaks Elementary 825
3 Hernando John D. Floyd Elementary 1483
3 Highlands Sun 'N Lake Elementary 885
3 Hillsborough Boyette Springs Elementary 1062
3 Holmes Bonifay Elementary 690
3 Indian River Glendale Elementary 626
3 Volusia Deltona Lakes Elementary 1013
3 Wakulla Crawfordville Elementary 827
3 Walton Maude Saunders Elementary 748
3 Washington Kate M. Smith Elementary 851
3 St. Johns Mill Creek Elementary 1319
3 St. Lucie Rivers Edge Elementary 857
3 Sumter Bushnell Elementary 789
3 Suwannee Suwannee Elementary 699
3 Taylor Taylor County Elementary 683
3 Polk Alta Vista Elementary 951
3 Putnam Interlachen Elementary 809
3 Santa Rosa Berryhill Elementary 983
3 Sarasota Ashton Elementary 877
3 Seminole Bear Lake Elementary 1076

45
Group District School Name
Student
Membership
3 Palm Beach Binks Forest Elementary 1178
3 Pasco Sand Pine Elementary 1034
3 Pinellas Cypress Woods Elementary 750
3 Martin Palm City Elementary 900
3 Nassau Hilliard Elementary 732
3 Okaloosa Antioch Elementary 866
3 Okeechobee Everglades Elementary 707
3 Levy Chiefland Elementary 829
3 Madison Madison County Central School 820
3 Manatee Freedom Elementary 766
3 Marion Maplewood Elementary 875
3 Jefferson Jefferson County Elementary 654
3 Lake Lost Lake Elementary 1463
3 Lee Gulf Elementary 1359
3 Leon Gilchrist Elementary 917
3 Dade Ernest R Graham Elementary 2176
3 Union Lake Butler Elementary School 955

46
Research Question 1
What differences, if any, exist in student achievement, based on the school-wide FCAT Math at the elementary level, when school size is a factor?
Descriptive statistics for the population from the third, fourth, and fifth grade
FCAT Math results, including comparative means and standard deviations, are depicted
in Table 2. The groups are denoted as followed:
Group 1 – small schools with a population of 1 – 300 students.
Group 2 – medium schools with a population of 301 – 599 students.
Group 3 – large schools with a population of 600 or more students.
The descriptive statistics show that large schools performed the highest throughout
the state of Florida on FCAT Math, followed by medium schools and then by small
schools. Based on the One-Way ANOVA test, there was no statistically significant
difference found (F(2, 127) = 3.014 p > .05).
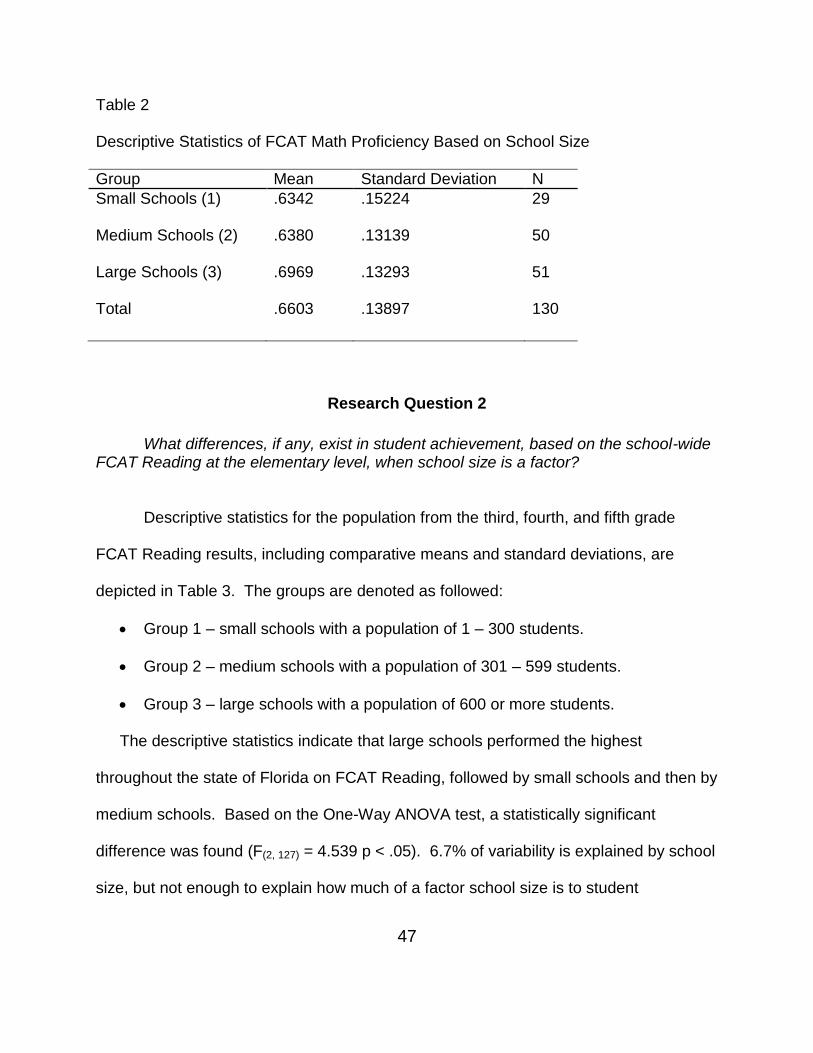
47
Table 2
Descriptive Statistics of FCAT Math Proficiency Based on School Size
Group Mean Standard Deviation N
Small Schools (1) .6342 .15224 29
Medium Schools (2) .6380 .13139 50
Large Schools (3) .6969 .13293 51
Total .6603 .13897 130
Research Question 2
What differences, if any, exist in student achievement, based on the school-wide FCAT Reading at the elementary level, when school size is a factor?
Descriptive statistics for the population from the third, fourth, and fifth grade
FCAT Reading results, including comparative means and standard deviations, are
depicted in Table 3. The groups are denoted as followed:
Group 1 – small schools with a population of 1 – 300 students.
Group 2 – medium schools with a population of 301 – 599 students.
Group 3 – large schools with a population of 600 or more students.
The descriptive statistics indicate that large schools performed the highest
throughout the state of Florida on FCAT Reading, followed by small schools and then by
medium schools. Based on the One-Way ANOVA test, a statistically significant
difference was found (F(2, 127) = 4.539 p < .05). 6.7% of variability is explained by school
size, but not enough to explain how much of a factor school size is to student

48
achievement. A Post Hoc test was performed to determine where the significance lay.
Due to having uneven group sizes, the Scheffe test was performed to determine where
the significance lay. The Scheffe test concluded that the significance lay between
medium and large schools. Based upon the Scheffe post hoc analysis, large schools
scored significantly better than medium schools. This difference contributed to the
significant results of the one way ANOVA.
Table 3
Descriptive Statistics of FCAT Reading Proficiency Based on School Size
Group Mean Standard Deviation N
Small Schools (1) .6972 .13970 29
Medium Schools (2) .6656 .10886 50
Large Schools (3) .7372 .11739 51
Total .7008 .12282 130
Summary
Chapter 4 presented an analysis of data collected that framed the course of this
study. Chapter 5 provides a summary and discussion of the results, conclusions,
implementations and recommendations for practice, and recommendations for future
research.

49
CHAPTER 5 SUMMARY AND RECOMMENDATIONS
Introduction
This chapter presents a review of the problem statement, methodology, and data
analysis for the study on school size and student achievement of elementary school
students on the FCAT Reading and FCAT Math standardized tests. Chapter 5 also
provides a summary, conclusion and recommendations that were derived from the data
analysis.
Statement of Problem
While there has been sufficient research on the effects of school size on student
achievement and student personal growth, there is limited information, to date,
regarding the effects of school size on student achievement in Florida public schools.
This study attempted to determine if differences exists in student achievement at the
elementary level when school size is a factor.
Methodology
Population
The population for this study consisted of the elementary schools in the state of
Florida. The sample was comprised of three elementary schools from each of the 67
school districts in the state of Florida.

50
Data Collection
For the purpose of this study, the parameters that determined the size of the school
were as follows:
A school with 1 - 300 students was considered small.
A school with 301 – 599 students was considered medium.
A school with 600 or more students was considered large.
Based on the parameters, there were a total of 130 schools within the sample.
All of the data used in this study was compiled from the Florida Indicator Reports
generator and school accountability reports available on the Florida Department of
Education website.
Data Analysis
Analysis of the data was completed by the researcher. In order to analyze the
collected data, a one-way ANOVA statistical analysis was used to discover whether
there was a difference in student achievement on the FCAT when school size is a
factor.
Summary and Discussion of Findings
Two research questions guided the course of this study. The following section
discusses the results and data analysis for each question.
Research Question 1
What differences, if any, exist in student achievement, based on the school-wide FCAT Math at the elementary level, when school size is a factor?

51
Based on the results of the one-way ANOVA test, large schools had a higher
percentage of proficiency among its students (μ = .6969) than both medium (μ = .6380)
and small schools (μ = .6342). However, there was no statistically significant difference
in any of the math analyses.
Research Question 2
What differences, if any, exist in student achievement, based on the school-wide FCAT Reading at the elementary level, when school size is a factor?
Based on the results of the one-way ANOVA test, large schools had a higher
percentage of proficiency among its students (μ = .7372) than both small schools (μ =
.6973) and medium schools (μ = .6656). The findings of this study showed that all
reading analyses were significant. The size of a school is a potential factor in explaining
the differences in mean FCAT proficiency rates. Based on the Scheffe Post Hoc Tests,
differences were significant only between medium and large schools, however, not
between small and medium schools or small and large schools.
Conclusion
The study has indicated that school size is not a factor that contributes to the
differences in proficiency rate of public elementary school students on FCAT Math in the
third, fourth, and fifth grades. Findings in this study suggest that for undetermined
reasons, elementary school students in large schools performed better on FCAT
Reading than students in small schools and medium schools.
There are multiple factors that could contribute to the findings of this study.
Resources, such as advanced technology and the availability of Reading Coaches, are

52
elements that could have contributed to there being a statistically significant difference
between medium schools and large schools on FCAT Reading. In compliance to the
No Child Left Behind Act (NCLB), school choice is an aspect to take into consideration
when examining student achievement when school size is a factor. Through NCLB,
parents have the right to send their children to better performing schools, which possible
creates an adverse affect on underperforming schools‘ population and FCAT scores.
Additional facets to take into consideration when examining student achievement when
school size is a factor are student to teacher ratios and the variety of programs offered
at the various schools.
Recommendations for Practice
The findings of this study can be used as a catalyst for school size reform in the
state of Florida. Based on this study, it is clear that schools that are considered large
are more effective in reading performance. Although this study displayed results that
show evidence of no statistical significant difference in mathematics achievement,
research has shown that small schools offer ―fewer discipline problems, lower dropout
rates, higher levels of student participation, steadier progress toward graduation and
more learning‖ (Raywid, 1997). The research strongly suggests that there are
underlying factors that should be investigated to find out what is causing the ambiguity
of the results of this study. The following are recommendations for practice:
1. Focus on which practices in large schools which can further benefit small and
medium schools in reading achievement.

53
2. Have political decision makers and education leaders use this information to
discuss the importance of school size and student achievement, while focusing
on how to improve mathematics achievement.
Recommendations for Future Research
―From reviewing the literature, it appears that there is not an ideal or optimal
district or school size that is universally agreed upon‖ (Bard et al, 2006). Based on the
analysis of the data within this study the following recommendations for future research
include:
1. As research supports the effects of small schools, more conclusive research
should be performed to settle discrepancies between appropriate school size
parameters before new laws are presented for discussion.
2. An expansion of this study would examine school size and student achievement
in the state of Florida over the course of five to seven years to observe whether
there is a change in the level of significance of each variable.
3. Further interest could be found in determining what factors are to be considered
in determining why the FCAT Reading results differ from the FCAT Math results
among the different size schools.
4. Further investigation of this study would allow for researchers to determine the
factors that allowed for larger schools to perform better on FCAT Reading.
5. A study can be developed to determine why there was no statistically significant
difference between the small, medium, and large schools in FCAT Math student
achievement.

54
6. Future studies could include controlling school location (urban, suburban, and
rural) throughout the state of Florida as an additional independent variable.
7. Develop future studies that analyze additional variables that could help provide
more detailed information on precisely how school size affects student
achievement specifically in the state of Florida (i.e. school location, school
programs, school resources, socio-economic status, etc).
8. An expansion of this study would examine school size and student achievement
in the state of Florida for various student populations (i.e., White, Black, Hispanic,
SES, ESE).
9. Another expansion of this study would include examining the difference between
the delivery systems in small schools, medium schools, and large schools.
Law makers should be ―cautious about making broad policy decisions about
school size‖ (Lashway, 1999). As other studies are developed, specifically for the
state of Florida, and analyzed, state law makers will be able to create legislation that
will benefit student achievement while also putting limitations on school size.
55
APPENDIX A MAP OF FLORIDA SCHOOL DISTRICTS

56
Figure 2: Map of Florida School Districts

57
APPENDIX B FCAT READING DATA FOR GRADE 3

58
Table 4
FCAT Reading data for Grade 3
District School Name – Group 1 FCAT Reading
3rd grade Percent Level 3
FCAT Reading
3rd grade Percent Level 4
FCAT Reading
3rd grade Percent Level 5
Total # of students
FCAT Read3 L3
Total # of students
FCAT Read3 L4
Total # of students
FCAT Read3 L5
Alachua Chester Shell Elementary 29 21 0 9.86 7.14 0
Bradford Hampton Elementary 54 25 0 12.96 6 0
Brevard Robert L. Stevenson Elem 14 48 36 6.16 21.12 15.84
Calhoun Carr Elementary School 35 42 8 9.1 10.92 2.08
Dade Liberty City Elementary 25 7 0 11 3.08 0
Duval Arlington Elementary School 23 17 2 11.04 8.16 0.96
Escambia George S. Hallmark Elem 50 21 0 12 5.04 0
Franklin H.G. Brown Elementary School 37 29 0 12.95 10.15 0
Gadsden Gadsden Elementary School 28 33 6 5.04 5.94 1.08
Glades West Glades Elementary 51 21 0 27.03 11.13 0
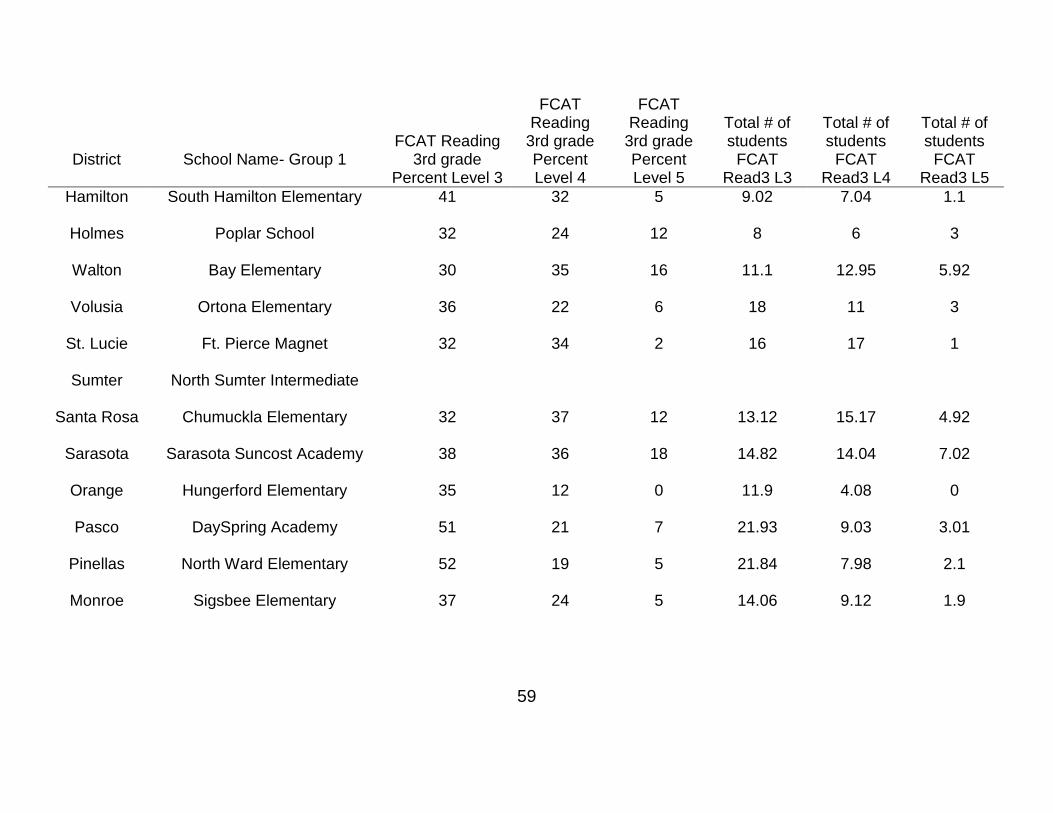
59
District School Name- Group 1 FCAT Reading
3rd grade Percent Level 3
FCAT Reading
3rd grade Percent Level 4
FCAT Reading
3rd grade Percent Level 5
Total # of students
FCAT Read3 L3
Total # of students
FCAT Read3 L4
Total # of students
FCAT Read3 L5
Hamilton South Hamilton Elementary 41 32 5 9.02 7.04 1.1
Holmes Poplar School 32 24 12 8 6 3
Walton Bay Elementary 30 35 16 11.1 12.95 5.92
Volusia Ortona Elementary 36 22 6 18 11 3
St. Lucie Ft. Pierce Magnet 32 34 2 16 17 1
Sumter North Sumter Intermediate
Santa Rosa Chumuckla Elementary 32 37 12 13.12 15.17 4.92
Sarasota Sarasota Suncost Academy 38 36 18 14.82 14.04 7.02
Orange Hungerford Elementary 35 12 0 11.9 4.08 0
Pasco DaySpring Academy 51 21 7 21.93 9.03 3.01
Pinellas North Ward Elementary 52 19 5 21.84 7.98 2.1
Monroe Sigsbee Elementary 37 24 5 14.06 9.12 1.9

60
District School Name- Group 1 FCAT Reading
3rd grade Percent Level 3
FCAT Reading
3rd grade Percent Level 4
FCAT Reading
3rd grade Percent Level 5
Total # of students
FCAT Read3 L3
Total # of students
FCAT Read3 L4
Total # of students
FCAT Read3 L5
Nassau Bryceville Elementary 41 39 7 18.04 17.16 3.08
Okaloosa Laurel Hill School 67 24 0 14.07 5.04 0
Levy Yankeetown School 48 23 5 19.2 9.2 2
Liberty Hosford Elementary Jr. High 33 30 12 10.89 9.9 3.96
Madison Lee Elementary 33 31 8 11.88 11.16 2.88
Marion Marion Charter 37 17 0 12.95 5.95 0
Lake Altonna School 30 30 0 3 3 0
Lee Ft. Myers Beach Elementary 19 55 13 5.89 17.05 4.03

61
District School Name – Group 2 FCAT Reading
3rd grade Percent Level 3
FCAT Reading
3rd grade Percent Level 4
FCAT Reading
3rd grade Percent Level 5
Total # of students
FCAT Read3 L3
Total # of students
FCAT Read3 L4
Total # of students
FCAT Read3 L5
Volusia Bonner Elementary 25 12 0 15 7.2 0
Walton Freeport Elementary 32 26 8 26.88 21.84 6.72
Washington Vernon Elementary 35 24 5 41.3 28.32 5.9
St. Johns Crookshank Elementary 42 18 3 28.14 12.06 2.01
St. Lucie Parkway Elementary 47 13 2 58.75 16.25 2.5
Sumter Lake Panasoffkee 31 43 10 23.87 33.11 7.7
Putnam James A. Long Elementary 41 25 4 28.29 17.25 2.76
Santa Rosa Bagdad Elementary 32 43 7 22.08 29.67 4.83
Sarasota Englewood Elementary 34 34 9 25.16 25.16 6.66
Seminole Geneva Elementary 30 33 8 24.9 27.39 6.64
Orange Aloma Elementary 36 27 4 29.88 22.41 3.32
Osceola P.M. Wells Charter Academy 38 22 8 27.74 16.06 5.84

62
District School Name – Group 2 FCAT Reading
3rd grade Percent Level 3
FCAT Reading
3rd grade Percent Level 4
FCAT Reading
3rd grade Percent Level 5
Total # of students
FCAT Read3 L3
Total # of students
FCAT Read3 L4
Total # of students
FCAT Read3 L5
Palm Beach Allamanda Elementary 44 26 6 33.88 20.02 4.62
Pasco Trinity Oaks Elementary 34 36 10 31.96 33.84 9.4
Pinellas Azalea Elementary 33 25 8 35.31 26.75 8.56
Martin Hobe Sound Elementary 41 26 9 36.9 23.4 8.1
Nassau Atlantic Elementary 31 38 13 59.21 72.58 24.83
Okaloosa Annette P. Edwins Elementary 39 25 9 26.91 17.25 6.21
Levy Williston Elementary 30 30 6 48 48 9.6
Liberty W.R. Tolar K-8 30 30 8 19.2 19.2 5.12
Manatee Ballard Elementary 31 17 1 26.04 14.28 0.84
Marion South Ocala Elementary 24 43 4 27.36 49.02 4.56
Lafayette Lafayette Elementary 33 27 8 29.7 24.3 7.2
Lake Eustis Elementary 29 30 19 22.91 23.7 15.01
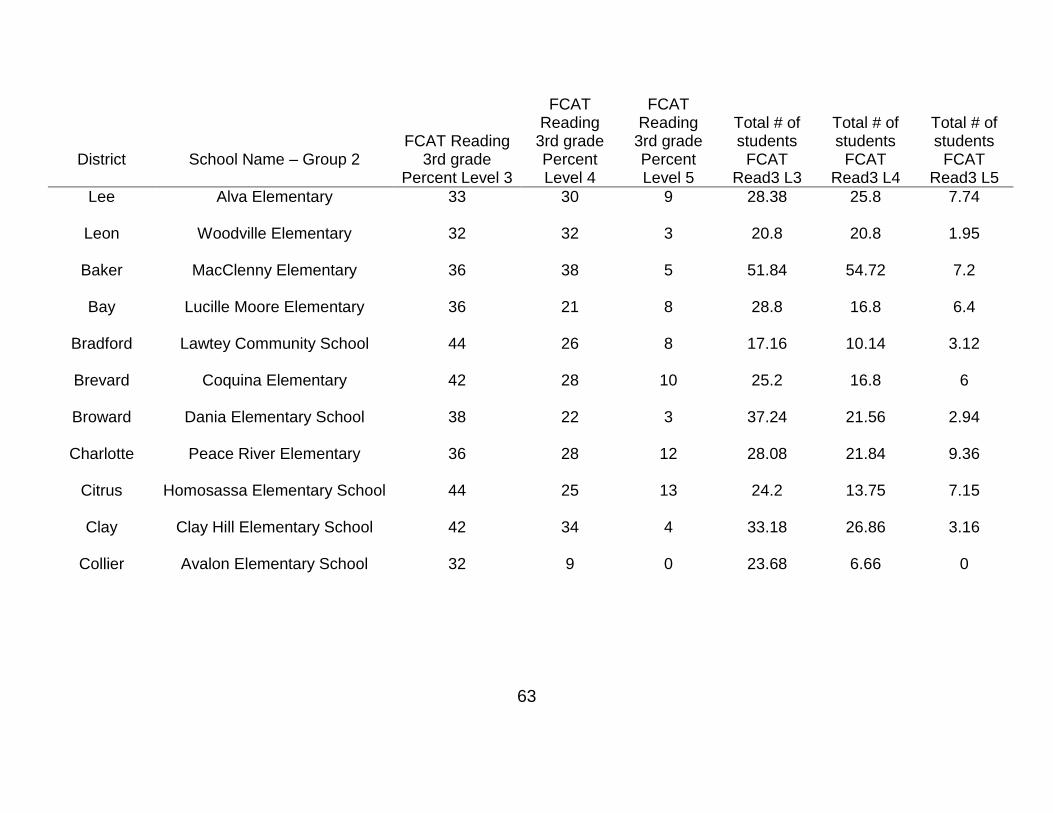
63
District School Name – Group 2 FCAT Reading
3rd grade Percent Level 3
FCAT Reading
3rd grade Percent Level 4
FCAT Reading
3rd grade Percent Level 5
Total # of students
FCAT Read3 L3
Total # of students
FCAT Read3 L4
Total # of students
FCAT Read3 L5
Lee Alva Elementary 33 30 9 28.38 25.8 7.74
Leon Woodville Elementary 32 32 3 20.8 20.8 1.95
Baker MacClenny Elementary 36 38 5 51.84 54.72 7.2
Bay Lucille Moore Elementary 36 21 8 28.8 16.8 6.4
Bradford Lawtey Community School 44 26 8 17.16 10.14 3.12
Brevard Coquina Elementary 42 28 10 25.2 16.8 6
Broward Dania Elementary School 38 22 3 37.24 21.56 2.94
Charlotte Peace River Elementary 36 28 12 28.08 21.84 9.36
Citrus Homosassa Elementary School 44 25 13 24.2 13.75 7.15
Clay Clay Hill Elementary School 42 34 4 33.18 26.86 3.16
Collier Avalon Elementary School 32 9 0 23.68 6.66 0

64
District School Name – Group 2 FCAT Reading
3rd grade Percent Level 3
FCAT Reading
3rd grade Percent Level 4
FCAT Reading
3rd grade Percent Level 5
Total # of students
FCAT Read3 L3
Total # of students
FCAT Read3 L4
Total # of students
FCAT Read3 L5
Columbia Niblack Elementary School 43 5 3 15.91 1.85 1.11
Dixie James M. Anderson Elem. 45 28 8 33.75 21 6
Duval Arlington Heights Elem. 31 15 2 33.48 16.2 2.16
Escambia Allie Yniestra Elem. 39 10 0 23.01 5.9 0
Gadsden Greensboro Elementary School 37 3 2 22.2 1.8 1.2
Glades Moore Haven Elementary 52 28 3 31.72 17.08 1.83
Hamilton Central Hamilton Elementary 29 11 0 22.04 8.36 0
Hardee Wauchula Elementary 42 29 6 43.68 30.16 6.24
Hendry Eastside Elementary 39 17 2 47.97 20.91 2.46
Highlands Lake Country Elementary 43 15 3 43.86 15.3 3.06
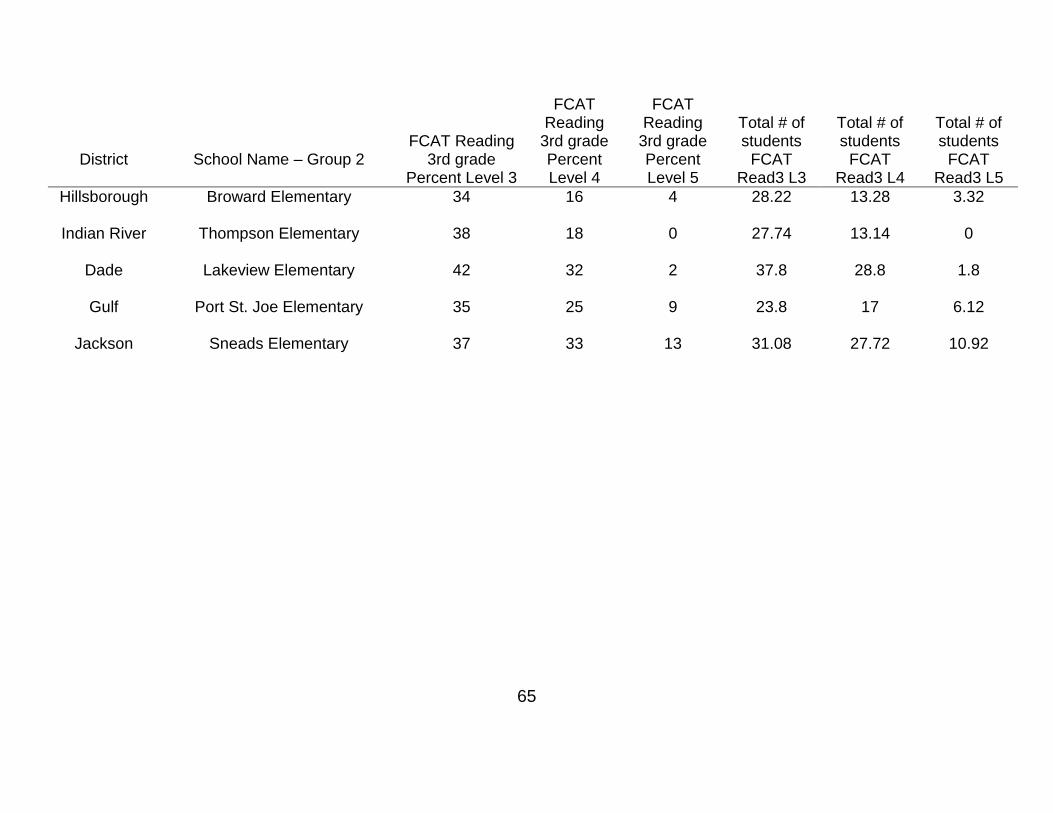
65
District School Name – Group 2 FCAT Reading
3rd grade Percent Level 3
FCAT Reading
3rd grade Percent Level 4
FCAT Reading
3rd grade Percent Level 5
Total # of students
FCAT Read3 L3
Total # of students
FCAT Read3 L4
Total # of students
FCAT Read3 L5
Hillsborough Broward Elementary 34 16 4 28.22 13.28 3.32
Indian River Thompson Elementary 38 18 0 27.74 13.14 0
Dade Lakeview Elementary 42 32 2 37.8 28.8 1.8
Gulf Port St. Joe Elementary 35 25 9 23.8 17 6.12
Jackson Sneads Elementary 37 33 13 31.08 27.72 10.92

66
District School Name – Group 3 FCAT Reading
3rd grade Percent Level 3
FCAT Reading
3rd grade Percent Level 4
FCAT Reading
3rd grade Percent Level 5
Total # of students
FCAT Read3 L3
Total # of students
FCAT Read3 L4
Total # of students
FCAT Read3 L5
Alachua C.W. Norton Elementary 42 28 11 43.68 29.12 11.44
Baker J Franklyn Keller Elementary
Bay Patronis Elementary 32 31 25 43.2 41.85 33.75
Bradford Southside Elementary 35 22 5 33.25 20.9 4.75
Brevard Discovery Elementary 34 36 5 44.54 47.16 6.55
Broward Challenger Elementary School 31 35 7 72.85 82.25 16.45
Calhoun Blountstown Elementary 35 30 10 36.05 30.9 10.3
Charlotte Vineland Elementary School 37 39 7 49.58 52.26 9.38
Citrus Citrus Springs Elem. 34 40 13 51.68 60.8 19.76
Clay Lake Asbury Elementary 41 38 6 80.77 74.86 11.82
Collier Laurel Oak Elementary School 33 35 9 69.96 74.2 19.08

67
District School Name – Group 3 FCAT Reading
3rd grade Percent Level 3
FCAT Reading
3rd grade Percent Level 4
FCAT Reading
3rd grade Percent Level 5
Total # of students
FCAT Read3 L3
Total # of students
FCAT Read3 L4
Total # of students
FCAT Read3 L5
Columbia Summers Elementary School 36 32 6 45 40 7.5
DeSoto Memorial Elementary School 31 22 3 45.57 32.34 4.41
Duval Sabal Palm Elementary School 36 40 6 78.48 87.2 13.08
Escambia Hellen Caro Elementary School 34 38 13 42.5 47.5 16.25
Flagler Belle Terre Elementary School 36 29 13 80.28 64.67 28.99
Gilchrist Trenton Elementary School 28 40 4 29.12 41.6 4.16
Hendry Country Oaks Elementary 39 17 2 47.97 20.91 2.46
Hernando John D. Floyd Elementary 40 31 7 84 65.1 14.7
Highlands Sun 'N Lake Elementary 33 20 10 45.21 27.4 13.7
Hillsborough Boyette Springs Elementary 35 32 9 71.75 65.6 18.45
Holmes Bonifay Elementary 36 37 3 43.2 44.4 3.6
Indian River Glendale Elementary 35 33 11 40.25 37.95 12.65

68
District School Name – Group 3 FCAT Reading
3rd grade Percent Level 3
FCAT Reading
3rd grade Percent Level 4
FCAT Reading
3rd grade Percent Level 5
Total # of students
FCAT Read3 L3
Total # of students
FCAT Read3 L4
Total # of students
FCAT Read3 L5
Volusia Deltona Lakes Elementary 35 30 4 55.3 47.4 6.32
Wakulla Crawfordville Elementary 28 41 9 38.36 56.17 12.33
Walton Maude Saunders Elementary 44 25 3 49.28 28 3.36
Washington Kate M. Smith Elementary 40 32 9 63.2 50.56 14.22
St. Johns Mill Creek Elementary 34 34 12 73.78 73.78 26.04
St. Lucie Rivers Edge Elementary 33 32 13 45.87 44.48 18.07
Sumter Bushnell Elementary 41 25 9 46.74 28.5 10.26
Suwannee Suwannee Elementary 29 30 9 98.89 102.3 30.69
Taylor Taylor County Elementary 47 25 6 111.86 59.5 14.28
Polk Alta Vista Elementary 35 7 1 52.5 10.5 1.5
Putnam Interlachen Elementary 37 32 7 41.81 36.16 7.91
Santa Rosa Berryhill Elementary 31 40 15 50.22 64.8 24.3

69
District School Name – Group 3 FCAT Reading
3rd grade Percent Level 3
FCAT Reading
3rd grade Percent Level 4
FCAT Reading
3rd grade Percent Level 5
Total # of students
FCAT Read3 L3
Total # of students
FCAT Read3 L4
Total # of students
FCAT Read3 L5
Sarasota Ashton Elementary 35 38 17 59.15 64.22 28.73
Orange Palmetto Elementary 24 13 3 53.28 28.86 6.66
Palm Beach Binks Forest Elementary 20 49 20 41.4 101.43 41.4
Pasco Sand Pine Elementary 34 43 5 56.78 71.81 8.35
Pinellas Cypress Woods Elementary 33 41 16 40.26 50.02 19.52
Martin Palm City Elementary 25 47 20 39.75 74.73 31.8
Nassau Hilliard Elementary 39 36 8 50.7 46.8 10.4
Okaloosa Antioch Elementary 30 43 14 39.6 56.76 18.48
Okeechobee Everglades Elementary 35 20 5 42 24 6
Levy Chiefland Elementary 38 16 9 48.64 20.48 11.52
Madison Madison County Central 37 16 1 44.03 19.04 1.19

70
District School Name- Group 3 FCAT Reading
3rd grade Percent Level 3
FCAT Reading
3rd grade Percent Level 4
FCAT Reading
3rd grade Percent Level 5
Total # of students
FCAT Read3 L3
Total # of students
FCAT Read3 L4
Total # of students
FCAT Read3 L5
Manatee Freedom Elementary 35 29 6 40.25 33.35 6.9
Marion Maplewood Elementary 43 20 3 49.02 22.8 3.42
Jefferson Jefferson County Elementary 41 19 5 37.31 17.29 4.55
Lake Lost Lake Elementary 30 40 14 74.1 98.8 34.58
Lee Gulf Elementary 38 40 9 90.06 94.8 21.33
Leon Gilchrist Elementary 20 46 23 28.6 65.78 32.89
Dade Ernest R Graham Elementary 40 31 3 120.4 93.31 9.03
Union Lake Butler Elementary School 41 35 7 67.24 57.4 11.48

71
APPENDIX C FCAT READING DATA FOR GRADE 4

72
Table 5
FCAT Reading data for Grade 4
District School Name – Group 1
FCAT Reading 4th grade Percent Level 3
FCAT Reading 4th grade Percent Level 4
FCAT Reading 4th grade Percent Level 5
Total # of students
FCAT Read4 L3
Total # of students
FCAT Read4 L4
Total # of students
FCAT Read4 L5
Alachua Chester Shell Elementary 36 19 3 12.96 6.84 1.08
Bradford Hampton Elementary 50 21 0 12 5.04 0
Brevard Robert L. Stevenson Elem 17 38 44 11.22 25.08 29.04
Calhoun Carr Elementary School 34 37 18 12.92 14.06 6.84
Dade Liberty City Elementary 43 15 3 17.2 6 1.2
Duval Arlington Elementary School 33 16 6 16.83 8.16 3.06
Escambia George S. Hallmark Elem 22 16 0 9.9 7.2 0
Franklin H.G. Brown Elementary 47 18 0 7.99 3.06 0
Gadsden Gadsden Elementary School 29 41 12 4.93 6.97 2.04
Glades West Glades Elementary 21 28 5 9.03 12.04 2.15

73
District School Name – Group 1
FCAT Reading 4th grade Percent Level 3
FCAT Reading 4th grade Percent Level 4
FCAT Reading 4th grade Percent Level 5
Total # of students
FCAT Read4 L3
Total # of students
FCAT Read4 L4
Total # of students
FCAT Read4 L5
Hamilton South Hamilton Elementary 40 28 0 10 7 0
Holmes Poplar School 41 18 5 9.02 3.96 1.1
Walton Bay Elementary 24 49 12 9.84 20.09 4.92
Volusia Ortona Elementary 33 30 7 15.18 13.8 3.22
St. Lucie Ft. Pierce Magnet 33 29 6 16.17 14.21 2.94
Sumter North Sumter Intermediate 38 16 5 48.64 20.48 6.4
Santa Rosa Chumuckla Elementary 30 42 9 9.9 13.86 2.97
Sarasota Sarasota Suncost Academy 30 50 5 6 10 1
Orange Hungerford Elementary 28 15 0 10.92 5.85 0
Pasco DaySpring Academy 40 38 4 19.2 18.24 1.92
Pinellas North Ward Elementary 35 35 0 15.05 15.05 0
Monroe Sigsbee Elementary 37 37 6 12.95 12.95 2.1

74
District School Name – Group 1
FCAT Reading 4th grade Percent Level 3
FCAT Reading 4th grade Percent Level 4
FCAT Reading 4th grade Percent Level 5
Total # of students
FCAT Read4 L3
Total # of students
FCAT Read4 L4
Total # of students
FCAT Read4 L5
Nassau Bryceville Elementary 32 45 8 12.16 17.1 3.04
Okaloosa Laurel Hill School 46 23 8 17.94 8.97 3.12
Levy Yankeetown School 32 11 7 8.96 3.08 1.96
Liberty Hosford Elementary Jr. High 40 37 3 12 11.1 0.9
Madison Lee Elementary 51 34 6 17.85 11.9 2.1
Marion Marion Charter 30 15 9 9.9 4.95 2.97
Lake Altonna School 27 18 14 5.94 3.96 3.08
Lee Ft. Myers Beach Elementary 22 46 24 8.14 17.02 8.88

75
District School Name – Group 2
FCAT Reading 4th grade Percent Level 3
FCAT Reading 4th grade Percent Level 4
FCAT Reading 4th grade Percent Level 5
Total # of students
FCAT Read4 L3
Total # of students
FCAT Read4 L4
Total # of students
FCAT Read4 L5
Volusia Bonner Elementary 32 13 0 19.2 7.8 0
Walton Freeport Elementary 35 31 4 35 31 4
Washington Vernon Elementary 36 22 6 37.08 22.66 6.18
St. Johns Crookshank Elementary 45 14 4 34.65 10.78 3.08
St. Lucie Parkway Elementary 46 13 0 40.02 11.31 0
Sumter Lake Panasoffkee 31 30 6 26.04 25.2 5.04
Putnam James A. Long Elementary 40 10 1 30.8 7.7 0.77
Santa Rosa Bagdad Elementary 35 32 10 26.95 24.64 7.7
Sarasota Englewood Elementary 27 35 14 19.17 24.85 9.94
Seminole Geneva Elementary 37 32 7 41.07 35.52 7.77
Orange Aloma Elementary 42 23 8 29.82 16.33 5.68
Osceola P.M. Wells Charter Academy 41 19 1 28.7 13.3 0.7

76
District School Name – Group 2
FCAT Reading 4th grade Percent Level 3
FCAT Reading 4th grade Percent Level 4
FCAT Reading 4th grade Percent Level 5
Total # of students
FCAT Read4 L3
Total # of students
FCAT Read4 L4
Total # of students
FCAT Read4 L5
Palm Beach Allamanda Elementary 34 25 16 23.12 17 10.88
Pasco Trinity Oaks Elementary 31 40 5 28.21 36.4 4.55
Pinellas Azalea Elementary 28 29 3 28 29 3
Martin Hobe Sound Elementary 35 35 13 34.65 34.65 12.87
Nassau Atlantic Elementary
Okaloosa Annette P. Edwins Elem 35 37 7 24.85 26.27 4.97
Levy Williston Elementary 27 28 8 46.71 48.44 13.84
Liberty W.R. Tolar K-8 37 21 4 24.79 14.07 2.68
Manatee Ballard Elementary 34 19 4 32.64 18.24 3.84
Marion South Ocala Elementary 21 41 17 17.01 33.21 13.77
Lafayette Lafayette Elementary 38 23 6 34.2 20.7 5.4
Lake Eustis Elementary 37 26 4 31.08 21.84 3.36

77
District School Name – Group 2
FCAT Reading 4th grade Percent Level 3
FCAT Reading 4th grade Percent Level 4
FCAT Reading 4th grade Percent Level 5
Total # of students
FCAT Read4 L3
Total # of students
FCAT Read4 L4
Total # of students
FCAT Read4 L5
Lee Alva Elementary 34 23 12 27.88 18.86 9.84
Leon Woodville Elementary 27 21 5 17.01 13.23 3.15
Baker MacClenny Elementary
Bay Lucille Moore Elementary 29 31 6 22.62 24.18 4.68
Bradford Lawtey Community School 33 29 8 16.83 14.79 4.08
Brevard Coquina Elementary 39 29 4 19.11 14.21 1.96
Broward Dania Elementary School 28 24 3 21.28 18.24 2.28
Charlotte Peace River Elementary 41 20 5 31.16 15.2 3.8
Citrus Homosassa Elementary 30 48 15 12 19.2 6
Clay Clay Hill Elementary School 48 33 5 35.04 24.09 3.65
Collier Avalon Elementary School 34 16 3 26.18 12.32 2.31
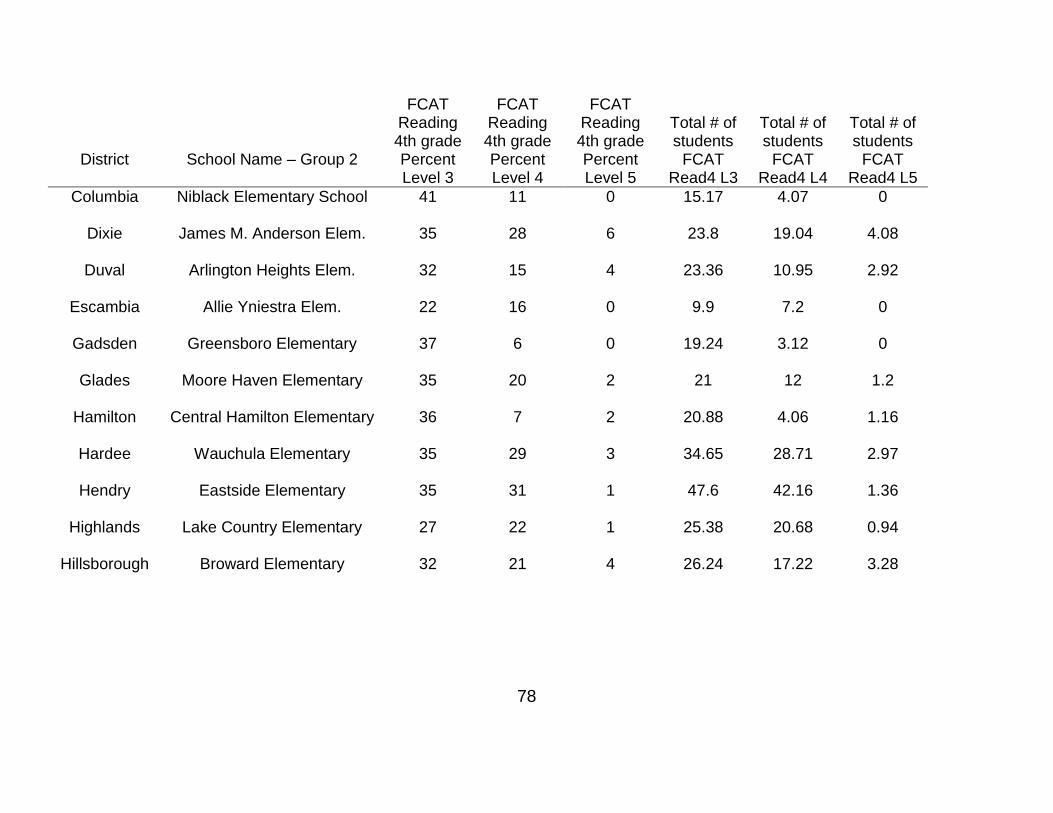
78
District School Name – Group 2
FCAT Reading 4th grade Percent Level 3
FCAT Reading 4th grade Percent Level 4
FCAT Reading 4th grade Percent Level 5
Total # of students
FCAT Read4 L3
Total # of students
FCAT Read4 L4
Total # of students
FCAT Read4 L5
Columbia Niblack Elementary School 41 11 0 15.17 4.07 0
Dixie James M. Anderson Elem. 35 28 6 23.8 19.04 4.08
Duval Arlington Heights Elem. 32 15 4 23.36 10.95 2.92
Escambia Allie Yniestra Elem. 22 16 0 9.9 7.2 0
Gadsden Greensboro Elementary 37 6 0 19.24 3.12 0
Glades Moore Haven Elementary 35 20 2 21 12 1.2
Hamilton Central Hamilton Elementary 36 7 2 20.88 4.06 1.16
Hardee Wauchula Elementary 35 29 3 34.65 28.71 2.97
Hendry Eastside Elementary 35 31 1 47.6 42.16 1.36
Highlands Lake Country Elementary 27 22 1 25.38 20.68 0.94
Hillsborough Broward Elementary 32 21 4 26.24 17.22 3.28

79
District School Name – Group 2
FCAT Reading 4th grade Percent Level 3
FCAT Reading 4th grade Percent Level 4
FCAT Reading 4th grade Percent Level 5
Total # of students
FCAT Read4 L3
Total # of students
FCAT Read4 L4
Total # of students
FCAT Read4 L5
Indian River Thompson Elementary 20 22 0 11.8 12.98 0
Dade Lakeview Elementary 41 26 8 36.08 22.88 7.04
Gulf Port St. Joe Elementary 35 27 9 28.7 22.14 7.38
Jackson Sneads Elementary 31 31 5 22.94 22.94 3.7
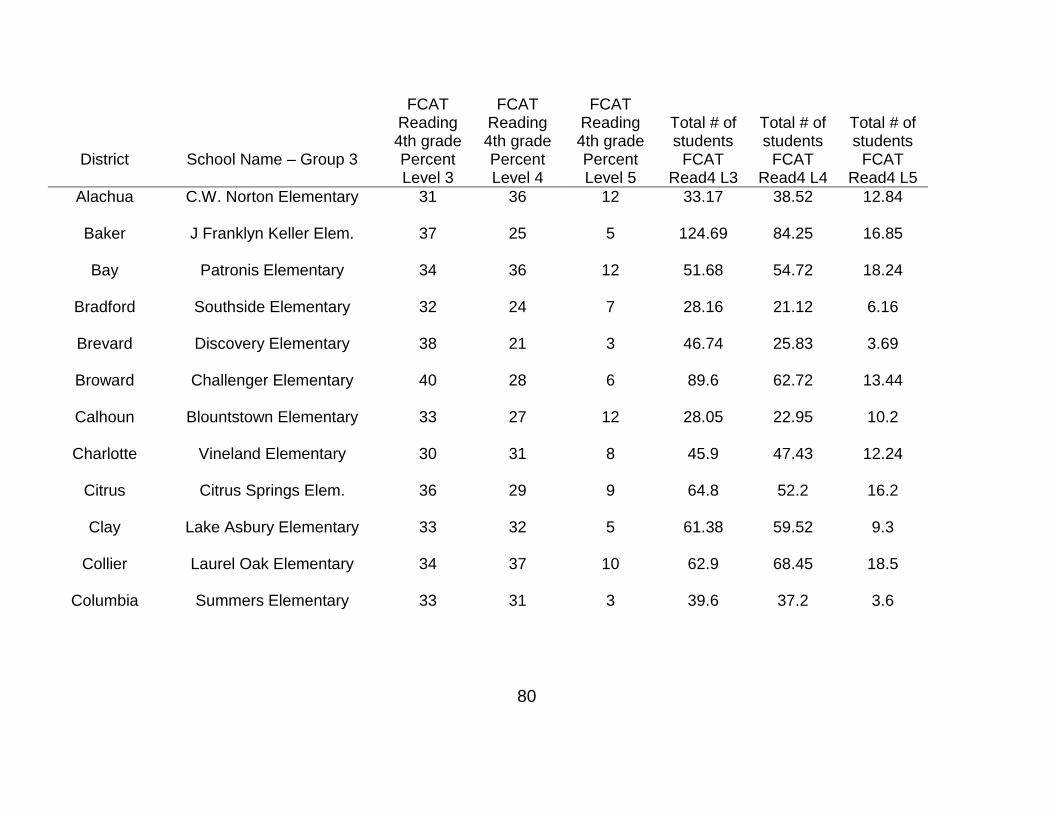
80
District School Name – Group 3
FCAT Reading 4th grade Percent Level 3
FCAT Reading 4th grade Percent Level 4
FCAT Reading 4th grade Percent Level 5
Total # of students
FCAT Read4 L3
Total # of students
FCAT Read4 L4
Total # of students
FCAT Read4 L5
Alachua C.W. Norton Elementary 31 36 12 33.17 38.52 12.84
Baker J Franklyn Keller Elem. 37 25 5 124.69 84.25 16.85
Bay Patronis Elementary 34 36 12 51.68 54.72 18.24
Bradford Southside Elementary 32 24 7 28.16 21.12 6.16
Brevard Discovery Elementary 38 21 3 46.74 25.83 3.69
Broward Challenger Elementary 40 28 6 89.6 62.72 13.44
Calhoun Blountstown Elementary 33 27 12 28.05 22.95 10.2
Charlotte Vineland Elementary 30 31 8 45.9 47.43 12.24
Citrus Citrus Springs Elem. 36 29 9 64.8 52.2 16.2
Clay Lake Asbury Elementary 33 32 5 61.38 59.52 9.3
Collier Laurel Oak Elementary 34 37 10 62.9 68.45 18.5
Columbia Summers Elementary 33 31 3 39.6 37.2 3.6

81
District School Name – Group 3
FCAT Reading 4th grade Percent Level 3
FCAT Reading 4th grade Percent Level 4
FCAT Reading 4th grade Percent Level 5
Total # of students
FCAT Read4 L3
Total # of students
FCAT Read4 L4
Total # of students
FCAT Read4 L5
DeSoto Memorial Elementary 38 14 3 49.4 18.2 3.9
Duval Sabal Palm Elementary 34 38 9 61.2 68.4 16.2
Escambia Hellen Caro Elementary 29 31 13 52.49 56.11 23.53
Flagler Belle Terre Elementary 36 32 8 88.92 79.04 19.76
Gilchrist Trenton Elementary School 39 38 5 42.9 41.8 5.5
Hendry Country Oaks Elementary 35 31 1 47.6 42.16 1.36
Hernando John D. Floyd Elementary 37 32 5 85.47 73.92 11.55
Highlands Sun 'N Lake Elementary 26 34 6 34.32 44.88 7.92
Hillsborough Boyette Springs Elementary 26 32 11 47.32 58.24 20.02
Holmes Bonifay Elementary 34 31 7 43.86 39.99 9.03
Indian River Glendale Elementary 29 32 9 28.71 31.68 8.91
Volusia Deltona Lakes Elementary 40 27 3 74.4 50.22 5.58

82
District School Name – Group 3
FCAT Reading 4th grade Percent Level 3
FCAT Reading 4th grade Percent Level 4
FCAT Reading 4th grade Percent Level 5
Total # of students
FCAT Read4 L3
Total # of students
FCAT Read4 L4
Total # of students
FCAT Read4 L5
Wakulla Crawfordville Elementary 34 33 7 42.5 41.25 8.75
Walton Maude Saunders Elementary 27 29 7 27.54 29.58 7.14
Washington Kate M. Smith Elementary 40 28 7 60.4 42.28 10.57
St. Johns Mill Creek Elementary 29 36 11 52.78 65.52 20.02
St. Lucie Rivers Edge Elementary 29 34 12 40.31 47.26 16.68
Sumter Bushnell Elementary 30 29 10 34.5 33.35 11.5
Suwannee Suwannee Elementary
Taylor Taylor County Elementary 36 26 4 78.48 56.68 8.72
Polk Alta Vista Elementary 34 7 0 51.34 10.57 0
Putnam Interlachen Elementary 36 29 5 41.04 33.06 5.7
Santa Rosa Berryhill Elementary 31 41 13 47.74 63.14 20.02
Sarasota Ashton Elementary 31 40 17 48.67 62.8 26.69
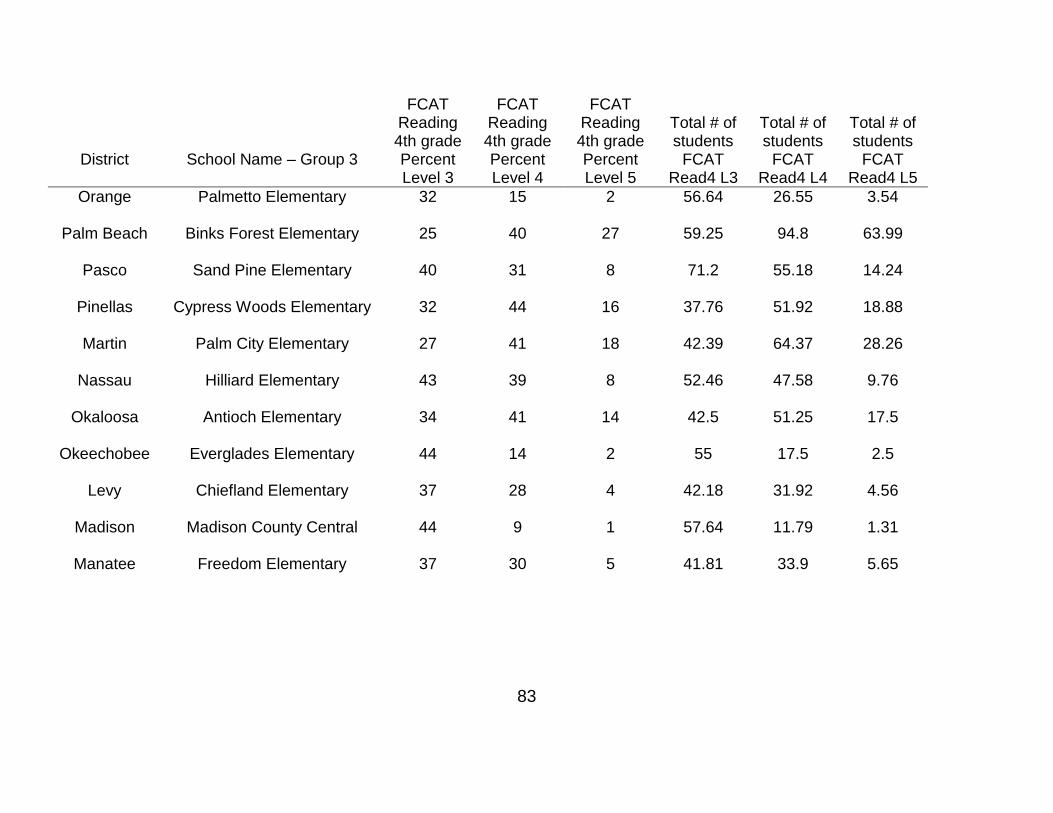
83
District School Name – Group 3
FCAT Reading 4th grade Percent Level 3
FCAT Reading 4th grade Percent Level 4
FCAT Reading 4th grade Percent Level 5
Total # of students
FCAT Read4 L3
Total # of students
FCAT Read4 L4
Total # of students
FCAT Read4 L5
Orange Palmetto Elementary 32 15 2 56.64 26.55 3.54
Palm Beach Binks Forest Elementary 25 40 27 59.25 94.8 63.99
Pasco Sand Pine Elementary 40 31 8 71.2 55.18 14.24
Pinellas Cypress Woods Elementary 32 44 16 37.76 51.92 18.88
Martin Palm City Elementary 27 41 18 42.39 64.37 28.26
Nassau Hilliard Elementary 43 39 8 52.46 47.58 9.76
Okaloosa Antioch Elementary 34 41 14 42.5 51.25 17.5
Okeechobee Everglades Elementary 44 14 2 55 17.5 2.5
Levy Chiefland Elementary 37 28 4 42.18 31.92 4.56
Madison Madison County Central 44 9 1 57.64 11.79 1.31
Manatee Freedom Elementary 37 30 5 41.81 33.9 5.65
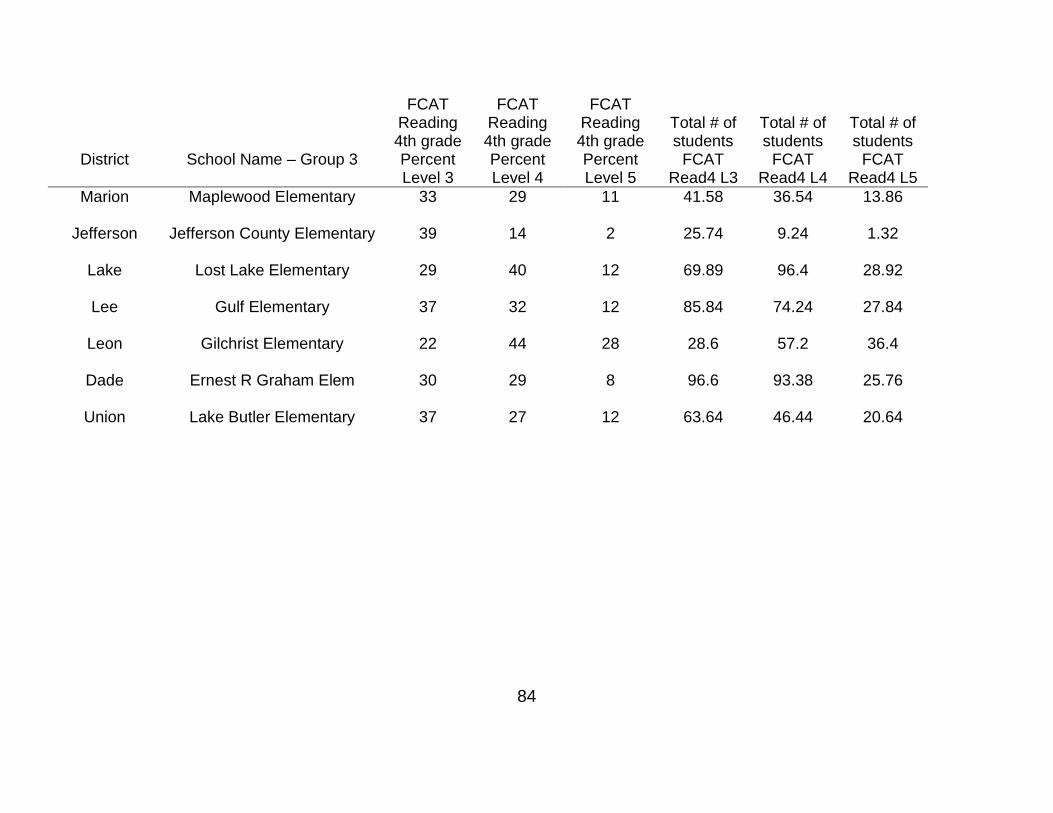
84
District School Name – Group 3
FCAT Reading 4th grade Percent Level 3
FCAT Reading 4th grade Percent Level 4
FCAT Reading 4th grade Percent Level 5
Total # of students
FCAT Read4 L3
Total # of students
FCAT Read4 L4
Total # of students
FCAT Read4 L5
Marion Maplewood Elementary 33 29 11 41.58 36.54 13.86
Jefferson Jefferson County Elementary 39 14 2 25.74 9.24 1.32
Lake Lost Lake Elementary 29 40 12 69.89 96.4 28.92
Lee Gulf Elementary 37 32 12 85.84 74.24 27.84
Leon Gilchrist Elementary 22 44 28 28.6 57.2 36.4
Dade Ernest R Graham Elem 30 29 8 96.6 93.38 25.76
Union Lake Butler Elementary 37 27 12 63.64 46.44 20.64

85
APPENDIX D FCAT READING DATA FOR GRADE 5
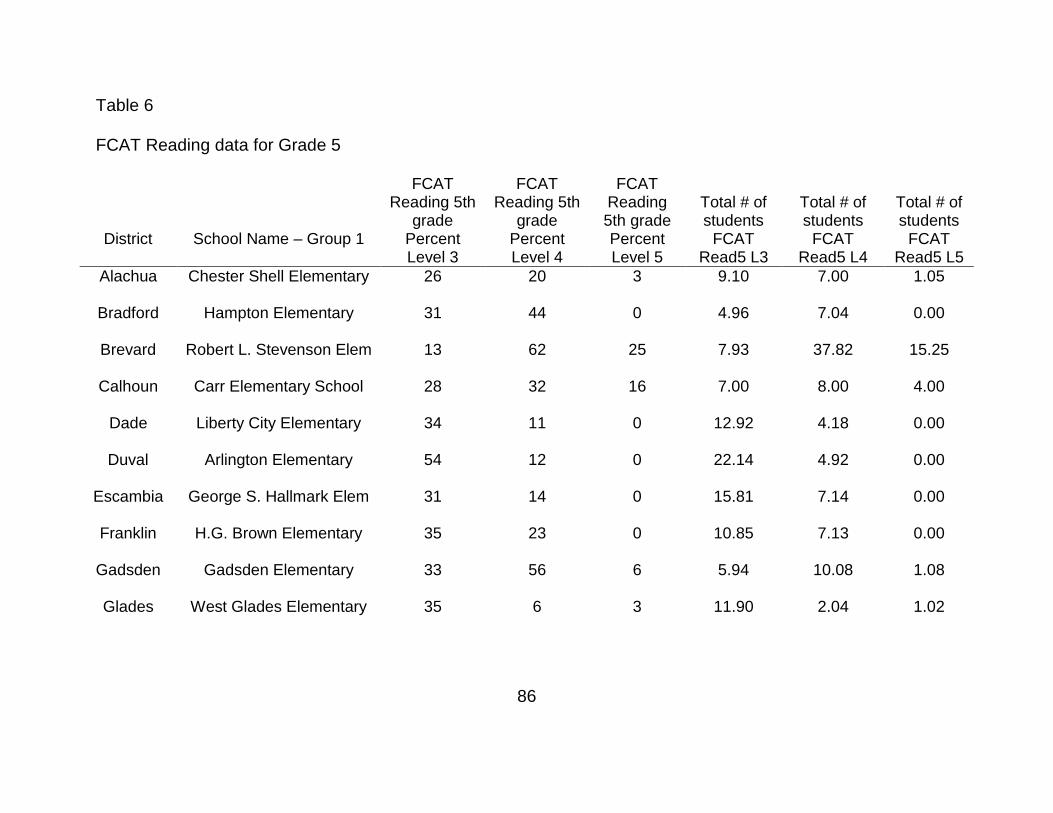
86
Table 6
FCAT Reading data for Grade 5
District School Name – Group 1
FCAT Reading 5th
grade Percent Level 3
FCAT Reading 5th
grade Percent Level 4
FCAT Reading 5th grade Percent Level 5
Total # of students
FCAT Read5 L3
Total # of students
FCAT Read5 L4
Total # of students
FCAT Read5 L5
Alachua Chester Shell Elementary 26 20 3 9.10 7.00 1.05
Bradford Hampton Elementary 31 44 0 4.96 7.04 0.00
Brevard Robert L. Stevenson Elem 13 62 25 7.93 37.82 15.25
Calhoun Carr Elementary School 28 32 16 7.00 8.00 4.00
Dade Liberty City Elementary 34 11 0 12.92 4.18 0.00
Duval Arlington Elementary 54 12 0 22.14 4.92 0.00
Escambia George S. Hallmark Elem 31 14 0 15.81 7.14 0.00
Franklin H.G. Brown Elementary 35 23 0 10.85 7.13 0.00
Gadsden Gadsden Elementary 33 56 6 5.94 10.08 1.08
Glades West Glades Elementary 35 6 3 11.90 2.04 1.02

87
District School Name – Group 1
FCAT Reading 4th
grade Percent Level 3
FCAT Reading 4th
grade Percent Level 4
FCAT Reading 4th grade Percent Level 5
Total # of students
FCAT Read4 L3
Total # of students
FCAT Read4 L4
Total # of students
FCAT Read4 L5
Hamilton South Hamilton Elem. 27 27 18 2.97 2.97 1.98
Holmes Poplar School 42 33 0 10.08 7.92 0.00
Walton Bay Elementary 24 41 11 8.88 15.17 4.07
Volusia Ortona Elementary 35 27 11 12.95 9.99 4.07
St. Lucie Ft. Pierce Magnet 37 17 4 19.98 9.18 2.16
Sumter North Sumter Intermediate 34 23 3 40.12 27.14 3.54
Putnam William D. Moseley Elem 34 5 5 14.96 2.20 2.20
Sarasota Sarasota Suncost Acad.
Orange Hungerford Elementary 43 19 5 9.03 3.99 1.05
Pasco DaySpring Academy 48 29 8 23.04 13.92 3.84
Pinellas North Ward Elementary 49 35 3 18.13 12.95 1.11
Monroe Sigsbee Elementary 45 39 3 13.95 12.09 0.93
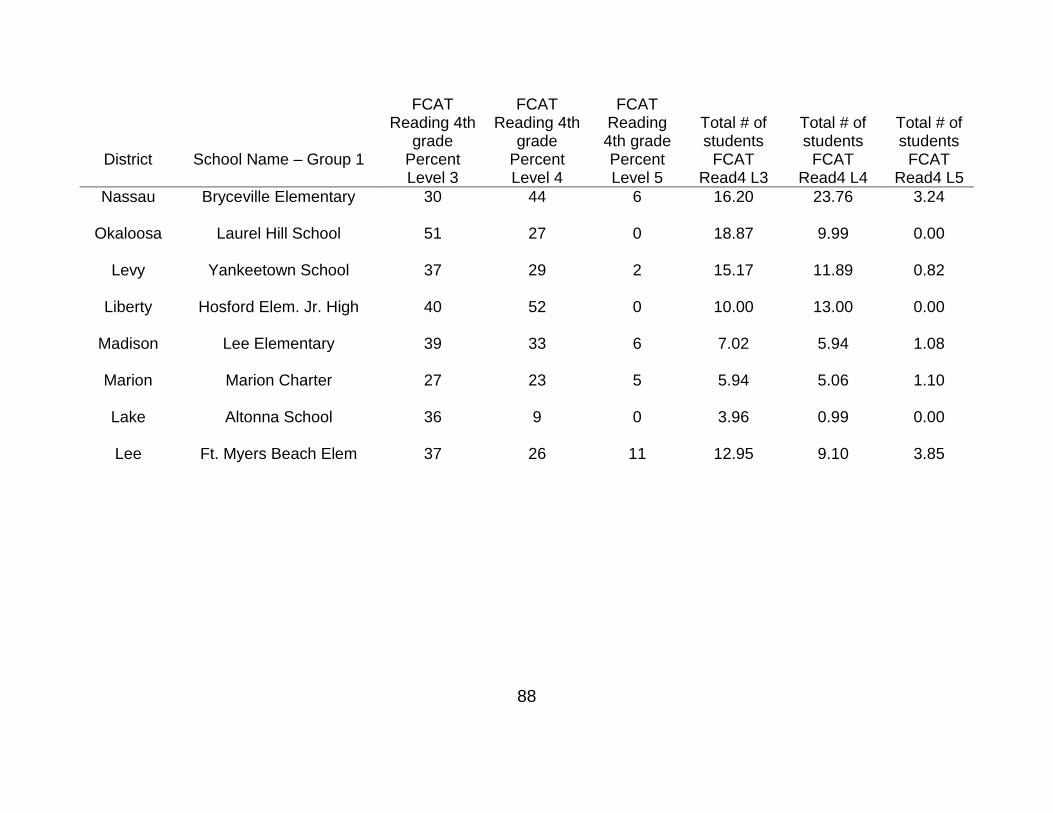
88
District School Name – Group 1
FCAT Reading 4th
grade Percent Level 3
FCAT Reading 4th
grade Percent Level 4
FCAT Reading 4th grade Percent Level 5
Total # of students
FCAT Read4 L3
Total # of students
FCAT Read4 L4
Total # of students
FCAT Read4 L5
Nassau Bryceville Elementary 30 44 6 16.20 23.76 3.24
Okaloosa Laurel Hill School 51 27 0 18.87 9.99 0.00
Levy Yankeetown School 37 29 2 15.17 11.89 0.82
Liberty Hosford Elem. Jr. High 40 52 0 10.00 13.00 0.00
Madison Lee Elementary 39 33 6 7.02 5.94 1.08
Marion Marion Charter 27 23 5 5.94 5.06 1.10
Lake Altonna School 36 9 0 3.96 0.99 0.00
Lee Ft. Myers Beach Elem 37 26 11 12.95 9.10 3.85

89
District School Name – Group 2
FCAT Reading 4th
grade Percent Level 3
FCAT Reading 4th
grade Percent Level 4
FCAT Reading 4th grade Percent Level 5
Total # of students
FCAT Read4 L3
Total # of students
FCAT Read4 L4
Total # of students
FCAT Read4 L5
Volusia Bonner Elementary 41 5 2 25.01 3.05 1.22
Walton Freeport Elementary 49 35 5 41.65 29.75 4.25
Washington Vernon Elementary
St. Johns Crookshank Elementary 35 21 4 23.80 14.28 2.72
St. Lucie Parkway Elementary 41 14 0 28.70 9.80 0.00
Sumter Lake Panasoffkee 39 30 8 34.32 26.40 7.04
Polk Berkley Elementary 33 34 5 29.04 29.92 4.40
Santa Rosa Bagdad Elementary 35 27 9 30.80 23.76 7.92
Sarasota Englewood Elementary 38 32 11 31.16 26.24 9.02
Seminole Geneva Elementary 39 37 9 38.22 36.26 8.82
Orange Aloma Elementary 43 31 1 28.81 20.77 0.67
Osceola P.M. Wells Charter Acad. 41 20 9 28.70 14.00 6.30

90
District School Name – Group 2
FCAT Reading 4th
grade Percent Level 3
FCAT Reading 4th
grade Percent Level 4
FCAT Reading 4th grade Percent Level 5
Total # of students
FCAT Read4 L3
Total # of students
FCAT Read4 L4
Total # of students
FCAT Read4 L5
Palm Beach Allamanda Elementary 38 36 3 29.64 28.08 2.34
Pasco Trinity Oaks Elementary 37 43 0 33.67 39.13 0.00
Pinellas Azalea Elementary 36 35 6 34.92 33.95 5.82
Martin Hobe Sound Elementary 25 42 12 22.25 37.38 10.68
Nassau Atlantic Elementary
Okaloosa Annette P. Edwins Elem 41 42 3 31.16 31.92 2.28
Levy Williston Elementary 33 27 1 52.80 43.20 1.60
Liberty W.R. Tolar K-8 29 27 5 16.24 15.12 2.80
Manatee Ballard Elementary 47 17 3 33.84 12.24 2.16
Marion South Ocala Elementary 40 35 4 31.20 27.30 3.12
Lafayette Lafayette Elementary 29 33 3 21.75 24.75 2.25
Lake Eustis Elementary 28 32 9 24.64 28.16 7.92

91
District School Name – Group 2
FCAT Reading 4th
grade Percent Level 3
FCAT Reading 4th
grade Percent Level 4
FCAT Reading 4th grade Percent Level 5
Total # of students
FCAT Read4 L3
Total # of students
FCAT Read4 L4
Total # of students
FCAT Read4 L5
Lee Alva Elementary 42 28 11 26.88 17.92 7.04
Leon Woodville Elementary 45 22 5 28.80 14.08 3.20
Alachua Alachua Elementary 30 28 4 37.50 35.00 5.00
Bay Lucille Moore Elementary 38 30 3 33.44 26.40 2.64
Bradford Lawtey Community School 27 14 2 11.88 6.16 0.88
Brevard Coquina Elementary 43 37 2 19.78 17.02 0.92
Broward Dania Elementary School 41 13 4 31.98 10.14 3.12
Charlotte Peace River Elementary 42 23 3 36.12 19.78 2.58
Citrus Homosassa Elementary 29 45 12 14.79 22.95 6.12
Clay Clay Hill Elementary 42 31 8 29.82 22.01 5.68

92
District School Name – Group 2
FCAT Reading 4th
grade Percent Level 3
FCAT Reading 4th
grade Percent Level 4
FCAT Reading 4th grade Percent Level 5
Total # of students
FCAT Read4 L3
Total # of students
FCAT Read4 L4
Total # of students
FCAT Read4 L5
Collier Avalon Elementary School 46 18 0 33.12 12.96 0.00
Columbia Niblack Elementary 34 5 0 14.96 2.20 0.00
Dixie James M. Anderson Elem. 48 28 4 24.00 14.00 2.00
Duval Arlington Heights Elem. 38 14 1 39.52 14.56 1.04
Escambia Allie Yniestra Elem. 31 14 0 15.81 7.14 0.00
Gadsden Greensboro Elementary 34 23 2 21.08 14.26 1.24
Glades Moore Haven Elem. 33 22 5 19.80 13.20 3.00
Hamilton Central Hamilton Elem 37 12 1 29.97 9.72 0.81
Hardee Wauchula Elementary 33 35 4 23.76 25.20 2.88
Hendry Eastside Elementary 43 22 3 49.88 25.52 3.48
Highlands Lake Country Elementary 37 33 4 34.41 30.69 3.72
Hillsborough Broward Elementary 34 16 1 27.88 13.12 0.82

93
District School Name – Group 2
FCAT Reading 4th
grade Percent Level 3
FCAT Reading 4th
grade Percent Level 4
FCAT Reading 4th grade Percent Level 5
Total # of students
FCAT Read4 L3
Total # of students
FCAT Read4 L4
Total # of students
FCAT Read4 L5
Holmes Ponce De Leon Elem 49 21 3 34.30 14.70 2.10
Dade Lakeview Elementary 44 23 0 27.28 14.26 0.00
Gulf Port St. Joe Elementary 34 28 6 27.88 22.96 4.92
Jackson Sneads Elementary 25 39 9 20.00 31.20 7.20

94
District School Name – Group 3
FCAT Reading 4th
grade Percent Level 3
FCAT Reading 4th
grade Percent Level 4
FCAT Reading 4th grade Percent Level 5
Total # of students
FCAT Read4 L3
Total # of students
FCAT Read4 L4
Total # of students
FCAT Read4 L5
Alachua C.W. Norton Elementary 37 36 5 49.21 47.88 6.65
Baker J Franklyn Keller Elem 37 29 3 131.35 102.95 10.65
Bay Patronis Elementary 29 41 18 36.54 51.66 22.68
Bradford Southside Elementary 29 29 5 29.00 29.00 5.00
Brevard Discovery Elementary 31 36 4 43.09 50.04 5.56
Broward Challenger Elementary 37 29 5 72.52 56.84 9.80
Calhoun Blountstown Elementary 46 33 5 34.96 25.08 3.80
Charlotte Vineland Elementary 35 34 8 53.55 52.02 12.24
Citrus Citrus Springs Elem. 42 27 7 68.88 44.28 11.48
Clay Lake Asbury Elementary 35 32 4 68.95 63.04 7.88
Collier Laurel Oak Elementary 31 40 10 68.20 88.00 22.00
Columbia Summers Elementary 35 31 5 44.80 39.68 6.40
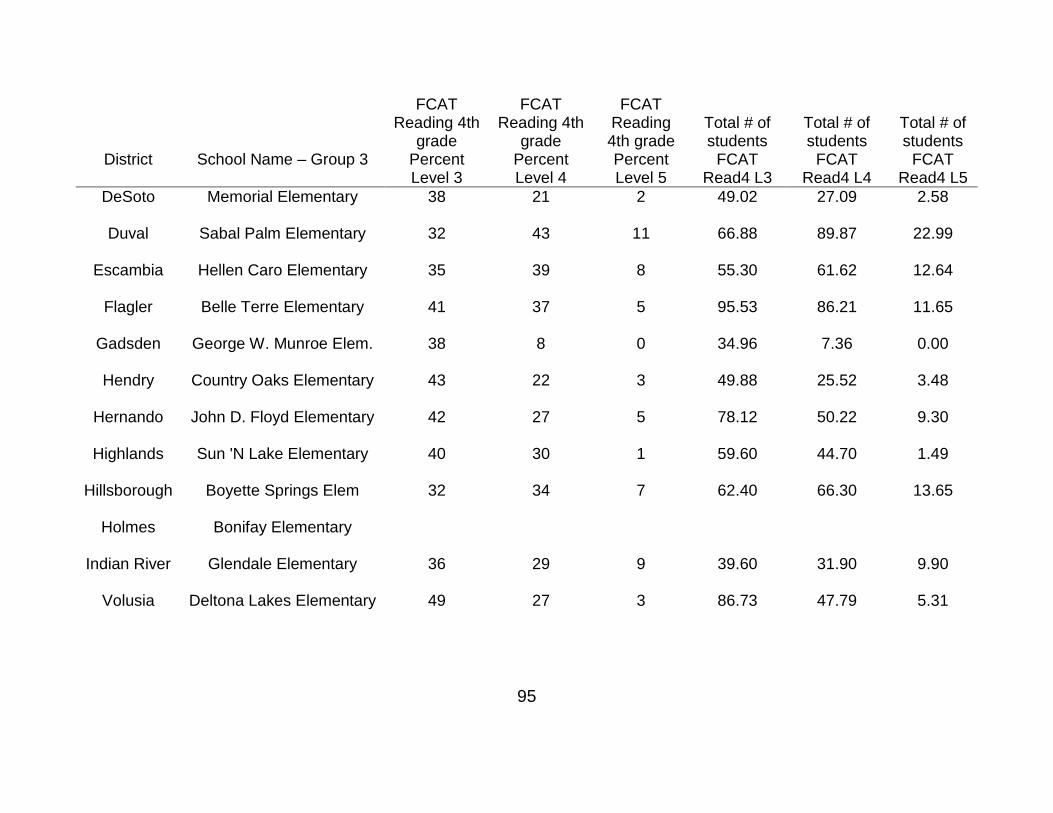
95
District School Name – Group 3
FCAT Reading 4th
grade Percent Level 3
FCAT Reading 4th
grade Percent Level 4
FCAT Reading 4th grade Percent Level 5
Total # of students
FCAT Read4 L3
Total # of students
FCAT Read4 L4
Total # of students
FCAT Read4 L5
DeSoto Memorial Elementary 38 21 2 49.02 27.09 2.58
Duval Sabal Palm Elementary 32 43 11 66.88 89.87 22.99
Escambia Hellen Caro Elementary 35 39 8 55.30 61.62 12.64
Flagler Belle Terre Elementary 41 37 5 95.53 86.21 11.65
Gadsden George W. Munroe Elem. 38 8 0 34.96 7.36 0.00
Hendry Country Oaks Elementary 43 22 3 49.88 25.52 3.48
Hernando John D. Floyd Elementary 42 27 5 78.12 50.22 9.30
Highlands Sun 'N Lake Elementary 40 30 1 59.60 44.70 1.49
Hillsborough Boyette Springs Elem 32 34 7 62.40 66.30 13.65
Holmes Bonifay Elementary
Indian River Glendale Elementary 36 29 9 39.60 31.90 9.90
Volusia Deltona Lakes Elementary 49 27 3 86.73 47.79 5.31

96
District School Name – Group 3
FCAT Reading 4th
grade Percent Level 3
FCAT Reading 4th
grade Percent Level 4
FCAT Reading 4th grade Percent Level 5
Total # of students
FCAT Read4 L3
Total # of students
FCAT Read4 L4
Total # of students
FCAT Read4 L5
Wakulla Crawfordville Elementary 27 40 9 37.80 56.00 12.60
Walton Maude Saunders Elem 43 24 4 48.16 26.88 4.48
Washington Kate M. Smith Elementary 0.00 0.00 0.00
St. Johns Mill Creek Elementary 33 40 8 50.49 61.20 12.24
St. Lucie Rivers Edge Elementary 43 27 5 59.34 37.26 6.90
Sumter Bushnell Elementary 37 28 5 45.14 34.16 6.10
Suwannee Suwannee Elementary
Taylor Taylor County Elementary 35 32 4 74.20 67.84 8.48
Polk Alta Vista Elementary 34 11 2 45.56 14.74 2.68
Putnam Interlachen Elementary 37 32 4 46.25 40.00 5.00
Santa Rosa Berryhill Elementary 30 49 10 46.50 75.95 15.50
Sarasota Ashton Elementary 29 45 14 44.95 69.75 21.70

97
District School Name – Group 3
FCAT Reading 4th
grade Percent Level 3
FCAT Reading 4th
grade Percent Level 4
FCAT Reading 4th grade Percent Level 5
Total # of students
FCAT Read4 L3
Total # of students
FCAT Read4 L4
Total # of students
FCAT Read4 L5
Seminole Bear Lake Elementary 37 39 9 78.81 83.07 19.17
Palm Beach Binks Forest Elementary 22 48 24 46.20 100.80 50.40
Pasco Sand Pine Elementary 43 32 5 69.23 51.52 8.05
Pinellas Cypress Woods Elem 35 43 11 39.90 49.02 12.54
Martin Palm City Elementary 27 49 11 48.06 87.22 19.58
Nassau Hilliard Elementary 40 40 6 47.60 47.60 7.14
Okaloosa Antioch Elementary 38 40 13 49.78 52.40 17.03
Okeechobee Everglades Elementary 46 17 2 38.64 14.28 1.68
Levy Chiefland Elementary 26 32 4 35.62 43.84 5.48
Madison Madison County Centrall 41 15 2 49.20 18.00 2.40
Manatee Freedom Elementary 37 35 6 39.96 37.80 6.48
Marion Maplewood Elementary 34 30 9 34.68 30.60 9.18
Jefferson Jefferson County Elem 43 13 6 30.96 9.36 4.32
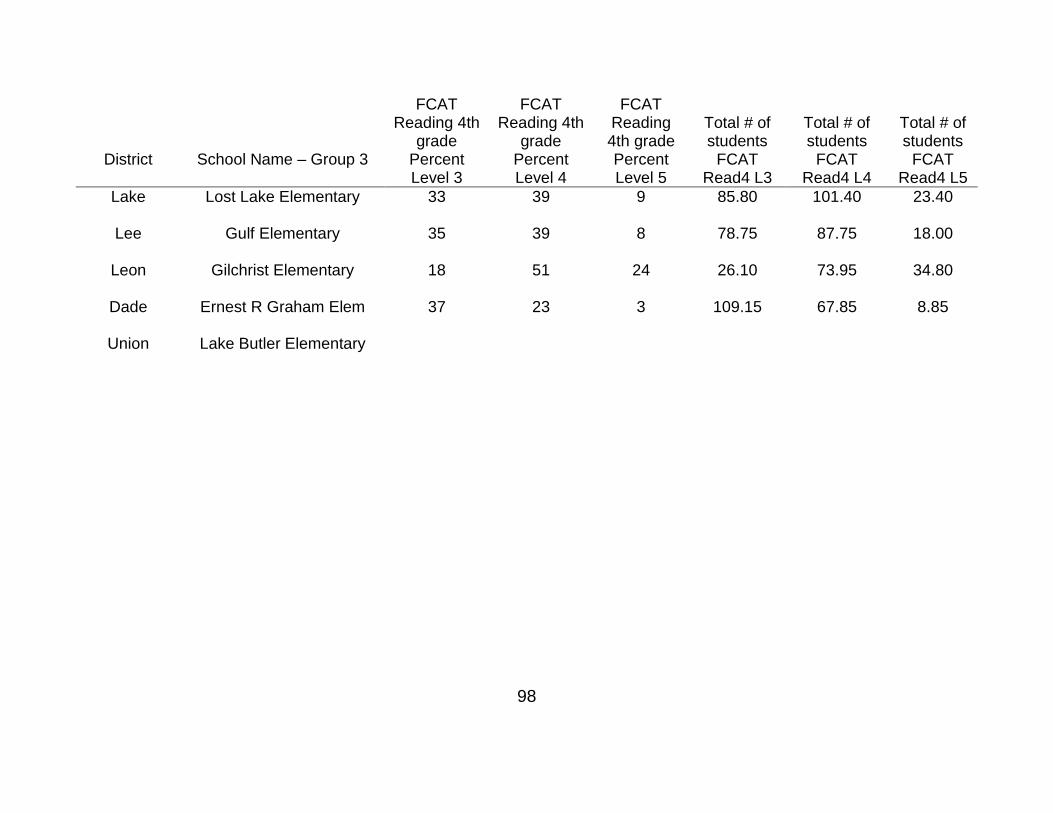
98
District School Name – Group 3
FCAT Reading 4th
grade Percent Level 3
FCAT Reading 4th
grade Percent Level 4
FCAT Reading 4th grade Percent Level 5
Total # of students
FCAT Read4 L3
Total # of students
FCAT Read4 L4
Total # of students
FCAT Read4 L5
Lake Lost Lake Elementary 33 39 9 85.80 101.40 23.40
Lee Gulf Elementary 35 39 8 78.75 87.75 18.00
Leon Gilchrist Elementary 18 51 24 26.10 73.95 34.80
Dade Ernest R Graham Elem 37 23 3 109.15 67.85 8.85
Union Lake Butler Elementary

99
APPENDIX E FCAT MATH DATA FOR GRADE 3

100
Table 7
FCAT Math data for Grade 3
District School Name – Group 1
FCAT Math 3rd
grade Percent Level 3
FCAT Math 3rd
grade Percent Level 4
FCAT Math 3rd
grade Percent Level 5
Total # of
students FCAT Math3
L3
Total # of
students FCAT Math3
L4
Total # of
students FCAT Math3
L5
Alachua Chester Shell Elementary 36 11 3 12.96 3.96 1.08
Bradford Hampton Elementary 41 15 8 9.84 3.6 1.92
Brevard Robert L. Stevenson Elem 16 45 39 7.04 19.8 17.16
Calhoun Carr Elementary School 19 50 15 4.94 13 3.9
Dade Liberty City Elementary 45 16 7 19.8 7.04 3.08
Duval Arlington Elementary 35 21 4 16.8 10.08 1.92
Escambia George S. Hallmark Elem 50 8 4 12 1.92 0.96
Franklin H.G. Brown Elementary 29 37 9 10.15 12.95 3.15
Gadsden Gadsden Elementary 39 33 17 7.02 5.94 3.06
Glades West Glades Elementary 53 17 2 28.09 9.01 1.06

101
District School Name – Group 1
FCAT Math 3rd
grade Percent Level 3
FCAT Math 3rd
grade Percent Level 4
FCAT Math 3rd
grade Percent Level 5
Total # of
students FCAT Math3
L3
Total # of
students FCAT Math3
L4
Total # of
students FCAT Math3
L5
Hamilton South Hamilton Elem 45 27 0 9.9 5.94 0
Holmes Poplar School 64 24 0 16 6 0
Walton Bay Elementary 38 35 16 14.06 12.95 5.92
Volusia Ortona Elementary 46 26 8 23 13 4
St. Lucie Ft. Pierce Magnet 32 26 4 16 13 2
Sumter North Sumter Intermediate
Putnam William D. Moseley Elem 49 27 14 24.01 13.23 6.86
Santa Rosa Chumuckla Elementary 29 34 20 11.89 13.94 8.2
Sarasota Sarasota Suncost Acad. 28 33 21 10.92 12.87 8.19
Orange Hungerford Elementary 14 11 0 4.9 3.85 0
Pasco DaySpring Academy 35 28 9 15.05 12.04 3.87
Pinellas North Ward Elementary 31 36 12 13.02 15.12 5.04
Monroe Sigsbee Elementary 42 26 13 15.96 9.88 4.94

102
District School Name – Group 1
FCAT Math 3rd
grade Percent Level 3
FCAT Math 3rd
grade Percent Level 4
FCAT Math 3rd
grade Percent Level 5
Total # of
students FCAT Math3
L3
Total # of
students FCAT Math3
L4
Total # of
students FCAT Math3
L5
Nassau Bryceville Elementary 41 25 25 18.04 11 11
Okaloosa Laurel Hill School 48 24 10 10.08 5.04 2.1
Levy Yankeetown School 43 18 8 17.2 7.2 3.2
Liberty Hosford Elementary Jr. High 47 32 12 15.98 10.88 4.08
Madison Lee Elementary 44 14 0 15.84 5.04 0
Marion Marion Charter 40 9 3 14 3.15 1.05
Lake Altonna School 50 30 0 5 3 0
Lee Ft. Myers Beach Elementary 23 58 13 7.13 17.98 4.03
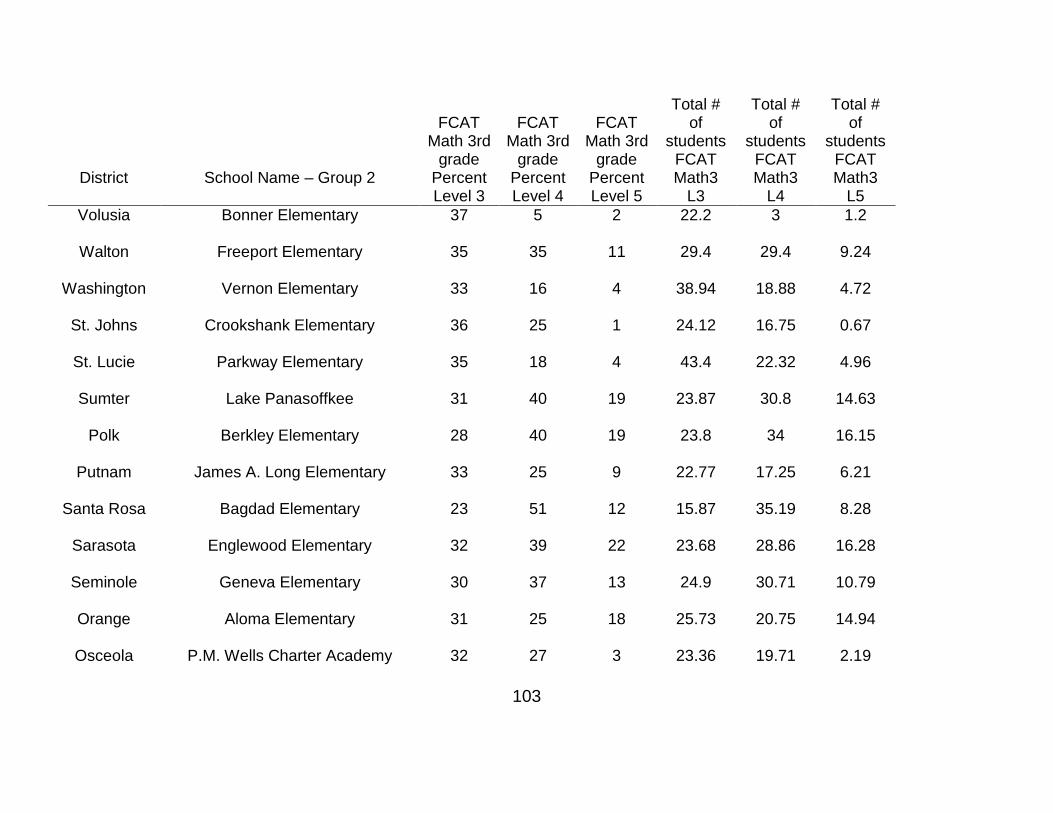
103
District School Name – Group 2
FCAT Math 3rd
grade Percent Level 3
FCAT Math 3rd
grade Percent Level 4
FCAT Math 3rd
grade Percent Level 5
Total # of
students FCAT Math3
L3
Total # of
students FCAT Math3
L4
Total # of
students FCAT Math3
L5
Volusia Bonner Elementary 37 5 2 22.2 3 1.2
Walton Freeport Elementary 35 35 11 29.4 29.4 9.24
Washington Vernon Elementary 33 16 4 38.94 18.88 4.72
St. Johns Crookshank Elementary 36 25 1 24.12 16.75 0.67
St. Lucie Parkway Elementary 35 18 4 43.4 22.32 4.96
Sumter Lake Panasoffkee 31 40 19 23.87 30.8 14.63
Polk Berkley Elementary 28 40 19 23.8 34 16.15
Putnam James A. Long Elementary 33 25 9 22.77 17.25 6.21
Santa Rosa Bagdad Elementary 23 51 12 15.87 35.19 8.28
Sarasota Englewood Elementary 32 39 22 23.68 28.86 16.28
Seminole Geneva Elementary 30 37 13 24.9 30.71 10.79
Orange Aloma Elementary 31 25 18 25.73 20.75 14.94
Osceola P.M. Wells Charter Academy 32 27 3 23.36 19.71 2.19

104
District School Name – Group 2
FCAT Math 3rd
grade Percent Level 3
FCAT Math 3rd
grade Percent Level 4
FCAT Math 3rd
grade Percent Level 5
Total # of
students FCAT Math3
L3
Total # of
students FCAT Math3
L4
Total # of
students FCAT Math3
L5
Palm Beach Allamanda Elementary 38 37 8 29.64 28.86 6.24
Pasco Trinity Oaks Elementary 32 38 7 29.44 34.96 6.44
Pinellas Azalea Elementary 30 36 8 32.1 38.52 8.56
Martin Hobe Sound Elementary 41 24 11 36.9 21.6 9.9
Nassau Atlantic Elementary 28 35 19 53.48 66.85 36.29
Okaloosa Annette P. Edwins Elementary 46 26 6 31.74 17.94 4.14
Levy Williston Elementary 40 27 10 64.4 43.47 16.1
Liberty W.R. Tolar K-8 38 12 2 24.7 7.8 1.3
Manatee Ballard Elementary 43 18 1 35.69 14.94 0.83
Marion South Ocala Elementary 25 32 18 28.5 36.48 20.52
Lafayette Lafayette Elementary 36 32 17 32.4 28.8 15.3
Lake Eustis Elementary 31 34 21 24.8 27.2 16.8
Lee Alva Elementary 34 28 18 28.9 23.8 15.3

105
District School Name – Group 2
FCAT Math 3rd
grade Percent Level 3
FCAT Math 3rd
grade Percent Level 4
FCAT Math 3rd
grade Percent Level 5
Total # of
students FCAT Math3
L3
Total # of
students FCAT Math3
L4
Total # of
students FCAT Math3
L5
Leon Woodville Elementary 49 18 6 31.85 11.7 3.9
Alachua Alachua Elementary 34 25 12 56.1 41.25 19.8
Baker MacClenny Elementary 33 37 13 47.52 53.28 18.72
Bay Lucille Moore Elementary 39 25 10 31.2 20 8
Bradford Lawtey Community School 41 15 8 15.99 5.85 3.12
Brevard Coquina Elementary 42 27 8 25.2 16.2 4.8
Broward Dania Elementary School 40 29 5 38.4 27.84 4.8
Charlotte Peace River Elementary School 24 36 9 18.72 28.08 7.02
Citrus Homosassa Elementary School 40 29 11 22 15.95 6.05
Clay Clay Hill Elementary School 41 37 5 32.39 29.23 3.95
Collier Avalon Elementary School 32 9 0 23.68 6.66 0
Columbia Niblack Elementary School 46 14 3 17.02 5.18 1.11
Dixie James M. Anderson Elem. 40 27 8 30 20.25 6

106
District School Name – Group 2
FCAT Math 3rd
grade Percent Level 3
FCAT Math 3rd
grade Percent Level 4
FCAT Math 3rd
grade Percent Level 5
Total # of
students FCAT Math3
L3
Total # of
students FCAT Math3
L4
Total # of
students FCAT Math3
L5
Duval Arlington Heights Elem. 31 25 2 33.48 27 2.16
Escambia Allie Yniestra Elem. 37 17 2 21.83 10.03 1.18
Gadsden Greensboro Elementary School 31 17 0 18.29 10.03 0
Glades Moore Haven Elementary School 36 38 15 21.96 23.18 9.15
Hamilton Central Hamilton Elementary 23 4 0 17.02 2.96 0
Hardee Wauchula Elementary 38 36 11 39.52 37.44 11.44
Hendry Eastside Elementary 36 28 7 37.8 29.4 7.35
Highlands Lake Country Elementary 36 24 5 36.72 24.48 5.1
Hillsborough Broward Elementary 29 27 1 24.07 22.41 0.83
Holmes Ponce De Leon Elementary 42 33 5 23.1 18.15 2.75
Indian River Thompson Elementary 34 10 0 24.82 7.3 0
Dade Lakeview Elementary 42 29 8 37.38 25.81 7.12
Gulf Port St. Joe Elementary 38 28 13 25.84 19.04 8.84
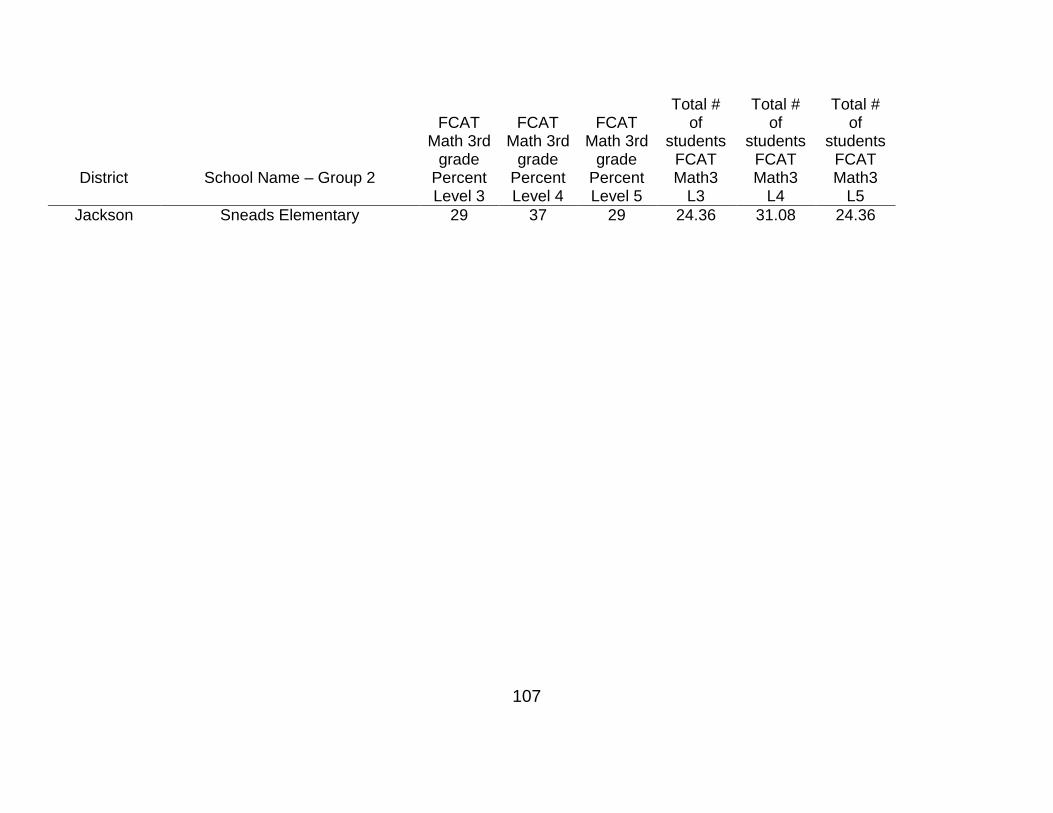
107
District School Name – Group 2
FCAT Math 3rd
grade Percent Level 3
FCAT Math 3rd
grade Percent Level 4
FCAT Math 3rd
grade Percent Level 5
Total # of
students FCAT Math3
L3
Total # of
students FCAT Math3
L4
Total # of
students FCAT Math3
L5
Jackson Sneads Elementary 29 37 29 24.36 31.08 24.36
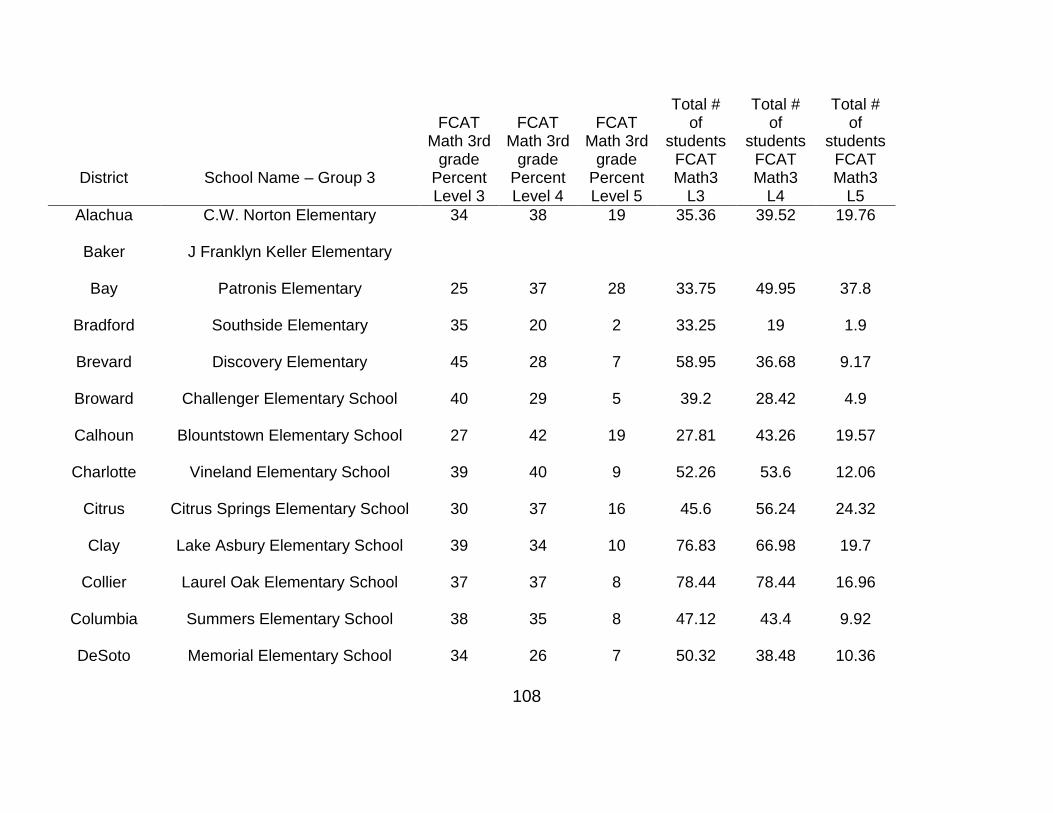
108
District School Name – Group 3
FCAT Math 3rd
grade Percent Level 3
FCAT Math 3rd
grade Percent Level 4
FCAT Math 3rd
grade Percent Level 5
Total # of
students FCAT Math3
L3
Total # of
students FCAT Math3
L4
Total # of
students FCAT Math3
L5
Alachua C.W. Norton Elementary 34 38 19 35.36 39.52 19.76
Baker J Franklyn Keller Elementary
Bay Patronis Elementary 25 37 28 33.75 49.95 37.8
Bradford Southside Elementary 35 20 2 33.25 19 1.9
Brevard Discovery Elementary 45 28 7 58.95 36.68 9.17
Broward Challenger Elementary School 40 29 5 39.2 28.42 4.9
Calhoun Blountstown Elementary School 27 42 19 27.81 43.26 19.57
Charlotte Vineland Elementary School 39 40 9 52.26 53.6 12.06
Citrus Citrus Springs Elementary School 30 37 16 45.6 56.24 24.32
Clay Lake Asbury Elementary School 39 34 10 76.83 66.98 19.7
Collier Laurel Oak Elementary School 37 37 8 78.44 78.44 16.96
Columbia Summers Elementary School 38 35 8 47.12 43.4 9.92
DeSoto Memorial Elementary School 34 26 7 50.32 38.48 10.36

109
District School Name – Group 3
FCAT Math 3rd
grade Percent Level 3
FCAT Math 3rd
grade Percent Level 4
FCAT Math 3rd
grade Percent Level 5
Total # of
students FCAT Math3
L3
Total # of
students FCAT Math3
L4
Total # of
students FCAT Math3
L5
Duval Sabal Palm Elementary School 33 34 16 71.94 74.12 34.88
Escambia Hellen Caro Elementary School 39 31 17 48.75 38.75 21.25
Flagler Belle Terre Elementary School 33 33 13 73.59 73.59 28.99
Gadsden George W. Munroe Elem. 33 12 1 36.63 13.32 1.11
Gilchrist Trenton Elementary School 35 35 13 36.4 36.4 13.52
Hendry Country Oaks Elementary 38 24 2 46.74 29.52 2.46
Hernando John D. Floyd Elementary 39 29 7 81.9 60.9 14.7
Highlands Sun 'N Lake Elementary 29 34 13 39.73 46.58 17.81
Hillsborough Boyette Springs Elementary 28 32 20 57.68 65.92 41.2
Holmes Bonifay Elementary 44 22 4 52.8 26.4 4.8
Indian River Glendale Elementary 31 37 13 35.65 42.55 14.95
Volusia Deltona Lakes Elementary 32 27 11 50.24 42.39 17.27
Wakulla Crawfordville Elementary 38 38 7 52.06 52.06 9.59

110
District School Name – Group 3
FCAT Math 3rd
grade Percent Level 3
FCAT Math 3rd
grade Percent Level 4
FCAT Math 3rd
grade Percent Level 5
Total # of
students FCAT Math3
L3
Total # of
students FCAT Math3
L4
Total # of
students FCAT Math3
L5
Walton Maude Saunders Elementary 39 28 5 43.29 31.08 5.55
Washington Kate M. Smith Elementary 41 26 16 64.78 41.08 25.28
St. Johns Mill Creek Elementary 31 39 14 66.96 84.24 30.24
St. Lucie Rivers Edge Elementary 38 32 9 52.82 44.48 12.51
Sumter Bushnell Elementary 42 27 4 47.46 30.51 4.52
Suwannee Suwannee Elementary 37 25 8 125.8 85 27.2
Taylor Taylor County Elementary 38 36 11 90.44 85.68 26.18
Polk Alta Vista Elementary 41 12 4 61.5 18 6
Putnam Interlachen Elementary 37 30 8 41.81 33.9 9.04
Santa Rosa Berryhill Elementary 33 45 18 53.13 72.45 28.98

111
District School Name – Group 3
FCAT Math 3rd
grade Percent Level 3
FCAT Math 3rd
grade Percent Level 4
FCAT Math 3rd
grade Percent Level 5
Total # of
students FCAT Math3
L3
Total # of
students FCAT Math3
L4
Total # of
students FCAT Math3
L5
Sarasota Ashton Elementary 32 38 17 44.16 52.44 23.46
Seminole Bear Lake Elementary 35 30 17 66.5 57 32.3
Orange Palmetto Elementary 22 12 1 48.84 26.64 2.22
Palm Beach Binks Forest Elementary 22 34 37 45.54 70.38 76.59
Pasco Sand Pine Elementary 41 26 6 68.47 43.42 10.02
Pinellas Cypress Woods Elementary 22 46 25 27.06 56.58 30.75
Martin Palm City Elementary 23 38 33 36.57 60.42 52.47
Nassau Hilliard Elementary 42 31 10 54.6 40.3 13
Okaloosa Antioch Elementary 19 50 24 24.89 65.5 31.44
Okeechobee Everglades Elementary 33 22 3 39.6 26.4 3.6
Levy Chiefland Elementary 44 23 10 56.32 29.44 12.8
Madison Madison County Central School 26 23 8 30.94 27.37 9.52
Manatee Freedom Elementary 37 28 10 42.55 32.2 11.5

112
District School Name – Group 3
FCAT Math 3rd
grade Percent Level 3
FCAT Math 3rd
grade Percent Level 4
FCAT Math 3rd
grade Percent Level 5
Total # of
students FCAT Math3
L3
Total # of
students FCAT Math3
L4
Total # of
students FCAT Math3
L5
Marion Maplewood Elementary 40 27 8 45.6 30.78 9.12
Jefferson Jefferson County Elementary 38 34 8 34.58 30.94 7.28
Lake Lost Lake Elementary 27 38 22 66.96 94.24 54.56
Lee Gulf Elementary 38 29 26 89.68 68.44 61.36
Leon Gilchrist Elementary 14 54 25 20.16 77.76 36
Dade Ernest R Graham Elementary 33 36 11 99 108 33
Union Lake Butler Elementary School 30 41 15 49.2 67.24 24.6

113
APPENDIX F FCAT MATH DATA FOR GRADE 4

114
Table 8
FCAT Math data for Grade 4
District School Name – Group 1
FCAT Math 4th
grade Percent Level 3
FCAT Math 4th
grade Percent Level 4
FCAT Math 4th
grade Percent Level 5
Total # of students
FCAT Math4 L3
Total # of students
FCAT Math4 L4
Total # of students
FCAT Math4 L5
Alachua Chester Shell Elementary 39 14 0 14.04 5.04 0
Bradford Hampton Elementary 35 20 2 17.85 10.2 1.02
Brevard Robert L. Stevenson Elem 29 39 32 19.14 25.74 21.12
Calhoun Carr Elementary School 50 21 8 19 7.98 3.04
Dade Liberty City Elementary 38 18 3 15.2 7.2 1.2
Duval Arlington Elementary 41 18 2 20.91 9.18 1.02
Escambia George S. Hallmark Elem 32 9 0 15.04 4.23 0
Franklin H.G. Brown Elementary 41 0 0 6.97 0 0
Gadsden Gadsden Elementary School 59 12 0 10.03 2.04 0
Glades West Glades Elementary 35 30 5 15.05 12.9 2.15
Hamilton South Hamilton Elem 52 16 0 13 4 0

115
District School Name – Group 1
FCAT Math 4th
grade Percent Level 3
FCAT Math 4th
grade Percent Level 4
FCAT Math 4th
grade Percent Level 5
Total # of students
FCAT Math4 L3
Total # of students
FCAT Math4 L4
Total # of students
FCAT Math4 L5
Holmes Poplar School 27 9 5 5.94 1.98 1.1
Walton Bay Elementary 41 32 22 16.81 13.12 9.02
Volusia Ortona Elementary 41 20 2 18.86 9.2 0.92
St. Lucie Ft. Pierce Magnet 24 22 8 11.76 10.78 3.92
Sumter North Sumter Intermediate 38 13 4 50.54 17.29 5.32
Putnam William D. Moseley Elementary 44 21 0 17.16 8.19 0
Santa Rosa Chumuckla Elementary 42 24 9 13.86 7.92 2.97
Sarasota Sarasota Suncost Academy 50 35 5 10 7 1
Orange Hungerford Elementary 25 13 0 10 5.2 0
Pasco DaySpring Academy 42 38 8 20.16 18.24 3.84
Pinellas North Ward Elementary 47 19 5 20.21 8.17 2.15
Monroe Sigsbee Elementary 46 23 6 16.1 8.05 2.1
Nassau Bryceville Elementary 47 21 5 17.86 7.98 1.9

116
District School Name – Group 1
FCAT Math 4th
grade Percent Level 3
FCAT Math 4th
grade Percent Level 4
FCAT Math 4th
grade Percent Level 5
Total # of students
FCAT Math4 L3
Total # of students
FCAT Math4 L4
Total # of students
FCAT Math4 L5
Okaloosa Laurel Hill School 41 28 3 15.99 10.92 1.17
Levy Yankeetown School 39 21 0 10.92 5.88 0
Liberty Hosford Elementary Jr. High 57 20 7 17.1 6 2.1
Madison Lee Elementary 46 17 0 16.1 5.95 0
Marion Marion Charter 35 15 0 11.9 5.1 0
Lake Altonna School 27 18 0 5.94 3.96 0
Lee Ft. Myers Beach Elementary 27 35 30 9.99 12.95 11.1

117
District School Name – Group 2
FCAT Math 4th
grade Percent Level 3
FCAT Math 4th
grade Percent Level 4
FCAT Math 4th
grade Percent Level 5
Total # of students
FCAT Math4 L3
Total # of students
FCAT Math4 L4
Total # of students
FCAT Math4 L5
Volusia Bonner Elementary 41 8 0 24.19 4.72 0
Walton Freeport Elementary 45 13 8 45 13 8
Washington Vernon Elementary 31 30 16 31.62 30.6 16.32
St. Johns Crookshank Elementary 41 23 0 31.98 17.94 0
St. Lucie Parkway Elementary 46 7 3 40.02 6.09 2.61
Sumter Lake Panasoffkee 42 24 6 35.28 20.16 5.04
Polk Berkley Elementary 45 25 9 39.6 22 7.92
Putnam James A. Long Elementary 35 10 6 26.95 7.7 4.62
Santa Rosa Bagdad Elementary 38 32 9 29.26 24.64 6.93
Sarasota Englewood Elementary 37 30 11 26.27 21.3 7.81
Seminole Geneva Elementary 45 23 9 50.4 25.76 10.08
Orange Aloma Elementary 30 30 14 21.3 21.3 9.94
Osceola P.M. Wells Charter Academy 46 13 0 33.12 9.36 0

118
District School Name – Group 2
FCAT Math 4th
grade Percent Level 3
FCAT Math 4th
grade Percent Level 4
FCAT Math 4th
grade Percent Level 5
Total # of students
FCAT Math4 L3
Total # of students
FCAT Math4 L4
Total # of students
FCAT Math4 L5
Palm Beach Allamanda Elementary 41 16 19 28.7 11.2 13.3
Pasco Trinity Oaks Elementary 44 21 8 40.04 19.11 7.28
Pinellas Azalea Elementary 39 19 5 39 19 5
Martin Hobe Sound Elementary 38 42 9 37.62 41.58 8.91
Nassau Atlantic Elementary
Okaloosa Annette P. Edwins Elementary 35 22 19 24.15 15.18 13.11
Levy Williston Elementary 39 25 8 67.47 43.25 13.84
Liberty W.R. Tolar K-8 39 13 4 26.13 8.71 2.68
Manatee Ballard Elementary 42 8 4 40.32 7.68 3.84
Marion South Ocala Elementary 33 30 21 27.06 24.6 17.22
Lafayette Lafayette Elementary 44 13 8 39.6 11.7 7.2
Lake Eustis Elementary 43 31 6 36.12 26.04 5.04
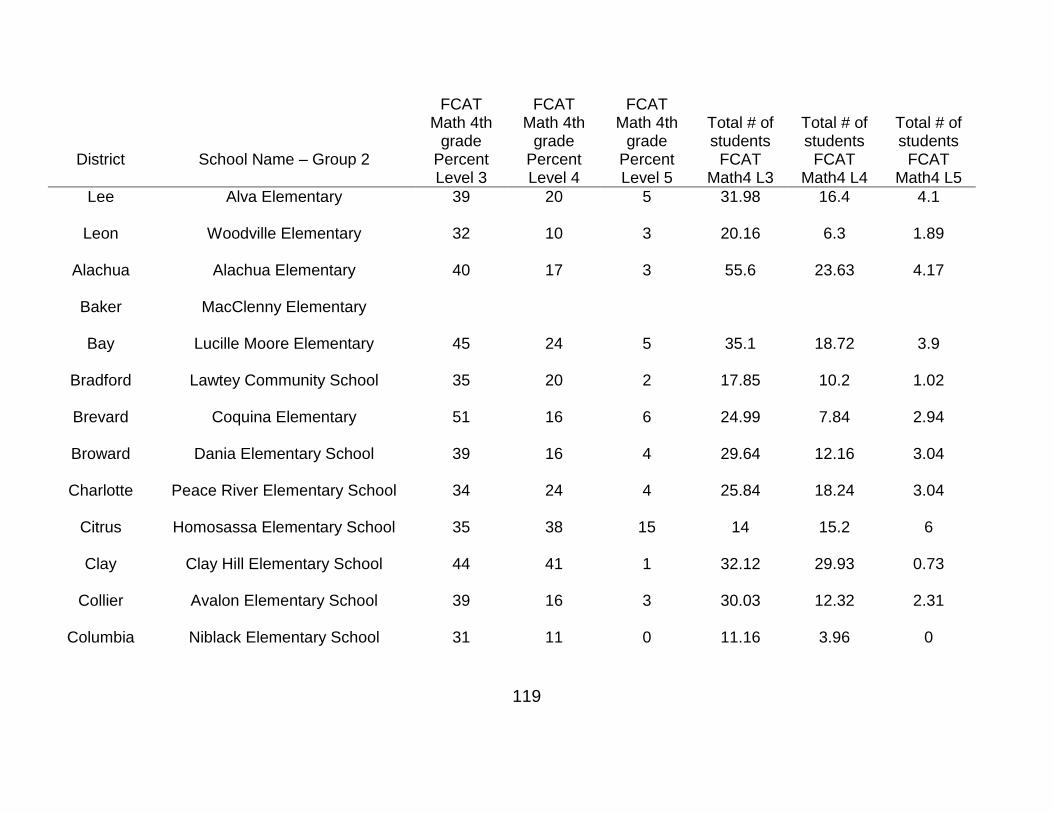
119
District School Name – Group 2
FCAT Math 4th
grade Percent Level 3
FCAT Math 4th
grade Percent Level 4
FCAT Math 4th
grade Percent Level 5
Total # of students
FCAT Math4 L3
Total # of students
FCAT Math4 L4
Total # of students
FCAT Math4 L5
Lee Alva Elementary 39 20 5 31.98 16.4 4.1
Leon Woodville Elementary 32 10 3 20.16 6.3 1.89
Alachua Alachua Elementary 40 17 3 55.6 23.63 4.17
Baker MacClenny Elementary
Bay Lucille Moore Elementary 45 24 5 35.1 18.72 3.9
Bradford Lawtey Community School 35 20 2 17.85 10.2 1.02
Brevard Coquina Elementary 51 16 6 24.99 7.84 2.94
Broward Dania Elementary School 39 16 4 29.64 12.16 3.04
Charlotte Peace River Elementary School 34 24 4 25.84 18.24 3.04
Citrus Homosassa Elementary School 35 38 15 14 15.2 6
Clay Clay Hill Elementary School 44 41 1 32.12 29.93 0.73
Collier Avalon Elementary School 39 16 3 30.03 12.32 2.31
Columbia Niblack Elementary School 31 11 0 11.16 3.96 0
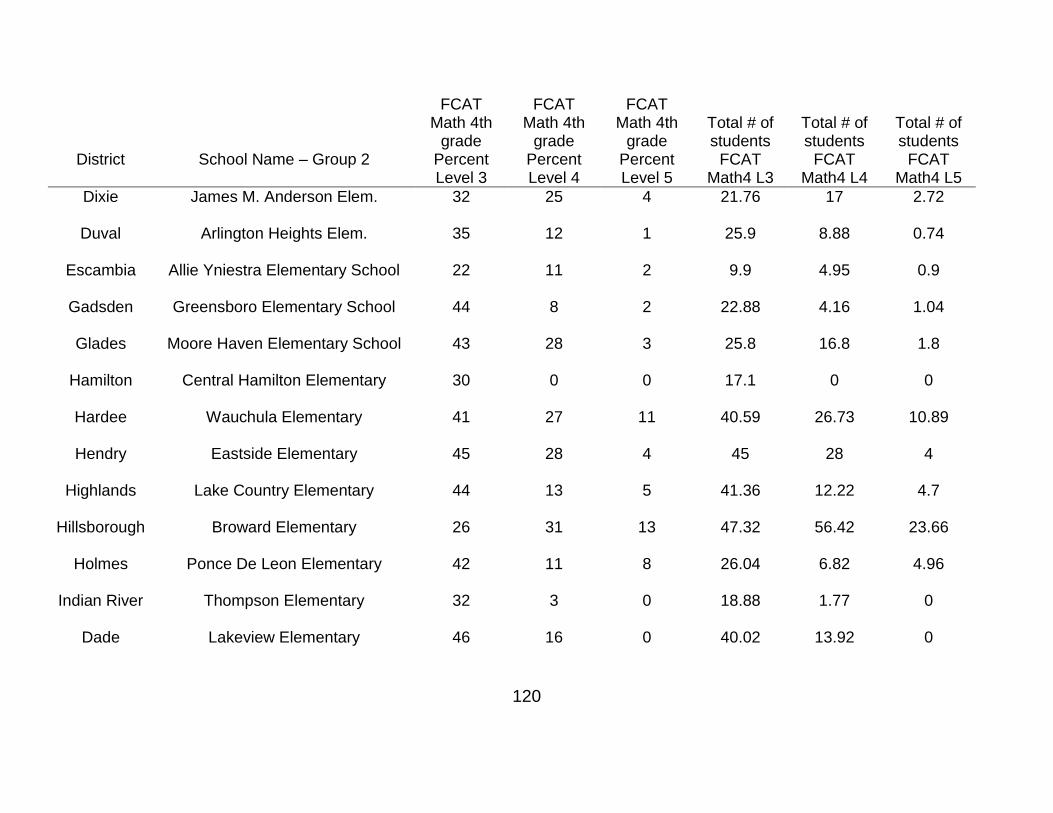
120
District School Name – Group 2
FCAT Math 4th
grade Percent Level 3
FCAT Math 4th
grade Percent Level 4
FCAT Math 4th
grade Percent Level 5
Total # of students
FCAT Math4 L3
Total # of students
FCAT Math4 L4
Total # of students
FCAT Math4 L5
Dixie James M. Anderson Elem. 32 25 4 21.76 17 2.72
Duval Arlington Heights Elem. 35 12 1 25.9 8.88 0.74
Escambia Allie Yniestra Elementary School 22 11 2 9.9 4.95 0.9
Gadsden Greensboro Elementary School 44 8 2 22.88 4.16 1.04
Glades Moore Haven Elementary School 43 28 3 25.8 16.8 1.8
Hamilton Central Hamilton Elementary 30 0 0 17.1 0 0
Hardee Wauchula Elementary 41 27 11 40.59 26.73 10.89
Hendry Eastside Elementary 45 28 4 45 28 4
Highlands Lake Country Elementary 44 13 5 41.36 12.22 4.7
Hillsborough Broward Elementary 26 31 13 47.32 56.42 23.66
Holmes Ponce De Leon Elementary 42 11 8 26.04 6.82 4.96
Indian River Thompson Elementary 32 3 0 18.88 1.77 0
Dade Lakeview Elementary 46 16 0 40.02 13.92 0
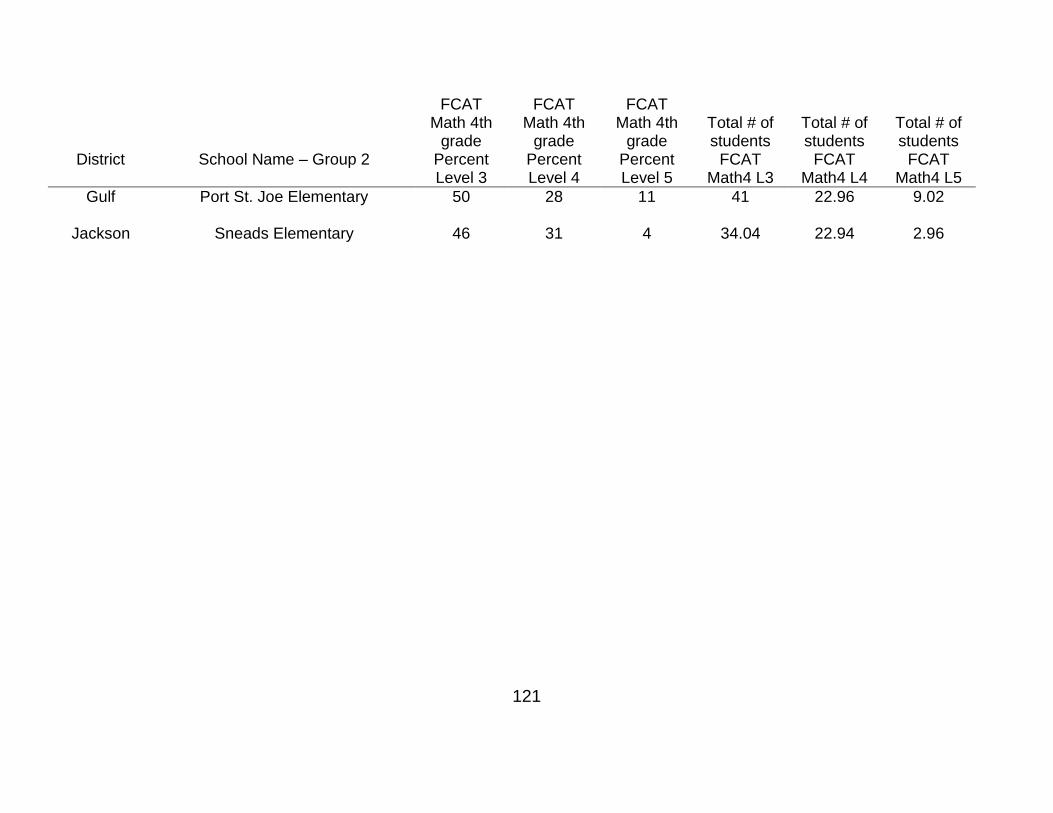
121
District School Name – Group 2
FCAT Math 4th
grade Percent Level 3
FCAT Math 4th
grade Percent Level 4
FCAT Math 4th
grade Percent Level 5
Total # of students
FCAT Math4 L3
Total # of students
FCAT Math4 L4
Total # of students
FCAT Math4 L5
Gulf Port St. Joe Elementary 50 28 11 41 22.96 9.02
Jackson Sneads Elementary 46 31 4 34.04 22.94 2.96

122
District School Name – Group 3
FCAT Math 4th
grade Percent Level 3
FCAT Math 4th
grade Percent Level 4
FCAT Math 4th
grade Percent Level 5
Total # of students
FCAT Math4 L3
Total # of students
FCAT Math4 L4
Total # of students
FCAT Math4 L5
Alachua C.W. Norton Elementary 34 33 12 36.38 35.31 12.84
Baker J Franklyn Keller Elementary 37 18 5 124.69 60.66 16.85
Bay Patronis Elementary 36 39 15 54.72 59.28 22.8
Bradford Southside Elementary 34 25 5 29.92 22 4.4
Brevard Discovery Elementary 43 20 7 52.89 24.6 8.61
Broward Challenger Elementary School 39 16 4 29.64 12.16 3.04
Calhoun Blountstown Elementary School 55 18 9 46.75 15.3 7.65
Charlotte Vineland Elementary School 37 24 8 56.61 36.72 12.24
Citrus Citrus Springs Elementary School 39 29 10 70.59 52.49 18.1
Clay Lake Asbury Elementary School 45 19 5 83.7 35.34 9.3
Collier Laurel Oak Elementary School 37 32 16 68.45 59.2 29.6
Columbia Summers Elementary School 42 23 5 50.4 27.6 6

123
District School Name – Group 3
FCAT Math 4th
grade Percent Level 3
FCAT Math 4th
grade Percent Level 4
FCAT Math 4th
grade Percent Level 5
Total # of students
FCAT Math4 L3
Total # of students
FCAT Math4 L4
Total # of students
FCAT Math4 L5
DeSoto Memorial Elementary School 29 21 4 37.7 27.3 5.2
Duval Sabal Palm Elementary School 39 34 8 71.37 62.22 14.64
Escambia Hellen Caro Elementary School 35 24 8 63.35 43.44 14.48
Flagler Belle Terre Elementary School 41 20 5 101.27 49.4 12.35
Gadsden George W. Munroe Elem. 29 4 0 27.55 3.8 0
Gilchrist Trenton Elementary School 48 27 8 52.8 29.7 8.8
Hendry Country Oaks Elementary 43 22 2 58.48 29.92 2.72
Hernando John D. Floyd Elementary 40 29 4 92 66.7 9.2
Highlands Sun 'N Lake Elementary 33 23 9 43.56 30.36 11.88
Hillsborough Boyette Springs Elementary 26 31 13 47.32 56.42 23.66
Holmes Bonifay Elementary 34 19 5 43.86 24.51 6.45
Indian River Glendale Elementary 33 23 11 32.67 22.77 10.89
Volusia Deltona Lakes Elementary 37 24 3 68.82 44.64 5.58

124
District School Name – Group 3
FCAT Math 4th
grade Percent Level 3
FCAT Math 4th
grade Percent Level 4
FCAT Math 4th
grade Percent Level 5
Total # of students
FCAT Math4 L3
Total # of students
FCAT Math4 L4
Total # of students
FCAT Math4 L5
Wakulla Crawfordville Elementary 41 18 2 51.25 22.5 2.5
Walton Maude Saunders Elementary 41 27 9 41.82 27.54 9.18
Washington Kate M. Smith Elementary 41 21 7 62.32 31.92 10.64
St. Johns Mill Creek Elementary 46 28 8 83.26 50.68 14.48
St. Lucie Rivers Edge Elementary 37 26 5 51.43 36.14 6.95
Sumter Bushnell Elementary 39 20 5 44.85 23 5.75
Suwannee Suwannee Elementary
Taylor Taylor County Elementary 47 19 4 102.46 41.42 8.72
Polk Alta Vista Elementary 39 17 3 58.89 25.67 4.53
Putnam Interlachen Elementary 50 18 4 57 20.52 4.56
Santa Rosa Berryhill Elementary 34 34 16 52.36 52.36 24.64
Sarasota Ashton Elementary 34 41 10 53.38 64.37 15.7
Seminole Bear Lake Elementary 35 32 16 66.5 60.8 30.4

125
District School Name – Group 3
FCAT Math 4th
grade Percent Level 3
FCAT Math 4th
grade Percent Level 4
FCAT Math 4th
grade Percent Level 5
Total # of students
FCAT Math4 L3
Total # of students
FCAT Math4 L4
Total # of students
FCAT Math4 L5
Orange Palmetto Elementary 32 10 3 57.28 17.9 5.37
Palm Beach Binks Forest Elementary 27 37 28 63.99 87.69 66.36
Pasco Sand Pine Elementary 40 28 4 71.2 49.84 7.12
Pinellas Cypress Woods Elementary 29 51 9 33.93 59.67 10.53
Martin Palm City Elementary 30 37 22 47.1 58.09 34.54
Nassau Hilliard Elementary 42 34 11 51.24 41.48 13.42
Okaloosa Antioch Elementary 40 35 18 50 43.75 22.5
Okeechobee Everglades Elementary 41 23 0 51.25 28.75 0
Levy Chiefland Elementary 44 15 5 50.16 17.1 5.7
Madison Madison County Central School 43 5 0 56.33 6.55 0
Manatee Freedom Elementary 52 18 3 58.76 20.34 3.39
Marion Maplewood Elementary 44 25 11 55.44 31.5 13.86
Jefferson Jefferson County Elementary 42 9 0 28.14 6.03 0

126
District School Name – Group 3
FCAT Math 4th
grade Percent Level 3
FCAT Math 4th
grade Percent Level 4
FCAT Math 4th
grade Percent Level 5
Total # of students
FCAT Math4 L3
Total # of students
FCAT Math4 L4
Total # of students
FCAT Math4 L5
Lake Lost Lake Elementary 41 29 13 97.99 69.31 31.07
Lee Gulf Elementary 37 26 12 85.1 59.8 27.6
Leon Gilchrist Elementary 20 47 28 25.8 60.63 36.12
Dade Ernest R Graham Elementary 35 33 12 112.7 106.26 38.64
Union Lake Butler Elementary School 39 29 7 67.08 49.88 12.04

127
APPENDIX G FCAT MATH DATA FOR GRADE 5

128
Table 9
FCAT Math data for Grade 5
District School Name – Group 1
FCAT Math 5th
grade Percent Level 3
FCAT Math 5th
grade Percent Level 4
FCAT Math 5th
grade Percent Level 5
Total # of students
FCAT Math5 L3
Total # of students
FCAT Math5 L4
Total # of students
FCAT Math5 L5
Alachua Chester Shell Elementary 20 9 6 7.00 3.15 2.10
Bradford Hampton Elementary 16 16 0 7.04 7.04 0.00
Brevard Robert L. Stevenson Elem 24 52 21 14.88 32.24 13.02
Calhoun Carr Elementary School 24 24 4 6.00 6.00 1.00
Dade Liberty City Elementary 11 5 0 4.18 1.90 0.00
Duval Arlington Elementary School 20 20 0 8.20 8.20 0.00
Escambia George S. Hallmark Elementary 20 2 2 8.80 0.88 0.88
Franklin H.G. Brown Elementary School 23 13 3 7.13 4.03 0.93
Gadsden Gadsden Elementary School 33 22 6 5.94 3.96 1.08
Glades West Glades Elementary 12 3 3 4.08 1.02 1.02
Hamilton South Hamilton Elementary 18 18 18 1.98 1.98 1.98

129
District School Name – Group 1
FCAT Math 4th
grade Percent Level 3
FCAT Math 4th
grade Percent Level 4
FCAT Math 4th
grade Percent Level 5
Total # of students
FCAT Math4 L3
Total # of students
FCAT Math4 L4
Total # of students
FCAT Math4 L5
Holmes Poplar School 38 8 0 9.12 1.92 0.00
Walton Bay Elementary 24 32 11 8.88 11.84 4.07
Volusia Ortona Elementary 32 14 11 11.84 5.18 4.07
St. Lucie Ft. Pierce Magnet 20 20 0 10.80 10.80 0.00
Sumter North Sumter Intermediate 32 14 3 37.76 16.52 3.54
Santa Rosa Chumuckla Elementary 24 43 3 8.88 15.91 1.11
Sarasota Sarasota Suncost Academy
Orange Hungerford Elementary 24 5 5 5.04 1.05 1.05
Pasco DaySpring Academy 23 15 8 11.04 7.20 3.84
Pinellas North Ward Elementary 46 24 8 17.02 8.88 2.96
Monroe Sigsbee Elementary 19 31 6 6.08 9.92 1.92
Nassau Bryceville Elementary 28 39 6 15.12 21.06 3.24
Okaloosa Laurel Hill School 27 19 0 9.99 7.03 0.00

130
District School Name – Group 1
FCAT Math 4th
grade Percent Level 3
FCAT Math 4th
grade Percent Level 4
FCAT Math 4th
grade Percent Level 5
Total # of students
FCAT Math4 L3
Total # of students
FCAT Math4 L4
Total # of students
FCAT Math4 L5
Liberty Hosford Elementary Jr. High 36 28 0 9.00 7.00 0.00
Madison Lee Elementary 0 22 0 0.00 3.96 0.00
Marion Marion Charter 32 9 9 7.04 1.98 1.98
Lake Altonna School 36 0 0 3.96 0.00 0.00
Lee Ft. Myers Beach Elementary 40 31 3 14.00 10.85 1.05

131
District School Name – Group 2
FCAT Math 4th
grade Percent Level 3
FCAT Math 4th
grade Percent Level 4
FCAT Math 4th
grade Percent Level 5
Total # of students
FCAT Math4 L3
Total # of students
FCAT Math4 L4
Total # of students
FCAT Math4 L5
Volusia Bonner Elementary 30 2 5 18.30 1.22 3.05
Walton Freeport Elementary 26 20 4 22.10 17.00 3.40
Washington Vernon Elementary
St. Johns Crookshank Elementary 24 13 1 16.32 8.84 0.68
St. Lucie Parkway Elementary 19 26 1 13.30 18.20 0.70
Sumter Lake Panasoffkee 26 28 11 22.62 24.36 9.57
Polk Berkley Elementary 39 32 6 34.32 28.16 5.28
Santa Rosa Bagdad Elementary 32 17 2 28.16 14.96 1.76
Sarasota Englewood Elementary 29 33 7 23.78 27.06 5.74
Seminole Geneva Elementary 33 33 11 31.68 31.68 10.56
Orange Aloma Elementary 28 27 3 18.76 18.09 2.01
Osceola P.M. Wells Charter Academy 24 15 4 17.04 10.65 2.84
Palm Beach Allamanda Elementary 26 32 12 20.28 24.96 9.36
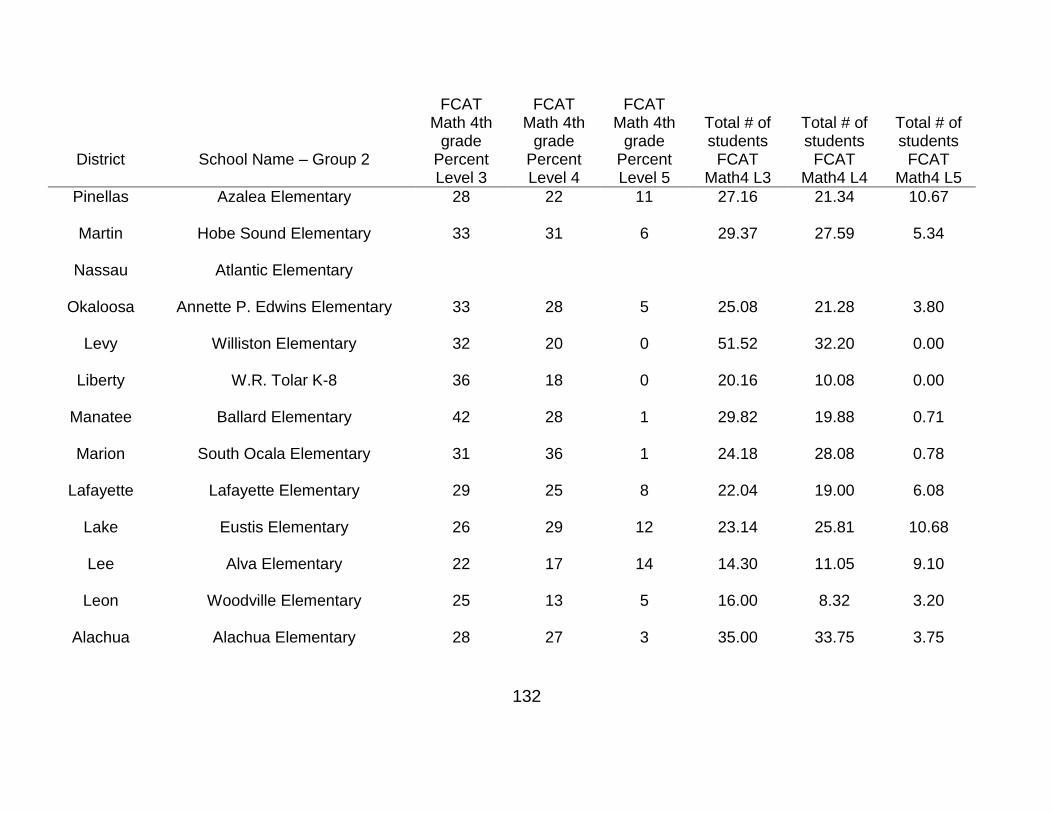
132
District School Name – Group 2
FCAT Math 4th
grade Percent Level 3
FCAT Math 4th
grade Percent Level 4
FCAT Math 4th
grade Percent Level 5
Total # of students
FCAT Math4 L3
Total # of students
FCAT Math4 L4
Total # of students
FCAT Math4 L5
Pinellas Azalea Elementary 28 22 11 27.16 21.34 10.67
Martin Hobe Sound Elementary 33 31 6 29.37 27.59 5.34
Nassau Atlantic Elementary
Okaloosa Annette P. Edwins Elementary 33 28 5 25.08 21.28 3.80
Levy Williston Elementary 32 20 0 51.52 32.20 0.00
Liberty W.R. Tolar K-8 36 18 0 20.16 10.08 0.00
Manatee Ballard Elementary 42 28 1 29.82 19.88 0.71
Marion South Ocala Elementary 31 36 1 24.18 28.08 0.78
Lafayette Lafayette Elementary 29 25 8 22.04 19.00 6.08
Lake Eustis Elementary 26 29 12 23.14 25.81 10.68
Lee Alva Elementary 22 17 14 14.30 11.05 9.10
Leon Woodville Elementary 25 13 5 16.00 8.32 3.20
Alachua Alachua Elementary 28 27 3 35.00 33.75 3.75

133
District School Name – Group 2
FCAT Math 4th
grade Percent Level 3
FCAT Math 4th
grade Percent Level 4
FCAT Math 4th
grade Percent Level 5
Total # of students
FCAT Math4 L3
Total # of students
FCAT Math4 L4
Total # of students
FCAT Math4 L5
Bradford Lawtey Community School 16 16 0 7.04 7.04 0.00
Brevard Coquina Elementary 30 26 4 13.80 11.96 1.84
Broward Dania Elementary School 23 21 9 17.94 16.38 7.02
Charlotte Peace River Elementary School 41 17 3 35.26 14.62 2.58
Citrus Homosassa Elementary School 37 27 8 18.87 13.77 4.08
Clay Clay Hill Elementary School 35 25 4 24.85 17.75 2.84
Collier Avalon Elementary School 33 14 4 23.76 10.08 2.88
Columbia Niblack Elementary School 11 2 0 4.95 0.90 0.00
Dixie James M. Anderson Elem. 24 20 4 12.24 10.20 2.04
Duval Arlington Heights Elem. 28 6 2 29.12 6.24 2.08
Escambia Allie Yniestra Elementary School 14 14 0 7.00 7.00 0.00
Gadsden Greensboro Elementary School 18 35 2 11.16 21.70 1.24
Glades Moore Haven Elementary School 32 22 0 19.20 13.20 0.00

134
District School Name – Group 2
FCAT Math 4th
grade Percent Level 3
FCAT Math 4th
grade Percent Level 4
FCAT Math 4th
grade Percent Level 5
Total # of students
FCAT Math4 L3
Total # of students
FCAT Math4 L4
Total # of students
FCAT Math4 L5
Hardee Wauchula Elementary 28 29 7 20.16 20.88 5.04
Hendry Eastside Elementary 31 14 1 22.32 10.08 0.72
Highlands Lake Country Elementary 25 37 13 23.25 34.41 12.09
Hillsborough Broward Elementary 22 7 0 18.04 5.74 0.00
Holmes Ponce De Leon Elementary 32 17 1 22.08 11.73 0.69
Indian River Thompson Elementary 23 13 5 14.03 7.93 3.05
Dade Lakeview Elementary 21 19 2 13.02 11.78 1.24
Jackson Sneads Elementary 23 38 10 18.40 30.40 8.00

135
District School Name – Group 3
FCAT Math 4th
grade Percent Level 3
FCAT Math 4th
grade Percent Level 4
FCAT Math 4th
grade Percent Level 5
Total # of students
FCAT Math4 L3
Total # of students
FCAT Math4 L4
Total # of students
FCAT Math4 L5
Alachua C.W. Norton Elementary 27 26 3 35.91 34.58 3.99
Baker J Franklyn Keller Elementary 22 21 2 78.10 74.55 7.10
Bay Patronis Elementary 25 39 17 31.50 49.14 21.42
Bradford Southside Elementary 28 16 6 28.00 16.00 6.00
Brevard Discovery Elementary 26 27 6 36.14 37.53 8.34
Broward Challenger Elementary School 23 21 9 17.94 16.38 7.02
Calhoun Blountstown Elementary School 30 38 12 23.10 29.26 9.24
Charlotte Vineland Elementary School 30 28 6 45.60 42.56 9.12
Citrus Citrus Springs Elementary School 26 23 4 42.64 37.72 6.56
Clay Lake Asbury Elementary School 28 25 3 55.44 49.50 5.94
Collier Laurel Oak Elementary School 26 37 11 57.20 81.40 24.20
Columbia Summers Elementary School 27 22 1 34.56 28.16 1.28
DeSoto Memorial Elementary School 18 14 1 23.22 18.06 1.29

136
District School Name – Group 3
FCAT Math 4th
grade Percent Level 3
FCAT Math 4th
grade Percent Level 4
FCAT Math 4th
grade Percent Level 5
Total # of students
FCAT Math4 L3
Total # of students
FCAT Math4 L4
Total # of students
FCAT Math4 L5
Escambia Hellen Caro Elementary School 32 25 5 50.56 39.50 7.90
Flagler Belle Terre Elementary School 29 19 6 67.86 44.46 14.04
Gadsden George W. Munroe Elem. 15 3 2 13.80 2.76 1.84
Gilchrist Trenton Elementary School
Hendry Country Oaks Elementary 25 20 3 29.00 23.20 3.48
Hernando John D. Floyd Elementary 28 18 3 52.08 33.48 5.58
Hillsborough Boyette Springs Elementary 24 28 8 46.80 54.60 15.60
Holmes Bonifay Elementary
Indian River Glendale Elementary 28 25 7 30.80 27.50 7.70
Volusia Deltona Lakes Elementary 14 20 7 24.78 35.40 12.39
Wakulla Crawfordville Elementary 22 29 8 31.02 40.89 11.28
Walton Maude Saunders Elementary 26 20 4 29.12 22.40 4.48
Washington Kate M. Smith Elementary 0.00 0.00 0.00

137
District School Name – Group 3
FCAT Math 4th
grade Percent Level 3
FCAT Math 4th
grade Percent Level 4
FCAT Math 4th
grade Percent Level 5
Total # of students
FCAT Math4 L3
Total # of students
FCAT Math4 L4
Total # of students
FCAT Math4 L5
St. Johns Mill Creek Elementary 27 26 8 41.04 39.52 12.16
St. Lucie Rivers Edge Elementary 33 25 6 45.21 34.25 8.22
Sumter Bushnell Elementary 15 20 1 18.30 24.40 1.22
Suwannee Suwannee Elementary
Taylor Taylor County Elementary 25 23 6 53.00 48.76 12.72
Polk Alta Vista Elementary 22 22 5 29.48 29.48 6.70
Putnam Interlachen Elementary 31 22 4 38.75 27.50 5.00
Santa Rosa Berryhill Elementary 35 35 9 54.25 54.25 13.95
Sarasota Ashton Elementary 26 37 17 40.30 57.35 26.35
Seminole Bear Lake Elementary 31 32 11 66.03 68.16 23.43
Orange Palmetto Elementary 19 7 2 33.25 12.25 3.50
Palm Beach Binks Forest Elementary 16 44 25 33.76 92.84 52.75
Pasco Sand Pine Elementary 34 21 5 54.74 33.81 8.05

138
District School Name – Group 3
FCAT Math 4th
grade Percent Level 3
FCAT Math 4th
grade Percent Level 4
FCAT Math 4th
grade Percent Level 5
Total # of students
FCAT Math4 L3
Total # of students
FCAT Math4 L4
Total # of students
FCAT Math4 L5
Nassau Hilliard Elementary 32 38 6 38.08 45.22 7.14
Okaloosa Antioch Elementary 32 35 12 41.60 45.50 15.60
Okeechobee Everglades Elementary 32 13 1 26.88 10.92 0.84
Levy Chiefland Elementary 32 21 1 43.52 28.56 1.36
Madison Madison County Central School 13 8 0 15.60 9.60 0.00
Manatee Freedom Elementary 27 26 8 29.16 28.08 8.64
Marion Maplewood Elementary 21 26 13 21.42 26.52 13.26
Jefferson Jefferson County Elementary 26 13 1 18.72 9.36 0.72
Lake Lost Lake Elementary 28 34 12 72.52 88.06 31.08
Lee Gulf Elementary 30 42 11 67.50 94.50 24.75
Leon Gilchrist Elementary 15 42 34 21.75 60.90 49.30
Dade Ernest R Graham Elementary 25 18 7 73.75 53.10 20.65
Union Lake Butler Elementary School

139
LIST OF REFERENCES
Alter, J. (2008, December 15). Bill Gates Goes to School. Newsweek, Retrieved December 30, 2008, from http://www.newsweek.com/id/172572/
American Teacher (2009, March). Washington, D.C.: American Federation
of Teachers. Bailey, J (2000, January). The case for small schools. A special series
from the center for rural affairs monthly newsletter. Center of Rural Affairs monthly newsletter, 2-8.
Bard, J., Gardener, C., & Wieland, R. (2006). Rural school consolidation:
History, research summary, conclusions, and recommendations.. The Rural Educator. 27, 40-48.
Bickel, R, & Howley, C (2000). The influence of scale on school
performance: A multi-level extension of the Matthew principle. Education Policy Analysis Archives, 8(22), Retrieved July 16, 2008, from http://olam.ed.asu.edu/epaa/v8n22.
Cotton, K. (1996). School size, school climate, and student performance.
Close-up #20. Portland, OR: Northwest Regional Educational Laboratory. Florida Department of Education. (2006). Florida school indicators report.
Retrieved June 12, 2008 from http://data.fldoe.org/fsir/. Florida Department of Education. (2006). School accountability reports.
Retrieved June 12, 2008 from http://schoolgrades.fldoe.org/default.asp. Florida Department of Education. (2008). Understanding FCAT reports
2008. Retrieved June 12, 2008 from http://fcat.fldoe.org/pdf/ufr_08.pdf. Ford, D. (2008).Student success the way they need it: Powerful school
change. Phi Delta Kappan. 90, 281-284. Fowler, Jr., W.J., & Walberg, H.J. (1991). School size, characteristics, and
outcomes. Educational Evaluation and Policy Analysis. 13, 189-202.

140
Friedkin, N.E., & Necochea, J. (1988). School system size and performance: A contingency perspective. Educational Evaluation and Policy Analysis. 10, 237-249.
Fulton, M. (1996). The ABCs of investing in student performance. (ERIC
Document Reproduction Service No. ED 402652) Retrieved July 16, 2008, from ERIC database.
Fusarelli, L. D. (2004).The potential impact of the no child left behind act
on equality and diversity in American education. Educational Policy. 18, 71-94.
Gallucci, C. (2008).Districtwide instructional reform: Using sociocultural
theory to link professional learning to organizational support. American Journal of Education. 114, 541-581.
Gamoran, A. (1996).Student achievement in public magnet, public
comprehensive, and private city high schools. Educational Evaluation and Policy Analysis. 18, 1-18.
Graham, E. (2009). Public school education –The case for reduced class
size. Retrieved May 2, 2009, from http://www.eric.ed.gov/ERICDocs/data/ericdocs2sql/content_storage_01/0000019b/80/42/c2/f3.pdf.
Haenn, J. (2002, April 1). Class Size and Student Success: Comparing the
Results of Five Elementary Schools Using Small Class Sizes. (ERIC Document Reproduction Service No. ED464725) Retrieved September 28, 2008, from ERIC database.
Harris, D., & Arizona State Univ., T. (2004, April 1). Class Size, Pre-
Kindergarten, and Educational Adequacy: Costs and Funding Options for Florida. Policy Brief. Education Policy Studies Laboratory, Arizona State University College of Education, (ERIC Document Reproduction Service No. ED483726) Retrieved September 28, 2008, from ERIC database.

141
Howley, C., & Bickel, R. (1999, August 25). The Matthew Project: National Report. (ERIC Document Reproduction Service No. ED433174) Retrieved July 16, 2008, from ERIC database.
Hylden, J. (2004). What‘s so big about small schools? The case for small
schools: Nationwide and in North Dakota. Retrieved September 24, 2008 from http://www.hks.harvard.edu/pepg/PDF/Papers/PEPG05-05Hylden.pdf.
Irmsher, K., & ERIC Clearinghouse on Educational Management, E. (1997,
July 1). School Size. ERIC Digest, Number 113. . (ERIC Document Reproduction Service No. ED414615) Retrieved July 16, 2008, from ERIC database.
Jepsen, C., & Rivkin, S. (2007). Class size reduction and student
achievement: The potential tradeoff between teacher quality and class size. The journal of human resources. 44, 223-250.
Kahne, J. E., Sporte, S.E., & Easton, J.Q. (2005). Creating small schools
in Chicago: An early look at implementation and impact. Improving Schools. 8, 7-22.
Kahne, J. E., Sporte, S.E., Torre, M.D. & Easton, J.Q. (2006). Small high
schools on a larger scale: The first three years of the Chicago high school redesign initiative. Consortium on Chicago School Research at the University of Chicago. 1-3.
Lashway, L. (1999).School size: Is small better?. Research Roundup. 15,
1-4. Lee, V. E., & Smith, J. B. (1993). Effects of school restructuring on the
achievement and engagement of middle-grade students.. Sociology of Education. 66, 164-187.
Lee, V.E., & Smith, J.B. (1997). High school size: Which works best and
for whom?. Educational Evaluation and Policy Analysis. 19, 205-227. Mathis, W. J. (2003).No child left behind: Costs and benefits. Phi Delta
Kappan. 84, 679-686.

142
McNeil, M. (2008, February 20). Leaner Class Sizes Add Fiscal Stress To Florida Districts. Education Week, 27(24), 1-18. Retrieved September 28, 2008, from Professional Development Collection database.
Meier, Deborah (1995). The Power of their ideas: Lessons for America
from a small school in Harlem. Boston, MA: Beacon Press. Mosteller, F. (1995).The Tennessee study of class size in the early school
grades. The Future of Children. 5, 113-127. National Education Association (2003). Protecting public education from
tax giveaways to corporations: Property tax abatements, tax increment financing, and funding for schools. Washington, DC: NEA Research.1-23.
National Education Association (2007). Rankings and estimates:
Rankings of the states 2006 and estimates of school statistics 2007. Washington, DC: NEA Research. 11-13, 53-57
Overbay, A. (2003).School size: A review of the literature. Research
Watch. 3, 1-12. Porter, K., & Soper, S. (2003).Closing the achievement gap: Urban
schools. The National Clearinghouse for Comprehensive School Reform. 2.
Raywid, M.A. (1997).Successful school downsizing.. School Administrator..
54.9, 18. Raywid, M., & ERIC Clearinghouse on Rural Education and Small Schools,
C. (1999, January 1). Current Literature on Small Schools. ERIC Digest. . (ERIC Document Reproduction Service No. ED425049) Retrieved July 16, 2008, from ERIC database.
Rubenstien, G. (2007, September). Northern Lights. Edutopia, 3, 26-30.
Success for All Foundation (2006). Success for Florida. Retrieved September 24, 2008 from http://www.successforall.net/research/reports.htm.
143
Smith, M. L. (2004, April). Retaining students in grades: Consequences for Florida. Retrieved from http://epicpolicy.org/files/EPSL-0401-114-EPRU.pdf.
Sofo, R. (2008).Beyond NCLB and AYP: One superintendent's experience
of school district reform. Harvard Educational Review. 78, 391-409. SPSS®. (2008). Statistical package for social sciences for Windows,
Version 17.0. [Computer program]. Chicago, IL: SPSS, Inc. Sunderman, G. L., Tracey, C. A., Kim, J., & Orfield, G. (2004). Listening to
teachers: Classroom realities and No Child Left Behind. The Civil Rights Project, 1-47.
Thompson, D. R. (1996).School size counts. School Administrator. 53, 6. U.S. Department of Education (2001). Public school finance programs of
the United States and Canada: 1998–99. Retrieved from http://nces.ed.gov/edfin/state_financing.asp on August 9, 2008.
Vander Ark, T. (2002).Class size, school size: The case for small high
schools. Educational Leadership. 59, 55-59. Wainer, H., & Zwerling, H. (2006). Evidence that smaller schools do not
improve student achievement. Phi Delta Kappan. 88, 300-303.