Embed Size (px)
Citation preview


ANNUAL REPORT of the Elektro Celje Company and Elektro Celje Group
2015

ANNUAL REPORT
Elektro Celje2 0 1 5
04
TABLE OF CONTENTS
INTRODUCTION 9
1. FINANCIAL AND OPERATION HIGHLIGHTS OF ELEKTRO CELJE GROUP 10
2. FOREWORD OF THE CHAIRMAN OF THE MANAGEMENT BOARD 12
3. SUPERVISORY BOARD REPORT 143.1 Introduction 143.2 Supervision of Company Operations 143.3 Appraisal of the Supervisory Board
Composition 163.4 Supervision of Company and Group
Operations after the End of the Fiscal Year 163.5 Audit and Approval of the Annual Report
of the Company and the Group, and Opinion on the Audit Report 16
BUSINESS REPORT 18
4. OVERVIEW OF MAJOR EVENTS IN 2015 204.1 Events after the End of the Accounting Period 22
5. DEVELOPMENT STRATEGY 235.1 Strategic Guidelines 235.2 Strategic Goals and Strategic Diagram 23
6. COMPANY GOVERNANCE AND MANAGEMENT 25
6.1 Elektro Celje Corporate Governance Statement 25
7. PRESENTATION OF ELEKTRO CELJE GROUP 27
7.1 Controlling Company Elektro Celje, d.d. 277.1.1 Elektro Celje Company Profile 277.1.2 Mission, Vision and Values of Elektro Celje 297.1.3 Organisational Structure of Elektro Celje 297.1.4 Internal Audit 307.2 Subsidiary ECE 31
7.2.1 ECE Company Profile 317.2.2 Mission, Vision and Values of ECE 317.2.3 Operations and Performance of ECE 327.2.3.1 Purchase of Electricity 327.2.3.2 Sales of Electricity 327.2.3.3 Renewable Energy Sources 337.2.3.4 Natural Gas 337.2.3.5 Wood Pellets 337.3 Subsidiary MHE – ELPRO 347.3.1 MHE – ELPRO Company Profile 347.3.2 Operations and Performance
of MHE – ELPRO 34
8. ORGANISATION AND ACTIVITIES OF THE COMPANY ELEKTRO CELJE 38
8.1 Operation and Development of the Distribution Network 38
8.1.1 Development of the Distribution Network 388.1.1.1 Documents on Developments Affecting
the Physical Environment 398.1.1.2 Agreements on Connection to
the Distribution Network 408.1.1.3 GIS and DTD 408.1.1.4 Quality of Electricity Supply and Network
Development 418.1.2 Operation of the Distribution Network 438.1.3 Protection and Remote Control 458.1.4 Telecommunications 468.1.5 Access to Network and Metering 468.1.5.1 Energy Balance Sheet 488.1.5.1.1 Input (Production) Balance 488.1.5.1.2 Electricity Suppliers 508.1.5.1.3 Electricity Consumers 508.1.5.2 Metering Equipment 518.1.6 Network Charges 518.2 Maintenance and Investments 518.2.1 Maintenance 528.2.2 Planning and Engineering 548.2.3 Investments 559. BUSINESS ENVIRONMENT 60

ANNUAL REPORT
Elektro Celje2 0 1 5
05
9.1 Analysis of the Business Environment 609.1.1 Impact of the economic environment
on the operations of the Elektro Celje Group 609.1.2 The Impact of Supply and Demand of
electricity and other energy-generating products on the operation of the Group 61
9.2 The Legal and Regulatory Framework of Operation 61
9.3 Composition of the price for electricity for the end consumer 63
9.4 Shares of categories on the electricity bill for a typical household customer 63
10. OPERATION AND PERFORMANCE ANALYSIS 66
10.1 Operation Analysis of the Company Elektro Celje 66
10.1.1 Net Income 6610.1.2 Ownership and Financial Position 7010.1.3 Cash and Cash Equivalents 7210.1.4 Performance Analysis for Elektro Celje, d.d. 7210.2 Performance Analysis
of the Elektro Celje Group 7810.2.1 Net Income 7810.2.2 Financial Position 8210.2.3 Cash and Cash Equivalents 8410.2.4 Elektro Celje Group Performance Indicators 84
11. RISK MANAGEMENT 9211.1 Risk Management at Elektro Celje 9211.2 Basic Risks at Elektro Celje 9311.3 Types of risks and their management at the
Elektro Celje Group 95
12. SUSTAINABLE DEVELOPMENT 9812.1 Sustainable Development Guidelines 9812.2 Corporate Integrity and Ethical Code 9812.3 Responsibility to Employees 9912.3.1 Headcount and Composition of Employees 9912.3.2 Employee Education and Training 101
12.3.3 Occupational Health and Safety 10112.4 Quality Management Systems 10212.4.1 Quality Management System 10212.4.2 Environmental Quality Management 10212.5 Communication 10312.6 Corporate Social Responsibility 105
13. PLANS AND ANTICIPATED DEVELOPMENT OF THE ELEKTRO CELJE COMPANY AND ELEKTRO CELJE GROUP 108
13.1 Key Business Goals of Elektro Celje 10813.2 Planning and Development of Distribution
Network 11013.3 Key Business Goals of Elektro Celje Group 113
FINANCIAL REPORT 114
14. INDEPENDENT AUDITOR'S REPORTS 116
15. FINANCIAL STATEMENTS OF THE COMPANY ELEKTRO CELJE 118
15.1 Balance Sheet 11815.2 Income Statement 12015.3 Statement of Other Comprehensive Income 12115.4 Statement of Cash Flows 12215.5 Statement of Changes in Equity 123
16. EXPLANATORY NOTES TO THE FINANCIAL STATEMENTS 125
16.1 Bases for the Preparation of Financial Statements 125
16.2 Principal Accounting Policies 12516.3 Disclosure of Items in the Balance Sheet 13016.3.1 Intangible Assets and Long-term Accrued Revenue and Deferred Expenses 13016.3.2 Property, Plant and Equipment 13116.3.3 Long-term Financial Investments 13316.3.4 Deferred Tax Assets 13416.3.5 Inventory 13416.3.6 Receivables 134

ANNUAL REPORT
Elektro Celje2 0 1 5
06
TABLE OF CONTENTS
16.3.6.1 Long-term Trade Receivables 13616.3.6.2 Short-term Trade Receivables 13616.3.7 Cash and Cash Equivalents 13716.3.8 Accrued Revenue and Deferred Expenses 13816.3.9 Equity 13816.3.10 Provisions and Long-term Accrued
Expenses and Deferred Revenue 13916.3.11 Long-term Financial Liabilities 14016.3.12 Short-term Financial Liabilities and
Trade Payables 14116.3.13 Short-term Accrued Expenses and
Deferred Revenue 14216.3.14 Contingent Liabilities 14216.3.15 Contingent Assets and Other Off-balance-
sheet Records 14216.4 Events Following the Balance Sheet Date 14316.5 Disclosures of Items in the Income
Statement 14316.5.1 Net Sales Revenue 14316.5.2 Capitalised Own Services 14416.5.3 Other Operating Revenue 14416.5.4 Operating Costs and Expenses
by Functional Groups 14516.5.4.1 Cost of Goods, Material and Services 14516.5.4.2 Labour Costs 14616.5.4.3 Write-downs and Write-offs 14616.5.4.4 Other Operating Expenses 14616.5.5 Finance Income from Shareholdings 14716.5.6 Finance Income from Interest on Loans 14716.5.7 Finance Income from Trade Receivables 14716.5.8 Financial Expenses from Impairment and
Write-downs of Financial Investments 14716.5.9 Financial Expenses from Financial Liabilities 14716.5.10 Financial Expenses from Operating
Liabilities 14816.5.11 Other Income 14816.5.12 Other Expenses 14816.5.13 Net Income/Profit 14816.5.14 Statement of Comprehensive Income 14816.5.15 Income Tax 149
16.6 Disclosure of Items in the Statement of Cash Flows 149
16.6.1 Inflows from Operating Activities 14916.6.2 Outflows from Operating Activities 14916.6.3 Inflows from Investing Activities 15016.6.4 Outflows from Investing Activities 15016.6.5 Inflows from Financing Activities 15016.6.6 Outflows from Financing Activities 15016.7 Disclosures of Items in the Statement
of Equity 15016.8 Financial Risk Management 15116.8.1 Credit Risk 15116.8.2 Liquidity Risk 15216.8.3 Market Risk 15316.8.4 Equity Risk 15316.9 Transactions with Associated Parties 15416.9.1 Transactions with Companies within the
Corporate Group 15416.9.2 Data on the Remuneration of the
Supervisory and Management Bodies 15416.10 Disclosures Pursuant to the Energy Act (EA) 15616.10.1 Balance Sheet Broken Down by Activities 15616.10.2 Income Statement Broken Down
by Activities 16216.10.3 Statement of Cash Flows Broken Down
by Activities 165
17. CONSOLIDATED FINANCIAL STATEMENTS OF ELEKTRO CELJE GROUP 170
17.1 Consolidated Balance Sheet 17017.2 Consolidated Income Statement 17217.3 Consolidated Comprehensive Income
Statement 17317.4 Consolidated Statement of Cash Flows 17417.5 Consolidated Statement of Changes
in Equity 175

ANNUAL REPORT
Elektro Celje2 0 1 5
07
18. DISCLOSURES AND EXPLANATORY NOTES TO THE CONSOLIDATED FINANCIAL STATEMENTS 178
18.1 Bases for the Preparation of Consolidated Financial Statements 178
18.2 Accounting Policies 17818.3 Disclosure of Items in the Consolidated
Balance Sheet 18318.3.1 Intangible Assets and Long-term
Accrued Revenue and Deferred Expenses 18418.3.2 Property, Plant and Equipment 18518.3.3 Investment Property 18718.3.4 Long-term Financial Investments 18718.3.5 Deferred Taxes 18818.3.6 Assets Held for Sale 18818.3.7 Inventory 18918.3.8 Receivables 18918.3.8.1 Long-term Trade Receivables 19018.3.8.2 Short-term Trade Receivables 19118.3.9 Cash and Cash Equivalents 19118.3.10 Short-term Accrued Revenue and
Deferred Expenses 19218.3.11 Equity 19218.3.12 Provisions and Long-term Accrued
Expenses and Deferred Revenue 19318.3.13 Long-term Financial Liabilities 19418.3.14 Short-term Financial Liabilities and
Trade Payables 19518.3.15 Short-term Accrued Expenses and
Deferred Revenue 19618.3.16 Contingent Liabilities 19618.3.17 Contingent Assets and Other
Off-balance-sheet Records 19718.4 Events Following the Balance Sheet Date 19718.5 Disclosures of Items in the Consolidated
Income Statement 19718.5.1 Net Sales Revenue 19818.5.2 Capitalised Own Services 19818.5.3 Other Operating Revenue 19818.5.4 Operating Costs and Expenses by
Functional Groups 198
18.5.4.1 Cost of Goods, Material and Services 19918.5.4.2 Labour Costs 19918.5.4.3 Write-downs and Write-offs 20018.5.4.4 Other Operating Expenses 20018.5.5 Finance Income from Shareholdings 20018.5.6 Finance Income from Interest on Loans 20018.5.7 Finance Income from Trade Receivables 20018.5.8 Financial Expenses from Impairment and
Write-downs of Financial Investments 20018.5.9 Financial Expenses from Financial
Liabilities 20118.5.10 Financial Expenses from Operating
Liabilities 20118.5.11 Other Income 20118.5.12 Other Expenses 20118.5.13 Net Income/Profit 20118.5.14 Statement of Comprehensive Income 20218.5.15 Income Tax 20218.6 Disclosure of Items in the Statement
of Cash Flows 20218.6.1 Inflows from Operating Activities 20218.6.2 Outflows from Operating Activities 20318.6.3 Inflows from Investing Activities 20318.6.4 Outflows from Investing Activities 20318.6.5 Inflows from Financing Activities 20318.6.6 Outflows from Financing Activities 20318.7 Disclosures of Items in the Consolidated
Statement of Changes in Equity 20318.8 Financial Risk Management 20418.8.1 Credit Risk 20418.8.2 Liquidity Risk 20518.8.3 Market Risk 20518.8.4 Equity Risk 20618.8.5 Transactions with Associated Parties –
Remuneration Data 206
19. STATEMENT OF THE MANAGEMENT BOARD 207
LIST OF ABBREVIATIONS 208

CONNECTIONAs one of the key links in the electricity chain that connects electric power generation and distribution to end consumers, we are an indispensable and reliable partner bringing electricity door to door, from morning till morning, into each new day.


ANNUAL REPORT
Elektro Celje2 0 1 5
10
1. FINANCIAL AND OPERATION HIGHLIGHTS OF ELEKTRO CELJE GROUP
1. FINANCIAL AND OPERATION HIGHLIGHTS OF ELEKTRO CELJE GROUPELEKTRO CELJE GROUP (in EUR) 2013 2014 2015
SALES REVENUE 156,542,174 140,389,018 162,405,192
EBIT 8,767,494 12,374,232 12,227,963
EBITDA 28,098,431 33,171,383 31,585,802
EBITDA margin 16.2 % 20.9 % 17.6 %
ADDED VALUE 48,783,276 54,553,794 54,680,314
PROFIT IN THE YEAR 6,639,381 10,733,939 10,233,231
EQUITY 188,478,584 196,839,551 207,638,928
ASSETS 283,699,999 285,713,412 312,244,544
Number of remote meter reading points 54,640 70,740 90,018
Number of customers 168,865 169,414 170,006
Number of employees 678 680 717
The realisation of investment exceeded the plan by 5 %.
Equity increased by 5.5 % to 207.6 million EUR.
Operating revenue per employee increased by 7 % to EUR 251,000.
Fixed assetsgrew by 2 %.
+ 2 %
+ 5 %
+ 5.5 %
+ 7 %

ANNUAL REPORT
Elektro Celje2 0 1 5
11
1. FINANCIAL AND OPERATION HIGHLIGHTS OF ELEKTRO CELJE GROUP
2013 2014 2015
0.9
0.8 0.7
SAIFI - Average number of interruptionsper customer - own cause
2013 2014 2015
36.9
29.7 27.4
SAIDI - Average duration of interruption(in min) per customer - own cause
2013 2014 2015
4.5
5.7
3.1
MAIFI - Average number of momentary interruptions per customer
2013 2014 2015
106,722
100,613
95,857
5.7 %
5.4 %
5.0 %
% of electric power losses
Losses
Electric power distribution losses (MWh)

ANNUAL REPORT
Elektro Celje2 0 1 5
12
2. FOREWORD OF THE CHAIRMAN OF THE MANAGEMENT BOARD
In 2015, the operation of Elektro Celje, d.d., was successful and in complete accordance with the business plan of the company, as evidenced by key performance indicators:
2. FOREWORD OF THE CHAIRMAN OF THE MANAGEMENT BOARD
PERFORMANCE INDICATOR ACHIEVED IN 2015 PLANNED FOR 2015
EBITDA (in EUR) 26,639,589 23,086,550
Gross value added (in EUR) 47,732,674 42,773,750
Added value per employee (in EUR) 75,407 67,680
SAIDI (average duration of interruption per customer – in min) 27.40 30.81
SAIFI (average number of interruptions per customer) 0.70 0.77
IEE-SN (number of weeks non-compliant with power quality standards / number of weeks under supervision)
67.45 69.42
13
ANNUAL REPORT
Elektro Celje2 0 1 5
2. FOREWORD OF THE CHAIRMAN OF THE MANAGEMENT BOARD
In all of the previously cited categories we surpassed the goals set. This Annual Report presents in detail the major events, as well as numerical data on the quantity of elec-tricity distributed, realised investment into expanding the network and improvement in operational readiness of our equipment, and other data necessary to provide a com-prehensive overview of the operation of our company in 2015.
Our core target throughout the past year has been cus-tomer satisfaction, and judging by the direct contact we have established with our customers, as well as by the minimal number of complaints we received and managed, I can safely say we have succeeded in meeting it. The merits of our working methods, service provision, and concern for the health of our employees and the protec-tion of the environment, have been confirmed by apprais-als carried out in accordance with the respective stand-ards, and we have started preparing the bases for the introduction of a Business Excellence Model as a tool for company governance and management. We believe that through the various activities we have undertaken to im-prove the business processes and the operation based on strategic orientation, as well as through the introduction of advanced technology, we have stepped onto a path where we can now evaluate our level of maturity in the management and operation of the company.
Elektro Celje is part of Horizon 2000, the European Con-sortium for Development and Research, in which it partici-pates in the development project Flex4Grid. It promotes the development of smart electricity grids that enable a novel concept of managing the flexibility of the distribu-tion network users as well as prosumers (producers-consumers), who generate electricity in distributed energy resources, but also consume electrical energy provided by distribution networks. Persuading the customers to accept the possibilities offered by new technologies will probably require quite a lot of effort, and additional incen-tives offered and measures taken by the regulator, such as dynamic tariffing and the like, may be necessary.
Unfortunately, 2015 did not see any significant changes towards a normalisation of the relations with the SODO electricity distribution system operator. The latter has been persistently trying to take over, in the long run, all of our vital activities, which we have been performing in a profes-sional and socially responsible way. By duplicating func-tions, SODO has been increasing the costs in the system and causing a growing confusion among customers. The amendment that is supposed to regulate the contractual relationship between individual electricity distributors and SODO in 2015 was, despite our joint efforts coordinated by the Economic Interest Grouping of Electricity Distribu-tors (GIZ), only signed on December 24, 2015. We hope that in the 2016-2018 regulatory framework the situation improves and that the agents that can intervene to bal-ance these relations will strategically determine the future organisation and relieve us of the pressure and stress.
Within the framework of the Group, Elektro Celje Energija, d.o.o., made a precedence acquisition of the commercial subsidiary Elektro Gorenjska Prodaja, d.o.o., and formed
with it a new company ECE, d.o.o., on October 1, 2015. This is proof that our orientation is correct, as this devel-opment has made us the second largest electricity sup-plier in Slovenia.
Our strategic orientation has been corroborated in a re-vised strategic plan. Special attention is dedicated to continual risk assessment and analysis, as well as internal auditing. The internal auditor works effectively with the Au-dit Committee of the Supervisory Board, and the coopera-tion between the Management Board and the Supervisory Board can be deemed successful and constructive, as well.
Following a renovation of the key part of our older infor-mation system, which covered the checking and issuing of invoices for electricity consumption, we also adopted a strategic orientation based on the introduction of the Mi-crosoft Dynamics AX enterprise resource planning system and IBM Maximo asset management software solution, and within this framework we have already conducted a pilot project. In the process, in addition to the various ac-tivities related to the application of DMS functions in the system of network management and supervision, we also set up a platform for advanced metering infrastructure (AMI) and meter data management (MDM), and have so far included over 90,000 consumers in our smart meter-ing systems. Using in-house expertise we commenced with the preparatory works for an upgrade of the DMS Group integrated system to version 3.0, which combines the SCADA and DMS functions, and this will be one of our key development tasks in 2016 and 2017.
At the end of the 2015 fiscal year, I am retiring after six years in the position of Chairman of the Management Board and after over ten years of working in senior man-agement. I would like to thank the team who have man-aged the company with me in harmony and good un-derstanding. We have won recognition as an open and modern business enterprise that respects good workers, while building relationships and knowledge as the founda-tions of a better tomorrow. We have turned the relatively highest profit for our owners and achieved several mile-stones in development.
I also thank all our employees who have, through their responsible work and commitment to the company, con-tributed to the good annual business results. I wish the company a lot of business success in the future, too.
Rade Knežević, univ. dipl. inž. el.Chairman of the Management Board

ANNUAL REPORT
Elektro Celje2 0 1 5
14
3. SUPERVISORY BOARD REPORT
3. SUPERVISORY BOARD REPORT3.1 Introduction
In 2015, the Supervisory Board of the company Elektro Celje, d.d., consisted of the following members:
• Shareholder representatives: - mag. Mirjan Trampuž, univ. dipl. inž. el., MBA, Chairman - Dejan Božič, univ. dipl. ekon., MBA, member, Deputy
Chairman - Tatjana Habjan, univ. dipl. ekon., member - Mitja Vatovec, dipl. ekon., member
• Employee representatives: - Tomislav Pajić, dipl. inž. energ. - Boris Počivavšek, elekt. energ.
The Supervisory Board with the above-mentioned mem-bership performed its tasks in compliance with the provi-sion of the Rules of Procedure of the Supervisory Board, Rules of Procedure of the Audit Committee, company Articles of Association, Code of Corporate Governance of State-Owned Enterprises, relevant legislation, recom-mendations of the Capital Assets Management Agency of the Republic of Slovenia, and other principles of good practice of corporate governance.
In 2015, the Supervisory Board held the following meet-ings:1st regular meeting on February 20, 2015 2nd regular meeting on April 7, 2015 3rd regular meeting on May 14, 2015 4th regular meeting on May 21, 2015 5th regular meeting on July 21, 2015 6th regular meeting on September 2, 2015 7th regular meeting on October 19, 2015 8th regular meeting on November 10, 2015 9th regular meeting on December 22, 2015
In addition, three meetings by correspondence were held:1st regular meeting on March 24, 2015 2nd regular meeting on June 3, 2015 3rd regular meeting on December 29, 2015 All regular meetings were held with all members of the Supervisory Board present, and all members of the Su-pervisory Board participated in the meetings held by cor-respondence.
Supervisory Board Audit Committee consisted of the following members:- Tatjana Habjan, univ. dipl. ekon., Chairwoman- Dejan Božič, univ. dipl. ekon., MBA, member- mag. Mirjan Trampuž, univ. dipl. inž. el., MBA, member- Darinka Virant, univ. dipl. ekon., independent third-party
expert on accounting and finance
Supervisory Board Audit Committee held the following meetings:1st regular meeting on February 5, 2015 2nd regular meeting on April 2, 2015 3rd regular meeting on May 6, 2015 4th regular meeting on June 18, 2015 5th regular meeting on August 18, 2015 6th regular meeting on December 14, 2015
All regular meetings were held in full attendance. There were no meetings held by correspondence.
The Supervisory Board and the Audit Committee did not incur any operating costs, other than the costs related to the Shareholders Assembly resolution on the rewards payable to the Supervisory Board members, and travel ex-penses for meeting attendance, which are disclosed in the Business Report in Chapter 16, Section 16.9.2. A con-tract was signed with the third-party independent expert taking part in the Audit Committee, Mrs. Darinka Virant, which is subject to the criteria and recommendations by the Capital Assets Management Agency of the Republic of Slovenia.
3.2 Supervision of Company Operations
As part of its fundamental function of responsible super-vision of company management, the Supervisory Board monitored the efficiency of company operations and the implementation of the set goals, dedicating special atten-tion to the developmental orientation of the company, for-mulation of the business plan for the period 2015-2018, and risk management. The Supervisory Board reviewed
business documentation, individual contracts with the re-spective annexes, monitored public tenders and the im-plementation of particular projects and transactions. The preparation of annual plans and the annual report revision process were monitored with the assistance of the Super-visory Board Audit Committee.

15
ANNUAL REPORT
Elektro Celje2 0 1 5
3. SUPERVISORY BOARD REPORT
The reports and data prepared by the Management Board enabled the Supervisory Board to conduct efficient super-vision and reach informed and competent decisions. The Management Board observed and acted on the recom-mendations, instructions and resolutions adopted by the Supervisory Board, and regularly prepared reports on their implementation. In compliance with the company Articles of Association, the Supervisory Board granted approvals to individual company transactions, adopting the following major decisions:
• the Supervisory Board (SB) was presented quarterly reports on the operations and performance of the com-pany Elektro Celje, d.d., and the companies within the Group;
• the SB examined reports on the collection of outstand-ing receivables and liabilities and realisation of public procurement, while monitoring the company perfor-mance indicators;
• the SB approved the conclusion of transactions in ac-cordance with the provisions of Article 28 of the com-pany Articles of Association;
• the SB approved the loan agreements and deposits;• the SB reviewed individual contracts, requesting and re-
ceiving additional explanation with regard thereto;• the SB learned in detail about individual business pro-
cesses: project engineering, investment and introduc-tion of a project server;
• the SB devoted considerable attention to the area of control over gainful activities of the employees aimed at ascertaining non-compliance with the prohibition on competition or possible conflicts of interest;
• the SB approved the 2014 Annual Report of the com-pany Elektro Celje, d.d., and the consolidated annual report of the Elektro Celje Group, and adopted the re-port on the Annual Report audit;
• the SB approved the Audit Report on the operations of the companies in 2014;
• the SB proposed to the company Shareholders As-sembly that they appoint the auditing firm BDO Revizija, d.o.o., as the company auditor for the 2015 fiscal year and concluded a contract with the same;
• the SB proposed to the Shareholders Assembly that they adopt the decision on the granting of discharge from liability to the company Management Board and Supervisory Board for 2014, and put forth a proposal for the allocation of distributable profits;
• the SB approved the 2015 operating plan for the In-ternal Audit Department and adopted the 2014 annual operating report by the same;
• the SB conducted a self-appraisal and based on the results adopted guidelines for improvements;
• the SB adopted the Strategic Business Plan for the pe-riod 2015–2018;
• the SB acted on three anonymous notifications and, upon the completion of the internal auditing proce-dures, prepared the answers for the Commission for the Prevention of Corruption and the Slovene Sovereign Holding;
• the SB took note of the activities in the process of merg-er by acquisition between Elektro Gorenjska Prodaja and Elektro Celje Energija, and of the intention of the Management Board to inform thereof the company
Shareholders Assembly, while monitoring the opera-tions of the company ECE on a quarterly basis;
• the SB was kept informed about the procedure of obtaining an EIB loan and the on-going negotiations, and pointed out to the Management Board the flaws of the agreement and the risks arising thereof. Follow-ing an assurance by the Management Board that the risks were appropriately managed and that individual adjustments had been made to the agreement, the SB expressed its consent to the conclusion of the credit agreement;
• after directing the company towards business excel-lence, the SB was presented the report on the self-ap-praisal conducted on the basis of the EFQM excellence model and utilising the BEM approach;
• the SB was presented a comparative analysis of the efficiency of electricity distribution in the period 2004–2013, commissioned by the Energy Agency;
• the SB was acquainted with the Corporate Integrity Plan of Elektro Celje Group;
• the SB received and examined quarterly reports on risk management in the company Elektro Celje, d.d., and called particular attention to the management of indi-vidual IT risks;
• the SB gave its approval to the appointment and sala-ries of the Internal Audit heads;
• the SB gave its approval to the conclusion of a directors and officers liability insurance agreement
• the SB approved the Business Plan of the company Elektro Celje, d.d., and Elektro Celje Group for 2016, complete with the starting points for 2017 and 2018.
Supervisory Board Audit Committee
Before the Supervisory Board meetings, the Audit Commit-tee reviewed business reports for the reporting period and provided its opinion thereon to the Supervisory Board and recommendations for the Management Board. It worked in close cooperation with the Internal Audit Department. At its meetings, the committee regularly discussed the ar-eas of financial reporting, the internal control system and risk management systems. It studied the individual reports by the Internal Audit Department and reports on the status of outstanding receivables and liabilities, and examined in detail the individual key processes or operations.
In addition, the committee conducted two separate inter-views with the internal and independent auditors, without the Management Board being present. It participated in the selection process for financial statement auditors and held several interviews with them. The Committee also re-viewed the unrevised and revised Annual Reports of the company of Elektro Celje, d.d., and the Consolidated An-nual Report of Elektro Celje Group, providing its opinion for the Supervisory Board.
The Audit Committee reported on its operations to the Supervisory Board, providing the perspective and recom-mendations to the points under evaluation. All members of the Supervisory Board receive minutes from the meetings of the Audit Committee, which ensures the transparency of the committee’s operation and greater efficiency of the Supervisory Board. The Audit Committee’s self-appraisal

ANNUAL REPORT
Elektro Celje2 0 1 5
16
3. SUPERVISORY BOARD REPORT
concerning its work in 2015 was performed in 2016. The results have shown that the committee performs its tasks well; however, determinate changes should be made and activities completed in order to further increase the qual-
ity of the committee’s operation and thereby benefit the Supervisory Board and the company. Individual activities were proposed.
3.3 Appraisal of the Supervisory Board Composition
The members of the Supervisory Board representing the shareholders were appointed via a structured nomina-tion procedure by the former Capital Assets Management Agency (AUKN) and the Slovene Compensation Company (SOD), and subsequently confirmed by the Shareholders Assembly; the employee representatives were elected by the Works Council.
The Supervisory Board considers that all its members meet, in addition to the statutory criteria, the requirements of the Corporate Governance Code for state-owned as-sets of the Republic of Slovenia. The members of the board have relevant education, professional competence and work experience. In their work, they pursue the in-terests of the company and they are not in any potential conflict of interest. They provide expert knowledge from different fields, and the heterogeneity of their skills brings
important synergy into their operation, leading to the best results possible. The members of the Supervisory Board supervise the work of the company Management Board in a responsible and professional manner, which also re-flects their personal involvement. In performing their func-tion, the members of the Supervisory Board are objective and independent, they follow the principles of corporate governance and good practice. They are committed to personal integrity and business ethics. All members of the board have signed the statements of independence and absence of conflict of interest, published on the company website.
Members of the Supervisory Board take part in training and education on their own initiative and keep up to date with changes in legislation. They follow and participate in current events important for the company operations.
3.4 Supervision of Company and Group Operations after the End of the Fiscal Year
Following the end of the 2015 fiscal year, special atten-tion was given to the selection procedure for a new Chair-man of the Management Board, and to the monitoring of the final phase of the 2015 financial statement auditing process. With the purpose of ameliorating and rational-
ising its work, the Supervisory Board performed a self-appraisal and identified the areas that show opportunity for improvement and are set to receive particular attention by the board during its future operations.
3.5 Audit and Approval of the Annual Report of the Company and the Group, and Opinion on the Audit Report
The Supervisory Board reviewed the 2015 Annual Re-port of the company Elektro Celje, d.d., and Elektro Celje Group, complete with the reports by the certified auditing company BDO revizija, d.o.o., Cesta v Mestni log 1, 1000 Ljubljana, at its 8th regular session held on May 24, 2016.
Pursuant to the provisions of Articles 270 and 294 of the Companies Act (ZGD-1), the Supervisory Board made sure that total remuneration paid out to the Management Board is in proportion to the Management Board’s tasks and the financial position of the company, as well as in compliance with the Act Governing the Remuneration of Managers of Companies with Majority Ownership held by the Republic of Slovenia or Self-Governing Local Commu-nities. Also, the Supervisory Board found the remuneration paid out to the members of the managerial and supervi-
sory bodies duly disclosed and reported in the present Annual Report.
The Supervisory Board found that the mentioned annual reports were drawn up in compliance with the provisions of the Companies Act and the Slovenian Accounting Standards, and believes that the two annual reports and the data they contain present to be a true and accurate account of the companies’ operations and performance in the past fiscal year. The board also established that the contents of the reports in terms of development strategies is consistent with the opinions of the Supervisory Board. In this, the board also relies on the opinion of the certified auditor: the financial statements, in all their major aspects, provide a faithful and true account of the financial posi-tion of the company Elektro Celje, d.d., and Elektro Celje

17
ANNUAL REPORT
Elektro Celje2 0 1 5
3. SUPERVISORY BOARD REPORT
Group as of December 31, 2015, and of its profit and loss and cash flows in 2015 in accordance with the Slovenian Accounting Standards. The auditing company BDO re-vizija, d.o.o., issued on April 22, 2016, a positive opinion to the Annual Report of the company Elektro Celje, and a positive opinion to the Consolidated Annual Report of Elektro Celje Group.
Therefore, based on its own audit of the annual reports, the review of the audit report issued by the certified audi-tor for the 2015 fiscal year, and the report by the Super-visory Board Audit Committee on the audit of the 2015 Annual Report of the company Elektro Celje, d.d., and of the Consolidated Annual Report of Elektro Celje Group:
• The Supervisory Board of the company Elektro Celje, d.d., approves, without any comments, the 2015 An-nual Report of the company Elektro Celje, d.d., and the 2015 Consolidated Annual Report of Elektro Celje Group.
• The Supervisory Board of the company Elektro Celje, d.d., gives a positive opinion on the audit report on the companies’ operations in 2015, as it finds that the re-port was compiled in conformity with the relevant law and prepared on the basis of a careful and comprehen-sive review of the operations and performance and the annual reports of the companies.
• The Supervisory Board of the company Elektro Celje, d.d., proposes to the Shareholders Assembly to adopt the decision to grant discharge from liability to the com-pany Management Board and Supervisory Board for the year 2015, for it judges that the company opera-tions were carried out in conformity with the set goals and the business plan for 2015.
• The Supervisory Board hereby adopts the Supervisory Board Audit Committee Report on the audit of the An-nual Report of the company Elektro Celje and of the Consolidated Annual Report of Elektro Celje Group.
Celje, May 24, 2016
Chairman of the Supervisory Boardmag. Mirjan Trampuž, MBA

Our mission is a reliable, high-quality, cost-effective and environment-friendly electricity supply, feeding life into each day, each moment, so that our customers can fulfil their needs and wishes carefree.
SUPPLY

ANNUAL REPORT
Elektro Celje2 0 1 5
20
4. OVERVIEW OF IMPORTANT EVENTS IN 2015
4. OVERVIEW OF MAJOR EVENTS IN 2015
• As one of eight participating companies and a distribu-tion testing ground provider, the company Elektro Celje joined a European development project Flex4Grid. The entire scheme (also in two German distributers) will involve 2,000 customers. The purpose of the project is ensuring consumption control and the related additional services. The duration of the project is 36 months.
• On January 26 and 27, a recertification audit of the oc-cupational health and safety system according to the OHSAS 18001:2007 standard was successfully com-pleted and the certificate was renewed for another three-year period.
• Strategically vital for the future operation of the Group was the acquisition of the company Elektro Gorenjska Prodaja by the subsidiary Elektro Celje Energija. With regard to the acquisition, the Supervisory Board had given its approval to the Letter of Intent in April 2014. December 31, 2014, was taken as the balance cut-off
date for the acquisition. In early 2015, a due diligence audit of the two companies was conducted for the pur-poses of the acquisition, and their shareholders were informed about the process of merger between the two controlled undertakings at the assemblies of the respective companies.
• The subsidiary Elektro Celje Energija presented a mod-ernised billing system for energy-generating products that enables the grouping of meter points and vari-ous energy-generating products in one single invoice by means of clearly outlined graphical presentations of contents. Also, in February 2015, it introduced the suc-cessor to the e-Storitve Internet portal, the portal Moj ECE, a quick and easy way for the users to monitor their consumption, payment balance and any outstanding positions, and report their watt-hour meter indications.
• A reorganisation of the sales sector in the subsidiary Elektro Celje Energija, now composed of retail sales and sales to key customers, will ensure greater flexibility and better servicing of the so-called mass market custom-ers. Also planned is a modernisation of the operation of the call centre and an upgrade of IT support in terms of contents monitoring, impact measurement and meeting higher performance standards.
• The company Elektro Celje obtained a full Family Friendly Enterprise certificate, which was developed as one of the tools for efficient and quality human resource
management within companies and organisations in the context of reconciling the professional and personal lives of their employees.
• In March, the company Elektro Celje received a visit by a Japanese delegation from the Hitachi Company with regard to a Slovene-Japanese project which is currently undergoing a feasibility study, but which will hopefully represent an upgrade of the SmartGrid system and serve as a testing ground for Slovene and Japanese companies.
• Based on a public tender carried out jointly for all five electricity distribution companies (EDCs) in January 2015, the company Elektro Celje made a purchase of meters and related equipment. At the same time, the public work contract for earthworks contractors was completed, with which the condition for an active be-ginning of the implementation of investment projects in 2015 was met.
• In March and April, the Business Data Processing Ser-vice of company Elektro Celje refurbished the server
infrastructure by replacing the hardware, upgrading the VMware vSphere server virtualisation infrastructure and setting up a data backup and availability solution with a Veeam product.
• In accordance with the recommendations by the man-ager of state assets, the management of Elektro Celje commenced the activities of introducing a Business Excellence Model as a company governance and man-agement tool. The purpose of self-appraisal is to ob-tain an objective, comprehensive and analytical insight into the operation and results of the company, to as-sess the approaches and results of the company on its path to excellence, and identify the key opportunities for improving the processes and performance of the com-pany in achieving its strategic targets. The work was conducted in the form of workshops, which were at-tended by permanent members of the evaluation team.
January
February
March

21
ANNUAL REPORT
Elektro Celje2 0 1 5
4. OVERVIEW OF IMPORTANT EVENTS IN 2015
• At the first strategic conference of Slovene Electricity Distribution, which was held in late April in Maribor, all five Slovene electricity distribution companies argued for a need to improve the status quo of electricity distri-bution by awarding the concessions directly to the dis-tribution companies. The concessions would eliminate the unnecessary intermediate of the public utility service SODO, thus optimizing and increasing the business ef-ficiency of EDCs as well as the efficiency of the Slovene electrical distribution system itself.
• The Management Board of the company Elektro Celje revised and improved the strategic plan of the company. The strategic task group, composed of sector directors, but involving numerous other employees, produced a strategic document that sets the guidelines for the per-
formance of the company’s employees. This was further discussed by the members of the company’s executive management, Works Council and Supervisory Board, who elaborated the document into the Strategic Busi-ness Plan of Elektro Celje, d.d., for the period 2015-2018.
• Commissioned by the Economic Interest Grouping of Electricity Distributors (GIZ DEE), the Elektro Celje company conducted in the past year the project of re-construction of a framework security policy for Slovene electricity distribution (SED), with the purpose of restor-ing the basic security platforms for the protection of IT resources. A leaflet entitled Information Security Policies of SED was designed, which gathers all key information from the restored security policies.
• On June 9, 2015, the company Elektro Celje Energija and its partners made a presentation of electrical vehi-cles currently available for sale or lease.
• Renovation of the Majcen Mislinja Small Hydropower Plant (SHP) started.
• The Management Board of Elektro Celje, following a briefing of the Supervisory Board of the company, ap-proved and adopted the Corporate Integrity Plan of the Elektro Celje Group. The Plan includes annexes Corporate Integrity Guidelines and Threats to Corpo-rate Integrity and is intended to ensure the conform-ity of the operations of the Elektro Celje Group with the law, professional regulations and recommenda-tions, internal rules of the companies in the Group, as well as compliance with the good business practice and the Code of Ethics of the Elektro Celje Group.
• On July 20, the companies Elektro Celje and Elektro Celje Energija signed an agreement with the Republic of Slovenia whereby they committed to the implementation of remission of debt under the terms and according to the procedure laid down by the law governing the con-ditions thereof. Proposals for the conclusion of arrange-ments on debt relief were being gathered up to October 31, 2015. However, within the Elektro Celje Group, it is the subsidiary Elektro Celje Energija, which is active in the marketing of electricity and other energy-generating products, that the agreement of relief or remission of debt primarily concerns.
• On August 31, 2015, at the 20th regular Shareholders Assembly of Elektro Celje, d.d., the shareholders were informed of the company’s operations in 2014 and pre-sented with the reports by the Management and Su-pervisory Boards. The shareholders adopted the deci-sion on the allocation of distributable profit for 2014 in the total amount of EUR 3,145,015.25 – i.e., EUR 0.13 per share – granted discharge to the company’s Man-agement Board and Supervisory Board for their work in the previous year and appointed the company BDO
revizija, d.o.o., as approved auditor for the fiscal year 2015. Additionally, the shareholders were informed of the procedures regarding the acquisition of the com-pany Elektro Gorenjska Prodaja, d.o.o., by the acquiring company Elektro Celje Energija, d.o.o. The Assembly also reached decisions on the amendment and supple-mentation of the company Articles of Association, and authorised the Management Board to purchase treasury shares and list the company’s shares on the regulated securities market.
• On September 14, 2015, the Official Gazette of RS published the Act on the Methodology Determining the Regulatory Framework and the Methodology for Charging the Network Charge for the Electricity System
Operators for the period 2016–2018. The Act entered into force on September 15, 2015, but will be applied as of January 1, 2016.
April
June
July
August
September
ANNUAL REPORT
Elektro Celje2 0 1 5
22
4. OVERVIEW OF IMPORTANT EVENTS IN 2015
• On October 1, 2015, a new company under the name ECE was registered in the business register. The com-pany was formed through the acquisition of Elektro Gorenjska Prodaja d.o.o., a subsidiary of Elektro Goren-jska, d.d., by Elektro Celje Energija, d.o.o., a subsidiary of Elektro Celje, d.d. Through the merger by acquisi-tion the new company entered the market as a national supplier of electricity, natural gas and biomass, present throughout the territory of Slovenia with places of busi-ness as well as services.
• On October 1, 2015 a new Internet page of the compa-ny Elektro Celje was launched, providing new contents, designs and functions for our customers. The new In-ternet page is clearer and more informative, enabling easier access to the desired information.
• Between October 5 and 7, 2015, QMS and EMS recer-tification audits took place. Since no instances of non-compliance were established, both certificates were re-newed for another three-year period – until September 15, 2018.
• At the 2014 Best Annual Report competition, organised by the Finance newspaper and the Finance Business Academy, the company Elektro Celje received an award
for the annual report presented on the most innovative medium.
• On December 24, 2015, the Management Board of Elektro Celje signed Amendment IV to the Agreement on the Lease of Electricity Distribution Infrastructure and Provision of Services for the Distribution Network
System Operator for the year 2015, and the Agreement to Sign an Amendment to the Lease Agreement for the Period 2016 – 2018.
4.1 Events after the End of the Accounting PeriodOn January 1, 2016, the control units Šmarje pri Jelšah and Rogaška Slatina were joined into the new control unit Mestinje. The purpose of the merging is to make the work in control units more uniform, to increase the operational efficiency in conducting regular maintenance work and re-construction of electricity infrastructure, and to optimise operating costs.
On January 20, 2016, an external control audit of the oc-cupational health and safety system took place at the com-pany. The external examiners of the testing, inspection and certification firm Bureau Veritas Certification conducted the audit and established that our company honours the com-mitments that were made when we introduced the system of occupational health and safety management. The audi-tors did recommend a few improvements, but found no inconsistencies or non-compliances. Their recommenda-tions will be taken under close consideration and improve-ments will be implemented mutatis mutandis within a three months’ period.
On January 21, 2016, the Government of RS appointed two inter-sectoral groups in the field of energy indus-try. The inter-sectoral working group for smart grids and broadband infrastructure will prepare an assessment of the possibility of achieving synergy effects in investing in
publicly-funded construction of smart grids and broad-band infrastructure, and synergy effects of inter-sectoral aid to the electronic communications sector. The task of the working group for the regulation of the PU service of DNSO is to form a plan of activities necessary for achieving a 100% state ownership in the five EDCs and for the di-vestment or break-up of subsidiaries for the sale and trad-ing of electricity from their parent distribution companies, which own a significant part of the distribution network in the Republic of Slovenia, or otherwise to reorganise the distribution groups into holding companies.
At the 5th regular session, held on March 21, 2016, the Supervisory Board adopted the decision to appoint the Chairman of the Board. The position of Chairman of the Management Board of the company Elektro Celje for the next four-year term extending from May 1, 2016, to April 30, 2020, was given to mag. Boris Kupec, univ. dipl. inž. el.
The management policy (Policy) adopted on February 29, 2016, by the Supervisory Board and the Management Board of company Elektro Celje represents a framework of company management. In the Policy, the Supervisory and Management Boards, in accordance with legal and statu-tory provisions, undertake to disclose how they intend to oversee and manage the company.
October
November
December

23
ANNUAL REPORT
Elektro Celje2 0 1 5
5. DEVELOPMENT STRATEGY
5. DEVELOPMENT STRATEGY5.1 Strategic GuidelinesIn its everyday operation, the Elektro Celje company is faced with challenges and opportunities that we wish to take, but also weaknesses to eliminate and threats to carefully avoid. Given the constantly changing requirements of the stakehold-ers and the company’s aspiration to keep improving its per-formance, the strategy of the company was revised in 2015 to define anew the strategic focus and prepare an operational
plan for achieving the new strategic goals.
Based on an analysis of changes in the internal and external environments, the company has proposed and adopted the strategic guidelines necessary for laying out and defining the strategic goals, activities and tasks:
5.2 Strategic Goals and Strategic DiagramBased on the strategic guidelines, twelve structured measurable strategic goals upon which the improved busi-ness operation is conditional have been set for the period 2015–2018. These can be classified into and evaluated within the perspectives of learning and growth, internal business processes, customers and market, and finances. Their achievement is significantly related to the conduct of the employees in pursuing sustainable development goals, particularly those in the fields of occupational health and safety and environmental protection, but also to an effec-tive communication, to transmission of information on the strategy and the strategic goals to all stakeholders – cor-
porate governance bodies, the managing team and the employees – as well as to the constant monitoring of the entire process of working towards the goals, including the control over the implementation of strategic activities.
The strategic goals and tasks are defined in a way that enables the use of a control indicator system for monitor-ing the implementation of the strategy. The achievement of these goals and implementation of the strategy is the task of all employees, with the ultimate responsibility lying on the leaders of the strategic process and on the manage-ment of the joint-stock company.
By streamlining the costs and the entire business operation, improving
warehouse operations and distribution of material to working grounds, improving the work conditions of field workers, controlling
the company’s debt position, managing energy losses, introducing new technologies, improving
the performance of the operative sector in distribution units (process planning) and
managing transport costs, we will be able to optimise the business process and
increase operational efficiency.
OPTIMISATION AND INCREASED EFFICIENCY
OF BUSINESS PROCESSES
With the introduction of new technologies, an efficient and reliable
provision of electric power supply, better customer communication, concessions
for the provision of the PU service of DNSO in the Elektro Celje geographical area, an
improved working culture of employees, use of advanced IT support, and the work performed by our own resources or in cooperation with subcontractors and contracting partners, we
will be able to offer excellent services to our customers.
PROVISION OF
HIGH-QUALITY SERVICE TO
CUSTOMERS THROUGH A REINFORCED DISTRIBUTION
NETWORK

ANNUAL REPORT
Elektro Celje2 0 1 5
24
5. DEVELOPMENT STRATEGY
The development of the employees’ competences, their motivation and commitment, coupled with excellent or-ganisation, can lead to a successful development of in-frastructure and asset management (the perspective of Learning and Growth), which in turn facilitates a suc-cessful effectuation of other processes (Internal Business Processes). Efficient processes enable the company to fulfil its mission, which is to ensure a reliable, high-qual-ity, cost-effective and environment-friendly electric power supply and related services (Customer and Market). The end result is a successful and efficient business operation and satisfied owners (Financial).
Strategic Indicators according to the evaluation perspectives:>> Learning and growth perspective:• target value of the regular maintenance plan realisation:
100 %• target total score on the SiOK organisational culture as-
sessment: 3.3• target number of hours of training and education per
employee: more than 15 • target percentage of sick leave usage: less than 4.8 %
>> Internal business process perspective:• target value of total energy loss: up to 5.4 %
>> Customer and market perspective: • target value of SAIDI (System Average Interruption Du-
ration Index): 35• target value of SAIFI (System Average Interruption Fre-
quency Index): 0.8
>> Financial perspective:• target value of the coefficient of net return on equity (ROE)
in the regulatory timeframe 2016–2018: over 2.0 %• target value of OPEX per standardised network length:
less than 73,000 EUR/km• target value of net debt to EBITDA: less than 2.50• target value of added value per employee: more than
70,000 EUR/employee
SG 11Effective
management of finances
SG 12Gaining of the
expected return on equity
(ROE)
Le
arn
ing
De
velo
pm
en
t o
f In
fra
stru
ctu
re
Inte
rna
l B
usi
ne
ss
Pro
ce
sse
s P
ers
pe
cti
ve
Cu
sto
me
r a
nd
Ma
rke
t P
ers
pe
cti
ve
Fin
an
cia
l P
ers
pe
cti
veL
ea
rnin
g a
nd
Gro
wth
Pe
rsp
ec
tive
Balance Scorecard - Strategic Diagram and Indicators
- System Average Interruption Duration Index (SAIDI)
- System Average Interruption Frequency Index (SAIFI)
- Number of incorrect manipulations
- Coefficient of net return on equity- OPEX per standardised network length- Net debt to EBITDA ratio- Financial debt on equity- Average margin applied to EURIBOR- Percentage of loans financed by EU
sources
- Number of CApp issued to DER- E-mobility- Total electricity losses
- Maintenance cost per unit of electricity distributed
- Time required for preparation of documentation
- Timely implementation of capital works- Not-exceeding the estimated value of
buildings- Losses in the distribution network
- Percentage of sick leave hours- Total score on the SiOK assessment of
organisational climate- Total score as per the EFQM
Excellence Model- Percentage of projects realised
according to the specifications, within planned time frame and within budget
SG 1Introduction of
a comprehensive system of human resources devel-
opment
SG 2Develop-
ment of an excellent
organisational structure
SG 4Efficient
performance and
performance control
SG 6 Business
optimisation through a new
ERP system
SG 5Renovation/
redevelopment of distribution
network SG 3Introduction of a compre-hensive asset management
system
SG 7Management of electricity
losses
SG 10Distribution
cost-effectiveness
SG 9Reliability and safety of network operation
SG 8Management of
distributed energy
resources

25
ANNUAL REPORT
Elektro Celje2 0 1 5
6. COMPANY GOVERNANCE AND MANAGEMENT
6. COMPANY GOVERNANCE AND MANAGEMENTThe bodies of corporate governance at Elektro Celje are: Management Board, Supervisory Board, and Sharehold-ers Assembly.
The Management Board is composed of a single member appointed by the company Supervisory Board. The board, consisting of Chairman Rade Knežević, univ. dipl. inž. el., was appointed for a four-year term from Jan-uary 12, 2014 to January 12, 2018. On December 22, 2015 the Supervisory Board of Elektro Celje took note of the proposal by the Chairman of the Management Board, Mr. Rade Knežević for a consensual termination of office before the expiration of the term. By agreement with Mr. Knežević, the Supervisory Board approved the consen-sual termination of the mandate of the Chairman of the Management Board as of April 30, 2016.
The Supervisory Board is composed of six members, two of which are representatives of the employees. Mem-
bers of the Board are appointed for a four-year term and eligible for re-election. The members of the board repre-senting capital are appointed to the board by the Share-holders Assembly with a simple majority of the sharehold-ers present. The two board members representing the employees are appointed by the company Works Council.
In 2015, the company Supervisory Board was composed of:Representatives of capital:mag. Mirjan Trampuž, MBA – ChairmanDejan Božič, MBA – Deputy ChairmanTatjana Habjan, univ. dipl. ekon. – MemberMitja Vatovec, dipl. ekon. – Member
Representatives of employees:Tomislav Pajić, dipl. inž. energ. – MemberBoris Počivavšek – Member
6.1 Elektro Celje Corporate Governance StatementThe Management and Supervisory Boards of Elektro Celje, d.d., wish to inform the shareholders and the public that the company operates in compliance with the exist-ing rules and regulations applicable to the company. The Corporate Government Statement is an integral part of the 2015 Annual Report and will be accessible on the com-pany website www.elektro-celje.si for at least five years from the date of its publication.
The Management Board represents the company and manages the business independently and on its own re-sponsibility. In doing so, it makes decisions in line with the strategic goals of the company and to the benefit of the shareholders. The system of governance and manage-ment steers the company and enables supervision over the company and its controlled undertakings. It defines the distribution of rights and responsibilities among the managing bodies, determines the rules and procedures to follow in deciding on corporate issues, provides a frame-work for setting, achieving and supervising the achieve-ment of business goals, and establishes the values, principles and standards of fair, honest and responsible decision-making and behaviour in all aspects of our busi-ness. The applicable rules and regulations important for the operation of Elektro Celje as well as the latter’s Arti-cles of Association are published on the company website (www.elektro-celje.si).
The governance and management system is a means for achieving the company’s long-term strategic goals and a way in which the Management Board and the Supervisory Board of Elektro Celje, d.d., carry out their responsibil-ity towards shareholders and other stakeholders of the
company. The vision and objective of Elektro Celje and its subsidiaries is the implementation of modern principles of governance and management and represents the fullest conformity with advanced business practices in Slovenia and abroad.
In its work and operation, Elektro Celje observes the Cor-porate Governance Code for Companies with Capital Assets of the State, adopted on December 19, 2014 by Slovenski državni holding d.d. (Slovenian Sovereign Hold-ing, hereinafter SSH), and published on the website of the same (www.sdh.si).
In 2015, the company’s operation did not deviate sig-nificantly from the principles, procedures and criteria pre-scribed by the above codes and recommendations. The company may depart from the latter when the provisions of said codes and recommendations are already governed differently by the law or the company Articles of Associa-tion, when non-mandatory actions are not prescribed in the company acts, or when practices are not established as legal obligations.
It is this company’s opinion that the members of the Su-pervisory Board are professional, responsible and inde-pendent in performing their duties and act in accordance with the Corporate Governance Code for Companies with Capital Assets of the State and recommendations of SSH.
The company declares that the Management Board of the controlling company has actively followed and directly supervised the operation of the controlled undertakings ECE, d.o.o., and MHE – ELPRO d.o.o., in accordance

ANNUAL REPORT
Elektro Celje2 0 1 5
26
6. COMPANY GOVERNANCE AND MANAGEMENT
with strategic guidelines, with the purpose of achieving the set business objectives.
Elektro Celje will observe the recommendations of new acts of SSH in the future as well, fine-tuning and improv-ing its management system accordingly. In the case of any departure from the present statement on the codes observance, the company will see to its timely publication.
Clarifications in Pursuance to the Require-ments of the Companies Act
Pursuant to Paragraph 5 of Article 70 of the Companies Act, which establishes the minimum required contents of the corporate governance statement, Elektro Celje sets forth the following clarifications:
1. Description of the principal characteristics of in-ternal control and risk management systems in the company in connection with the financial reporting procedure.Elektro Celje, d.d., manages risks and implements internal control procedures at all levels of its business. The pur-pose of internal control is to ensure the accuracy, reliability, visibility and transparency of all processes, as well as the management of risks related to financial reporting. At the same time, the internal control system establishes mecha-nisms that prevent a misuse of resources and cost ineffi-ciency. The system of internal control includes procedures ensuring that: • events are recorded in authentic accounting docu-
ments, on the basis of which the events are recorded faithfully and honestly and provide a guarantee that the company disposes of its assets in good faith.
• events are recorded and financial statements prepared in accordance with applicable law,
• unauthorised acquisition, use or disposal of the com-pany’s assets which could materially affect the financial statements is prevented or detected in time.
The internal control in the company is conducted by the Economic and Financial Sector, which is in charge of bookkeeping and production of financial statements in accordance with applicable accounting, tax and other regulations, by the internal auditor and by the risk man-agement coordinator.
2. Significant direct and indirect ownership of the company’s securities in terms of achieving a qualified holding, as determined by the act governing mergers and acquisitions. The data on achieving a qualified holding, as determined by the Takeovers Act, in our company have been regu-larly updated in the electronic reporting system of the
Ljubljana Stock Exchange and forwarded to the Securi-ties Market Agency. The owner of a qualified holding, as determined by the Takeovers Act, of the company Elektro Celje, d.d., is, as of the date of December 31, 2015, the Republic of Slovenia, with a 79.50 % ownership share; i.e., 19,232,978 shares.
3. Clarifications on each holder of securities with spe-cial controlling rights.Individual shareholders of the company Elektro Celje, d.d., have no special controlling rights arising from their holding shares of the company.
4. Clarifications concerning all restrictions of voting rights.The shareholders of Elektro Celje have no restrictions in exercising their voting rights.
5. The company’s rules on appointment and replace-ment of members of management or supervisory bod-ies, and amendments to articles of association.Company regulations do not govern separately the ap-pointment or replacement of members of management or supervisory bodies or changes to the articles of associa-tion. In such cases, the company refers entirely to the cur-rent legislation.
6. Authorisation to the management, particularly au-thorisations to issue or purchase treasury shares.In 2015, the company Elektro Celje, d.d., did not have authorisation to issue or purchase treasury shares.
7. Activities of the company’s general meeting and its key responsibilities.In 2015, the Shareholders Assembly met once. The pow-ers of the Shareholders Assembly and the shareholders’ rights are specified in the law and shall be exercised in the manner as provided in the company’s Act of Asso-ciation, assembly rules of procedure and the Chair of the Assembly.
8. Data on the structure and operation of the manage-ment and supervisory bodies and their commissions.A comprehensive presentation of the management and supervisory bodies and their commissions is given under 16.9.2.
Pursuant to Article 60.a of the Companies Act, the Man-agement Board and the Supervisory Board of Elektro Celje, d.d., jointly find that the Annual Report of Elektro Celje and Elektro Celje Group for the year 2015 is com-piled and published in compliance with the Companies Act and Slovenian Accounting Standards.
Chairman of the Management Board Rade Knežević, univ. dipl. inž. el.
Chairman of the Supervisory Boardmag. Mirjan Trampuž

27
ANNUAL REPORT
Elektro Celje2 0 1 5
7. PRESENTATION OF ELEKTRO CELJE GROUP
7. PRESENTATION OF ELEKTRO CELJE GROUPThe Elektro Celje Group consists of the controlling com-pany Elektro Celje and its two subsidiaries ECE, supplier
of electricity and other energy-generating products, and MHE – ELPRO, electricity producer.
7.1 Controlling Company Elektro Celje, d.d.
7.1.1 Elektro Celje Company ProfileElektro Celje is part of the electric power system of the re-public of Slovenia and one of the five electricity distribution companies in the country. Since 2007, the company has been registered as a limited company governed by private law, performing network (i.e., regulated) activities and elec-tricity infrastructure related marketing services.
Elektro Celje, d.d., is the owner of an electricity infrastruc-ture consisting of over 13,600 km of low-voltage net-works, 808 km of medium-voltage underground cables, over 2,600 km of medium-voltage overhead power lines, 101 km of 110 kV overhead power lines, 17 distribution transformer substations, 14 distribution substations, and over 3,400 transformer substations. On July 1, 2007, the
company leased its electricity infrastructure to the national distribution network system operator, the company SODO d.o.o., signing the Agreement on the Lease of Electricity Distribution Infrastructure and Provision of Services for the Distribution Network System Operator.
As an electricity distributer, Elektro Celje is in charge of the supervision, management and operation of the electricity distribution network, as well as of the maintenance, con-struction and refurbishment of electric power devices and plants in the Savinjska, Koroška and Spodnjeposavska regions, spanning 4,345 km² or 22% of the total territory of Slovenia.
ELEKTRO CELJE, d. d.(controlling company)
MHE - ELPRO d.o.o. (100%)
ECE d.o.o.(74.3 %)
ELEKTRO CELJE GROUP

ANNUAL REPORT
Elektro Celje2 0 1 5
28
7. PRESENTATION OF ELEKTRO CELJE GROUP
In 2015, Elektro Celje distributed electricity to 150,077 household and 19,929 business consumers, supplying a
total of 1,929 GWh of electric power.
Company: ELEKTRO CELJE, podjetje za distribucijo električne energije, d.d.Abbreviated name: ELEKTRO CELJE, d.d.Head office: Vrunčeva 2a, 3000 CeljeLegal registration: Register of Companies of the District Court of Celje, Reg. No.
1/00600/00Company share capital: EUR 100,953,200.63Number of shares: 24,192,425 no-par value shares, 79.5 % of which are held by the
Republic of SloveniaRegistration number: 5223067VAT identification number: SI62166859Current accounts: 03118-1000007817 with SKB banka
29000-0001897565 with UniCredit Bank02234-0010129952 with NLB10100-0047650663 with Banka Koper06000-0001100279 with Abanka
Company size (according to the provisions of the Companies Act-1):
large company
Number of employees as of Dec 31, 2015: 632Distribution area: three Slovene regions: Savinjska, Koroška and Spodnjeposavska,
with 40 municipalities in their entirety and 2 in partSize of distribution area: 4,345 km2
Number of customers in 2015 (connected to the distribution network):
170,006
Number of MWh distributed in 2015: 1,928,787 MWhCONTACT DETAILS FOR ELEKTRO CELJE, d.d.Elektro Celje, d.d. : Vrunčeva 2a, 3000 CeljeTelephone: (03) 42 01 000Fax: (03) 42 01 010Call centre: (03) 42 01 180Press contact: (03) 42 01 435Chairman of the Management Board: (03) 42 01 201Website: http://www.elektro-celje.siE-mail: [email protected] of the Management Board: Rade Knežević, univ. dipl. inž. el.Chairman of the Supervisory Board: mag. Mirjan Trampuž, MBA
DU Slovenj Gradec
DU Velenje
DU Celje
DU Krško

29
ANNUAL REPORT
Elektro Celje2 0 1 5
7. PRESENTATION OF ELEKTRO CELJE GROUP
7.1.2 Mission, Vision and Values of Elektro Celje>> MissionTo provide a reliable, high-quality, cost-effective and en-vironment-friendly electric power supply and related ser-vices.
>> VisionTo become a leading electricity provider with a technologi-cally advanced electricity network, which can lead to the recognition of the company as an agent of improvement of the quality of life, with a responsible attitude towards the environment and employees.
>> ValuesElektro Celje appreciates and promotes activities ensuring that the company always respect the following principles and values: • PROFESSIONAL COMPETENCE:Behaviour and actions honouring the company’s mission, vision, strategy, goals and values. The objective is to co-create a productive work environment that fosters the per-sonal growth of all employees and raises environmental awareness and responsibility among them.
• KNOWLEDGE:Knowledge acquisition and the sharing of experience and expertise among colleagues ensure the high quality of our work and enable the development of each individual and the company as a whole.• ENTREPRENEURSHIP:Initiative, creativity, risk preparedness, making changes, setting, reaching and surpassing ambitious goals.• PARTNERSHIP:Success is a result of joint work, mutual trust and open communication. The relationship between colleagues should resemble the relationship among the members of a winning sports team. People creating in a harmonious atmosphere, and focussed on common goals, are the driving force of the company.• RESPECT:Interpersonal relations are based on the respect of each individual, goal, agreement, rule and the commitment to the company.• RESPONSIBILITY:
7.1.3 Organisational Structure of Elektro CeljeThe organisational structure of the company is based on the applicable Rules and Regulations on Internal Organi-sation and Job Classification, which are set to ensure ex-
pert, efficient and rational performance of company op-erations, as well as efficient control over the execution of the tasks.
VALUES
Professional competence
Knowledge
Entrepreneur-ship
Partnership
Respect
Responsibility

ANNUAL REPORT
Elektro Celje2 0 1 5
30
7. PRESENTATION OF ELEKTRO CELJE GROUP
7.1.4 Internal AuditAn internal audit is an independent activity providing as-surance and consulting in order to increase the benefits and improve the operation of the company. The Internal Audit department evaluates the performance of risks management, reviews the management of key risks, and advises on the improvement of risk management. It op-erates in compliance with the International Standards of Professional Conduct in Internal Auditing and Code of Professional Ethics. An internal audit report is compiled after each completed audit, which is submitted to the au-ditee, the Management Board and the Supervisory Board Audit Committee. Twice per year, the Internal Audit de-partment drafts a report for the Supervisory Board and its Audit Committee on the activities of the Internal Audit, and, separately, on the monitoring of the implementation of measures adopted following previous recommenda-tions by the Internal Audit.
The mission of the Internal Audit at the Elektro Celje Group is pursued based on an annual plan of work adopted by the management upon proposal by the Supervisory Board Audit Committee, following the approval by the Supervi-sory Board. In addition to planned regular inspections, the Internal Audit also acts upon decisions by the Manage-ment and Supervisory Boards.
In 2015, internal audits were performed in the following fields: restoration and maintenance of power lines by ex-ternal contractors, material and service purchase, projects managed at the project server, utilisation of indicators in select processes, and contracts for the maintenance of IT solutions. In addition to inspecting three anonymous noti-fications following a decision of the Supervisory Board, the internal auditor provided consulting services, conducted inspections and imparted training with the purpose of im-proving the control environment and risk management.
In the context of individual operations and tasks, the in-ternal auditor verified and evaluated the adequacy and effectiveness of internal controls and determined the con-trol system in Elektro Celje to be suitable. The controls, authorisations and responsibilities are essentially defined in the ISO 9001 quality management system, in the ISO 14001 environmental management system and the OH-SAS 18001.
In the focus of the internal audit were also the likelihood of fraud and the operation of information technology. The system of precautionary internal control aimed at prevent-ing major fraud in the areas inspected was found to be well-established and properly functioning. Upon inspec-tion of the field of information-communication technology, the internal auditor deems the internal controls for ensur-ing traceability, information protection and data process-ing to be adequate.
Maintenance and Investment Sector
Distribution Unit CeljeDistribution Unit KrškoDistribution Unit Slovenj GradecDistribution Unit VelenjeInvestment DepartmentPlanning and Engineering Department
Development and Operations Sector
Operations DepartmentDevelopment DepartmentProtection and Remote Control DepartmentTelecommunications DepartmentNetwork Access and Numerical Metering DepartmentNetwork Charge Department
Joint Services Sector
Legal and General Services departmentHuman Resources DepartmentPurchase and Procurement DepartmentOHS and FS DepartmentPlant and Transportation Logistics Department
Economic and Financial Sector
Financial Services DepartmentAccounting DepartmentPlanning and Analysis Department
Business Data Processing Department
MANAGEMENT BOARD
Internal Audit
Supervisory Board

31
ANNUAL REPORT
Elektro Celje2 0 1 5
7. PRESENTATION OF ELEKTRO CELJE GROUP
7.2 Subsidiary ECEECE, energetska družba, d.o.o., was formed in the pro-cess of merger by acquisition of Elektro Gorenjska Prodaja (EGP) by Elektro Celje Energija. The merger was legally registered on October 1, 2015, (cut-off date December 31, 2014). The basis for the merger by acquisition was the contract of members signed between the company’s owners Elektro Celje, d.d., and Elektro Gorenjska, d.d.
The business interest of each member in the share capital is as follows:• Elektro Celje, d.d.: 74.3256 %• Elektro Gorenjska, d.d.: 25.6744 %
The ECE company is managed by mag. Mitja Terče. The company has no Supervisory Board of its own.
7.2.1 ECE Company ProfileCompany: ECE, energetska družba, d. o. o.Abbreviated name: ECE, d. o. o.Head office: Vrunčeva 2a, 3000 CeljeBranch offices: Celje, Kranj, Krško, Slovenj Gradec, Velenje, ŽirovnicaLegal registration: Register of Companies of the District Court of Celje, ref. number
Srg 2011/36741, and changes following merger with acquisition, ref. number Srg 2015/37235
Company share capital: EUR 3,436,767.65Registration number: 6064892000VAT identification number: SI55722679Current accounts: 06000-0100121371 with Abanka
03118-1000877810 with SKB banka02943-0259709385 with NLB30000-0009265864 with Sberbank19100-0010311251 with Deželna banka Slovenije07000-0002705420 with Gorenjska banka
Company size (according to the provisions of the Companies Act-1):
large company
Number of employees as of Dec 31, 2015: 85Number of customers in 2015: 189,266Number of MWh sold in 2015: 2,716,106CONTACT DETAILS FOR ECE, d. o. o.:ECE, d. o. o.: Vrunčeva 2a, 3000 CeljeTelephone: 080 22 04Fax: (03) 62 09 559Website: http://www.ece.siE-mail: [email protected] director: mag. Mitja TerčeProcurator: Rudolf Ogrinc, mag.
7.2.2 Mission, Vision and Values of ECE>> MissionWith a responsible, professional and innovative approach we market electricity and advise on energy saving, working through a partnership relationship towards long-lasting sat-isfaction of our customers, shareholders and employees.
>> VisionOur aim is to become the major energy supplier in Slovenia and the best-known electricity and natural gas trader in the region. Our high-quality, comprehensive service and reason-able prices will be reflected in customer satisfaction and sales growth, which will, coupled with great efficiency, yield above-average returns for our shareholders. Through pur-chase of electricity from renewable energy sources, solutions for reducing energy consumption and promotion of energy-saving electrical devices we wish to exercise our responsibil-ity towards the environment in which we live and work.
>> Values• satisfaction: a satisfied customer is the company’s
greatest value• innovation in the quest for new ideas for improvement
and growth• efficacy in the optimisation of business processes with
the aim of achieving the best results• a friendly and courteous attitude towards co-workers,
customers and business partners• stability, quality and reliability: fulfilment of all commit-
ments and goals, and management of the risk arising in the process
• responsible attitude towards the shareholders, the envi-ronment and the society
• integrity: abidance by all laws, regulations, codes and promises given, and an open dialogue with all stake-holders.

ANNUAL REPORT
Elektro Celje2 0 1 5
32
7. PRESENTATION OF ELEKTRO CELJE GROUP
7.2.3 Operations and Performance of ECEIn its operation, ECE is pursuing with great dedication the following goals:• customer-oriented approach• flexible offer providing mutual satisfaction, and supply of
energy-generating products at competitive prices • use of modern IT infrastructure • highly educated professional staff
• competitive and market driven attitude in providing a comprehensive supply for customer needs for electric-ity, natural gas, wood biomass, and additional services (heat pumps, natural gas and wood biomass furnaces)
• optimisation of operating expenses• risk management
7.2.3.1 Purchase of Electricity
The total purchase of electricity in 2015 was 5.1 % higher than planned and 68.2 % higher than in 2014. Including deviations from timetables for 2015 (17.1 GWh), the pur-chase of electricity amounted to 2,716 GWh.
Since the company Elektro Gorenjska Prodaja ceased to exist as a legal person on October 1, 2015, the data for the last three months of the previous year refer to the merged company ECE, d.o.o., which means that they include the amount of Elektro Celje Energija and Elektro Gorenjska Prodaja combined (if the purchase amounts of Elektro Gorenjska Prodaja for the first nine months of the previ-ous year were excluded from the data, the amount of the electricity purchase would be 2,131 GWh).
7.2.3.2 Sales of Electricity
In 2015, the sales of electricity amounted to 2,716 GWh, which is 68.2 % more than during the year before. The sales to household customers amounted to 708 GWh, those to business customers 2,008 GWh.
Sales of electricity to business customers
The category of business customers includes large com-panies, which are treated individually, with an assigned administrator/key account manager (around 500) and custom tailored offers, and medium-sized and smaller companies or legal persons (about 15,000) managed at
the level of mass, standardised offer.
In 2015, the sharp competition for large-business custom-ers continued, but the number of new customers that we managed to attract (over 40 companies) was higher than the number of established customers that we lost. Despite the dumping policies of HEP we were successful in finding clients who accepted normal market prices.
The segment of small-business customers (some 9 % of our customers) is mostly serviced individually, which cre-ates the need for even greater involvement of the field
Purchase of electricity in the period 2011−2015
500
1,000
1,500
2,000
2,500
3,000
GWh
Planned
Actual
1,508
1,509
2011
1,491
1,501
2012
1,718
1,837
2013
1,592
1,615
2014
2,585
2,716
2015

33
ANNUAL REPORT
Elektro Celje2 0 1 5
7. PRESENTATION OF ELEKTRO CELJE GROUP
sales personnel, while the growing competition in this group dictates increasingly lower sales margins. As this group, which is, besides household customers, most prof-itable, is well aware of its negotiating position, custom-ers with an annual consumption of over 100 MWh enjoy similar rates as large-business customers (with an annual consumption of several GWh of electricity). In 2015, we organised in this group a marketing campaign offering the option of fixed prices until the end of 2017. 14 % of cus-tomers with a total annual consumption of 30 GWh opted to sign this contract.
In 2015, ECE had 15,042 business customers and 31,602 business consumption metering points.
Sales of electricity to household consumers
In 2015, in response to the campaign launched by the Slovene Consumers’ Association, we prepared a great offer with the slogan “Save more!”, in which we offered electricity at prices that were lower than those obtained at auction. Approximately 20,000 customers accepted the special offer. Towards the end of 2015, with the desire to avoid the downward trend in the number of customers, we organised the campaign “A cell phone for 1 euro”, which had a very high profile all around Slovenia, and was very successful, too (we sold around 6,500 cell phones). For new customers, the campaign will continue in 2016, as well.
In 2015, the company ECE had 174,224 household cus-tomers and 185,988 household consumption metering points.
7.2.3.3 Renewable Energy Sources
In 2015, we extended the supply of electricity entirely gen-erated by renewable energy sources from household to small-business customers.
In pursuance of the Decree on Green Public Procurement, which entered into force in 2012, the persons registered for electricity purchase are required to procure a manda-tory share of electricity from renewable sources and prove that by redeeming the so-called Guarantees of Origin (GO).
Now that we have supplied RES-generated electricity to all households and small-business customers and all cus-tomers in public tenders in which the law provides for a mandatory purchase of
7.2.3.4 Natural Gas
The sale of natural gas was introduced in 2013. In compar-ison with previous years, the competition among suppliers of this energy-generating product was considerably more intense, particularly due to traders who are also distribut-ers. Each ran their own special offers of discounted prices, mostly targeting existing customers, but these, unlike with electricity, are rather reluctant to change their suppliers.
This is especially true of household customers. In 2015, 7,278,610 Sm3 of natural gas were sold to business cus-tomers and 579,919 Sm3 to households, for a combined total of 7,858,529 Sm3. The value of the sales amounted to EUR 2,601,614 for business customers and EUR 169,372 for households, for a total of EUR 2,770,986.
Amount and values of natural gas sales 2013 2014 2015
Amount (Sm3) 52,851 3,911,434 7,858,529
Value (EUR) 22,376 1,337,119 2,770,986
Amounts and values of wood pellet sales 2013 2014 2015
Amount (T) 1,852 1,672 2,229
Value (EUR) 366,863 346,457 415,981
7.2.3.5 Wood Pellets
Based on the experience from previous heating seasons we decided to enter the 2015/2016 season with an offer of high-quality wood pellets at affordable prices and with advantageous related services (payment by instalment, transport-in price, reliable logistics partner). We continued with the sales of A1-quality wood pellets of Austrian origin. In the A2-quality class we opted for a Slovene supplier on
the grounds of a simpler cooperation in terms of formalities and risk. The quality of the pellets is corroborated by the ENplus certificate.
The table below presents the sales of wood pellets in the past three years.
ECE’s market share of wood pellet sales is estimated to range between 1 % and 2 % of the entire Slovene market.

ANNUAL REPORT
Elektro Celje2 0 1 5
34
7. PRESENTATION OF ELEKTRO CELJE GROUP
7.3 Subsidiary MHE – ELPROMHE – ELPRO, podjetje za proizvodnjo in trženje električne energije, d.o.o., is a limited liability company. Its founder
and sole shareholder is the company Elektro Celje, d.d.
7.3.1 MHE – ELPRO Company Profile
Company MHE - ELPRO, podjetje za proizvodnjo in trženje električne energije, d. o. o.Abbreviated name MHE - ELPRO d. o. o.Head office Vrunčeva 2a, 3000 CeljeLegal registration Register of Companies of the District Court of Celje, entry no. 1/07492/00Company share capital EUR 12,518.78Registration number 1700758VAT identification number SI52011429Current account 06000-0910239666 with AbankaCompany size (according to the provisions of the Companies Act-1)
micro company
Number of employees as of Dec 31, 2015 0Number of kWh produced in 2015: 3,730,056Managing director Gregor Milanez, dipl. inž. el.
7.3.2 Operations and Performance of MHE – ELPROIn 2015, the company MHE – ELPRO completed 14 years of operation. Its key values include efficient and environ-ment-friendly production of electricity and investment into renewable energy sources. In 2015, company operations included:• small hydropower plants: Rastke, Ljubija zgornja, Ljubi-
ja spodnja, and Majcen Mislinja• small-scale photovoltaic systems: Brdo pri Kranju,
Srce, Lava, Šempeter 1, Šempeter 2, Slovenj Gradec 1, Slovenj Gradec 2, Slovenj Gradec 3, Mestinje 1, and Mestinje 2
• combined heat and power plants Srce located at the Elektro Celje, d.d., headquarters, and on office build-ings in Selce, Krško and Slovenj Gradec.
In 2015, the company MHE – ELPRO, in cooperation with Elektro Celje, d.d., started introducing electromobility by purchasing a facility for the management of charging in-frastructure, and 8 electric vehicle charging stations. This infrastructure will allow us to gain experience and knowl-edge to prepare for the future, which seems to lie in elec-tromobility.
1,000,000
Electricity generated by SHPs
Electricity generated by SPSs
Electricity generated by CHPPs
Heat generated by CHPPs
2,000,000
3,000,000
4,000,000
in kWh
2,884,955
119,375
3,109,068
235,147
3,532,953
344,169
62,820
4,522,383
399,747
235,751
756,191
2,858,164
432,370
439,522
1,356,504
2011 2012 2013 2014 2015
Electricity generation at the company MHE - ELPRO
Am
ount

35
ANNUAL REPORT
Elektro Celje2 0 1 5
7. PRESENTATION OF ELEKTRO CELJE GROUP
The output of small hydropower plants largely depends on natural circumstances. Two years stand out in the com-pany’s history: 2011 (as a very dry year) and 2014 (as a year with high rainfall). 2015 was a dry year, its output quite comparable to that of 2011.
The operation of small-scale photovoltaic systems (SPSs) depends on the amount of solar radiation, which also changes with the seasons. In 2015, the total SPS output was comparable to that of the year before. The opera-tion of the combined heat and power plants (CHPPs) is planned during the heating season and designed to pro-vide heating for the Elektro Celje company office buildings. The operation and the power output depend on the build-ings’ needs for heating in relation to outside temperatures. In 2015, all plants operated at full capacity and according to expectations and predictions.
The share of electricity produced by SHSs was 76.6 % (2,858,164 kWh), the share of SPHS-generated electricity 11.6 % (432,370 kWh), and the share of electricity out-put from the combined heat and power plants 11.8 % (439,522 kWh). In addition, 1,356,504 kWh of heat were produced.
The company MHE – ELPRO wrapped up the 2015 with a profit of EUR 105,464 (index 72 with respect to 2014, or 98 with respect to the annual plan). The results fall within the planned range, but are lower in comparison to those of 2014 due to less favourable hydrological conditions.
SPS Brdo pri Kranju

MAINTENANCEWe maintain the distribution network in good condition, seeing to the proper state of repair of electrical devices and equipment, so that electric power can flow smoothly between the regions we service: Savinjska, Koroška and Spodnjeposavska.


ANNUAL REPORT
Elektro Celje2 0 1 5
38
8. ORGANISATION AND ACTIVITIES OF THE COMPANY ELEKTRO CELJE
8. ORGANISATION AND ACTIVITIES OF THE COMPANY ELEKTRO CELJE8.1 Operation and Development of the Distribution NetworkThe Development and Operations sector performs the fol-lowing tasks:• distribution of electricity• management, control and operation of the distribution
network• provision of network development• compliance with systemic operational instructions• management of electricity transmission via distribution
network and exchange with other networks• provision of optimum restoration of system operations
following any faults• coordinated operation of the distribution network with
connected networks• provision of systemic protection of the distribution net-
work• conducting of operational measurements in the distri-
bution network• conducting of measurements and analyses in the field
of electricity quality • development of operational statistics
In 2015, the Development and Operations sector contin-ued the upgrading of the DMS/OMS V2 software tool by
concentrating on actively reducing losses of electricity in the network. Together with our partners, we are success-fully participating in the European project Flex4Grid.
Focussing on a reliable provision of electricity to our cus-tomers, in 2015 Elektro Celje continued activities on the project “parallel operation of the MV network.” The electri-cal codes allow the normal power-line loads that cause up to a 7.5 % voltage drop, but in extraordinary operating conditions, the maximum permitted voltage drop can be higher. The temporal and financial limitations regarding the placement of facilities can result in an extraordinary oper-ating condition reducing to ordinary operating conditions. The disadvantages are mainly greater electricity losses and a negative impact on the continuity of supply param-eters. Elektro Celje set itself the goal of utilising the exist-ing infrastructure optimally even in such circumstances. In order to achieve this goal, project documentation and technical guidelines were prepared for the planned equip-ment. In 2015, we implemented this project into the real environment and began monitoring the first experiences of such an operation. It should be noted that this is the first project of its kind in Slovenia.
8.1.1 Development of the Distribution NetworkThe Development Department issues documents required for developments that affect the physical environment, while also managing agreements on connection to the
distribution network, the processing of geographic data for the Geographic Information System (GIS), the quality of electricity supply, and network development plans.
DTS Žalec

39
ANNUAL REPORT
Elektro Celje2 0 1 5
8. ORGANISATION AND ACTIVITIES OF THE COMPANY ELEKTRO CELJE
8.1.1.1 Documents on Developments Affecting the Physical Environment
Number of documents on developments affecting the physical environment issued in 2015 Total
No. Type of document Category DU Celje DU Krško
DU Sl. Gradec
DU Velenje
Elektro Celje
1. Guidelines to the spatial planning document
9 11 4 22 46
2. Opinion on the spatial planning document
11 10 4 16 41
3. Terms of project 181 342 129 180 832
4. Approval of project documentation
44 321 134 418 917
5. Connection approval
0.4 kV up to 41 kW 253 140 156 213 762
0.4 kV over 41 kW 60 39 27 32 158
household customers 600 373 250 481 1,704
MV (1 - 35 kV) 7 10 6 10 33
distributed energy resources - input
1 5 2 4 12
distributed energy resources - output
1 5 2 5 13
distributed energy resources - generation
1 4 1 0 6
Connection approvals in total 923 576 444 745 2,688
Total 1,168 1,260 715 1,381 4,524
Num
ber
1,000
2,000
3,000
4,000
2011 2012 2013 2014 2015
5,000
6,000
7,000
Approval of connection to the distribution network
Approval of project documentation
Issued documents on developments affecting the physical environment
Issued documents on developments affecting the physical environment
1,51
0
1,39
8
1,68
4
1,20
4
919
1,42
6
1,56
1
1,50
8
1,30
0
917
3,22
2
3,65
0
2,18
1
2,48
0
2,68
8

ANNUAL REPORT
Elektro Celje2 0 1 5
40
8. ORGANISATION AND ACTIVITIES OF THE COMPANY ELEKTRO CELJE
8.1.1.2 Agreements on Connection to the Distribution Network
The table below shows the number of agreements on the connection to the distribution network, issued in 2015, by
individual category for the areas of Celje, Krško, Slovenj Gradec and Velenje.
8.1.1.3 GIS and DTD
The Department of Development also includes a team for the technical information system (TIS), which is in charge of:• entering data on electric power equipment into TIS (GIS
and later on DTD) and maintaining consistency between them
• transferring data on electric power equipment to other information systems within the company (DMS, SCADA etc.)
• analysing and preparing data and graphical templates for the requirements of business processes
• recording the electric power equipment with manual GPS devices
• management and maintenance of GIS• updating single-line diagrams of TSs• ordering third-party surveying services and manage-
ment of the archives of the received surveying snap-shots
• exchanging data with GURS (The Surveying and Map-ping Authority of the Republic of Slovenia) in the field of cadastre of the public utility infrastructure
• preparation and forwarding of network data to external clients
In 2015, we continued entering new data and updating the existing information on electric power equipment. We joined the preparation of Terms of Reference (ToR) by en-tering the planned routes for new networks into GIS, thus generating the asset codes used in the ToR.
Based on our own GPS data capture, the provided sur-veying snapshots and by copying from plans and ToR, we drew into GIS 43 TSs, 339 km of MV network and 1,471 km of LV network. This includes assets not owned by Ele-ktro Celje and those in the process of construction.
Number of connection agreements in 2015 Total
Category DU Celje DU Krško DU Sl. Gradec DU Velenje Elektro Celje
0.4 kV up to 41 kW 212 137 180 140 669
0.4 kV over 41 kW 41 34 25 26 126
household customers 443 329 235 328 1,335
MV (1 - 35 kV) 5 10 4 7 26
distributed energy resources 1 1 0 4 6
Total 702 511 444 505 2,162
Amounts of data recorded in GIS in 2015
TS (number) recorded over the year 43
entered as of Dec 31 4,088
rate - recorded over the year/ as of Dec 31 1.1 %
HV + MV network (km) recorded over the year 339
entered as of Dec 31 3,946
rate - recorded over the year/ as of Dec 31 8.6 %
LV network (km) recorded over the year 1,471
entered as of Dec 31 7,504
rate - recorded over the year/ as of Dec 31 19.6 %

41
ANNUAL REPORT
Elektro Celje2 0 1 5
8. ORGANISATION AND ACTIVITIES OF THE COMPANY ELEKTRO CELJE
8.1.1.4 Quality of Electricity Supply and Network Development
The purpose of network planning is to provide quality sup-ply of electricity with the possibility of allowing the con-nection of new consumers. Every two years, updates are performed in the ten-year development plan, which pro-vides the basis for the annual planning of the distribution network. For the purposes of including new, large-busi-ness customers and distributed energy sources, analyses of the network are performed with the use of appropriate software.
The development department monitors the indicators of supply reliability and electric voltage quality, and takes part in solving customer complaints concerning poor voltage conditions. Based on electric voltage quality measure-ments and field inspection, solutions are proposed to im-prove voltage conditions.
In 2015, we processed 74 complaints by our customers regarding unsatisfactory power quality, 46 of which were justified.
The reliability of supplied electricity is monitored through the indicators SAIFI (System Average Interruption Fre-quency Index) and SAIDI (System Average Interruption Duration Index), relative to the cause of interruption, and MAIFI (Momentary Average Interruption Frequency Index).
Following are the total values of the reliability indicators SAIFI and SAIDI for 2015 at the company level, presented by cause of interruption. These indicators provide informa-tion about the average number of interruptions and the average duration of interruption per customer.
SAIFI / SAIDI Reliability indicators
UNPLANNED INTERRUPTIONSPLANNED
INTERRUPTIONS
OWN CAUSE OTHER PARTY CAUSE FORCE MAJEURE
SAIFI SAIDI SAIFI SAIDI SAIFI SAIDI SAIFI SAIDI
[int./cust.] [min/cust.] [int./cust.] [min/cust.] [int./cust.] [min/cust.] [int./cust.] [min/cust.]
Total urban lines 0.560 19.840 0.553 16.618 0.106 3.789 0.620 94.418
Total rural lines 0.823 34.339 0.331 9.395 0.761 35.701 1.630 279.060
Total value 0.697 27.404 0.437 12.850 0.447 20.437 1.147 190.743
By following these indicators, which are also included in the set of strategic indicators of the company Elektro Celje, we monitor the progress towards of one of our key strategic goals – reliability and safety of network operation – and the implementation of strategic activities towards
achievement of goals: ensuring reliability of network op-eration, efficient control of voltage conditions, MV network automation upgrade, MV network cabling, and optic cable upgrade.
40
20
60
10
50
30
70
80
Num
ber o
f com
plai
nts
2011 2012 2013 2014 2015
Total complaints
Number of justified complaints
Total complaints
Number of justified complaints
Total complaints
Number of justified complaints
Total complaints
Number of justified complaints
Total complaints
Number of justified complaints
53
47
58
52
6974
37 3944
46
Complaints to power quality

ANNUAL REPORT
Elektro Celje2 0 1 5
42
8. ORGANISATION AND ACTIVITIES OF THE COMPANY ELEKTRO CELJE
2011 2012 2013 2014 2015 2011 2012 2013 2014 2015
3.528 413.834
0.788
29.713
1.764
68.8651.125
42.288
2.899
300.345
1.101
44.354
1.804
88.5940.876
36.865
1.581
60.6910.697
27.404
0.8
0.4
1.2
0.2
1.0
0.6
1.4
Ave
rage
num
ber
of i
nter
rup
tions
per
cus
tom
er 1.6
2011 2012 2013 2014 2015
SAIFI
Target value
SAIFI
Actual value
SAIFI
Target value
SAIFI
Actual value
SAIFI
Target value
SAIFI
Actual value
SAIFI
Target value
SAIFI
Actual value
SAIFI
Target value
SAIFI
Actual value
1.46
1.121.08
1.19
0.840.77
1.10
0.880.79
0.70
Own cause
Total value of unplanned interruptions
Own cause
Total value of unplanned interruptions
2012 2013 2014 2015
3.066
7.288
7.288 4.476
4.476
5.714
5.714
Trend
*We have been monitoring the MAIFI indicator since 2012.
Value of unplanned momentary interruptions
3.066
MAIFI - Average number of momentary interruptions per customer
SAIFI value: unplanned interruptions - own cause
SAIFI - Average number of interruptions per customer SAIDI - Average duration of interruption per customer (in min)

43
ANNUAL REPORT
Elektro Celje2 0 1 5
8. ORGANISATION AND ACTIVITIES OF THE COMPANY ELEKTRO CELJE
The achieved and target values of uninterrupted power supply indicators in 2015 were better than in the previ-
ous years, and lower than target values, which indicates greater reliability of electricity supply.
8.1.2 Operation of the Distribution NetworkThe Operations Department includes the distribution con-trol centre (DCC) and system engineering. The key tasks of the distribution management centre are the following:• remote control supervision, management and provi-
sion of safe and reliable operation of the entire power electricity distribution system (EDS), more specifically DTSs, DSs, remote-controlled TSs and RCSs (Remote-Controlled Switchgears) in the entire Elektro Celje area
• coordination and plan development for the EDS opera-tion with neighbouring systems
• outage and fault analysis and operational statistics de-velopment
• coordination of switchgear manipulations for planned
and unplanned events on HV and MV networks• dispatching pursuant to ELES's National Control Cen-
tre (NCC) and Regional Control Centres (RCC), and the neighbouring Distribution Control Centres (DCC)
• development of reports on planned and unplanned events, and recording events statistics
• elaboration of forecasts and analyses of the power dis-tribution network operating conditions
• implementation of the measures prescribed for load and consumption limiting
• development or confirmation of operating instructions• response to customer calls outside regular working
hours
SAIDI value: unplanned interruptions - own cause
40
20
10
50
30
Ave
rage
dur
atio
n of
inte
rrup
tion
per
cus
tom
er (i
n m
in)
60
2011 2012 2013 2014 2015
SAIDI
Target value
SAIDI
Actual value
SAIDI
Target value
SAIDI
Actual value
SAIDI
Target value
SAIDI
Actual value
SAIDI
Target value
SAIDI
Actual value
SAIDI
Target value
SAIDI
Actual value
53.82
42.2940.60
48.85
35.55
30.81
44.35
36.86
29.7127.40
MAIFI value: unplanned momentary interruptions
8.0
4.0
2.0
6.0
Ave
rage
num
ber
of m
omen
tary
inte
rrup
tions
per
cus
tom
er
2012 2013 2014 2015
MAIFI
Target value
MAIFI
Actual value
MAIFI
Target value
MAIFI
Actual value
MAIFI
Target value
MAIFI
Actual valuest
MAIFI
Target value
MAIFI
Actual value
5.43
7.297.07
4.355.54
4.48
5.71
3.07
*We have been using the MAIFI indicator since 2012.

ANNUAL REPORT
Elektro Celje2 0 1 5
44
8. ORGANISATION AND ACTIVITIES OF THE COMPANY ELEKTRO CELJE
The following two graphs present works performed by individual DUs on the power distribution network in the
period 2011–2015, broken down per work programmes and work orders.
500
Work programmes - Celje
Work programmes - Krško
Work programmes - Slovenj Gradec
Work programmes - Velenje
1,000
1,500
2,000
Number of work programmes
879
565
596
442
480
583
440
540
535
377
400
468
601
471
387
2011 2012 2013 2014 2015
Work programmes
Work programmes - Total 1,852 1,927
593
0
2,037
332
1,835
398
274
1,710
1,000
Work orders - Celje
Work orders - Krško
Work orders - Slovenj Gradec
Work orders - Velenje
Number of work orders
2,214
918
1,763
904
1,496
935
2,067
2,797
1,748
2,922
1,285
2,855
1,609
2,755
1,583
2011 2012 2013 2014 2015
Work orders - Total 8,752 8,802
2,210
0
5,342
752
5,250
2,446
790
5,903
3,000
2,000
4,000
6,000
5,000
7,000
9,000
8,000
Work orders
45
ANNUAL REPORT
Elektro Celje2 0 1 5
8. ORGANISATION AND ACTIVITIES OF THE COMPANY ELEKTRO CELJE
The key task of system engineering in 2015 was the devel-opment of the power distribution network model in DMS and PSI software tools and synchronisation with the state in GIS and DTD.
In March and April, Phase IV of the upgrade of DMS soft-ware was completed, concluding with the Site Accept-ance Test by the client in May. The aim of the upgrade was to expand the existing functions of the system, develop new functions and adjust the Outage Management Sys-tem (OMS) to the needs of the companies Elektro Celje, SODO and Energy Agency.
The Dynamic Mimic Diagram (DMD) application, which serves the purposes of conducting analyses at the level of the whole electricity distribution network of Elektro Celje, d.d., and a faster location of the errors in case of an out-age, was additionally installed in individual distribution units. Internal training on its use was carried out.
In October, the employees of DCC underwent internal training on OMS. In November, training was also organ-
ized for work safety documentation drafters at DUs Celje and Slovenj Gradec.
The video control and anti-burglary system installed in the Slovenj Gradec administrative building was upgraded, and its connection to the security control centre (SCC) Var-nost Maribor is projected for January or February 2016. The inspection and upgrade were also performed at the Lava facility housing DTS Lava. The facility DTS Brežice and the related administrative building were connected to SCC Prosignal. At the DU Velenje headquarters, where renovation work on the facility was carried out in 2015, the inspection of the condition of the video control and anti-burglary system will be performed, followed by con-nection to a SCC.
To enable an expansion of the control and anti-burglary system, a new server and decode station were purchased.
In November, all dispatchers of the DCC attended a two-day training session on the topic of effective communica-tion with colleagues and difficult customers.
8.1.3 Protection and Remote Control
In the field of MV network automation, we installed 16 RCS sets in 2015. TS Mirna, TS OMCO Feniks and TS Tabor were automated. Regular maintenance of RCS has con-tributed to a more reliable operation of the MV network.
The Business Data Processing department updated the SQL server to the version SQL 2014. We participated in the upgrade of the management system in DTS Trnov-lje, where we refurbished the substation’s process bus for the 20 kV switching substation. We installed new power transformers at DTS Mozirje (TR1, TR2) and DTS Rogaška Slatina (TR1). To make uniform the operation of our DTS facilities, we upgraded secondary operation systems with arc suppression coils at DTS Mozirje, DTS Velenje, DTS Brežice and DTS Krško. We were active participants in the pilot project of parallel operation of MV lines between DTS Sevnica and DTS Mokronog, and performed the testing of secondary systems at DTS Žalec.
In 2015, we successfully completed the expansion of the DS Planina switching substation, which included a pro-tection and control upgrade. The protection and manage-
ment of the smaller switching substations DS Podgračeno and DS Podsreda was also updated.
The year 2015 saw an increased workload in regular main-tenance in terms of periodic measurements of grounding systems at MV/LV transformer stations.
Additionally, we carried out functional tests of protection and control, mandatory measurements, voltage tests on HVUCs and LVUCs, casing tests and measurements of electricity quality, as well as data capture from the electric-ity monitoring system on our equipment.
180 faults of MV and LV underground cables required a search for the location of the error.
We participated actively in the detection and elimination of faults of protection, management and control systems, replaced the RUPS software systems at DTS Lava and DTS Trnovlje, continued the renewal of older remote con-trol equipment, and took part in the sale of transmission parts of 110 kV switching substations.

ANNUAL REPORT
Elektro Celje2 0 1 5
46
8. ORGANISATION AND ACTIVITIES OF THE COMPANY ELEKTRO CELJE
8.1.4 Telecommunications
There are four main communication networks in Elektro Celje: optical network, IP/Ethernet network, digital radio system for speech and narrow-band data connections, and the telephone system (with a call centre and a cus-tomer relationship management [CRM] system).
In 2015, two new cyber-safety systems were installed. The control system of the safety mechanism was updated with the new Juniper Junos Space system, which was completed with SIEM Juniper Secure Analytics.
Several projects were realized in the digital radio system. With the digital radio dispatch centre in DCC expanded to include the radio areas of Krško and Slovenj Gradec, we completed the project of radio system digitalisation. In ad-dition, the digital radio repeater Boč 2 for the Krško radio
area was begun, and the radio repeater Okrog was set up for the area of Mokronog. To provide greater reliability of the radio repeater redundant connection, a licenced mi-crowave link Boč-Mrzlica was put in place.
The EDIC2 customer relationship system was completely renovated.
With respect to developments in the optical network, we set up a connection to the business facility Vojnik (by conveying an underground optical cable from the nearby ELES 110 kV power line) and connections DTS Dravograd – TS Libeliče, and DS Radlje – TS Radlje. For marketing purposes, we also connected the MOS Mestinje business building to the network with an underground optical cable.
8.1.5 Access to Network and Metering
Before connection, the customer or the producer has to sign an agreement on supply or feed-in of electricity with an elec-tricity supplier, which is the basis for signing an agreement on access to the distribution network. The access agreement is signed with the holder of the approval of connection to the distribution network for each input/output point, and has to be signed before the beginning of power supply or feed-in from or into the distribution network, or following any chang-es in the parameters of this same agreement. The access agreement is signed for an indefinite period of time, except in cases when connection approval is issued for a fixed term.
In 2015, 8,948 customers from the area of Elektro Celje, d.d., changed their electricity supplier, which is 4,327 more than in 2014.
At the end of 2015, 1,106 electricity producers were con-nected to the distribution network of Elektro Celje, d.d. (in 2015 alone, 2 electricity producers were connected). In the remote metering system, there are 1,847 concen-trators installed in TS, representing 54 % of all TSs, and 2,836 control meters, representing 83 % of all TSs, while 90,018 customers already (53 % of all customers) are charged by actual consumption of electricity.
In recent years, the number of remote metering points has increased. Our plan is to fit all our customers with remote meters by 2020, allowing them to be charged by actual monthly consumption of power.
2011 2012 2013 2014 2015
163
117
129
149
179
Number of remote-controlled switchgears
20
40
60
80
100
120
140
160
180
200
Number

47
ANNUAL REPORT
Elektro Celje2 0 1 5
8. ORGANISATION AND ACTIVITIES OF THE COMPANY ELEKTRO CELJE
2011 2012 2013 2014 2015
70,740
31,135
43,478
54,640
90,018
Charging by actual consumption
10,000
20,000
30,000
40,000
50,000
60,000
70,000
80,000
90,000
100,000
Number of customers
Installation of Boč – Mrzlica licensed microwave link Okrog – Mokronog control centre radio repeater

ANNUAL REPORT
Elektro Celje2 0 1 5
48
8. ORGANISATION AND ACTIVITIES OF THE COMPANY ELEKTRO CELJE
8.1.5.1 Energy Balance Sheet
8.1.5.1.1 Input (Production) Balance
In 2015, the total input of electricity into the distribution network of Elektro Celje, d.d., amounted to 2,024,647 MWh (input from transmission network + input from power producers + input from other distribution networks), which is 2.8 % more than in 2014, while maximum peak load reached a limit of 306.4 MW in February 2015. The total
amount of electricity distributed to customers connected to the Elektro Celje distribution network (use of network) in 2015 amounted to 1,928,787 MWh, which is 3.2 % more than the year before. The percentage of input from transmission network increased by 2.9 %, from 1,809,644 MWh in 2014 to 1,861,240 MWh in 2015.
Compared to 2014, the production of electricity in SPSs increased by 7.6 % due to a higher number of sunny days, while the power production in SHPs decreased by 35.7 % due to drought.
The annual electricity production of SPSs and SHPS is presented below:
Input and output (generation and consumption) balance
2011 Share 2012 Share 2013 Share 2014 Share 2015 Share
in MWh in % in MWh in % in MWh in % in MWh in % in MWh in %
Transmission network
1,929,434 95.30 1,883,051 94.00 1,850,964 93.03 1,809,644 91.89 1,861,240 91.93
Independent power producers
91,323 4.51 119,174 5.95 131,261 6.60 143,781 7.30 143,688 7.10
Non-regulated supply (input)
3,829 0.19 947 0.05 7,288 0.37 16,005 0.81 19,719 0.97
Total input into the distribution network
2,024,586 100 2,003,172 100 1,989,513 100 1,969,430 100 2,024,647 100
Total supply (output) of electricity
1,912,437 / 1,891,762 / 1,882,792 / 1,868,300 / 1,928,787 /
Non-regulated supply (output)
740 / 296 / 0.449 / 518 / 3,770 /
Losses 111,410 5.83 111,114 5.87 106,722 5.67 100,613 5.39 95,857 4.97
2011
2012
2013
2014
60,000,000
25,008,484
28,271,695
17,573,539
42,111,170
2015
34,189,263
42,959,085
27,610,950
49,698,563
50,433,777
54,241,841
10,000,000
20,000,000
30,000,000
40,000,000
50,000,000
Amounts in kWh SHPs SPSs
Annual electricity generation in SHPs and SPSs

49
ANNUAL REPORT
Elektro Celje2 0 1 5
8. ORGANISATION AND ACTIVITIES OF THE COMPANY ELEKTRO CELJE
In comparison to previous years, the number of newly connected independent power plants dropped consid-erably. The reason lies in the reduced systemic financial
support for the construction of renewable energy sources facilities.
In line with systemic operating instructions for the elec-tricity distribution network, the instructions for connection and operation of power plants with output capacity of up to 10 MW should be noted. The so-called PX3 schemes, where the power source generates electricity for the re-quirements of its own consumption and only surpluses are fed back into the distribution network, have resulted in a decrease in revenue from use of network and in electric-ity supplied, and this trend will continue into the future. In 2015, such energy amounted to 77.1 GWh, which is 2.6 % of total distributed electricity.
Losses in the distribution network decreased from 5.39 % in 2014 to 4.97 % in 2015, calculated in compliance with the Act Determining the Methodology for Charging for the Network Charge.
The considerable decrease of losses from previous years is a result of measurement of commercial losses, which include losses due to metering errors, inaccuracy of me-tering devices, unregistered consumption, unjustified consumption, and other unforeseeable events in the op-eration of the power distribution system. The reason for lower losses of electric energy in 2015 is particularly more frequent readings, upgraded software and a higher share of remote metering points. The measures to reduce com-mercial and technical losses include the implementation of AMI systems. In fact, remote metering systems simplify our work, while allowing us to perform it more accurately.
Number of newly connected power plants
Energy source
Sun Water Biomass Gas Wind Total
2010 159 0 0 2 0 161
2011 210 0 0 4 1 215
2012 367 0 2 5 0 374
2013 46 2 4 17 1 70
2014 11 0 1 45 0 57
2015 0 1 0 1 0 2
Total 793 3 7 74 2 879
91.93 %
7.10 %
0.97 %
Input shares for 2015
Input ELES
Independent power producers
Non-regulated supply
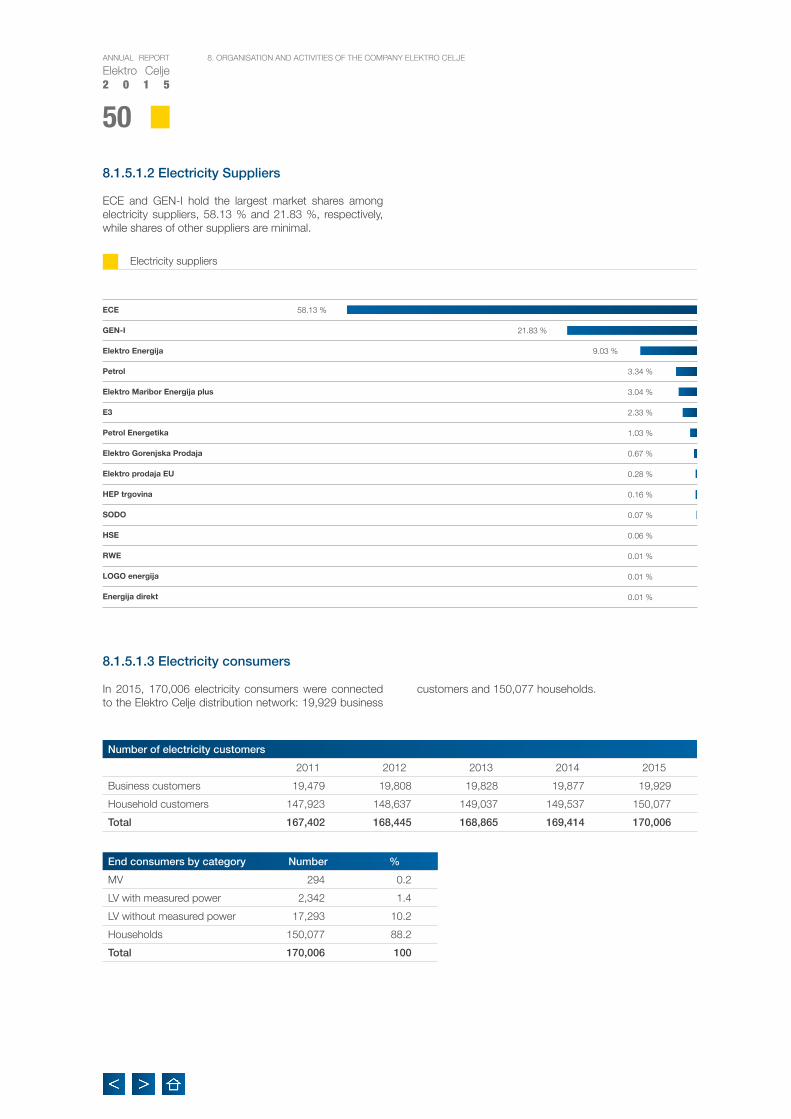
ANNUAL REPORT
Elektro Celje2 0 1 5
50
8. ORGANISATION AND ACTIVITIES OF THE COMPANY ELEKTRO CELJE
8.1.5.1.2 Electricity Suppliers
ECE and GEN-I hold the largest market shares among electricity suppliers, 58.13 % and 21.83 %, respectively, while shares of other suppliers are minimal.
8.1.5.1.3 Electricity consumers
In 2015, 170,006 electricity consumers were connected to the Elektro Celje distribution network: 19,929 business
customers and 150,077 households.
Number of electricity customers
2011 2012 2013 2014 2015
Business customers 19,479 19,808 19,828 19,877 19,929
Household customers 147,923 148,637 149,037 149,537 150,077
Total 167,402 168,445 168,865 169,414 170,006
End consumers by category Number %
MV 294 0.2
LV with measured power 2,342 1.4
LV without measured power 17,293 10.2
Households 150,077 88.2
Total 170,006 100
Electricity suppliers
ECE
GEN-I
Elektro Energija
Petrol
Elektro Maribor Energija plus
E3
Petrol Energetika
Elektro Gorenjska Prodaja
Elektro prodaja EU
HEP trgovina
SODO
HSE
RWE
LOGO energija
Energija direkt
58.13 %
21.83 %
9.03 %
3.34 %
3.04 %
2.33 %
1.03 %
0.67 %
0.07 %
0.16 %
0.28 %
0.06 %
0.01 %
0.01 %
0.01 %

51
ANNUAL REPORT
Elektro Celje2 0 1 5
8. ORGANISATION AND ACTIVITIES OF THE COMPANY ELEKTRO CELJE
8.1.5.2 Metering Equipment
In 2015, we continued with the installation of meters that allow automatic reading and transferral of data to a central base via different communication channels. As of the end of the previous year, 117,841 such meters were installed, representing 63 % of all customers connected to the Ele-ktro Celje distribution network. At the end of the year, the number of customers billed on the basis of actual electric-ity consumption was 90,018.
The benefits of introducing the remote meter reading sys-tem are:• lower costs of meter reading
• revenue management – fewer errors in meter reading, data transfer and electricity theft detection (which ac-count for 1 % of commercial losses)
• possibility of data transfer services for third parties (gas, water, etc.)
• greater billing accuracy• two-way communication• fewer customer complaints• better overview over power consumption and network
operation• easier error detection and higher quality of analyses• implementation of measures for efficient energy use
8.1.6 Network ChargesPursuant to the agreement with SODO, Elektro Celje is in-voicing network charges to those customers who are not billed for the network charge by their electricity suppliers.
The network charges invoiced on behalf of SODO amount to EUR 82,192,939, which is 7 % more than in 2014.
The table below presents the dynamics of the services of the network charge department for the last five-year period.
We are bound by the Act on Submission of Data on the Quality of Electric Energy Supply, issued by the Energy Agency of the Republic of Slovenia, to monitor some ac-tivities that provide quality provision of services for elec-tricity consumers on the Elektro Celje distribution network.
The following events are recorded for monitoring of com-mercial quality indicators:• time required for response to written inquiries, com-
plaints and user requests• time required to resume electricity supply at a meter-
ing point after the conditions for such resumption have been met
• time required to repair a meter fault
• number of meter readings in a year according to the type of schedule (annual, monthly)
• time of call hold at the call centre• call-centre service level indicator
In 2015, the systematic recording of events related to the monitoring of commercial quality indicators was up-dated. In addition to the document management system BusinessConnect, intended for managing complaints, re-sponding to requests on which we report to regulatory au-thorities, and organising the work at the Celje call-centre, we upgraded the information system for recording and monitoring calls and forwarding customer requests to the respective sectors for resolution.
8.2 Maintenance and InvestmentsIn addition to network maintenance and planning and im-plementation of investment projects, the Maintenance and Investment Sector provides to its customers a complete range of services in building, reconstruction, maintenance and servicing power-generating facilities and devices at
MV and LV levels. These tasks are carried out by the De-partment of Planning and Engineering, the Investment Department and the DUs of Celje, Krško, Slovenj Gradec and Velenje and their respective control units and electrical installation teams.
Services of the network charge department 2011 2012 2013 2014 2015
Agreements on access to distribution network 11,762 10,497 10,118 11,924 15,463
Manual meter reading - annual reading 138,441 123,805 111,893 99,528 85,511
Manual meter reading - monthly reading 122,411 112,020 100,684 82,154 62,502
Remote meter reading - household and business customers 359,640 437,992 577,204 752,845 947,066
Manual meter reading due to change of supplier 4,054 5,075 4,693 2,729 4,847
Remote meter reading due to change of supplier 1,108 1,368 1,593 1,892 4,101

ANNUAL REPORT
Elektro Celje2 0 1 5
52
8. ORGANISATION AND ACTIVITIES OF THE COMPANY ELEKTRO CELJE
8.2.1 MaintenanceFollowing is a presentation of value data on electricity infra-structure maintenance by type of asset for 2015.
Maintenance by type of asset DU CELJE DU KRŠKO DU
SLOVENJ GRADEC
DU VELENJE
TOTAL ELEKTRO
CELJE
HV overhead power lines 24,721 40,057 0 19,552 84,330
DTS 110/MV kV, DS 110 kV 233,667 161,580 114,274 204,546 714,066
Total 110 kV facilities 258,387 201,637 114,274 224,098 798,396
MV overhead power lines 394,879 530,393 474,177 432,480 1,831,929
MV underground cables 39,674 33,733 27,099 61,663 162,169
DTS MV/MV, DS MV (with control and protection) 33,137 47,554 8,457 60,936 150,084
TS MV/0.4 kV, TS SN/0.95 kV, TS 0.95/0.4 kV 523,443 379,492 211,970 373,243 1,488,148
Total MV facilities 991,134 991,171 721,703 928,321 3,632,329
Total LV network 1,172,637 885,094 663,108 914,155 3,634,993
TOTAL MAINTENANCE OF LINES AND DEVICES
2,422,158 2,077,902 1,499,085 2,066,574 8,065,718
in EUR
The DUs are in charge of ensuring a technically impec-cable condition of the power distribution equipment, in-tervening as necessary during regular working hours, pro-viding emergency services outside regular working hours, reading meters, and replacing fuses. These activities are primarily carried out by control units.
Technical and other documentation for the requirements of regular maintenance and investment maintenance is provided in cooperation with technical operations at the
DUs; also, arrangements are made with property owners and customers regarding the works and interruptions in electricity supply. Maintenance teams are in charge of in-vestment and maintenance works of public benefit.
In 2015, due to various causes, there occurred occasional interruptions and faults in the power distribution equip-ment, which the maintenance personnel repaired in the shortest time possible, normal operation of the network being restored.
Maintenance of electricity distribution infrastructure
DU Celje
DU Krško
DU Slovenj Gradec
DU Velenje
Total Elektro Celje
1,000 2,000 3,000 4,000 in 000 EUR
Total 110 kV facilities
Total MV facilities
Total LV facilities

53
ANNUAL REPORT
Elektro Celje2 0 1 5
8. ORGANISATION AND ACTIVITIES OF THE COMPANY ELEKTRO CELJE
In the area of DU Celje, the number of interruptions/faults exceeding 3 minutes on the MV infrastructure dropped by 52 % compared to 2014, from 67 to 32. As a conse-quence, the time to repair the faults was also shorter (by 31 %). The reasons for interruption decrease are intensive and systematic investment in the renovation of the MV network and the integration of resonant inductors in the DTSs. The number of faults and interruptions on the LV equipment rose from 600 to 726 (by 21 %), but the time required to repair them decreased by 15 %.
In the area of DU Krško, the number of faults on the MV infrastructure dropped from 75 to 41 (by 45 %) compared to 2014, and from 239 to 196 (by 18 %) on the LV infra-structure. Since the faults were small, the time required to repair them decreased by 45 % in the MV equipment and by 4 % in the LV equipment.
In the area of DU Slovenj Gradec, the number of inter-ruptions/faults caused by adverse weather conditions in-creased from 25 to 44 (by 76 %), but since the faults were small, the time to repair them decreased by 10 %. The
number of interruptions on the LV infrastructure dropped from 209 to 145 (by 31 %), and the time required for their repair by 19 %.
In the area of DU Velenje, the number of interruptions/faults on the MV infrastructure in 2015 increased from 55 to 78 (by 42 %); as a consequence, the time required to repair them increased, too (by 17 %). The number of faults on the LV infrastructure dropped from 466 to 373 (by 20 %) and, analogously, the time necessary for their repair (by 41 %).
Compared to 2014, the number of faults on the 110 kV infrastructure rose from 9 to 13 (by 44 %) in 2015, but all 13 of them were caused by faults on the 110 kV network of the Slovene transmission network system operator – ELES.
In 2015, we replaced 38 transformers due to the require-ment of increased capacity and 53 due to wear. We also restored 1,041 LV connections.
Electricity distribution infrastructure as of Dec 31, 2015
DU Celje
DU Krško
DU Slovenj Gradec
DU Velenje
Total Elektro Celje
Number of DTSs 6 4 4 3 17
Number of DSs 3 4 3 4 14
Number of TSs 976 952 720 825 3,473
110 kV OPL (km) 61 33 0 7 101
MV OPL (km) 708 815 433 683 2,639
MV UC (km) 255 221 158 174 808
0.4 kV LV network (km) 4,300 3,511 2,655 3,151 13,617
195
13
4,588
1,263
0
1,440
LV network
MV infrastructure
110 kV infrastructure
LV network
MV infrastructure
110 kV infrastructure
Number of interruptions Number of hours required to repair the faults

ANNUAL REPORT
Elektro Celje2 0 1 5
54
8. ORGANISATION AND ACTIVITIES OF THE COMPANY ELEKTRO CELJE
8.2.2 Planning and EngineeringThe Planning and Engineering Department drafts project documentation up to building permit (PD – conceptual de-sign, BD – basic design), project documentation for the execution of the works (DD – detailed design), concep-tual designs (CDs) and project documentation for com-pleted works (AD –as-built design) for newly constructed and renovated transformer stations of the MV/LV infra-structure, of MV and LV connection lines, relocations and revisions of power distribution lines and equipment, me-chanical protection of overhead power lines, underground and overhead optical cables, individual parts of DTSs and DSs, instructions on the use and operation of DTSs and DSs, and to a smaller extent also project documentation
for LV connections to buildings and electric vehicle charg-ing stations.
The engineers also develop studies and safety plans and perform the task of OHS coordinators. Besides design-ing the basic technical aspect of project documentation, the planners/engineers dedicate much of their time and attention to placing facilities and infrastructure into their physical environment.
The total investment value of completed BD and DD pro-ject documentation in 2015 was EUR 8,088,376.
In 2015, the Planning and Engineering Department com-pleted a total of 129 projects, of which 74 were BDs and/or DDs, 54 ADs, and 1 PD. Of all designs, a total of 26 designs were developed for third-party customers, of which 19 BDs and (or) DDs, 6 ADs and 1 PD. It also pre-pared 2 new and 11 revised instructions on the use and operation of DTSs and DSs, drafted 320 easement agree-
ments and 151 amendments to such agreements, carried out 245 appraisals of easement compensations and 63 revisions to such appraisals, and signed 936 easement agreements. It made 4 purchases of plots for existing and planned TSs, prepared 6 cancellation permits, and drew up 6 amendments to agreements, 1 co-investment agree-ment and 3 superficies contracts.
2,000,000
3,000,000
4,000,000
5,000,000
6,000,000
7,000,000
planned value actual value
2011 2012 2013 2014 2015
8,000,000
0
10,000,000
20,000,000
30,000,000
40,000,000
50,000,000
60,000,000
70,000,000
80,000,000
90,000,000
cumulative value
7,79
3,48
1
7,21
7,82
2
8,38
0,68
3
8,57
0,07
3
7,67
6,01
5
8,36
2,16
9
7,56
5,14
3
7,72
0,00
3
6,15
3,56
6
8,08
8,37
6
Plan and realisation of completed projects according to estimated value of investment
Value
0
20
40
60
80
100
120
0
20
40
60
80
100
120
140
160
180
PD AD TOTALBC, DD
146
4 5 9 5 156 40 62 59 5486 82 88 85 74
127
159149
129
linear (TOTAL)
Number of projects completed by year
Number of projects
2011 2012 2013 2014 2015

55
ANNUAL REPORT
Elektro Celje2 0 1 5
8. ORGANISATION AND ACTIVITIES OF THE COMPANY ELEKTRO CELJE
8.2.3 InvestmentsIn 2015, investments amounted to EUR 21,765,222 (value of acquisitions stated in the tables of intangible assets and PP&E in 2015, minus the value of PP&E acquired free of charge), which is equivalent to 107.2 % of the annual plan of EUR 20,300,000. The investments were financed with
own depreciation assets in the amount of EUR 6,899,755, other own sources in the amount of EUR 6,265,467 and loans in the amount of EUR 8,600,000. The value of PP&E acquired free of charge in 2015 amounted to EUR 380,390.
Investments in 2015 DU Celje DU Krško DU Sl. Gradec DU VelenjeTotal Elektro
Celje
New MV and LV infrastructure 2,079,833 1,634,503 1,417,182 1,893,853 7,025,371
Replacements and increase of capacity 2,050,862 1,390,391 1,291,323 2,048,606 6,781,182
Refurbishment/renovation 399,416 719,680 901,633 382,412 2,403,141
Other electricity network investments 1,437,789 865,559 587,213 310,770 3,201,331
Investments not related to the power network
1,148,188 352,526 295,236 558,247 2,354,197
TOTAL 7,116,088 4,962,659 4,492,587 5,193,888 21,765,222
New MV and LV InfrastructureFunds in the amount of EUR 6,835,000 were allocated for the construction of new MV and LV lines and other infrastructure. Actual investments amounted to EUR 7,025,371, which is 102.8 % of the annual plan. We con-structed 36 new TS (20/0.4 kV), 4.2 km of MV overhead power lines, 46.7 km of MV underground cables, and 35.9 km of LV underground cables.
Renovation and Replacement, and Increase of CapacityFor the purposes of renovation, replacement, and in-crease of capacity of MV and LV lines and other infrastruc-ture we allocated funds in the amount of EUR 7,572,000. The actually used funds amounting to EUR 9,184,323, which is 106 % of the annual plan, were intended for the remediation of the damage to the power distribution net-work caused by ice in February; for the remediation of the damaged lines and other infrastructure; replacement of cables, utility poles with relevant equipment, disconnec-tors, and power lines; construction of replacement MV un-derground cables; replacement of LV cabinets, overvolt-age conductors and refurbishment of the building and/or MV equipment at transformer substations; replacement of utility poles for overhead LV power lines; and underground cabling of the LV network. We remedied 42.3 km of MV overhead power lines, built 11.9 km of MV underground cabling, installed 192 km of LV network cables, reno-vated 20 buildings of transformer substations, replaced MV switching blocks at 44 and LV switching blocks at 42 transformer substations, replaced 1,363 MV utility poles and 1.570 LV utility poles, as well as 382 MV overvoltage conductors.
Other Electricity Network InvestmentsInvestments into major power distribution infrastructure were planned in the amount of EUR 3,343,000. Actual in-vestments amounted to EUR 3,201,331, which is 95.8 % of the annual plan.
Review of Major Investments in 2015Underground cable 2 x 110 kV DTS Žalec – 110 kV OPL DTS Podlog – DTS LavaSince SODO is the investor, we submitted an application for the change of building permit to the Ministry of Infra-structure in 2014. Due to complications in the carrying out of the public procurement procedure, the beginning of the works for the installation of a 2 x 110 kV connecting cable for DTS Žalec and MV cable ducts between shafts CS 12 and CS 7 were delayed until December 2015. The com-pletion of all works is projected for the end of the first half of 2016.
DV 2 x 110 kV DTS Ravne – DTS MežicaIn 2015, we successfully completed the public presenta-tion and discussion of documents in the municipalities of Mežica, Ravne na Koroškem and Prevalje. Despite the fulfilment of all requests made by the residents of the mu-nicipalities at the public discussion, the procedures are at a standstill. We informed the Ministry of Environment and Spatial Planning of the situation, and unless the Municipal-ity of Prevalje responds, we will be forced to make a deci-sion on the implementation of the National Spatial Plan, which will lengthen the duration of the project.
OPL 2 x 110 kV DTS Trebnje – DTS Mokronog – DTS SevnicaSince we obtained all the opinions of the national spatial planning authorities, the Government of the Republic of Slovenia is expected to issue a decision in January 2016 on the most favourable OPL route.
DTS 110/20 kV Žalec with TS 110/20 kV 2 x 31.5 MVAIn 2015, we finished testing the equipment at the level of DTS. The facility was connected to the new LV cable from the TS Arnovski gozd 5. The 20 kV switching substation was fitted with four ducts towards the north, and at the end of 2015 we began installing the cable ducts towards the south. SODO began to work on the 110 kV under-ground connection cabling. The trial operation of the facil-ity is expected for 2016.
in EUR
ANNUAL REPORT
Elektro Celje2 0 1 5
56
8. ORGANISATION AND ACTIVITIES OF THE COMPANY ELEKTRO CELJE
DTS 110/20 kV Vojnik with TS 110/20 kV 2 x 20 MVASince the network customers of the wider Vojnik and Do-brna area are connected to a two-system overhead power line 2 x 20 kV Vojnik – Ljubečna and since this is a pre-dominantly rural type of network, where the reliability of operation is not consistent with the number of connected users, it will be necessary to construct a new DTS 110/20 kV Vojnik with a 2 x 110 kV underground connection ca-ble. Currently, we are at the phase of public procurement procedure for the selection of contractors for the prepa-ration of project documentation (CD, BD, DD, Bdoc and AD).
DTS 110/20 kV LavaA replacement of MV secondary equipment was planned for 2015. Since we only activated one of the two planned ducts, the works will continue into 2016. We replaced the AKU batteries and repaired the handrail.
DTS 110/20 kV SelceWe provided the oil-collector with signalling devices.
DTS 110/20 kV MozirjeWe upgraded the neutral point earthing system with an arc suppression coil, restored the concrete cable ducts at the 110 kV switching substation and replaced the current with 2 x 31.5 MVA transformers. The new transformers were financed by SODO, while Elektro Celje covered the costs of electrical installation works in the replacement of the transformers. We also produced the DD and AD docu-mentation.
DTS 110/20/10 kV TrnovljeThe control system was upgraded and the AKU batteries changed.
DTS 110/20 kV VelenjeWe refurbished the controller cabinets for transformers TR I and TR II, reroofed the DTS and renovated the outer walls of the control room.
DTS 110/20 kV VuzenicaWe continued the installation of the arc suppression coil and prepared the DD and AD documentation. We also re-placed the windows and doors in the building.
DTS 110/20 kV Rogaška SlatinaWe replaced the current transformer with a 31.5 MVA transformer. The transformer was financed by SODO, while Elektro Celje covered the costs of electrical installa-tion works in its replacement. We also purchased primary equipment for the TR field, which is planned to be installed in 2016.
DTS 110/20 kV SevnicaWe renovated TR I and put it back into operation, pre-pared DD and AD documentation, restored the concrete cable ducts at the 110 kV switching substation, pur-chased secondary equipment and insulated the busbars.
DTS 110/20 kV DravogradWe continued the installation of the arc suppression coil and inbuilt the signalling devices for the oil-collector.We also drafted DD and AD documentation.
DTS 110/20 kV RavneWe restored the foundations of transformers and concrete cable ducts at the 110 kV switching substation, and in-stalled an air-conditioning system.
DTS 110/20 kV KrškoThe facility was scheduled for replacement of primary and secondary equipment for the OPL field, but due to ELES’s withdrawal (new regulation on the division of 110 kV OPLs) the replacement was not carried out. We upgraded the neutral point earthing system with an arc suppression coil, and installed an air-conditioning system.
DTS 110/20 kV BrežiceWe upgraded the neutral point earthing system with an arc suppression coil, and installed a signalling device for the oil-collector.
DTS 110/20 kV BrestanicaWe installed a signalling device for the oil-collector.
DS LjubnoWe purchased feeder terminals.
DS Podsreda and DS PodgračenoWe upgraded the communication connections with the DCC.
DS Mežica, DS RadljeWe installed an air-conditioning system.
DS MokronogWe installed a signalling device for the oil-collector.
Metering DevicesRegular and extraordinary substitution activities included the replacement of 13,413 meters, 1,287 for the require-ments of statistical sampling.
Telecommunication NetworkIn 2015, two new cyber-safety systems were installed. The control system of the safety mechanism was up-dated with the new Juniper Junos Space system, which was completed with SIEM Juniper Secure Analytics. Several projects were realized in the digital radio system, and the EDIC2 customer relationship system (CRM) was completely renovated. With respect to developments in the optical network, we set up a connection to the busi-ness facility Vojnik, and connections DTS Dravograd – TS Libeliče, and DS Radlje – TS Radlje. For marketing pur-poses, we also connected the MOS Mestinje business building to the network with an underground optical cable.
Automatization of the MV NetworkWe installed 16 RCS sets in 2015, automated TS Mirna, TS OMCO Feniks and TS Tabor, and carried out functional protection tests at 10 remote-controlled switching points. We were active participants in the pilot project of the par-allel operation of MV lines between DTS Sevnica and DTS Mokronog. The project is in the execution phase and will be completed in 2016.

57
ANNUAL REPORT
Elektro Celje2 0 1 5
8. ORGANISATION AND ACTIVITIES OF THE COMPANY ELEKTRO CELJE
DCCWe renewed the maintenance contract for the PSI soft-ware tool for 2015. Part of the funds were allocated to the upgrade of the Schneider DMS software tools. We pur-chased and installed a video server for the requirements of video control of Elektro Celje facilities and office build-ings. The decode station at the DCC, which monitors the executed switch manipulations on 110 kV OPL, had to be replaced due to wear and fault. Some unused funds were transferred to the budget for metering equipment.
Business Data ProcessingIn 2015, we set up an asset management software solution (IBM Maximo), updated the DMS system, purchased com-puter hardware (desktop computers, laptops, monitors, printers), upgraded the functions in the eDoc document management system, upgraded the AutoCAD software to version 2015, and improved the main server with a rela-tional database management system (MS SQL). Further to the decision to introduce a new system with the Always On Availability Groups concept we purchased additional disk capacity for storing secondary database replicas. We upgraded the function in the ePredračuni application.
Office Buildings and Physical InventoryIn Velenje we renovated the office buildings (replaced win-dows and doors, reconstructed the roof, fitted the building walls and roof with thermal insulation, installed or restored lightning conductors and replaced the heated gutter ca-bling, built carports for company vehicles, remodelled the courtyard, and refurbished the heating system). At the Ravne control centre we replaced windows and doors, fitted the building with thermal insulation, refurbished the heating system and painted internal walls. At the Krško plant building we replaced some of the windows, dropped the ceilings and fitted them with thermal insulation, reno-vated the internal storage platform, replaced the light-
ing, renovated the power lines in the parking and stor-age rooms, and remedied the damage to the main office building caused by soakage. At the administrative building the lighting in the parking garages and basement was re-placed, in two offices lighting was replaced and ceilings were lowered, partitions were built in the staircases, and the security system was upgraded. At the Šempeter cen-tral archives we replaced windows and doors, and regu-lated the ventilation, heating and cooling systems. At the Lava and Šempeter plant buildings we upgraded the se-curity system and connected it to a security company. In Slovenj Gradec we installed a security system and con-nected it to a security company.
Transport VehiclesBased on an executed public contract the following vehi-cles were purchased in 2015: 1 personal electric vehicle, 2 personal vehicles, 1 electric light duty vehicle, 21 light-duty vehicles, 1 heavy-duty vehicle with a trailer and 3 trailer vehicles for the transport of cables.
Ecology Investments and Major and Small ToolsIn 2015, we connected the control centres of Ravne, Naz-arje and Šempeter to the public sewage network. At the DTS Ravne we closed up the restroom and the septic tank, preparing the latter for occasional emptying. At the Ravne and Velenje control centres we replaced the outdoor light-ing in accordance with the law. The centres were, in addi-tion to the regular supply of standardised small tools, fitted with sets for earthing and short-circuiting the MV power lines from the ground. DU Krško, DU Slovenj Gradec and DU Velenje were furnished with thermovision inspection cameras, and the repair shop in Slovenj Gradec acquired a punch laser machine.
The graph below presents the value and the structure of investments for the period from 2011 to 2015.
0
5,000,000
10,000,000
15,000,000
20,000,000
25,000,000
30,000,000
6,689,803
Value and structure of investments
6,041,847
2,158,206
7,694,972
2,756,355
7,128,525
5,790,279
2,146,269
4,983,110
2,425,065
6,454,025
6,241,158
2,000,972
6,295,220
3,518,787
6,176,388
8,517,314
1,837,208
4,044,135
2,547,955
7,025,371
6,781,182
2,403,141
3,201,331
2,354,197
25,341,182
22,473,248
24,510,16223,123,000
21,765,222
5,000,000
10,000,000
15,000,000
20,000,000
25,000,000
0
MV and LV infrastructure R&IC R/R TOTALOther power network investments
Investments not related to power network
in EUR
2011 2012 2013 2014 2015

ANNUAL REPORT
Elektro Celje2 0 1 5
58
8. ORGANISATION AND ACTIVITIES OF THE COMPANY ELEKTRO CELJE
In the period 2011–2015, Elektro Celje invested a total of 117.2 million EUR, which is 24.9 % of all investments made by electricity distribution companies in Slovenia during this same period and considerably more than the proportional share of Elektro Celje with respect to the area serviced and share of infrastructure.
The table presents the investment plan for the period 2015–2017 and the actual investments in 2015, following the agreement between EIB and Elektro Celje, d.d.
Item2015 2016 2017
Contract Realisation Contract Contract
New HV power lines M EUR 0.18 0.03 0.15 0.15
(Preparation of documentation for power line placement)
km 0.00 0.00 0.00 0.00
Refurbished HV power lines M EUR 0.00 0.00 0.00 0.00
km 0.00 0.00 0.00 0.00
New MV power lines M EUR 0.49 0.20 0.10 0.10
km 8.40 4.20 2.00 2.00
Refurbished MV power lines M EUR 1.17 3.58 1.05 1.25
km 38.90 42.30 41.80 40.50
New MV underground cables M EUR 2.50 3.95 3.61 3.73
km 46.00 46.74 66.80 69.00
Refurbished MV underground cables M EUR 1.00 0.25 1.28 1.01
km 49.60 11.90 53.30 42.00
LV network M EUR 5.57 4.25 5.06 5.59
km 266.90 227.91 242.00 267.00
MV/LV stations M EUR 2.86 2.73 2.07 2.19
- New Number 40.00 36.00 31.00 27.00
- Replacement and increase of capacity Number 0.00 0.00 0.00 0.00
- Refurbished Number 105.00 106.00 100.00 108.00
- Upgraded transformer capacity MVA 0.00 0.00 0.00 0.00
HV/MV stations M EUR 0.46 0.58 0.93 0.63
- New Number 0.00 0.00 0.00 0.00
- Replacement and increase of capacity Number 0.00 0.00 0.00 0.00
- Refurbished Number 3.00 3.00 1.00 1.00
- Upgraded transformer capacity MVA 0.00 0.00 0.00 0.00
Automatisation and control M EUR 1.05 0.77 0.89 0.98
Other equipment (metering equipment, transportation means, office buildings etc.)
M EUR 5.02 5.42 4.86 5.27
Total M EUR 20.30 21.77 20.00 20.90

59
ANNUAL REPORT
Elektro Celje2 0 1 5
Maintenance work on electricity infrastructure

ANNUAL REPORT
Elektro Celje2 0 1 5
60
9. BUSINESS ENVIRONMENT
9. BUSINESS ENVIRONMENT9.1 Analysis of the Business Environment
According to the first estimate (based on the quarterly data), gross domestic product stood at 38.5 billion EUR and grew by 2.9 % in real terms, which is 0.2 percentage points higher than what the Institute of Macroeconomic Analysis and Development (UMAR) had predicted.
The unemployment rate decreased from 13.0 % in 2014 to 12.3 %. According to the data from the Employment Agency of the Republic of Slovenia, there were 113,076 registered unemployed persons in Slovenia as of the end of 2015, which is 5.4 % less than in December 2014.
The Slovene consumer price index decreased by 0.5 % at an annual level. The lower prices for oil products con-tributed most to the annual deflation. The average annual inflation rate was also negative and also equalled 0.5 %, while both the annual and the average annual inflation rates for 2014 were 0.2 %.
The average monthly gross salary for 2015 in the Republic of Slovenia amounted to EUR 1,555.89, which is more than the average monthly salary for 2014: by 0.7 % in nominal and 1.2 % in real terms.
9.1.1 Impact of the economic environment on the operations of the Elektro Celje GroupThe volume of electricity consumption is connected to the volume of economic activity. Economic growth induces higher electricity consumption, but since the economic situation in Slovenia is not yet fully stabilised, the predic-tion of consumption is complex and uncertain. The pro-jected rate of electricity consumption growth is low and based on the premise that further economic growth re-quires sufficient amounts of electricity and a power sys-tem capable of providing electricity to end consumers. In 2016 and 2017, according to the projections made by
UMAR, we can expect the economic growth to continue (by 2.3 % in comparison to the past year). Analyses of past trends show that during periods of high GDP growth, the consumption of energy grows somewhat slower, just as in the periods of large drops in GDP the consumption decreases slightly more slowly. The correlation is under-standable, for not all consumption of the network custom-ers is directly associated with economic activity and the consumption by household customers acts as a “cush-ion” for the trends.
Economic trend indicators 2013 2014 2015
GDP (real growth in %) -1.1 3.0 2.9
Registered unemployment rate (in %) 13.5 13.0 12.3
Inflation rate (annual average in %) 1.8 0.2 -0.5
Average gross salary in the RS (nominal growth in %) -0.1 1.1 0.7
Average gross salary in the RS (real growth in %) -1.9 0.9 1.2
1988
1989
1990
1991
1992
1993
1994
1995
1996
1997
1998
1999
2000
2001
2002
2003
2004
2005
2006
2007
2008
2009
2010
2011
2012
2013
0.20
0.40
0.60
0.80
1.00
1.20
1.40
Stock market index, year 2000 = 1.00
Total consumption from the distribution network GDP Constant prices, reference year 2000 (in millions of Euro)

61
ANNUAL REPORT
Elektro Celje2 0 1 5
9. BUSINESS ENVIRONMENT
The graph clearly shows the two periods of transition crisis in the late 1980s and early 1990s, the financial and most recent economic crises, and how they were reflected by the concurrent shrinking of economic activities.
But economic activity is not the only factor defining the volume of electricity consumption. In the short term, the influence of weather and outdoor temperatures is very important, too. Not to mention that the future growth or shrinkage of volume will also be affected by consumption in transport (electric vehicles, increased consumption in railways).
The current situation does not justify the halt of the de-velopment cycle of investments. On the contrary. First, because the Slovene electricity system has prepared for the regrowth of consumption and because electricity in-frastructure investments, due to their complex siting and execution, require long-term planning. The systems that will be ready for such regrowth will provide a long-term competitive advantage to their economies. Due to their extensive multiplicative effect, investments in the power infrastructure have to be considered as opportunities for mitigating the effects of crises and promoting faster further development.
9.1.2 The Impact of Supply and Demand of electricity and other energy-generating products on the operation of the GroupCompared to other forms of goods, electricity is charac-terised by several specifics: it has no adequate substitute, cannot be stored, and is not freely transferable between countries, for it is limited by the physical capacity of power lines.
The economic crisis and attempts at economic recovery in recent years still exert a powerful influence on the price of electricity. The 2015 trends of the latter moved in ac-cordance with weather conditions, the available amount of electricity generated by renewable sources, and the prices of other energy-generating products. The reason for the price fluctuation were the expectations of economic re-covery and the situation in financial and other markets. In 2015, the price of electricity was also affected by prices of other energy-generating products (largely oil, which lost no less than 45 % of its value since the beginning of the year, and natural gas), the speculative fluctuation of EU al-lowances, as well as the prices of transmission capacities; these were in the past year fairly high, as they depend on the prices on the Hungarian electricity market.
Finally, the price of electricity is also related to renewable energy sources, which represent a growing category in the structure of electricity production sources. Due to their strong correlation with weather conditions, renewable en-ergy sources influence the relationship between rates for individual hours of the day. Recently we have witnessed large differences between day and night rates of electric-ity; the day rate, at peak load times, when there was a shortage of production sources, was very high, while the night rate was quite low. In 2015, the difference between night and day rates was decreasing, mostly due to RES, which produce more electricity during the day and thus contribute to the increased supply of electricity on the market.
The purchase of natural gas is entirely covered by imports, mostly from Russia. The problems arising in the natural gas market are related to the non-standardised service of system operators with regard to the data necessary for the management of purchase and an uninterrupted supply to our end customers.
9.2 The Legal and Regulatory Framework of OperationThe role of distribution in the Slovene electricity system is defined in the National Energy Programme (NEP). Follow-ing the adoption of Energy Act (EZ-1), the current NEP will be replaced by Slovenia’s Energy Concept, in which the targets of reliable, sustainable and competitive electricity supply for the period of the next 20 years, and framework period of 40 years, will be set, based on the projections of economic, environmental and social development of our country, and on international commitments made.
The development of an electricity distribution network and provision of a long-term, stable electricity supply is defined in the Plan for the Development of the Electricity Distribu-tion Network in the Republic of Slovenia in the 10-year period from 2015 to 2024, produced by the company SODO, concessionaire for the performance of the public utility service of the distribution network system opera-tor in the territory of the Republic of Slovenia. The Plan is based on the individual plans for the development of
the electricity distribution network for the 10-year period between 2015 and 2024 made by electricity distribution companies of Slovenia.
In its operation in 2015, the Elektro Celje Group complied with all core legislative and regulatory bases.
MAJOR EU DIRECTIVES RELATED TO ENERGY:
Directive 2009/72/EC of the European parliament and the Council of 13th July 2009 concerning common rules for the international market in electricity and repealing Direc-tive 2003/54/EC (Official Gazette of the Republic of Slove-nia no. L 211, August 14, 2009, pp. 55–93)
ACTS RELATED TO ENERGY:
• Act Amending the Energy Act (EZ-1A) (Official Gazette of the Republic of Slovenia, no. 81/2015);
ANNUAL REPORT
Elektro Celje2 0 1 5
62
9. BUSINESS ENVIRONMENT
• Energy Act (EZ-1) (OG RS, no. 17/2014);• Companies Act (ZGD-1), OG RS, no. 65/09 – official
consolidated text, 33/11, 91/11, 32/12, 57/12, 44/13 – dec. CC, and 82/13;
• Service of General Economic Interest Act (ZGJS), OG RS, no. 32/93, 30/98 - ZZLPPO, 127/06 - ZJZP, 38/10 - ZUKN, and 57/11 - ORZGJS40.
IMPLEMENTING REGULATIONS RELATED TO ELECTRICITY:
• Decree on the Method of Provision of an Electricity DSO Service of General Economic Interest and a Service of General Economic Interest of Electricity Supply to Tar-iff (Official Gazette of the Republic of Slovenia, nos. 117/2004, 23/2007, and 17/2014 - EZ-1);
• Decree on the Concession of an Electricity DSO Service of General Economic Interest (OG RS, nos. 39/2007, and 17/2014 - EZ-1);
• Act on the Methodology Determining the Regulatory Framework and the Methodology for Charging the Net-work Charge for the Electricity System Operators (OG RS, no. 66/2015)
• Act Determining the Methodology for Charging for the Network Charge, the Methodology for Setting the Net-work Charge, and the Criteria for Establishing Eligible Costs for Electricity Networks (OG RS, nos. 81/2012, 47/2013, 112/2013, and 7/2014);
• Legal Act on the Methodology for the Preparation and Evaluation of an Investment Plan of the Electricity Distri-bution System Operator (OG RS, no. 97/2014);
• General Conditions for Connection to the Distribution Electric System (OG RS, nos. 126/2007, 37/2011 dec. CC, and 17/2014 - EZ-1);
• Rules on the System Operation of Electricity Distribution Network (OG RS, nos. 41/2011, and 17/2014 - EZ-1);
• Decree on the Energy Infrastructure (OG RS, nos. 62/2003, 88/2003, 75/2010, 53/2011, and 17/2014 - EZ-1);
• Decree on Maintenance Works for the Public Benefit in the Energy Sector (OG RS, nos. 125/2004, 71/2009, and 17/14 - EZ-1);
• Decree on Support for Electricity Generated from High-efficiency Cogeneration of Heat and Electricity (OG RS, nos. 37/2009, 53/2009, 68/2009, 76/2009, 17/2010, 81/2010, and 17/2014 - EZ-1);
• Decree on Support for Electricity Generated from Renewable Energy Sources (OG RS, nos. 37/2009, 53/2009, 68/2009, 76/2009, 17/2010, 94/2010, 43/2011, 105/2011, 43/2012; 90/2012, and 17/2014 - EZ-1);
• Decree on the Method of Determining and Calculating the Contribution for Ensuring Support for the Produc-tion of Electricity from High-efficiency Cogeneration and Renewable Energy Sources (OG RS, no. 36/2014);
• Regulation on Determination of the Amount of Electricity from Cogeneration of Heat and Electricity which is Gen-erated with High Efficiency, and Determination of Effi-ciency of Transformation of Energy from Wood Biomass (OG RS, nos. 37/2009 and 17/2014 - EZ-1);
• Decree on Energy Savings Requirement (OG RS, no. 96/2014);
• Decree on Measures and Procedures for the Intro-duction and Interoperability of Advanced Electric Power Metering Systems (OG RS, no. 79/2015).
OTHER LEGISLATION:
• Construction Act (ZGO-1), Official Gazette of the Re-public of Slovenia, 102/04 – official consolidated text, 14/05 – corr., 92/05 - ZJC-B, 93/05 - ZVMS, 111/05 - dec. CC, 120/06 (CC decision), 126/07, 108/09, 61/10 - ZRud-1, 20/11 - dec. CC, 57/12, 101/13 - ZDavNepr, and 110/13;
• Spatial Planning Act (ZPNačrt), OG RS, nos. 33/07, 70/08 - ZVO-1B, 108/09, 80/10 - ZUPUDPP, 43/11 - ZKZ-C, 57/12, 57/12 - ZUPUDPP-A, (109/12), and 76/14 - dec. CC;
• Spatial Management Act (ZUreP-1), OG RS, nos. 110/02, 8/03 – corr., 58/03 - ZZK-1, 33/07 - ZPNačrt, 108/09 - ZGO-1C, 80/10 – ZUPUDPP;
• Environmental Protection Act (ZVO-1), OG RS, 39/06 - official consolidated text, 49/06 - ZMetD, 66/06 - dec. CC, 33/07 - ZPNačrt, 57/08 - ZFO-1A, 70/08, 108/09, 108/09 - ZPNačrt-A, 48/12, 57/12, and 92/13;
• Public Information Access Act (ZDIJZ), OG RS, nos. 51/06 - official consolidated text, 117/06 - ZDavP-2, 23/14, and 50/14;
• General Administrative Procedure Act (ZUP), OG RS, nos. 24/06 - official consolidated text, 105/06 - ZUS-1, 126/07, 65/08, 8/10, and 82/13;
• Administrative Dispute Act (ZUS-1), OG RS, nos. 105/06, 107/09 - dec. CC, 62/10, 98/11 - dec. CC, and 109/12;
• Public Procurement Act (ZJN-2), OG RS, nos. 12/13 - official consolidated text, and 19/14;
• Act Regulating Public Procurement in the Water, Ener-gy, Transport and Postal Services Sectors (ZJNVETPS), OG RS, nos. 72/11 - official consolidated text, 43/12 - dec. CC, 90/12, and 19/14;
• Legal Protection in Public Procurement Procedures Act (ZPVPJN), OG RS, nos. 43/11, 60/11 - ZTP-D, and 63/13;
• Physical Assets of the State and Local Government Act (ZSPDSLS), OG RS, nos. 86/10, 75/12, 47/13 - ZDU-1G, and 50/14;
• Public Finance Act (ZJF), OG RS, nos. 11/11 - official consolidated text, 14/13 - corr., and 101/13;
• Siting of Spatial Arrangements of National Importance Act (ZUPUDPP), OG RS, nos. 80/10, 106/10 - corr., and 57/12;
• Rules on conditions and restrictions regarding the con-struction and use of installations and the performance of activities in the electricity network safety zone, OG RS, nos. 101/10, and 17/14 - EZ-1;
• Resolution on the National Energy Programme, OG RS, 57/04 (ReNep);
• Strategy for Development of the Power distribution System in the Republic of Slovenia between 2013 and 2022.

63
ANNUAL REPORT
Elektro Celje2 0 1 5
9. BUSINESS ENVIRONMENT
9.3 Composition of the price for electricity for the end consumerThe final price of supplied electricity for a customer who is billed for the network charge and the electricity consumed together by the electricity supplier is composed of the fol-lowing categories:• price of electricity formed in the free market• charges for the use of networks: - the transmission and distribution network charge (de-
termined by the Energy Agency) - system services network charge (determined by the
Energy Agency) - surcharge to the network charge (determined by the
Government of RS)
• contributions (determined by the Government of RS): - contribution for provision of support to high-efficiency
combined heat and power generation and for energy generation from renewable energy sources (RES and CHP)
- contribution for efficient energy use (EE) - contribution for the activity of market operator • excise duty on electricity (determined by the Govern-
ment of RS) • VAT (determined by the Government of RS)
9.4 Shares of categories on the electricity bill for a typical household customer
Source: Energy Agency
37 %
29 %
34 %
Energy
Network charge and additional fees
Charges and contributions


Advanced technology allows us to constantly monitor the power flow in our distribution network. Through analyses of the demand and operation of our electricity devices and equipment we regulate the transfer of electricity and maintain transmission system balance at all times.
ANALYSES

ANNUAL REPORT
Elektro Celje2 0 1 5
66
10. OPERATION AND PERFORMANCE ANALYSIS
10. OPERATION AND PERFORMANCE ANALYSIS10.1 Operation Analysis of the Company Elektro Celje
10.1.1 Net IncomeElektro Celje, d.d., wrapped up the 2015 fiscal year with a net profit of EUR 6,808,482, which is EUR 3,507,182
ahead of plan and EUR 2,033,130 down on the income generated in 2014.
Income statement summary
Amount in EUR Index
Actual in 2015
Plannedfor 2015
Actual in 2014
Actual 2015 /Planned
2015
Actual 2015 / Actual 2014
1. Operating revenue 69,433,526 65,491,400 72,339,914 106 96
2. Operating expenses 60,894,104 60,995,500 62,590,484 100 97
3. Operating profit (1-2) 8,539,422 4,495,900 9,749,430 190 88
4. Finance income 145,345 89,200 632,382 163 23
5. Financial expenses 1,082,192 1,143,300 1,284,021 95 84
6. Profit from ordinary operating activities (3+4-5)
7,602,575 3,441,800 9,097,791 221 84
7. Other income 26,854 18,200 17,328 148 155
8. Other expenses 63,416 48,200 67,039 132 95
9. Profit from extraordinary operating activities (7-8)
-36,562 -30,000 -49,711 122 74
10. Total profit (6+9) 7,566,013 3,411,800 9,048,080 222 84
11. Income tax 784,969 110,500 806,567 710 97
12. Deferred taxes 27,438 0 600,099 0 5
13. Net income/profit (10-11+12) 6,808,482 3,301,300 8,841,612 206 77

67
ANNUAL REPORT
Elektro Celje2 0 1 5
10. OPERATION AND PERFORMANCE ANALYSIS
Revenue in 2015 amounted to EUR 69,605,725, which is 4.6 % less than 2014 and 6.1 % more than planned.
Operating revenue in the amount of EUR 69,433,526 represents 99.8 % of total company revenue, and includes revenue from lease and maintenance of infrastructure and provision of services for SODO d.o.o., revenue from the sale of services, revenue from construction of own fixed assets, and other operating revenue. The largest share in the composition of total revenue is represented by lease and maintenance of infrastructure and provision of ser-vices for SODO (74.8 %), followed by revenue from capi-talised own services (20.6 %).
Revenue from lease and maintenance of the electricity network and from provision of services for SODO and coverage of power network losses amounted to EUR 52,065,913, which is EUR 276,153 down on 2014, or EUR 4,234,510 up on the annual plan. The rent for the infrastructure amounted to EUR 26,240,468, service pro-vision to EUR 19,932,318, approved amount for power losses EUR 5,827,142; emergency supply, reconciliation of erroneous meter readings, and unjustified consumption EUR 65,985. Pursuant to the respective amendment, on March 14, 2016, SODO d.o.o., sent a preliminary reconcil-iation statement for the 2015 regulatory year in the amount of EUR 3,426,391 excluding VAT, and was invoiced for it. The preliminary reconciliation will most probably be paid during the next regulatory period (2019–2021). In 2014, the revenue from lease and maintenance of the electricity distribution infrastructure were up by 0.5 %, mainly due to higher revenue in respect to eligible uncontrollable op-eration and maintenance expenses incurred in order to remedy the ice damage (EUR 1,126,083). The 2015 rev-enue is also lower due to the negative final reconciliation statement of the regulatory framework for 2014, which is
included in the 2015 operating profit. In compliance with the decision by EAgen, the incentives for quality regulation in the amount of EUR 159,216 were excluded from the reconciliation statement.
Revenue from sale of services, which in the structure of total revenue represents a 2.5 % share, includes mainly electrical installation services for third-party customers, and rents. In 2015, it amounted to EUR 1,725,648, and was 16.9 % ahead of plan and 9.4 % higher than in 2014.
Revenue from construction of own fixed assets in the amount of EUR 14,324,151, represents 20.6 % of total revenue. Since in-house workers completed fewer investments than planned, this revenue was 3.9 % or EUR 573,849 lower than planned, and 5.3 % down on 2014. The value of investments was 5.9 % lower than in 2014, when larger-scale investment was also required for the re-pair of ice damage.
Other operating revenue in the amount of EUR 1,317,814 represents 1.9 % of total revenue and exceeds the plan by 2.5 %. This revenue is down on 2014 by 60.1 % mainly due to lower insurance compensation (EUR 162,782) compared to that of 2014 (EUR 2,221,956), when it also included insurance compensation for the repair of ice damage in the amount of EUR 2,014,128. (The cost of material necessary for damage repair in 2015 amounted to EUR 171,697, the cost of services in dam-age repair EUR 191,553, cost of salaries EUR 204,819, and operating expenses from the revaluation of tangible fixed assets written off due to damage EUR 9,154). This item also includes reversal of provisions for fixed assets
14,324,151 / 20.6%
1,725,648 / 2.5%
145,345 / 0.2%1,317,814 / 1.9%
52,065,913 / 74.8 %
26,854 / 0.0%
SODO (lease, services, losses)
Capitalised own products and services
Revenue from sale of products and services
Other operating revenue
Finance income
Other income
Revenue in 2015
Total: EUR 69,605,725

ANNUAL REPORT
Elektro Celje2 0 1 5
68
10. OPERATION AND PERFORMANCE ANALYSIS
acquired free of charge and average costs of connection prior to July 1, 2007 (EUR 606,481), revenue from sale of decommissioned material, and the difference between the sales and carrying values in the sale of fixed assets (EUR 297,455), bonuses for exceeding the quota of persons with disabilities pursuant to the Vocational Rehabilitation and Employment of Persons with Disabilities Act (EUR 76,538), reversal of accruals and deferrals for EU grants (EUR 102,502), and other minor amounts.
Finance income, amounting to EUR 145,345, repre-sents 0.2 % of total revenue and exceeded the annual plan by EUR 56,145. It is down on 2014 by EUR 487,037 due to lower financial revenue from loans (interest on de-posits of banks dropped by EUR 86,390) and lower fi-
nancial revenue from shareholdings within the corporate group, in the amount of EUR 475,281. Finance income also includes late charges on overdue payments for net-work charges and services (EUR 135,685), interest on deposits (EUR 1,828), dividend (EUR 7,400) and other smaller amounts.
Other income from extraordinary operating ac-tivities amounted to EUR 26,854 in 2015. It was EUR 8,654 ahead of plan and EUR 9,526 higher relative to the year before. It included payments of costs of enforcement officers, court fees, and other received compensations (EUR 23,468), charged overdue payment letter costs, col-lected receivables previously written off, and other extraor-dinary items (EUR 3,386).
Company expenses in 2015 amounted to EUR 62,039,712, which is 0.2 % less than expected, and 3 % less than in the year before.
Operating expenses in the amount of EUR 60,894,104 represent 98.2 % of total expenses; they were 0.2 % down on the plan, and 2.7 % down on 2014.
Costs of purchase of electricity for covering losses amounted to EUR 4,925,127 in 2015, which is 2.2 % less than planned, and 6.3 % less than in 2014. In 2015, the total amount of distributed electricity was 1,928,787 MWh, which is 3.1 % ahead of plan and 3.2 % more than in 2014. Losses of electricity amounted to 95,857 MWh or 4.97 % of the quantity distributed, which represents less than 5.88 % of recognised losses as per the regulative framework of the Energy Agency. Losses of electricity were lower than in the previous year, when they amounted to 5.39 % of total distributed power.
Cost of material, amounting to EUR 9,668,911, repre-sents 15.6 % of total expenses. This is 11.7 % less com-pared to the annual plan, and 14.8 % down on 2014, due to lower costs of material for maintenance and damage repair.
Cost of services in the amount of EUR 6,732,642 rep-resents 10.9 % of total expenses. This is a 4.4 % increase over the plan and a 3.8 % increase over 2014, largely on account of EUR 477,838 higher costs of insurance pre-miums.
Labour costs in 2015 amounted to EUR 21,093,085, which is 34 % of total expenses. Labour costs were 7.1 % higher than planned and 6.4 % higher than in 2014. Costs of salaries amounted to EUR 14,974,458, which is 8.8 % more than planned and 3.1 % more than in the year before. In 2015, the average gross salary per employee per hours worked was EUR 1,980, which is 3.8 % more
Expenses in 2015
784,839 EUR / 1.3%
6,732,642 EUR/ 10.9%
17,689,500 EUR / 28.5%
1,082,192 EUR / 1.7%
9,668,911 EUR / 15.6%
21,093,085 EUR / 34.0%
4,925,127 EUR /7.9%
63,416 EUR / 0.1%
Cost of material
Cost of services
Labour costs
Amortisation and depreciation
Other operating expenses
Financial expenses
Other expenses
Purchase of electricity
Total: EUR 62,039,712

69
ANNUAL REPORT
Elektro Celje2 0 1 5
10. OPERATION AND PERFORMANCE ANALYSIS
than in 2014, or 127.3 % of the average gross salary per employee in the Republic of Slovenia. The cost of em-ployer contributions and other levies on salaries amounted to EUR 2,396,291, supplementary employee retirement insurance to EUR 694,363, other labour costs to EUR 3,027,973. Labour cost provisions, in compliance with the demand made by the trade union for the payment of balance of the 2015 holiday pay up to the amount defined under Art. 128 of the Collective Agreement for Slovenian Electricity Industry, amounted to EUR 588,821.
Depreciation and amortisation in the amount of EUR 17,689,500 represents 29 % of total expenses, and was 3.1 %, or EUR 560,500 below the plan, and 1.3 % down on 2014.
Other operating expenses amounted to EUR 784,839, which is 1.3 % of total expenses. The largest share thereof is represented by operating expenses re-lated to the revaluation fixed assets (EUR 255,756), fol-lowed by charges for the use of construction land (EUR 219,621), and operating expenses related to the revalua-tion of current assets (EUR 154,911).
Financial expenses in the amount of EUR 1,082,192 represent a 2 % share of total expenses. They include mostly interest paid on loans from banks (EUR 720,092), financial expenses from other financial liabilities (EUR 257,835), revaluation financial expenses related to finan-cial asset impairment and write-offs (EUR 103,508), and financial expenses from operating liabilities (EUR 757).
Other expenses from extraordinary operating activities amounted to EUR 63,416 in 2015. They in-clude compensations and indemnifications (EUR 36,981), annuities (EUR 16,317), humanitarian aid and donations (EUR 8,350), and other expenses (EUR 1,768).
Operating profit for the year 2015 amounts to EUR 8,539,422 (90 % ahead of plan and 12.4 % down on 2014). Adding the effect of finance income and expens-es, the operating profit from ordinary operating activities amounts to EUR 7,602,575; adding the effect of revenue and expenses from extraordinary operating activities, the total income/profit before tax amounts to EUR 7,566,013. After deducting the income tax and taking into account deferred taxes, the net profit of the company Elektro Celje stands at EUR 6,808,482, which is 106 % ahead of plan and 23 % down on the net profit for 2014.

ANNUAL REPORT
Elektro Celje2 0 1 5
70
10. OPERATION AND PERFORMANCE ANALYSIS
Assets Dec 31, 2015 Dec 31, 2014
Non-current assets 259,214,761 253,443,528
Intangible assets and long-term accrued revenue and deferred expenses 1,156,361 1,384,700
Tangible fixed assets - property, plant and equipment 243,904,942 239,718,420
Long-term financial investments 7,580,116 7,683,920
Long-term trade receivables 5,934,882 4,056,389
Deferred tax asset 638,460 600,099
Current assets 12,306,938 10,308,179
Inventory 1,380,529 1,392,747
Short-term trade receivables 10,902,286 8,808,684
Cash and cash equivalents 24,123 106,748
Short-term accrued revenue and deferred expenses 739,294 1,061,808
Total assets 272,260,993 264,813,515
10.1.2 Ownership and Financial Position
The value of company assets increased by 3 %. As of the end of the year, it amounted to EUR 272,260,993. Tangi-ble fixed assets (property, plant and equipment), amount-ing to EUR 243,904,942, which is EUR 4,186,522 more than the year before, represent 89.6 % of total assets. In-vestment in 2015 amounted to EUR 21,765,222. Among current assets, short-term trade receivables hold the larg-
est share (4 % of all assets). They were 23.8 % up on the previous year, mostly due to higher trade receivables from customers. The value of inventory as of December 31, 2015 was EUR 1,380,529, which is 0.9 % less than in 2014. Cash and cash equivalents decreased by EUR 82,625 compared to the year before.
Liabilities Dec 31, 2015 Dec 31, 2014
Equity 196,443,080 192,935,102
Provisions and long-term accrued expenses and deferred revenue 19,644,210 19,127,245
Non-current financial liabilities 33,550,207 36,669,343
Short-term financial liabilities 21,825,063 15,213,956
Short-term accrued expenses and deferred revenue 798,433 867,869
Total liabilities 272,260,993 264,813,515
in EUR
in EUR
50,000,000
100,000,000
150,000,000
200,000,000
250,000,000
300,000,000
in EUR
Dec 31, 2015 Dec 31, 2014
Short-term accrued revenue and deferred expenses
Cash and cash equivalents
Short-term trade receivables
Inventory
Deferred tax asset
Long-term trade receivables
Long-term financial investments
Tangible fixed assets - property, plant and equipment
Intangible assets and long-term accrued revenue and deferred expenses
Assets of Elektro Celje as of December 31, 2015 compared to the year before

71
ANNUAL REPORT
Elektro Celje2 0 1 5
10. OPERATION AND PERFORMANCE ANALYSIS
In 2015, to finance investments, Elektro Celje took out a loan with EIB in the amount of EUR 28,000,000 to be re-paid over a three-year period (2015–2017). The total bal-ance of investment loans as of December 31, 2015, stood at EUR 45,329,424.
Company equity amounted to EUR 196,443,080, which is 1.8 % more than the year before. In the composition of liabilities, equity represented 72.2 %. Provisions and ac-crued expenses and deferred revenue in the amount of EUR 19,644,210 were 2.7 % higher compared to 2014.
Short-term liabilities increased by 43.5 % relative to the year before, mainly on account of short-term financial lia-bilities due to banks. Company share capital is divided into 24,192,425 no-par value shares. Of these, 19,232,978 shares (79.50 %) are held by the Republic of Slovenia; 370,238 shares (1.53 %) are held by pension fund man-agement company Kapitalska družba and Modra Za-varovalnica insurance company; 3,907,939 shares (16.15 %) are held by other legal persons; and 681,270 shares (2.82 %) are held by natural persons.
The carrying value per share as of December 31, 2015, amounted to EUR 8.12.
Dec 31, 2015 Dec 31, 2014
50,000,000
100,000,000
150,000,000
200,000,000
250,000,000
in EUR
Short-term accrued expenses and deferred revenue
Short-term financial liabilities
Non-current financial liabilities
Provisions and long-term accrued expenses and deferred revenue
Equity
Liabilities of Elektro Celje as of December 31, 2015 compared to the year before
79.50 %
1.53 %
2.82 %
16.15 %
Republic of Slovenia
Kapitalska družba and Modra zavarovalnica
Investment companies and other legal persons
Natural persons
Ownership profile of the company Elektro Celje as of December 31, 2015

ANNUAL REPORT
Elektro Celje2 0 1 5
72
10. OPERATION AND PERFORMANCE ANALYSIS
10.1.3 Cash and Cash Equivalents
10.1.4 Performance Analysis for Elektro Celje, d.d.
in EUR
2015 2014
Operating cash flow
Revenue from operating activities 100,743,131 101,209,900
Expenses in operating activities -92,249,535 -88,755,029
Net cash provided by operating activities 8,493,596 12,454,871
Investing cash flow
Inflows from investing activities 328,599 4,740,350
Outflows from investing activities -7,551,884 -11,053,341
Net cash used in investing activities -7,223,285 -6,312,991
Financing cash flow
Inflows from financing activities 18,475,000 59,615,000
Outflows from financing activities -19,827,936 -65,702,680
Net cash used in financing activities -1,352,936 -6,087,680
Cash and cash equivalents in the period -82,625 54,200
Closing balance of cash and cash equivalents 24,123 106,748
The cash and cash equivalents of the company Elektro Celje decreased by EUR 82,625 in 2015, as the nega-tive cash flows from investing and financing activities ex-ceeded the positive cash flow provided by operating ac-tivities. The operating cash flow in 2015 amounted to EUR 8,493,596, which is EUR 3,961,275 less than in 2014, primarily due to higher expenses for purchase of mate-
rial and services, and higher charges. The financing cash flow registered a surplus of disbursements over revenues in the amount of EUR 7,223,285, and exceeded that of the year before by EUR 910,294. The negative financing cash flow in 2015 was most strongly influenced by repay-ments of non-current and short-term financial liabilities in the amount of EUR 15,970,567.
A. FINANCING INDICATORS
in EUR Dec 31, 2012
Dec 31, 2013
Dec 31, 2014
Plan 2015 Dec 31, 2015
Graphical comparison
Equity 184,435,940 186,467,766 192,935,102 189,408,357 196,443,080
Total liabilities 260,465,989 262,241,480 264,813,515 266,779,127 272,260,993
Equity to total liabilities ratio 70.81 % 71.11 % 72.86 % 71.00 % 72.15 %
Equity plus long-term debt (including provisions) and long-term accrued expenses and deferred revenue 240,229,890 240,239,554 248,731,690 247,437,155 249,637,497
Total liabilities 260,465,989 262,241,480 264,813,515 266,779,127 272,260,993
Long-term financing rate 92.23 % 91.61 % 93.93 % 92.75 % 91.69 %
* Selected indicators for SSH** The calculation of standardised network length is based on the information on the quantity of lines recorded in GIS.

73
ANNUAL REPORT
Elektro Celje2 0 1 5
10. OPERATION AND PERFORMANCE ANALYSIS
B. INVESTMENT INDICATORS
in EUR Dec 31, 2012
Dec 31, 2013
Dec 31, 2014
Plan 2015 Dec 31, 2015
Graphical comparison
Property, plant and equipment (carrying value)
228,713,008 235,023,848 239,718,420 240,429,741 243,904,942
Total assets 260,465,989 262,241,480 264,813,515 266,779,127 272,260,993
PP&E to total assets ratio 87.81 % 89.62 % 90.52 % 90.12 % 89.58 %
Fixed assets (PP&E) plus long-term accrued revenue and deferred expenses (carrying value), investment property, long-term financial investments and long-term trade receivables 239,352,342 244,433,306 252,843,429 249,445,939 258,576,301
Total assets 260,465,989 262,241,480 264,813,515 266,779,127 272,260,993
Long-term investment ratio 91.89 % 93.21 % 95.48 % 93.50 % 94.97 %
in EUR 2012 2013 2014 Plan 2015 2015 Graphical comparison
Actual investment 22,473,248 24,510,162 23,123,000 20,300,000 21,765,222
Planned investment 23,970,000 24,000,000 21,500,000 20,300,000 20,300,000
Investment realisation rate 93.76 % 102.13 % 107.55 % 100.00 % 107.22 %
Investing cash flow 22,473,248 24,510,162 23,123,000 20,300,000 21,765,222
Net revenue from sales 52,139,625 52,578,900 53,919,563 49,307,710 53,791,561
CAPEX to net revenue from sales ratio* 43.10 % 46.62 % 42.88 % 41.17 % 40.46 %
C. HORIZONTAL FINANCIAL STRUCTURE RATIOS
in EUR Dec 31, 2012
Dec 31, 2013
Dec 31, 2014
Plan 2015 Dec 31, 2015
Graphical comparison
Equity 184,435,940 186,467,766 192,935,102 189,408,357 196,443,080
Property, plant and equipment (carrying value)
228,713,008 235,023,848 239,718,420 240,429,741 243,904,942
Equity to fixed asset ratio 0.806 0.793 0.805 0.788 0.805
Liquid assets 375,985 52,548 106,748 383,188 24,123
Current liabilities 19,134,899 21,126,063 15,213,956 18,491,972 21,825,063
Liquid assets to short-term liabilities ratio 0.020 0.002 0.007 0.021 0.001
in EUR Dec 31, 2012
Dec 31, 2013
Dec 31, 2014
Plan 2015 Dec 31, 2015
Graphical comparison
Sum of liquid assets and short-term receivables 9,803,630 9,634,714 8,915,432 10,183,188 10,926,409
Current liabilities 19,134,899 21,126,063 15,213,956 18,491,972 21,825,063
Acid-test ratio 0.512 0.456 0.586 0.551 0.501
* Selected indicators for SSH** The calculation of standardised network length is based on the information on the quantity of lines recorded in GIS.

ANNUAL REPORT
Elektro Celje2 0 1 5
74
10. OPERATION AND PERFORMANCE ANALYSIS
D. ECONOMIC INDICATOR
in EUR 2012 2013 2014 Plan 2015 2015 Graphical comparison
Operating revenue 68,172,067 69,483,976 72,339,914 65,491,400 69,433,526
Operating expenses 60,973,483 61,681,895 62,590,484 60,995,500 60,894,104
Operating efficiency ratio 1.118 1.126 1.156 1.074 1.140
F. LABOUR PRODUCTIVITY INDICATOR
in EUR 2012 2013 2014 Plan 2015 2015 Graphical comparison
Gross value added 43,868,395 45,685,077 48,943,645 42,773,750 47,732,674
Number of employees per hours worked 632 623 635 632 633
Gross value added per employee* 69,412 73,331 77,077 67,680 75,407
E. PROFITABILITY INDICATORS
in EUR 2012 2013 2014 Plan 2015 2015 Graphical comparison
EBITDA 24,729,201 26,450,230 29,124,466 23,086,550 26,639,589
Gross operating profit 68,172,067 69,483,976 72,339,914 65,491,400 69,433,526
EBITDA margin* 36.27 % 38.07 % 40.26 % 35.25 % 38.37 %
EBIT 7,198,584 7,802,081 9,749,430 4,495,900 8,539,422
Gross operating profit 68,172,067 69,483,976 72,339,914 65,491,400 69,433,526
EBIT margin 10.56 % 11.23 % 13.48 % 6.86 % 12.30 %
Net income 7,486,250 5,580,713 8,841,612 3,301,300 6,808,482
Average equity (excl. net income from the year at hand) 178,177,513 182,661,497 185,280,628 186,635,992 191,284,850
Net return on equity (ROE) 4.20 % 3.06 % 4.77 % 1.77 % 3.56 %
Net income 7,486,250 5,580,713 8,841,612 3,301,300 6,808,482
Average assets 255,518,290 261,353,735 263,527,498 265,796,757 268,537,254
Return on assets (ROA)* 2.93 % 2.14 % 3.36 % 1.24 % 2.54 %
in EUR Dec 31, 2012
Dec 31, 2013
Dec 31, 2014
Plan 2015 Dec 31, 2015
Graphical comparison
Sum of dividends for the fiscal year 2,476,667 3,556,286 2,419,242 1,890,220 3,145,015
Average share capital 100,953,201 100,953,201 100,953,201 100,953,201 100,953,201
Dividend to share capital ratio 0.025 0.035 0.024 0.019 0.031
Dividend paid out in the year 2,476,667 3,556,286 2,419,242 1,890,220 3,145,015
Average equity 181,920,638 185,451,853 189,701,434 188,286,642 194,689,091
Dividend to equity ratio 1.36 % 1.92 % 1.28 % 1.00 % 1.62 %
* Selected indicators for SSH** The calculation of standardised network length is based on the information on the quantity of lines recorded in GIS.

75
ANNUAL REPORT
Elektro Celje2 0 1 5
10. OPERATION AND PERFORMANCE ANALYSIS
G. TECHNICAL INDICATORS
in EUR 2012 2013 2014 Plan 2015 2015 Graphical comparison
SAIDI (System Average Interruption Duration Index)*
44.35 36.86 29.71 30.81 27.40
SAIFI (System Average Interruption Frequency Index)*
1.10 0.88 0.79 0.77 0.70
MAIFI (Momentary Average Interruption Frequency Index)*
7.29 4.48 5.71 5.54 3.07
Losses (MWh) 111,114 106,722 100,613 98,000 95,857
Electricity distributed (MWh) 1,891,762 1,882,792 1,868,300 1,870,000 1,928,787
Losses to electricity distributed ratio* 0.059 0.057 0.054 0.052 0.050
Electricity supplied in the time interval (MW) 228 227 225 225 231
Peak power in the time interval (MW) 333 308 309 309 306
Load factor (LF) 0.69 0.74 0.73 0.73 0.75
Electricity distributed (MWh) 1,891,762 1,882,792 1,868,300 1,870,000 1,928,787
Standardised network length (km)** 598 605 585 611 599
Power distribution per standardised network length 3,163 3,112 3,194 3,061 3,220
Number of connection approvals issued by consumer category
- MV (1 - 35 kV) 36 20 24 27 33
- 0.4 kV measured power 168 143 132 191 158
- 0.4 kV without measured power 1,111 627 728 836 774
- households 1,811 1,251 1,449 1,668 1,704
in EUR 2012 2013 2014 Plan 2015 2015 Graphical comparison
Standardised network length (km)** 598 605 585 611 599
Number of employees 632 632 632 632 632
Standardised network length per employee 0.95 0.96 0.93 0.97 0.95
* Selected indicators for SSH** The calculation of standardised network length is based on the information on the quantity of lines recorded in GIS.

ANNUAL REPORT
Elektro Celje2 0 1 5
76
10. OPERATION AND PERFORMANCE ANALYSIS
H. TECHNICAL ECONOMIC INDICATORS OF REGULATED ACTIVITY
in EUR 2012 2013 2014 Plan 2015 2015 Graphical comparison
Operating expenses of regulated activity (in EUR) 44,398,080 44,928,481 45,993,267 44,604,903 45,067,062
Electricity distributed (MWh) 1,891,762 1,882,792 1,868,300 1,870,000 1,928,787
OPEX per electricity distributed* 23 24 25 24 23
Operating expenses of regulated activity (in EUR) 44,398,080 44,928,481 45,993,267 44,604,903 45,067,062
Standardised network length (km)** 598 605 585 611 599
OPEX per standardised network length 74,244 74,262 78,621 73,003 75,237
Investment in regulated activity (in EUR) 21,946,106 23,682,241 22,605,214 19,997,435 21,279,340
Electricity distributed (MWh) 1,891,762 1,882,792 1,868,300 1,870,000 1,928,787
Investment per electricity distributed 12 13 12 11 11
Labour costs of regulated activity (in EUR) 13,933,677 13,775,275 14,279,828 14,174,784 15,196,660
Number of customers 168,445 168,865 169,414 169,700 170,006
Labour costs per customer (in EUR) 83 82 84 84 89
Operating revenue of regulated activity (in EUR) 51,730,235 53,095,531 55,960,882 49,097,520 53,646,613
Electricity distributed (MWh) 1,891,762 1,882,792 1,868,300 1,870,000 1,928,787
Operating revenue per electricity distributed 27 28 30 26 28
* Selected indicators for SSH** The calculation of standardised network length is based on the information on the quantity of lines recorded in GIS.

77
ANNUAL REPORT
Elektro Celje2 0 1 5
10. OPERATION AND PERFORMANCE ANALYSIS
I. INDICATORS OF COMPLIANCE WITH BANK COMMITMENTS
in EUR 2012 2013 2014 Plan 2015 2015 Graphical comparison
Financial debt 45,133,159 45,444,466 42,881,872 50,267,943 45,387,489
Equity 184,435,940 186,467,766 192,935,102 189,408,357 196,443,080
Financial debt/Equity (EIB) 0.245 0.244 0.222 0.265 0.231
Financial debt 45,133,159 45,444,466 42,881,872 50,267,943 45,387,489
EBITDA 24,729,201 26,450,230 29,124,466 23,086,550 26,639,589
Financial debt/EBITDA (EIB) 1.825 1.718 1.472 2.177 1.704
EBITDA 24,729,201 26,450,230 29,124,466 23,086,550 26,639,589
Financial expenses from financial liabilities 937,123 1,056,699 1,280,888 1,143,300 977,927
EBITDA/Financial expenses from financial liabilities (EIB) 26 25 23 20 27
Current assets 19,885,517 14,880,473 10,308,179 14,533,188 12,306,938
Current liabilities 19,134,899 21,126,063 15,213,956 18,491,972 21,825,063
Current ratio (EIB) 1.039 0.704 0.678 0.786 0.564
Financial debt 45,133,159 45,444,466 42,881,872 50,267,943 45,387,489
Average equity 181,920,638 185,451,853 189,701,434 188,286,642 194,689,091
Financial debt/Equity (SID Bank) 0.248 0.245 0.226 0.267 0.233
Net financial debt 44,757,174 45,391,918 42,775,124 49,884,755 45,363,366
EBITDA 24,729,201 26,450,230 29,124,466 23,086,550 26,639,589
Net financial debt/EBITDA* 1.810 1.716 1.469 2.161 1.703
The financing indicators refer to the shares of equity, debt, and accruals and deferrals in the composition of total fi-nancial liabilities and are most important in long-term de-cisions about the financing policy. In 2015, the share of long-term financing in liabilities amounted to 91.7 %, the share of equity in liabilities to 72.2 %.
Investment indicators are particularly important in the decision-making process concerning investment projects. The values for 2015 are lower than those for 2014. The share of tangible fixed assets (PP&E) in total assets was 89.6 %, which is 1 percentage point less than in 2014. The reason for this is in the simultaneous increase in the value of fixed assets (by 1.7 %) and that of total assets (by 2.8 %). The share of total long-term assets in total value of assets was 95 %; actual investment amounted to 107.2 % of the annual plan.
The indicators of horizontal financial structure were ap-propriate. The equity to fixed asset ratio shows that as of December 31, 2015, 80.5 % of property, plant, and equip-ment was covered by equity, same as in 2014. The liquid
assets to short-term liabilities and the acid-test ratios cor-roborate the company’s financial solvency. The values of the two ratios decreased compared to 2014, mainly due to an increase in short-term financial liabilities and a delay in absorbing investment loans.
The operating efficiency ratio is the rate between operat-ing revenue and operating expenses. Its value for 2015 was 1.1, which is 6 % higher than planned and 1.4 % lower than in 2014.
The EBITDA margin (the rate between operating revenue and operating expenses minus depreciation) is an indica-tor of the company's operating profitability. In 2015, this indicator stood at 38.4 %. In 2015, ROA reached 2.5 %, ROE stood at 3.6 %, and dividend to share capital ratio was at 1.6 %. All these values exceed the plan for 2015.
Added value per employee in 2015 amounted to EUR 75,407, which is EUR 7,727 ahead of plan and EUR 1,670 less than in 2014, due to lower gross value added and lower average number of employees per hours worked.
* Selected indicators for SSH** The calculation of standardised network length is based on the information on the quantity of lines recorded in GIS.

ANNUAL REPORT
Elektro Celje2 0 1 5
78
10. OPERATION AND PERFORMANCE ANALYSIS
The SAIDI (System Average Interruption Duration Index), SAIFI (System Average Interruption Frequency Index) and MAIFI (Momentary Average Interruption Frequency Index) for the period January–December 2015 are lower (more favourable) than planned, and lower than in 2014. Data on the continuity of supply refer to interruptions due to own cause. The share of losses per unit of electricity distrib-uted in the period stood at 5.0 %, while recognised losses as per the Energy Agency regulatory framework amount to 5.88 %.
Indicators referring to regulated activity of the company Elektro Celje stand as follows: operating expenses per 1 MWh of distributed electricity amounted to EUR 23 or, measured per 1 km of standardised network length, EUR 75,237. Labour cost of regulated activity per customer amounted to EUR 89; operating revenue of regulated ac-tivity per unit of electricity distributed was 28 EUR/MWh.
The net financial debt to EBITDA ratio shows that the gross cash flow generated by Elektro Celje in 2015 would be sufficient to liquidate company’s total financial liabilities in 1.7 years. In 2014, that would have taken 1.5 years. As of the end of 2015, the current liabilities of the company exceeded its current assets, but in view of the delayed absorption of investment loans, that was more reasonable in terms of costs. The debt ratio in 2015 was 0.23.
Indicators referring to Elektro Celje’s commitment to the banks show that in 2015, the company maintained an ap-propriate financial position and fulfilled all its financial com-mitments to banks.
In the period January–December 2015, the performance of Elektro Celje, d.d., was successful. The net profit in the amount of EUR 6,808,482 claims an implementation rate of 206 percent against the annual plan and 77 percent against the 2014 overall result.
10.2 Performance Analysis of Elektro Celje Group
10.2.1 Net IncomeIn 2015, the Elektro Celje Group generated a net in-come/profit in the amount of EUR 10,233,231
which is EUR 5,760,991 ahead of plan, and EUR 500,708 down on the net profit for 2014.
Income statement summary
Amount in EUR Index
Actual in 2015
Plannedfor 2015
Actual in 2014
Actual 2015 /Planned
2015
Actual 2015 /Actual 2014
1. Operating revenue 179,625,613 157,249,368 158,913,110 114 113
2. Operating expenses 167,397,650 151,583,675 146,538,878 110 114
3. Operating profit (1-2) 12,227,963 5,665,693 12,374,232 216 99
4. Finance income 346,514 248,579 294,983 139 117
5. Financial expenses 1,103,061 1,186,400 1,307,696 93 84
6. Profit from ordinary operating activities (3+4-5)
11,471,416 4,727,872 11,361,519 243 101
7. Other income 165,497 138,200 145,605 120 114
8. Other expenses 107,209 55,200 87,859 194 122
9. Profit from extraordinary operating activities (7-8)
58,288 83,000 57,746 70 101
10. Total profit (6+9) 11,529,704 4,810,872 11,419,265 240 101
11. Income tax 1,114,450 338,632 1,369,444 329 81
12. Deferred taxes 182,023 0 684,118 0 27
13. Net income/profit (10-11+12) 10,233,231 4,472,240 10,733,939 229 95
Net income/profit of majority shareholders
9,597,207 4,472,240 0 215 0
Net income/profit of minority shareholders
636,024 0 0 0 0
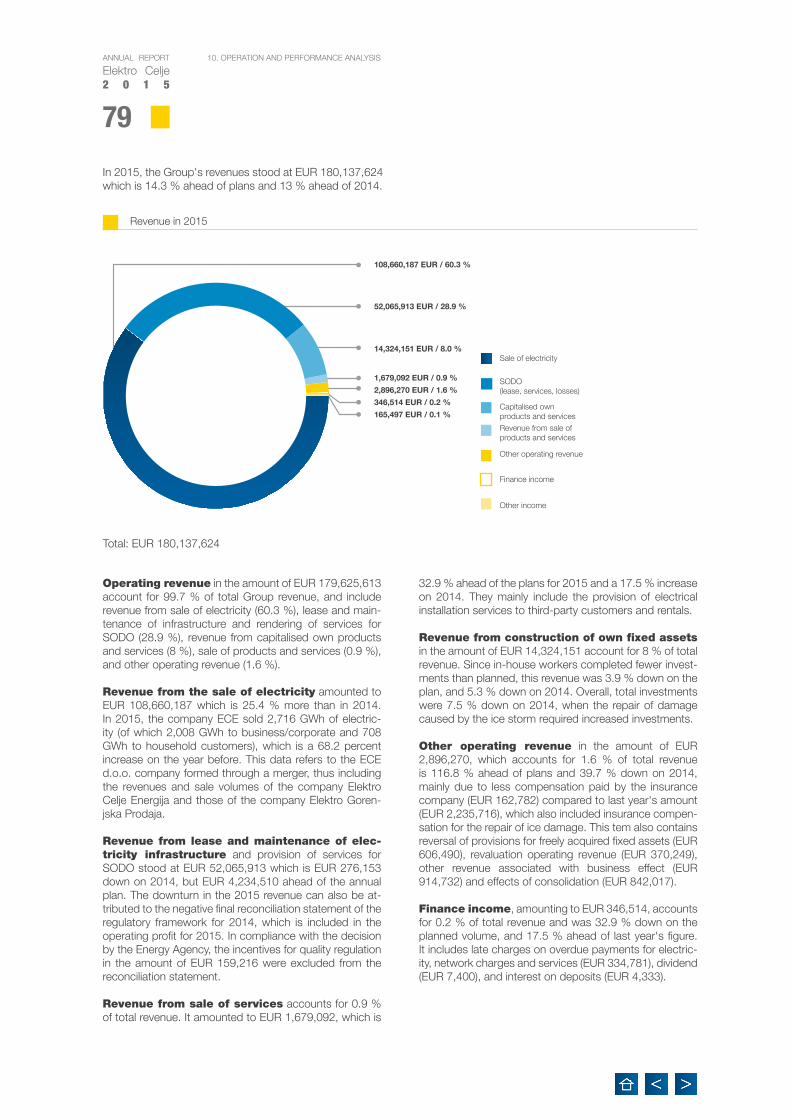
79
ANNUAL REPORT
Elektro Celje2 0 1 5
10. OPERATION AND PERFORMANCE ANALYSIS
In 2015, the Group's revenues stood at EUR 180,137,624 which is 14.3 % ahead of plans and 13 % ahead of 2014.
Operating revenue in the amount of EUR 179,625,613 account for 99.7 % of total Group revenue, and include revenue from sale of electricity (60.3 %), lease and main-tenance of infrastructure and rendering of services for SODO (28.9 %), revenue from capitalised own products and services (8 %), sale of products and services (0.9 %), and other operating revenue (1.6 %).
Revenue from the sale of electricity amounted to EUR 108,660,187 which is 25.4 % more than in 2014. In 2015, the company ECE sold 2,716 GWh of electric-ity (of which 2,008 GWh to business/corporate and 708 GWh to household customers), which is a 68.2 percent increase on the year before. This data refers to the ECE d.o.o. company formed through a merger, thus including the revenues and sale volumes of the company Elektro Celje Energija and those of the company Elektro Goren-jska Prodaja.
Revenue from lease and maintenance of elec-tricity infrastructure and provision of services for SODO stood at EUR 52,065,913 which is EUR 276,153 down on 2014, but EUR 4,234,510 ahead of the annual plan. The downturn in the 2015 revenue can also be at-tributed to the negative final reconciliation statement of the regulatory framework for 2014, which is included in the operating profit for 2015. In compliance with the decision by the Energy Agency, the incentives for quality regulation in the amount of EUR 159,216 were excluded from the reconciliation statement.
Revenue from sale of services accounts for 0.9 % of total revenue. It amounted to EUR 1,679,092, which is
32.9 % ahead of the plans for 2015 and a 17.5 % increase on 2014. They mainly include the provision of electrical installation services to third-party customers and rentals.
Revenue from construction of own fixed assets in the amount of EUR 14,324,151 account for 8 % of total revenue. Since in-house workers completed fewer invest-ments than planned, this revenue was 3.9 % down on the plan, and 5.3 % down on 2014. Overall, total investments were 7.5 % down on 2014, when the repair of damage caused by the ice storm required increased investments.
Other operating revenue in the amount of EUR 2,896,270, which accounts for 1.6 % of total revenue is 116.8 % ahead of plans and 39.7 % down on 2014, mainly due to less compensation paid by the insurance company (EUR 162,782) compared to last year's amount (EUR 2,235,716), which also included insurance compen-sation for the repair of ice damage. This tem also contains reversal of provisions for freely acquired fixed assets (EUR 606,490), revaluation operating revenue (EUR 370,249), other revenue associated with business effect (EUR 914,732) and effects of consolidation (EUR 842,017).
Finance income, amounting to EUR 346,514, accounts for 0.2 % of total revenue and was 32.9 % down on the planned volume, and 17.5 % ahead of last year's figure. It includes late charges on overdue payments for electric-ity, network charges and services (EUR 334,781), dividend (EUR 7,400), and interest on deposits (EUR 4,333).
108,660,187 EUR / 60.3 %
SODO (lease, services, losses)
Capitalised own products and servicesRevenue from sale of products and services
Other operating revenue
Finance income
Other income
Revenue in 2015
52,065,913 EUR / 28.9 %
14,324,151 EUR / 8.0 %
1,679,092 EUR / 0.9 %
2,896,270 EUR / 1.6 %
346,514 EUR / 0.2 %
165,497 EUR / 0.1 %
Sale of electricity
Total: EUR 180,137,624

ANNUAL REPORT
Elektro Celje2 0 1 5
80
10. OPERATION AND PERFORMANCE ANALYSIS
Other income from extraordinary operating ac-tivities amounted to EUR 165,497 in 2015, which is EUR 19,653 down on the plan and EUR 19,892 higher than the year before. It included payments of penalties and damages (EUR 53,318), collected receivables pre-viously written-off (EUR 12,732 EUR), and other income from extraordinary operating activities (EUR 99,447).
The Group's expenses in 2015 amounted to EUR 168,607,920, which is 9 % less than planned and 14 % more than in 2014.
Operating expenses in the amount of EUR 167,397,650, which accounts for 99.2 % of total expens-es, were down by 9 % relative to plan and up by 14.2 % relative to 2014.
Costs of electricity purchased, accounting for 62 % of total expenses, stood at EUR 104,630,345 (of which EUR 876,352 represents the cost of wood pellets and EUR 3,052,231 the cost of natural gas). This is 14.9 % more than planned and 25.4 % more than the year before. The costs incurred by subsidiary ECE for the purchase of 2,716 GWh of electricity amounted to EUR 100,701,762, and are broken down by suppliers as follows: HSE (EUR 83,667,782), Elektro Energija (EUR 5,984,601), GEN En-ergija (EUR 2,606,465), InterEnergo (EUR 2,522,883), other suppliers (EUR 5,920,031).
Costs of material in the amount of EUR 9,620,625 ac-count for 5.7 % of total expenses. This is 12.9 % more than planned and 15.1 % less than in 2014 due to lower cost of material for maintenance and damage repair.
Cost of services, amounting to EUR 10,040,032, ac-count for 5.9 % of total expenses. They were 21.7 % higher than planned and 9 % higher than in 2014, mainly due to higher insurance premium costs in the amount of EUR 483,384.
In 2015, labour cost in the amount of EUR 23.094.512 accounted for 14 % of total expenses. They were 8 % above the plan and above the 2014 figure. Cost of sala-ries amounting to EUR 16,481,894 were 10 % above the plan and 5.3 % above the 2014 figure. The cost of em-ployer contributions and other levies on salaries stood at
EUR 2,639,158, cost of supplementary employee retire-ment insurance was EUR 749,645, and other labour cost amounted to EUR 3,223,815.
Amortisation and depreciation in the amount of EUR 18,069,944 accounts for 11 % of total expenses. It was 2.8 % (EUR 522,645) down on the planned volume and 1 % down on 2014's figure.
Other operating expenses in the amount of EUR 1,942,192 represent 1.2 % of total expenses, with operat-ing expenses from revaluation (EUR 1,287,895) account-ing for the largest portion.
Financial expenses in the amount of EUR 1,103,061 account for 0.7 % of total expenses and mainly pertain to interest on bank loans (EUR 727,722), which were 34.9 % down on 2014, financial expenses from other financial liabilities (EUR 257,835), revaluation financial expenses related to financial asset impairment and write-offs (EUR 103,508), and EUR 13,996 in financial expenses from op-erating liabilities.
In 2015, other expenses from extraordinary op-erating activities amount to EUR 107,209 and include compensation and rent payments (EUR 53,298), penalties imposed payable in cash (EUR 750) and other expenses (EUR 53,161).
Expenses in 2015
9,620,625 EUR / 5.7 %
18,069,944 EUR/ 10.7 %
104,630,345 EUR / 62.0 %
10,040,032 EUR / 5.9 %
1,942,192 EUR / 1.2 %
23,094,512 EUR / 13.7 %
Purchase of electricity
Cost of material
Cost of services
Labour costs
Amortisation and depreciation
Other operating expenses
Financial expenses
Other expenses
1,103,061 EUR / 0.7 %
107,209 EUR / 0.1 %
Total: EUR 168,607,920
81
ANNUAL REPORT
Elektro Celje2 0 1 5
10. OPERATION AND PERFORMANCE ANALYSIS
Operating profit for the year 2015 amounts to EUR 12,227,963 (115.8 % ahead of plan and 1.2 % down on 2014). Adding the effect of finance income and expenses, the operating profit from regular activities amounts to EUR 11,471,416; adding the effect of revenue and expenses from extraordinary activities, the total profit before tax
stands at EUR 11,529,704. After deducting the corpo-rate income tax and taking into account deferred taxes, the net profit of the Elektro Celje Group amounts to EUR 10,233,231. The index of actual overall profit is at 229 relative to the annual plan, and 95 compared to the results in 2014.

ANNUAL REPORT
Elektro Celje2 0 1 5
82
10. OPERATION AND PERFORMANCE ANALYSIS
10.2.2 Financial Position
The value of the Elektro Celje Group assets increased by 9.3 % and as of the end of 2015 amounted to EUR 312,244,544. Tangible fixed assets in the amount of EUR 246,489,479, which is EUR 4,235,503 more than the year before, account for 78.6 % of total assets. Investments in 2015 amounted to EUR 21,923,723. Among current as-sets, short-term trade receivables hold the largest share
(16 % of all assets); they increased by 61.2 % on the year before, mainly due to higher trade receivables from cus-tomers. As of December 31, 2015, the value of inventory amounted to EUR 1,426,577, which is similar to 2014, while the Elektro Celje Group's cash and cash equivalents decreased by EUR 146,680 on the year before.
Liabilities Dec 31, 2015 Dec 31, 2014
Equity 207,638,928 196,839,551
Provisions and long-term accrued expenses and deferred revenue 20,206,307 19,457,685
Non-current financial liabilities 33,632,922 36,770,278
Short-term financial liabilities 48,742,355 30,519,657
Short-term accrued expenses and deferred revenue 2,024,032 2,126,241
Total liabilities 312,244,544 285,713,412
in EUR
in EUR
Assets Dec 31, 2015 Dec 31, 2014
Non-current assets 257,668,990 249,934,024
Intangible assets and long-term accrued revenue and deferred expenses 1,787,304 1,670,260
Tangible fixed assets - property, plant and equipment 246,489,479 242,253,976
Investment property 321,318 298,773
Long-term financial investments 684,777 436,944
Long-term trade receivables 6,928,016 4,170,788
Deferred tax asset 1,458,096 1,103,283
Current assets 54,096,194 34,940,768
Assets held for sale 51,628 0
Inventory 1,426,577 1,451,015
Short-term trade receivables 50,761,120 31,486,204
Cash and cash equivalents 1,856,869 2,003,549
Short-term accrued revenue and deferred expenses 479,360 838,620
Total assets 312,244,544 285,713,412
50,000,000
100,000,000
150,000,000
200,000,000
250,000,000
300,000,000
in EUR
Dec 31, 2015 Dec 31, 2014
Short-term accrued revenue and deferred expenses
Cash and cash equivalents
Short-term trade receivables
Inventory
Assets held for sale
Deferred tax asset
Long-term trade receivables
Long-term financial investments
Investment property
Intangible assets and long-term accrued revenue and deferred expenses
Tangible fixed assets - property, plant and equipment
Assets of Elektro Celje Group as of December 31, 2015 compared to the year before
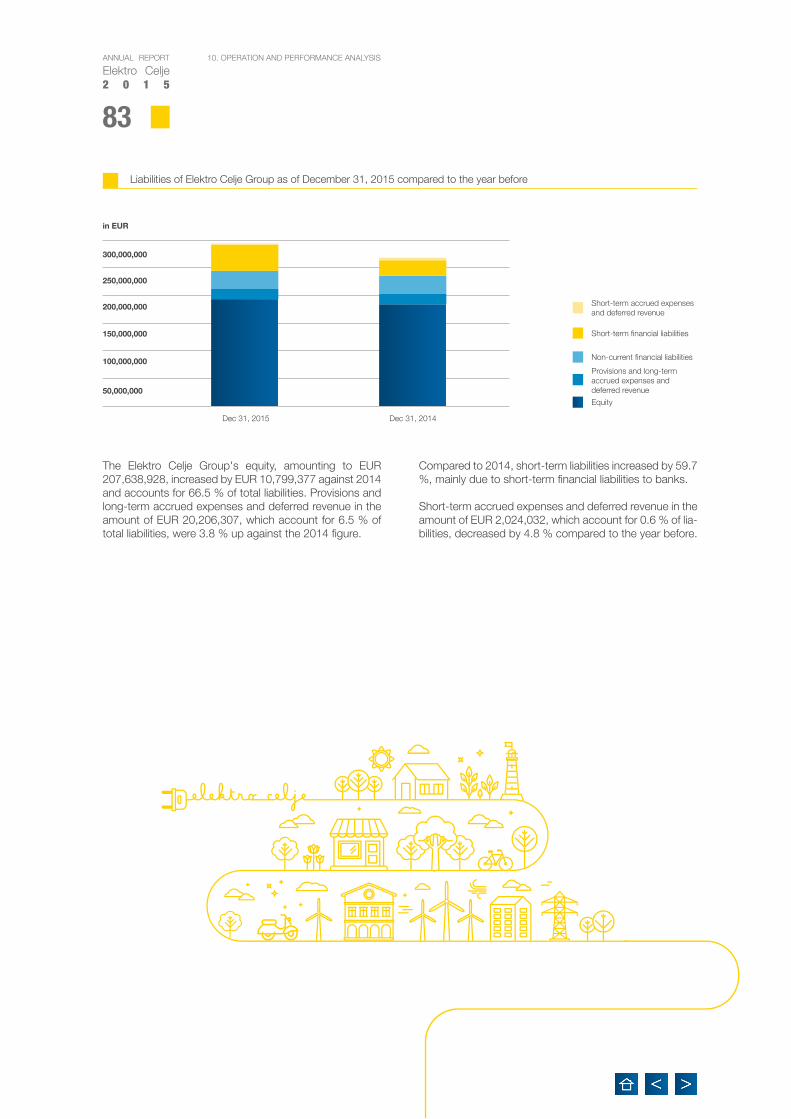
83
ANNUAL REPORT
Elektro Celje2 0 1 5
10. OPERATION AND PERFORMANCE ANALYSIS
The Elektro Celje Group's equity, amounting to EUR 207,638,928, increased by EUR 10,799,377 against 2014 and accounts for 66.5 % of total liabilities. Provisions and long-term accrued expenses and deferred revenue in the amount of EUR 20,206,307, which account for 6.5 % of total liabilities, were 3.8 % up against the 2014 figure.
Compared to 2014, short-term liabilities increased by 59.7 %, mainly due to short-term financial liabilities to banks.
Short-term accrued expenses and deferred revenue in the amount of EUR 2,024,032, which account for 0.6 % of lia-bilities, decreased by 4.8 % compared to the year before.
Dec 31, 2015 Dec 31, 2014
50,000,000
100,000,000
150,000,000
200,000,000
250,000,000
in EUR
Short-term accrued expenses and deferred revenue
Short-term financial liabilities
Non-current financial liabilities
Provisions and long-term accrued expenses and deferred revenue
Equity
Liabilities of Elektro Celje Group as of December 31, 2015 compared to the year before
300,000,000

ANNUAL REPORT
Elektro Celje2 0 1 5
84
10. OPERATION AND PERFORMANCE ANALYSIS
10.2.3 Cash and Cash EquivalentsIn 2015, the cash and cash equivalents of Elektro Celje Group decreased by EUR 500,404, as the negative cash flow from investing activities exceeded the positive cash flows from operating and financing activities. Operat-ing cash flow in the amount of EUR 6,513,424 was EUR 10,218,730 down on 2014, mainly due to higher expendi-ture for purchase of material and services, and higher du-
ties. Investing cash flow, recording a surplus of outflows over inflows in the amount of EUR 7,616,788, is 4.6 % down on the year before. The negative cash flow in fi-nancing activities can mainly be attributed to the payment of non-current and short-term financial liabilities in the amount of EUR 36,485,172.
10.2.4 Elektro Celje Group Performance Indicators
in EUR
2015 2014
Operating cash flow
Revenue from operating activities 356,512,724 265,540,976
Expenses in operating activities -349,999,300 -248,808,822
Net cash provided by operating activities 6,513,424 16,732,154
Investing cash flow
Inflows from investing activities 758,336 3,612,810
Outflows from investing activities -8,375,124 -11,595,597
Net cash used in investing activities -7,616,788 -7,982,787
Financing cash flow
Inflows from financing activities 40,955,055 73,145,117
Outflows from financing activities -40,352,095 -80,580,705
Net cash used in financing activities 602,960 -7,435,588
Cash and cash equivalents in the period -500,404 1,313,779
Closing balance of cash and cash equivalents 1,856,869 2,003,549
A. FINANCING INDICATORS
in EUR Dec 31, 2012
Dec 31, 2013
Dec 31, 2014
Plan 2015 Dec 31, 2015
Graphical comparison
Equity 185,388,091 188,478,584 196,839,551 193,642,044 207,638,928
Total liabilities 277,757,706 283,699,999 285,713,412 287,101,532 312,244,544
Equity to total liabilities ratio 66.74 % 66.44 % 68.89 % 67.45 % 66.50 %
Equity plus long-term debt (including provisions) and long-term accrued expenses and deferred revenue 241,552,824 242,709,424 253,067,514 252,081,842 261,478,157
Total liabilities 277,757,706 283,699,999 285,713,412 287,101,532 312,244,544
Long-term financing rate 86.97 % 85.55 % 88.57 % 87.80 % 83.74 %
* Selected indicators for SSH.** The calculation of standardised network length is based on the information on the quantity of lines recorded in GIS.The technical indicators and technical economic indicators of regulated activity are calculated for the company Elektro Celje.

85
ANNUAL REPORT
Elektro Celje2 0 1 5
10. OPERATION AND PERFORMANCE ANALYSIS
C. HORIZONTAL FINANCIAL STRUCTURE RATIOS
in EUR Dec 31, 2012
Dec 31, 2013
Dec 31, 2014
Plan 2015 Dec 31, 2015
Graphical comparison
Equity 185,388,091 188,478,584 196,839,551 193,642,044 207,638,928
Property, plant and equipment (carrying value)
230,975,080 237,388,266 242,253,976 243,021,703 246,489,479
Equity to fixed asset ratio 0.803 0.794 0.813 0.797 0.842
Liquid assets 829,014 689,770 2,003,549 614,854 1,856,869
Current liabilities 34,656,529 39,641,102 30,519,657 33,754,368 48,742,355
Liquid assets to short-term liabilities ratio 0.024 0.017 0.066 0.018 0.038
in EUR Dec 31, 2012
Dec 31, 2013
Dec 31, 2014
Plan 2015 Dec 31, 2015
Graphical comparison
Sum of liquid assets and short-term receivables 33,014,797 34,917,881 33,489,753 34,057,848 52,617,989
Current liabilities 34,656,529 39,641,102 30,519,657 33,754,368 48,742,355
Acid-test ratio 0.953 0.881 1.097 1.009 1.080
B. INVESTMENT INDICATORS
in EUR Dec 31, 2012
Dec 31, 2013
Dec 31, 2014
Plan 2015 Dec 31, 2015
Graphical comparison
Property, plant and equipment (carrying value)
230,975,080 237,388,266 242,253,976 243,021,703 246,489,479
Total assets 277,757,706 283,699,999 285,713,412 287,101,532 312,244,544
PP&E to total assets ratio 83.16 % 83.68 % 84.79 % 84.65 % 78.94 %
Fixed assets (PP&E) plus long-term accrued revenue and deferred expenses (carrying value), investment property, long-term financial investments and long-term trade receivables 235,196,264 240,536,790 248,830,741 245,960,769 256,210,894
Total assets 277,757,706 283,699,999 285,713,412 287,101,532 312,244,544
Long-term investment ratio 84.68 % 84.79 % 87.09 % 85.67 % 82.05 %
in EUR 2012 2013 2014 Plan 2015 2015 Graphical comparison
Actual investment 22,584,328 24,914,164 23,689,059 20,800,000 21,923,723
Planned investment 24,279,000 25,352,013 22,270,000 20,800,000 20,800,000
Investment realisation rate 93.02 % 98.27 % 106.37 % 100.00 % 105.40 %
Investing cash flow 22,584,328 24,914,164 23,689,059 20,800,000 21,923,723
Net revenue from sales 145,793,897 156,542,174 140,389,018 141,015,678 162,405,192
CAPEX to net revenue from sales ratio* 15.49 % 15.92 % 16.87 % 14.75 % 13.50 %
* Selected indicators for SSH.** The calculation of standardised network length is based on the information on the quantity of lines recorded in GIS.The technical indicators and technical economic indicators of regulated activity are calculated for the company Elektro Celje.

ANNUAL REPORT
Elektro Celje2 0 1 5
86
10. OPERATION AND PERFORMANCE ANALYSIS
D. ECONOMIC INDICATOR
in EUR 2012 2013 2014 Plan 2015 2015 Graphical comparison
Operating revenue 161,840,238 173,555,129 158,913,110 157,249,368 179,625,613
Operating expenses 154,250,339 164,787,635 146,538,878 151,583,675 167,397,650
Operating efficiency ratio 1.049 1.053 1.084 1.037 1.073
F. LABOUR PRODUCTIVITY INDICATOR
in EUR 2012 2013 2014 Plan 2015 2015 Graphical comparison
Gross value added 46,746,047 48,783,276 54,553,794 46,592,132 54,680,314
Number of employees per hours worked 678 669 683 680 689
Gross value added per employee* 68,947 72,920 79,874 68,518 79,362
E. PROFITABILITY INDICATORS
in EUR 2012 2013 2014 Plan 2015 2015 Graphical comparison
EBITDA 26,092,087 28,098,431 33,171,383 25,198,932 31,585,802
Gross operating profit 161,840,238 173,555,129 158,913,110 157,249,368 179,625,613
EBITDA margin* 16.12 % 16.19 % 20.87 % 16.02 % 17.58 %
EBIT 7,589,899 8,767,494 12,374,232 5,665,693 12,227,963
Gross operating profit 161,840,238 173,555,129 158,913,110 157,249,368 179,625,613
EBIT margin 4.69 % 5.05 % 7.79 % 3.60 % 6.81 %
Net income 6,905,850 6,639,381 10,733,939 4,472,240 10,233,231
Average equity (excl. net income from the year at hand) 179,710,064 183,613,647 187,292,098 189,473,994 197,122,624
Net return on equity (ROE) 3.84 % 3.62 % 5.73 % 2.36 % 5.19 %
Net income 6,905,850 6,639,381 10,733,939 4,472,240 10,233,231
Average assets 273,076,180 280,728,853 284,706,706 285,793,188 298,978,978
Return on assets (ROA)* 2.53 % 2.37 % 3.77 % 1.56 % 3.42 %
in EUR Dec 31, 2012
Dec 31, 2013
Dec 31, 2014
Plan 2015 Dec 31, 2015
Graphical comparison
Sum of dividends for the fiscal year 2,476,667 3,556,286 2,419,242 1,890,220 3,145,015
Average share capital 100,953,201 100,953,201 100,953,201 100,953,201 100,953,201
Dividend to share capital ratio 0.025 0.035 0.024 0.019 0.031
Dividend paid out in the year 2,476,667 3,556,286 2,419,242 1,890,220 3,145,015
Average equity 183,162,989 186,933,338 192,659,068 191,710,114 202,239,240
Dividend to equity ratio 1.35 % 1.90 % 1.26 % 0.99 % 1.56 %
* Selected indicators for SSH.** The calculation of standardised network length is based on the information on the quantity of lines recorded in GIS.The technical indicators and technical economic indicators of regulated activity are calculated for the company Elektro Celje.

87
ANNUAL REPORT
Elektro Celje2 0 1 5
10. OPERATION AND PERFORMANCE ANALYSIS
G. TECHNICAL INDICATORS
in EUR 2012 2013 2014 Plan 2015 2015 Graphical comparison
SAIDI (System Average Interruption Duration Index, calculated at an annual level)*
44.35 36.86 29.71 30.81 27.40
SAIFI (System Average Interruption Frequency Index, calculated at an annual level)*
1.10 0.88 0.79 0.77 0.70
MAIFI (Momentary Average Interruption Frequency Index, calculated at an annual level)*
7.29 4.48 5.71 5.54 3.07
Losses (MWh) 111,114 106,722 100,613 98,000 95,857
Electricity distributed (MWh) 1,891,762 1,882,792 1,868,300 1,870,000 1,928,787
Losses to electricity distributed ratio* 0.059 0.057 0.054 0.052 0.050
Electricity supplied in the time interval (MW) 228 227 225 225 231
Peak power in the time interval (MW) 333 308 309 309 306
Load factor (LF) 0.69 0.74 0.73 0.73 0.75
Electricity distributed (MWh) 1,891,762 1,882,792 1,868,300 1,870,000 1,928,787
Standardised network length (km)** 598 605 585 611 599
Power distribution per standardised network length 3,163 3,112 3,194 3,061 3,220
Number of connection approvals issued by consumer category
- MV (1 - 35 kV) 36 20 24 27 33
- 0.4 kV measured power 168 143 132 191 158
- 0.4 kV without measured power 1,111 627 728 836 774
- households 1,811 1,251 1,449 1,668 1,704
in EUR 2012 2013 2014 Plan 2015 2015 Graphical comparison
Standardised network length (km)** 598 605 585 611 599
Number of employees 632 632 632 632 632
Standardised network length per employee 0.95 0.96 0.93 0.97 0.95
* Selected indicators for SSH.** The calculation of standardised network length is based on the information on the quantity of lines recorded in GIS.The technical indicators and technical economic indicators of regulated activity are calculated for the company Elektro Celje.

ANNUAL REPORT
Elektro Celje2 0 1 5
88
10. OPERATION AND PERFORMANCE ANALYSIS
H. TECHNICAL ECONOMIC INDICATORS OF REGULATED ACTIVITY
in EUR 2012 2013 2014 Plan 2015 2015 Graphical comparison
Operating expenses of regulated activity (in EUR) 44,398,080 44,928,481 45,993,267 44,604,903 45,067,062
Electricity distributed (MWh) 598 605 585 611 599
OPEX per electricity distributed* 74,244 74,262 78,621 73,003 75,237
Operating expenses of regulated activity (in EUR) 44,398,080 44,928,481 45,993,267 44,604,903 45,067,062
Standardised network length (km)** 598 605 585 611 599
OPEX per standardised network length 74,244 74,262 78,621 73,003 75,237
Investment in regulated activity (in EUR) 21,946,106 23,682,241 22,605,214 19,997,435 21,279,340
Electricity distributed (MWh) 1,891,762 1,882,792 1,868,300 1,870,000 1,928,787
Investment per electricity distributed 12 13 12 11 11
Labour costs of regulated activity (in EUR) 13,933,677 13,775,275 14,279,828 14,174,784 15,196,660
Number of customers 168,445 168,865 169,414 169,700 170,006
Labour costs per customer (in EUR) 83 82 84 84 89
Operating revenue of regulated activity (in EUR) 51,730,235 53,095,531 55,960,882 49,097,520 53,646,613
Electricity distributed (MWh) 1,891,762 1,882,792 1,868,300 1,870,000 1,928,787
Operating revenue per electricity distributed 27 28 30 26 28
* Selected indicators for SSH.** The calculation of standardised network length is based on the information on the quantity of lines recorded in GIS.The technical indicators and technical economic indicators of regulated activity are calculated for the company Elektro Celje.

89
ANNUAL REPORT
Elektro Celje2 0 1 5
10. OPERATION AND PERFORMANCE ANALYSIS
I. INDICATORS OF COMPLIANCE WITH BANK COMMITMENTS
in EUR 2012 2013 2014 Plan 2015 2015 Graphical comparison
Financial debt 46,114,492 46,914,613 43,017,780 50,868,943 47,488,684
Equity 185,388,091 188,478,584 196,839,551 193,642,044 207,638,928
Financial debt/Equity (EIB) 0.249 0.249 0.219 0.263 0.229
Financial debt 46,114,492 46,914,613 43,017,780 50,868,943 47,488,684
EBITDA 26,092,087 28,098,431 33,171,383 25,198,932 31,585,802
Financial debt/EBITDA (EIB) 1.767 1.670 1.297 2.019 1.503
EBITDA 26,092,087 28,098,431 33,171,383 25,198,932 31,585,802
Financial expenses from financial liabilities 955,536 1,057,952 1,305,291 1,184,400 985,557
EBITDA/Financial expenses from financial liabilities (EIB) 27 27 25 21 32
Current assets 40,727,972 39,543,384 34,940,768 38,458,912 54,096,194
Current liabilities 34,656,529 39,641,102 30,519,657 33,754,368 48,742,355
Current ratio (EIB) 1.175 0.998 1.145 1.139 1.110
Financial debt 46,114,492 46,914,613 43,017,780 50,868,943 47,488,684
Average equity 183,162,989 186,933,338 192,659,068 191,710,114 202,239,240
Financial debt/Equity (SID Bank) 0.252 0.251 0.223 0.265 0.235
Net financial debt 45,285,478 46,224,843 41,014,231 50,254,089 45,631,815
EBITDA 26,092,087 28,098,431 33,171,383 25,198,932 31,585,802
Net financial debt/EBITDA* 1.736 1.645 1.236 1.994 1.445
Financing indicators as of December31, 2015 point to an appropriate structure of long-term asset financing with long-term liabilities. Long-term financing in liabilities amounted to 83.7 %, while equity in liabilities accounted for 66.5 %.
In 2015, investment indicators recorded a downturn on 2014. The share of tangible fixed assets in total assets was 78.9 %, which is 6 percentage points less than in 2014, the reason being the simultaneous increase of value of fixed assets (by 1.7 %) and that of total assets (by 9.3 %). Total long-term assets accounted for 82 % of total assets; actual investment amounted to 105.4 % of the an-nual plan.
The indicators of horizontal financial structure were appro-priate. As of December 31, 2015, equity to fixed asset ra-tio of the Elektro Celje Group amounted to 84.2 %, which is ahead of the year before. The liquid assets to short-term liabilities and acid-test ratios indicate the company's
solvency. The values of the two ratios are both down on 2014, mainly due to increased short-term financial liabili-ties and a delay in absorbing investment loans.Operating efficiency ratio stood at 1.1, which is 3 % ahead of the plan and 1.5 % lower than the year before.
The EBITDA margin, which is a benchmark for business performance and profitability, amounted to 17.6 % in 2015. ROA stood at 3.4 %, ROE at 5.2 %, and dividend to equity ratio was 1.6 %. All these values are higher than planned for 2015.
In 2015, value added per employee amounted to EUR 79,362, which is EUR 10,844 ahead of plan and EUR 512 down on 2014, mainly due to a higher average number of employees per hours worked.
The technical and technical economic indicators of regu-lated activity are calculated for the company Elektro Celje and described in section 10.1.4.
* Selected indicators for SSH.** The calculation of standardised network length is based on the information on the quantity of lines recorded in GIS.The technical indicators and technical economic indicators of regulated activity are calculated for the company Elektro Celje.

ANNUAL REPORT
Elektro Celje2 0 1 5
90
10. OPERATION AND PERFORMANCE ANALYSIS
Indicators of compliance with bank commitments corrob-orate that the Group maintained an appropriate financial position and fulfilled all its commitments to banks. The net financial debt to EBITDA ratio shows that the gross cash flow generated in 2015 would allow the Group to pay all its financial liabilities in 1.4 years. As of the end of 2015, cur-rent assets exceeded current liabilities. The financial debt to equity ratio amounted to 0.23.
The performance of Elektro Celje Group in the period from January to December 2015 was successful. The net profit in the amount of EUR 10,233,231 claims an implementa-tion rate of 229 percent against the annual plan and 95 percent against the 2014 overall result.

91
ANNUAL REPORT
Elektro Celje2 0 1 5

ANNUAL REPORT
Elektro Celje2 0 1 5
92
11. RISK MANAGEMENT
11. RISK MANAGEMENT11.1 Risk Management at Elektro CeljeThe latest, updated version of ISO 9001:2015 puts a strong emphasis on risk management. “When an organi-sation reflects on its objectives, on what it can achieve and where it would like to be, it can apply a risk-based approach, whereby it always has to weigh between the opportunities and risk-related threats.” It is the manage-ment's responsibility to identify and address both risks and opportunities. Risk management methods are not specifically delineated and the management must find a way to implement the necessary activities. Risks and op-portunities must be identified in all company processes and the business operation has to be rely on risk-based thinking.
In 2012, Elektro Celje introduced a risk management system to its operation as part of the ISO 9001 quality management system and a sub-process of the corporate management process. In compliance with the Rules and Regulations on Risk Management, the company monitors risks while considering internal and external factors, as well as relevant interested parties. Risk is identified as a possible event or series of events the occurrence of which would affect the company's operations. Both threats (un-favourable effect) and opportunities (favourable effect) are assessed in the process.
The risk register, updated and managed by the risk man-agement coordinator in cooperation with administrators of individual risks, includes all identified and assessed risks and opportunities in relation to the operating processes and goals. The risk management coordinator:• updates and reports on the list of identified risks• develops the methodology of risk management• points out the potential risks in individual areas• organises education and training in the field of risk man-
agement and promotes a responsible risk-taking culture• monitors the company performance indicators• participates and provides technical help in the imple-
mentation of risk management processes.
Planned and systematic risk (opportunity) monitoring is a constant process at Elektro Celje. The list of existing and identified risks is regularly updated. Changes in the risks are reported to the Supervisory Board and its Audit Com-mittee by the risk coordinator on a quarterly basis. The initial identification of risk in the various fields of the com-pany operation and the implementation of the adopted measures to reduce these risks is the responsibility of the respective risk administrators. These include the manage-ment, sector directors, and in specific cases also depart-ment heads.
Risk rate is assessed according to the adopted method-ology based on the risk matrix whereby the risk rate is a product of effects and consequences that an unfavour-able or favourable event might have on the company's operation. The assessed risk rate serves to determine the risk responses, measures and the responsible adminis-trators, as well as the deadlines for the implementation of measures and reporting. The management of a risk makes sense when its benefits exceed the costs. The risk management process also involves the internal auditor, who plans annual audits on the basis of the list and as-sessment of risks.
The categories of responses to risk include manage-ment, diversification, avoidance and acceptance. The most frequent response is risk management, which in-cludes internal controls (methods, measures, instructions and procedures providing effective risk management and achievement of the company goals). Risk identification and management is essential to achieving strategic goals; set objectives will only be fulfilled when risks are identi-fied, assessed and managed to an acceptable level – i.e., within the limits of tolerable risk.

93
ANNUAL REPORT
Elektro Celje2 0 1 5
11. RISK MANAGEMENT
11.2 Basic Risks at Elektro CeljeThe risks for the company fall into three categories: strategic, operational and financial risks.
>> STRATEGIC RISKS Strategy and management related risks: Due to the fact that the Republic of Slovenia is the majority share-holder of Elektro Celje, the company has to implement its strategy in compliance with the recommendations of SSH, the company for managing capital assets owned by the Republic of Slovenia, which monitors the company op-eration. Based on the strategy of capital assets manage-ment, SSH will draft a proposal for the future regulation of Slovene electricity distribution companies. In addition, and in compliance with the implementation of the Republic of Slovenia Budget Act, SSH intends to acquire the shares of the company's minority shareholders at a justified price.Elektro Celje regularly ensures the compliance of its strat-egy with the directions of the shareholder represented by SSH, d.d., as well as the directions of the customer and contracting authority – SODO. Due to the fact that Elektro Celje generates most revenues from infrastructure, two key risks were identified in 2015:• Amendment to the agreement with SODO: In
2015, the company signed Amedment IV to the agree-ment on the lease of electricity distribution infrastructure and rendering of services for the system operator of the power distribution network. The amendment contains several provisions that are unfavourable for the com-pany, including the increase of SODO financing costs. The company strives to reduce the risk by adjusting the business plan to new conditions and by operation ra-tionalisation.
• The Act on the Methodology Determining the Regulatory Framework and the Methodology for Charging the Network Charge for Electric-ity System Operators estimates the value of pro-jected costs per year of the regulatory period, as well as the values of projected network charges, other rev-enues from performing the activities of electricity sys-tem operators, and surpluses and deficits from network charges from previous years. Based on the provisions of the new act adopted in 2015 there is a risk of lower income as well as reduced covering of potential dam-ages and recognition of insurance premium costs. It has yet to be decided how the network charge balance pay-ments for the individual years of the previous regulatory framework will be executed. To manage this risk, the company is optimising its business processes, plans to reduce the cost of material and services, and is actively participating, through various institutions and interest groups at the same time, in the preparation of legislative amendments.
Reputation Related Risks include potential events that affect the external and internal company image. The company image is important for the relations with the stakeholders, as well as for the company's credit rating with the suppliers and financial institutions. These risks are managed by monitoring the satisfaction of the sharehold-ers, customers, employees, suppliers and the public at large.
RISKS
STRATEGIC RISKS
OPERATIONAL RISKS
FINANCIAL RISKS
CORPORATE INTEGRITY
STRATEGY/MANAGEMENT
EMPLOYEE BEHAVIOUR
CREDIT RISK
SYSTEMS OPERATION
MARKET RISK
EXTERNAL EVENTS
LIQUIDITY RISK
EQUITY RISK
HUMAN RESOURCES
DEVELOPMENT
REPUTATION

ANNUAL REPORT
Elektro Celje2 0 1 5
94
11. RISK MANAGEMENT
Development risk is related to adopting decisions on new, more advanced or better, technology. This is always reflected in various short or longer (multiannual) projects, which can be delayed due to a bad choice, underestimat-ed costs or failure of the company to follow the trends in the area of technological development. Such risks can be avoided by carefully planned development, project man-agement, assignment of teams to each individual project, in-process corrections and identification of discrepancies.
Human resource risks are related to the selection and establishment of employee competencies, employee satisfaction and motivation, communication, knowledge transfer and replacement of key employees. These risks are managed by:• conducting annual development interviews• annual human resource planning in terms of employee
replacement• planning internal recruitments of future managerial staff• employee education and training• organisation climate surveys• provision of a safe and healthy working environment• responsible actions of the management and employees
based on moral and ethical values pursuant to the Ele-ktro Celje Group Ethical Code.
In 2015, Elektro Celje received a full Family Friendly Com-pany certificate. Improvements can be made through an-ticipated career plans for key personnel, program of activi-ties to reduce sick leave and promote creativity and the spirit of innovation.
Corporate integrity risks were first included in the risk register in 2015. The company designed a Plan of Corporate Integrity and appointed a dedicated compli-ance officer. In this context, risks are managed in order to reduce breaches of corporate integrity and achieve busi-ness coherence through good business practices, ethical norms and a socially responsible relation with the com-munity and the natural environment.
>> OPERATIONAL RISKS Operational risks are potential events that affect the ac-complishment of the company's annual business goals and the risk of loss or potential of benefit. This category includes the behaviour of people, the functioning of sys-tems, and external events.
Conduct of people: In this respect, the risks most commonly occur in the fields of maintenance and invest-ment (consensuses, easement/right of way agreements, project planning, project management and monitoring, etc.) and supply (procurement planning, purchasing con-ditions, contracting, evaluation of suppliers and contrac-tors, public procurement audits, inventory management). Additional risks include changes of organisational struc-ture, delimitation of power and responsibility, and the flow of information. Risk management measures for this cat-egory include appropriate delimitation of power and re-sponsibilities, appropriate flow of information, appropriate written work instructions and guidelines, preventive and corrective measures, inspections, and employee educa-tion and training.
System functioning: Two risks in particular should be pointed out: security risk and risk regarding the informa-tion system. In 2015, Elektro Celje adopted a security pol-icy which classifies as a document of quality management system (ISO 9001:2008) and was introduced to the per-sonnel in the form of leaflet. In December 2015 a vulner-ability testing of the SED network was performed. The risk of data loss at the company is managed by data back-up and archiving.
Elektro Celje faces higher risks in the field of IT systems in terms of support for key information services. The compa-ny contracted for providing it was Informatika d.d., which services other distribution companies, too, but since it performed poorly in 2015, it might have compromised the operation of Elektro Celje, as well. Consequently, Elektro Celje adopted a plan of action in the event of risk materi-alisation and informed SSH, d.d., which will take specific measures in order to protect electricity distribution com-panies.
As to external events, the identified weather risk is managed through network planning/engineering and op-eration, and insurance. The operational risks of the distri-bution network are reduced by regular maintenance and other activities (inspections, audits, measurements) in or-der to prevent electricity outages and major damage at the plant.
>> FINANCIAL RISKS Financial risks affect the realisation of the planned income and capital outcome of the company.
Credit risk is the risk of loss due to non-fulfilment of debtors' liability, mostly as a consequence of insolvency (bankruptcy or liquidation of a debtor), or due to unjustified consumption. The risk is managed by standard collection and recovery methods. The reports on receivables and their collection are presented to the Supervisory Board and its Audit Committee every month.
Credit risk is explained in more detail in section 16.8.1.
Market risk is related to the potential increase of finan-cial expenses due to changes in the reference interest rate EURIBOR. In order to minimise this risk, the com-pany selects the lender that provides the most favourable terms, monitors interest rates and looks for opportunities to exchange current loans with loans that have a more fa-vourable interest rate. In addition, the company rejects all loan agreements that include the “increased cost” clause. Due to its limited regional operation, the company is not exposed to foreign exchange risk.
Market risk is explained in more detail in section 16.8.3.
Liquidity risk is a risk due to unbalanced liquidity – i.e., maturity and liabilities which might result in insolvency. The risk is managed by the finance sector through monitor-ing and management of the company's liquidity, and the maintenance and investment sector by implementing its activities according to the plan.

95
ANNUAL REPORT
Elektro Celje2 0 1 5
11. RISK MANAGEMENT
Liquidity risk is explained in more detail in section 16.8.2.
Equity risk arises when the company lacks sufficient long-term financing sources in relation to the scale and type of its operations. It is mainly the risk of the company's
financial incapacity and it is managed through planning investments within the available company resources and credit status.
Equity risk is explained in more detail in section 16.8.4.
11.3 Types of risks and their management at the Elektro Celje Group The risks faced by the Group are divided into three cat-egories: strategic, operational and financial.
Strategic risks include potential events with an effect on the attainment of medium- or long-term business goals of the group companies. These are managed by setting, monitoring and analysing strategic and annual business goals. In 2015, the operational strategy of Elektro Celje Energija, d.o.o., underwent some changes due to the merger of Elektro Celje Energija and Elektro Gorenjska Prodaja into ECE, d.o.o., on October 1, 2015. Other strategic risks are related to the company's reputa-tion and are managed by monitoring the satisfaction of customers, shareholders, employees, suppliers and the public, and the implementation of measures based on survey results.
Operational risks are the potential events that affect the achievement of the group companies’ annual busi-ness goals and present the risk of losses and the poten-tial benefits resultant from the implementation of internal processes. At group level, only the risk of implementa-tion of subsidiary management was identified. The risk is managed by developing expert platforms for subsidiary management and thoughtful selection of the subsidiary's managerial staff.
Financial risks are the potential events with an effect on the achievement of the strategic and annual goals in relation to companies' financing. At group level, credit and market risks were identified.
RISKS
STRATEGIC RISKS
OPERATIONAL RISKS
FINANCIAL RISKS
STRATEGY/MANAGEMENT
REPUTATION
EMPLOYEE BEHAVIOUR
CREDIT RISK
MARKET RISK
DEVELOPMENTDevelopment of the distribution network is one of our principal tasks, by which we try to meet the growing demand for electricity. Constantly upgrading and modernizing the system, availing ourselves of state-of-the-art technology and putting expert knowledge to good use we are building the network of the future.


ANNUAL REPORT
Elektro Celje2 0 1 5
98
12. SUSTAINABLE DEVELOPMENT
12. SUSTAINABLE DEVELOPMENT 12.1 Sustainable Development Guidelines Sustainable development of the company Elektro Celje and Elektro Celje Group is a constituent part of business processes. By integrating the principles of sustainable de-velopment and social responsibility in our operations, we generate added value, ensure that our operation is compli-ant with quality policy and in line with legal provisions and ethical norms, strengthen our concern for the employees and the efforts to increase their satisfaction, commit to the preservation of the environment, and promote the efficient use of electricity among our customers. The promotion of our employees' personal growth facilitates the devel-opment of their potentials, while an organisational culture developing towards raising personnel awareness in regard to the significance of customer satisfaction provides for the future growth and development of the company.
The entire personnel, suppliers, contractors and other business partners actively participate in our concern re-garding energy efficiency, comprehensive corporate re-sponsibility and sustainable development. Our guiding principle in incarnating a responsible attitude towards the natural environment is to contribute to the long-term healthy lifestyles of our employees, customers and other stakeholders, in accordance with the principles of sustain-able development. Our customers are given the possibil-ity to act responsibly in terms of efficient energy use and environmental protection by reducing their carbon print in their business and private lives. Through the implementa-tion of energy efficiency principles we want future genera-tions to enjoy a quality of life and environment comparable to, or better than, that of today.
12.2 Corporate Integrity and Ethical Code In the second half of 2015, Elektro Celje Group estab-lished a system of corporate integrity containing elements defined by the Slovenian Guidelines of Corporate Integrity. Corporate integrity and the related risk have been inte-grated in our existing risk management system.
Acting with integrity and responsibility is a key element of our corporate culture. What matters is not only that we attain out business goals but how we attain them, as well. Our customers, business partners, shareholders, credi-tors, the public and, last but not least, all our employees expect the same: integrity in business and interpersonal relations. In other words: honesty, fairness and transpar-ency in our operations. The principles of ethics and ethi-cal rules followed by the personnel and management in particular situations are contained in the Elektro Celje Group Ethical Code, a Vade Mecum of everyday con-duct, business decisions and employee relations, which reflects the standards of proper conduct in Elektro Celje Group. Maintaining the reputation of the company and the Group is an objective shared by employees and contrac-tors alike.
The Plan of the Elektro Celje Group Corporate Integrity is a tool for establishment/monitoring of integ-rity within the Group, as well as identifying/eliminating the susceptibility of the Group, its individual companies and their employees to acts of corruption. Through a compli-ance officer, we established a mechanism for regular and comprehensive identification of corporate integrity risks, their assessment and a systematic and independent con-trol of risk management efficiency.
Corporate integrity is one of our strategic goals and as such integrated into the strategic orientation of the Elek-tro Celje Group. Corporate integrity and related risks are included in the Risk Register, where they are identified, assessed and managed through proposed measures. In
this way we want to facilitate the attainment of set goals, promote proactive management, enhance the identifica-tion of opportunities and threats, act in compliance with the applicable regulations and standards, increase opera-tional efficiency and performance, improve occupational health and safety, environmental protection, etc.

99
ANNUAL REPORT
Elektro Celje2 0 1 5
12. SUSTAINABLE DEVELOPMENT
12.3 Responsibility to Employees Elektro Celje Group comprises the personnel of the con-trolling company Elektro Celje and the subsidiary ECE. Our values are compliance with labour legislation, concern for occupational health and safety, and investment in new knowledge required by the development of industry. Our basic ethical values include expertise, knowledge, entre-preneurship, partnership, respect and responsibility. We provide new employment and personnel career develop-ment without any discrimination. Any form of violence or mobbing among our employees is inadmissible. Every employee has a right to privacy and to a safe and healthy working environment.
Superiors must lead by their example and provide for the employees’ satisfaction and development. In making deci-sions, they must respect the dignity, personal integrity and
privacy of each individual. They create conditions for the employees’ personal and professional development, con-duct interviews with them to establish an open dialogue and harmonise personal and common objectives, identify their human resource potential, and provide for mentorship and transfer of knowledge to their colleagues.
Human resource planning is part of the company's stra-tegic and annual plan. In planning new employment, we follow the policy of recruiting highly qualified, ambitious, competent, motivated and target-oriented labour in order to be able to keep up with the requirements and develop-ment of the power engineering industry and operate in ac-cordance with the company's mission, values and vision. Employment vacancy notices are available on our website and at the Employment Service of Slovenia.
12.3.1 Headcount and Composition of EmployeesElektro Celje Group strives to preserve the number of em-ployees and job positions. The 4.5% fluctuation recorded was largely due to retirement and fixed-term employment. In 2015, 11 employees retired due to age, while there were no disability retirements. Two employees retired in the ECE subsidiary undertaking, one due to age and the other due to disability. This is a decrease from the previous years when in addition to the age structure of the com-pany, the amendments of pension and disability legislation also attributed to retirements.
As of December 31, 2015, Elektro Celje Group had a total of 717 employees, with the average number of personnel being 700. The number of employees increased over that of the previous years due to the acquisition of the com-pany Elektro Gorenjska Prodaja by the ECE subsidiary.
In terms of employment status, the number of perma-nently employed workers amounted to 682 (95 %), that of temporarily employed to 32. Three interns were employed for a limited period as of the end of the year. A number of aspects are considered in workflow organisation and staff deployment. We provide for a healthy working en-vironment, and special attention is paid to occupational health and safety, fire safety and the preservation of the environment. Within the limits of our workflow, we enable high-school and university students to perform their prac-tical training and, upon completion of their studies, intern-ships as well. The majority of the personnel are employed full-time; only 2 % work part-time, mostly employees with disability status or those entitled to part-time employment due to parenthood.
Elektro Celje Company
ECE d. o. o. Elektro Celje Group
Number of permanently employed workers 610 72 682
Number of temporarily employed workers 19 13 32
Number of apprentices 3 0 3
Total number of employees as of Dec 31, 2015 632 85 717

ANNUAL REPORT
Elektro Celje2 0 1 5
100
12. SUSTAINABLE DEVELOPMENT
The age structure of the employees remained similar to those of previous years. The average age of personnel at the controlling company is 44.5 years and 41 years at the subsidiary. The gender composition at the controlling
company is 86 % male and 14 % female employees, at the subsidiary the situation is reversed: there are 25 % male and 75 % female employees.
Both companies comply with the provisions of the Decree Establishing an Employment Quota for Persons with Dis-abilities applicable in the field of electricity supply. For sev-eral years in a row, 8 % of the company's employees have had disability status, which exceeds the requirements of the decree by 2 %. As of the end of 2015, the Group employed 52 disabled persons. Through adjustments of workflow or reassignment to more suitable posts, the disabled persons and employees with different health conditions can continue working after a disability. We also encourage retraining of those who are no longer able to perform their work tasks.
In Elektro Celje, absence of work because of illness is monitored and health promotion activities are implement-ed. In 2015, sick leave amounted to 4.7 % of total work-ing hours, including refundable and non-refundable, which is a decrease from the 2014 level. Long-term absences may result in disability determination procedures. In 2015, there were no cases of retirement due to disability, but 4 employees acquired the status of a person with disability and work restrictions.
25.8 %
30.7 %
1.0 %
11.8 %
0.3 %
30.4 %
Composition of employees by age
15–20 years
21–30 years
41–50 years
51–60 years
31–40 years
over 61 years
Headcount of Elektro Celje Group
100
200
300
400
500
700
600
Elektro Celje, d. d.
ECE d. o. o.
636
47
2011
632
48
2012
632
46
2013
632
48
2014
632
85
2015Number of employees
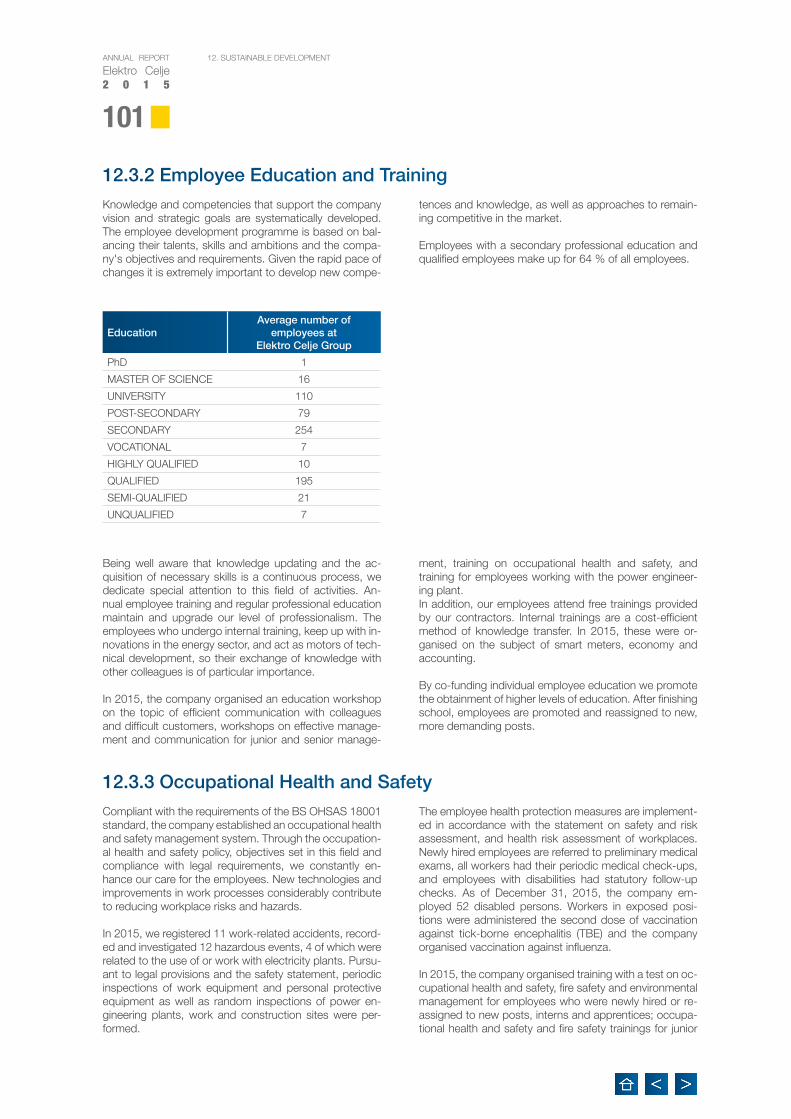
101
ANNUAL REPORT
Elektro Celje2 0 1 5
12. SUSTAINABLE DEVELOPMENT
12.3.2 Employee Education and Training Knowledge and competencies that support the company vision and strategic goals are systematically developed. The employee development programme is based on bal-ancing their talents, skills and ambitions and the compa-ny's objectives and requirements. Given the rapid pace of changes it is extremely important to develop new compe-
tences and knowledge, as well as approaches to remain-ing competitive in the market.
Employees with a secondary professional education and qualified employees make up for 64 % of all employees.
EducationAverage number of
employees at Elektro Celje Group
PhD 1
MASTER OF SCIENCE 16
UNIVERSITY 110
POST-SECONDARY 79
SECONDARY 254
VOCATIONAL 7
HIGHLY QUALIFIED 10
QUALIFIED 195
SEMI-QUALIFIED 21
UNQUALIFIED 7
Being well aware that knowledge updating and the ac-quisition of necessary skills is a continuous process, we dedicate special attention to this field of activities. An-nual employee training and regular professional education maintain and upgrade our level of professionalism. The employees who undergo internal training, keep up with in-novations in the energy sector, and act as motors of tech-nical development, so their exchange of knowledge with other colleagues is of particular importance.
In 2015, the company organised an education workshop on the topic of efficient communication with colleagues and difficult customers, workshops on effective manage-ment and communication for junior and senior manage-
ment, training on occupational health and safety, and training for employees working with the power engineer-ing plant.In addition, our employees attend free trainings provided by our contractors. Internal trainings are a cost-efficient method of knowledge transfer. In 2015, these were or-ganised on the subject of smart meters, economy and accounting.
By co-funding individual employee education we promote the obtainment of higher levels of education. After finishing school, employees are promoted and reassigned to new, more demanding posts.
12.3.3 Occupational Health and Safety Compliant with the requirements of the BS OHSAS 18001 standard, the company established an occupational health and safety management system. Through the occupation-al health and safety policy, objectives set in this field and compliance with legal requirements, we constantly en-hance our care for the employees. New technologies and improvements in work processes considerably contribute to reducing workplace risks and hazards.
In 2015, we registered 11 work-related accidents, record-ed and investigated 12 hazardous events, 4 of which were related to the use of or work with electricity plants. Pursu-ant to legal provisions and the safety statement, periodic inspections of work equipment and personal protective equipment as well as random inspections of power en-gineering plants, work and construction sites were per-formed.
The employee health protection measures are implement-ed in accordance with the statement on safety and risk assessment, and health risk assessment of workplaces. Newly hired employees are referred to preliminary medical exams, all workers had their periodic medical check-ups, and employees with disabilities had statutory follow-up checks. As of December 31, 2015, the company em-ployed 52 disabled persons. Workers in exposed posi-tions were administered the second dose of vaccination against tick-borne encephalitis (TBE) and the company organised vaccination against influenza.
In 2015, the company organised training with a test on oc-cupational health and safety, fire safety and environmental management for employees who were newly hired or re-assigned to new posts, interns and apprentices; occupa-tional health and safety and fire safety trainings for junior

ANNUAL REPORT
Elektro Celje2 0 1 5
102
12. SUSTAINABLE DEVELOPMENT
and senior managers in the Slovenian power engineering industry; first-aid training for employees responsible for administering first-aid at the workplace; beginner training in the safe use of chainsaws and pole saws; periodic train-ing in the safe use of forklifts; refresher training for heavy
duty truck drivers in the safe use of hydraulic lifts. OHS and FS staff attended seminars and organised and con-ducted an evacuation drill with practical training from the company's headquarters.
12.4 Quality Management Systems Elektro Celje has applied a certified quality management system (QMS) compliant with the ISO 9001 standard since 2003 and an environmental management system (EMS) certified by ISO 14001 since 2007. The functioning and control of the systems is reviewed by the Bureau Veri-tas Certification audit company through annual external
audits, while the efficient implementation of said systems has been subject to internal control. In 2015, the com-pany successfully passed recertification audits on all three systems (including OHSAS 18001) and their validity was extended to 2018.
12.4.1 Quality Management System The quality management system is a basis for other certi-fied systems as well as the activities on the path to busi-ness excellence. Its efficient implementation is based on 6 main and 5 support processes that are interrelated. All processes comprise sub-processes with dedicated ac-tivities, responsibilities, documentation and performance monitoring.
In compliance with the quality management requirements, the following important activities were performed in 2015:• process implementation and monitoring in accordance
with the quality, environmental, and occupational health and safety management systems, set objectives and a systemic approach to performance indicator monitoring
• control and management of contractors and suppliers• support and instructions for processes and employees
on the requirements of the company's quality manage-
ment system, monitoring the objectives set in the pro-cesses
• internal audits of quality, environmental, and occupa-tional health and safety management systems
• meetings of the Management System Council• a management review• learning new requirements of ISO 9001:2015 and ISO
14001:2015 standards
The external control audit report included 18 notes and 6 recommendations for improvements. The operation of quality management systems (quality, environmental, and occupational health and safety) was compliant with the requirements of effective standards, set quality objectives, performance indicator monitoring, and consistent with the objectives laid down for particular processes and locations.
12.4.2 Environmental Quality Management The customers, employees and all interested parties consider responsibility to the environment ever more im-portant, thus Elektro Celje incorporates it in day-to-day operations and activities. Our responsibility to the natural environment has clearly been defined in the environmental management policy which outlines our principal goals in terms of preservation of the environment. Through sus-tainable development, we accomplish tasks and goals to the maximum possible extent. The ISO 14001 certificate granted to our company eight years ago testifies to our commitment to constant reduction of all negative impacts on the environment; i.e., the reduction of all emissions and sustainable management of natural resources.
In 2015, special attention was given to waste manage-ment and separate waste collection. The existing waste management systems were improved, resulting in a clean-er working environment and landscape. Asbestos roofing on business premises and power engineering plants was removed. Waste is collected separately. Recyclable waste
that can be further processed is sold to contractors which also provide for waste disposal.
Environmental management policy is publicly disclosed online while the employees are informed on the subject via an intranet site dedicated to the quality and environmental management systems.
In 2015, planned internal audits, separate by location, to assess compliance with environmental management sys-tem standards were performed. The company adopted a waste management plan for 2015–2018. The results of performed statutory monitoring were within permitted threshold values. The environmental management policy was subject to periodic monitoring and endorsed by the management review. The external control audit did not identify any non-com-pliances; 18 notes and 6 recommendations for improve-ments will be acted upon in 2016.
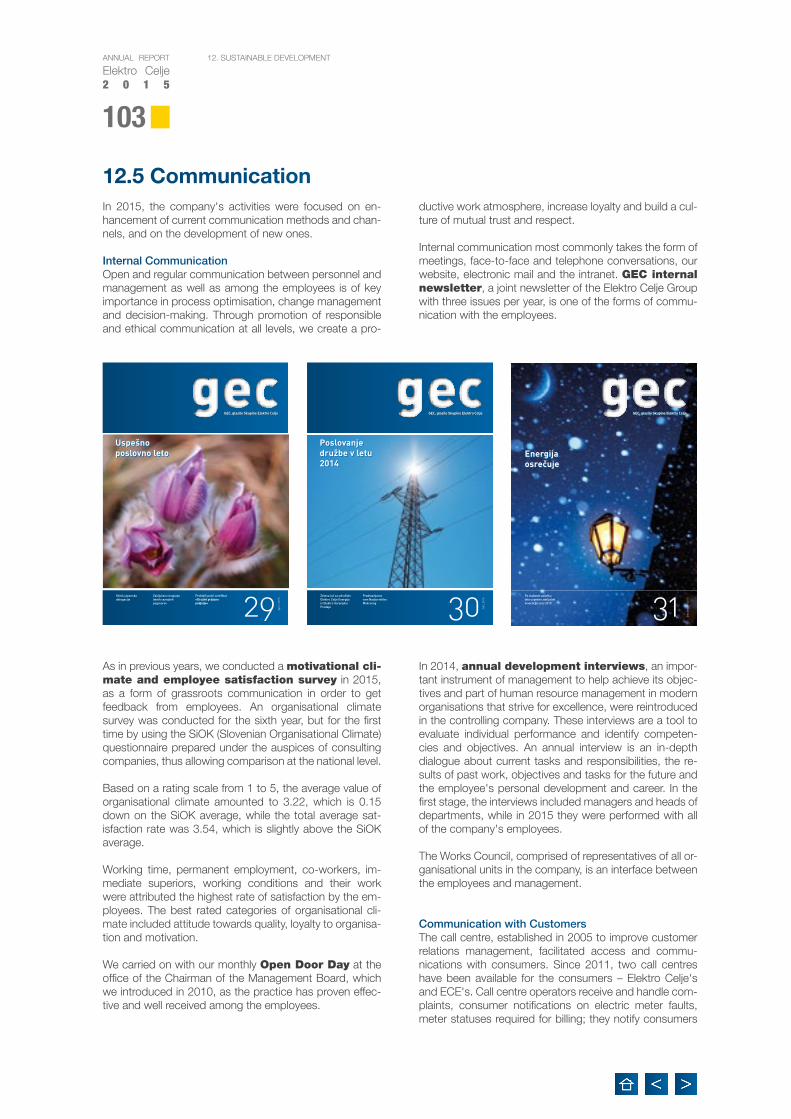
103
ANNUAL REPORT
Elektro Celje2 0 1 5
12. SUSTAINABLE DEVELOPMENT
12.5 CommunicationIn 2015, the company's activities were focused on en-hancement of current communication methods and chan-nels, and on the development of new ones.
Internal Communication Open and regular communication between personnel and management as well as among the employees is of key importance in process optimisation, change management and decision-making. Through promotion of responsible and ethical communication at all levels, we create a pro-
ductive work atmosphere, increase loyalty and build a cul-ture of mutual trust and respect.
Internal communication most commonly takes the form of meetings, face-to-face and telephone conversations, our website, electronic mail and the intranet. GEC internal newsletter, a joint newsletter of the Elektro Celje Group with three issues per year, is one of the forms of commu-nication with the employees.
As in previous years, we conducted a motivational cli-mate and employee satisfaction survey in 2015, as a form of grassroots communication in order to get feedback from employees. An organisational climate survey was conducted for the sixth year, but for the first time by using the SiOK (Slovenian Organisational Climate) questionnaire prepared under the auspices of consulting companies, thus allowing comparison at the national level.
Based on a rating scale from 1 to 5, the average value of organisational climate amounted to 3.22, which is 0.15 down on the SiOK average, while the total average sat-isfaction rate was 3.54, which is slightly above the SiOK average.
Working time, permanent employment, co-workers, im-mediate superiors, working conditions and their work were attributed the highest rate of satisfaction by the em-ployees. The best rated categories of organisational cli-mate included attitude towards quality, loyalty to organisa-tion and motivation.
We carried on with our monthly Open Door Day at the office of the Chairman of the Management Board, which we introduced in 2010, as the practice has proven effec-tive and well received among the employees.
In 2014, annual development interviews, an impor-tant instrument of management to help achieve its objec-tives and part of human resource management in modern organisations that strive for excellence, were reintroduced in the controlling company. These interviews are a tool to evaluate individual performance and identify competen-cies and objectives. An annual interview is an in-depth dialogue about current tasks and responsibilities, the re-sults of past work, objectives and tasks for the future and the employee's personal development and career. In the first stage, the interviews included managers and heads of departments, while in 2015 they were performed with all of the company's employees.
The Works Council, comprised of representatives of all or-ganisational units in the company, is an interface between the employees and management.
Communication with Customers The call centre, established in 2005 to improve customer relations management, facilitated access and commu-nications with consumers. Since 2011, two call centres have been available for the consumers – Elektro Celje's and ECE's. Call centre operators receive and handle com-plaints, consumer notifications on electric meter faults, meter statuses required for billing; they notify consumers

ANNUAL REPORT
Elektro Celje2 0 1 5
104
12. SUSTAINABLE DEVELOPMENT
on planned power supply interruptions; reply to custom-ers’ general questions; regularly communicate with work-ers in the field and electricity suppliers; and handle com-munications involving other services within the company.
Consumers are informed regarding efficient use of energy and encouraged to use energy generated from renewable sources.
A new Elektro Celje website with new forms, con-tent and functionalities has been online since October 1, 2015. It is more informative, user-friendly and facilitates access to information of interest. We hope it will provide our consumers an easy way to find information they need.
All information required by SSH will also be disclosed on-line.
In 2013, following the successful establishment of good IT support, we launched the consumer notification scheme for planned power supply interruptions. In 2016, after the establishment of connections from the transformer sub-stations to each metering point, the consumers will be notified about planned interruptions via SMS text mes-sages or electronic mail, in addition to our regular and es-tablished practice of notifications via radio, television and website.
Communication with Business Partners and Share-holders The principal goal of Elektro Celje, d.d., is to maximise the company's value and operate for the benefit of all stake-holders, including shareholders and investors. Respon-sible management is demonstrated by the attainment of operational goals, through operational transparency and shareholder communication. Transparency of operations, which is in comportment with good practices in corpo-rate management and corporate governance codes, is
implemented through the online disclosure of relevant information.
C o m m u n i c a t i o n with Business Part-ners is based on per-sonal contacts and e-communication. Per-sonal contacts are a must in the business, hence our customers are treated on an indi-vidual basis.
C o m m u n i c a t i o n with Shareholders and investors is trans-parent and compliant with all effective provisions. The shareholders are provided information on business performance and the company's future strategy. Public information (quarterly reports, con-cluded contracts, General Assembly meetings and ma-terial thereof) is disclosed on www.elektro-celje.si, the corporate website. Shareholder communication is based on SSH recommendations and OECD guidelines for cor-porate governance of state-owned enterprises that put
emphasis on three main principles: transparency, efficiency and re-sponsibility.
Press Relations Our media relations are based on transparent and updated commu-nication. Media communication mainly regards company's opera-tions, provision of new services and sponsor agreements, net-work developments and comple-tion of major works on the elec-tricity distribution infrastructure. We are regular contributors to the Slovenia power industry newslet-ter Naš stik (Our Contact), pub-lishing news and informing the professional community on the activities implemented in and by our company.
In 2015, marketing and communication activities of our subsidiary undertaking Elektro Celje Energija were focused on supporting the sales of the three energy sources in our range of products – electricity, natural gas and wooden pellets – and the presentation of support activities and benefits for customers provided in cooperation with our partners. The activities were direct (marketing campaigns) and indirect (public relations, brand building, tradeshow presentations, sponsorship agreements and donations).

105
ANNUAL REPORT
Elektro Celje2 0 1 5
12. SUSTAINABLE DEVELOPMENT
12.6 Corporate Social Responsibility Social responsibility is a constant commitment to give back to the environment in which we operate. We are aware that a reputable company shares its success with the community, thus showing its sense of corporate social responsibility.
Quality Standards at the company Elektro Celje (ISO 9001:2008, ISO 14001:2004, OHSAS 18001:2007)Elektro Celje makes its best effort to ensure quality and transparent operations. Our mission is to constantly meet the needs of our customers through quality provision of power as well as safe and reliable electricity lines and plant. The environmental certificate testifies to the com-pany's commitment to sustainable environmental devel-opment. It is a way to build relations with environmentally conscious customers and demonstrate our commitment to the preservation of the environment to our loyal part-ners. Being aware of our responsibility to the occupation-al health and safety of our personnel, the management adopted a policy that binds the company and all contrac-tors to comply with the requirements of labour legislation and regulations, agreements and the OHSAS 18001:2007 standard.
Family Friendly Enterprise The Family Friendly Enterprise certificate ensures positive effects of harmonisation of our employees’ professional and private lives short and long-term. Since 2011, Elektro Celje has built the corporate culture of a family friendly company, and in the first triad successfully implemented 9 measures. The summary report was submitted to the Audit Council, which established that the measures were implemented and objectives achieved. In 2015, the com-pany was thus granted the full certificate Family Friendly Enterprise which is extended every three years for another three-year period. This certificate corroborates our corpo-rate social responsibility and our support of the employees in the harmonisation of their professional and private lives.
Our sports society promotes sports activities among the employees. Employees and retired workers are offered the company's holiday facilities at the seaside, in spas and in the mountains, where they can spend quality free time.
Signing the Agreement on Debt Relief for Socially Most Disadvantaged On July 20, 2015, Elektro Celje signed with the Govern-ment of the Republic of Slovenia an agreement on debt relief under the conditions and procedure determined by the law regulating the terms and conditions thereof.
Sponsorships and Donations Elektro Celje allocates a part of available funds for dona-tions observing the principle of corporate social responsi-bility, and sponsorships applying the principle of balance, economic benefit and diversification. Thus we supported a
number of sports, cultural, educational and other events. In the New Year's holiday period we funded various hu-manitarian activities in the local communities where Elektro Celje is active.
TransparencyTransparency is considered an important value, imple-mented through the disclosure of data and information on our operations on the websites of the Elektro Celje control-ling company and the ECE subsidiary undertaking.


PLANNINGWe approach the search for solutions of future challenges of servicing our customers, responsibly paying regard to the natural and social environments. Our distribution network planning is based on long-term strategic decisions and a dialogue with the key stakeholders.

ANNUAL REPORT
Elektro Celje2 0 1 5
108
13. PLANS AND ANTICIPATED DEVELOPMENT OF THE ELEKTRO CELJE COMPANY AND ELEKTRO CELJE GROUP
13. PLANS AND ANTICIPATED DEVELOPMENT OF THE ELEKTRO CELJE COMPANY AND ELEKTRO CELJE GROUP 13.1 Key Business Goals of Elektro Celje Through management, operations, maintenance and de-velopment of a power distribution network, Elektro Celje will continue to provide reliable, safe and quality supply of electricity, while promoting its efficient use, economi-cal use of renewable energy sources, preservation of the environment, and integration and implementation of the fundamental values of sustainable development and op-eration in all its activities.
The company's sustainable growth and its long-term successful and stable operation requires constant pro-
gress and development of the company as a whole, its processes and human resources. Further implementation of internal audits and monitoring of the efficiency of qual-ity and environmental management systems, combined with preventative and corrective measures, will ensure the company’s continuous improvement of operation. For our company, optimal operation means growing satisfaction of our customers, shareholders, employees, suppliers, and growing care of the environment. To this end, we have adopted a system of indicators in order to continuously assess the attainment of individual goals:
• target values of operating revenues, capitalised own services, net profit, investment realisation, loss, OPEX and revenues from services ren-dered to SODO per distributed elec-tricity; target values of ROE, ROA, SAIDI and SAIFI indicators
• meeting the SAIDI, SAIFI and MAIFI target values
• reducing losses in the power net-work; larger share of remote meter-ing points, metering point control inspections, inaccessible meter control readings; shorter average time used for processing consumer claims, questions and complaints
• realisation of the annual plan for ren-ovation, replacement and increase of capacity, and regular mainte-nance; meeting the target share of projects developed for third-party customers
• reducing the number of interrup-tions of protection and management devices; not exceeding the average fault repair time and reducing the number of faults in the telecommu-nication network; outage-free DCC operation
• realisation of annual investment and productivity plan in drafting project documentation; preparing cost es-timates for simple duties; obtaining operating permits
>> processes:
Corporate governance
Development
Access to network,
and network charge
Maintenance of
electric power infrastructure
Operation of electric power infrastructure
Investment planning &
implementation

109
ANNUAL REPORT
Elektro Celje2 0 1 5
13. PLANS AND ANTICIPATED DEVELOPMENT OF THE ELEKTRO CELJE COMPANY AND ELEKTRO CELJE GROUP
>> and sub-processes:• finance and accounting services: (obtaining a
positive opinion from the certified independent auditor; ensuring company operation liquidity; meeting target DSO (days sales outstanding), target values of net fi-nancial debt/EBITDA average margin added to EURI-BOR, and financial debt/equity indicators)
• IT services (reducing the duration of IT service inter-ruptions, increasing the system's functionality, enhanc-ing customer satisfaction)
• legal and human-resource services (ensur-ing the quality and efficiency of personnel training and education, providing the planned number of train-ing and education hours per employee; achieving maximum working time efficiency; employing health protection measures to decrease sick leave usage; managing company headcount; recruiting competent personnel; providing for a positive organisational climate)
• services of Plant and Transport Logistics De-partment (meeting target rates concerning plant and transport vehicle depreciation, operational capacity of heavy duty vehicles with over 3,500 kg of total weight, vehicle utilisation, average fuel consumption per 100 km)
• procurement of material and services (meeting target values for inventories and DSI (days sales of in-ventory), and average purchase price)
With regard to ensuring quality electricity supply, the company will strive to achieve all goals laid down, which include: commercial quality, continuity of supply (reliabil-ity) and voltage quality defined by the Decree on General Conditions for the Supply and Consumption of Electric-ity and the Slovene SIST EN 50160 standard. The SAIDI, SAIFI and MAIFI indicator values planned for 2016 are harmonised with the requirements of the Energy Agency and amount to:
Elektro Celje Operational Goals in 2016
Projected amount of electricity distribution: 1,936,000 MWh.
Projected network charge in the amount of 79 million EUR, with SODO’s share accounting for 56.4%.
Projected power losses in the amount of 5.3 % of distributed electricity.
The company will implement the strategy of headcount management.
Concern for growth and development of the employees and promotion of the activities ensuring the abidance of company's principles and values (professional competence, knowledge, entrepreneurship, partnership, respect, responsibility).
Cost optimisation in all areas of operation.
Projected net profit in the amount of 8.1 million EUR.
Provision of own services of construction and electrical installation to consumers will be kept to the maximum possible volume.
Investments for 2016 are projected in the amount 21.3 million EUR, of which Elektro Celje investments amount to 20 million EUR, and SODO’s investments to 1.3 million EUR.
In accordance with the expectations of the company SSH, managing capital assets of the Republic of Slovenia, the dividend policy of Elektro Celje will provide a balance between dividends paid out and the future growth of the company's operation; the projected dividend to equity ratio for 2016 amounts to 1.5 %.
Realisation of financial expectations of SSH (ROA 3 %, EBITDA margin 35.5 %, net financial debt/EBITDA 1.92, CAPEX to net revenue from sales ratio 40.5 %, gross value added per employee EUR 68,200).
Responsible environmental management: planning, development and implementation of technological solutions that contribute to the preservation of the environment and a more efficient use of resources, and on-going monitoring of the company operations’ potential impacts on the environment.
Concern for sustainable development, responsible and active co-creation of the company's social environment.
Urban Rural Combined
SAIFI - interruption frequency/customer 0.62 0.86 0.75
SAIDI - number of minutes/customer 21.07 34.43 28.04
MAIFI - momentary interruption frequency/customer 1.47 5.38 3.51
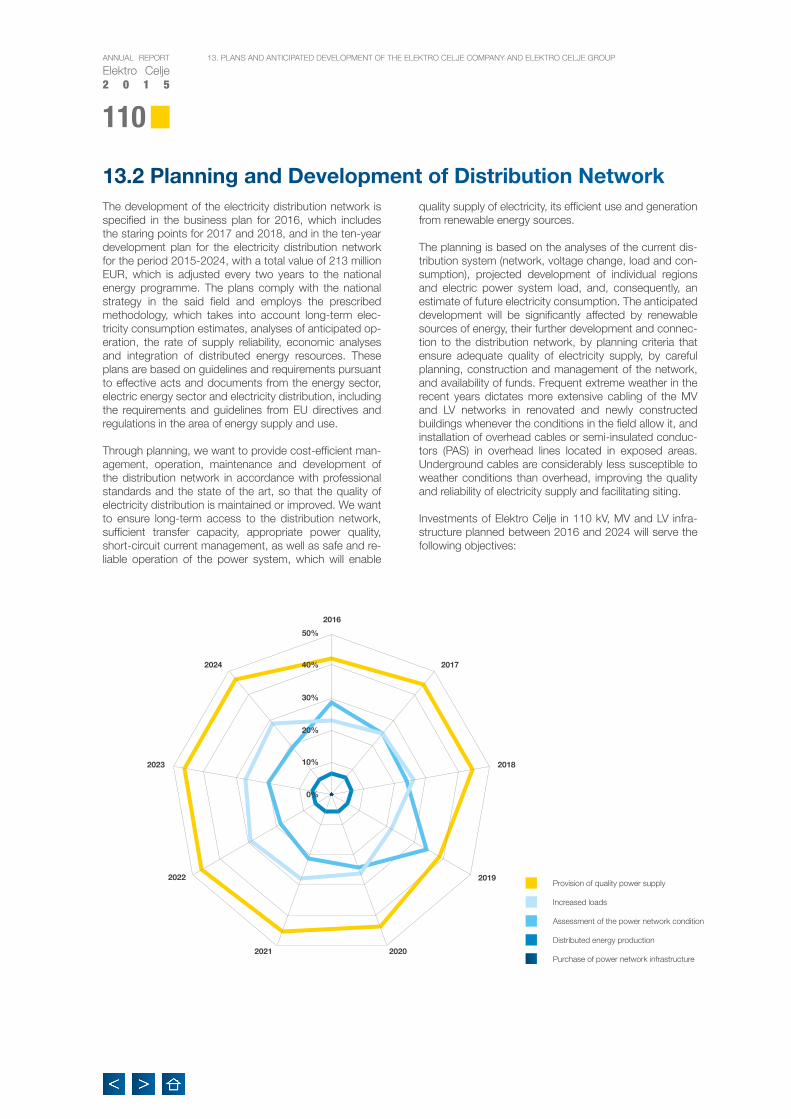
ANNUAL REPORT
Elektro Celje2 0 1 5
110
13. PLANS AND ANTICIPATED DEVELOPMENT OF THE ELEKTRO CELJE COMPANY AND ELEKTRO CELJE GROUP
13.2 Planning and Development of Distribution Network The development of the electricity distribution network is specified in the business plan for 2016, which includes the staring points for 2017 and 2018, and in the ten-year development plan for the electricity distribution network for the period 2015-2024, with a total value of 213 million EUR, which is adjusted every two years to the national energy programme. The plans comply with the national strategy in the said field and employs the prescribed methodology, which takes into account long-term elec-tricity consumption estimates, analyses of anticipated op-eration, the rate of supply reliability, economic analyses and integration of distributed energy resources. These plans are based on guidelines and requirements pursuant to effective acts and documents from the energy sector, electric energy sector and electricity distribution, including the requirements and guidelines from EU directives and regulations in the area of energy supply and use.
Through planning, we want to provide cost-efficient man-agement, operation, maintenance and development of the distribution network in accordance with professional standards and the state of the art, so that the quality of electricity distribution is maintained or improved. We want to ensure long-term access to the distribution network, sufficient transfer capacity, appropriate power quality, short-circuit current management, as well as safe and re-liable operation of the power system, which will enable
quality supply of electricity, its efficient use and generation from renewable energy sources.
The planning is based on the analyses of the current dis-tribution system (network, voltage change, load and con-sumption), projected development of individual regions and electric power system load, and, consequently, an estimate of future electricity consumption. The anticipated development will be significantly affected by renewable sources of energy, their further development and connec-tion to the distribution network, by planning criteria that ensure adequate quality of electricity supply, by careful planning, construction and management of the network, and availability of funds. Frequent extreme weather in the recent years dictates more extensive cabling of the MV and LV networks in renovated and newly constructed buildings whenever the conditions in the field allow it, and installation of overhead cables or semi-insulated conduc-tors (PAS) in overhead lines located in exposed areas. Underground cables are considerably less susceptible to weather conditions than overhead, improving the quality and reliability of electricity supply and facilitating siting.
Investments of Elektro Celje in 110 kV, MV and LV infra-structure planned between 2016 and 2024 will serve the following objectives:
2016
2017
2018
2019
20202021
2022
2023
2024
Provision of quality power supply
Increased loads
Distributed energy production
Assessment of the power network condition
Purchase of power network infrastructure
0%
10%
20%
30%
40%
50%

111
ANNUAL REPORT
Elektro Celje2 0 1 5
13. PLANS AND ANTICIPATED DEVELOPMENT OF THE ELEKTRO CELJE COMPANY AND ELEKTRO CELJE GROUP
The consumer demand for quality electricity supply and, consequently, their expectations of smarter and more reli-able networks is constantly increasing, which presents us with new challenges and requires the understanding of the operation of electricity network as a whole. Our objective is to attain cost-efficient smart grids with low losses and high rates of reliability, quality and safety of power supply. Planning, management, operation, maintenance and devel-opment of the electric power system has to be adjusted to such objectives. It is of key importance to introduce modern IT and communication technologies that integrate the end users into the smart grid. The construction of a comprehen-sive system is based on modern DMS software and instal-lation of advanced metering systems in the network, which provide accurate and graphic electricity consumption data.
The allotment of the largest share of total investments into power infrastructure in the area serviced by Elektro Celje in the period 2016-2014 is projected for MV infrastructure (37
%), followed by LV infrastructure (25 %), secondary equip-ment (12 %), 110 kV infrastructure (9 %) and the obtain-ing of project documentation (4 %). It is expected that 56 % of the funds will go for new infrastructure, 30 % for re-constructions and 4 % for project documentation and pur-chase of electricity distribution infrastructure. The medium voltage network is being constructed in order to integrate new MV/LV transformer substations for the needs of new consumers, and to improve voltage conditions and network looping the low voltage network to improve the quality of electricity supply. The investments are aimed at develop-ing a network capable of integrating new customers and distributed energy resources, while simultaneously allowing the current customer an increase of installed capacity at reasonable cost. By effectively planning the development and building infrastructure, we meet the requirements of projected and actual electricity consumption, and peak loads of the system.
Investments in the Elektro Celje area planned for the period 2016-2024
2016
0 1 2 3 4 5 6 7 8 9 10 11 12 13 14 15 16 17 18 19 20 21 22 23
2017
2018
2019
2020
2021
2022
2023
2024
Million
110 kV INFRASTRUCTURE
MV INFRASTRUCTURE
SECONDARY EQUIPMENT
DOCUMENTATION
LV INFRASTRUCTURE
OTHER NON-POWER-RELATED INVESTMENTS
2
1
2
3
2
3
3
1
2
5
5
5
5
5
5
5
6
6
2
3
3
3
3
3
3
3
3
1
1
1
1
1
1
1
1
1
2
3
3
2
3
2
2
2
2
9
9
7
7
7
7
7
8
8

ANNUAL REPORT
Elektro Celje2 0 1 5
112
13. PLANS AND ANTICIPATED DEVELOPMENT OF THE ELEKTRO CELJE COMPANY AND ELEKTRO CELJE GROUP
Investments planned for 2016 in the area of the Elektro Celje electricity distribution system amount to 21.3 million EUR, of which 20 million EUR will be invested by Elek-tro Celje, while SODO is expected to provide 1.3 million EUR of assigned revenue to finance the investments into greater transmission capacity and development of the power distribution network required by the customers’ higher connected load. The enforcement of the decree on ownership transfer of transmission network to the system operator, the company ELES, resulted in gradual transfer for value of lines and devices of a 110 kV network having the character of a transmission network.
Important Investments Planned for the Elektro Celje Distribution Network: • Upon the construction of underground cable (UC) 2 x
110 kV (app. 0.6 km) between DTS 110/20 kV Žalec and OPL 110 kV DTS Podlog – DTS Lava planned for 2016, DTS Žalec will be connected to the MV network.
• In the Mežica Valley area, construction of a 110 kV pow-er line (8 km overhead line and 0.46 km underground cable) between DTS Ravne and DTS Mežica is planned for 2022, and the construction of DTS Mežica 110/20 kV for 2027. The three years following the adoption of the MDSP will be dedicated to conducting a field sur-vey, obtaining easement/ right of way, and drafting a surveying plan and project documentation in order to obtain the building permit.
• Construction of DTS 110/20 kV Mokronog is planned for 2022, and its connection to the newly constructed 2 x OPL 110 kV DTS Trebnje – DTS Mokronog – DTS Sevnica (cca. 9 km) and 2 × UC (0.4 km) for 2024. Ac-tivities in the following years will focus on siting of the overhead power line into relevant spatial plans.
• Planned construction of DTS Vojnik 110/20 kV: the built part of the DTS, to be completed by 2019, will operate as DS Vojnik 20 kV until 2030. In the following years, the focus of activities will be provision of the necessary siting documentation, development of project docu-mentation and preliminary works on the site planned for construction.
• Renovation and restoration works due to wear and tear, improvement of operational reliability, provision of ade-quate power supply are planned in the individual DTSs.
• Investments in the MV network are related to the construction of new commercial and residential ar-eas in the vicinity of state road infrastructure (mo-torways, expressways), appropriate power supply and increased demand for construction of renewable energy source facilities. New MV power lines are mainly built in the underground cable version (UC 2 x 20 kV DTS 110/20 kV Trnovlje – DS Vojnik in 2017, UPTS 2 x 20 kV DTS Podlog – DS Ločica in 2018).
• Another important investment is the construction of 3 × UC 20 kV DS Nazarje – DS Ljubno, which will enable additional consumption in the Ljubno industry and busi-ness zone, a basic and stand-by supply in the future, and reduce the effect of distributed energy resources in the Upper Savinja Valley.
• The construction of TS Miklavc (2016), DS (TS) Pristava betonarna 20 kV (2017), DS Ločica 20 kV (2018) will improve the reliability of supply and ensure stand-by supply.
• Consistent with the anticipated increase in the con-sumption of electricity, construction of new commercial and residential zones, appropriate provision of quality supply, and integration of new distributed sources into the distribution network (solar power plants, combined heat and power plants, small hydro power plants), 117 new standard TSs MV/0.4 kV will be constructed in the company's distribution area over the next three years.
• The transition to 20 kV lines in the area of Celje, mainly in the old town centre, is underway.
• Consistent with the projections of the electricity con-sumption, the state of the art, environmental protection and requirements of consent authorities, the company also plans to invest in the current TSs and replacement, increase of capacity and renovation of MV and LV over-head power lines and devices.
• Replacement and modernisation of remote-controlled protection systems in DTSs and DSs, installation of ad-ditional remote-controlled switches and their connec-tion to DMC Celje, and the installation of fault indicators and remote control switchgear in poorly accessible and critical sections of the network for faster fault location and repair is planned for the next few years.
• Pursuant to the new Energy Act (EZ-1; Official Gazette of RS, No. 17/2014) and its provision that the smart metering system include 80 % of the consumers by 2020, we shall continue the installation of 12,000 elec-tronic meters per year.
• Introduction of the EAM and ERP systems for asset management and resource planning, and the upgrade of the AMI remote control platform with the MDM func-tion of advanced data analysis.
• Installation of remote-controlled circuit-breakers in loca-tions of difficult access and wherever major electricity consumers are connected, installation of remote-con-trolled limit switches between overhead power lines to enable supply via alternate network configurations in case of outages, and fault indicators to identify the fault sections more quickly.
• Further extension of own optical network in redundant rings throughout the power network, use of digital ra-dio system also for narrowband data links for remote control and automation of the MV network, construction of the company's own wireless system for broadband data links that could cover the communication needs of the entire SmartGrid system.
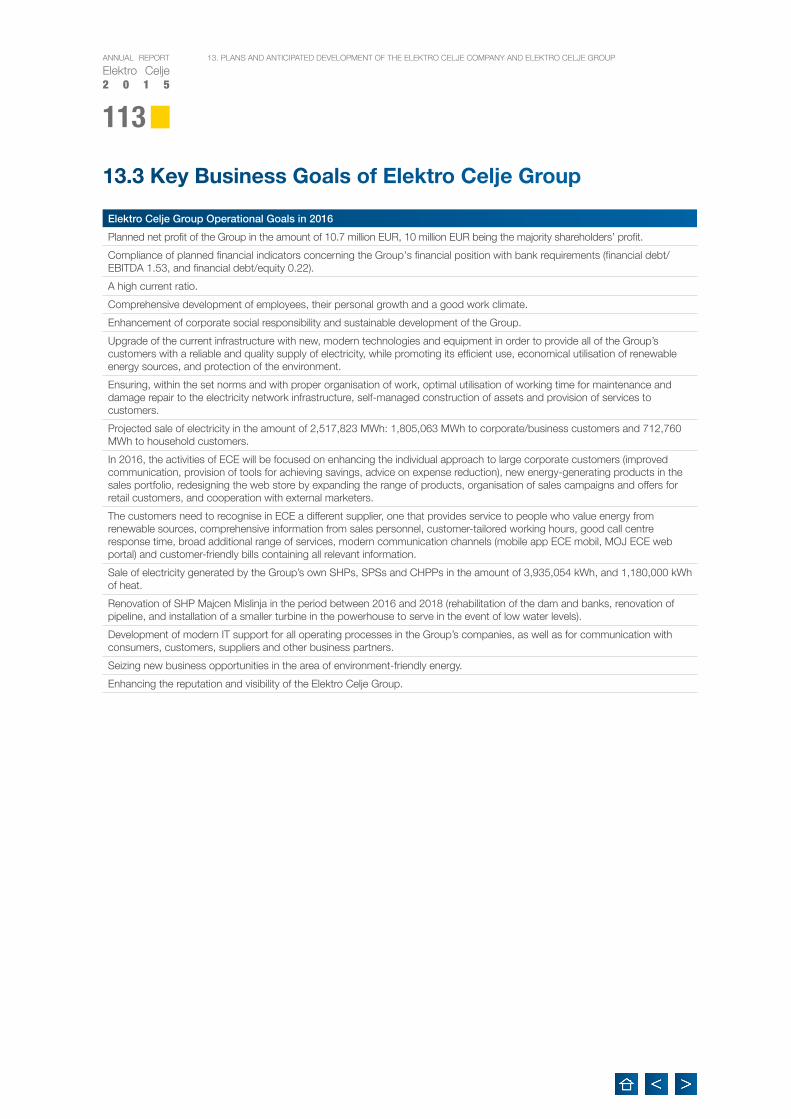
113
ANNUAL REPORT
Elektro Celje2 0 1 5
13. PLANS AND ANTICIPATED DEVELOPMENT OF THE ELEKTRO CELJE COMPANY AND ELEKTRO CELJE GROUP
13.3 Key Business Goals of Elektro Celje Group
Elektro Celje Group Operational Goals in 2016
Planned net profit of the Group in the amount of 10.7 million EUR, 10 million EUR being the majority shareholders’ profit.
Compliance of planned financial indicators concerning the Group's financial position with bank requirements (financial debt/EBITDA 1.53, and financial debt/equity 0.22).
A high current ratio.
Comprehensive development of employees, their personal growth and a good work climate.
Enhancement of corporate social responsibility and sustainable development of the Group.
Upgrade of the current infrastructure with new, modern technologies and equipment in order to provide all of the Group’s customers with a reliable and quality supply of electricity, while promoting its efficient use, economical utilisation of renewable energy sources, and protection of the environment.
Ensuring, within the set norms and with proper organisation of work, optimal utilisation of working time for maintenance and damage repair to the electricity network infrastructure, self-managed construction of assets and provision of services to customers.
Projected sale of electricity in the amount of 2,517,823 MWh: 1,805,063 MWh to corporate/business customers and 712,760 MWh to household customers.
In 2016, the activities of ECE will be focused on enhancing the individual approach to large corporate customers (improved communication, provision of tools for achieving savings, advice on expense reduction), new energy-generating products in the sales portfolio, redesigning the web store by expanding the range of products, organisation of sales campaigns and offers for retail customers, and cooperation with external marketers.
The customers need to recognise in ECE a different supplier, one that provides service to people who value energy from renewable sources, comprehensive information from sales personnel, customer-tailored working hours, good call centre response time, broad additional range of services, modern communication channels (mobile app ECE mobil, MOJ ECE web portal) and customer-friendly bills containing all relevant information.
Sale of electricity generated by the Group’s own SHPs, SPSs and CHPPs in the amount of 3,935,054 kWh, and 1,180,000 kWh of heat.
Renovation of SHP Majcen Mislinja in the period between 2016 and 2018 (rehabilitation of the dam and banks, renovation of pipeline, and installation of a smaller turbine in the powerhouse to serve in the event of low water levels).
Development of modern IT support for all operating processes in the Group’s companies, as well as for communication with consumers, customers, suppliers and other business partners.
Seizing new business opportunities in the area of environment-friendly energy.
Enhancing the reputation and visibility of the Elektro Celje Group.


Together we shape the social environment in which we grow. With socially conscious projects and ideas we are contributing our share of creativity, cultivating positive stories and developing human potential. We are committed to good energy that fuels our good ideas and allows us to put them into action.
CREATION

ANNUAL REPORT
Elektro Celje2 0 1 5
116
14. INDEPENDENT AUDITOR'S REPORTS
14. INDEPENDENT AUDITOR'S REPORTS
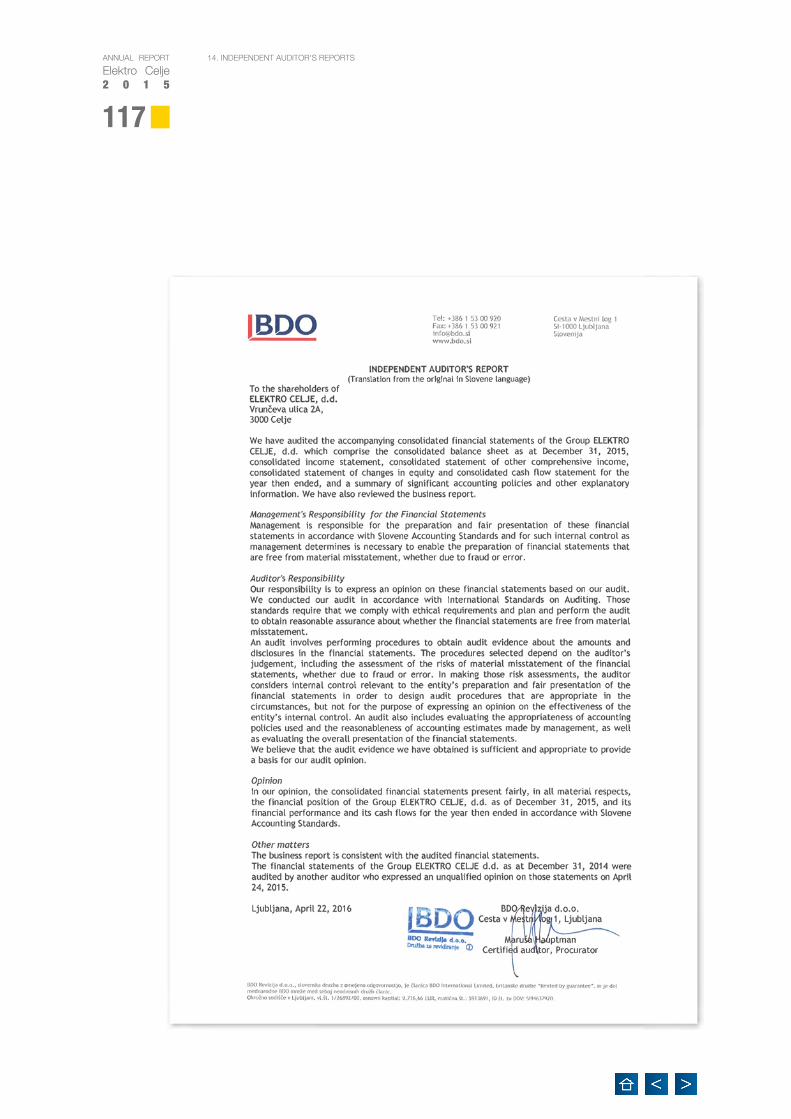
117
ANNUAL REPORT
Elektro Celje2 0 1 5
14. INDEPENDENT AUDITOR'S REPORTS

ANNUAL REPORT
Elektro Celje2 0 1 5
118
15. FINANCIAL STATEMENTS OF THE COMPANY ELEKTRO CELJE
15. FINANCIAL STATEMENTS OF THE COMPANY ELEKTRO CELJE15.1 BALANCE SHEET
ITEM NoteAmount
Current year Previous year
A. Non-current assets (I. + II. + III. + IV. + V. + VI.) 259,214,761 253,443,528
I. Intangible assets and long-term accrued revenue and deferred expenses (1 to 6)
16.3.1 1,156,361 1,384,700
1. Long-term property rights 1,146,160 1,342,171
4. Intangible assets in development 10,051 41,907
6. Other long-term accrued revenue and deferred expenses 150 622
II. Property, plant and equipment (1 to 4) 16.3.2 243,904,942 239,718,420
1. Land and buildings (a + b) 173,752,723 171,550,450
a) Land 5,795,804 5,862,933
b) Buildings 167,956,919 165,687,517
2. Production equipment and machinery 62,087,248 62,596,655
3. Other plant and equipment 93,493 85,313
4. Tangible fixed assets in the course of acquisition (a + b) 7,971,478 5,486,002
a) Property, plant and equipment under construction 7,971,478 5,486,002
IV. Long-term financial investments (1 to 2) 16.3.3 7,580,116 7,683,920
1. Long-term financial investments excl. loans 7,580,116 7,683,920
a) Shares and shareholdings in companies within the corporate group
7,246,975 7,246,975
c) Other shares and shareholdings 333,141 436,945
V. Long-term trade receivables (1 to 3) 16.3.6.1 5,934,882 4,056,389
2. Long-term trade receivables 5,927,233 23,149
3. Long-term trade receivables from others 7,649 4,033,240
VI. Deferred tax asset 16.3.4 638,460 600,099
B. Current assets (I. + II. + III. + IV. + V.) 12,306,938 10,308,179
II. Inventory (1 to 4) 16.3.5 1,380,529 1,392,747
1. Material 1,380,529 1,392,747
IV. Short-term trade receivables (1 to 3) 16.3.6.2 10,902,286 8,808,684
1. Short-term trade receivables from companies within the corporate group
11,772 44,118
2. Short-term trade receivables from customers 10,542,806 8,420,764
3. Short-term trade receivables from others 347,708 343,802
V. Cash and cash equivalents 16.3.7 24,123 106,748
C. Short-term accrued revenue and deferred expenses 16.3.8 739,294 1,061,808
TOTAL ASSETS (A + B + C) 272,260,993 264,813,515
in EUR

119
ANNUAL REPORT
Elektro Celje2 0 1 5
15. FINANCIAL STATEMENTS OF THE COMPANY ELEKTRO CELJE
in EUR
ITEM NoteAmount
Current year Previous year
A. Equity 16.3.9 196,443,080 192,935,102
I. Called-up share capital 100,953,201 100,953,201
1. Share capital 100,953,201 100,953,201
II. Share premium 62,260,317 62,260,317
III. Revenue reserve 30,075,398 25,446,194
1. Legal reserves 2,563,756 2,223,332
5. Other revenue reserves 27,511,642 23,222,862
IV. Revaluation surplus -81,082 75,624
V. Retained earnings 1,217 0
1. Retained earnings from previous years 1,217 0
VI. Net income/ profit for the year 3,234,029 4,199,766
1. Undistributed net income/ profit for the year 3,234,029 4,199,766
B.Provisions and long-term accrued expenses and deferred revenue (1 to 3)
16.3.10 19,644,210 19,127,245
1. Retirement benefits and similar employee benefits 5,409,368 5,140,088
2. Other provisions 615,626 40,000
3. Long-term accrued expenses and deferred revenue 13,619,216 13,947,157
C. Non-current liabilities (I.+ II.+ III.) 16.3.11 33,550,207 36,669,343
I. Non-current financial liabilities (1 to 4) 33,542,731 36,669,343
2. Long-term financial liabilities to banks 33,542,731 36,669,343
III. Deferred tax liabilities 7,476 0
D. Current liabilities (I. + II. + III.) 16.3.12 21,825,063 15,213,956
II. Current financial liabilities (1 to 4) 11,844,758 6,212,529
2. Short-term financial liabilities to banks 11,837,695 6,206,650
4. Other short-term financial liabilities 7,063 5,879
III. Current operating liabilities (1 to 8) 9,980,305 9,001,427
1. Short-term trade payables to companies within the corporate group 686,907 666,203
2. Short-term trade payables to suppliers 3,210,524 2,386,053
4. Short-term trade payables from operations for third-party account 3,845,389 3,344,420
5. Short-term trade payables to employees 1,454,486 1,399,631
6. Short-term trade payables to state and other institutions 308,472 687,678
7. Short-term trade payables based on advances 65,810 73,555
8. Other short-term trade payables 408,717 443,887
E. Short-term accrued expenses and deferred revenue 16.3.13 798,433 867,869
TOTAL LIABILITIES (A + B + C + D + E) 272,260,993 264,813,515

ANNUAL REPORT
Elektro Celje2 0 1 5
120
15. FINANCIAL STATEMENTS OF THE COMPANY ELEKTRO CELJE
15.2 INCOME STATEMENT
ITEM NoteAmount
Current year Previous year
1. Net sales revenue (a + b) 16.5.1 53,791,561 53,919,563
a. In the domestic market 53,791,561 53,919,563
3. Capitalised own products and services 16.5.2 14,324,151 15,117,824
4. Other operating revenue (incl. revaluation surplus) 16.5.3 1,317,814 3,302,527
5. Costs of goods, material and services (a + b) 16.5.4.1 21,326,680 23,088,363
a. Cost of goods and material 14,594,038 16,599,483
b. Cost of services 6,732,642 6,488,880
6. Labour costs (a + b + c + d) 16.5.4.2 21,093,085 19,819,179
a. Cost of salaries 14,974,458 14,519,094
b. Cost of supplementary employee retirement insurance 694,363 668,144
c. Cost of employer contributions and other levies on salaries 2,396,291 2,324,444
d. Other labour costs 3,027,973 2,307,497
7. Write-downs and write-offs (a + b + c) 16.5.4.3 18,100,167 19,375,036
a. Amortisation and depreciation 17,689,500 17,923,351
b. Operating expenses from revaluation of intangible and tangible fixed assets
255,756 1,292,942
c. Operating expenses from revaluation of current assets 154,911 158,743
8. Other operating expenses 16.5.4.4 374,172 307,906
9. Finance income from shareholdings (a + b + c) 16.5.5 7,400 480,313
a. Finance income from shareholdings in companies within the corporate group
0 475,281
b. Finance income from shareholdings in other companies 7,400 5,032
10. Finance income from loans granted (a + b) 16.5.6 2,223 100,219
a. Finance income from loans to companies within the corporate group 395 12,001
b. Finance income from loans to others 1,828 88,218
11. Finance income from trade receivables (a + b) 16.5.7 135,722 51,850
b. Finance income from trade receivables due from third parties 135,722 51,850
12.Financial expenses from impairment and write-downs of financial investments
16.5.8 103,508 0
13. Financial expenses from financial liabilities (a + b + c + d) 16.5.9 977,927 1,280,888
a. Financial expenses related to loans from companies within the corporate group
0 1,239
b. Financial expenses related to loans from banks 720,092 1,102,691
d. Financial expenses related to other financial liabilities 257,835 176,958
14. Financial expenses from trade payables (a + b + c) 16.5.10 757 3,133
a. Financial expenses from trade payables to companies within the corporate group
0 2,882
c. Financial expenses from other trade payables 757 251
15. Other revenue 16.5.11 26,854 17,328
16. Other expenses 16.5.12 63,416 67,039
17.PROFIT FOR THE PERIOD BEFORE TAXES (1±2+3+4-5-6-7-8+9+10+11-12-13-14+15-16)
16.5.13 7,566,013 9,048,080
18. Income tax 16.5.15 784,969 806,567
19. Deferred taxes 16.5.15 27,438 600,099
20.NET PROFIT/LOSS FOR THE PERIOD(1±2+3+4-5-6-7-8+9+10+11-12-13-14+15-16-18+19)
16.5.13 6,808,482 8,841,612
in EUR
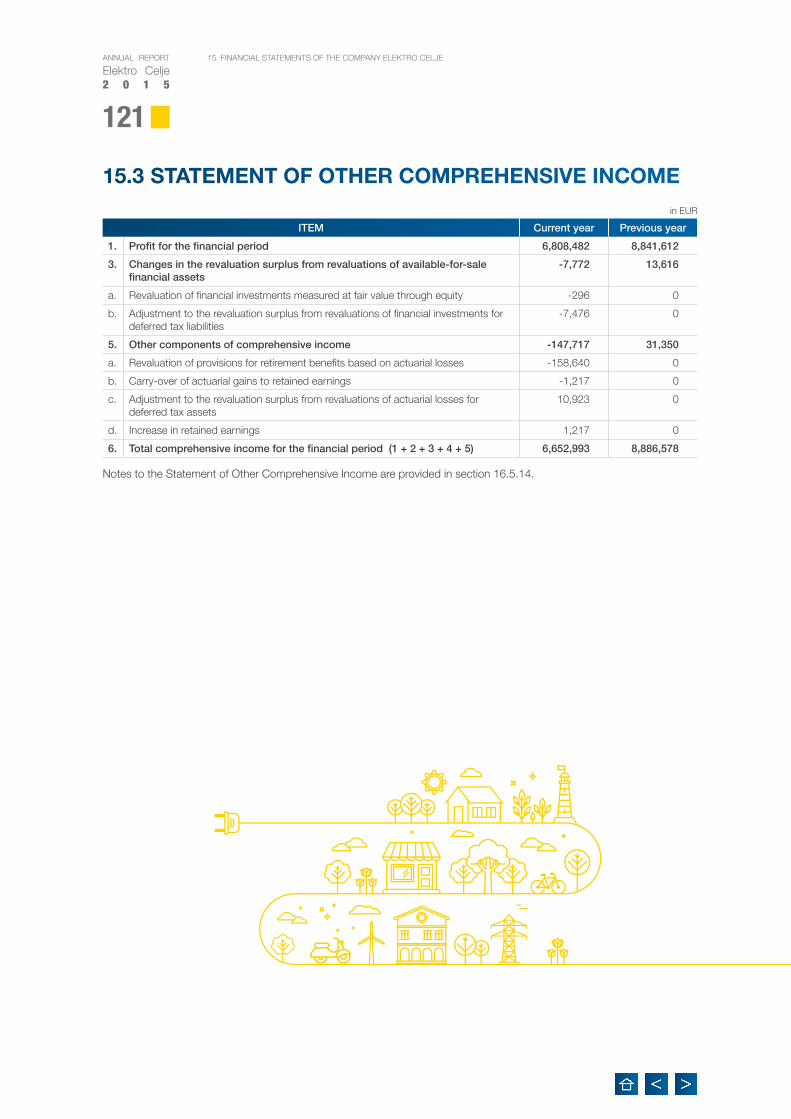
121
ANNUAL REPORT
Elektro Celje2 0 1 5
15. FINANCIAL STATEMENTS OF THE COMPANY ELEKTRO CELJE
15.3 STATEMENT OF OTHER COMPREHENSIVE INCOMEin EUR
ITEM Current year Previous year
1. Profit for the financial period 6,808,482 8,841,612
3. Changes in the revaluation surplus from revaluations of available-for-sale financial assets
-7,772 13,616
a. Revaluation of financial investments measured at fair value through equity -296 0
b. Adjustment to the revaluation surplus from revaluations of financial investments for deferred tax liabilities
-7,476 0
5. Other components of comprehensive income -147,717 31,350
a. Revaluation of provisions for retirement benefits based on actuarial losses -158,640 0
b. Carry-over of actuarial gains to retained earnings -1,217 0
c. Adjustment to the revaluation surplus from revaluations of actuarial losses for deferred tax assets
10,923 0
d. Increase in retained earnings 1,217 0
6. Total comprehensive income for the financial period (1 + 2 + 3 + 4 + 5) 6,652,993 8,886,578
Notes to the Statement of Other Comprehensive Income are provided in section 16.5.14.

ANNUAL REPORT
Elektro Celje2 0 1 5
122
15. FINANCIAL STATEMENTS OF THE COMPANY ELEKTRO CELJE
15.4 STATEMENT OF CASH FLOWSin EUR
Item Note Current year Previous year
1 2 3 4
A. Operating cash flow
a) Operating revenue 16.6.1 100,743,131 101,209,900
Revenue from sale of goods and services 99,587,573 97,316,743
Other operating revenue 1,155,558 3,893,157
b) Operating expenses 16.6.2 -92,249,535 -88,755,029
Purchase of material and services -64,909,390 -63,484,257
Salaries and employees' share in the profit -20,172,295 -19,473,303
Charges (contributions and other taxes) -6,087,820 -4,413,555
Other operating expenses -1,080,030 -1,383,914
c) Net cash inflow or outflow in operating activities 8,493,596 12,454,871
B. Investing cash flow
a) Inflows from investing activities 16.6.3 328,599 4,740,350
Interests and dividends received 9,627 594,877
Proceeds from disposal of property, plant and equipment 258,972 501,473Proceeds from disposal of short-term financial investments in companies within the corporate group
60,000 644,000
Proceeds from disposal of short-term financial investments 0 3,000,000
b) Outflows from investing activities 16.6.4 -7,551,884 -11,053,341
Purchase of intangible fixed assets -869,118 -174,781
Purchase of property, plant and equipment -6,622,766 -10,878,560
Purchase of long-term financial investments 0 0Purchase of short-term financial investments in companies within the corporate group
-60,000 0
Purchase of short-term financial investments 0 0
c) Net cash inflow or outflow in investing activities -7,223,285 -6,312,991
C. Financing cash flow
a) Inflows from financing activities 16.6.5 18,475,000 59,615,000
Loans granted by companies within the corporate group 0 2,570,000
Granted long-term loans 8,775,000 23,415,000
Granted short-term loans 9,700,000 33,630,000
b) Outflows from financing activities 16.6.6 -19,827,936 -65,702,680
Interests paid -738,609 -1,124,965
Repayments of loans granted by companies within the corporate group 0 -2,570,000
Repayments of long-term debt -6,270,567 -25,976,474
Repayments of short-term debt -9,700,000 -33,630,000
Paid out dividends and other profit shares -3,118,760 -2,401,241
c) Net cash inflow or outflow in financing activities -1,352,936 -6,087,680
D. Closing balance 24,123 106,748Cash and cash equivalents in the period (sum of net cash inflows/outflows under Ac, Bc and Cc)
-82,625 54,200
Opening balance 106,748 52,548

123
ANNUAL REPORT
Elektro Celje2 0 1 5
15. FINANCIAL STATEMENTS OF THE COMPANY ELEKTRO CELJE
15.5 STATEMENT OF CHANGES IN EQUITY
in E
UR
STA
TE
ME
NT
OF
CH
AN
GE
S IN
EQ
UIT
Yfr
om
Jan
1, 2
015
to D
ec 3
1, 2
015
Cal
led
-up
ca
pita
lR
even
ue r
eser
ve
Rev
alua
tion
surp
lus
Ret
aine
d
earn
ing
s
Net
in
com
e/p
rofit
fo
r th
e ye
arTo
tal
Sha
re
cap
ital
Sha
re
pre
miu
mLe
gal
re
serv
es
Oth
er
reve
nue
rese
rve
Ret
aine
d
earn
ing
s
Net
in
com
e/p
rofit
fo
r th
e ye
ar
A.1
.B
alan
ce a
t th
e en
d o
f p
revi
ous
per
iod
100,
953,
201
62,2
60,3
172,
223,
332
23,2
22,8
6275
,624
04,
199,
766
192,
935,
102
A.2
.B
alan
ce a
t th
e b
egin
ning
of
the
rep
ort
ing
p
erio
d10
0,95
3,20
162
,260
,317
2,22
3,33
223
,222
,862
75,6
240
4,19
9,76
619
2,93
5,10
2
B.1
.C
hang
es in
eq
uity
- t
rans
actio
ns w
ith
shar
eho
lder
s0
00
00
-3,1
45,0
150
-3,1
45,0
15
a)P
aym
ent o
f div
iden
ds0
00
00
-3,1
45,0
150
-3,1
45,0
15
B.2
.To
tal c
om
pre
hens
ive
inco
me
in t
he
rep
ort
ing
per
iod
00
00
-156
,706
1,21
76,
808,
482
6,65
2,99
3
a)E
ntry
of n
et in
com
e/ p
rofit
for
the
repo
rtin
g pe
riod
00
00
00
6,80
8,48
26,
808,
482
b)C
hang
es in
the
reva
luat
ion
surp
lus
from
re
valu
atio
ns o
f fina
ncia
l inv
estm
ents
00
00
-7,7
720
0-7
,772
c)O
ther
com
pone
nts
of to
tal c
ompr
ehen
sive
in
com
e in
the
repo
rtin
g pe
riod
00
00
-148
,934
1,21
70
-147
,717
B.3
.C
hang
es in
eq
uity
00
340,
424
4,28
8,78
00
3,14
5,01
5-7
,774
,219
0
a)A
lloca
tion
of th
e re
mai
nder
of n
et p
rofit
of
2014
to o
ther
equ
ity c
ompo
nent
s0
00
00
4,19
9,76
6-4
,199
,766
0
b)
Allo
catio
n of
a p
art o
f net
pro
fit o
f 201
5 to
ot
her
equi
ty c
ompo
nent
s pu
rsua
nt to
the
deci
sion
by
the
man
agem
ent a
nd s
uper
viso
ry
bodi
es
00
340,
424
3,23
4,02
90
0-3
,574
,453
0
c)A
lloca
tion
of a
par
t of n
et p
rofit
into
bui
ldin
g up
ad
ditio
nal r
eser
ves
purs
uant
to th
e de
cisi
on b
y th
e S
hare
hold
ers
Ass
embl
y0
00
1,05
4,75
10
-1,0
54,7
510
0
C.1
.B
alan
ce a
t th
e en
d o
f th
e re
po
rtin
g p
erio
d10
0,95
3,20
162
,260
,317
2,56
3,75
627
,511
,642
-81,
082
1,21
73,
234,
029
196,
443,
080
DIS
TR
IBU
TAB
LE P
RO
FIT
00
00
01,
217
3,23
4,02
93,
235,
246
Notes to the Statement of Changes in Equity are provided in section 16.7.

ANNUAL REPORT
Elektro Celje2 0 1 5
124
15. FINANCIAL STATEMENTS OF THE COMPANY ELEKTRO CELJE
15.5 STATEMENT OF CHANGES IN EQUITY
in E
UR
STA
TE
ME
NT
OF
CH
AN
GE
S IN
EQ
UIT
Yfr
om
Jan
1, 2
014
to D
ec 3
1, 2
014
Cal
led
-up
ca
pita
lR
even
ue r
eser
ve
Rev
alua
tion
surp
lus
Ret
aine
d
earn
ing
s
Net
in
com
e/p
rofit
fo
r th
e ye
arTo
tal
Sha
re
cap
ital
Sha
re
pre
miu
mLe
gal
re
serv
es
Oth
er
reve
nue
rese
rve
Ret
aine
d
earn
ing
s
Net
in
com
e/p
rofit
fo
r th
e ye
ar
A.1
.B
alan
ce a
t th
e en
d o
f p
revi
ous
per
iod
100,
953,
201
62,2
60,3
171,
781,
251
18,7
91,5
0030
,658
02,
650,
839
179,
405,
335
A.2
.B
alan
ce a
t th
e b
egin
ning
of
the
rep
ort
ing
p
erio
d10
0,95
3,20
162
,260
,317
1,78
1,25
118
,791
,500
30,6
580
2,65
0,83
918
6,46
7,76
6
B.1
.C
hang
es in
eq
uity
- t
rans
actio
ns w
ith
shar
eho
lder
s0
00
00
-2,4
19,2
420
-2,4
19,2
42
a)P
aym
ent o
f div
iden
ds0
00
00
-2,4
19,2
420
-2,4
19,2
42
B.2
.To
tal c
om
pre
hens
ive
inco
me
in t
he
rep
ort
ing
per
iod
00
00
44,9
660
8,84
1,61
28,
886,
578
a)E
ntry
of n
et in
com
e/ p
rofit
for
the
repo
rtin
g pe
riod
00
00
00
8,84
1,61
28,
841,
612
b)C
hang
es in
the
reva
luat
ion
surp
lus
from
re
valu
atio
ns o
f fina
ncia
l inv
estm
ents
00
00
13,6
160
013
,616
c)O
ther
com
pone
nts
of to
tal c
ompr
ehen
sive
in
com
e in
the
repo
rtin
g pe
riod
00
00
31,3
500
031
,350
B.3
.C
hang
es in
eq
uity
00
442,
081
4,43
1,36
20
2,41
9,24
2-7
,292
,685
0
a)A
lloca
tion
of th
e re
mai
nder
of n
et p
rofit
of
2013
to o
ther
equ
ity c
ompo
nent
s0
00
00
2,65
0,83
9-2
,650
,839
0
b)
Allo
catio
n of
a p
art o
f net
pro
fit o
f 201
4 to
ot
her
equi
ty c
ompo
nent
s pu
rsua
nt to
the
deci
sion
by
the
man
agem
ent a
nd s
uper
viso
ry
bodi
es
00
442,
081
4,19
9,76
50
0-4
,641
,846
0
c)A
lloca
tion
of a
par
t of n
et p
rofit
into
bui
ldin
g up
ad
ditio
nal r
eser
ves
purs
uant
to th
e de
cisi
on b
y th
e S
hare
hold
ers
Ass
embl
y0
00
231,
597
0-2
31,5
970
0
C.1
.B
alan
ce a
t th
e en
d o
f th
e re
po
rtin
g p
erio
d10
0,95
3,20
162
,260
,317
2,22
3,33
223
,222
,862
75,6
240
4,19
9,76
619
2,93
5,10
2
DIS
TR
IBU
TAB
LE P
RO
FIT
00
00
00
4,19
9,76
64,
199,
766
Notes to the Statement of Changes in Equity are provided in section 16.7.

125
ANNUAL REPORT
Elektro Celje2 0 1 5
16. EXPLANATORY NOTES TO THE FINANCIAL STATEMENTS
16. EXPLANATORY NOTES TO THE FINANCIAL STATEMENTSThe company Elektro Celje, d.d., is organised as a public limited company with the head office at 2a Vrunčeva in Celje. The key purpose of the company is, through main-
tenance of and investment into the power network and infrastructure, to meet the needs of its customers for a reliable electricity supply.
16.1 Bases for the Preparation of Financial StatementsThe financial statements present a faithful and fair account of the financial position of the company, its financial per-formance and cash flows. The fiscal year is the calendar year from January 1 to December 31, 2015.
Declaration of conformityThe financial statements of the company Elektro Celje are developed in conformity with the provisions of the Com-panies Act (ZGD-1); Slovenian Accounting Standards (SAS), the relevant interpretations and explanations, ac-counting rules and regulations; Energy Act (EZ-1); and other regulations governing the accounting, finance and tax systems. The Annual Report includes all disclosures required by ZGD-1, and disclosures pursuant to SAS for companies subject to mandatory audit.
Pursuant to Article 109 of EZ-1, the company provides separate accounting for the activities related to the Agree-
ment on the Lease of Electricity Distribution Infrastructure and Provision of Services for the Distribution Network Sys-tem Operator, and for market activities; pursuant to the SAS, these two activities are also considered two busi-ness segments. The Balance Sheet, the Income State-ment, the Statement of Cash Flows and the Statement of Changes in Equity broken down by activities are set out in section 16.10.
On March 31, 2016, the company Management Board confirmed and adopted the financial statements of the Annual Report for the year 2015, including the explana-tory notes provided and the accounting policies applied thereto.
Functional and presentational currencyThe financial statements are compiled in Euros (EUR) and reported rounded up to the nearest whole unit (no cents).
16.2 Principal Accounting PoliciesSAS are directly applied in reporting and valuation of items recorded in the financial statements. The items for which the SAS allow a choice between various valuation meth-ods, are defined according to the accounting policies dis-closed in the Annual Report for each individual item. In 2015, the company did not introduce any changes to the accounting policies in use.In compiling the financial statements, the company abides by the general valuation rules: going concern, consistency and accruals. In doing so it observes the quality charac-teristics of financial statements: readability, adequacy, reli-ability and comparability. The selection and application of the accounting policies is based on prudence, substance over form, and relevance.In compliance with the provisions of the SAS, the company discloses all material items; the relevance of the individual items is defined in the accounting rules and regulations.
Intangible assets and long-term accrued revenue and deferred expenses
Measurement upon initial recognitionIntangible assets are initially recognised at cost.
Measurement after recognition
For measurement after the recognition, the company uses the historical cost model. Historical costs are subsequent-ly reduced through amortisation.
Amortisation/depreciation and useful lifeThe straight-line amortisation method is used. Amortisa-tion and depreciation rates based on useful life are 33.33 % for computer software (estimated useful life 3 years), 3.33 % for the right to use a facility (estimated useful life 30 years) and 1 % for material rights on property (estimated useful life 100 years). The amortisation/depreciation of an asset begins on the first day of the month after the asset has been made ready for use.
Tangible fixed assets – PP&E
Measurement upon initial recognitionInitial recognition of a tangible fixed asset – property, plant and equipment – is at cost, which includes purchase price, import and non-refundable duties, and costs direct-ly attributable to the activities necessary to prepare the asset for its intended use. If the period from the date of the first invoice for the construction and installation service or equipment to the date when the fixed asset is prepared for its intended use is longer than one year, the cost of the

ANNUAL REPORT
Elektro Celje2 0 1 5
126
16. EXPLANATORY NOTES TO THE FINANCIAL STATEMENTS
asset also includes loan costs related to the acquisition of the new asset for the period from the payment deadline of each invoice to the date of preparation of the asset. If the cost of the asset is high, it is reallocated over its relative parts. If these parts have significantly different useful lives in relation to the total cost of the tangible fixed asset, each part is recorded separately.
Land is valued at cost, which also includes paid land and building transaction tax and land registry fee.
The cost of a building includes costs incurred in the acqui-sition, construction or completion of the building, costs of the project and other documentation on the basis of which the acquisition, construction or completion was carried out, costs of land development, costs of required permits for connection, and other costs directly attributable to the preparation of the building for its intended use. The cost does not include the cost of the land on which the building is built, nor the cost of the acquisition of land intended for access to the building or for other purposes related to the use of the building.
The cost of equipment includes costs incurred in the ac-quisition, construction or completion of the equipment, costs of delivery, costs of installation, and any other costs incurred in the acquisition, construction or completion of the equipment.
The cost of a tangible fixed asset built or made within the company consists of the costs resulting from its construc-tion or manufacture, and of indirect costs of construction
or manufacture attributable to the asset. The cost does not include costs unrelated to its construction or manu-facture, and costs not recognised by the market. The cost of such fixed assets cannot exceed that of the same or similar assets on the market. Investments of the company are classified into:
• refurbishment, including investments to extend the ini-tially defined useful life of an asset
• replacements and increase of capacity, including invest-ments to replace and increase the capacity of existing assets
• new investments as investments toward acquiring new assets.
Measurement after recognitionIn the valuation of tangible fixed assets (PP&E) the com-pany uses the cost model, carrying the assets at cost minus accumulated depreciation and impairment. Assets acquired free of charge are valued at cost or at the fair value determined in the free acquisition agreement.
Subsequent costsSubsequently incurred costs related to PP&E are recorded as maintenance costs when they are incurred in the pro-cess of restoring and maintaining future economic ben-efits expected as per the initial estimate of the efficiency rate, or as an increase in the cost of the asset if the future benefits increase compared to the initial estimate.
Depreciation and useful life
The depreciation of a tangible fixed asset begins on the first day of the month after the asset has been made avail-able for use. The company observes the straight-line de-preciation method. The depreciation rates are defined in conformity with the expected useful life of the asset. De-preciation is applied individually until it completely replaces the original value of the asset taken as the basis for the calculation. The revaluation adjustment applied to the fixed asset equals the value computed in the annual deprecia-tion calculation. Land and assets of artistic and cultural value are not subject to depreciation.
The company regularly reviews the remaining carrying value of the PP&E for indications of impairment. In case of impairment, the recoverable value of the asset is esti-mated. As a rule, the company revalues the asset as soon
as its carrying value surpasses the recoverable value. The recoverable value is the higher of fair vale minus selling cost and value in use. The value of land, buildings and distribution equipment is estimated by certified appraisers. As a rule, the company does not recognise impairment of other equipment, as it represents less than 5 % of total fixed assets. Tangible fixed assets (PP&E) acquired prior to December 31, 2001, are recorded at values estimated in 2001.
The remaining carrying value of a fixed asset without useful life is recognised as an expense from revaluation; if such asset is sold and its net marketable value exceeds the carrying value, such value is recognised as revenue from revaluation.
Depreciation rates and useful life Minimum (in %) Maximum (in %) Useful life
Buildings 2.00 2.50 40 to 50 years
Infrastructural facilities 2.00 5.00 20 to 50 years
Electrical equipment of transformer substations 2.86 6.67 15 to 35 years
Other equipment 4.00 33.00 3 to 25 years
Motor vehicles 8.33 12.50 8 to 12 years
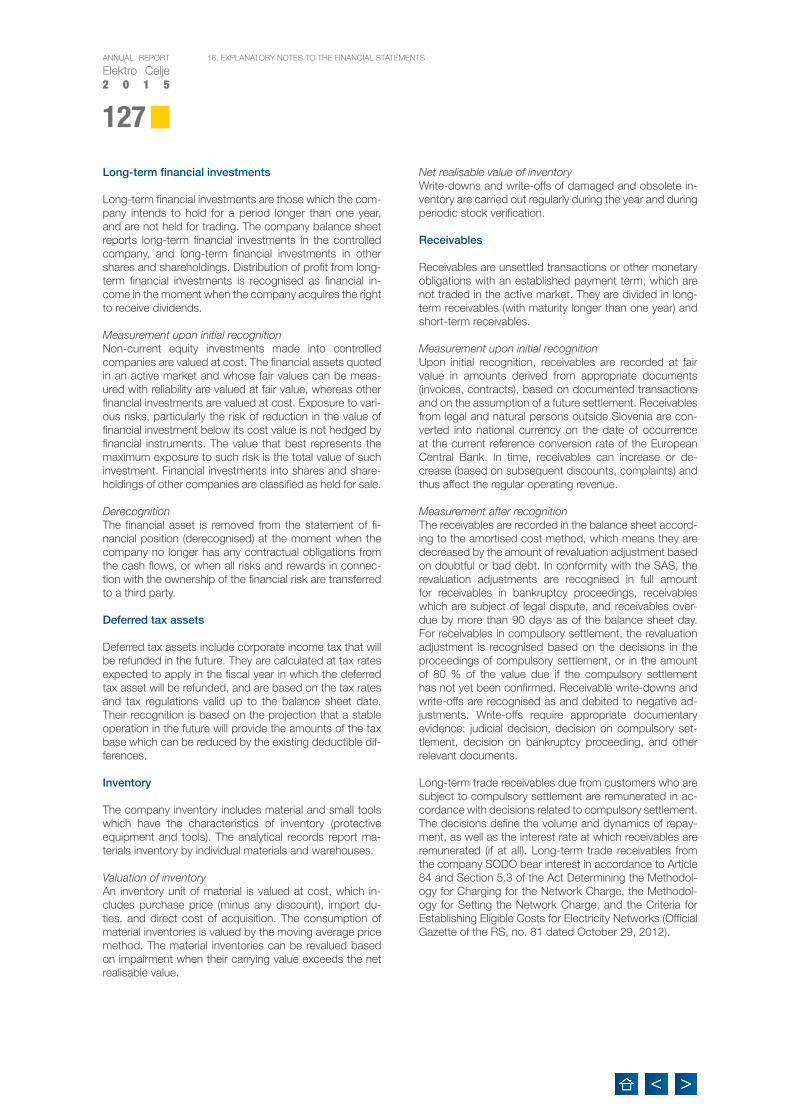
127
ANNUAL REPORT
Elektro Celje2 0 1 5
16. EXPLANATORY NOTES TO THE FINANCIAL STATEMENTS
Long-term financial investments
Long-term financial investments are those which the com-pany intends to hold for a period longer than one year, and are not held for trading. The company balance sheet reports long-term financial investments in the controlled company, and long-term financial investments in other shares and shareholdings. Distribution of profit from long-term financial investments is recognised as financial in-come in the moment when the company acquires the right to receive dividends.
Measurement upon initial recognitionNon-current equity investments made into controlled companies are valued at cost. The financial assets quoted in an active market and whose fair values can be meas-ured with reliability are valued at fair value, whereas other financial investments are valued at cost. Exposure to vari-ous risks, particularly the risk of reduction in the value of financial investment below its cost value is not hedged by financial instruments. The value that best represents the maximum exposure to such risk is the total value of such investment. Financial investments into shares and share-holdings of other companies are classified as held for sale.
DerecognitionThe financial asset is removed from the statement of fi-nancial position (derecognised) at the moment when the company no longer has any contractual obligations from the cash flows, or when all risks and rewards in connec-tion with the ownership of the financial risk are transferred to a third party.
Deferred tax assets
Deferred tax assets include corporate income tax that will be refunded in the future. They are calculated at tax rates expected to apply in the fiscal year in which the deferred tax asset will be refunded, and are based on the tax rates and tax regulations valid up to the balance sheet date. Their recognition is based on the projection that a stable operation in the future will provide the amounts of the tax base which can be reduced by the existing deductible dif-ferences.
Inventory
The company inventory includes material and small tools which have the characteristics of inventory (protective equipment and tools). The analytical records report ma-terials inventory by individual materials and warehouses.
Valuation of inventoryAn inventory unit of material is valued at cost, which in-cludes purchase price (minus any discount), import du-ties, and direct cost of acquisition. The consumption of material inventories is valued by the moving average price method. The material inventories can be revalued based on impairment when their carrying value exceeds the net realisable value.
Net realisable value of inventoryWrite-downs and write-offs of damaged and obsolete in-ventory are carried out regularly during the year and during periodic stock verification.
Receivables
Receivables are unsettled transactions or other monetary obligations with an established payment term, which are not traded in the active market. They are divided in long-term receivables (with maturity longer than one year) and short-term receivables.
Measurement upon initial recognitionUpon initial recognition, receivables are recorded at fair value in amounts derived from appropriate documents (invoices, contracts), based on documented transactions and on the assumption of a future settlement. Receivables from legal and natural persons outside Slovenia are con-verted into national currency on the date of occurrence at the current reference conversion rate of the European Central Bank. In time, receivables can increase or de-crease (based on subsequent discounts, complaints) and thus affect the regular operating revenue.
Measurement after recognitionThe receivables are recorded in the balance sheet accord-ing to the amortised cost method, which means they are decreased by the amount of revaluation adjustment based on doubtful or bad debt. In conformity with the SAS, the revaluation adjustments are recognised in full amount for receivables in bankruptcy proceedings, receivables which are subject of legal dispute, and receivables over-due by more than 90 days as of the balance sheet day. For receivables in compulsory settlement, the revaluation adjustment is recognised based on the decisions in the proceedings of compulsory settlement, or in the amount of 80 % of the value due if the compulsory settlement has not yet been confirmed. Receivable write-downs and write-offs are recognised as and debited to negative ad-justments. Write-offs require appropriate documentary evidence: judicial decision, decision on compulsory set-tlement, decision on bankruptcy proceeding, and other relevant documents.
Long-term trade receivables due from customers who are subject to compulsory settlement are remunerated in ac-cordance with decisions related to compulsory settlement. The decisions define the volume and dynamics of repay-ment, as well as the interest rate at which receivables are remunerated (if at all). Long-term trade receivables from the company SODO bear interest in accordance to Article 84 and Section 5.3 of the Act Determining the Methodol-ogy for Charging for the Network Charge, the Methodol-ogy for Setting the Network Charge, and the Criteria for Establishing Eligible Costs for Electricity Networks (Official Gazette of the RS, no. 81 dated October 29, 2012).

ANNUAL REPORT
Elektro Celje2 0 1 5
128
16. EXPLANATORY NOTES TO THE FINANCIAL STATEMENTS
Cash and cash equivalents
Cash and cash equivalents include cash in current ac-counts and deposits redeemable at notice. They are rec-ognised in the amounts arising from the relevant docu-ments, upon verification of the nature of such.
Equity
Equity is the liability to company owners (shareholders) to be liquidated when the company goes out of business. It is defined by the amounts invested in the company by the owners, and by the amounts generated during operation that belong to the owners. Equity decreases due to oper-ating losses and through the payment of dividends. Total equity includes share capital, share premium, revenue re-serves, retained earnings, and fair value reserve.
Provisions and long-term accrued expenses and de-ferred revenue
The purpose of provisions is to collect amounts, in the form of accrued costs or expenses, which will allow the coverage of costs or expenses incurred in the future. This item includes deferred revenue which will cover the pro-jected expenses over a period longer than one year. Provi-sions and long-term accrued expenses and deferred rev-enue are not revalued. At the end of the accounting period they are adjusted to reconcile their value with the current value of the expenses that are estimated to be necessary to cover the liabilities.
Provisions for payments of retirement benefits and long-service awardsPursuant to statutory provisions and the collective agree-ment, the company is obliged to pay long-service awards to its employees, benefits upon retirement, and allowance in the case of death, for which long-term provisions are recognised. Liabilities from provisions for long-service awards were calculated using the Projected Unit Credit method based on the multiple decrement model. The income statement recognises labour costs and interest charges, while adjustments of post-employment benefits or unrealised actuarial gains or losses are included in the other comprehensive income statement. There are no other retirement liabilities.
Provisions for lawsuitsThe company recognises provisions for lawsuits in which it is represented as the defendant. The justification of the recognised provisions is verified on a yearly basis in view of the status of a legal dispute and probability of favour-able or unfavourable outcome. The amount of provision is determined based on the known amount of the damage claim, or on the projected possible amount of the damage claim if the claim is still unknown.
Long-term accrued expenses and deferred revenue The company recognises long-term accrued expenses and deferred revenue for fixed assets acquired free of charge, which are classified by categories based on the depreciation rate of the assets. Such accruals and de-ferrals are intended for covering depreciation costs and
are drawn at the depreciation rate of the acquired assets starting in the subsequent month. The company also rec-ognises long-term accrued expenses and deferred rev-enue for average connection fees charged in the period up to June 30, 2007. These are intended for covering the depreciation of assets and are used through carry-overs to operating revenue at the prevailing rate for fixed assets of power infrastructure - i.e., at a 3 % rate.
Liabilities
Company liabilities are classified by type in financial liabili-ties and trade payables, and by payment deadline in long-term and short-term liabilities. Short-term liabilities are li-abilities due for payment in a period shorter than one year.
Valuation upon initial recognitionUpon initial recognition, liabilities are reported in the amounts arising from relevant documents regarding their occurrence, which in the case of short-term financial debt confirm the receipt of a loan, liability for the payment of interest or dividends, discharge of an operating debt, or, in the case of short-term operating debt, the receipt of a product or service or work completed or the cost charged, and expense or share in profit.
Measurement after recognitionLiabilities are measured based on their amortised cost. Before compiling the financial statements, the company estimates the fair value of short-term liabilities based on contracts, and if the carrying values are lower than the established fair values, it increases the value of its short-term debt. Increased short-term debt increases regular financial expenses, whereas decreased short-term debt increases regular financial income. The company does not recognise or report short-term debt impairment.
Short-term liabilities denominated in foreign currency are converted into national currency on the balance sheet day at the current reference conversion rate of the European Central Bank.
DerecognitionA liability is removed from the statement of financial posi-tion only when the related obligation is settled, cancelled or has expired. The difference between the carrying value of the derecognised financial liability and the payment is recognised in the income statement.
Income Tax
The income tax for the fiscal year includes current and deferred taxes. Current tax is that tax which the company pays from the taxable profit for the year, with the applica-tion of the tax rates effective on the reporting date and established on the date of the Statement of Financial Posi-tion, and which takes into account any adjustments to tax liabilities related to previous fiscal years.
The deferred tax is reported according to the balance sheet liability method, which takes into account tempo-rary differences between the carrying and tax values of individual assets and liabilities. The amount of the deferred
129
ANNUAL REPORT
Elektro Celje2 0 1 5
16. EXPLANATORY NOTES TO THE FINANCIAL STATEMENTS
tax is based on the expected manner of recovery or set-tlement of the carrying value of assets and liabilities using the tax rates applicable on the reporting date.
The deferred tax asset is recognised in the amount of probable available future profit against which the deferred tax asset can be charged in the future. Deferred tax assets are reduced by the amount for which it is no longer likely that it can be claimed against tax in relation to the asset.
Revenue
Revenue is recognised if the increase of economic benefit in the accounting period is related to the increase in the value of assets or decrease in liabilities and if this increase can be measured with reliability. Revenue is broken down into operating revenue, finance income, and other income.
Operating revenue includes net sales revenue, capi-talised own products and services, and other operating revenue.
Net sales revenue is recognised upon sales of products or services if it can be reasonably expected that the sales will lead to receipts when such receipts are not realised upon occurrence. Such revenue is measured based on the selling prices reported on invoices and other docu-ments, minus any returns and discounts granted at the moment of sale or subsequently on the grounds of early payment. Recognition of revenue from services rendered is based on the method of work completion rate on the balance sheet date.
Capitalised own services are services rendered for the company’s own needs and capitalised among tangible fixed assets or intangible non-current assets.
Finance income includes income from dividends re-ceived and participation in profit of subsidiaries; received interest on deposits, loans granted and cash in current accounts; exchange gains; and late charges on overdue payments of network charges and services rendered. Revenue from interest is recognised on the date of its oc-currence using the effective interest rate, income from divi-dends on the date when the shareholder’s right to receive payment is exercised, and late charges on overdue pay-ments of network charge and services rendered at settle-ment when there is no doubt with respect to their amount and maturity date.
Costs and expenses
Costs and expenses are recognised when the decrease of economic benefit in the accounting period is connected with the decreased value of assets or increase in liabilities and this increase can be measured with reliability. Costs and expenses are broken down into operating, financial and other expenses.
Operating expenses include costs of goods, material and services, labour costs, write-downs, and other oper-ating expenses. Labour costs include salaries and other labour costs in gross amounts, as well as contributions paid from these taxable bases, which are not comprised in the said gross amounts. The company paid the salaries in compliance with the provisions of general and industry collective agreements and individual employment con-tracts. Write-downs include depreciation and amortisa-tion expenses, and operating expenses from revaluation. Depreciation was calculated based on the depreciation rates established by the single commission of the five dis-tribution companies with respect to the useful life of fixed assets. Operating expenses from revaluation occur in rela-tion to the impairment of tangible, intangible and current assets.
Financial expenses include expenses related to loans, impairment and write-downs of financial investments, ex-change losses, and other expenses, and are recognised when charged, regardless of any related payments. Ex-penses related to loans received are recognised in the in-come statement by the effective interest method, except those which are capitalised and allocated to tangible fixed assets in the course of construction or development. Fi-nancial expenses are broken down into expenses related to the generation of operating revenue and expenses re-lated to the generation of finance income.
Statement of other comprehensive income
The statement of comprehensive income is a finan-cial statement which faithfully and fairly presents all the components of the income statement and, in addition, includes those items of income and expenses which are not recognised in the profit or loss, but affect the amount of equity.
The company uses version I of the profit and loss accord-ing to SAS 25.5. This additional statement reports the total comprehensive income including items laid down in points 18 to 24 of section 25.8 of the SAS, and items laid down in points 25 to 29 of section 25.10 of the SAS.
Statement of cash flows
The statement of cash flows faithfully and fairly presents the changes in inflows and outflows in operating, investing and financing activities.
Cash and cash equivalents in the cash flow statement include cahs in current accounts, cash items in the pro-cess of collection, and deposits redeemable at notice. The statement of cash flows is compiled using the direct method, in line-by-line form (version I).
Sales revenue includes value added tax and excise du-ties; cash flow items in investing and financing activities are reported in non-offset amounts. The data for the items of the statement of cash flows are derived from analytical records, current account summaries, and offsets.

ANNUAL REPORT
Elektro Celje2 0 1 5
130
16. EXPLANATORY NOTES TO THE FINANCIAL STATEMENTS
16.3 Disclosure of Items in the Balance Sheet Balance sheet is a fundamental financial statement pre-senting a fair account of assets and liabilities as of the end of the 2015 fiscal year. It is compiled in sequential order, as defined in the SAS under 24.4 and in the Companies Act.
The items in the balance sheet are reported in carrying amounts as the difference between total value and revalu-ation adjustment. The principle of individual valuation of assets and liabilities is observed.
16.3.1 Intangible Assets and Long-term Accrued Revenue and Deferred ExpensesIntangible non-current assets include long-term property rights and such assets in development (ERP software).
In 2015, investments into software in the amount of EUR 1,076,446 represented the greater share of property rights (carrying value of the refurbishment of eIS software EUR 431,830; of the DMS system EUR 169,012; of the MAXIMO programme system 123,394 EUR; of the ADV. LANDIS + GYR programme system EUR 56,416 etc.). The remaining part of property rights includes material rights to use vacation apartments for a period of 30 years in the
amount of EUR 28,519 EUR, and investments into real property rights in the amount of EUR 41,195.
The value of new acquisitions in 2015 amounted to EUR 504,864, that of the activation to EUR 536,720. The two largest activation items in 2015 were the upgrade of the DMS system (EUR 203,395) and investment into the MAXIMO software (EUR 143,294).
Intangible assets are not revalued, as they represent less than 1 % of total asset value.
As of December 31, 2015, the company reports trade payables in the amount of EUR 37,227 for the acquisi-
tion of intangible assets. No intangible asset is pledged as security for debt.
Intangible non-current assets (in EUR) Dec 31, 2015 Dec 31, 2014
Property rights 1,146,160 1,342,171
Intangible assets in development 10,051 41,907
Other long-term accrued revenue and deferred expenses 150 622
Total 1,156,361 1,384,700
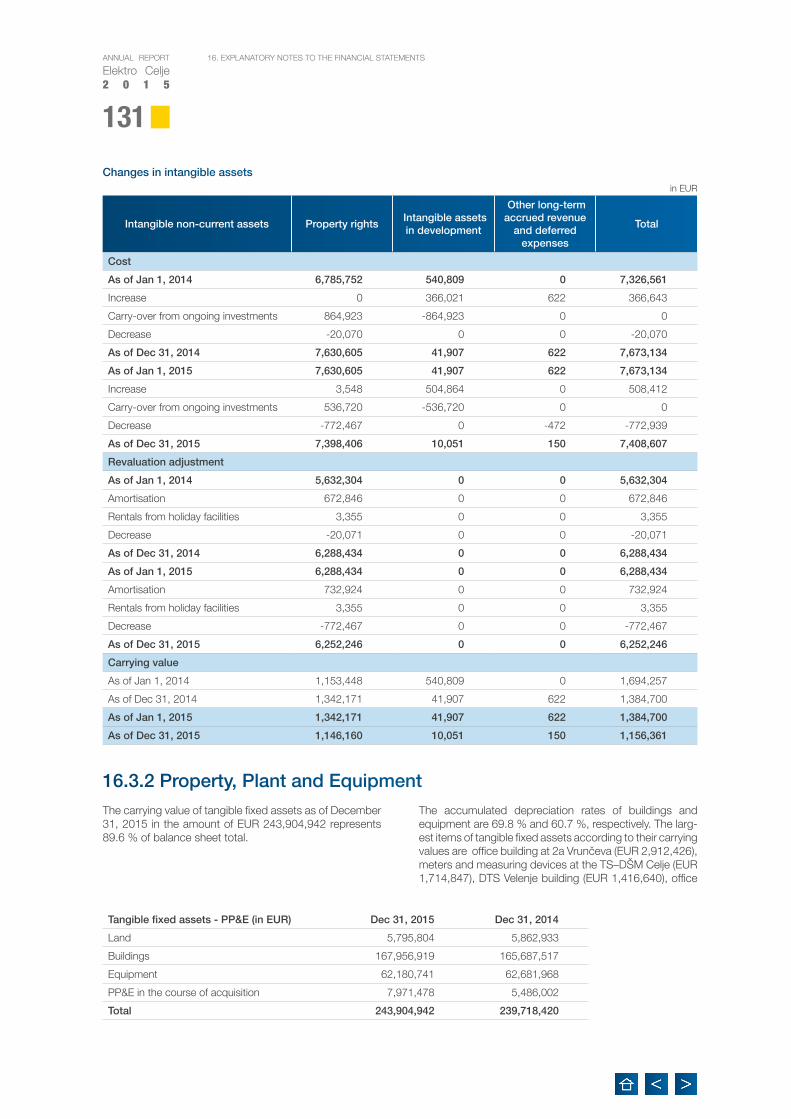
131
ANNUAL REPORT
Elektro Celje2 0 1 5
16. EXPLANATORY NOTES TO THE FINANCIAL STATEMENTS
16.3.2 Property, Plant and EquipmentThe carrying value of tangible fixed assets as of December 31, 2015 in the amount of EUR 243,904,942 represents 89.6 % of balance sheet total.
The accumulated depreciation rates of buildings and equipment are 69.8 % and 60.7 %, respectively. The larg-est items of tangible fixed assets according to their carrying values are office building at 2a Vrunčeva (EUR 2,912,426), meters and measuring devices at the TS–DŠM Celje (EUR 1,714,847), DTS Velenje building (EUR 1,416,640), office
Intangible non-current assets Property rights Intangible assets in development
Other long-term accrued revenue
and deferred expenses
Total
Cost
As of Jan 1, 2014 6,785,752 540,809 0 7,326,561
Increase 0 366,021 622 366,643
Carry-over from ongoing investments 864,923 -864,923 0 0
Decrease -20,070 0 0 -20,070
As of Dec 31, 2014 7,630,605 41,907 622 7,673,134
As of Jan 1, 2015 7,630,605 41,907 622 7,673,134
Increase 3,548 504,864 0 508,412
Carry-over from ongoing investments 536,720 -536,720 0 0
Decrease -772,467 0 -472 -772,939
As of Dec 31, 2015 7,398,406 10,051 150 7,408,607
Revaluation adjustment
As of Jan 1, 2014 5,632,304 0 0 5,632,304
Amortisation 672,846 0 0 672,846
Rentals from holiday facilities 3,355 0 0 3,355
Decrease -20,071 0 0 -20,071
As of Dec 31, 2014 6,288,434 0 0 6,288,434
As of Jan 1, 2015 6,288,434 0 0 6,288,434
Amortisation 732,924 0 0 732,924
Rentals from holiday facilities 3,355 0 0 3,355
Decrease -772,467 0 0 -772,467
As of Dec 31, 2015 6,252,246 0 0 6,252,246
Carrying value
As of Jan 1, 2014 1,153,448 540,809 0 1,694,257
As of Dec 31, 2014 1,342,171 41,907 622 1,384,700
As of Jan 1, 2015 1,342,171 41,907 622 1,384,700
As of Dec 31, 2015 1,146,160 10,051 150 1,156,361
Changes in intangible assets
Tangible fixed assets - PP&E (in EUR) Dec 31, 2015 Dec 31, 2014
Land 5,795,804 5,862,933
Buildings 167,956,919 165,687,517
Equipment 62,180,741 62,681,968
PP&E in the course of acquisition 7,971,478 5,486,002
Total 243,904,942 239,718,420
in EUR

ANNUAL REPORT
Elektro Celje2 0 1 5
132
16. EXPLANATORY NOTES TO THE FINANCIAL STATEMENTS
building at 1 Mariborska (EUR 1,063,471), Mestinje busi-ness building (EUR 1,050,708), 110 kV switching gear DTS Žalec 110/20 kV (EUR 975,811), the DTS Brežice building (EUR 948,903), ZMF three-phase direct connec-tion meters (EUR 857,262), switching gear 20/10 kV DTS Velenje (EUR 839,441), and DTS Žalec 110/20 kV facility (EUR 827,839).
The largest activations were the construction of the un-derground cable connecting DTS Trnovlje and DTS Lava (EUR 755,651) and renovation of the overhead power lines OPL 20kV DV Podplat - RTP Šentjur (EUR 383,919), OPL 20kV Ravne Žerjav (EUR 233,959), OPL 20kV Loke (EUR 174,845), OPL 20kV Laško – Brestanica (EUR 159,931), and OPL DV 20kV Polzela (EUR 148.541). We completed the construction of the OPL 20kV Ponikva - TP Hramše (EUR 209,858) and the connection of underground cable 20kV from OPL Jagoče to TS Gavge (EUR 148,089). In 2015, we carried out replacements or first installations of 14,402 different electricity meters for a total value of EUR 1,475,424 (mainly smart three-phase meters).
The costs of in-house construction and manufacture costs of own capitalised fixed assets in 2015 amounted to EUR 14,324,151, and the costs of fixed asset acquisition from suppliers to EUR 7,441,071, while the value of fixed assets acquired free of charge was EUR 380,390. Liabili-ties for acquisition of property, plant and equipment as of December 31, 2015 stand at EUR 1,527,265.
In 2015, as owner of electricity infrastructure, the com-pany Elektro Celje, d.d., signed Amendment IV to the Agreement on the Lease of Electricity Distribution Infra-structure and Provision of Services for the Distribution Network System Operator with the company SODO d.o.o., which defines the amount of lease payments and the volume of services to be rendered by the company Elektro Celje, d.d., for SODO d.o.o., as well as the amount of funds for the coverage of electricity losses in the distri-bution network of Elektro Celje, d.d. The carrying value of the leased electricity distribution infrastructure as of De-cember 31, 2015 was EUR 214,469,851, that of all other assets EUR 21,568,223, with intangible assets amount-
Tangible fixed assets - PP&E
Land Buildings EquipmentOngoing
investments
Advance payments for
PP&ETotal
Cost
As of Jan 1, 2014 5,840,542 536,904,537 150,330,998 7,990,848 0 701,066,925
Increase 0 0 0 23,272,177 6,782 23,278,959
Carry-over from ongoing investments
22,391 17,066,422 8,688,210 -25,777,023 0 0
Decrease 0 -5,574,309 -2,690,021 0 -6,782 -8,271,112
As of Dec 31, 2014 5,862,933 548,396,650 156,329,187 5,486,002 0 716,074,772
As of Jan 1, 2015 5,862,933 548,396,650 156,329,187 5,486,002 0 716,074,772
Increase 0 0 0 21,640,748 2,548 21,643,296
Carry-over from ongoing investments
22,025 13,414,149 5,719,098 -19,155,272 0 0
Decrease -89,154 -5,461,869 -3,696,205 0 -2,548 -9,249,776
As of Dec 31, 2015 5,795,804 556,348,930 158,352,080 7,971,478 0 728,468,292
Revaluation adjustment
As of Jan 1, 2014 0 375,696,259 90,346,818 0 0 466,043,077
Depreciation 0 11,367,622 5,882,883 0 0 17,250,505
Decrease 0 -4,354,748 -2,582,482 0 0 -6,937,230
As of Dec 31, 2014 0 382,709,133 93,647,219 0 0 476,356,352
As of Jan 1, 2015 0 382,709,133 93,647,219 0 0 476,356,352
Depreciation 0 10,933,691 6,022,886 0 0 16,956,577
Decrease 0 -5,250,813 -3,498,766 0 0 -8,749,579
As of Dec 31, 2015 0 388,392,011 96,171,339 0 0 484,563,350
Carrying value
As of Jan 1, 2014 5,840,542 161,208,278 59,984,180 7,990,848 0 235,023,848
As of Dec 31, 2014 5,862,933 165,687,517 62,681,968 5,486,002 0 239,718,420
As of Jan 1, 2015 5,862,933 165,687,517 62,681,968 5,486,002 0 239,718,420
As of Dec 31, 2015 5,795,804 167,956,919 62,180,741 7,971,478 0 243,904,942
in EURChanges in property, plant and equipment

133
ANNUAL REPORT
Elektro Celje2 0 1 5
16. EXPLANATORY NOTES TO THE FINANCIAL STATEMENTS
ing to EUR 1,131,915, and tangible fixed assets to EUR 234,906,159. Based on the preliminary reconciliation of the regulatory year 2015, the earnings from the lease to SODO in the 2015 fiscal year reached EUR 26,238,701.
The company does not have any property, plant or equip-ment acquired by capital lease, or any tangible fixed as-sets pledged as security for debt.
16.3.3 Long-term Financial InvestmentsLong-term financial investments into companies within the corporate group are investments into the two subsidiaries:
• ECE d.o.o. in the amount of EUR 5,501,023 (contribu-tion in kind). The subscribed capital contribution of the partner Elektro Celje, d.d., amounts to EUR 2,554,399 which or 74.3256 % of the company’s share capital. Total capital of the company as of December 31, 2015 stands at EUR 17,384,409. In 2015, the company gen-erated a net income of EUR 2,729,274.
• MHE – Elpro d.o.o. in the amount of EUR 1,745,952, of which EUR 12,519 as cash contribution and EUR 1,733,433 as contribution in kind. The company is 100 percent owned by the controlling company. Total capital of the company as of December 31, 2015 stands at
EUR 2,220,487, net income for 2015 at EUR 105,464.
The company does not recognise fair value for shares and shareholdings of companies within the corporate group, as they are not listed on stock exchange, but it does check annually for any indications that an impairment of investment might be necessary. Also, there are no reliable data on comparable sales which could provide relevant information on the fair value of these investments.
Financial investments into shares and shareholdings of other companies are classified as held for sale. Their structure is as follows:
Revaluation adjustment of long-term financial investments available for sale at market value or fair value is recognised in the comprehensive income in the amount of EUR -296, and in the income statement in the amount of EUR -103,508.
Revaluation surplus, amounting to EUR 44,274 as of Jan-uary 1, 2015, decreased by EUR 296 due to a revaluation of the shares of Zavarovalnice Triglav, d.d.; as of Decem-ber 31, 2015 it stood at EUR 43,978.
The impairment of long-term financial investments through the income statement, which is recognised under financial expenses, amounted to EUR 103,508 as of December 31, 2015. The company management established there were objective reasons for an impairment assessment of the fi-nancial investment into the equity instrument of the company Informatika d.d. Since the carrying value of this financial in-vestment as of December 31, 2015 was 20 % higher than the proportional part of the carrying amount of total company
equity, and future business plans of the company also point-ed at a permanent impairment of the investment, a negative adjustment in the amount of EUR 103,508 or 33 % of the investment’s value was recognised.
The company is not partner in any other company in which it would bear unlimited personal liability for such company’s commitments.
Other shares and shareholdings (in EUR) Dec 31, 2015 Number of shares Dec 31, 2014 Number of shares
Zavarovalnica Triglav, d.d. 69,560 2,960 69,856 2,960
Informatika, d.d. 206,987 2,479 310,495 2,479
Stelkom, d.o.o. 56,594 0 56,594 0
Total 333,141 5,439 436,945 5,439
in EUR
ItemInvestments into companies within the corporate group
Other investments Total
Carrying value as of Jan 1, 2014 7,246,975 423,329 7,670,304
Impairment through the Income Statement 0 0 0
Changes in the other comprehensive income 0 13,616 13,616
Carrying value as of Dec 31, 2014 7,246,975 436,945 7,683,920
Carrying value as of Jan 1, 2015 7,246,975 436,945 7,683,920
Impairment through the Income Statement 0 -103,508 -103,508
Changes in the other comprehensive income 0 -296 -296
Carrying value as of Dec 31, 2015 7,246,975 333,141 7,580,116
Changes in long-term financial investments in 2015

ANNUAL REPORT
Elektro Celje2 0 1 5
134
16. EXPLANATORY NOTES TO THE FINANCIAL STATEMENTS
16.3.4 Deferred Tax Assets
In 2015, the company recognised deferred tax assets for deductible temporary differences from past and current non-deductible expenses, related to revaluation adjust-ments to receivables, recognition of provisions for retire-ment benefits, long-service awards, and death allowance, and to impairment of investment in the total amount of EUR 638,460. The deferred tax assets was calculated us-
ing the 17 % tax rate, which is expected to apply in the following years, as well.
As of December 31, 2015, the company does not report any other significant deductible temporary differences and tax credit which could lead to recognition of additional de-ferred tax asset.
16.3.5 InventoryInventory includes inventory of material and small tools.
Based on the data of regular stocktaking carried out as of November 11, 2015, the company identified a deficit of EUR 597 and a surplus of EUR 379, which were rec-ognised in the company expenses and income. In 2015, a EUR 12,136 worth of inventory was written off due to obsolescence or change in quality material.
The company has no inventory pledged as security for its liabilities.
16.3.6 ReceivablesAs of December 31, 2015, the company held receiva-bles in the total amount of EUR 16,837,168, of which EUR 5,934,882 long-term trade receivables, and EUR
10,902,286 short-term receivables. Revaluation adjust-ment for receivables as of December 31, 2015 was rec-ognised in the amount of EUR 1,010,646.
Changes in the Deferred Tax Asset
ItemShort-term receivables
Long-term receivables
Provisions for long-term
benefits
Financial investments
Total
As of Jan 1, 2014 0 0 0 0 0
Recognised in the Income Statement 164,831 3,990 431,278 0 600,099
Reversed in the Income Statement 0 0 0 0 0
As of Dec 31, 2014 164,831 3,990 431,278 0 600,099
As of Jan 1, 2015 164,831 3,990 431,278 0 600,099
Recognised in the Income Statement 2,199 2,332 5,310 17,597 27,438
Recognised in the Comprehensive Income Statement
0 0 10,923 0 10,923
Reversed in the Income Statement 0 0 0 0 0
As of Dec 31, 2015 167,030 6,322 447,511 17,597 638,460
Inventory (in EUR) Dec 31, 2015 Dec 31, 2014
Material 1,274,534 1,294,096
Small tools 105,995 98,651
Total 1,380,529 1,392,747
in EUR

135
ANNUAL REPORT
Elektro Celje2 0 1 5
16. EXPLANATORY NOTES TO THE FINANCIAL STATEMENTS
in EUR
in EUR
Changes in revaluation adjustments to short-term receivables for 2015
Changes in revaluation adjustments to short-term receivables for 2014
ItemAs of
Jan 1, 2014
Write-downs and write-offs
Reconciliation As of Dec 31, 2014Increase Reversal
Adjustments to trade receivables - network charge 702,801 47,170 119,713 0 775,344
Adjustments to trade receivables - services 116,581 2,900 0 1,928 111,753
Adjustments to trade receivables - other 32,061 607 399 0 31,853
A Total adjustments to trade receivables 851,443 50,677 120,112 1,928 918,950
Adjustments to late charge - network charge 60,394 4,003 3,782 0 60,173
Adjustments to late charge - services 6,261 499 2,777 0 8,539
Adjustments to late charge - other 1,782 20 1,424 0 3,186
B Total adjustments to late charge 68,437 4,522 7,983 0 71,898
Adjustments to misc. short-term receivables 5,673 541 1,302 0 6,434
Adjustments to advance payments made 0 0 428 0 428
C Total adjustments to misc. short-term receivables 5,673 541 1,730 0 6,862
TOTAL (A + B + C) 925,553 55,740 129,825 1,928 997,710
ItemAs of
Jan 1, 2015
Write-downs and write-offs
Reconciliation As of Dec 31, 2015Increase Reversal
Adjustments to trade receivables - network charge 775,344 95,438 115,969 0 795,875
Adjustments to trade receivables - services 111,753 1,428 3,030 0 113,355
Adjustments to trade receivables - other 31,853 221 0 17,752 13,880
A Total adjustments to trade receivables 918,950 97,087 118,999 17,752 923,110
Adjustments to late charge - network charge 60,173 13,522 22,236 0 68,887
Adjustments to late charge - services 8,539 156 0 1,695 6,688
Adjustments to late charge - other 3,186 0 663 0 3,849
B Total adjustments to late charge 71,898 13,678 22,899 1,695 79,424
Adjustments to misc. short-term receivables 6,434 78 1,756 0 8,112
C Total adjustments to misc. short-term receivables 6,434 78 1,756 0 8,112
DAdjustments to short-term advance payments made
428 428 0 0 0
TOTAL (A + B + C + D) 997,710 111,271 143,654 19,447 1,010,646

ANNUAL REPORT
Elektro Celje2 0 1 5
136
16. EXPLANATORY NOTES TO THE FINANCIAL STATEMENTS
16.3.6.1 Long-term Trade Receivables
Long-term trade receivables of the company amounting to EUR 5,934,882 include long-term trade receivables due from customers in compulsory settlement proceed-ings (EUR 17,197), long-term trade receivables from others (EUR 7,649), and long-term receivables due from SODO (EUR 5,910,036); the long-term portion of the discounted receivable due from SODO in relation to the preliminary reconciliation of the 2014 regulatory frame-work - RF (EUR 2,520,535), discounted receivable due from SODO in relation to the preliminary reconciliation of the 2015 RF (EUR 3,355,430), the long-term portion of final RF reconciliations for 2012, 2013 and 2014, as well as interest (EUR 34,071) charged for unsettled deficits of preliminary and final RF reconciliations for 2012, 2013 and
2014 (due to the network charge deficit), from their oc-currence up to their inclusion into the 2016-2018 RF. In compliance with SAS 5.48, the two receivables due from SODO in relation to the preliminary reconciliation of the RF for 2014 and 2015, whose remuneration terminated after their inclusion in the regulatory framework, are reported at discounted value, taking into account the deficit and surplus remuneration method from Article 85 of the Act on the Methodology Determining the Regulatory Framework and the Methodology for Charging the Network Charge for the Electricity System Operators (Official Gazette of the RS no. 66/2015 dated September 14, 2015) and the 1.4 % interest rate equal to the average fixed interest rate of all long-term loans.
A part of long-term trade payables in the amount of EUR 28,962, falling due in 2015, was transferred to short-term trade receivables. Revaluation adjustment is recognised in the amount of EUR 37,188.
The company does not have any long-term receivables insured or pledged as security for its liabilities.
16.3.6.2 Short-term Trade Receivables
As of December 31, 2015, the company short-term re-ceivables are reported at EUR 10,902,286, with 0.1 % of total receivables due from companies within the corporate group amount, 96.7 % from customers, and 3.2 % from others.
Short-term trade receivables from companies within the Group, amounting to EUR 11,772, pertain to receivables for network charges, lease income, and services, due from subsidiaries.
Short-term receivables from customers in the total amount of EUR 10,481,303 include:
• trade receivables from customers for network charges amounting to EUR 3,910,325;
• receivables related to the maintenance and lease of the power infrastructure and rendering services for SODO d.o.o., amounting to EUR 6,246,253 and not yet due;
• discounted value of the SODO receivables related to the preliminary reconciliation of the 2014 regulatory year, amounting to EUR -26,653;
• trade receivables from customers for services rendered, amounting to EUR 151,397 (accounts: 1200, 1201, 1290 and 1291);
• trade receivables from customers for lease, average connection fees, sold fixed assets and scrap material, in the amount of EUR 199,981 (accounts: 1202, 1205, 1206, 1295 and 1296).
Long-term trade receivables (in EUR) Dec 31, 2015 Dec 31, 2014
Long-term trade receivables from customers 5,993,383 80,619
Minus revaluation adjustment -37,188 -23,470
Short-term portion of long-term trade receivables from customers -28,962 -34,000
5,927,233 23,149
Long-term trade receivables from others 7,649 4,033,240
Minus revaluation adjustment 0 0
Short-term portion of long-term trade receivables from others 0 0
7,649 4,033,240
Total 5,934,882 4,056,389

137
ANNUAL REPORT
Elektro Celje2 0 1 5
16. EXPLANATORY NOTES TO THE FINANCIAL STATEMENTS
Short-term interest receivables reduced by the interest revaluation adjustment and amounting to EUR 8,296, pertain to receivables for late charges on overdue pay-ments of network charges (EUR 7,504), receivables for late charges on overdue payments of services (EUR 166) and short-term portion of long-term receivables for late charges (EUR 626).
The majority of receivables due from others, in the total amount of EUR 347,705, pertain to receivables for input
VAT (amounting to EUR 197,901) and other short-term re-ceivables due from state institutions (amounting to EUR 149,804).
There are no short-term receivables pledged as security for the company’s liabilities. Also, the company does not report any receivables due from the Management Board, members of the Supervisory Board, and employee share-holders, except for regular invoices for electricity.
16.3.7 Cash and Cash EquivalentsCash and cash equivalents of the company Elektro Celje as of December 31, 2015 include money on current accounts
with commercial banks in the amount of EUR 15,934, and overnight deposits in the amount of EUR 8,189.
Short-term trade receivables (in EUR) Dec 31, 2015 Dec 31, 2014
Short-term trade receivables from companies within the corporate group 11,772 44,118
Short-term trade receivables from customers 11,431,066 9,273,816
- revaluation adjustment to trade receivables from customers -923,110 -918,950
- discounted trade receivables from SODO as per the preliminary reconciliation statement for 2014
-26,653 0
Late charge receivables 87,720 82,592
(of which short-term portion of long-term receivables for late charge) 626 626
- revaluation adjustment to late charge receivables -79,424 -71,898
Advance payments made 53,207 55,632
- revaluation adjustment to advance payments made 0 -428
10,542,806 8,420,764
Short-term trade receivables from others 355,817 350,229
(of which short-term portion of long-term trade receivables) 28,962 34,000
- revaluation adjustment to short-term receivables from others -8,112 -6,434
Receivables related to finance income 3 7
347,708 343,802
Total 10,902,286 8,808,684
Cash and cash equivalents (in EUR) Dec 31, 2015 Dec 31, 2014
Cash in current accounts 15,934 72,927
Overnight deposits 8,189 33,821
Total 24,123 106,748

ANNUAL REPORT
Elektro Celje2 0 1 5
138
16. EXPLANATORY NOTES TO THE FINANCIAL STATEMENTS
16.3.8 Accrued Revenue and Deferred ExpensesAccrued revenue and deferred expenses include short-term deferred costs (expenses) which are expected to oc-cur in the coming year, the occurrence of which is likely and the amount of which is reliably estimated, and which do not affect the income yet, and accrued revenue.
Accrued revenue and deferred expenses include early payments of costs in the amount of EUR 670,108 (the greater part of which is represented by accrued credit: from acquisition of electricity for coverage network losses in the amount of EUR 637,418, and from decreased costs
of documentation archiving for 2014 in the amount of EUR 20,000), VAT from advance payments received and overpayment of electricity in the amount of EUR 4.162, as well as accrued revenue in the amount of EUR 65,024 (of which EUR 47,989 correspond to projects completed in 2015 but not yet charged, and EUR 17,035 to one third of the justified expenses recognised in the 2012 – 2014 reg-ulatory period, which will be settled in 2016, in compliance with the Act Determining the Methodology for Charging for the Network Charge).
Items in the balance sheet are real and do not include undisclosed reserves.
16.3.9 EquityTotal company equity consists of called-up share capital, share premium, revenue reserves, revaluation surplus, re-tained earnings and net profit for the fiscal year. Amounts of individual equity components as of January 1, 2015 and December 31, 2015, as well as changes in the individual equity components in 2015 are reported in table 15.5.
Share capital of the company Elektro Celje is divided into 24,192,425 freely transferable no-par value shares. All eq-uity components outside the share capital belong to the owners of the share capital in proportion to their owner-ship shares. The carrying value per share as of December 31, 2015 was EUR 8.12 (as of December 31, 2014 it was EUR 7.98), while net earnings per share amounted to EUR 0.28.
Ordinary shares give their owners the right to participate in the management of the company, the right to a share of the profit (dividend), and the right to a proportionate part of the remaining assets upon the liquidation or bankruptcy of the company. There are no agreements between share-holders that could restrict the transfer of securities and voting rights. The shareholders of Elektro Celje have no restrictions in exercising their voting rights. All shares are of the same class and have been paid in full. The shares were issued in dematerialised form and are kept with the KDD – Centralna klirinško depotna družba, d. d., as per
the relevant regulations. In the financial year, the company did not perform any conditional increase of share capital and did not hold any treasury shares. Company manage-ment members have no authorisation for issuing and pur-chasing treasury shares. The company does not have an employee share scheme.
Share premium includes general revaluation adjustment to equity in the amount of EUR 62,260,317. Revenue re-serves of EUR 30,075,398 include legal reserves in the amount of EUR 2,563,756 (5 % of net profit for the period 2003–2014, and EUR 340,424 in 2015 alone) and other revenue reserves in the amount of EUR 27,511,642 (EUR 4,288,780 in 2015 alone).
Revaluation surplus decreased by EUR 156,706 to stand at EUR -81,082. In 2015, it decreased by EUR 296 through the revaluation adjustment to Zavarovalnica Triglav, d.d., shares, by EUR 159,857 based on actuarial gain from the recognition of provisions for retirement benefits, by EUR 7,476 with the adjustment of surplus from the revaluation of financial investments for deferred tax, and it increased by EUR 10,923 through deferred tax from actuarial losses.
Undistributed net profit for the year amounts to EUR 3,234,029.
Short-term accrued revenue and deferred expenses (in EUR) Dec 31, 2015 Dec 31, 2014
Short-term deferred expenses (costs) 670,108 322,613
Short-term accrued revenue 65,024 733,978
VAT from advance payments received 4,098 5,217
VAT from overpayment of electricity 64 0
Total 739,294 1,061,808

139
ANNUAL REPORT
Elektro Celje2 0 1 5
16. EXPLANATORY NOTES TO THE FINANCIAL STATEMENTS
16.3.10 Provisions and Long-term Accrued Expenses and Deferred Revenue
In the structure of liabilities, long-term provisions for long-service awards, retirement benefits and death allowance in the amount of EUR 5,409,368 represent a 2 % share.
They are recognised in the amount of estimated future payments discounted on December 31, 2015.
The basis for establishing provisions was the actuarial estimation as of December 31, 2015 in the amount of EUR 5,409,368, which was based on the following as-sumptions: statistical probability of mortality and disabil-ity, retirement in accordance with the law, and employee turnover (4 % in the under 40 age group, 1 % in the 41-50 age group, 0 % in the over 51 age group), a 2 % discount rate, a 2.5 % wage growth in the Republic of Slovenia and electricity industry, a 2.25 % wage growth in the com-
pany, a 16.1 % current employer’s contribution rate, and 1 % growth of amounts stated in the Decree on the Levels of Reimbursed Work-related Expenses and of Certain In-come not to be Included in the Tax Base (Official Gazette of the RS 140/2006, 76/2008). The expected current value of liabilities also includes actuarial gains/losses due to changed financial and demographic assumptions and experience adjustments.
Provisions and long-term accrued expenses and deferred revenue (in EUR) Dec 31, 2015 Dec 31, 2014
Long-term provisions for retirement benefits and long-service awards 5,409,368 5,140,088
Provisions for lawsuits 615,626 40,000
Long-term accrued expenses and deferred revenue:
- from received government grants (state aid) 1,063,344 1,174,144
- fixed assets acquired free of charge 9,989,558 10,098,707
- from connection fees 2,566,314 2,674,306
Total 19,644,210 19,127,245
in EURLiabilities related to long-term employment benefits
ItemLong-service
awardsRetirement
benefitsDeath
allowanceTotal
As of Jan 1, 2014 1,701,315 3,191,559 163,073 5,055,947
Current service costs 110,600 145,361 9,790 265,751
Interest expense 59,546 111,705 5,707 176,958
Payments of benefits -213,705 -141,336 -4,607 -359,648
Actuarial surplus 39,613 -31,350 -7,183 1,080
As of Dec 31, 2014 1,697,369 3,275,939 166,780 5,140,088
As of Jan 1, 2015 1,697,369 3,275,939 166,780 5,140,088
Current service costs 116,811 162,803 11,422 291,036
Interest expense 32,668 70,846 3,403 106,917
Payments of benefits -245,445 -127,218 -15,518 -388,181
Actuarial surplus 84,261 158,640 16,607 259,508
As of Dec 31, 2015 1,685,664 3,541,010 182,694 5,409,368

ANNUAL REPORT
Elektro Celje2 0 1 5
140
16. EXPLANATORY NOTES TO THE FINANCIAL STATEMENTS
The amount of provisions used for covering actual ex-penses related to long-term employee benefits in 2015 was EUR 388,181, the amount of additionally recognised provisions EUR 657,461.
In 2015, the company established EUR 380,390 of long-term accrued expenses and deferred revenue related to fixed assets acquired free of charge. A EUR 597,531 worth of long-term accrued expenses and deferred rev-enue were reversed for the fixed assets acquired free of charge and average connection fees, EUR 8,298 for the use of assigned contributions as per the Vocational Reha-bilitation and Employment of Disabled Persons Act, and EUR 102,502 for drawing state aids for the acquisition of
fixed assets. The establishment and reversal of long-term accrued expenses and deferred revenue from EU grants in the amount of EUR 94,205 is related to the implementa-tion of the Flex4grid pilot project.
Provisions established for lawsuits amounted to EUR 19,850, (action for damages due to the disconnection of a neutral line), the existing provision as of January 1, 2015 in the amount of EUR 40,000 were used or reversed in their entirety. In compliance with the demand for the pay-ment of balance of the 2015 holiday pay up to the amount defined under Article 128 of the Collective Agreement for Slovenian Electricity Industry, provisions for lawsuits amounting to EUR 595,776 were recognised.
16.3.11 Long-term Financial LiabilitiesThe total amount of principals (capital) repaid by the com-pany in 2015 was EUR 6,270,567, the amount of paid interest, reported under financial expenses was EUR 735,880. The loans are secured by means of bills of ex-change. The average margin applied to the EURIBOR rate
in all long-term loans is 1.7 %. The company does not hedge the changes in the EURIBOR interest rate with any financial instruments. The value of principals maturing in five years from the balance sheet date is EUR 3,295,049.
To finance its investments in the period 2015–2017, the company signed a loan agreement with the European In-vestment Bank in 2015 for the amount of EUR 28,000,000. The credit terms are negotiated and defined at the drawing of each tranche (moratorium from 2 to 36 months, maturity up to 15 years, interest rate etc.). In December 2015, the company took out a revolving credit with a 3-year maturity, a 3-month EURIBOR interest rate and a 0.85 % margin for the coverage of occasional lack of liquid assets.
The company pays all instalments of principal and interest at maturity. The short-term portion of long-term loans ma-turing in 2015, amounting to EUR 11,837,695, is reported under short-term financial liabilities. The company does not have any long-term debt denominated in foreign currency.
By hiring long-term loans, the company committed to reaching target values of select performance indicators in the financing period. For Elektro Celje that means a finan-cial debt to equity ratio lower than 0.40 by 2030, and a net financial debt to EBITDA ratio lower than 2.70 by 2030; and for Elektro Celje Group, a financial debt to EBITDA ratio lower than 2.70 in 2015 and lower than 2.5 in the following years, a financial debt to equity ratio lower than 0.3, an EBITDA to financial expenses from financial liabili-ties ratio higher than 12, and a current ratio higher than 0.9. As of the balance sheet date the Group met all its contractual financial commitments.
in EURChanges in provisions and long-term accrued expenses and deferred revenue
ItemProvisions for long-
term benefitsOther provisions
Long term accrued expenses and
deferred revenueTotal
As of Jan 1, 2014 5,055,947 0 14,114,048 19,169,995
Utilisation 359,648 0 0 359,648
Recognition 443,789 40,000 552,619 1,036,408
Reversal 0 0 719,510 719,510
As of Dec 31, 2014 5,140,088 40,000 13,947,157 19,127,245
As of Jan 1, 2015 5,140,088 40,000 13,947,157 19,127,245
Utilisation 388,182 31,050 0 419,232
Recognition 657,462 615,626 474,595 1,747,683
Reversal 0 8,950 802,536 811,486
As of Dec 31, 2015 5,409,368 615,626 13,619,216 19,644,210
Long-term financial liabilities (in EUR) Dec 31, 2015 Dec 31, 2014
Long-term financial liabilities to banks 33,542,731 36,669,343

141
ANNUAL REPORT
Elektro Celje2 0 1 5
16. EXPLANATORY NOTES TO THE FINANCIAL STATEMENTS
The carrying value of long-term debt equals its fair value. The company’s long-term debt is not exposed to any par-ticular currency or credit risks. Interest rate risk exposure only exists in relation to potentially unfavourable changes
in the EURIBOR reference interest rate, but the company has the possibility of early repayment or refinancing of long-term debt without additional costs any time before its maturity.
16.3.12 Short-term Financial Liabilities and Trade PayablesShort-term trade payables to companies within the corpo-rate group pertain to payables to subsidiaries ECE d.o.o. in the amount of EUR 654,248 (EUR 623,530 for electric-ity supplied for covering losses, EUR 10,993 for electricity and natural gas supplied, and EUR 19,725 for uninvoiced material and services), and MHE–ELPRO in the amount of EUR 32,659 (EUR 26,083 for heat supplied, and EUR 6,576 for electricity supplied).
Trade payables to suppliers as of December 31, 2015 were reported at EUR 3,210,524, of which trade payables for fixed assets amounted to EUR 1,564,492, for current assets to EUR 1,573,875, for current assets abroad to EUR 53,042, and for uninvoiced material and services to EUR 19,115. According to the balance sheet as of De-cember 31, 2015, the company settled all its outstanding trade payables to suppliers, the remaining will be due for payment within three months after the balance sheet date.
Short-term trade payables from operations for third-party account in the amount of EUR 3,845,389 pertain to trade payables to SODO d.o.o. for the use of network as per the contract.
Short-term payables to employees in the amount of EUR 1,454,486 include salaries reported but not yet paid, re-tirement benefits and long-service awards for the month of December, together with the payables for the contribu-tions on such amounts.
Payables to state and other institutions include payables for VAT charged (EUR 243,594), payables for the tax on the corporation (EUR 45,616), payables for tax levied on meeting fees, labour contracts and mandatory ap-prenticeship (EUR 6,223), excise duty for the December (EUR 303), and other payables to state institutions (EUR 12,736).
Short-term trade payables based on advance payments include advances for services (EUR 63,889), as well as received overpayment of network charges and average connection fees (EUR 1,921).
Reported among other short-term trade payables of the company are paid deposits of providers (EUR 198,149), short-term liabilities related to deductions from employ-ees’ salaries (EUR 93,811), payables for supplement employee retirement insurance (EUR 55,899), short-term payables for interest (EUR 25,000), payables to employ-ees for long-service awards and retirement benefits (EUR 21,494), and other short-term payables (EUR 14,364).
The company does not have any payables to the Man-agement Board, the Supervisory Board, and to employee shareholders, except for those related to salaries and meeting fees of the Supervisory Board members for the month of December 2015. The company has not granted the Management Board, the Supervisory Board or em-ployee shareholders any loans, advance payments or se-curity for liabilities.
None of the company liabilities are secured by real col-lateral (liens etc.).
Current financial and operating liabilities (in EUR) Dec 31, 2015 Dec 31, 2014
Current financial liabilities
Short-term financial liabilities to banks 11,837,695 6,206,650
Other short-term financial liabilities 7,063 5,879
Total 11,844,758 6,212,529
Short-term trade payables
Short-term trade payables to companies within the corporate group 686,907 666,203
- of which payables for electricity for covering distribution losses 643,255 585,677
Short-term trade payables to suppliers 3,210,524 2,386,053
Short-term trade payables from operations for third-party account 3,845,389 3,344,420
Short-term trade payables to employees 1,454,486 1,399,631
Short-term trade payables to state and other institutions 308,472 687,678
Short-term trade payables based on advance payments 65,810 73,555
Other short-term trade payables 408,717 443,887
Total 9,980,305 9,001,427

ANNUAL REPORT
Elektro Celje2 0 1 5
142
16. EXPLANATORY NOTES TO THE FINANCIAL STATEMENTS
16.3.13 Short-term Accrued Expenses and Deferred RevenueAccrued expenses and deferred revenue includes accrued costs (expenses) and short-term deferred revenue, which may only be used for items for which they have been initially recognised.
Short-term accrued costs in the amount of EUR 747,606 mainly include accrued labour costs for unused annual leave of the employees for 2015 in the amount of EUR 522,805, and accrued costs of salaries related to the unpaid part of
performance bonus as per collective industry agreement in the amount of EUR 219,446.
Short-term deferred revenue amounting to EUR 47,826 per-tain to costs incurred as a result of withdrawals from con-tractual orders (EUR 9,967), and to received EU grants for covering the costs of the pilot project, which will be incurred in 2016 (EUR 37,859).
16.3.14 Contingent Liabilities
Contingent liabilities in the amount of EUR 1,221,260 do not qualify for recognition among balance sheet items, thus they are included in the off-balance-sheet records. The amount of contingent liabilities related to ongoing litigation procedures in which Elektro Celje, d.d., is rep-resented as the defendant, is EUR 1,215,349, which is EUR 648,781 more than as of December 31, 2014; claims for damages in the total amount of EUR 298,035 were resolved; the value of litigation procedures begun in 2015 is EUR 946,816. Two of the minority shareholders, Cypriot financial funds AMPELUS HOLDING LIMITED, and G.I. Dakota Investments Limited filed a lawsuit challenging de-cision no. 3.1 adopted at the 20th regular Shareholders Assembly of the company Elektro Celje, d.d., whereby the shareholders decided to use part of the distributable profit
in the amount of 3,145,015.25 for the payment of divi-dends, and allocate the remaining part in the amount of EUR 1,054,750.75 to other revenue reserves. The plain-tiffs demand that additional EUR 893,113 be allocated for the payment of dividends, and their claim is classified by the company as contingent liability. Even in case of an un-favourable decision for the company Elektro Celje, such liability will have no effect on the current profit and will only impact the company equity.
In 2015, the company also recognised long-term provi-sions in the amount of EUR 19,850 in the case of an ac-tion for damages for alleged damage that is claimed to have been caused by asymmetry in the electrical instal-lations.
16.3.15 Contingent Assets and Other Off-balance-sheet RecordsAssets included in off-balance-sheet records do not quali-fy for recognition among the balance sheet items.
Short-term accrued expenses and deferred revenue (in EUR) Dec 31, 2015 Dec 31, 2014
Short-term accrued costs and expenses 747,606 854,829
Short-term deferred revenue 47,826 9,967
VAT from advance payments made 3,001 3,073
Total 798,433 867,869
Contingent liabilities (in EUR) Dec 31, 2015 Dec 31, 2014
Ongoing litigation procedures 1,215,349 566,568
Bank guarantees given 5,911 114,949
Total 1,221,260 681,517

143
ANNUAL REPORT
Elektro Celje2 0 1 5
16. EXPLANATORY NOTES TO THE FINANCIAL STATEMENTS
The value of bank performance guarantees and guaran-tees of defect rectification in the warranty period is EUR 2,802,156.
Damage claims against insurance companies have not been settled in full yet, therefore they cannot be objectively valued prior to the settlement by the insurance companies (when the payable is transferred to the balance sheet to-tal). Their estimated value is EUR 81,559.
The value of receivables due from partners in companies cancelled from the register increased by EUR 26,142.
Tax reliefs for employment of persons with disabilities are reported at EUR 84,777.
The value of fixed assets transferred to SODO d.o.o., based on the mutual agreement on the transfer and ac-quisition of fixed assets financed with the funds from aver-age connection fees and the sales contract, amounts to EUR 3,703,612.
16.4 Events Following the Balance Sheet DateThere were no events following the balance sheet date and up to the date of the auditor’s report, which would materially affect the assets and liabilities of the company
and impair the ability of the balance sheet users to per-form a relevant evaluation and reach an informed decision.
16.5 Disclosures of Items in the Income StatementIncome statement is a fundamental financial statement that provides a faithful and fair account of the income for the fiscal year. The statement is prepared according to
version I of SAS 25.5, and as such it reports the costs separately by functional groups.
16.5.1 Net Sales Revenue
Net sales revenue includes revenue from lease and main-tenance of infrastructure and rendering of services for SODO d.o.o. as per the relevant agreement, and other revenue from sales of products and services. The amounts invoiced for the account and on behalf of the company SODO d.o.o., are not reported as revenue, but rather as liabilities to the company SODO d.o.o. VAT and excise duty are not reported under sales revenue, but rather as withdrawal liabilities.
The company generated EUR 53,791,561 of net sales revenue in the domestic market and no revenue in inter-national markets.
On February 21, 2012, Elektro Celje, d.d., as owner of electricity infrastructure, signed the Agreement on the Lease of Electricity Distribution Infrastructure and Provi-sion of Services for the Distribution Network System Op-erator SODO d.o.o., which is the exclusive holder of the
Contingent assets and other off-balance-sheet records (in EUR) Dec 31, 2015 Dec 31, 2014
Contingent assets:
Bank guarantees received 2,802,156 2,618,671
Damage claims 81,559 202,301
Receivables from partners in companies cancelled from the register 176,090 149,948
Allowance for employing disabled persons 84,777 78,860
3,144,582 3,049,780
Other off-balance-sheet records:
Infrastructure owned by SODO d. o. o. 3,703,612 3,846,276
Net sales revenue (in EUR) 2015 2014
Revenue from lease and maintenance of infrastructure and provision of services for SODO d. o. o.
52,065,913 52,342,066
Revenue from sales of goods and services 1,725,648 1,577,497
Total 53,791,561 53,919,563

ANNUAL REPORT
Elektro Celje2 0 1 5
144
16. EXPLANATORY NOTES TO THE FINANCIAL STATEMENTS
concession for performing compulsory public service of distribution system operator in the Republic of Slovenia. Pursuant to the provisions of said agreement, the parties sign an amendment to the agreement each year for the current year, defining therein the amount of lease pay-ments, the volume of services to be rendered, and the amount of funds for coverage of distribution network losses. In 2015, the revenue based on the agreement and generated with the lease and maintenance of electricity infrastructure, rendering of services for SODO d.o.o. and the coverage of distribution network losses, in the total amount of EUR 52,065,913, represented 74.8 % of total company revenue. The agreement also provides that pur-suant to the Act Determining the Methodology for Charg-ing for the Network Charge one third of justified costs for the period from January 1, 2010 to December 31, 2011 in the amount of EUR 75,678, be taken into account in the calculations for 2015. These are justified costs incurred in the period from 2010 and 2011, which were not covered by network charges charged to electricity consumers, but
were included by the Energy Agency into the calculation of network charge tariff rates for the period from 2013 and 2015, when the distribution companies were charg-ing electricity consumers for the network charge on behalf and account of SODO d.o.o. Pursuant to this agreement and amendments thereto, SODO d.o.o. prepared a final reconciliation for 2014, which yielded the amount of EUR -188,560, and a preliminary reconciliation for the 2015 regulatory year in the amount of EUR 3,426,391. In March 2016, this amount was invoiced and the respective rev-enue reported for 2015, but due to the network charge deficit it will probably be paid in the next regulatory period extending from 2019 to 2021, when it will be incorporated in the network charge tariff rates applicable to consumers then.
Performance of electricity installation and other services for third parties yielded to the company EUR 1,725,648 of revenue.
16.5.2 Capitalised Own ServicesBy constructing own assets the company generated 20.6 % of company revenue in the amount of EUR 14,324,151.
The company recognises and reports no profit in this re-gard.
16.5.3 Other Operating Revenue
Other operating revenue in the amount of EUR 1,317,814 includes: • revenue from reversal of provisions in the amount of
EUR 606,481 (EUR 489,539 from reversal of provisions from fixed assets acquired free of charge; EUR 107,992 from reversal of provisions from average connection fees charged and received prior to July 1, 2007; and EUR 8,950 from reversal of provisions for lawsuits)
• other revenue associated with business effects in the amount of EUR 235,386 (incentives for employment of persons with disabilities and bonuses for employment of persons with disabilities above the mandatory quota in the amount of EUR 76,539; subsidies for human re-
sources from EU funds; drawing of state aid for fixed assets and grants in the total amount of EUR 158,847)
• received damage compensation from insurance com-panies and other compensations in the amount of EUR 162,782
• revaluation adjustments from revaluation of operating revenue in the amount of EUR 313,165 (revenue from sales of fixed assets and decommissioned material in the amount of EUR 297,455; decreased VAT liabilities, write-downs of liabilities and reversal of the revalua-tion adjustment to receivables in the amount of EUR 15,710).
Other operating revenue (in EUR) 2015 2014
Income from reversal of provisions 606,481 588,159
Other revenue associated with business effects 235,386 234,089
Compensation received 162,782 2,221,956
Operating revenue from revaluation 313,165 258,323
Total 1,317,814 3,302,527

145
ANNUAL REPORT
Elektro Celje2 0 1 5
16. EXPLANATORY NOTES TO THE FINANCIAL STATEMENTS
16.5.4 Operating Costs and Expenses by Functional Groups
Operating costs and expenses can be direct, i.e., associable with the emerging business effects (production
costs), or overhead.
16.5.4.1 Cost of Goods, Material and Services
Cost of goods, material and services in the amount of EUR 21,326,680 includes cost of purchase of electricity, cost of material and cost of services.
Costs of purchase of electricity for covering electricity loss-es in the distribution network amounted to EUR 4,925,127.
Cost of material in the amount of EUR 9,668,911 includes cost of material for investments carried out in-house (EUR 7,666,485), cost of fuel and energy (720.544 EUR), cost of material used in maintenance (EUR 562,939), cost of material used for damage repair (EUR 171,697), cost of material used in provision of services to customers (EUR 352,063), write-offs of material for current requirements of occupational safety and small tools (EUR 177,291), and other cost of material (EUR 17,892).
Cost of services in the amount of EUR 6,732,642 includes maintenance service cost (EUR 2,134,432), cost of ser-vices of damage repair (EUR 191,553), costs associated with provision of electrical installation services to custom-ers (EUR 217,933), costs of business data processing (EUR 1,382,293), insurance premiums (EUR 1,228.268), cost of postal and telephone services (EUR 267,053),
costs of the Supervisory Board and its Committees (EUR 125,445), cost of water, public utilities and hazardous waste management (EUR 96,795), cost of healthcare services (EUR 81,431), cost of technical education and training services (EUR 76,624), cost of system study services (EUR 71,519), cost of auditing, consulting, attorney and notarial services (EUR 61,233), advertising, entertainment and tradeshow ex-penses (EUR 59,463), cost of bank services (EUR 57,467), cost of rent (EUR 41,501), reimbursement of work-related costs (EUR 33,477), cost of access to data via electronic me-dia (EUR 23,109), and costs of other services (EUR 583,046).
Pursuant to Article 57 of Companies Act (ZGD - 1), the company is subject to mandatory audit. BDO Revizija, d.o.o., was appointed as the company auditor for the an-nual report of the 2015 fiscal year, and an auditing contract in the amount of EUR 8,320 (excl. VAT) was signed with said auditing firm. The mentioned amount also includes the cost of auditing the consolidated annual report in the amount of EUR 880 (excl. VAT).
Type of expenses Production costs Overhead Total
Purchase of electricity 4,925,127 0 4,925,127
Cost of material 9,485,313 183,598 9,668,911
Cost of services 5,105,298 1,627,344 6,732,642
Labour cost 18,366,695 2,726,390 21,093,085
Amortisation and depreciation 16,953,721 735,779 17,689,500
Other expenses 617,162 167,677 784,839
Total 55,453,316 5,440,788 60,894,104
Cost of material and services (in EUR) 2015 2014
Cost of purchase of electricity 4,925,127 5,253,908
Cost of material:
- for maintenance 562,940 614,965
- for damage repair 171,697 394,873
- other costs of material 8,934,275 10,335,737
Cost of services:
- for maintenance 2,134,431 2,247,986
- for damage repair 191,553 366,860
- other costs of services 4,406,657 3,874,034
Total 21,326,680 23,088,363
in EUR

ANNUAL REPORT
Elektro Celje2 0 1 5
146
16. EXPLANATORY NOTES TO THE FINANCIAL STATEMENTS
16.5.4.2 Labour Costs
As of the balance sheet day, the company recognised among labour costs EUR 450,306 of labour costs accrued for unused annual leave in 2015, EUR 189,015 from the yet unpaid performance bonus as per the industry collective agreement, and EUR 102,930 of the contributions and other levies payable from these amounts.
Other labour costs in the amount of EUR 2,636,069 in-clude EUR 822,845 of meal allowance for employees, EUR 658,671 of costs of travel to and from work, EUR 588,821 of accrued labour costs pursuant to the demand made by the trade union for the payment of balance of the 2015 holi-
day pay up to the amount defined under Art. 128 of the Collective Agreement for Slovenian Electricity Industry, EUR 509,362 of holiday pays, and EUR 56,370 of other income. The cost of provisions for long-service awards, retirement benefits and death allowance amounted to EUR 391,904.
In the 2015 fiscal year, the company Elektro Celje had 643 employees on average at the end of each month, or 633 employees per hours worked. The education composition of the employees is provided in section 12.3.2 of the Busi-ness Report.
16.5.4.3 Write-downs and Write-offs
Depreciation and amortisation calculated based on the same rates as in 2014 amount to EUR 17,689,500,
representing 28.5 % of total company expenses.
Operating expenses from revaluation of fixed assets in the amount of EUR 255,756 and related to losses resulting from write-offs of fixed assets, were lower than the year before by EUR 1,037,186, when ice damage, comparatively speaking, resulted in write-offs amounting to EUR 1,171,830 of the current value of the fixed assets.
Operating expenses from revaluation of current assets in the amount of EUR 154,911 were 2.4 % lower than in 2014 and include revaluation adjustments to re-ceivables due from customers in bankruptcy and compul-sory settlement proceedings for disputed receivables, and receivables overdue by over 90 days as of the balance sheet day in the total amount of EUR 142,775, as well as revaluation adjustments to materials inventory in the amount of EUR 12,136.
16.5.4.4 Other Operating Expenses
Other operating expenses in the amount of EUR 374,172 include charges for the use of construction land (EUR
219,621), court fees (EUR 17,076), and other operating expenses.
Labour costs (in EUR) 2015 2014
Cost of salaries 14,974,458 14,519,094
Cost of supplementary employee retirement insurance 694,363 668,144
Cost of employer contributions and other levies on salaries 2,396,291 2,324,444
Other labour costs 2,636,069 2,009,316
Provisions for long-service awards and retirement benefits 391,904 298,181
Total 21,093,085 19,819,179
Write-downs and write-offs (in EUR) 2015 2014
Amortisation and depreciation 17,689,500 17,923,351
Operating expenses from revaluation of tangible and intangible fixed assets 255,756 1,292,942
Operating expenses from revaluation of current assets 154,911 158,743
Total 18,100,167 19,375,036
Amortisation and depreciationIntangible
non-current assetsBuildings Equipment Total
Amortisation and depreciation for the year 2015 732,923 10,933,691 6,022,886 17,689,500
Amortisation and depreciation for the year 2014 672,846 11,367,622 5,882,883 17,923,351
in EUR

147
ANNUAL REPORT
Elektro Celje2 0 1 5
16. EXPLANATORY NOTES TO THE FINANCIAL STATEMENTS
16.5.5 Finance Income from ShareholdingsFinance income from shareholdings in other companies in the amount of EUR 7,400 pertains to dividend paid out by Zavarovalnica Triglav, d.d.
16.5.6 Finance Income from Interest on Loans
In 2015, the company received EUR 395 from interest on loans granted to companies within the Group, and EUR
1,828 from interest on fixed-term deposits with banks..
16.5.7 Finance Income from Trade ReceivablesFinance income from trade receivables in the amount of EUR 135,722 includes exchange differences (EUR 38) and finance income from late charges on payments of trade receivables from customers (EUR 135,684 – of
which EUR 50,616 for network charges, EUR 6,138 for services, EUR 78,595 from the 2014 RF reconciliation, and EUR 335 from other trade receivables).
16.5.8 Financial Expenses from Impairment and Write-downs of Financial InvestmentsImpairment of long-term financial investments through income, debited to financial expenses, as of December 31, 2015 amounted to EUR 103,508 and pertained to the impairment of the financial investment into the equity
instrument of the company Informatika d.d. In 2014, the company did not register any financial investment impair-ment or write-downs.
16.5.9 Financial Expenses from Financial Liabilities
Financial expenses from financial liabilities include bank in-terest for loans taken out (EUR 720,092) and financial ex-penses from other financial liabilities (EUR 257,835), which include expenses for net interest estimated on the basis of an actuarial calculation as of December 31, 2015 in
relation to the expected current value of liabilities pertain-ing to long-service awards, retirement benefits and death allowance (EUR 106,918), as well as to the discounted receivables from the company SODO (EUR 150,917).
Financial expenses from financial liabilities (in EUR) 2015 2014
Financial expenses related to loans from companies within the corporate group 0 1,239
Financial expenses related to loans from banks 720,092 1,102,691
Financial expenses related to other financial liabilities 257,835 176,958
Total 977,927 1,280,888
Finance income from shareholdings (in EUR) 2015 2014
Finance income from shareholdings in companies within the corporate group 0 475,281
Finance income from shareholdings in other companies 7,400 5,032
Total 7,400 480,313
Finance income from loans granted (in EUR) 2015 2014
Finance income from loans granted to companies within the corporate group 395 12,001
Finance income from loans granted to others 1,828 88,218
Total 2,223 100,219

ANNUAL REPORT
Elektro Celje2 0 1 5
148
16. EXPLANATORY NOTES TO THE FINANCIAL STATEMENTS
16.5.10 Financial Expenses from Operating LiabilitiesFinancial expenses from operating liabilities amount to EUR 757 and include financial expenses from interest on contributions charged (EUR 546), expenses from other
operating liabilities (EUR 82), and exchange losses (EUR 129).
16.5.11 Other IncomeOther income includes extraordinary items which are not expected to appear regularly or frequently, and which are recognised when they qualify for recognition. In 2015, such income amounts to EUR 26,854, of which reim-
bursement of court fees and execution officers’ expenses received amount to EUR 23,468.
16.5.12 Other ExpensesOther expenses include extraordinary items and other ex-penses from extraordinary operation which decrease the company income. They are recognised when they qualify for recognition. Other expenses in the amount of EUR
63,416 include compensations (EUR 36,981), annuities and reimbursement claims (EUR 16,317), donations (EUR 8,350), and other expenses (EUR 1,768).
16.5.13 Net Income/ProfitOperating profit amounts to EUR 8,539,422. Add-ing the effect of finance income and financial expenses, net income from ordinary operation amounts to EUR 7,602,575. Together with other income and expenses from extraordinary operation, and the corporate income tax in the amount of EUR 784,969 and deferred taxes amounting to EUR 27,438, net income for 2015 stands at EUR 6,808,482.
Pursuant to SAS 8.30 and in order to preserve the pur-chasing power of capital, the company is obliged to dis-close its net income (profit or loss) calculated on the basis of revaluation and growth of consumer price index. Since the consumer price decreased by 0.5 % in 2015, revalu-ation to preserve the purchasing power of capital was not performed.
16.5.14 Statement of Comprehensive IncomeThe total comprehensive income for the accounting pe-riod amounts to EUR 6,652,993 and is, due to revaluation of financial assets, available for sale (EUR -7,772) and due to other changes in equity composition (EUR -147,717)
lower by EUR 155,489 than the net income for the ac-counting period (EUR 6,808,482).
Other income (in EUR) 2015 2014
Collected receivables from earlier periods, previously written off 258 196
Received payments of court fees, and compensations 23,468 15,781
Other income from extraordinary operation 3,128 1,351
Total 26,854 17,328
Other expenses (in EUR) 2015 2014
Fines 750 30
Compensations, indemnifications and annuities 53,298 59,164
Other extraordinary items 9,368 7,845
Total 63,416 67,039

149
ANNUAL REPORT
Elektro Celje2 0 1 5
16. EXPLANATORY NOTES TO THE FINANCIAL STATEMENTS
16.5.15 Income TaxIn the 2015 fiscal year, the company proved liable for a corporate tax in the amount of EUR 784,969, recognised on the basis of tax return. Following is a representation of
reconciliation of the tax expense with the tax calculated from the accounting gains before taxation:
16.6 Disclosure of Items in the Statement of Cash FlowsThe net cash flow in the period January - December 2015 amounted to EUR 82,625. The initial balance of cash and cash equivalents as of January 1, 2015 was EUR
106,748, the closing balance as of December 31, 2015 was EUR 24,123.
16.6.1 Inflows from Operating ActivitiesIn the period at hand, the inflows from operating activi-ties amounted to EUR 100,743,131, with 98.9 % of which from the sale of products and services. The greater part of inflows from operating activities are reported from re-ceivables for lease and services as per the agreement with SODO d.o.o., which amount to EUR 58,277,609
and represent 57.9 % of total inflows from operating ac-tivities. Inflows from the use of network amounted to EUR 37,203,800, services rendered to customers yielded EUR 1,002,866, and inflows from services rendered to cus-tomers on behalf and for the account of SODO d.o.o., amounted to EUR 260,675.
16.6.2 Outflows from Operating ActivitiesOutflows from operating activities amounting to EUR 92,249,535 include expenses for the purchase of material and services, salaries including contributions and taxes, value added tax, and other expenses. The largest share of outflows from operating is held by expenses for the purchase of material and services in the amount of EUR 64,909,390, which represent 70.4 % of total operating expenses.
Salary expenses amounted to EUR 20,172,295. Outflows for taxes and charges are 37.9 % higher than in 2014 and amount to EUR 6,087,820. Other outflows amount to EUR 1,080,030, which is 22 % less than in 2014; the largest share (54.8 %) is represented by supplementary employee retirement insurance. The operating surplus in the amount of EUR 8,493,596 also sufficed to settle in their totality the liabilities related to the repayment of principal and interest of company's long-term investment loans.
in EUR
Comparison between effective and statutory tax rates2015 2014
Rate Amount Rate Amount
Profit before tax 7,566,013 9,048,080
Income tax defined by applying the statutory tax rate 17.00 % 1,286,222 17.00 % 1,538,174
Amounts with a negative effect on base of tax 1,422,722 1,276,562
- amount decreasing the level of tax-deductible expenses 1,422,722 1,276,562
- amount increasing the level of taxable income 0 0
Amounts with a positive effect on base of tax (+) (-) 770,255 1,744,904
- amount increasing the level of tax-deductible expenses 391,770 893,507
- amount decreasing the level of taxable income 378,485 851,397
Tax deductions 3,601,017 3,835,225
- applied, reducing tax liability 3,601,017 3,835,225
Current tax for the current year 10.37 % 784,969 8.91 % 806,567
Increase/decrease in deferred taxes -27,438 -600,099
Income tax in the Income Statement 10.01 % 757,531 2.28 % 206,468
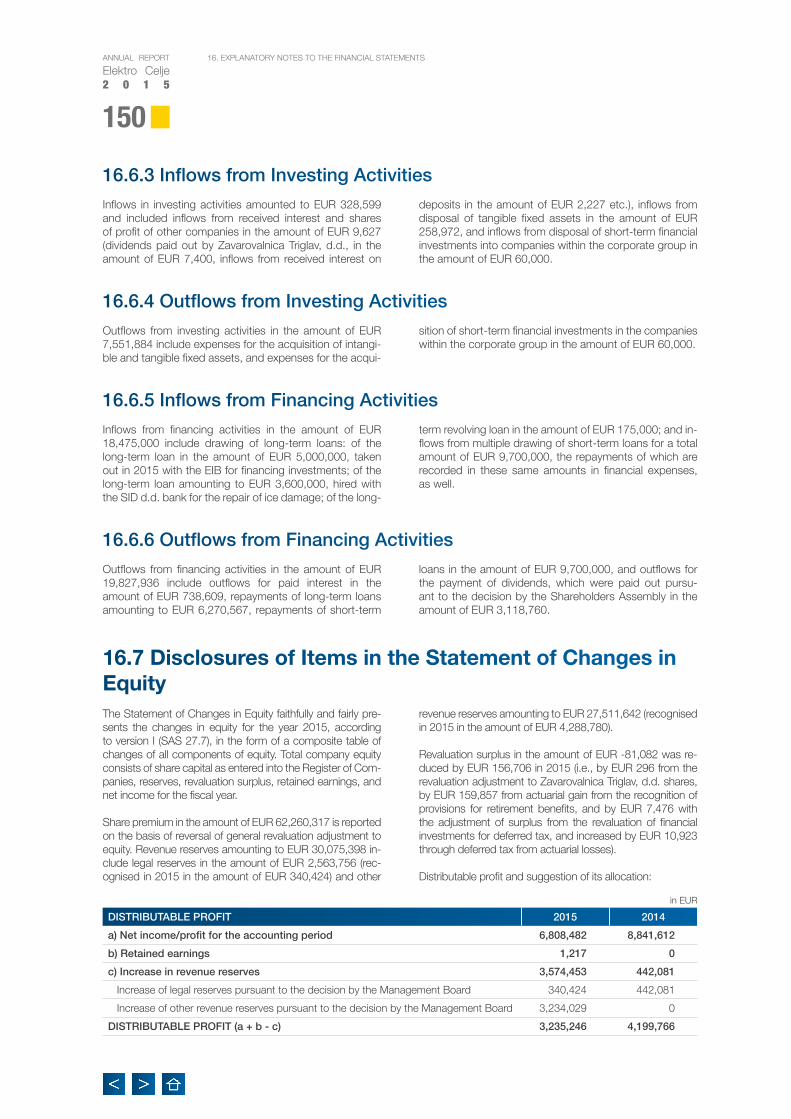
ANNUAL REPORT
Elektro Celje2 0 1 5
150
16. EXPLANATORY NOTES TO THE FINANCIAL STATEMENTS
16.6.3 Inflows from Investing ActivitiesInflows in investing activities amounted to EUR 328,599 and included inflows from received interest and shares of profit of other companies in the amount of EUR 9,627 (dividends paid out by Zavarovalnica Triglav, d.d., in the amount of EUR 7,400, inflows from received interest on
deposits in the amount of EUR 2,227 etc.), inflows from disposal of tangible fixed assets in the amount of EUR 258,972, and inflows from disposal of short-term financial investments into companies within the corporate group in the amount of EUR 60,000.
16.6.4 Outflows from Investing ActivitiesOutflows from investing activities in the amount of EUR 7,551,884 include expenses for the acquisition of intangi-ble and tangible fixed assets, and expenses for the acqui-
sition of short-term financial investments in the companies within the corporate group in the amount of EUR 60,000.
16.6.5 Inflows from Financing ActivitiesInflows from financing activities in the amount of EUR 18,475,000 include drawing of long-term loans: of the long-term loan in the amount of EUR 5,000,000, taken out in 2015 with the EIB for financing investments; of the long-term loan amounting to EUR 3,600,000, hired with the SID d.d. bank for the repair of ice damage; of the long-
term revolving loan in the amount of EUR 175,000; and in-flows from multiple drawing of short-term loans for a total amount of EUR 9,700,000, the repayments of which are recorded in these same amounts in financial expenses, as well.
16.6.6 Outflows from Financing ActivitiesOutflows from financing activities in the amount of EUR 19,827,936 include outflows for paid interest in the amount of EUR 738,609, repayments of long-term loans amounting to EUR 6,270,567, repayments of short-term
loans in the amount of EUR 9,700,000, and outflows for the payment of dividends, which were paid out pursu-ant to the decision by the Shareholders Assembly in the amount of EUR 3,118,760.
16.7 Disclosures of Items in the Statement of Changes in EquityThe Statement of Changes in Equity faithfully and fairly pre-sents the changes in equity for the year 2015, according to version I (SAS 27.7), in the form of a composite table of changes of all components of equity. Total company equity consists of share capital as entered into the Register of Com-panies, reserves, revaluation surplus, retained earnings, and net income for the fiscal year.
Share premium in the amount of EUR 62,260,317 is reported on the basis of reversal of general revaluation adjustment to equity. Revenue reserves amounting to EUR 30,075,398 in-clude legal reserves in the amount of EUR 2,563,756 (rec-ognised in 2015 in the amount of EUR 340,424) and other
revenue reserves amounting to EUR 27,511,642 (recognised in 2015 in the amount of EUR 4,288,780).
Revaluation surplus in the amount of EUR -81,082 was re-duced by EUR 156,706 in 2015 (i.e., by EUR 296 from the revaluation adjustment to Zavarovalnica Triglav, d.d. shares, by EUR 159,857 from actuarial gain from the recognition of provisions for retirement benefits, and by EUR 7,476 with the adjustment of surplus from the revaluation of financial investments for deferred tax, and increased by EUR 10,923 through deferred tax from actuarial losses).
Distributable profit and suggestion of its allocation:
DISTRIBUTABLE PROFIT 2015 2014
a) Net income/profit for the accounting period 6,808,482 8,841,612
b) Retained earnings 1,217 0
c) Increase in revenue reserves 3,574,453 442,081
Increase of legal reserves pursuant to the decision by the Management Board 340,424 442,081
Increase of other revenue reserves pursuant to the decision by the Management Board 3,234,029 0
DISTRIBUTABLE PROFIT (a + b - c) 3,235,246 4,199,766
in EUR
151
ANNUAL REPORT
Elektro Celje2 0 1 5
16. EXPLANATORY NOTES TO THE FINANCIAL STATEMENTS
The Management Board of Elektro Celje proposes that the distributable profit for 2015 in the amount of EUR 3,235,246 be allocated in its entirety to other revenue reserves, and that such reserves in the amount of EUR 3,235,246 be used to set up a fund for the acquisition of treasury shares. The
state assets management strategy adopted by the National Assembly suggests that companies that own electricity in-frastructure gradually consolidate their ownership shares so that the Republic of Slovenia eventually becomes a 100 % shareholder.
16.8 Financial Risk Management Long-term stability of operation is ensured through active risk management. In terms of financial risk, the company is pro-active in credit, market, equity and liquidity risk management. Exposure to individual risks and appropriate management
are assessed and implemented based on their effects on cash flows and financing expenses. In compliance with the adopted risk management policy, financial risks are regularly assessed and the suitability of their management is verified
16.8.1 Credit Risk Credit risk in trade receivables (risk of loss due to non-fulfil-ment of debtor's liability) is related to the non-payment or late payment by electricity consumers and by recipients of the services rendered by the company. Receivables manage-ment and debt recovery are implemented in accordance with Article 76 of the Energy Act (EZ–1), Article 42 of the Decree on General Conditions for the Supply and Consumption of Electricity (SPDOEE), and the provisions of the financial regu-lation of the company. Risk is managed mainly by constant monitoring and accounts receivables insurance, active re-covery of overdue and unpaid receivables, and late charges for overdue payments.
As of December 31, 2015, trade receivables recorded a 28.2 % year-over-year increase mainly due to the receipt of pre-liminary reconciliation of the regulatory framework (RF) for the year 2015 in the amount of EUR 3,426,391, which is expect-ed to be paid in the next RF (i.e., in the years 2019–2021, one third per year). Trade receivables from deviations of the RF for the years 2012–2015 from the actual justified costs of SODO activity by Elektro Celje account for 43.9 % of total trade receivables and will due to a deficit in network charges be included in network charge items in future RFs.
Short-term trade and other receivables account for 88.6 % of the company’s current assets. At the end of 2015, their value was 25.2 % higher than at the beginning of the year, mainly owing to the carry-over of short-term receivables from the company SODO in the amount of EUR 1,277,304, which will come due in 2016. The policy of receivables insurance in 2015 remained the same. Compliant with its risk manage-ment system, the company requires security for receivables
from higher-risk business partners. Security for short-term trade receivables based on debt collection instruments amounts to EUR 399,797; other company's receivables are not secured. Network charge receivables from customers are not insured because this is not anticipated in the SPDOEE.
Exposure to credit risk As of December 31, 2015, the company has EUR 788,435 of trade receivables for network charges, services, lease, average connection fees and late charges payable within a period longer than 365 days (bankruptcies, compulsory set-tlements, lawsuits, and property manager debt as per the Housing Act, and a revaluation adjustment recognised for such) and EUR 9,905,234 of trade receivables not yet due. The percentage of unrecovered trade receivables from 2014 which remain unsettled even one year after their due date amounts to 0.2 %.
The maturity profile of trade receivables reports short-term receivables to the companies within the Group and to cus-tomers (without revaluation adjustments), and late charge re-ceivables (without revaluation adjustments). Compliant with the SAS, the company recognises the revaluation adjustment for trade receivables in bankruptcy proceedings, receivables which are subject of legal dispute, and receivables overdue by more than 90 days as of the balance sheet day. Revalu-ation adjustment of trade receivables is further explained in section 16.2 within the accounting policies (measurement upon initial recognition). The probability of the liquidation of such debt is about 2 %. In 2015, receivables for unjustified consumption amounted to EUR 257,839, of which a little less than 38 % was actually paid.

ANNUAL REPORT
Elektro Celje2 0 1 5
152
16. EXPLANATORY NOTES TO THE FINANCIAL STATEMENTS
The company is also exposed to credit risk related to the fi-nancial investments within the Group which are held for sale. Credit risk arising from financial investments is a risk of higher fluctuations in the value of a financial instrument. Low cred-itworthiness affects the liquidity of financial instruments and makes the sale of investment more difficult. At its extreme, credit risk may lead to a situation in which an investment becomes of no value. Financial assets quoted in the active market and the fair value of which can be reliably measured are valued at fair value (i.e., 2,960 shares of Zavarovalnica
Triglav, d.d., in the amount of EUR 69,560), while others are valued at cost. On the balance sheet date, the company's management establishes whether there are any objective reasons for impairment assessment of a financial investment into an equity instrument. The value that best represents the maximum possible exposure to such risk is the total value of investment. Hedging instruments cannot be used for reduc-ing the exposure to the risk of decrease in the value of long-term financial investments below their cost.
16.8.2 Liquidity Risk In its operation, Elektro Celje is exposed to the risk of unbal-anced liquidity, meaning that at a given moment it may not be able to settle its liabilities. The exposure is measured based on the balance of cash inflows and cash outflows.
Exposure to liquidity risk An important element in liquidity risk management (even short-term) is cash flow planning, which is implemented by Elektro Celje on daily, weekly, monthly and annual bases. Cash flow risk is affected by the amount of collected network
charges, for due to the deficit in network charges for 2014 and 2015 the payments pursuant to the preliminary recon-ciliations of SODO contractual liabilities will only be made in future regulatory periods, when the Energy Agency calcu-lates them into tariff rates for network charges payable by the customers. The company's financial position statement re-ports the two receivables at discounted value, as calculated for the period following the inclusion of receivables into the RF when, in compliance with the network charges act, their remuneration is terminated.
To ensure daily liquidity and for the event of increased liquid-ity demand, in 2015, the company had a EUR 2.5 million worth of bank credit agreements with a maturity of up to one year and, since December, a long-term revolving loan in the amount of EUR 3.145 million. In 2015, the company also signed a contract with the EIB, for EUR 28 million to finance
its investments in the period 2015–2017. The risk of poor credit and timely acquisition of required borrowing consents from sectorial ministries is managed by maintaining an ad-equate share of equity in liabilities and high values of financial performance indicators.
Maturity analysis of current trade receivables due by customers (in EUR):
Maturity Dec 31, 2015 Share in % Dec 31, 2014 Share in %
Receivables not yet due 9,905,234 85.9 7,946,579 84.5
Overdue by less than 30 days 565,908 4.9 408,224 4.3
Overdue by 31-60 days 64,603 0.6 38,876 0.4
Overdue by 61-90 days 12,063 0.1 9,990 0.1
Overdue by 91-180 days 60,369 0.5 45,757 0.5
Overdue by 181-365 days 133,945 1.2 114,574 1.2
Overdue by over 365 days 788,435 6.8 836,526 8.9
Total 11,530,557 100.0 9,400,526 100.0
Preliminary and final reconciliations (in EUR)Carrying value as of
Dec 31, 2015
Incorporation into the regulatory framework
2016-2018 2019-2021
1. SODO - 2014 preliminary reconciliation (PRO 2014) 3,860,759 3,860,759 0
2. SODO - 2015 preliminary reconciliation (PRO 2015) 3,426,391 0 3,426,391
3. SODO - contractual interest for PRO 2014 77,215 77,215 0
4. EAgen - final reconciliation RF 2012-2014 -26,108 -26,108 0
5. Total deviations from the Regulatory Framework (RF) 7,338,257 3,911,866 3,426,391

153
ANNUAL REPORT
Elektro Celje2 0 1 5
16. EXPLANATORY NOTES TO THE FINANCIAL STATEMENTS
16.8.3 Market Risk The major market risk to which Elektro Celje is exposed is the risk of loss (benefit) due to changes in the interest rates of loans. It is related to market fluctuations of interest rates and consequently affects interest-sensitive financial liabilities, which may result in an increase or decrease of related expenses. The exposure to interest rate risk is as-sessed as low, as only 16.7 % of assets are financed with bank loans.
The balance sheet as of December 31, 2015 shows that the financial liabilities were mostly subject to variable in-terest rates based on three or six month EURIBOR. The company is exposed to interest rate risk due to potentially unfavourable changes in the EURIBOR reference interest rate; the latter are not secured by financial instruments.
Exposure to interest rate riskExposure to interest rate risk is assessed by sensitivity analysis. Based on the volume of loans as of December 31, 2015, a 0.1 % change in the interest rate (IR) would result in a cash outflow amounting to EUR 15,943, a 0.2 % change in the IR would result in a cash outflow amount-ing to EUR 41,046, and a 0.3 % change in the IR would result in EUR 81,342 higher expenses for interest paid (the likelihood of higher EURIBOR change is estimated as low). The analysis rests on the assumption that all other vari-ables remain the same.
As a precaution, the company rejects all terms of con-tracts that would allow the lender to subsequently change interest rates (increased costs clauses) due to changed conditions in the money and capital markets, changes in regulations and instructions by any governmental, fiscal or monetary authorities, changes in the borrower's credit ranking, etc. The company acts in accordance with the Decree on the Terms and Conditions and Methods of Borrowing by Legal Entities from Article 87 of the Pub-lic Finance Act. Pursuant to the decree, consent by the Ministry of Finance is required for any and each borrowing procedure and signing agreements with banks.
The company cannot fully manage this risk, as the man-agement costs (interest rate hedging) or taking out loans at fixed interest rate not based on EURIBOR would ex-ceed the benefits. A large increase of EURIBOR is not ex-pected in 2016, and the company has succeeded several times already in reducing the EURIBOR margin defined in the existing contracts (in 2015, the effect of reduction on pre-tax income amounted to EUR 123,403, which is EUR 584,759 to the expiration of these contracts). The average EURIBOR margin for all long-term loans in 2015 amounts to 1.7 %.
16.8.4 Equity Risk Equity is managed in order to ensure a high credit rating, capital adequacy and good financing indicators to meet the requirements of operation funding and attain the high-est possible value for shareholders. In 2015, equity to total liabilities rate amounted to 72.15 % compared to 72.86 % in 2014.
Changes in equity are monitored by the financial leverage indicator calculated by dividing (net) financial liabilities by equity. Net financial liabilities include long- and short-term liabilities to banks and other financial liabilities minus cash
and cash equivalents. In making equity management deci-sions, the company also observes other financial commit-ments pursuant to credit agreements defined in section 16.3.11. On the balance sheet date, the company fulfils all contractual financial commitments.
Exposure to equity risk The company's net debt to equity ratio is relatively low, which is a good starting point for obtaining a good credit rating and thereby lower costs of borrowing.
Maturity of financial liabilities to banks as of Dec 31, 2015 (in EUR)
Carrying value as of Dec 31, 2015
Term
Up to 1 year 1 to 5 years over 5 years
1. Investment financing loans 45,304,426 11,761,695 30,247,682 3,295,049
2. Other loans granted 76,000 76,000 0 0
Total financial liabilities to banks 45,380,426 11,837,695 30,247,682 3,295,049
Maturity of financial liabilities to banks as of Dec 31, 2014 (in EUR)
Carrying value as of Dec 31, 2014
Term
Up to 1 year 1 to 5 years over 5 years
1. Investment financing loans 42,875,993 6,206,650 28,795,660 7,873,683
Total financial liabilities to banks 42,875,993 6,206,650 28,795,660 7,873,683

ANNUAL REPORT
Elektro Celje2 0 1 5
154
16. EXPLANATORY NOTES TO THE FINANCIAL STATEMENTS
16.9 Transactions with Associated Parties
16.9.1 Transactions with Companies within the Corporate Group
16.9.2 Data on the Remuneration of the Supervisory and Management BodiesRemuneration granted to the supervisory and management bodies for their functions in the company is as follows:
The Management Board in the person of Chairman Mr. Rade Knežević received EUR 108,860 gross (92,413 EUR as fixed part of salary, EUR 13,190 as performance-linked variable part of salary, EUR 2,466 EUR as reimbursement of work-related costs, and EUR 791 as holiday pay). The costs of training and education amounted to EUR 1,344. The Chairman of the Management Board is entitled to use a company vehicle. In case of no-fault termination of office
before the expiration of the term, the employment con-tract of the Chairman of the Management Board provides for severance pay in the amount of six monthly salaries if the Chairman’s employment is terminated. In 2015, the Chairman of the Management Board did not hold a po-sition in supervisory or management bodies in any other company.
Financial leverage indicator (in EUR) Dec 31, 2015 Dec 31, 2014
1. Loans granted and other financial liabilities 45,387,489 42,881,872
2. Minus cash and cash equivalents -24,123 -106,748
3. Net financial liabilities 45,363,366 42,775,124
4. Equity 196,443,080 192,935,102
5. Net debt to equity ratio 23.1% 22.2%
in EUR / YEAR2015 2014
ECE d.o.o. MHE - ELPRO d.o.o. ECE d.o.o. MHE - ELPRO d.o.o.
Assets:
Short-term trade receivables 8,718 3,054 38,495 5,623
Accrued revenue and deferred expenses 637,418 0 292,652 0
Total assets 646,136 3,054 331,147 5,623
Liabilities:
Short-term operating liabilities to suppliers 654,248 32,659 633,435 32,768
Total liabilities 654,248 32,659 633,435 32,768
Income
Net revenue from sales 158,530 24,693 171,001 26,479
Finance income 0 395 11,932 69
Total income 158,530 25,088 182,933 26,548
Costs and expenses:
Cost of material 5,002,467 145,340 5,350,360 81,002
Cost of services 86 0 160,216 0
Financial expenses 0 0 4,121 0
Total costs and expenses 5,002,553 145,340 5,514,697 81,002
Gross receipts of groups of persons (in EUR) 2015 2014
Member of the Management Board 108,860 103,833
Members of the Supervisory Board and Supervisory Board Audit Committee 114,680 110,371
Total 223,539 214,204
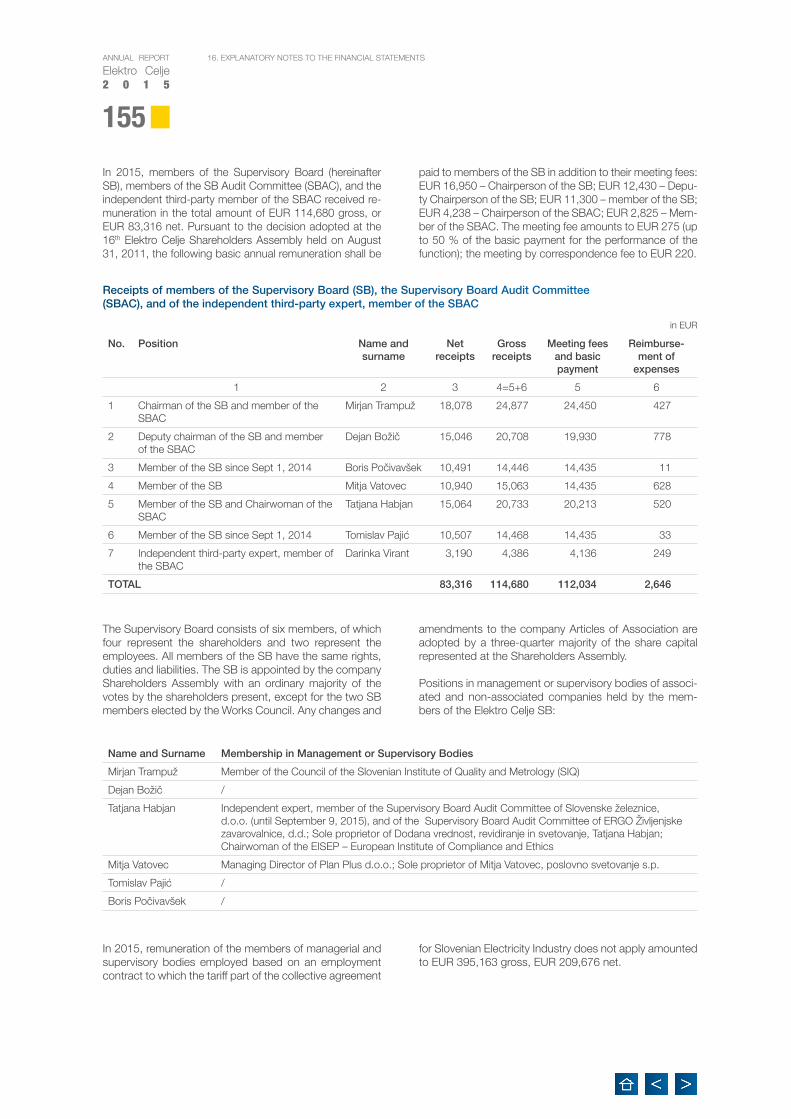
155
ANNUAL REPORT
Elektro Celje2 0 1 5
16. EXPLANATORY NOTES TO THE FINANCIAL STATEMENTS
In 2015, members of the Supervisory Board (hereinafter SB), members of the SB Audit Committee (SBAC), and the independent third-party member of the SBAC received re-muneration in the total amount of EUR 114,680 gross, or EUR 83,316 net. Pursuant to the decision adopted at the 16th Elektro Celje Shareholders Assembly held on August 31, 2011, the following basic annual remuneration shall be
paid to members of the SB in addition to their meeting fees: EUR 16,950 – Chairperson of the SB; EUR 12,430 – Depu-ty Chairperson of the SB; EUR 11,300 – member of the SB; EUR 4,238 – Chairperson of the SBAC; EUR 2,825 – Mem-ber of the SBAC. The meeting fee amounts to EUR 275 (up to 50 % of the basic payment for the performance of the function); the meeting by correspondence fee to EUR 220.
The Supervisory Board consists of six members, of which four represent the shareholders and two represent the employees. All members of the SB have the same rights, duties and liabilities. The SB is appointed by the company Shareholders Assembly with an ordinary majority of the votes by the shareholders present, except for the two SB members elected by the Works Council. Any changes and
amendments to the company Articles of Association are adopted by a three-quarter majority of the share capital represented at the Shareholders Assembly.
Positions in management or supervisory bodies of associ-ated and non-associated companies held by the mem-bers of the Elektro Celje SB:
In 2015, remuneration of the members of managerial and supervisory bodies employed based on an employment contract to which the tariff part of the collective agreement
for Slovenian Electricity Industry does not apply amounted to EUR 395,163 gross, EUR 209,676 net.
Name and Surname Membership in Management or Supervisory Bodies
Mirjan Trampuž Member of the Council of the Slovenian Institute of Quality and Metrology (SIQ)
Dejan Božič /
Tatjana Habjan Independent expert, member of the Supervisory Board Audit Committee of Slovenske železnice, d.o.o. (until September 9, 2015), and of the Supervisory Board Audit Committee of ERGO Življenjske zavarovalnice, d.d.; Sole proprietor of Dodana vrednost, revidiranje in svetovanje, Tatjana Habjan; Chairwoman of the EISEP – European Institute of Compliance and Ethics
Mitja Vatovec Managing Director of Plan Plus d.o.o.; Sole proprietor of Mitja Vatovec, poslovno svetovanje s.p.
Tomislav Pajić /
Boris Počivavšek /
Receipts of members of the Supervisory Board (SB), the Supervisory Board Audit Committee (SBAC), and of the independent third-party expert, member of the SBAC
No. Position Name and surname
Net receipts
Gross receipts
Meeting fees and basic payment
Reimburse-ment of
expenses
1 2 3 4=5+6 5 6
1 Chairman of the SB and member of the SBAC
Mirjan Trampuž 18,078 24,877 24,450 427
2 Deputy chairman of the SB and member of the SBAC
Dejan Božič 15,046 20,708 19,930 778
3 Member of the SB since Sept 1, 2014 Boris Počivavšek 10,491 14,446 14,435 11
4 Member of the SB Mitja Vatovec 10,940 15,063 14,435 628
5 Member of the SB and Chairwoman of the SBAC
Tatjana Habjan 15,064 20,733 20,213 520
6 Member of the SB since Sept 1, 2014 Tomislav Pajić 10,507 14,468 14,435 33
7 Independent third-party expert, member of the SBAC
Darinka Virant 3,190 4,386 4,136 249
TOTAL 83,316 114,680 112,034 2,646
in EUR
ANNUAL REPORT
Elektro Celje2 0 1 5
156
16. EXPLANATORY NOTES TO THE FINANCIAL STATEMENTS
16.10 Disclosures Pursuant to the Energy Act (EA)Elektro Celje, d.d., compiles its financial statements for the company as a whole. In addition, business segments or activities are reported on pursuant to Article 109 of EA (EZ-1) and to the provisions of the SAS in order to provide
explanatory notes to the financial statements. The activi-ties of the company include provision of electricity infra-structure and services of public utility service of DNSO as per agreement with SODO d.o.o., and market activities.
16.10.1 Balance Sheet Broken Down by ActivitiesTransactions affecting the accounts of assets and liabili-ties are recorded on an accrual basis and per activities, whereby the company applies the principle of individual valuation of assets and liabilities. Balance Sheet broken down by activities – business segments – has the form of a double-entry balance and includes items specified in SAS 24.4.
Pursuant to the rules and regulations on the criteria for separate accounting recording and reporting by the busi-ness activities of Elektro Celje, the assets and liabilities are classified according to their purpose and use under the respective activities of the company. Only the distribution network including the control centres activity is classified directly under the activity of providing power distribution infrastructure and services for the network distribution operator, while the remaining assets and liabilities of this sector that are not exclusive to one activity are classified in the appropriate category based on the number of hours spent by the sector working on each activity.
The activity of provision of power infrastructure and ser-vices is directly allocated short-term and long-term finan-
cial liabilities to banks from investment loans, short-term liabilities from operations for third-party account (SODO), and short-term and long-term trade receivables for net-work charge and trade receivables due from the system operator. The market activity is directly allocated two long-term investments, one into the subsidiary for power gen-eration and distribution, and the other into the controlled company for the marketing of electricity.
Short-term financial investments and available cash and cash equivalents are calculated based on the amount of assets and liabilities of the activity. The amounts of share capital and revenue reserve are determined and do not change, while the changes of other components of capital by individual segments are disclosed and reported in the statements of changes in equity broken down by activity. The remaining assets and liabilities of the sector that are not exclusive to one activity are classified into the appro-priate category based on the number of hours spent by the sector working on each activity.
With regard to assets and liabilities of shared functions the classification by activity follows these criteria:
• Criterion 1 – Share of hours worked for a par-ticular activity in the accounting period – is used to allocate long-term financial investments not as-signed to a particular activity; long-term loans granted; long-term trade receivables; liabilities related to sala-ries; short-term liabilities to state and other institutions; other short-term trade payables; small tools inventory; long-term trade payables; and retained contributions for employment of persons with disabilities over the man-datory quota. These assets and liabilities are related by contents and amount to the number of hours worked or the number of employees (sale of apartments with pay-ment in instalments, small tools purchase, employees’ salaries).
• Criterion 2 – Share of fixed assets current val-ue – is applied in classifying fixed assets used within shared functions. Since they serve both activities, they are allocated to the appropriated category based on the share of fixed assets pertaining to each activity in the maintenance and investment sector.
• Criterion 3 – Share of total revenue in the ac-counting period, excluding the revenue from shared functions – is applied in classifying short-term receivables, payables for VAT, and short-term ac-cruals and deferrals that are not assigned to a particular activity. The balance of these assets and liabilities de-pends on the scope of invoicing and the related total revenue.
Account Criterion
007, 06, 07, 08, 25, 262, 263, 2655, 2663, 270, 277, 282, 285, 2851 to 2859, 320, 321, 966, 989 1
003, 004, 008, 010, 015, 020, 021, 027, 035, 040, 041, 045, 047, 048, 050, 051, 055, 058, 089, 130, 131, 968 2
120, 129, 1321, 133, 150, 151, 155, 159, 160, 161, 164, 165, 169, 190, 191, 192, 195, 260, 290, 291, 295 3
30, 31, 1320 4
2201, 230, 2212, 224, 2656/8 and 2660/1, 2, 4, 5 5
100, 101, 102, 109, 110, 111, 112, 180, 183, 189, 900, 919, 920, 923, 930, 931, 932, 963 Calculation

157
ANNUAL REPORT
Elektro Celje2 0 1 5
16. EXPLANATORY NOTES TO THE FINANCIAL STATEMENTS
• Criterion 4 – Share of material used in the ac-counting period by particular activity (excluding the cost of electricity purchased to cover the losses) – is applied in classification of materials inventory. Greater use of material requires larger purchases and in turn larger inventory.
• Criterion 5 – Share of cost of material and services by particular activity (excluding the cost of electricity purchased to cover the losses) – is used in classifying trade payables to suppliers of fixed and current assets. Since these payables are based on the invoices for material and services received, which are recorded upon occurrence at the level of shared func-tions, they are classified based on a combined criteria of used material and services by the activities from which these payables reasonably derive.

ANNUAL REPORT
Elektro Celje2 0 1 5
158
16. EXPLANATORY NOTES TO THE FINANCIAL STATEMENTS
BALANCE SHEET BY ACTIVITIES as of Dec 31, 2015
ITEM SODO activityMarket
activitiesTotal
1 2 3 4
A. Non-current assets (I. + II. + III. + IV. + V. + VI.) 250,762,915 8,451,846 259,214,761
I.Intangible assets and long-term accrued revenue and deferred expenses (1 to 6)
1,142,030 14,331 1,156,361
1. Long-term property rights 1,131,915 14,245 1,146,160
4. Intangible assets in development 10,008 43 10,051
6. Other long-term accrued revenue and deferred expenses 107 43 150
II. Property, plant and equipment (1 to 4) 242,853,979 1,050,963 243,904,942
1. Land and buildings (a + b) 173,715,604 37,119 173,752,723
a) Land 5,791,678 4,126 5,795,804
b) Buildings 167,923,926 32,993 167,956,919
2. Production equipment and machinery 61,143,839 943,409 62,087,248
3. Other plant and equipment 46,716 46,777 93,493
4. Tangible fixed assets in the course of acquisition (a + b) 7,947,820 23,658 7,971,478
a) Property, plant and equipment under construction 7,947,820 23,658 7,971,478
IV. Long-term financial investments (1 to 2) 194,760 7,385,356 7,580,116
1. Long-term financial investments excl. loans (a + b + c + d) 194,760 7,385,356 7,580,116
a) Shares and shareholdings in companies within the corporate group
0 7,246,975 7,246,975
c) Other shares and shareholdings 194,760 138,381 333,141
V. Long-term trade receivables (1 to 3) 5,933,686 1,196 5,934,882
2. Long-term trade receivables from customers 5,927,233 0 5,927,233
3. Long-term trade receivables from others 6,453 1,196 7,649
VI. Deferred tax assets 638,460 0 638,460
B. Current assets (I. + II. + III. + IV. + V.) 11,020,743 1,286,195 12,306,938
II. Inventory (1 to 4) 337,488 1,043,041 1,380,529
1. Material 337,488 1,043,041 1,380,529
IV. Short-term trade receivables (1 to 3) 10,680,185 222,101 10,902,286
1. Short-term trade receivables from companies within the corporate group
9,129 2,643 11,772
2. Short-term trade receivables 10,391,791 151,015 10,542,806
3. Short-term trade receivables from others 279,265 68,443 347,708
V. Cash and cash equivalents 3,070 21,053 24,123
C. Short-term accrued revenue and deferred expenses 680,978 58,316 739,294
TOTAL ASSETS (A + B + C) 262,464,636 9,796,357 272,260,993
in EUR

159
ANNUAL REPORT
Elektro Celje2 0 1 5
16. EXPLANATORY NOTES TO THE FINANCIAL STATEMENTS
ITEM SODO activityMarket
activitiesTotal
1 2 3 4
A. Equity 190,439,273 6,003,807 196,443,080
I. Called-up share capital 98,665,077 2,288,124 100,953,201
1. Share capital 98,665,077 2,288,124 100,953,201
II. Share premium 60,849,175 1,411,142 62,260,317
III. Revenue reserve 27,697,859 2,377,539 30,075,398
1. Legal reserves 2,446,066 117,690 2,563,756
5. Other revenue reserves 25,251,793 2,259,849 27,511,642
IV. Revaluation surplus -93,600 12,518 -81,082
V. Retained earnings 899 318 1,217
1. Retained earnings from previous years 899 318 1,217
VI. Net income/ profit for the year 3,319,863 -85,834 3,234,029
1. Undistributed net income/ profit for the year 3,234,029 0 3,234,029
2. Net loss for the year 85,834 -85,834 0
B.Provisions and long-term accrued expenses and deferred revenue (1 to 3)
18,020,344 1,623,866 19,644,210
1. Retirement benefits and similar employee benefits 3,921,223 1,488,145 5,409,368
2. Other provisions 560,069 55,557 615,626
3. Long-term accrued expenses and deferred revenue 13,539,052 80,164 13,619,216
C. Non-current liabilities (I.+ II.+ III.) 33,550,207 0 33,550,207
I. Non-current financial liabilities (1 to 4) 33,542,731 0 33,542,731
2. Long-term financial liabilities to banks and companies 33,542,731 0 33,542,731
III. Deferred tax liabilities 7,476 0 7,476
D. Current liabilities (I. + II. + III.) 19,885,894 1,939,169 21,825,063
II. Current financial liabilities (1 to 4) 11,837,695 7,063 11,844,758
2. Short-term financial liabilities to banks and companies 11,837,695 0 11,837,695
4. Other short-term financial liabilities 0 7,063 7,063
III. Current operating liabilities (1 to 8) 8,048,199 1,932,106 9,980,305
1. Short-term trade payables to companies within the corporate group
675,510 11,397 686,907
2. Short-term trade payables to suppliers 1,881,002 1,329,522 3,210,524
4. Short-term trade payables from operations for third-party account
3,845,389 0 3,845,389
5. Short-term trade payables to employees 1,092,528 361,958 1,454,486
6. Short-term trade payables to state and other institutions 242,141 66,331 308,472
7. Short-term trade payables based on advances 1,921 63,889 65,810
8. Other short-term trade payables 309,708 99,009 408,717
E. Short-term accrued expenses and deferred revenue 568,918 229,515 798,433
TOTAL LIABILITIES (A to E) 262,464,636 9,796,357 272,260,993
in EUR
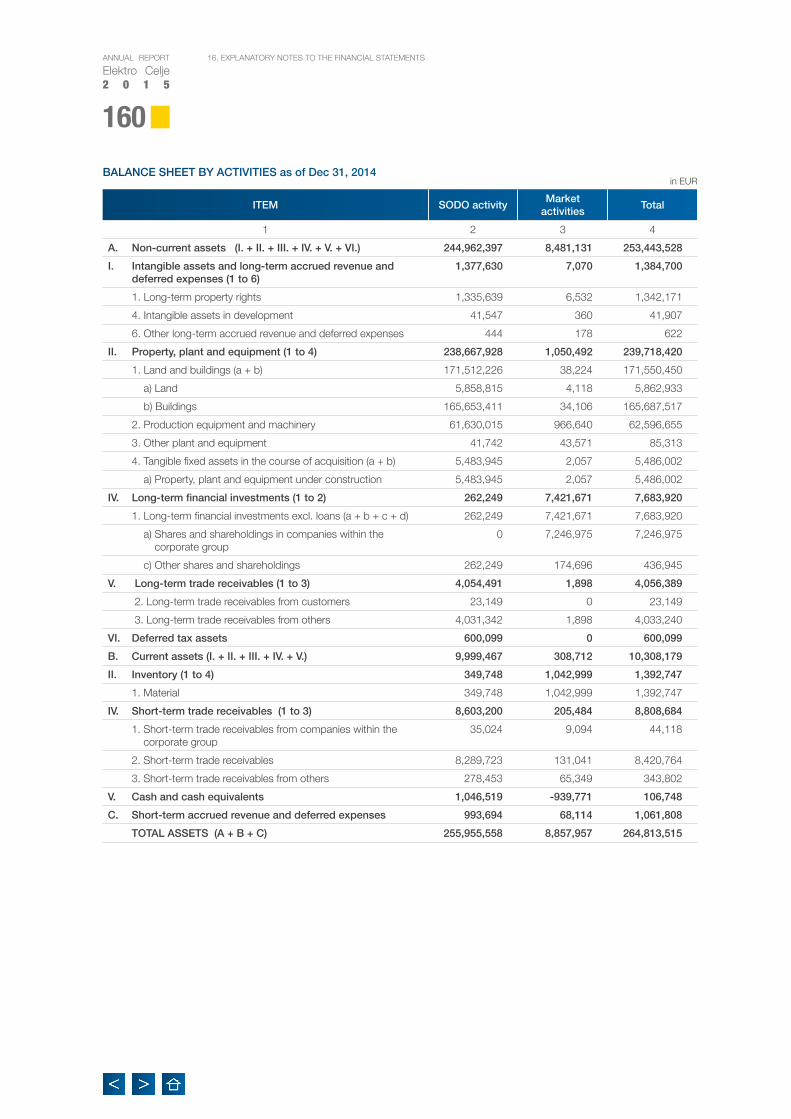
ANNUAL REPORT
Elektro Celje2 0 1 5
160
16. EXPLANATORY NOTES TO THE FINANCIAL STATEMENTS
BALANCE SHEET BY ACTIVITIES as of Dec 31, 2014
ITEM SODO activityMarket
activitiesTotal
1 2 3 4
A. Non-current assets (I. + II. + III. + IV. + V. + VI.) 244,962,397 8,481,131 253,443,528
I. Intangible assets and long-term accrued revenue and deferred expenses (1 to 6)
1,377,630 7,070 1,384,700
1. Long-term property rights 1,335,639 6,532 1,342,171
4. Intangible assets in development 41,547 360 41,907
6. Other long-term accrued revenue and deferred expenses 444 178 622
II. Property, plant and equipment (1 to 4) 238,667,928 1,050,492 239,718,420
1. Land and buildings (a + b) 171,512,226 38,224 171,550,450
a) Land 5,858,815 4,118 5,862,933
b) Buildings 165,653,411 34,106 165,687,517
2. Production equipment and machinery 61,630,015 966,640 62,596,655
3. Other plant and equipment 41,742 43,571 85,313
4. Tangible fixed assets in the course of acquisition (a + b) 5,483,945 2,057 5,486,002
a) Property, plant and equipment under construction 5,483,945 2,057 5,486,002
IV. Long-term financial investments (1 to 2) 262,249 7,421,671 7,683,920
1. Long-term financial investments excl. loans (a + b + c + d) 262,249 7,421,671 7,683,920
a) Shares and shareholdings in companies within the corporate group
0 7,246,975 7,246,975
c) Other shares and shareholdings 262,249 174,696 436,945
V. Long-term trade receivables (1 to 3) 4,054,491 1,898 4,056,389
2. Long-term trade receivables from customers 23,149 0 23,149
3. Long-term trade receivables from others 4,031,342 1,898 4,033,240
VI. Deferred tax assets 600,099 0 600,099
B. Current assets (I. + II. + III. + IV. + V.) 9,999,467 308,712 10,308,179
II. Inventory (1 to 4) 349,748 1,042,999 1,392,747
1. Material 349,748 1,042,999 1,392,747
IV. Short-term trade receivables (1 to 3) 8,603,200 205,484 8,808,684
1. Short-term trade receivables from companies within the corporate group
35,024 9,094 44,118
2. Short-term trade receivables 8,289,723 131,041 8,420,764
3. Short-term trade receivables from others 278,453 65,349 343,802
V. Cash and cash equivalents 1,046,519 -939,771 106,748
C. Short-term accrued revenue and deferred expenses 993,694 68,114 1,061,808
TOTAL ASSETS (A + B + C) 255,955,558 8,857,957 264,813,515
in EUR

161
ANNUAL REPORT
Elektro Celje2 0 1 5
16. EXPLANATORY NOTES TO THE FINANCIAL STATEMENTS
ITEM SODO activityMarket
activitiesTotal
1 2 3 4
A. Equity 187,956,607 4,978,495 192,935,102
I. Called-up share capital 98,665,077 2,288,124 100,953,201
1. Share capital 98,665,077 2,288,124 100,953,201
II. Share premium 60,849,175 1,411,142 62,260,317
III. Revenue reserve 23,131,940 2,314,254 25,446,194
1. Legal reserves 2,105,642 117,690 2,223,332
5. Other revenue reserves 21,026,298 2,196,564 23,222,862
IV. Revaluation surplus 21,071 54,553 75,624
V. Retained earnings 1,335,762 -1,335,762 0
1. Retained earnings from previous years 1,335,762 0 1,335,762
2. Retained losses from previous years 0 1,335,762 1,335,762
VI. Net income/ profit for the year 3,953,582 246,184 4,199,766
1. Undistributed net income/ profit for the year 3,953,582 246,184 4,199,766
B. Provisions and long-term accrued expenses and deferred revenue (1 to 3)
17,670,897 1,456,348 19,127,245
1. Retirement benefits and similar employee benefits 3,721,082 1,419,006 5,140,088
2. Other provisions 40,000 0 40,000
3. Long-term accrued expenses and deferred revenue 13,909,815 37,342 13,947,157
C. Non-current liabilities (I.+ II.+ III.) 36,669,343 0 36,669,343
I. Non-current financial liabilities (1 to 4) 36,669,343 0 36,669,343
2. Long-term financial liabilities to banks and companies 36,669,343 0 36,669,343
D. Current liabilities (I. + II. + III.) 13,022,834 2,191,122 15,213,956
II. Current financial liabilities (1 to 4) 6,210,704 1,825 6,212,529
2. Short-term financial liabilities to banks and companies 6,206,650 0 6,206,650
4. Other short-term financial liabilities 4,054 1,825 5,879
III. Current operating liabilities (1 to 8) 6,812,130 2,189,297 9,001,427
1. Short-term trade payables to companies within the corporate group
643,205 22,998 666,203
2. Short-term trade payables to suppliers 858,775 1,527,278 2,386,053
4. Short-term trade payables from operations for third-party account
3,344,420 0 3,344,420
5. Short-term trade payables to employees 1,018,484 381,147 1,399,631
6. Short-term trade payables to state and other institutions 617,537 70,141 687,678
7. Short-term trade payables based on advances 735 72,820 73,555
8. Other short-term trade payables 328,974 114,913 443,887
E. Short-term accrued expenses and deferred revenue 635,877 231,992 867,869
TOTAL LIABILITIES (A to E) 255,955,558 8,857,957 264,813,515
in EUR

ANNUAL REPORT
Elektro Celje2 0 1 5
162
16. EXPLANATORY NOTES TO THE FINANCIAL STATEMENTS
16.10.2 Income Statement Broken Down by ActivitiesIncome statement broken down by business segments is compiled according to version I (SAS 25.5). All revenue, ex-penses and net income are broken down into the part relat-ed to activities of providing power distribution infrastructure and rendering services for SODO, and market activities.
Organizational activities are not separated; they are con-ducted within the maintenance and investment section, development and operations sector, and shared functions.
Revenue, costs and expenses that cannot be directly at-tributed to a particular activity based on the type of work are classified in the appropriate category based on the number of hours spent by the sector working on each activity. In allocating the revenue, costs and expenses of the shared functions and organizational units within the shared functions, which cannot be directly attributed to a particular activity, the classification under the appropriate category is carried out according to the following criteria:
The criteria of shared functions and individual organisa-tional unit within the shared functions are based on the calculation of appropriate ponders, which include the fol-lowing categories:• activity revenue (the criterion is calculated based on
revenue by activity for the accounting period, minus the shared functions revenue)
• current value of fixed assets associated with the activity (the criterion is calculated based on the current value of fixed assets by activity on the last day of the accounting period)
• consumption of material (the criterion is calculated based on the amounts of material used, excluding the costs of electricity, by activities in the accounting period)
• number of hours worked (the criterion is calculated based on the actual hours worked by the employees per each activity in the accounting period)
• cost of business data processing (the criterion is calculated based on the shares of use of resources as per the price list from the contract signed with Infor-matika, d. d.)
• transport costs (the criterion is calculated based on the value of transports by activity in the accounting period).
Net sales revenue broken down by company activities:
Account Criterion
part of 760, 765, 766, 768, 769, 770, 774, 775, 777, 78, 720, 721, 740, 743, 745, 746, 749
Shared functions
770, 772 Number of hours worked per individual activity
others 40, 41, 43, 443, 47, 48, 75, 78 Individual organisational unit within shared functions
Net sales revenue by activities (in EUR) SODO activityMarket
activitiesTotal
From lease and maintenance of infrastructure and rendering services for SODO
52,065,913 0 52,065,913
From the sale of services 474,109 1,251,539 1,725,648
Total 52,540,022 1,251,539 53,791,561

163
ANNUAL REPORT
Elektro Celje2 0 1 5
16. EXPLANATORY NOTES TO THE FINANCIAL STATEMENTS
INCOME STATEMENT BY ACTIVITIES for the period January-December 2015
ITEMAmount
SODO activity
Market activities
Total
1 2 3 4
1. Net sales revenue 52,540,046 1,251,515 53,791,561
a. In the domestic market 52,540,046 1,251,515 53,791,561
3. Capitalised own products and services 0 14,324,151 14,324,151
4. Other operating revenue (incl. revaluation surplus) 1,106,610 211,204 1,317,814
5. Costs of goods, material and services (a + b) 12,035,651 9,291,029 21,326,680
a. Cost of goods and material 6,250,936 8,343,102 14,594,038
b. Cost of services 5,784,715 947,927 6,732,642
6. Labour costs (a + b + c + d) 15,197,030 5,896,055 21,093,085
a. Cost of salaries 10,733,692 4,240,766 14,974,458
b. Cost of supplementary employee retirement insurance 511,958 182,405 694,363
c. Cost of employer contributions and other levies on salaries 1,717,132 679,159 2,396,291
d. Other labour costs 2,234,248 793,725 3,027,973
7. Write-downs and write-offs (a + b + c) 17,500,191 599,976 18,100,167
a. Amortisation and depreciation 17,122,756 566,744 17,689,500
b. Operating expenses from revaluation of intangible and tangible fixed assets 232,253 23,503 255,756
c. Operating expenses from revaluation of current assets 145,182 9,729 154,911
8. Other operating expenses 334,190 39,982 374,172
9. Finance income from shareholdings (a + b) 0 7,400 7,400
b. Finance income from shareholdings in other companies 0 7,400 7,400
10. Finance income from loans granted (a + b) 1,549 674 2,223
a. Finance income from loans to companies within the corporate group 275 120 395
b. Finance income from loans to others 1,274 554 1,828
11. Finance income from trade receivables 133,722 2,000 135,722
b. Finance income from trade receivables due from third parties 133,722 2,000 135,722
12. Financial expenses from impairment and write-downs of financial investments 72,135 31,373 103,508
13. Financial expenses from financial liabilities (a + b) 950,753 27,174 977,927
b. Financial expenses related to loans from banks 720,092 0 720,092
d. Financial expenses related to other financial liabilities 230,661 27,174 257,835
14. Financial expenses from trade payables 549 208 757
c. Financial expenses from other trade payables 549 208 757
15. Other revenue 19,630 7,224 26,854
16. Other expenses 59,211 4,205 63,416
17. PROFIT FOR THE PERIOD BEFORE TAXES(1 ± 2 + 3 + 4 - 5 - 6 - 7 - 8 + 9 + 10 + 11 - 12 - 13 - 14 + 15 - 16) 7,651,847 -85,834 7,566,013
18. Income tax 784,969 0 784,969
19. Deferred taxes 27,438 0 27,438
20. NET PROFIT/LOSS FOR THE PERIOD(1 ± 2 + 3 + 4 - 5 - 6 - 7 - 8 + 9 + 10 + 11 - 12 - 13 - 14 + 15 - 16 - 18 + 19) 6,894,316 -85,834 6,808,482
in EUR

ANNUAL REPORT
Elektro Celje2 0 1 5
164
16. EXPLANATORY NOTES TO THE FINANCIAL STATEMENTS
INCOME STATEMENT BY ACTIVITIES for the period January-December 2014in EUR
ITEMAmount
SODO activity
Market activities
Total
1 2 3 4
1. Net sales revenue 52,816,806 1,102,757 53,919,563
a. In the domestic market 52,816,806 1,102,757 53,919,563
3. Capitalised own products and services 0 15,117,824 15,117,824
4. Other operating revenue (incl. revaluation surplus) 3,144,077 158,450 3,302,527
5. Costs of goods, material and services (a + b) 12,635,284 10,453,079 23,088,363
a. Cost of goods and material 6,983,279 9,616,204 16,599,483
b. Cost of services 5,652,005 836,875 6,488,880
6. Labour costs (a + b + c + d) 14,279,829 5,539,350 19,819,179
a. Cost of salaries 10,480,343 4,038,751 14,519,094
b. Cost of supplementary employee retirement insurance 478,857 189,287 668,144
c. Cost of employer contributions and other levies on salaries 1,678,097 646,347 2,324,444
d. Other labour costs 1,642,532 664,965 2,307,497
7. Write-downs and write-offs (a + b + c) 18,802,291 572,745 19,375,036
a. Amortisation and depreciation 17,367,532 555,819 17,923,351
b. Operating expenses from revaluation of intangible and tangible fixed assets 1,287,457 5,485 1,292,942
c. Operating expenses from revaluation of current assets 147,302 11,441 158,743
8. Other operating expenses 275,863 32,043 307,906
9. Finance income from shareholdings (a + b) 0 480,313 480,313
a. Finance income from shareholdings in companies within the corporate group 0 475,281 475,281
b. Finance income from shareholdings in other companies 0 5,032 5,032
10. Finance income from loans granted (a + b) 69,452 30,767 100,219
a. Finance income from loans to companies within the corporate group 8,317 3,684 12,001
b. Finance income from loans to others 61,135 27,083 88,218
11. Finance income from trade receivables 49,201 2,649 51,850
b. Finance income from trade receivables due from third parties 49,201 2,649 51,850
13. Financial expenses from financial liabilities (a + b) 1,231,382 49,506 1,280,888
a. Financial expenses related to loans from companies within the corporate group 859 380 1,239
b. Financial expenses related to loans from banks 1,102,691 0 1,102,691
d. Financial expenses related to other financial liabilities 127,832 49,126 176,958
14. Financial expenses from trade payables 2,172 961 3,133
a. Financial expenses from trade payables to companies within the corporate group 1,998 884 2,882
c. Financial expenses from other trade payables 174 77 251
15. Other revenue 14,575 2,753 17,328
16. Other expenses 65,394 1,645 67,039
17.PROFIT FOR THE PERIOD BEFORE TAXES (1 ± 2 + 3 + 4 - 5 - 6 - 7 - 8 + 9 + 10 + 11 - 12 - 13 - 14 + 15 - 16) 8,801,896 246,184 9,048,080
18. Income tax 806,567 0 806,567
19. Deferred taxes 600,099 0 600,099
20.NET PROFIT/LOSS FOR THE PERIOD(1 ± 2 + 3 + 4 - 5 - 6 - 7 - 8 + 9 + 10 + 11 - 12 - 13 - 14 + 15 - 16 - 18 + 19) 8,595,428 246,184 8,841,612

165
ANNUAL REPORT
Elektro Celje2 0 1 5
16. EXPLANATORY NOTES TO THE FINANCIAL STATEMENTS
16.10.3 Statement of Cash Flows Broken Down by ActivitiesThe statement of cash flows broken down by activities is a company financial statement that faithfully and fairly pre-sents changes in the cash and cash equivalents by activi-ties. It refers to the fiscal year for which it is compiled. It reports the cash flows by activity in operating, investing and financing activities. The cash flow statement is com-piled in version I (SAS 26.5) using the direct method and line-by-line form.
The basis for compiling the statement of cash flows by activity are data from the relative underlying documents on the cash flows. The allocation of revenue and expenses by
activity for the relevant accounting period follows the crite-ria for allocating assets, liabilities, revenue and expenses.
The cash flows increasing or decreasing the values of as-sets and liabilities of a sector and cannot be directly at-tributed to one particular activity are classified under the appropriate category based on the number of hours spent by the sector working on each activity. The allocation of revenue and expenses of shared functions to the appro-priate activities follows the criteria defined in the rules and regulations on the criteria for separate accounting record-ing and reporting by the business activities of Elektro Celje:
The cash flows which increase or decrease the volume of revenue, costs and expenses of activities within the maintenance and investment sector and within the de-velopment and operations sector, and which cannot be directly attributed to a particular activity based on the type of work, will be classified under the appropriate category
based on the number of hours spent by each sector work-ing on a particular activity. The allocation of revenue, costs and expenses of shared functions and organisational units within shared functions, which cannot be directly attrib-uted to a particular activity, follows the criteria specified in Articles 14 and 15 of the said rules and regulations:
The surplus of inflows from operating activities over the outflows from the activity of providing power distribution network and rendering services for the distribution net-work operator represents a funding source for investing
activities, payments to suppliers, and carrying out own investments within the company’s non-power related ac-tivities.
Account Criterion
06, 07, 08, 25, 263, 2655, 2663, 270, 277, 282, 285, 966 C1
130, 131, 968 C2
120, 1321, 133, 150, 151, 155, 160, 161, 164, 165, 190, 191, 192, 195, 260, 290, 291, 295 C3
2201, 230, 2212, 224, 2656/8, 2660/1, 2, 4, 5, 6, 2203 C5
110, 111,112, 176, 180, 182, 183, 272, 280 Calculation
Account Criterion
7772, 7773, 7862, 7863, 7460/1, 2 Shared functions
4163, 4196, 4821, 4890, 7540, 7580, 7591, 7880, 7890 Individual organisational unit within shared functions

ANNUAL REPORT
Elektro Celje2 0 1 5
166
16. EXPLANATORY NOTES TO THE FINANCIAL STATEMENTS
STATEMENT OF CASH FLOWS FOR 2015in EUR
Item SODO activityMarket
activitiesTotal
1 2 3 4
A. Operating cash flow
a) Operating revenue 99,069,711 19,148,884 118,218,595
Revenue from sale of goods and services 98,238,981 18,824,056 117,063,037
Other operating revenue 830,730 324,828 1,155,558
b) Operating expenses -77,174,304 -15,075,230 -92,249,534
Purchase of material and services -56,548,296 -8,361,093 -64,909,389
Salaries and employees' share in the profit -15,187,970 -4,984,325 -20,172,295
Charges (contributions and other taxes) -4,635,516 -1,452,304 -6,087,820
Other operating expenses -802,522 -277,508 -1,080,030
c) Net cash inflow or outflow in operating activities 21,895,407 4,073,654 25,969,061
B. Investing cash flow
a) Inflows from investing activities 283,360 45,239 328,599
Interests and dividends received 1,812 7,815 9,627
Proceeds from disposal of property, plant and equipment 221,548 37,424 258,972
Proceeds from disposal of short-term financial investments in companies within the corporate group
60,000 0 60,000
Proceeds from disposal of short-term financial investments 0 0 0
b) Outflows from investing activities -24,988,040 -39,308 -25,027,348
Purchase of intangible fixed assets -858,347 -10,771 -869,118
Purchase of property, plant and equipment -24,069,693 -28,537 -24,098,230
Purchase of short-term financial investments in companies within the corporate group
-60,000 0 0
c) Net cash inflow or outflow in investing activities -24,704,680 5,931 -24,698,749
C. Financing cash flow
a) Inflows from financing activities 18,475,000 17,475,464 35,950,464
Loans granted by companies within the corporate group 0 0 0
Granted long-term loans 8,775,000 0 8,775,000
Granted short-term loans 9,700,000 17,475,464 27,175,464
b) Outflows from financing activities -16,709,176 -20,594,225 -37,303,401
Interest paid -738,609 0 -738,609
Repayments of loans granted by companies within the corporate group 0 0 0
Repayments of long-term debt -6,270,567 0 -6,270,567
Repayments of short-term debt -9,700,000 -17,475,464 -27,175,464
Paid out dividends and other profit shares 0 -3,118,761 3,118,761
c) Net cash inflow or outflow in financing activities 1,765,824 -3,118,761 -1,352,937
D. Closing balance 3,070 21,053 24,123
Cash and cash equivalents in the period (sum of net cash inflows/outflows under Ac, Bc and Cc)
-1,043,449 960,824 -82,625
Opening balance 1,046,519 -939,771 106,748

167
ANNUAL REPORT
Elektro Celje2 0 1 5
16. EXPLANATORY NOTES TO THE FINANCIAL STATEMENTS
STATEMENT OF CASH FLOWS FOR 2014in EUR
Item SODO activityMarket
activitiesTotal
1 2 3 4
A. Operating cash flow
a) Operating revenue 99,719,875 19,933,771 119,653,646
Revenue from sale of goods and services 96,123,704 19,636,785 115,760,489
Other operating revenue 3,596,171 296,986 3,893,157
b) Operating expenses -70,917,208 -17,837,821 -88,755,029
Purchase of material and services -52,402,417 -11,081,840 -63,484,257
Salaries and employees' share in the profit -14,105,325 -5,367,979 -19,473,304
Charges (contributions and other taxes) -3,307,783 -1,105,771 -4,413,554
Other operating expenses -1,101,683 -282,231 -1,383,914
c) Net cash inflow or outflow in operating activities 28,802,667 2,095,950 30,898,617
B. Investing cash flow
a) Inflows from investing activities 4,221,795 518,554 4,740,349
Interests and dividends received 114,498 480,378 594,876
Proceeds from disposal of property, plant and equipment 463,297 38,176 501,473
Proceeds from disposal of short-term financial investments of companies within the corporate group
644,000 0 644,000
Proceeds from disposal of short-term financial investments 3,000,000 0 3,000,000
b) Outflows from investing activities -29,449,493 -47,593 -29,497,086
Purchase of intangible fixed assets -173,889 -892 -174,781
Purchase of property, plant and equipment -29,275,604 -46,701 -29,322,305
c) Net cash inflow or outflow in investing activities -25,227,698 470,961 -24,756,737
C. Financing cash flow
a) Inflows from financing activities 40,437,263 19,177,737 59,615,000
Loans granted by companies within the corporate group 1,836,008 733,992 2,570,000
Granted long-term loans 23,415,000 0 23,415,000
Granted short-term loans 15,186,255 18,443,745 33,630,000
b) Outflows from financing activities -45,780,558 -19,922,122 -65,702,680
Interests paid -1,124,965 0 -1,124,965
Repayments of loans granted by companies within the corporate group -1,836,008 -733,992 -2,570,000
Repayments of long-term debt -25,976,474 0 -25,976,474
Repayments of short-term debt -15,186,255 -18,443,745 -33,630,000
Paid out dividends and other profit shares -1,656,856 -744,385 -2,401,241
c) Net cash inflow or outflow in financing activities -5,343,295 -744,385 -6,087,680
D. Closing balance 1,046,519 -939,771 106,748
Cash and cash equivalents in the period (sum of net cash inflows/outflows under Ac, Bc and Cc)
-1,768,326 1,822,526 54,200
Opening balance 2,814,845 -2,762,297 52,548

We provide electricity to almost one quarter of Slovenia. This is a responsibility we implement by managing a modern distribution network, in which all electric power devices and equipment are integrated into an efficient system.
INTEGRATION

ANNUAL REPORT
Elektro Celje2 0 1 5
170
17. CONSOLIDATED FINANCIAL STATEMENTS OF ELEKTRO CELJE GROUP
17. CONSOLIDATED FINANCIAL STATEMENTS OF ELEKTRO CELJE GROUP17.1 CONSOLIDATED BALANCE SHEET
in EUR
ITEM NoteAmount
Current year Previous year
A. Non-current assets (I. + II. + III. + IV. + V. + VI.) 257,668,990 249,934,024
I. Intangible assets and long-term accrued revenue and deferred expenses (1 to 6)
18.3.1 1,787,304 1,670,260
1. Long-term property rights 1,629,895 1,627,731
4. Intangible assets in development 157,259 41,907
6. Other long-term accrued revenue and deferred expenses 150 622
II. Property, plant and equipment (1 to 4) 18.3.2 246,489,479 242,253,976
1. Land and buildings (a + b) 174,835,032 172,674,287
a) Land 5,862,153 5,928,244
b) Buildings 168,972,879 166,746,043
2. Production equipment and machinery 63,265,765 64,002,019
3. Other plant and equipment 417,204 91,668
4. Tangible fixed assets in the course of acquisition (a + b) 7,971,478 5,486,002
a) Property, plant and equipment under construction 7,971,478 5,486,002
III. Investment property 18.3.3 321,318 298,773
IV. Long-term financial investments (1 to 2) 18.3.4 684,777 436,944
1. Long-term financial investments excl. loans (a + b + c + d) 684,777 436,944
c) Other shares and shareholdings 684,777 436,944
V. Long-term trade receivables (1 to 3) 18.3.8.1 6,928,016 4,170,788
2. Long-term trade receivables from customers 6,919,719 136,177
3. Long-term trade receivables from others 8,297 4,034,611
VI. Deferred tax assets 18.3.5 1,458,096 1,103,283
B. Current assets (I. + II. + III. + IV. + V.) 54,096,194 34,940,768
I. Available-for-sale assets 18.3.6 51,628 0
II. Inventory (1 to 4) 18.3.7 1,426,577 1,451,015
1. Material 1,380,529 1,392,747
3. Products and merchandise 46,048 58,268
IV. Short-term trade receivables (1 to 3) 18.3.8.2 50,761,120 31,486,204
2. Short-term trade receivables from customers 47,167,231 29,407,821
3. Short-term trade receivables from others 3,593,889 2,078,383
V. Cash and cash equivalents 18.3.9 1,856,869 2,003,549
C. Short-term accrued revenue and deferred expenses 18.3.10 479,360 838,620
TOTAL ASSETS (A + B + C) 312,244,544 285,713,412

171
ANNUAL REPORT
Elektro Celje2 0 1 5
17. CONSOLIDATED FINANCIAL STATEMENTS OF ELEKTRO CELJE GROUP
in EUR
ITEM NoteAmount
Current year Previous year
A. Equity 18.3.11 207,638,928 196,839,551
Equity share of non-controlling interests 4,463,343 0
Equity share of controlling interests 203,175,585 196,839,551
I. Called-up share capital 100,953,201 100,953,201
1. Share capital 100,953,201 100,953,201
II. Share premium 62,260,317 62,260,317
III. Revenue reserve 30,076,650 25,447,446
1. Legal reserves 2,565,008 2,224,584
5. Other revenue reserves 27,511,642 23,222,862
IV. Revaluation surplus -40,448 76,927
V. Retained earnings 3,903,111 2,009,567
1. Retained earnings from previous years 3,903,111 2,009,567
VI. Net income/ profit for the year 6,022,754 6,092,093
1. Undistributed net income/ profit for the year 6,022,754 6,092,093
B. Provisions and long-term accrued expenses and deferred revenue (1 to 3)
18.3.12 20,206,307 19,457,685
1. Retirement benefits and similar employee benefits 5,971,465 5,470,528
2. Other provisions 615,626 40,000
3. Long-term accrued expenses and deferred revenue 13,619,216 13,947,157
C. Non-current liabilities (I.+ II.+ III.) 33,632,922 36,770,278
I. Non-current financial liabilities (1 to 4) 18.3.13 33,609,060 36,770,278
2. Long-term financial liabilities to banks and companies 33,609,060 36,770,278
II. Non-current operating liabilities (1 to 5) 7,659 0
4. Long-term operating liabilities related to advance payments 7,659 0
III. Deferred tax liabilities 18.3.14 16,203 0
D. Current liabilities (I. + II. + III.) 48,742,355 30,519,657
II. Current financial liabilities (1 to 4) 13,879,624 6,247,502
2. Short-term financial liabilities to banks and companies 13,872,561 6,241,623
4. Other short-term financial liabilities 7,063 5,879
III. Current operating liabilities (1 to 8) 34,862,731 24,272,155
2. Short-term trade payables to suppliers 18,974,262 12,321,912
4. Short-term trade payables from operations for third-party account 11,455,151 7,896,043
5. Short-term trade payables to employees 1,725,717 1,536,620
6. Short-term trade payables to state and other institutions 1,105,221 1,627,062
7. Short-term trade payables based on advances 970,217 429,827
8. Other short-term trade payables 632,163 460,691
E. Short-term accrued expenses and deferred revenue 18.3.15 2,024,032 2,126,241
TOTAL LIABILITIES (A + B + C + D + E) 312,244,544 285,713,412

ANNUAL REPORT
Elektro Celje2 0 1 5
172
17. CONSOLIDATED FINANCIAL STATEMENTS OF ELEKTRO CELJE GROUP
17.2 CONSOLIDATED INCOME STATEMENT
ITEM NoteAmount
Current yearPrevious
year
1. Net sales revenue (a + b) 18.5.1 162,405,192 140,389,018
a. In the domestic market 162,405,192 140,389,018
3. Capitalised own products and services 18.5.2 14,324,151 15,117,824
4. Other operating revenue (incl. revaluation surplus) 18.5.3 2,896,270 3,406,268
5. Costs of goods, material and services (a + b) 18.5.4.1 124,291,002 103,981,806
a. Cost of goods and material 114,250,970 94,774,053
b. Cost of services 10,040,032 9,207,753
6. Labour costs (a + b + c + d) 18.5.4.2 23,094,512 21,382,411
a. Cost of salaries 16,481,894 15,648,468
b. Cost of supplementary employee retirement insurance 749,645 714,451
c. Cost of employer contributions and other levies on salaries 2,639,158 2,510,559
d. Other labour costs 3,223,815 2,508,933
7. Write-downs and write-offs (a + b + c) 18.5.4.3 19,357,839 20,797,151
a. Amortisation and depreciation 18,069,944 18,248,905
b. Operating expenses from revaluation of intangible and tangible fixed assets 256,951 1,542,069
c. Operating expenses from revaluation of current assets 1,030,944 1,006,177
8. Other operating expenses 18.5.4.4 654,297 377,510
9. Finance income from shareholdings (a + b + c) 18.5.5 7,400 5,032
b. Finance income from shareholdings in other companies 7,400 5,032
10. Finance income from loans granted (a + b) 18.5.6 4,333 99,392
b. Finance income from loans to others 4,333 99,392
11. Finance income from trade receivables (a + b) 18.5.7 334,781 190,559
b. Finance income from trade receivables due from third parties 334,781 190,559
12. Financial expenses from impairment and write-downs of financial investments
18.5.8 103,508 0
13. Financial expenses from financial liabilities (a + b + c + d) 18.5.9 985,557 1,305,291
b. Financial expenses related to loans from banks 727,722 1,116,955
d. Financial expenses related to other financial liabilities 257,835 188,336
14. Financial expenses from trade payables (a + b + c) 18.5.10 13,996 2,405
b. Financial expenses from trade payables to suppliers and liabilities arising from bills of exchange
398 2,147
c. Financial expenses from other trade payables 13,598 258
15. Other revenue 18.5.11 165,497 145,605
16. Other expenses 18.5.12 107,209 87,859
17. PROFIT FOR THE PERIOD BEFORE TAXES(1 + 2 + 3 + 4 - 5 - 6 - 7 - 8 + 9 + 10 + 11 - 12 - 13 - 14 + 15 - 16)
18.5.13 11,529,704 11,419,265
18. Income tax 18.5.15 1,114,450 1,369,444
19. Deferred taxes 182,023 -684,118
20. NET PROFIT/LOSS FOR THE PERIOD(1 + 2 + 3 + 4 - 5 - 6 - 7 - 8 + 9 + 10 + 11 - 12 - 13 - 14 + 15 - 16 - 18 + 19)
18.5.13 10,233,231 10,733,939
21. NET PROFIT SHARE OF CONTROLLING INTERESTS 9,597,207
22. NET PROFIT SHARE OF NON-CONTROLLING INTERESTS 636,024
in EUR

173
ANNUAL REPORT
Elektro Celje2 0 1 5
17. CONSOLIDATED FINANCIAL STATEMENTS OF ELEKTRO CELJE GROUP
17.3 CONSOLIDATED COMPREHENSIVE INCOME STATEMENT
in EUR
ITEM Current year Previous year
1. Profit for the financial period 10,233,231 10,733,939
3. Changes in the revaluation surplus from revaluations of available-for-sale financial assets 22,430 13,616
5. Adjustment to the revaluation surplus from revaluations of actuarial gain/loss -124,552 32,653
6. Total comprehensive income for the financial period (1 + 2 + 3 + 4 + 5) 10,131,109 10,780,208
Explanatory notes to the Consolidated Comprehensive Income Statement are provided in section 18.5.14.

ANNUAL REPORT
Elektro Celje2 0 1 5
174
17. CONSOLIDATED FINANCIAL STATEMENTS OF ELEKTRO CELJE GROUP
17.4 CONSOLIDATED STATEMENT OF CASH FLOWSin EUR
Item Note Current year Previous year
1 2 3 4
A. Operating cash flow
a) Operating revenue 18.6.1 356,512,724 265,540,976
Revenue from sale of goods and services 354,565,167 261,769,977
Other operating revenue 1,947,557 3,770,999
b) Operating expenses 18.6.2 -349,999,300 -248,808,822
Purchase of material and services -306,354,368 -213,712,088
Salaries and employees' share in the profit -23,049,499 -20,980,031
Charges (contributions and other taxes) -19,361,929 -13,069,719
Other operating expenses -1,233,504 -1,046,984
c) Net cash inflow or outflow in operating activities 6,513,424 16,732,154
B. Investing cash flow
a) Inflows from investing activities 18.6.3 758,336 3,612,810
Interests and dividends received 19,364 112,969
Proceeds from disposal of property, plant and equipment 258,972 499,841
Proceeds from disposal of short-term financial investments 480,000 3,000,000
b) Outflows from investing activities 18.6.4 -8,375,124 -11,595,597
Purchase of intangible fixed assets -1,201,028 -373,735
Purchase of property, plant and equipment -6,794,096 -11,221,862
Purchase of short-term financial investments -380,000 0
c) Net cash inflow or outflow in investing activities -7,616,788 -7,982,787
C. Financing cash flow
a) Inflows from financing activities 18.6.5 40,955,055 73,145,117
Granted long-term loans 8,775,000 23,415,000
Granted short-term loans 32,180,055 49,730,117
b) Outflows from financing activities 18.6.6 -40,352,095 -80,580,705
Interest paid -748,163 -1,138,385
Repayments of long-term debt -6,305,172 -26,011,079
Repayments of short-term debt -30,180,000 -51,030,000
Paid out dividends and other profit shares -3,118,760 -2,401,241
c) Net cash inflow or outflow in financing activities 602,960 -7,435,588
D. Closing balance 1,856,869 2,003,549
Cash and cash equivalents in the period (sum of net cash inflows/outflows under Ac, Bc and Cc)
-500,404 1,313,779
Opening balance 2,357,273 689,770

175
ANNUAL REPORT
Elektro Celje2 0 1 5
17. CONSOLIDATED FINANCIAL STATEMENTS OF ELEKTRO CELJE GROUP
17.5 CONSOLIDATED STATEMENT OF CHANGES IN EQUITY
in E
UR
Explanatory notes to the Consolidated Statement of Changes in Equity are provided in section 18.7.
CO
NS
OLI
DAT
ED
STA
TEM
EN
T O
F C
HA
NG
ES
IN E
QU
ITY
fr
om J
an 1
, 201
5 to
Dec
31,
201
5
Cal
led
-up
ca
pita
lR
even
ue r
eser
veR
eva-
luat
ion
surp
lus
Ret
aine
d
earn
ing
s
Net
inco
-m
e/ p
rofit
fo
r th
e ye
ar
Tota
l eq
uity
sh
are
of
the
con-
tro
lling
in
tere
sts
Eq
uity
sh
are
of
the
non-
con-
tro
lling
in
tere
sts
Tota
l
Sha
re
cap
ital
Sha
re
pre
miu
mLe
gal
re
serv
es
Oth
er
reve
nue
rese
rve
Ret
aine
d
earn
ing
s
Net
inco
-m
e/ p
rofit
fo
r th
e ye
ar
A.1
.B
alan
ce a
t th
e en
d o
f p
revi
ous
p
erio
d10
0,95
3,20
162
,260
,317
2,22
4,58
423
,222
,862
76,9
272,
009,
567
6,09
2,09
319
6,83
9,55
10
196,
839,
551
A.2
.B
alan
ce a
t th
e b
egin
ning
of
the
rep
ort
ing
per
iod
100,
953,
201
62,2
60,3
172,
224,
584
23,2
22,8
6276
,927
2,00
9,56
76,
092,
093
196,
839,
551
019
6,83
9,55
1
B.1
.C
hang
es in
eq
uity
- t
rans
actio
ns
with
sha
reho
lder
s0
00
00
-3,1
45,0
150
-3,1
45,0
153,
813,
283
668,
268
a)P
aym
ent o
f div
iden
ds0
00
00
-3,1
45,0
150
-3,1
45,0
150
-3,1
45,0
15
b)E
ffect
s of
the
mer
ger
by a
cqui
sitio
n0
00
00
00
03,
813,
283
3,81
3,28
3
B.2
.To
tal c
om
pre
hens
ive
inco
me
in t
he
rep
ort
ing
per
iod
00
00
-116
,158
09,
597,
207
9,48
1,04
965
0,06
010
,131
,109
a)E
ntry
of n
et in
com
e/ p
rofit
for
the
repo
rtin
g pe
riod
00
00
00
9,59
7,20
79,
597,
207
636,
024
10,2
33,2
31
b)C
hang
es in
the
reva
luat
ion
surp
lus
from
reva
luat
ions
of fi
nanc
ial
inve
stm
ents
00
00
22,4
300
022
,430
10,4
3332
,863
c)A
djus
tmen
t of t
he re
valu
atio
n su
rplu
s -
actu
aria
l gai
ns0
00
0-1
38,5
880
0-1
38,5
883,
603
-134
,985
B.3
.C
hang
es in
eq
uity
00
340,
424
4,28
8,78
0-1
,217
5,03
8,55
9-9
,666
,546
00
0
a)A
lloca
tion
of th
e re
mai
nder
of
net p
rofit
of 2
014
to o
ther
equ
ity
com
pone
nts
00
00
06,
092,
093
-6,0
92,0
930
00
b)A
lloca
tion
of a
par
t of n
et p
rofit
of
2015
to o
ther
equ
ity c
ompo
nent
s pu
rsua
nt to
the
deci
sion
by
the
man
agem
ent a
nd s
uper
viso
ry b
odie
s
00
340,
424
3,23
4,02
90
0-3
,574
,453
00
0
c)A
lloca
tion
of a
par
t of n
et p
rofit
into
bu
ildin
g up
add
ition
al re
serv
es p
ursu
ant
to th
e de
cisi
on b
y th
e S
hare
hold
ers
Ass
embl
y
00
01,
054,
751
0-1
,054
,751
00
00
d)O
ther
cha
nges
in e
quity
-1,2
171,
217
00
00
C.
Bal
ance
at
the
end
of
the
rep
ort
ing
p
erio
d10
0,95
3,20
162
,260
,317
2,56
5,00
827
,511
,642
-40,
448
3,90
3,11
16,
022,
754
203,
175,
585
4,46
3,34
320
7,63
8,92
8

ANNUAL REPORT
Elektro Celje2 0 1 5
176
17. CONSOLIDATED FINANCIAL STATEMENTS OF ELEKTRO CELJE GROUP
in E
UR
Explanatory notes to the Consolidated Statement of Changes in Equity are provided in section 18.7.
CO
NS
OLI
DAT
ED
STA
TE
ME
NT
OF
CH
AN
GE
S IN
EQ
UIT
Yfr
om
Jan
1, 2
014
to D
ec 3
1, 2
014
Cal
led
-up
ca
pita
lR
even
ue r
eser
veR
eva-
luat
ion
surp
lus
Ret
aine
d
earn
ing
s
Net
inco
-m
e/ p
rofit
fo
r th
e ye
arTo
tal
Sha
re
cap
ital
Sha
re
pre
miu
mLe
gal
re
serv
es
Oth
er
reve
nue
rese
rves
Ret
aine
d
earn
ing
s
Net
inco
-m
e/p
rofit
fo
r th
e ye
ar
A.1
.B
alan
ce a
t th
e en
d o
f p
revi
ous
per
iod
100,
953,
201
62,2
60,3
171,
782,
503
18,7
91,5
0030
,658
950,
898
3,70
9,50
718
8,47
8,58
4
b)E
x-po
st a
djus
tmen
ts0
00
00
10
1
A.2
.B
alan
ce a
t th
e b
egin
ning
of
the
rep
ort
ing
per
iod
100,
953,
201
62,2
60,3
171,
782,
503
18,7
91,5
0030
,658
950,
899
3,70
9,50
718
8,47
8,58
5
B.1
.C
hang
es in
eq
uity
- t
rans
actio
ns w
ith s
hare
hold
ers
00
00
0-2
,419
,242
0-2
,419
,242
a)P
aym
ent o
f div
iden
ds0
00
00
-2,4
19,2
420
-2,4
19,2
42
B.2
.To
tal c
om
pre
hens
ive
inco
me
in t
he r
epo
rtin
g p
erio
d0
00
046
,269
010
,733
,939
10,7
80,2
08
a)E
ntry
of n
et in
com
e/ p
rofit
for
the
repo
rtin
g pe
riod
00
00
00
10,7
33,9
3910
,733
,939
b)C
hang
es in
the
reva
luat
ion
surp
lus
from
reva
luat
ions
of fi
nanc
ial
inve
stm
ents
00
00
13,6
160
013
,616
c)A
djus
tmen
t of t
he re
valu
atio
n su
rplu
s -
actu
aria
l gai
ns0
00
032
,653
00
32,6
53
B.3
.C
hang
es in
eq
uity
00
442,
081
4,43
1,36
20
3,47
7,91
0-8
,351
,353
0
a)A
lloca
tion
of th
e re
mai
nder
of n
et p
rofit
of 2
013
to o
ther
equ
ity
com
pone
nts
00
00
03,
709,
507
-3,7
09,5
070
b)A
lloca
tion
of a
par
t of n
et p
rofit
of 2
014
to o
ther
equ
ity
com
pone
nts
purs
uant
to th
e de
cisi
on b
y th
e m
anag
emen
t and
su
perv
isor
y bo
dies
00
442,
081
4,19
9,76
50
0-4
,641
,846
0
c)A
lloca
tion
of a
par
t of n
et p
rofit
into
bui
ldin
g up
add
ition
al
rese
rves
pur
suan
t to
the
deci
sion
by
the
Sha
reho
lder
s A
ssem
bly
00
023
1,59
70
-231
,597
00
C.
Bal
ance
at
the
end
of
the
rep
ort
ing
per
iod
100,
953,
201
62,2
60,3
172,
224,
584
23,2
22,8
6276
,927
2,00
9,56
76,
092,
093
196,
839,
551
17.5 CONSOLIDATED STATEMENT OF CHANGES IN EQUITY
177
ANNUAL REPORT
Elektro Celje2 0 1 5

ANNUAL REPORT
Elektro Celje2 0 1 5
178
18. DISCLOSURES AND EXPLANATORY NOTES TO THE CONSOLIDATED FINANCIAL STATEMENTS
18. DISCLOSURES AND EXPLANATORY NOTES TO THE CONSOLIDATED FINANCIAL STATEMENTSElektro Celje Group is composed by the controlling com-pany Elektro Celje, d.d., and two subsidiaries:• ECE, energetska družba, d.o.o., with the head of-
fice in Celje. The company equity amounts to EUR 17,384,409. In 2015, ECE generated EUR 2,729,274 of net income.
• MHE – ELPRO, družba za proizvodnjo in trženje električne energije, d.o.o. The equity of the company amounts to EUR 2,220,487. In 2015, MHE - ELPRO generated EUR 105,464 EUR of net income.
18.1 Bases for the Preparation of Consolidated Financial StatementsThe consolidated financial statements present a faith-ful and fair account of the financial assets, liabilities and equity of the Group, its financial performance and cash flows. The fiscal year is the calendar year from January 1 to December 31, 2015.
Declaration of ConformityThe consolidated financial statements are developed in conformity with the Slovenian Accounting Standards (SAS), including the relevant interpretations and expla-nations, and with the provisions of the Companies Act. The Annual Report includes all disclosures required by the Companies Act, and disclosures pursuant to the SAS for companies subject to mandatory audit. The Group does
not disclose information for which it may reasonably esti-mate that such disclosure could cause significant dam-age.
On April 21, 2016, the Management Board confirmed and adopted the consolidated financial statements of the Annual Report for the year 2015, including the explana-tory notes provided and the accounting policies applied thereto.
Functional and presentational currencyThe consolidated financial statements are compiled in Eu-ros (EUR) and reported rounded up to the nearest whole unit (no cents).
18.2 Accounting PoliciesElektro Celje Group abides by the same accounting poli-cies for all periods reported in the consolidated financial statements.
In the compilation of the consolidated financial state-ments, the same accounting policies were followed as in the compilation of the annual financial statements of the controlling company Elektro Celje. In 2015, the Group did not introduce any changes to the accounting policies in use.
Basis of Consolidation
A subsidiary is a company controlled by a parent com-pany. The control is exercised when the parent company has the possibility to decide on the financial and business focuses of the controlled company in order to obtain ben-efit from its operation. The assessment of the influence of the controlling company is based on the existence and effect of any voting rights that are presently exercisable or convertible. The financial statements of the subsidiar-
ies are included in the consolidated financial statements from the date when the controlling influence begins to be exercised, to the date when the parent company ceases to have a controlling financial interest in the subsidiary.
The consolidated financial statements are compiled based on the separate financial statements of the individual consolidated companies, prepared by using uniform ac-counting policies and taking into account consolidation adjustments. The financial statements of the companies in the Elektro Celje Group are combined into group finan-cial statements on the basis of complete consolidation, by grouping related assets, liabilities, equity, revenue and expenses. The Group is presented as if it were one single company, thus its financial statements exclude invest-ments of the controlling company into the equities of its subsidiaries, and the corresponding shares of the control-ling company in the equities of its subsidiaries, as well as the financial positions, revenues, expenses, and the unre-alised net gains and net losses arising from related party transactions.

179
ANNUAL REPORT
Elektro Celje2 0 1 5
18. DISCLOSURES AND EXPLANATORY NOTES TO THE CONSOLIDATED FINANCIAL STATEMENTS
The consolidated revenue and expenses of the Group in-clude the revenue, expenses and costs of the companies Elektro Celje, d.d., and MHE – Elpro d.o.o., for the period from January 1, 2015 to December 31, 2015, as well as the revenue, expenses and costs of the companies Elek-tro Celje Energija for the period from January 1, 2015 to September 30, 2015, and ECE for the period from Oc-tober 1, 2015 to December 31, 2015. The consolidation excludes transactions between the controlling company and its subsidiaries.
Intangible assets and long-term accrued revenue and deferred expenses
Intangible non-current assets of the Group include prop-erty rights, assets in the course of development, good-will, and other long-term accrued revenue and deferred expenses.
The property rights of the Group include invest-ments into software, material property rights, and material rights to the use of vacation apartments. They are report-ed at cost and decreased by amortisation.
Subsequent costsSubsequent costs incurred in relation to intangible assets are only capitalised when they increase the future eco-nomic benefits arising from the asset to which the ex-penses refer.
Amortisation/depreciation and useful lifeThe straight-line amortisation method is used. Amortisa-tion and depreciation rates based on useful life are 33.33 % for computer software (estimated useful life 3 years), 3.33 % for the right to use a facility (estimated useful life 30 years) and 1 % for material rights on property (estimated useful life 100 years). The amortisation/depreciation of an asset begins on the first day of the month after the asset has been made ready for use.
Intangible assets are not revalued, as they represent less than 1 % of total assets. The Group does not hold any intangible assets pledged as security for liability.
Tangible fixed assets – PP&E
Property, plant and equipment of Elektro Celje Group in-clude land, buildings, equipment and such assets in the course of acquisition or construction. In the measurement after recognition, the Group applies the cost model and reports such values at cost, minus depreciation revalua-tion adjustments and accrued impairment losses.
The cost includes purchase price, import and non-refund-able duties, and costs directly attributable to the activities necessary to prepare the asset for its intended use. If the period from the date of the first invoice for the construction and installation service or equipment to the date when the fixed asset is prepared for its intended use is longer than one year, the cost of the asset also includes costs of loans related to the acquisition of the new asset for the period from the payment deadline of each invoice to the date of preparation of the asset.
Land is valued at cost, which also includes paid land and building transaction tax and land registry fee. The cost of a building includes costs incurred in the acquisition, con-struction or completion of the building, costs of the pro-ject and other documentation on the basis of which the acquisition, construction or completion was carried out, costs of land development, costs of required permits for connections, and other costs directly attributable to the preparation of the building for its intended use. The cost does not include the cost of the land on which the building is built, nor the cost of the acquisition of land intended for access to the building or for other purposes related to the use of the building. The cost of equipment includes costs incurred in the acquisition, construction or completion of the equipment, costs of delivery, costs of installation, and any other costs incurred in the acquisition, construction or completion of the equipment.
The cost of a tangible fixed asset built or made within the Group consists of the cost of material, direct labour cost, and other costs resulting from its construction or manu-facture, as well as indirect costs of construction or manu-facture which can be attributed to the asset. The cost of such fixed assets cannot exceed that of the same or simi-lar assets in the market.
If the cost of the asset is high, it is reallocated over its rela-tive parts. If these parts have significantly different useful lives in relation to the total cost of the tangible fixed asset, each part is recorded as a separate asset.

ANNUAL REPORT
Elektro Celje2 0 1 5
180
18. DISCLOSURES AND EXPLANATORY NOTES TO THE CONSOLIDATED FINANCIAL STATEMENTS
DepreciationDepreciation is calculated using the method of straight-line depreciation method and taking into account the use-ful life of each individual asset or their constituent parts.
Land and assets in the course of acquisition/construction are not depreciated. The depreciation rates applied in 2015 are as follows:
Investment property
Investment property is property that has been acquired with the intention of earning a return on the investment through rent.
In measuring its investment property, the Group uses the historical cost model. The adjustment to the value of in-vestment property is made in the amount equal to the de-preciation calculated using the straight-line depreciation method. The expected useful life of investment property is 50 years.
Long-term financial investments
Long-term financial investments are those that the Group intends to hold for a period longer than one year, and are not held for trading. The Group balance sheet reports long-term financial investments in other shares and share-holdings. Distribution of profit from long-term financial in-vestments is recognised as finance income at the moment when a company acquires the right to receive dividends.
Non-current financial investments quoted in an active market and whose fair values can be measured with reli-ability are valued at fair value, whereas other financial in-vestments are valued at cost. Exposure to various risks, particularly the risk of reduction in the value of financial investment below its cost value is not hedged by financial instruments. The value that best represents the maximum exposure to such risk is the total value of such investment. Financial investments into shares and shareholdings of other companies are classified as held for sale.
Deferred tax assets
Deferred tax assets include corporate income tax that will be refunded in the future. They are calculated at the tax rate of 17 %, which is expected to apply in the fiscal year in which the deferred tax asset will be refunded.
Inventory
The Group inventory includes material and small tools which have the characteristics of inventory (protective equipment and tools), as well as merchandise. The ana-lytical records report materials inventory by individual ma-terials and warehouses.
In the statements of financial position, inventory is valued at the lower of cost and net realisable value. An inventory unit of material and small tools is valued at cost (purchase price minus any discount), including all direct costs of pur-chase. The consumption of material inventories is valued by the moving average price method. Material inventories can be revalued based on impairment when their carrying value exceeds the net realisable value.
Quantitative stock of merchandise is recorded at retail prices including VAT; the consumption of the inventory is valued at the most recent average cost.
Receivables
The Group reports long-term and short-term trade re-ceivables, which do not include any trade receivables between the controlling company and its subsidiaries, for these are internal accounting relationships. The receiva-bles are recorded in the balance sheet according to the amortised cost method, which means they are decreased by the amount of revaluation adjustment based on doubt-ful or bad debt. Before compiling the annual statement of accounts, the companies in the corporate group verify the recorded amounts of the individual claims.
Long-term trade receivables due from customers who are subject to compulsory settlement are remunerated in ac-cordance with decisions related to compulsory settlement. The decisions define the volume and dynamics of repay-ment, as well as the interest rate at which receivables are remunerated (if at all). Long-term trade receivables from the company SODO bear interest in accordance to Article 84 and Section 5.3 of the Act Determining the Methodol-ogy for Charging for the Network Charge, the Methodol-ogy for Setting the Network Charge, and the Criteria for Establishing Eligible Costs for Electricity Networks (Official Gazette of the RS, no. 81 dated October 29, 2012).
Depreciation rates applied in 2015: Minimum (in %) Maximum (in %) Useful life
Buildings 2.00 2.50 40 to 50 years
Infrastructural facilities 2.00 5.00 20 to 50 years
Electrical equipment of transformer substations 2.86 6.67 15 to 35 years
Other equipment 4.00 50.00 2 to 25 years
Motor vehicles 8.33 20.00 5 to 12 years
Equipment in the SHP 5.00 6.67 15 to 20 years

181
ANNUAL REPORT
Elektro Celje2 0 1 5
18. DISCLOSURES AND EXPLANATORY NOTES TO THE CONSOLIDATED FINANCIAL STATEMENTS
Cash and cash equivalents
Among cash and cash equivalents, the Group reports money in current accounts with commercial banks, cash items in the process of collection, and cash equivalents (overnight deposits).
Equity
Equity is the liability to the owners of the companies within the corporate group, to be liquidated when the companies go out of business. It is defined by the amounts invested in the companies by the owners, and by the amounts gen-erated during operation that belong to the owners. Eq-uity decreases due to operating losses and through the payment of dividends. Total equity includes share capital, share premium, revenue reserves, retained earnings, and fair value reserve.
Provisions and long-term accrued expenses and de-ferred revenue
Provisions for payments of retirement benefits and long-service awardsLong-term provisions of the Group are recognised for long-service awards, retirement benefits, and death allow-ances. They are recognised with the intention of collecting amounts, in the form of accrued costs or expenses, which will allow the coverage of costs or expenses incurred in the future. Pursuant to statutory provisions and the indus-try collective agreement, the companies within the Group are obliged to pay long-service awards to their employees, benefits upon retirement, and allowance in the case of death, for which long-term provisions are recognised. Li-abilities from provisions for long-service awards were cal-culated using the Projected Unit Credit method based on the multiple decrement model. The income statement of the Group recognises labour costs and interest charges, while adjustments of post-employment benefits or unre-alised actuarial gains or losses are included in the other comprehensive income statement.
Provisions for lawsuitsThe Group recognises provisions for lawsuits in which it is represented as the defendant. The justification of the recognised provisions is verified on a yearly basis in view of the status of a legal dispute and probability of favour-able or unfavourable outcome. The amount of provision is determined based on the known amount of the damage claim, or on the projected possible amount of the damage claim if the claim is still unknown.
Long-term accrued expenses and deferred revenue Long-term accrued expenses and deferred revenue rec-ognise revenue which will, within a period longer than one year, cover the projected expenses. They are recognised by the controlling company in relation to fixed assets ac-quired free of charge, and are intended for covering de-preciation costs. They are drawn at the depreciation rate of the acquired assets starting in the subsequent month. The controlling company also recognises long-term ac-crued expenses and deferred revenue for average con-nection fees charged in the period up to June 30, 2007.
These are intended for covering the depreciation of assets and are used through carry-overs to operating revenue at the prevailing rate for fixed assets of power infrastructure - i.e., at a 3 % rate.
Provisions and long-term accrued expenses and deferred revenue are not revalued. At the end of the accounting period they are adjusted to reconcile their value with the current value of the expenses that are estimated to be necessary to cover the liabilities.
Liabilities
The Group’s liabilities are classified by type in financial li-abilities and trade payables, and by payment deadline in long-term and short-term liabilities. Short-term liabilities are liabilities due for payment in a period shorter than one year. Liabilities are measured at amortised cost.
Short-term liabilities denominated in foreign currency are converted into national currency on the balance sheet day at the current reference conversion rate of the European Central Bank.
Income tax
The income tax for the fiscal year includes current and deferred taxes. Income tax is reported in the income statement, except in the part associated with items di-rectly reported in the comprehensive income. Current tax is payable from the taxable income for the year, calcu-lated at the rates effective on the reporting date, and from any adjustments to tax liabilities related to previous fiscal years. The deferred tax is reported according to the bal-ance sheet liability method, which takes into account tem-porary differences between the carrying value of assets and liabilities for financial reporting purposes and values for taxation purposes. The deferred tax reports exclude the following temporary differences: initial recognition of assets or liabilities in transactions which do not represent business mergers and which have no effect on either ac-counting gains or taxable income; differences related to investments into subsidiaries and jointly-controlled un-dertakings in the amount unlikely to be adjusted in the foreseeable future. The deferred income tax is also not re-ported in the case of taxable temporary differences upon initial recognition of goodwill.
The amount of the deferred tax is based on the expected manner of recovery or settlement of the carrying value of assets and liabilities using the tax rates applicable on the reporting date. The deferred tax assets and deferred tax liabilities are offset if there exists a legal right to set off current tax assets against current tax liabilities related to income tax, and if the deferred taxes all relate to the same taxable entity and the same taxation authority.
The deferred tax asset is recognised in the amount of probable available future taxable income against which the deferred tax asset can be charged in the future. De-ferred tax assets are reduced by the amount for which it is no longer likely that it can be claimed against tax in relation to the asset.
ANNUAL REPORT
Elektro Celje2 0 1 5
182
18. DISCLOSURES AND EXPLANATORY NOTES TO THE CONSOLIDATED FINANCIAL STATEMENTS
Revenue
Revenue is broken down into operating revenue, finance income, and other income. Revenue is recognised if the increase of economic benefit in the accounting period is related to the increase in the value of assets or decrease in liabilities and if this increase can be measured with reli-ability.
Net sales revenue includes revenue from sale of elec-tricity, revenue from lease and maintenance of infrastruc-ture and service rendered for SODO, revenue from sales of other energy-generating products (wood pellets, natural gas), and other net sales revenue (revenue from services rendered, leases/rentals).
Net sales revenue is recognised upon sales of products or services if it can be reasonably expected that the sales will lead to receipts when such receipts are not realised upon occurrence. Recognition of revenue from services rendered is based on the work completion rate on the re-porting date.
Other operating revenue mainly includes revenue from reversals of provisions, received damage compensa-tions from insurance companies, and operating revenue from revaluation, generated through sale of fixed assets and decommissioned material.
Finance income includes income from dividends re-ceived; proceeds from disposal of available-for-sale fi-nancial assets; income from revaluation of financial assets measured at fair value through profit and loss; received interest on deposits, loans granted and cash in current ac-counts; exchange gains; and late charges. Revenue from interest is recognised on the date of its occurrence using the effective interest rate, income from dividends on the date when the shareholder’s right to receive payment is exercised.
Costs and expenses
Operating expenses include costs of goods, material and services, labour costs, write-downs, and other oper-ating expenses. Labour costs include salaries and other labour costs in gross amounts, as well as contributions paid from these taxable bases, which are not comprised in the said gross amounts. The companies within the corporate group paid the salaries in compliance with the provisions of general and industry collective agreements and individual employment contracts. Other operating ex-penses include costs of travel to work, meal allowance for employees, costs of holiday pays, reimbursement of material costs, and provisions for long-service awards and retirement benefits. Operating expenses from revaluation occur in relation to the impairment of tangible, intangible and current assets.
Financial expenses include borrowing expenses, im-pairment and write-downs of financial investments, ex-change losses, and other expenses, and are recognised when charged, regardless of any related payments. Bor-rowing expenses are recognised by the companies in the Group in their income statements by the effective interest method, except those which are capitalised and allocated to tangible fixed assets in the course of construction or development. Financial expenses are broken down into expenses related to the generation of operating revenue and expenses related to the generation of finance income.
Statement of other comprehensive income
The statement of comprehensive income is a finan-cial statement which faithfully and fairly presents all the components of the income statement and, in addition, includes those items of income and expenses which are not recognised in the profit or loss, but affect the amount of equity.
The Group uses version I of the income statement ac-cording to SAS 25.5. This additional statement reports the total comprehensive income including items laid down in points 18 to 24 of section 25.8 of the SAS, and items laid down in points 25 to 29 of section 25.10 of the SAS.
Statement of cash flows
The Group's statement of cash flows faithfully and fairly presents the changes in inflows and outflows and explains the changes in cash and cash equivalents during the fiscal year. The statement of cash flows is compiled using the di-rect method, in line-by-line form (version I), and reports the inflows and outflows in operating, investing and financing activities.
Statement of changes in equity
The statement of changes in equity is a faithful and fair account of the changes in the composition of equity dur-ing the calendar year according to version I (SAS 27.2), in the form of a composite table reporting changes in all eq-uity components. Total equity of the Group includes share capital as entered in the Register of Companies, reserves, retained earnings, and net profit for the fiscal year.

183
ANNUAL REPORT
Elektro Celje2 0 1 5
18. DISCLOSURES AND EXPLANATORY NOTES TO THE CONSOLIDATED FINANCIAL STATEMENTS
18.3 Disclosure of Items in the Consolidated Balance SheetConsolidated balance sheet is a fundamental financial statement presenting a fair account of assets and liabili-ties of Elektro Celje Group as of the end of the 2015 fiscal year. It is compiled in sequential order, as defined in the SAS under 24.4 and in the Companies Act.
The consolidated balance sheet of Elektro Celje Group includes assets and liabilities of the controlling company Elektro Celje and its subsidiaries ECE and MHE – EL-PRO. The following items were excluded in the consoli-dation process: short-term trade receivables from com-
panies within the corporate group in the amount of EUR 725,407, short-term accrued revenue and deferred ex-penses in the amount of EUR 657,143, short-term trade payables to companies within the Group in the amount of EUR 745,132, accrued expenses and deferred revenue in the amount of EUR 637,418, investments of the control-ling company into its subsidiaries in the amount of EUR 7,246,976, equity of the subsidiaries in the amount of EUR 8,409,048, and reversal of goodwill in the amount of EUR 1,162,071.
in EUR/YEAR
Electricity distribution
Purchase and sale of electricity
Electricity generation
Intra-group transactions
Elektro Celje Group
2015 2014 2015 2014 2015 2014 2015 2014 2015 2014
Assets as of Dec 31
272,260,993 264,813,515 47,350,864 26,871,840 2,424,284 2,333,750 -9,791,597 -8,305,693 312,244,544 285,713,412
Equity as of Dec 31
196,443,080 192,935,102 17,384,409 9,036,403 2,220,487 2,115,022 -8,409,048 -7,246,976 207,638,928 196,839,551

ANNUAL REPORT
Elektro Celje2 0 1 5
184
18. DISCLOSURES AND EXPLANATORY NOTES TO THE CONSOLIDATED FINANCIAL STATEMENTS
18.3.1 Intangible Assets and Long-term Accrued Revenue and Deferred Expenses
Group’s property rights include investments into software in the amount of EUR 1,560,181, real property rights in the amount of EUR 41,195, and material rights to use vaca-tion apartments in the amount of EUR 28,519.
Depreciation and amortisation amounted to a total of EUR 984,949, amortisation of investments into material rights to use vacation apartments amounted to EUR 3,355.
No intangible asset is pledged as security for liabilities.
Intangible non-current assets (in EUR) Dec 31, 2015 Dec 31, 2014
Property rights 1,629,895 1,627,731
Intangible assets in development 157,259 41,907
Other long-term accrued revenue and deferred expenses 150 622
Total 1,787,304 1,670,260
in EUR
Intangible fixed assets Property rights Intangible assets in development
Other long-term accrued revenue
and deferred expenses
Total
Cost
As of Jan 1, 2014 7,522,697 743,026 0 8,265,723
Increase 0 624,369 622 624,991
Carry-over from ongoing investments 1,076,361 -1,076,361 0 0
Write-downs of ongoing investments 0 -249,127 0 -249,127
Decrease -135,928 0 0 -135,928
As of Dec 31, 2014 8,463,130 41,907 622 8,505,659
As of Jan 1, 2015 8,463,130 41,907 622 8,505,659
Increase 441,783 664,037 201 1,106,021
Carry-over from ongoing investments 548,685 -548,685 0 0
Decrease -772,467 0 -874 -773,341
As of Dec 31, 2015 8,681,132 157,259 150 8,838,541
Revaluation adjustment
As of Jan 1, 2014 6,118,439 0 0 6,118,439
Amortisation 795,468 0 0 795,468
Rentals from holiday facilities 3,355 0 0 3,355
Decrease -81,863 0 0 -81,863
As of Dec 31, 2014 6,835,399 0 0 6,835,399
As of Jan 1, 2015 6,835,399 0 0 6,835,399
Amortisation 984,949 0 0 984,949
Rentals from holiday facilities 3,355 0 0 3,355
Decrease -772,466 0 0 -772,466
As of Dec 31, 2015 7,051,237 0 0 7,051,237
Carrying value
As of Jan 1, 2014 1,404,258 743,026 0 2,147,284
As of Dec 31, 2014 1,627,731 41,907 622 1,670,260
As of Jan 1, 2015 1,627,731 41,907 622 1,670,260
As of Dec 31, 2015 1,629,895 157,259 150 1,787,304
Changes in intangible assets

185
ANNUAL REPORT
Elektro Celje2 0 1 5
18. DISCLOSURES AND EXPLANATORY NOTES TO THE CONSOLIDATED FINANCIAL STATEMENTS
18.3.2 Property, Plant and Equipment
The controlling company Elektro Celje owns 99 % of the tangible fixed assets of the Group. The largest invest-ments into immovable property, machines and equipment were the installation and replacement of electricity meters (EUR 1,475,424), construction of the underground cable connecting DTS Trnovlje and DTS Lava (EUR 755,651) and renovation of the overhead power lines OPL 20kV DV Podplat - RTP Šentjur (EUR 383,919), and OPL 20kV Ravne Žerjav (EUR 233,959).
Major investments of the subsidiary ECE include replace-ment of the outdated computer equipment (EUR 38,040), acquisition of company vehicles (EUR 30,715), and invest-ments into office furniture and equipment (EUR 11,211). The subsidiary MHE–ELPRO completed in 2015 the ac-tivation of equipment in the co-generation facilities Selce, Slovenj Gradec and Krško (EUR 30,232), and activated 7 charging stations.
The controlling company, as the owner of the electricity distribution infrastructure signed the Agreement on the Lease of Electricity Distribution Infrastructure and Provi-sion of Services for the Distribution Network System Op-erator SODO d.o.o., which is the exclusive holder of the
concession for performing compulsory public service of distribution system operator in the Republic of Slovenia. Pursuant to the provisions of said agreement, the parties sign an amendment to the agreement each year for the current year, which defines the amount of lease payments and the volume of services to be rendered by the com-pany Elektro Celje, d.d., for SODO d.o.o., as well as the amount of funds for the coverage of electricity losses in the distribution network of Elektro Celje, d.d. The carrying value of the leased electricity infrastructure as of Decem-ber 31, 2015, was EUR 236,038,074; of which intangible fixed assets in the value of EUR 1,131,915, and tangible fixed assets in the value of EUR 234,906,159. Based on the preliminary reconciliation of the regulatory year 2015, the earnings from the lease to SODO in the 2015 fiscal year reached EUR 26,238,701.
The decrease in the value of tangible fixed assets is mainly a result of write-downs of the current values of the control-ling company’s tangible assets pertaining to the electricity infrastructure. The calculated depreciation of the Group amounts to EUR 17,343,849. The accumulated deprecia-tion rates of buildings and equipment are 69.7 % and 60.5 %, respectively.
Property, plant and equipment (in EUR) Dec 31, 2015 Dec 31, 2014
Land 5,862,153 5,928,244
Buildings 168,972,879 166,746,043
Equipment 63,682,969 64,093,687
Property, plant and equipment in the course of acquisition 7,971,478 5,486,002
Total 246,489,479 242,253,976

ANNUAL REPORT
Elektro Celje2 0 1 5
186
18. DISCLOSURES AND EXPLANATORY NOTES TO THE CONSOLIDATED FINANCIAL STATEMENTS
The Group does not have any property, plant or equip-ment acquired by capital lease, or any tangible fixed as-
sets pledged as security for debt.
in EURChanges in property, plant and equipment
Tangible fixed assets Land Buildings EquipmentOngoing
investments
Advance payments for
PP&ETotal
Cost
As of Jan 1, 2014 5,905,853 538,462,502 152,252,892 7,996,841 0 704,618,088
Increase 0 0 0 23,627,958 6,782 23,634,740
Carry-over from ongoing investments
22,391 17,066,422 9,049,984 -26,138,797 0 0
Decrease 0 -5,574,309 -2,707,916 0 -6,782 -8,289,007
As of Dec 31, 2014 5,928,244 549,954,615 158,594,960 5,486,002 0 719,963,821
As of Jan 1, 2015 5,928,244 549,954,615 158,594,960 5,486,002 0 719,963,821
Increase 1,038 0 313,625 21,794,584 2,548 22,111,795
Carry-over from ongoing investments
22,025 13,414,149 5,872,934 -19,309,108 0 0
Decrease -89,154 -5,461,869 -3,751,100 0 -2,548 -9,304,671
As of Dec 31, 2015 5,862,153 557,906,895 161,030,419 7,971,478 0 732,770,945
Revaluation adjustment
As of Jan 1, 2014 0 376,153,130 91,076,692 0 0 467,229,822
Depreciation 0 11,410,189 6,024,904 0 0 17,435,092
Decrease 0 -4,354,747 -2,600,323 0 0 -6,955,067
As of Dec 31, 2014 0 383,208,572 94,501,273 0 0 477,709,845
As of Jan 1, 2015 0 383,208,572 94,501,273 0 0 477,709,845
Depreciation 0 10,976,259 6,387,590 0 0 17,363,849
Decrease 0 -5,250,815 -3,541,413 0 0 -8,792,228
As of Dec 31, 2015 0 388,934,016 97,347,450 0 0 486,281,466
Carrying value
As of Jan 1, 2014 5,905,853 162,309,372 61,176,200 7,996,841 0 237,388,266
As of Dec 31, 2014 5,928,244 166,746,043 64,093,687 5,486,002 0 242,253,976
As of Jan 1, 2015 5,928,244 166,746,043 64,093,687 5,486,002 0 242,253,976
As of Dec 31, 2015 5,862,153 168,972,879 63,682,969 7,971,478 0 246,489,479

187
ANNUAL REPORT
Elektro Celje2 0 1 5
18. DISCLOSURES AND EXPLANATORY NOTES TO THE CONSOLIDATED FINANCIAL STATEMENTS
18.3.3 Investment PropertyInvestment properties include the office building owned by the subsidiary ECE and leased out under an operating
lease. The earnings from the rent in 2015 amounted to EUR 6,410, and the expenses related to it EUR 7,080.
18.3.4 Long-term Financial Investments
Long-term financial investments of Elektro Celje Group in the amount of EUR 684,777 pertain to the investment of the controlling company into 2,960 shares of Zavarov-alnica Triglav, d.d., amounting to EUR 69,560; invest-ment into 2,479 shares of the company Informatika, d.d., amounting to EUR 206,987; shareholding in the company
Stelkom d.o.o., amounting to EUR 56,594; as well as to the investment of the subsidiary ECE into 2,664 shares of Zavarovalnica Triglav, d.d., amounting to EUR 62,870, and investment into 2,350 shares of Gorenjska banka d.d. Kranj amounting to EUR 288,766.
in EURChanges in investment property
Investment property Amount
Cost
As of Jan 1, 2014 917,182
As of Dec 31, 2014 917,182
As of Jan 1, 2015 917,182
Increase 40,889
As of Dec 31, 2015 958,071
Revaluation adjustment
As of Jan 1, 2014 600,065
Depreciation 18,344
As of Dec 31, 2014 618,409
As of Jan 1, 2015 618,409
Depreciation 18,344
As of Dec 31, 2015 636,753
Carrying value
As of Jan 1, 2014 317,117
As of Dec 31, 2014 298,773
As of Jan 1, 2015 298,773
As of Dec 31, 2015 321,318
Long-term financial investments (in EUR): Dec 31, 2015 Number of shares Dec 31, 2014 Number of shares
Gorenjska Banka, d. d. 288,766 2,350 0 0
Zavarovalnica Triglav, d. d. 132,430 5,624 69,855 2,960
Informatika, d. d. 206,987 2,479 310,495 2,479
Stelkom, d. o. o 56,594 0 56,594 0
Total 684,777 10,453 436,944 5,439

ANNUAL REPORT
Elektro Celje2 0 1 5
188
18. DISCLOSURES AND EXPLANATORY NOTES TO THE CONSOLIDATED FINANCIAL STATEMENTS
As of December 31, 2015 the controlling company ad-justed the value of its long-term financial investments available for sale to market or fair value. The management of the company estimated there were objective reasons for an impairment assessment of the financial investment into the equity instrument of the company Informatika d.d. and an impairment of the investment was performed through net profit/income debited to financial expenses in
the amount of EUR -103.508. The revaluation adjustment to the shares of Zavarovalnica Triglav, d.d., reduced the revaluation surplus from the revaluation of Zavarovalnica Triglav, d.d., shares.
Long-term financial investments into companies within the corporate group in the amount of EUR 7,246,976 are ex-cluded on the grounds of consolidation.
18.3.5 Deferred Taxes
The recognition of deferred tax assets for 2015 amounted to EUR 193,133, reversal of deferred tax assets to EUR 364,233, and total amount of deferred tax asset as of De-cember 31, 2015 amounted to EUR 1,458,096 (recog-nition of adjustments to short-term and long-term trade receivables, costs of provisions for retirement benefits, long-service awards and death allowance, and impair-
ment of financial investments through comprehensive in-come statement).
As of December 31, 2015, the company does not report any other material deductible temporary differences and tax credit which could lead to recognition of additional de-ferred tax asset.
18.3.6 Assets Held for SaleAssets held for sale as of December 31, 2015, are invest-ments of the subsidiary ECE into the company Stelkom
amounting to EUR 51,628. As of December 31, 2014, the Group did not hold any assets held for sale.
in EURChanges in long-term financial investments in 2015
Other shares and shareholdings Amount
Carrying value as of Jan 1, 2014 423,329
Impairment through the Income Statement 0
Changes in other comprehensive income 13,615
Carrying value as of Dec 31, 2014 436,944
Carrying value as of Jan 1, 2015 436,944
Increase due to merger by acquisition 351,637
Impairment through the Income Statement -103,508
Changes in other comprehensive income -296
Carrying value as of Dec 31, 2015 684,777
in EURChanges in deferred tax assets
Changes in deferred tax assets (in EUR)
Jan 1, 2015
Deferred tax assets from the
merger by acquisition
TransferIncrease in the Income Statement
Reversal in the Income Statement
Recogni-tion in the Compre-hensive Income
Statement
Dec 31, 2015
Trade receivables 617,862 0 153,005 154,898 0 0 925,765
Long-term provisions 485,421 0 20,347 9,715 32,492 10,923 493,914
Financial investments 0 0 0 17,597 0 0 17,597
Deferred tax assets arising from temporary differences
0 173,352 -173,352 0 0 0 0
Deferred tax assets for tax loss
0 352,561 0 0 331,741 0 20,820
Total 1,103,283 525,913 0 182,210 364,233 10,923 1,458,096
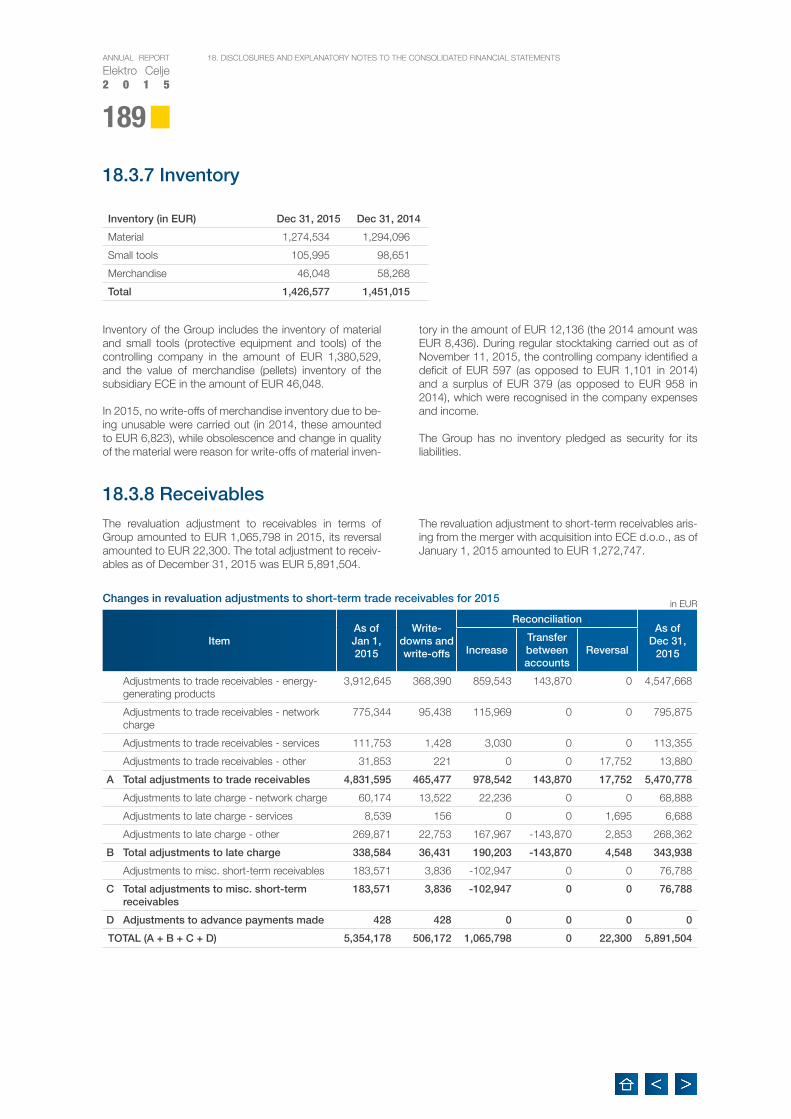
189
ANNUAL REPORT
Elektro Celje2 0 1 5
18. DISCLOSURES AND EXPLANATORY NOTES TO THE CONSOLIDATED FINANCIAL STATEMENTS
18.3.7 Inventory
Inventory of the Group includes the inventory of material and small tools (protective equipment and tools) of the controlling company in the amount of EUR 1,380,529, and the value of merchandise (pellets) inventory of the subsidiary ECE in the amount of EUR 46,048.
In 2015, no write-offs of merchandise inventory due to be-ing unusable were carried out (in 2014, these amounted to EUR 6,823), while obsolescence and change in quality of the material were reason for write-offs of material inven-
tory in the amount of EUR 12,136 (the 2014 amount was EUR 8,436). During regular stocktaking carried out as of November 11, 2015, the controlling company identified a deficit of EUR 597 (as opposed to EUR 1,101 in 2014) and a surplus of EUR 379 (as opposed to EUR 958 in 2014), which were recognised in the company expenses and income.
The Group has no inventory pledged as security for its liabilities.
18.3.8 ReceivablesThe revaluation adjustment to receivables in terms of Group amounted to EUR 1,065,798 in 2015, its reversal amounted to EUR 22,300. The total adjustment to receiv-ables as of December 31, 2015 was EUR 5,891,504.
The revaluation adjustment to short-term receivables aris-ing from the merger with acquisition into ECE d.o.o., as of January 1, 2015 amounted to EUR 1,272,747.
in EURChanges in revaluation adjustments to short-term trade receivables for 2015
Inventory (in EUR) Dec 31, 2015 Dec 31, 2014
Material 1,274,534 1,294,096
Small tools 105,995 98,651
Merchandise 46,048 58,268
Total 1,426,577 1,451,015
ItemAs of Jan 1, 2015
Write-downs and write-offs
ReconciliationAs of
Dec 31, 2015Increase
Transfer between accounts
Reversal
Adjustments to trade receivables - energy-generating products
3,912,645 368,390 859,543 143,870 0 4,547,668
Adjustments to trade receivables - network charge
775,344 95,438 115,969 0 0 795,875
Adjustments to trade receivables - services 111,753 1,428 3,030 0 0 113,355
Adjustments to trade receivables - other 31,853 221 0 0 17,752 13,880
A Total adjustments to trade receivables 4,831,595 465,477 978,542 143,870 17,752 5,470,778
Adjustments to late charge - network charge 60,174 13,522 22,236 0 0 68,888
Adjustments to late charge - services 8,539 156 0 0 1,695 6,688
Adjustments to late charge - other 269,871 22,753 167,967 -143,870 2,853 268,362
B Total adjustments to late charge 338,584 36,431 190,203 -143,870 4,548 343,938
Adjustments to misc. short-term receivables 183,571 3,836 -102,947 0 0 76,788
C Total adjustments to misc. short-term receivables
183,571 3,836 -102,947 0 0 76,788
D Adjustments to advance payments made 428 428 0 0 0 0
TOTAL (A + B + C + D) 5,354,178 506,172 1,065,798 0 22,300 5,891,504

ANNUAL REPORT
Elektro Celje2 0 1 5
190
18. DISCLOSURES AND EXPLANATORY NOTES TO THE CONSOLIDATED FINANCIAL STATEMENTS
18.3.8.1 Long-term Trade Receivables
Under long-term trade receivables Elektro Celje Group recognises receivables with a maturity longer than one year. Long-term trade receivables in the gross amount of EUR 6,928.016 include long-term trade receivables to customers amounting to EUR 6,919,719, of which long-term trade receivables of the controlling company to the company SODO in the amount of EUR 5,910,036, and
long-term trade receivables to others in the amount of EUR 8,297. The adjustment to receivables amounted to EUR 37.188.
The Group does not have any long-term receivables in-sured or pledged as security for its liabilities.
ItemAs of
Jan 1, 2014
Write-downs and write-offs
Reconciliation As of Dec 31, 2014Increase Reversal
Adjustments to trade receivables - network charge 702,801 47,170 119,713 0 775,344
Adjustments to trade receivables - services 116,581 2,900 0 1,928 111,753
Adjustments to trade receivables - tariff 423,803 41,307 80,171 0 462,667
Adjustments to trade receivables - justified 1,792,260 143,259 588,416 0 2,237,417
Adjustments to trade receivables - other 53,939 669 -1,721 0 51,549
A Total adjustments to trade receivables 3,089,384 235,305 786,579 1,928 3,638,730
Adjustments to late charge - network charge 60,394 4,003 3,782 0 60,173
Adjustments to late charge - services 9,936 579 2,557 0 11,914
Adjustments to late charge - tariff 7,241 408 -6,833 0 0
Adjustments to late charge - justified 159,897 18,009 41,542 0 183,430
Adjustments to late charge - other 1,782 21 1,424 0 3,185
B Total adjustments to late charge 239,250 23,020 42,472 0 258,702
Adjustments to misc. short-term receivables 58,905 3,726 128,392 0 183,571
Adjustments to advance payments made 0 0 428 0 428
C Total adjustments to misc. short-term receivables 58,905 3,726 128,820 0 183,999
TOTAL (A + B + C) 3,387,539 262,051 957,871 1,928 4,081,431
in EURChanges in revaluation adjustments to short-term trade receivables for 2014
Long-term trade receivables (in EUR) Dec 31, 2015 Dec 31, 2014
Long-term trade receivables from customers 7,525,192 304,391
Minus revaluation adjustment -37,188 -23,470
Short-term portion of long-term trade receivables from customers -568,285 -143,604
6,919,719 137,317
Long-term trade receivables from others 8,297 4,033,471
Minus revaluation adjustment 0 0
Short-term portion of long-term trade receivables from others 0 0
8,297 4,033,471
Total 6,928,016 4,170,788
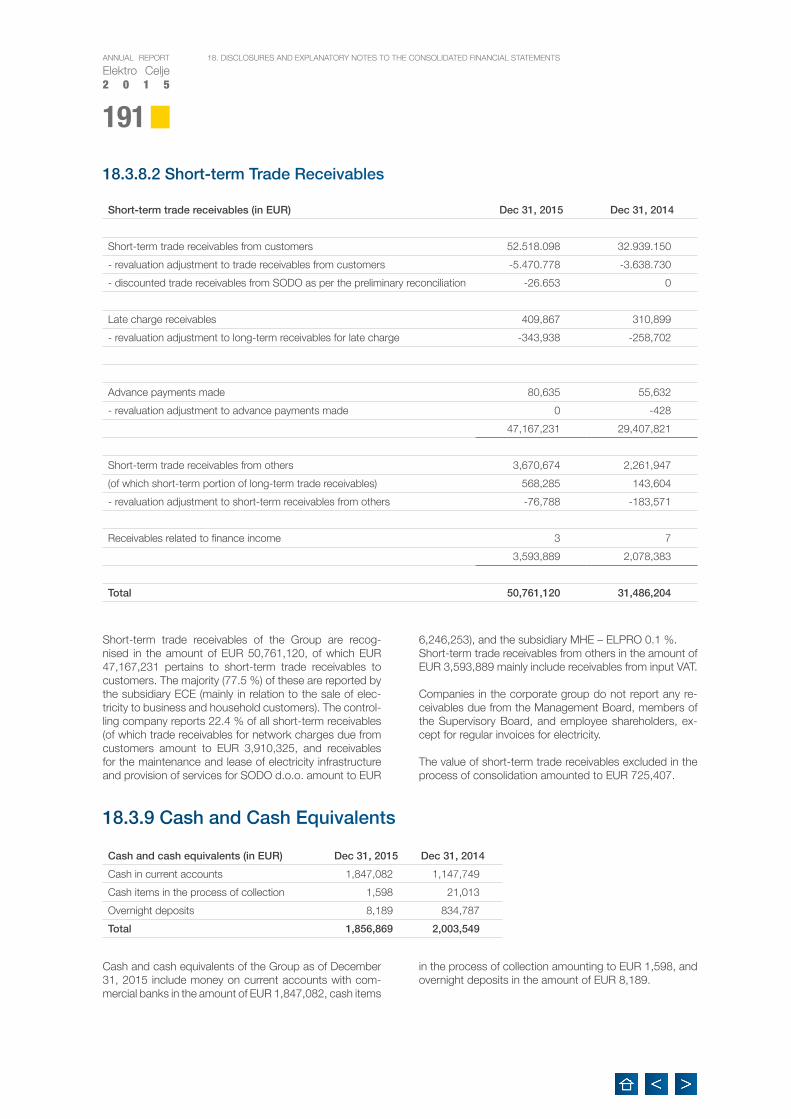
191
ANNUAL REPORT
Elektro Celje2 0 1 5
18. DISCLOSURES AND EXPLANATORY NOTES TO THE CONSOLIDATED FINANCIAL STATEMENTS
18.3.8.2 Short-term Trade Receivables
Short-term trade receivables of the Group are recog-nised in the amount of EUR 50,761,120, of which EUR 47,167,231 pertains to short-term trade receivables to customers. The majority (77.5 %) of these are reported by the subsidiary ECE (mainly in relation to the sale of elec-tricity to business and household customers). The control-ling company reports 22.4 % of all short-term receivables (of which trade receivables for network charges due from customers amount to EUR 3,910,325, and receivables for the maintenance and lease of electricity infrastructure and provision of services for SODO d.o.o. amount to EUR
6,246,253), and the subsidiary MHE – ELPRO 0.1 %.Short-term trade receivables from others in the amount of EUR 3,593,889 mainly include receivables from input VAT.
Companies in the corporate group do not report any re-ceivables due from the Management Board, members of the Supervisory Board, and employee shareholders, ex-cept for regular invoices for electricity.
The value of short-term trade receivables excluded in the process of consolidation amounted to EUR 725,407.
18.3.9 Cash and Cash Equivalents
Cash and cash equivalents of the Group as of December 31, 2015 include money on current accounts with com-mercial banks in the amount of EUR 1,847,082, cash items
in the process of collection amounting to EUR 1,598, and overnight deposits in the amount of EUR 8,189.
Short-term trade receivables (in EUR) Dec 31, 2015 Dec 31, 2014
Short-term trade receivables from customers 52.518.098 32.939.150
- revaluation adjustment to trade receivables from customers -5.470.778 -3.638.730
- discounted trade receivables from SODO as per the preliminary reconciliation -26.653 0
Late charge receivables 409,867 310,899
- revaluation adjustment to long-term receivables for late charge -343,938 -258,702
Advance payments made 80,635 55,632
- revaluation adjustment to advance payments made 0 -428
47,167,231 29,407,821
Short-term trade receivables from others 3,670,674 2,261,947
(of which short-term portion of long-term trade receivables) 568,285 143,604
- revaluation adjustment to short-term receivables from others -76,788 -183,571
Receivables related to finance income 3 7
3,593,889 2,078,383
Total 50,761,120 31,486,204
Cash and cash equivalents (in EUR) Dec 31, 2015 Dec 31, 2014
Cash in current accounts 1,847,082 1,147,749
Cash items in the process of collection 1,598 21,013
Overnight deposits 8,189 834,787
Total 1,856,869 2,003,549

ANNUAL REPORT
Elektro Celje2 0 1 5
192
18. DISCLOSURES AND EXPLANATORY NOTES TO THE CONSOLIDATED FINANCIAL STATEMENTS
18.3.10 Short-term Accrued Revenue and Deferred Expenses
Short-term accrued revenue and deferred expenses in-clude early payments of costs (EUR 6,190), short-term deferred costs which are expected to occur within one year, the occurrence of which is likely and the amount of which is reliably estimated (EUR 34,315), accrued revenue (EUR 273,655), and VAT from received advance payments and overpayments of electricity (EUR 165,200). The great-er part of short-term accrued revenue and deferred ex-
penses pertain to the subsidiary ECE; VAT from overpay-ments of electricity (EUR 160,306) and reconciliation of deviations to the company HSE (EUR 173,740).
The value of short-term accrued revenue and deferred ex-penses excluded in the process of consolidation amount-ed to EUR 657,143.
18.3.11 Equity
The equity share of the non-controlling interest in the amount of EUR 4,463,343 pertains to the company Elek-tro Gorenjska, which entered the ECE company as a part-ner in the process of merger with acquisition of its subsidi-ary Elektro Gorenjska Prodaja as the company acquired by the company Elektro Celje Energija. The business share of the partner in the share capital of ECE amounts to 25.6744 %. The profit for the year pertaining to the non-controlling interest amounts to EUR 636,024.
The equity of the holder of the controlling interest, com-pany Elektro Celje, in the amount of EUR 203,175,585 is composed of called-up capital, share premium, revenue reserves, revaluation surplus, retained earnings from pre-
vious years and the net income for the year. The busi-ness share of the company Elektro Celje in the share capital of ECE amounts to 74.3256 %. The profit for the year pertaining to the controlling interest amounts to EUR 9,597,207.
The share capital of the Group is equity capital divided into 24,192,425 freely transferable ordinary no-par shares. Revenue reserves report share premium in the amount of EUR 62,260,317. The changes in the individual equity components in 2015 and the nature and purpose of all types of reserves are presented in the statement of chang-es in equity under section 17.5. with explanatory notes provided under section 18.7.
Short-term accrued revenue and deferred expenses (in EUR) Dec 31, 2015 Dec 31, 2014
Prepaid expenses 6,190 11,349
Short-term deferred expenses (costs) 34,315 30,559
Short-term accrued revenue 273,655 735,300
VAT from advance payments received 4,098 61,412
VAT from overpayment of electricity 161,102 0
Total 479,360 838,620
Equity (in EUR) Dec 31, 2015 Dec 31, 2014
Equity share of non-controlling interest 4,463,343 0
Equity share of controlling interest 203,175,585 0
Share capital 100,953,201 100,953,201
Revenue reserves 62,260,317 62,260,317
Legal reserves 2,565,008 2,224,584
Other revenue reserves 27,511,642 23,222,862
Revaluation surplus -40,448 76,927
Retained earnings from previous years 3,903,111 2,009,567
Undistributed net income/profit for the year 6,022,754 6,092,093
Total 207,638,928 196,839,551

193
ANNUAL REPORT
Elektro Celje2 0 1 5
18. DISCLOSURES AND EXPLANATORY NOTES TO THE CONSOLIDATED FINANCIAL STATEMENTS
The net profit for the year reported in the balance sheet in the amount of EUR 6,022,754, is composed of the distrib-utable income of the controlling company in the amount of EUR 3,234,029, distributable incomes of the subsidiaries MHE – ELPRO d.o.o. in the amount of EUR 105.464 and ECE d.o.o. in the amount of EUR 1,841,244, and of the consolidation difference in the amount of EUR 842,017.
The companies of the corporate group are not partners in any other company in which they would bear unlimited personal liability for the liabilities of the Group. In 2015, the companies in the corporate group did not own any treas-ury shares, did not implement conditional increases of share capital, and did not issue bonds or other securities.
The value of equity of subsidiaries excluded in the process of consolidation amounted to EUR 8,409,048.
18.3.12 Provisions and Long-term Accrued Expenses and Deferred Revenue
In 2015, the Group recognised EUR 380,390 in long-term accrued expenses and deferred revenue from fixed assets acquired free of charge. Reversals of long-term accrued expenses and deferred revenue for fixed assets acquired free of charge and average connection fees amounted to EUR 597,531, reversals intended for the use of assigned contribution as per the Decree on Employment of Per-sons with Disabilities amounted to EUR 8,298, reversals for drawing state aids for the acquisition of fixed assets amounted to EUR 102,502. The recognition and rever-sal of long-term accrued expenses and deferred revenue from EU grants in the amount of EUR 94,205 pertains to the implementation of the pilot project Flex4Grid.
In 2015, the controlling company recognised provisions for lawsuits in the amount of EUR 19,850 (action for dam-age due to the disconnection of a neutral line), the ex-isting provisions as of January 1, 2015 in the amount of EUR 40,000 were used in their entirety or reversed. In compliance with the demand for the payment of balance of the 2015 holiday pay up to the amount defined under Article 128 of the Collective Agreement for Slovenian Elec-tricity Industry, provisions for lawsuits amounting to EUR 595,776 were recognised.
The basis for establishing provisions for liabilities to the employees related to post-employment and other long-term employment benefits was the actuarial estimation based on the following assumptions: statistical probability of mortality and disability, retirement in accordance with the law, and employee turnover (4 % in the under 40 age group, 1 % in the 41-50 age group, 0 % in the over 51 age group), a 2 % discount rate, a 2.5 % wage growth in the Republic of Slovenia and electricity industry, a 2.25 % wage growth in the company, a 16.1 % current employer’s contribution rate, and 1 % growth of amounts stated in the Decree on the Levels of Reimbursed Work-related Ex-penses and of Certain Income not to be Included in the Tax Base (Official Gazette of the RS 140/2006, 76/2008). The expected current value of liabilities also includes ac-tuarial gains/losses due to changed financial and demo-graphic assumptions and experience adjustments.
Payments of benefits amounted to EUR 427,248, ad-ditional recognition amounted to EUR 699,062, and the actuarial surplus of the Group amounted to EUR 229,124. .
Provisions and long-term accrued expenses and deferred revenue (in EUR) Dec 31, 2015 Dec 31, 2014
Long-term provisions for retirement benefits and long-service awards 5,971,465 5,470,528
Provisions for lawsuits 615,626 40,000
Long-term accrued expenses and deferred revenue: 13,619,216 13,947,157
- from received state grants 1,063,344 1,174,144
- from fixed assets acquired free of charge 9,989,558 10,098,707
- from connection fees 2,566,314 2,674,306
Total 20,206,307 19,457,685

ANNUAL REPORT
Elektro Celje2 0 1 5
194
18. DISCLOSURES AND EXPLANATORY NOTES TO THE CONSOLIDATED FINANCIAL STATEMENTS
18.3.13 Long-term Financial Liabilities Long-term financial liabilities of the Group include liabili-ties of the controlling company to commercial banks for loans granted and intended for investments, amounting to EUR 33,542,731, and two long-term bank loans of the subsidiary MHE-ELPRO, d.o.o. in the total amount of
EUR 66,329, with a 2.6 year maturity and the six month EURIBOR interest rate with an annual 2.9 % margin (for investments into SPTE SRCE and solar power plants in Mestinje). Average margin to EURIBOR in long-term loans of the controlling company amounts to 1.7 %.
The company pays all instalments of principal and interest at maturity. All loans in the Group are insured with bills of exchange. The value of principals maturing in 5 years after the balance sheet day amounts to EUR 3,295,049. The commitments made by the Group in hiring long-term loans entail monitoring of the performance indicators de-fined at the level of Group financial statements: financial
debt to EBITDA ratio (lower than 2.7 in 2015 and lower than 2.5 in the years to follow), financial debt to equity ra-tio (lower than 0.3), EBITDA to financial expenses from fi-nancial liabilities ratio (higher than 12), current ratio (higher than 0.9). As of the balance sheet date the Group met all its contractual financial commitments.
in EURLiabilities related to long-term employment benefits
ItemLong-service
awardsRetirement
benefitsDeath allowance Total
As of Jan 1, 2014 1,820,895 3,388,346 171,827 5,381,068
Current service costs 121,763 157,608 10,558 289,929
Interest expense 63,731 118,592 6,013 188,336
Payments of benefits -234,870 -141,336 -4,607 -380,813
Actuarial surplus 33,230 -32,653 -8,570 -7,993
As of Dec 31, 2014 1,804,749 3,490,557 175,221 5,470,527
As of Jan 1, 2015 1,804,749 3,490,557 175,221 5,470,527
Liabilities related to benefits of the employees of the company acquired
91,252 150,104 0 241,356
Current service costs 134,665 184,979 19,159 338,803
Interest expense 36,837 78,473 3,593 118,903
Payments of benefits -258,774 -152,956 -15,518 -427,248
Actuarial surplus 66,798 145,908 16,418 229,124
As of Dec 31, 2015 1,875,527 3,897,065 198,873 5,971,465
Long-term financial liabilities (in EUR) Dec 31, 2015 Dec 31, 2014
Long-term financial liabilities to banks 33,609,060 36,770,278

195
ANNUAL REPORT
Elektro Celje2 0 1 5
18. DISCLOSURES AND EXPLANATORY NOTES TO THE CONSOLIDATED FINANCIAL STATEMENTS
18.3.14 Short-term Financial Liabilities and Trade Payables
Short-term financial liabilities of the Group pertain to short-term portions of long-term debt to banks maturing in 2015 and amounting to EUR 13,872,561 (value of the loans of the controlling company is EUR 11,837,695; value of the loans of the subsidiary ECE is EUR 2,000,000; value of the loans of the subsidiary MHE - ELPRO is EUR 34,866), and to the amounts of unpaid dividends in the amount of EUR 7,063.
Short-term trade payables mainly record payables related to the purchase of electricity, trade payables from opera-tions for third-party account (liabilities to SODO d.o.o. for the use of network as per the agreement), trade payables to suppliers for the acquisition of fixed assets, material
and services, trade payables from operations for third-party account, liabilities to the employees and payables to the state.
The Group does not have any payables to the Manage-ment Board, the Supervisory Board, and to employee shareholders, except for those related to salaries and meeting fees of the Supervisory Board members for the month of December 2015. None of the liabilities of the companies within the corporate group are secured by real collateral. The value of short-term trade payables ex-cluded in the process of consolidation amounts to EUR 745,132.
Short-term financial liabilities and trade payables (in EUR) Dec 31, 2015 Dec 31, 2014
Short-term financial liabilities
Short-term financial liabilities to banks 13,872,561 6,241,623
Other short-term financial liabilities 7,063 5,879
Total 13,879,624 6,247,502
Short-term trade payables
Short-term trade payables for purchasing electricity 14,470,117 8,742,886
Short-term trade payables to suppliers 4,504,145 3,579,026
Short-term trade payables from operations for third-party account 11,455,151 7,896,043
Short-term trade payables to employees 1,725,717 1,536,620
Short-term trade payables to state and other institutions 1,105,221 1,627,062
Short-term trade payables based on advance payments 970,217 429,827
Other short-term trade payables 632,163 460,691
Total 34,862,731 24,272,155
Total 48,742,355 30,519,657

ANNUAL REPORT
Elektro Celje2 0 1 5
196
18. DISCLOSURES AND EXPLANATORY NOTES TO THE CONSOLIDATED FINANCIAL STATEMENTS
18.3.15 Short-term Accrued Expenses and Deferred RevenueShort-term accrued costs in the amount of EUR 1,737,098 mainly include accrued labour costs for unused annual leave of the employees for 2015 (EUR 621,192), accrued costs of salaries related to the unpaid part of performance bonus as per collective industry agreement
(EUR 263,066), and uninvoiced purchased electricity from the subsidiary ECE (EUR 684,284). Short-term deferred revenue in the amount of EUR 282,007 mostly includes compensation of the subsidiary ECE.
The value of short-term accrued expenses and deferred revenue excluded in the process of consolidation amount-
ed to EUR 637,418 (credit of ECE against the controlling group for the purchase of electricity for covering losses).
18.3.16 Contingent Liabilities
Contingent liabilities in the amount of EUR 31,112,260 do not qualify for recognition among balance sheet items, thus they are included in the off-balance-sheet records. Among ongoing litigation procedures there are two ac-tions for damages claimed against the controlling compa-ny, one in the amount of EUR 19,850 and claiming dam-age supposedly caused by asymmetry in the electrical installation, and the other in the amount of EUR 893,113, related to the claim for damages by minority shareholders (i.e.,. Cypriot financial funds AMPELUS HOLDING LIM-ITED, and G.I. Dakota Investments Limited), which filed a lawsuit challenging decision no. 3.1 adopted at the 20th regular Shareholders Assembly of the company Elektro Celje, d.d., whereby the shareholders decided to use part
of the distributable profit in the amount of 3,145,015.25 for the payment of dividends, and allocate the remaining part in the amount of EUR 1,054,750.75 to other reve-nue reserves. The plaintiffs demand that additional EUR 893,113 be allocated for the payment of dividends. Even in case of an unfavourable decision for the Group, such liability will have no effect on the current profit and will only impact the Group’s equity.
The bank guarantees granted mostly include guarantees of the subsidiary ECE in the amount of EUR 29,891.000; the largest was given to the company SODO, in the amount of EUR 10,647.476.
Contingent liabilities (in EUR) Dec 31, 2015 Dec 31, 2014
Ongoing litigation procedures 1.215.349 566.568
Bank guarantees given 29.896.911 17.318.109
Total 31,112,260 17,884,677
Short-term accrued expenses and deferred revenue (in EUR) Dec 31, 2015 Dec 31, 2014
Short-term accrued costs and expenses 1,737,099 1,876,034
Short-term deferred revenue 282,007 244,148
VAT from advance payments made 4,926 6,059
Total 2,024,032 2,126,241

197
ANNUAL REPORT
Elektro Celje2 0 1 5
18. DISCLOSURES AND EXPLANATORY NOTES TO THE CONSOLIDATED FINANCIAL STATEMENTS
18.3.17 Contingent Assets and Other Off-balance-sheet Records
The value of bank performance guarantees and guaran-tees of defect rectification in the warranty period is EUR 2,802,156; damage claims against insurance companies which have not been settled in full yet and therefore can-not be objectively valued prior to the settlement by the insurance companies, amount to EUR 81,559; the value
of receivables due from partners in companies cancelled from the register amounts to EUR 297,201; tax reliefs for employment of persons with disabilities are reported at EUR 84,777; and the value of fixed assets financed with the funds from average connection fees and transferred to SODO d.o.o. amounts to EUR 3,703,612.
18.4 Events Following the Balance Sheet DateThere were no events following the balance sheet date and up to the date of the auditor’s report, which would materially affect the assets and liabilities of the Group and
impair the ability of the balance sheet users to perform a relevant evaluation and reach an informed decision.
18.5 Disclosures of Items in the Consolidated Income StatementThe consolidated income statement is prepared accord-ing to version I of SAS 25.5. The income and expenses of the Group include income, expenses and costs of the companies Elektro Celje, d.d., and MHE-Elpro d.o.o for the period from January 1, 2015 to December 31, 2015, and income, expenses and costs of the companies Elek-tro Celje Energija for the period between January 1, 2015
and September 30, 2015, and ECE for the period between October 1, 2015 and December 31, 2015. The process of consolidation excludes mutual transactions between the controlling company and its subsidiaries. The total amount of income and expenses excluded in the process of con-solidation is EUR 5,520,221.
Contingent assets and other off-balance-sheet records (in EUR) Dec 31, 2015 Dec 31, 2014
Contingent assets:
Bank guarantees received 2,802,156 2,618,671
Damage claims 81,559 202,301
Receivables from partners in companies cancelled from the register 297,201 230,463
Allowance for employing persons with disabilities 84,777 78,860
3,265,693 3,130,295
Other off-balance-sheet records:
Infrastructure owned by SODO d. o. o. 3,703,612 3,846,276
in EUR/YEARElectricity
distributionPurchase and sale
of electricityElectricity generation
Intra-group transactions
Elektro Celje Group
2015 2014 2015 2014 2015 2014 2015 2014 2015 2014
Net income/profit 6,808,482 8,841,612 2,477,268 2,220,656 105,464 146,952 842,017 -475,281 10,233,231 10,733,939
Net sales revenue 53,791,561 53,919,563 113,651,626 92,047,446 481,811 434,477 -5,519,806 -6,012,468 162,405,192 140,389,018

ANNUAL REPORT
Elektro Celje2 0 1 5
198
18. DISCLOSURES AND EXPLANATORY NOTES TO THE CONSOLIDATED FINANCIAL STATEMENTS
18.5.1 Net Sales Revenue
18.5.2 Capitalised Own ServicesCapitalised own services are services in the amount of EUR 14,324,151 (in 2014, they amounted to EUR 15,117,824) which the controlling company performed for its own re-quirements, capitalising them among tangible fixed assets or intangible non-current assets. EUR 7,666,485 is the
value of the material used in the process, EUR 5,446,155 the value of the work performed, and EUR 1.211,511 the value of the motor vehicle transport. The company does not recognise or report any profit in this regard.
18.5.3 Other Operating Revenue
Other operating revenue in the amount of EUR 2,896,270 mainly includes the income of the subsidiary ECE from de-viations in the sale of electricity in 2014 in the amount of EUR 674,779, income from reversal of provisions of the
controlling company in the amount of EUR 606,481, and gain on a bargain purchase of the property of the com-pany Elektro Gorenjska Prodaja, in the amount of EUR 842,017.
18.5.4 Operating Costs and Expenses by Functional GroupsCosts and expenses can be direct, i.e., associable with the emerging business effects (production costs), or over-
head (management, administration).
Net sales revenue (in EUR) 2015 2014
Revenue from the sale of electricity 104,540,205 84,988,206
Revenue from lease and maintenance of infrastructure and provision of services for SODO d. o. o.
52,065,913 52,342,066
Revenue from the sale of wood pellets 1,421,476 346,457
Revenue from the sale of natural gas 2,698,506 1,283,214
Revenue from the sale of services 1,679,092 1,429,075
Total 162,405,192 140,389,018
Other operating revenue (in EUR) 2015 2014
Income from reversal of provisions 606,490 652,216
Other revenue associated with business effects 914,732 234,089
Compensation received 162,782 2,235,716
Operating revenue from revaluation 370,249 284,247
Other operating revenue 842,017 0
Total 2,896,270 3,406,268
Expenses by type (in EUR) 2015 2014
Production costs 155,156,642 135,622,388
Cost of sales 6,800,220 5,896,450
Overhead 5,440,788 5,020,040
Total 167,397,650 146,538,878

199
ANNUAL REPORT
Elektro Celje2 0 1 5
18. DISCLOSURES AND EXPLANATORY NOTES TO THE CONSOLIDATED FINANCIAL STATEMENTS
18.5.4.1 Cost of Goods, Material and Services
Cost of goods, material and services of the Group in the amount of EUR 124,291,002 includes cost of pur-chase of electricity amounting to EUR 100,701,762, cost of wood pellets and natural gas in the amount of EUR 3,928,583, and cost of material and services in a total of EUR 19,660,657.
Cost of material in the amount of EUR 9,620,625 mainly includes cost of material for investments carried out in-house (EUR 7,666,485), cost of material used in main-tenance (EUR 566,127), cost of fuel and energy (EUR 517,188), cost of material used in provision of services to customers (EUR 352,063), write-off of material for current requirements of occupational safety and small tools (EUR 189,418) and cost of material used for damage repair (EUR 171,697).
Cost of services in the amount of EUR 10,040,032 mainly include maintenance service cost (EUR 2,289,458), cost of intellectual and personal services (EUR 1,488,008), costs of business data processing (EUR 1,382,293), in-surance premiums (EUR 1,243,671), cost of postal and phone telephone services (EUR 961,453), advertising, en-tertainment and tradeshow expenses (EUR 822,480), and cost of services of damage repair (EUR 191,553).
Pursuant to Article 57 of Companies Act (ZGD - 1), the Group is subject to mandatory audit. The contractual amount for auditing services in 2015 amounted to EUR 14,230 (excl. VAT).
The cost of material, services and the cost value of mer-chandise excluded in the consolidation process amount to EUR 5,517,809.
18.5.4.2 Labour Costs
Labour costs include accrued labour costs of the employ-ees of the controlling company, more specifically, for un-used annual leave in 2015.
In 2015, Elektro Celje Group employed 700 persons on the average. The education composition of the employees is provided in section 12.3.2.
Costs of goods, material and services (in EUR) 2015 2014
Cost of electricity purchased 100,701,762 81,616,121
Cost of goods 3,928,583 1,832,904
Cost of material 9,620,625 11,325,028
Cost of services 10,040,032 9,207,753
Total 124,291,002 103,981,806
Labour costs (in EUR) 2015 2014
Cost of salaries 16,481,894 15,648,468
Cost of supplementary employee retirement insurance 749,645 714,451
Cost of employer contributions and other levies on salaries 2,639,158 2,510,559
Other labour costs 2,801,796 2,193,725
Provisions for long-service awards and retirement benefits 422,019 315,208
Total 23,094,512 21,382,411

ANNUAL REPORT
Elektro Celje2 0 1 5
200
18. DISCLOSURES AND EXPLANATORY NOTES TO THE CONSOLIDATED FINANCIAL STATEMENTS
18.5.4.3 Write-downs and Write-offs
Depreciation and amortisation of the Group is calcu-lated individually, using the straight-line depreciation method
and applying the same depreciation rates as in 2014.
Expenses from revaluation of fixed assets pertain mostly to the controlling company (99.6 %), while operating ex-
penses from revaluation of current assets mostly relate to the subsidiary ECE (90.3 %).
18.5.4.4 Other Operating Expenses
Other operating expenses in the amount of EUR 654,297 (in 2014, they amounted to EUR 377,510) include mainly
charges for the use of construction land and paid court fees.
18.5.5 Finance Income from ShareholdingsFinance income from shareholdings in other companies in the amount of EUR 7,400 pertains to dividend paid out by
Zavarovalnica Triglav, d.d., to the controlling company (in 2014, they amounted to EUR 5,032).
18.5.6 Finance Income from Interest on LoansFinance income from interest on loans in the amount of EUR 4,333 are mostly related to interest on fixed-term de-
posits with commercial banks (in 2014, they amounted to EUR 99,392).
18.5.7 Finance Income from Trade ReceivablesFinance income from trade receivables in the amount of EUR 334,781 include late charges on late payments from customers in relation to trade receivables for network
charge, electricity and services (in 2014, they amounted to EUR 190,559).
18.5.8 Financial Expenses from Impairment and Write-downs of Financial InvestmentsImpairment of long-term financial investments of the con-trolling company through income, debited to financial ex-penses, amounted to EUR 103,508 in 2015, and is related to the impairment of the financial investment into the eq-
uity instrument of the company Informatika d.d. In 2014, the Group recorded no impairments or write-downs to financial investments.
Write-downs and write-offs (in EUR) 2015 2014
Amortisation and depreciation 18,069,944 18,248,905
Operating expenses from revaluation of tangible and intangible fixed assets 256,951 1,542,069
Operating expenses from revaluation of current assets 1,030,944 1,006,177
Total 19,357,839 20,797,151
Amortisation and depreciation
Intangible non-current assets
Buildings EquipmentInvestment
propertyTotal
2015 928,363 10,976,258 6,146,979 18,344 18,069,944
2014 795,468 11,410,189 6,024,904 18,344 18,248,905
in EUR
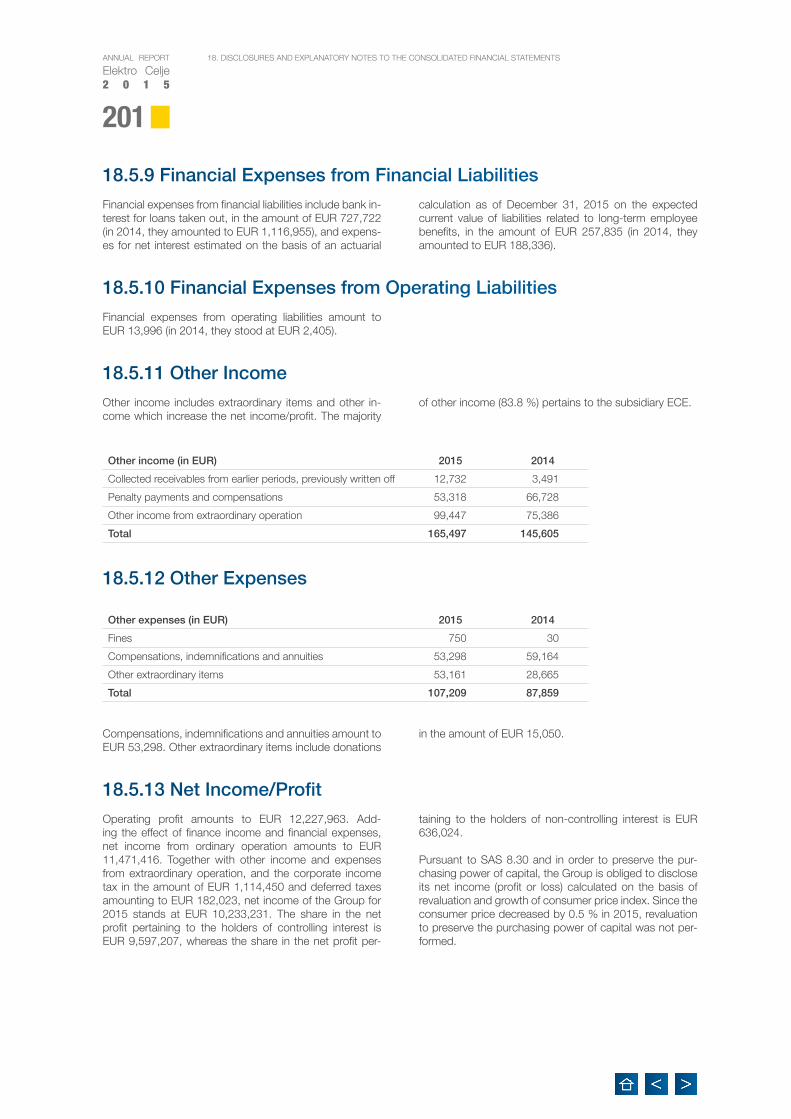
201
ANNUAL REPORT
Elektro Celje2 0 1 5
18. DISCLOSURES AND EXPLANATORY NOTES TO THE CONSOLIDATED FINANCIAL STATEMENTS
18.5.9 Financial Expenses from Financial LiabilitiesFinancial expenses from financial liabilities include bank in-terest for loans taken out, in the amount of EUR 727,722 (in 2014, they amounted to EUR 1,116,955), and expens-es for net interest estimated on the basis of an actuarial
calculation as of December 31, 2015 on the expected current value of liabilities related to long-term employee benefits, in the amount of EUR 257,835 (in 2014, they amounted to EUR 188,336).
18.5.10 Financial Expenses from Operating LiabilitiesFinancial expenses from operating liabilities amount to EUR 13,996 (in 2014, they stood at EUR 2,405).
18.5.11 Other IncomeOther income includes extraordinary items and other in-come which increase the net income/profit. The majority
of other income (83.8 %) pertains to the subsidiary ECE.
18.5.12 Other Expenses
Compensations, indemnifications and annuities amount to EUR 53,298. Other extraordinary items include donations
in the amount of EUR 15,050.
18.5.13 Net Income/ProfitOperating profit amounts to EUR 12,227,963. Add-ing the effect of finance income and financial expenses, net income from ordinary operation amounts to EUR 11,471,416. Together with other income and expenses from extraordinary operation, and the corporate income tax in the amount of EUR 1,114,450 and deferred taxes amounting to EUR 182,023, net income of the Group for 2015 stands at EUR 10,233,231. The share in the net profit pertaining to the holders of controlling interest is EUR 9,597,207, whereas the share in the net profit per-
taining to the holders of non-controlling interest is EUR 636,024.
Pursuant to SAS 8.30 and in order to preserve the pur-chasing power of capital, the Group is obliged to disclose its net income (profit or loss) calculated on the basis of revaluation and growth of consumer price index. Since the consumer price decreased by 0.5 % in 2015, revaluation to preserve the purchasing power of capital was not per-formed.
Other income (in EUR) 2015 2014
Collected receivables from earlier periods, previously written off 12,732 3,491
Penalty payments and compensations 53,318 66,728
Other income from extraordinary operation 99,447 75,386
Total 165,497 145,605
Other expenses (in EUR) 2015 2014
Fines 750 30
Compensations, indemnifications and annuities 53,298 59,164
Other extraordinary items 53,161 28,665
Total 107,209 87,859

ANNUAL REPORT
Elektro Celje2 0 1 5
202
18. DISCLOSURES AND EXPLANATORY NOTES TO THE CONSOLIDATED FINANCIAL STATEMENTS
18.5.14 Statement of Comprehensive IncomeThe total comprehensive income for the accounting pe-riod amounts to EUR 10,131,109 and is, due to revalua-tion of financial assets available for sale (EUR 22,430) and
due to changes in the surplus from revaluation of actuarial losses (EUR -124,552) lower by EUR 102,122 than the net income for the accounting period (EUR 10,233,231).
18.5.15 Income TaxIn the 2015 fiscal year, the Group proved liable for a cor-porate tax in the amount of EUR 1,114,450, recognised on the basis of tax return.
Following is a representation of reconciliation of the tax expense with the tax calculated from the accounting gains before taxation:
18.6 Disclosure of Items in the Statement of Cash FlowsThe process of consolidation excluded the mutual inflows in the Group in the amount of EUR 7,332,347, outflows amounting to EUR 7,334,520 incurred by the companies in the operation within the Group, inflows from investing activities in the amount of EUR 60,395, outflows from in-vesting activities in the amount of EUR 100,889, inflows from financing activities in the amount of EUR 60,000, and outflows from financing activities in the amount of EUR 60,395.
The net cash flow in the period January - December 2015 amounted to EUR -500,404. The initial balance of cash and cash equivalents as of January 1, 2015 was EUR 2,357,273, the closing balance as of December 31, 2015 was EUR 1,856,869, of which EUR 1,689,403 at the sub-sidiary ECE.
18.6.1 Inflows from Operating ActivitiesThe inflows from operating activities in 2015 amounted to EUR 356,512,724, which is 89.5 % of total inflows of the Group. The larger part of inflows from the sales of prod-ucts and services pertains to the subsidiary ECE (in the amount of EUR 262,573,634), mostly from the sales of electricity. Inflows from the sales of products and services
of the controlling company amount to EUR 100,743,131 and are associated mostly with receivables for the lease and services as per the agreement with SODO d.o.o., and with inflows from the use of network. Other inflows in the operation of the Group amounted to EUR 1,947,557 and included mainly inflows from received compensation.
in EUR
Comparison between effective and statutory tax rates2015 2014
Rate Amount Rate Amount
Profit before tax 10,939,693 11,894,546
Income tax defined by applying the statutory tax rate 17.00 % 1,859,748 17.00 % 2,022,073
Amounts with a negative effect on base of tax 2,522,296 2,212,928
- amount decreasing the level of tax-deductible expenses 2,522,281 2,212,928
- amount increasing the level of taxable income 15 0
Amounts with a positive effect on base of tax (+) (-) 1,218,332 1,953,249
- amount increasing the level of tax-deductible expenses 820,709 1,098,248
- amount decreasing the level of taxable income 397,623 855,001
Tax deductions 5,688,067 4,098,674
- applied, reducing tax liability 5,688,067 4,098,674
Current tax for the current year 10.19 % 1,114,450 11.51 % 1,369,444
Increase/decrease in deferred taxes 182,023 -684,118
Income tax in the Income Statement 11.85 % 1,296,473 5.76 % 685,326

203
ANNUAL REPORT
Elektro Celje2 0 1 5
18. DISCLOSURES AND EXPLANATORY NOTES TO THE CONSOLIDATED FINANCIAL STATEMENTS
18.6.2 Outflows from Operating ActivitiesOutflows from operating activities amounting to EUR 349,999,300 include expenses for the purchase of materi-al and services, salaries including contributions and taxes, and other expenses. The largest share of outflows from operating is held by expenses for the purchase of material and services, and expenses for salaries (94.1 %). Expens-es for the purchase of material and services mostly pertain to the subsidiary ECE (75.7 %), while expenses for salaries are mainly related to the controlling company (87.5 %).
The surplus of inflows from operating activities stands at EUR 6,513,424. In 2015, the Group’s operation within its main activity was in the black, and the Group was able to settle all its liabilities related to the repayment of principal and interest of long-term investment loans, and partly in-vestment expenses, as well.
18.6.3 Inflows from Investing ActivitiesInflows in investing activities amounted to EUR 758,336 and included inflows from received interest on deposits and shares of profit of other companies in the amount of EUR 19,364, inflows from disposal of tangible fixed as-
sets in the amount of EUR 258,972, and inflows from the repayments of short fixed-term deposits of the subsidiary ECE in the amount of EUR 480,000.
18.6.4 Outflows from Investing ActivitiesOutflows from investing activities in the amount of EUR 8,375,124 include expenses for the acquisition of intangi-
ble and tangible fixed assets.
18.6.5 Inflows from Financing ActivitiesInflows from financing activities in the amount of EUR 40,955,055 include drawing of long-term loans: of the long-term loan in the amount of EUR 5,000,000, taken out in 2015 with the EIB for financing investments; of the long-term loan amounting to EUR 3,600,000, hired with
the SID d.d. bank for the repair of ice damage; of the long-term revolving loan in the amount of EUR 175,000; and in-flows from multiple drawing of short-term loans for a total amount of EUR 32,180,055, the repayments of which are recorded in financial expenses.
18.6.6 Outflows from Financing ActivitiesOutflows from financing activities in the amount of EUR 40,352,095 include outflows for paid interest in the amount of EUR 748,163, repayments of long-term loans amounting to EUR 6,305,172, repayments of short-term
loans in the amount of EUR 30,180,000, outflows for the payment of dividends of the controlling company in the amount of EUR 3,118,760, which were paid out pursuant to the decision by the Shareholders Assembly.
18.7 Disclosures of Items in the Consolidated Statement of Changes in EquityShare premium in the amount of EUR 62,260,317 is re-ported on the basis of reversal of general revaluation ad-justment to equity.
Revenue reserves amounting to EUR 30,076,650 include legal reserves in the amount of EUR 2,565,008 (recog-nised in 2015 in the amount of EUR 340,424) and other revenue reserves amounting to EUR 27,511.642 (recog-nised in 2015 in the amount of EUR 4,288,780).
Revaluation surplus in the amount of EUR -40,448 in-cludes the revaluation adjustment to financial investments in the amount of EUR 36,502, actuarial losses recognised in the establishment of provisions for retirement benefits in the amount of EUR -76,950.
Consolidated equity as of December 31, 2015 stands at EUR 207,638,928; of which equity pertaining to the holders of the controlling interest amounts to EUR 203,175,585, and equity pertaining to the holders of non-controlling interest amounts to EUR 4,463,343.

ANNUAL REPORT
Elektro Celje2 0 1 5
204
18. DISCLOSURES AND EXPLANATORY NOTES TO THE CONSOLIDATED FINANCIAL STATEMENTS
18.8 Financial Risk ManagementExposure to individual risks and appropriate management are assessed and implemented based on the effects on cash flows and financing expenses. The Group regularly
assesses them and verifies the suitability of their manage-ment.
18.8.1 Credit RiskCredit risk in trade receivables (risk of loss due to non-fulfilment of debtor's liability) is related to the non-payment or late payment by electricity consumers and by recipients of the services rendered by the Group. Receivables man-agement and debt recovery are implemented in accord-ance with Article 76 of the Energy Act (EZ–1), Article 42 of the Decree on General Conditions for the Supply and Consumption of Electricity (SPDOEE), and the provisions of the financial regulation of the controlling company. Risk is managed mainly by constant monitoring and accounts receivables insurance, active recovery of overdue and un-paid receivables, and late charges for overdue payments.
According to the balance sheet as of December 31, 2015, short-term trade receivables recorded a 60.4 %, year-over-year increase mainly due to the merger by acquisi-tion of the company Elektro Gorenjska Prodaja into Elektro Celje Group, and the receipt of preliminary reconciliation of the regulatory framework (RF) for the year 2015 at the controlling company, which amounted to EUR 3,426,391. The latter is expected to be paid in the next RF (i.e., in the years 2019–2021, one third per year).
The policy of receivables insurance in 2015 remained the same. Receivables due from large customers of ECE d.o.o. are insured with a contract with the insurance company SID - Prva kreditna zavarovalnica d.d., Ljubljana, whereas trade receivables from household customers are not in-sured with hedging instruments, as this is not anticipated in the SPDOEE. The amount of granted insurance limits as of December 31, 2015 was EUR 2,715.652. Receivables for electricity due from some higher-risk business partners are secured with bills of exchange, bank guarantees or debt collection instruments. The insurance of short-term trade receivables from customers by means of debt collection instruments at the controlling company amounts to EUR 399,797, while other receivables are not insured (trade re-ceivables for network charges due from customers are not secured, as this is not anticipated in the SPDOEE).
Exposure to credit riskAs of December 31, 2015, the Group has EUR 4,689,659 of trade receivables for network charges, services, lease, aver-age connection fees, electricity and other energy-generating products, and late charges payable within a period longer than 365 days (bankruptcies, compulsory settlements, law-suits, and property manager debt as per the Housing Act, and a revaluation adjustment recognised for such) and EUR 41,853,331 of trade receivables not yet due.
The maturity profile of trade receivables reports short-term receivables of the companies within the Group to customers (without revaluation adjustments). Compliant with the SAS, the companies in the Group recognise the revaluation adjustment for trade receivables in bankruptcy proceedings, receivables which are subject of legal dis-pute, and receivables overdue by more than 90 days as of the balance sheet day. Revaluation adjustment of trade receivables is further explained in section 18.2 within the accounting policies (measurement upon initial recogni-
tion). In 2015, receivables for unjustified consumption amounted to EUR 257,839, of which a little less than 38 % was actually paid.
Credit risk arising from financial investments is a risk of higher fluctuations in the value of a financial instrument. Low creditworthiness affects the liquidity of financial in-struments and makes the sale of investment more difficult. At its extreme, credit risk may lead to a situation in which an investment becomes of no value. Financial assets
Maturity profile of current trade receivables due by customers (in EUR):
Maturity Dec 31, 2015 Share in % Dec 31, 2014 Share in %
Receivables not yet due 41,853,331 79.1 25,082,416 75.4
Overdue by less than 30 days 3,906,193 7.4 2,834,531 8.5
Overdue by 31-60 days 1,004,451 1.9 730,512 2.2
Overdue by 61-90 days 374,791 0.7 169,800 0.5
Overdue by 91-180 days 525,283 1.0 397,741 1.2
Overdue by 181-365 days 574,257 1.1 212,215 0.6
Overdue by over 365 days 4,689,659 8.9 3,822,834 11.5
Total 52,927,965 100.0 33,250,049 100.0

205
ANNUAL REPORT
Elektro Celje2 0 1 5
18. DISCLOSURES AND EXPLANATORY NOTES TO THE CONSOLIDATED FINANCIAL STATEMENTS
quoted in the active market and the fair value of which can be reliably measured are valued at fair value (i.e., 5.624 shares of Zavarovalnica Triglav, d.d., in the amount of EUR 132,430, and 2,350 shares of Gorenjska banka d.d. in the amount of EUR 288,766), while others are valued at cost. On the balance sheet date, the managements of the com-panies within the corporate group establish whether there
are any objective reasons for impairment assessment of a financial investment into an equity instrument. The value that best represents the maximum possible exposure to such risk is the total value of investment. Hedging instru-ments cannot be used for reducing the exposure to the risk of decrease in the value of long-term financial invest-ments below their cost.
18.8.2 Liquidity RiskElektro Celje Group measures the exposure to liquidity risk based on the balance of cash inflows and cash outflows, while an important element in liquidity risk management is also cash flow planning. The Group's cash flow risk is affected by the amount of collected network charges, for due to the deficit in network charges for 2014 and 2015 the payments pursuant to the preliminary reconciliations of SODO contractual liabilities amounting to EUR 7,287,150 will only be made in future regulatory periods, when the Energy Agency calculates them into tariff rates for network charges payable by the customers.
To ensure daily liquidity and for the event of increased li-quidity demand, in 2015, the Group had several bank cred-its for 4.5 mio EUR with a maturity of up to one year, and since December it is drawing a long-term revolving loan in the amount of EUR 3.145 million. In 2015, the controlling company also signed a contract with the EIB for EUR 28 million to finance its investments in the period 2015–2017. The risk of poor credit and timely acquisition of required borrowing consents from sectorial ministries is managed by maintaining an adequate share of equity in liabilities and high values of financial performance indicators.
18.8.3 Market RiskThe major market risk to which Elektro Celje Group is ex-posed is the risk of loss (benefit) due to changes in the in-terest rates of loans The Group is exposed to interest rate risk due to potentially unfavourable changes in the EU-RIBOR reference interest rate; the latter are not secured by financial instruments. The Group’s exposure to interest rate risk is estimated as low, for only 15.2 % of the Group’s assets is financed with bank loans.
Exposure to interest rate risk is assessed by sensitivity analysis. Based on the volume of loans as of December 31, 2015, a 0.1 % change in the interest rate (IR) would result in a cash outflow amounting to EUR 16,097, a 0.2 % change in the IR would result in a cash outflow amount-ing to EUR 41,251, and a 0.3 % change in the IR would result in EUR 81,671 higher expenses for interest paid (the likelihood of higher EURIBOR change is estimated as low). The analysis does not take into account the two short-
term loans of the subsidiary ECE in the amount of EUR 2,000,000, and maturity on January 13, 2016. The analy-sis rests on the assumption that all other variables remain the same.
As a precaution, the Group rejects all terms of contracts that would allow the lender to subsequently change in-terest rates (increased costs clauses) due to changed conditions in the money and capital markets, changes in regulations and instructions by any governmental, fiscal or monetary authorities, changes in the borrower's credit ranking, etc. The controlling company acts in accordance with the Decree on the Terms and Conditions and Meth-ods of Borrowing by Legal Entities from Article 87 of the Public Finance Act. Pursuant to the decree, consent by the Ministry of Finance is required for any and each bor-rowing procedure and signing agreements with banks.
Maturity of financial liabilities as of Dec 31, 2015 (in EUR)
Carrying value as of Dec 31, 2015
Term
Up to 1 year 1 to 5 years over 5 years
1. Investment financing loans 45,405,621 11,796,561 30,314,011 3,295,049
2. Other loans granted 2,076,000 2,076,000 0 0
Total financial liabilities 47,481,621 13,872,561 30,314,011 3,295,049
Maturity of financial liabilities to banks as of Dec 31, 2014 (in EUR)
Carrying value as of Dec 31, 2014
Term
Up to 1 year 1 to 5 years over 5 years
1. Investment financing loans 43,011,901 6,241,623 28,896,595 7,873,683
Total financial liabilities to banks 43,011,901 6,241,623 28,896,595 7,873,683

ANNUAL REPORT
Elektro Celje2 0 1 5
206
18. DISCLOSURES AND EXPLANATORY NOTES TO THE CONSOLIDATED FINANCIAL STATEMENTS
18.8.4 Equity RiskThe Group's net debt to equity ratio is relatively low, which is a good starting point for obtaining a good credit rating and thereby lower costs of borrowing.
18.8.5 Transactions with Associated Parties – Remuneration Data Remuneration granted to groups of persons for their work in the Group is as follows:
• Management Board of the controlling company, rep-resented by the Chairman of the Management Board Rade Knežević, received EUR 108,860 gross (EUR 92,413 as fixed part of salary; EUR 13.190 as variable part of salary – performance bonus; EUR 2,466 as re-imbursement of work-related expenses; and EUR 791 as holiday pay). The costs of training and education amounted to EUR 1,344. The Chairman of the Manage-ment Board is entitled to the use of a company vehicle.
• Members of the Supervisory Board, Audit Committee of the SB, and the independent expert, member of the Audit Committee of the Supervisory Board of the con-trolling company received in 2015 EUR 114,680 gross or EUR 83,316 net receipts.
• Receipts of employees with an employment contract to which the tariff part of the industry collective agreement does not apply, amounted to EUR 468,747 gross or EUR 240,813 net in 2015.
• Managing director of the susbsidiary ECE Mitja Terče received EUR 89,199 gross (EUR 77,761 as fixed part of salary; EUR 8,771 as variable part of salary – perfor-mance bonus; EUR 1,876 as reimbursement of work-related expenses; and EUR 791 of holiday pay). The managing director of the company is entitled to use a company vehicle.
• Managing director of the subsidiary MHE – ELPRO d.o.o., Gregor Milanez received in the period between January 2015 and April 30, 2015 a salary of EUR 2,899 gross, and in the period from May 1, 2015 to December 31, 2015 on the basis of a management contract EUR 6,400 (EUR 800 gross per month).
The Group did not grant any loans, advance payments, or securities for liabilities of the Management Board, mem-bers of the managerial body or members of the Supervi-sory Board.
Financial leverage indicator (in EUR) Dec 31, 2015 Dec 31, 2014
1. Loans received and other financial liabilities 47,488,684 43,017,780
2. Minus cash and cash equivalents -1,856,869 -2,003,549
3. Net financial liabilities 45,631,815 41,014,231
4. Equity 207,638,928 196,839,551
5. Net debt to equity ratio 22.0% 20.8%

207
ANNUAL REPORT
Elektro Celje2 0 1 5
19. STATEMENT OF THE MANAGEMENT BOARD
19. STATEMENT OF THE MANAGEMENT BOARDThe Management Board of the company Elektro Celje hereby confirms the financial statements disclosed and presented in this Annual Report, and all other components thereof.
The Management Board of Elektro Celje is responsible for compiling the financial statements and presenting them to the interested public in such way that the statements present a faithful and fair account of the financial position and performance of the company Elektro Celje and Elek-tro Celje Group.
The Management Board hereby declares that:
• all financial statements have been compiled in compli-ance with professional standards and legislation regu-lating operation, accounting, taxation, and finance;
• the financial statements of the company and group have been prepared under the assumption of going concern;
• the selected accounting policies are implemented con-sistently, and any changes in such policies are duly dis-closed;
• the accounting estimates are prepared with the pru-dence and diligence befitting a good manager;
• the financial statements do not include any material or immaterial errors made in order to achieve a particular presentation of the company’s financial position, finan-cial performance or cash flows.
On April 21, 2016, the company Management Board con-firmed and adopted the financial statements and the An-nual Report for the year 2015.
Rade Knežević, univ. dipl. inž. el.Chairman of the Management Board

ANNUAL REPORT
Elektro Celje2 0 1 5
208
LIST OF ABBREVIATIONSBDoc Bidding DocumentsBSC Balanced ScorecardCA Construction ActCApp Connection ApprovalCHPP Combined Heat and Power PlantCD Conceptual Design (IDZ)CS Cable ShaftDD Detailed Design (PIZ)D.D. Public Limited Company (Joint-Stock Company)DER Distributed Energy ResourcesDCC Distribution Control CentreDMD Dynamic Mimic DiagramDMS Distribution Management SystemDNSO Distribution Network System OperatorD.O.O. Public Limited Company (Limited Liability Company)DS Distribution substationDTD Database of Technical DataDTS Distribution Transformer SubstationDU Distribution UnitEA Energy ActEAgen Energy Agency of the Republic of SloveniaEAM Enterprise Asset ManagementEBITDA Earnings Before Interest, Taxes, Depreciation and AmortizationEDC Electricity Distribution CompanyEDI Electricity Distribution InfrastructureEDS Electricity Distribution SystemEE Energy EfficiencyEIB European Investment BankEIMV Milan Vidmar Electric Power Research InstituteELES Elektro – Slovenija, d.o.o. (ELES, Ltd., Electricity Transmission System Operator)EMS Environmental Management SystemERP Enterprise Resource PlanningFS Fire SafetyGDP Gross Domestic ProductGIS Geographic Information SystemGPS Global Positioning SystemGURS Surveying and Mapping Authority of the Republic of SloveniaGWh Gigawatt HourHEP Hrvatska elektroprivreda d.d. (Croatian National Electricity Company – HEP d.d.)HV High VoltageHVUC High-voltage Underground CableIP Internet ProtocolISO International Organization for Standardizationkm Kilometer
209
ANNUAL REPORT
Elektro Celje2 0 1 5
kV KilovoltkW KilowattkWh Kilowatt HourLV Low VoltageLVUC Low-voltage Underground CableMDM Meter Data ManagementMDSP Municipal Detailed Spatial PlanMV Medium VoltageMW MegawattMWh Megawatt HourNCC National Control CentreOHS Occupational Health and SafetyOHSAS Occupational Health and Safety Management Systems (BS OHSAS 18001)OMS Outage Management SystemOPEX Operational ExpenditureOPL Overhead Power LinePD Preliminary Design (IDP)PQ Power QualityPSI Software Solution for Distribution Control CentresPU Public UtilityPUS Public Utility ServicePX3 A scheme where the generation source produces electricity for its own consumptionQMS Quality Management SystemRCC Regional Control CentreRCS Remote-Controlled SwitchgearRES Renewable Energy SourcesRS Republic of SloveniaSAIDI System Average Interruption Duration IndexSAIFI System Average Interruption Frequency IndexSCADA Supervisory Control and Data AcquisitionSCS Security and Control SystemSED Slovene Electricity DistributionSHP Small Hydropower PlantSICAD Geographic Information System Software SolutionSODO d.o.o. Distribution Network System Operator for the Republic of SloveniaSPS Small-scale Photovoltaic SystemSS Switching SubstationSSH Slovenski državni holding, d.d. (Slovenian Sovereign Holding)TC TelecommunicationTIS Technical Information SystemTS Transformer SubstationTR TransformerUC Underground Cable

Editing and copywriting: Elektro Celje, d. d.Design and typesetting: AV studio d.o.o.Photographic art: Elektro Celje photography section, shutterstock.comYear of publication: 2016