Embed Size (px)
Citation preview

[ 1 9 ] FLUORESCENCE-ACTIVATED CELL SORTING 197
to plastic microspheres for the electrophoretic separation of human lym- phocytes. 47 Aggregation and damage of the microsphere-labeled lympho- cytes, however, was observed. In addition, multivalent binding may ren- der dissociation of the particles from the cells difficult. We find it neither necessary nor desirable to add cell-particle interactions to the cell-anti- body reaction for electrophoretic cell separation.
A promising approach to the amplification of the differences in cell surface charge induced by bound antibody may be the prior modification of the antibodies used. Charged groups may be introduced or neutralized, and charged peptides or proteins may be coupled to immunoglobulin, 48 without interfering with antibody specificity.
Another important advantage of ASECS in comparison to other im- munospecific cell separation methods is its high separation capacity. While, for instance, in fluorescence-activated cell sorting the cell flow rate is limited to about 2000 cells/sec, in free-flow electrophoresis the anti- body/labeled cells can be separated at a rate of 100,000 cells/sec.
The introduction of ASECS has greatly enhanced the potential of free- flow electrophoresis. This technique opens possibility of electrophoretic separation of human lymphocyte subpopulations on a preparative scale and should also be helpful for the separation of murine lymphocyte sub- classes.
47 A. Smolka, D. Kempner, and A. Rembaum, Electrophoresis 3, 300 (1982). 4~ G. B. Olson, M. McFadden, and B. H. Bartels, in "Electrophoresis 81" (R. C. Allen and
P. Arnaud, eds.), p. 933. de Gruyter, Berlin, 1981.
[ 19] F luorescence -Ac t iva ted Cell Sorting:
Theo ry , Exp e r i me n t a l Optimization, and Applications in L y m p h o i d Cell Biology
By D. R. PARKS and L. A. HERZENBERG
Introduction
Most of the questions being asked in contemporary cell biological research can be framed in terms of the properties of the individual cells in the system and the interactions among those cells. Flow cytometry and sorting now provide the most informative and powerful methods for the analysis and separation of cell populations in such research. The analyti- cal strength of flow cytometry lies in its ability to make quantitative,
Copyright © 1984 by Academic Press, Inc. METHODS IN ENZYMOLOGY, VOL. 108 All rights of reproduction in any form reserved.
ISBN 0-12-182008-4

198 LYMPHORETICULAR CELLS [19]
multiparameter measurements on statistically adequate numbers of cells to define the properties of a cell population or its component subpopula- tions. The techniques can be applied to any sample that can be obtained as a single cell suspension. Although the same methodology and instrumen- tation can be used for analysis and sorting of all kinds of particles, includ- ing subcellular components like chromosomes I or whole nuclei, we limit this chapter to consideration of cells.
Multiparameter analysis, combining measurements of intrinsic cell properties like light scatter with quantitative assessment of investigator- controlled features such as cell surface immunofluorescence, makes it possible to evaluate particular cell populations even in complex mixtures. Monoclonal antibodies have vastly increased the range and effectiveness of immunofluorescence measurements, while flow cytometry and sorting have been important aids in the development and characterization of new monoclonal antibodies.
The FACS TM makes quantitative, correlated multiparameter measure- ments on each cell. These measurements may be the ultimate data in an experiment or may be used to define sorting criteria yielding sorted cells for further work. Other cell separation techniques rely on nonspecific physical properties, like buoyant density or nylon adherence, or on appli- cation of a specific reagent, such as in antibody affinity binding, in ways that are neither quantitative nor multiparameter.
At present some experiments require more sorted cells than FACS techniques can supply in a reasonable time. Typical running rates of 5000 cells per second mean that it takes a day to run 108 cells. Some increase in cell analysis and sorting rate may be expected in the future, but the main openings will probably come from improvements in experimental tech- niques allowing smaller cell samples to be used.
Flow cytometric techniques are now used in a wide variety of basic and clinical research programs and are coming into use for clinical diag- nostic purposes. The array of uses ranges from chromosome sorting to identification of freshwater algae, and books, 2 conference proceedings, 3
A. V. Carrano, M. A. Van Dilla, and J. W. Gray, in "Flow Cytometry and Sorting" (M. Melamed, P. Mullaney, and M. Mendelsohn, eds.), p. 421. Wiley, New York, 1979.
la Abbreviations: FACS, fluorescence-activated cell sorter; PI, propidium iodide; PE, phy- coerythrin; APC, allophycocyanin; PMT, photomultiplier tube; dhfr, dihydrofolate reduc- tase; AHH, aryl hydrocarbon hydroxylase; BP, benzo[a]pyrene; TCDD, 2,3,7,8-tetra- chlorodibenzo-p-dioxin.
2 M. Melamed, P. Mullaney, and M. Mendelsohn, eds, "Flow Cytometry and Sorting." Wiley, New York, 1979.
3 Automated Cytology Conference Proceedings, J. Histochem. Cytochem. 22(7) (1974); 24(1) (1976); 25(7) (1977); 27(1) (1979).

[19] FLUORESCENCE-ACTIVATED CELL SORTING 199
and review articles 4-6 as well as the journal Cytometry are available as sources of information.
The discussion in this chapter focuses on sorting-capable instruments and their use in lymphoid cell analysis, immunochemical and enzymologi- cal research, studies of gene amplification and hybridoma selection, and other rare cell sorting problems. The emphasis is on information relevant to the analysis and sorting of viable, immunofluorescent stained cells. We have tried to discuss theory and practical considerations in ways that will be clear to those not already using flow cytometry but with enough rigor and detail to be informative to current users and to facilitate applications beyond those described specifically in the applications sections.
History of the Instrumentation
The history of flow cytometry and cell sorting has been reviewed by Melamed and Mullaney 7 and by Herzenberg et al. 8 The following sketch of the development of the instrumentation is based largely on those re- views.
Ideas for cell counting and measurement in flow have been around for a long time, but reliability and reproducibility of measurements was not easily achieved until laminar-flow guidance of a small cell-containing stream in moving cell-free fluid 9 was applied to give stable flow in rela- tively large channels. Several microscope-based systems were developed to measure light scatter, light absorption and/or fluorescence using arc- lamp illumination and the epifluorescence principle. 1°,1j Van Dilla et al. ~2
at Los Alamos made the first use of an argon-ion laser in a system where the axes of cell flow, laser beam path, and fluorescence detection were mutually orthogonal.
Electrostatic sorting utilizing stabilized drop formation and individual drop charging, as used in current cell sorting machines, developed from the ink-jet deflection work of Sweet. 13 Fulwyler first applied this tech-
4 K. A. Ault, Diagn. Imrnunol. 1, 2 (1983). 5 M. R. Loken and A. M. Stall, J. lmmunol. Methods 50, R85 (1982).
L. A. Herzenberg and L. A. Herzenberg, in "Handbook of Experimental Immunology" (D. M. Weir, ed.), 3rd ed., p. 22.1. Blackwell, Oxford, 1978.
7 M. R. Melamed and P. F. Mullaney, in "Flow Cytometry and Sorting" (M. Melamed, P. Mullaney, and M. Mendelsohn, eds.), p. 3. Wiley, New York, 1979.
s L. A. Herzenberg, R. G. Sweet, and L. A. Herzenberg, Sci. Am. 234, 108 (1976). P. J. Crosland-Taylor, Nature (London) 171, 37 (1953).
~0 L. K. Kamentsky, M. R. Melamed, and H. Derman, Science 150, 630 (1965). 11 W. Gohde and W. Dittirch, Acta Histochem., Suppl. 10, 42 (1971). z~ M. A. Van Dilla, T. T. Trujillo, P. F. Mullaney, and J. R. Coulter, Science 163, 1213
(1969). 13 R. G. Sweet, Rev. Sci. Instrum. 36, 131 (1965).

200 LYMPHORETICULAR CELLS [19]
nique to sorting cells on the basis of a Coulter-type resistive volume measurement. ~4 Our group at Stanford 15 developed a sorting system for fluorescent-stained cells, and Bonner et al. 16 in our laboratory introduced optical measurements in the sorting jet rather than in an enclosed flow cell. A laser light scatter channel that was added to that system to provide detection of nonfluorescent cells proved to be useful not only for cell sizing but also for live/dead cell discrimination. 17 The first commercial cell sorting instrument (Becton Dickinson "FACS I") was based on that sys- tem, and most commercial sorters still use the same basic design.
In the last several years both investigator-built and commercial cell sorters have proliferated and evolved with changes particularly toward multiparameter measurement and toward more sophisticated and power- ful computer analysis.
T h e o r y o f O p e r a t i o n a n d M e a s u r e m e n t
Description of the Basic Cell Sorter Components and Their Functions
A sketch of the mechanical and optical components of a "typical" cell sorter and a block diagram of the signal processing electronics are shown in Fig. I and described below. Fluorescent and scattered light are pro- duced when a cell contained in the liquid jet passes through the focused laser beam. The jet consists primarily of cell-free sheath fluid. The cell suspension is injected into the center of the nozzle, and hydrodynamic focusing Is ensures that the cells remain centered in the jet. This centering is necessary for making accurate measurements on the cells.
A forward light scatter detector receives light from a selected angular range beyond the coverage of the laser beam stop, commonly from angles in the range from 1 to 15 °. Fluorescent light is collected by a lens and divided between two photomultiplier detectors (PMTs) by a dichroic beamsplitter. Each fluorescence detector has further optical filtering to exclude scattered laser light and to pass light in the desired wavelength region for that detector.
For sorting, the nozzle assembly is vibrated by an oscillator-driven piezoelectric crystal (a device which expands and contracts slightly as a
14 M. J. Fulwyler, R. B. Glascock, R. D. Hiebert, and N. M. Johnson, Rev. Sci. Instrum. 40, 42 (1969).
i5 H. R. Hulett, W. A. Bonner, J. Barrett, and L. A. Herzenberg, Science 166, 747 (1969). 16 W. A. Bonner, H. R. Hulett, R. G. Sweet, and L. A. Herzenberg, Rev. Sci. Instrum. 43,
404 (1972). 17 M. R. Loken and L. A. Herzenberg, Ann. N.Y. Acad. Sci. 254, 163 (1975). is V. Kachel and E. Menke, in "Flow Cytometry and Sorting" (M. Melamed, P. Mullaney,
and M. Mendelsohn, eds.), p. 41. Wiley, New York, 1979.

[19] FLUORESCENCE-ACTIVATED CELL SORTING 201
function of the varying voltage applied across it) at a frequency near the natural drop breakup frequency of the jet. This stabilizes the drop forma- tion at that frequency, resulting in uniform drop size and a well-defined time delay between detection of a cell at the laser beam and incorporation of the cell into afree drop. I fa cell is to be sorted, a potential in the 100 V
F1
F2
PIEZOELECTRIC F2 PMT _ CRYSTAL
F 1 PMT
NOZZLE
SCATTER.~_~.
DROP FORMING
J SIGNAL
CELL SAMPLE
. j _~SHEATH f FLUID
DROP CHARGING ~ _ j
LIGHT SCATTER DETECTOR
LASER BEAM
+l SORTED SAMPLES
®
U
"~ DEFLECTION
i 1 PLATES -
)o / U ~ . , I A S ~ , R A T O R
o
W FIG. 1. Generalized cell sorter diagram. The functions of the components in (a) the
mechanical and optical systems and (b) the signal processing and sorting electronics are described in the text.

202 LYMPHORETICULAR CELLS [19]
F1 F2 s
v I
DROP FORMING SIGNAL
DROP CHARGING
SIGNAL
I'NEARANO'O J I LOGARITHMIC SIGNAL AMPLIFIERS
I ANALOG ~ SIGNAL
EVALUATION
I DROPCHARGE L I AMPLIFIER r
COMPUTER OR ~ DISPLAY ] PHA STORAGE SYSTEM AND ANALYSIS
T DIGITIZATION I- - - ~ DIGITALANALOGDEcISIoNSORTOR I
OSCILLATOR ~, DROP CHARGE TIMING
AND COINCIDENCE PROTECTION LOGIC
Fl6. lb. See legend on p. 201.
range is applied to the fluid inside the nozzle. The electrical conductivity of the fluid assures that any drops that break from the jet while the voltage is applied will carry a corresponding electric charge. The timing and dura- tion of the applied voltage are chosen to charge one or more drops which will contain the desired cell. Two populations of cells can be sorted simul- taneously by applying a positive charge to drops containing one popula- tion and a negative charge to drops containing the other. The train of drops passes between two plates charged at plus and minus several thou- sand volts, separating the charged drops from the uncharged ones. The undeflected drops are removed by an aspirator, and the deflected drops are collected in appropriate receptacles. The aspirator is very effective in preventing formation of aerosols by the undeflected drops. 19 This can be important when handling biohazard materials.
Proceeding to the signal processing electronics (Fig. lb), the light scatter and fluorescence detector outputs are amplified and processed for evaluation. These operations may involve bandpass limitation, time gat- ing, integration, peak detection, etc. with the usual objective of producing a processed signal for each detector that is the best possible estimator of the scattered light or fluorescence produced by each cell. These signals are digitized and fed to a computer or pulse height analyzer for storage and analysis. Cell frequency data in one or two of the scatter/fluorescence measurement dimensions can be displayed on a CRT screen or on a hard copy plotter to assist the investigator in visualizing and interpreting the cell population measurements. 19 j. T. Merrill, Cytometry 1, 342 (1981).

[19] FLUORESCENCE-ACTIVATED CELL SORTING 203
Sorting decisions can be made using either analog or digital data. Analog decision making is usually accomplished by combining indepen- dent "windows" on the signals so that a cell is selected for sorting if its light scatter signal falls within a selected range and each of its fluores- cence signals falls within the range selected on that channel. In two di- mensions (e.g., light scatter vs green fluorescence) the selection criteria can be visualized as a rectangular box such that cells whose signals cor- respond to a point in the box are to be sorted, and those outside the box are not. If the sort decision is made by a computer using digitized data, the selection may be defined on the basis of a more general combination of the signal values. In two dimensions useful results might be elliptical sorting regions or irregular polygon regions.
Once the decision about the preferred disposition of the cell has been made (i.e., left sort, right sort, or no sort) it is still necessary to produce the drop charging pulse at the appropriate time. It is also usually desirable to protect the purity of sorted fractions by examining situations in which a cell that fulfills the sorting criteria is close to a cell which does not ("coin- cidences") so that sorting of any drop that might contain the wrong cell can be suppressed. The system to carry this out could be hard-wired or computerized.
The fundamental limit on the complexity of computer decision making in cell sorter systems is the time between the detection of the cell and its incorporation into a free drop, which may be as short as 200/.~sec. In addition, it may be necessary to process several cells during that interval.
Cell Sorter Elaborations and Variations
At this point we would like to mention a few additional features and ways in which some cell sorter systems differ from the "typical" one described above.
More Excitation Sources and Detectors. As the cell populations and questions being asked about them become more complex, it becomes important to increase the array of measurements made on each cell. A number of systems have been produced using two or three lasers to excite several d y e s . 2°-z4 Use of such systems may require three or four fluores- cence detection channels. Also light scatter measurements in angular ranges other than the moderate forward angles mentioned above have
20 D. J. Arndt-Jovin, B. G. Grimwade, and T. M. Jovin, Cytometry 1, 127 (1980). 2~ D. R. Parks, R. R. Hardy, and L. A. Herzenberg, lmmunol. Today 4, 145 (1983). 22 D. R. Parks, R. R. Hardy, and L. A. Herzenberg, Cytometry 5, 159 (1984). 23 j. A. Steinkamp, C. C. Stewart, and H. A. Crissman, Cytometry 2, 226 (1982). 24 M. R. Loken and L. L. Lanier, Cytometry 5, 151 (1984).

204 LYMPHORETICULAR CELLS [19]
proved useful in analyzing complex populations. We discuss these addi- tions in more detail below.
Sample Handling. Several years ago we developed a microprocessor- controlled, syringe-driven sample handling system as an aid in analyzing large numbers of cell samples. Samples may be taken directly from the tray in which they are stained and run without being transferred to indi- vidual tubes, allowing larger numbers of samples to be run conveniently.
Cloning. In work with tissue culture cells it is often convenient to do cloning directly with the cell sorter. 25 The sorting logic modifications that allow one and only one cell or a specified number of cells fulfilling the selection criteria to be sorted have been implemented on several commer- cial machines.
Flow Cell Interrogation. In some cell sorter systems the cell stream intersects the laser beam within a transparent flow chamber and then passes through the jet forming orifice. This system has some optical ad- vantages in that the laser beam passes through fiat windows thus avoiding the large amount of reflected and refracted light found in jet-in-air mea- surement systems. On the other hand the windows must be kept clean while the surface of a jet in air is constantly renewed and self cleaning. The extra time and the stream velocity changes occurring between cell detection and drop formation in a flow cell sorter lead to greater delay time uncertainties in sorting so that more drops may have to be allocated to each cell than with jet-in-air measurement.
Other Measurements in Flow
While light scatter and fluorescence are the primary measurements made in flow sorters, several other types of measurements can be made in flow systems, and some have been implemented in sorters. Coulter vol- ume, based on the effect of a cell on the DC resistance across an orifice, involves a more complex geometry with separate measuring and jet form- ing orifices and also requires careful design to keep the sorter drop charg- ing pulses from interfering with the resistive volume measurement. 26 Re- lated AC measurements have been carried out, 27 but they do not seem to be in routine use.
Ultrasound measurements on cells in flow have been demonstrated, 28 but their utility in biological investigations has not yet been established.
25 D. R. Parks, V. M. Bryan, V. T. Oi, and L. A. Herzenberg, Proc. Natl. Acad. Sci. U.S.A. 76, 1962 (1979).
26 V. Kachel, in "Flow Cytometry and Sorting" (M. Melamed, P. Mullaney, and M. Men- delsohn, eds.), p. 61. Wiley, New York, 1979.
27 R. A. Hoffman and W. B. Britt, J. Histochem. Cytochem. 27, 234 (1979). 2s R. G. Sweet, M. J. Fulwyler, and L. A. Herzenberg, Anal. Cytol. Cytometry, 9th and Int.
Symp. Flow Cytometry, 6th Abstract (1982).

[19] FLUORESCENCE-ACTIVATED CELL SORTING 205
Light extinction can be measured, particularly in flow cell geome- tries, z9 This is a measurement of the light removed from a laser beam by the passage of a cell. Theoretically, it should correspond to an all-angle integrated scatter measurement since light is removed from the laser beam by scatter and/or absorption, and absorption by cells stained with the usual dyes tends to be low. Strongly absorbing dyes have been used in some systems such as the Technicon Hemalog to distinguish different types of white blood cells by measuring light scatter and absorption. 3°
Light Scatter Analysis
Uses for Light Scatter Measurements
Light scatter measurements provide extremely valuable information in flow analysis and sorting. They (1) provide reliable detection of all cell- sized objects regardless of their fluorescence, (2) provide clear initiation signals for sort system timing, (3) give some information on relative cell size, (4) allow live-dead cell discrimination in some populations, and (5) provide useful cell type discrimination in mixed populations.
Light Scatter Theo~
Light scatter measurements in flow systems have been reviewed by Salzman. 31,32 Because typical eukaryotic cells and their principal internal structures have dimensions in the range of a few times the wavelength of visible light, both large-object and small-object approximations fail to simplify light scatter calculations. As a result significant computations are required to predict light scatter angular distributions in even the most simplified model systems. 33 In practical applications light scatter theory provides some guidelines on what angular ranges may give sensitivity to features of interest, but, at present, it does not allow us to define specific properties and structures of a cell on the basis of light scatter measure- ments.
Some guidelines derived broadly from theoretical calculations and from measurements on real cells may be summarized as (1) light scatter
29 j. A. Steinkamp, Cytometry 4, 83 (1983). 3o L. A. Cooper, in "Flow Cytometry and Sorting" (M. Melamed, P. Mullaney, and M.
Mendelsohn, eds.), p. 679. Wiley, New York, 1979. 3~ G. C. Salzman, P. F. Mullaney, and B. J. Price, in "Flow Cytometry and Sorting" (M.
Melamed, P. Mullaney, and M. Mendelsohn, eds.), p. 105. Wiley, New York, 1979. 32 G. C. Salzman, in "Cell Analysis" (N. Catsimpoolas, ed.), p. 111. Plenum. New York.
1982. 33 M. Kerker, "The Scattering of Light and Other Electromagnetic Radiation." Academic
Press, New York, 1969.

206 LYMPHORETICULAR CELLS [19]
intensities for cells are highest at very small angles falling off with oscilla- tions in intensity to values several orders of magnitude lower at large angles, (2) light scatter is most proportional to overall cell size and least sensitive to internal structure at the smallest angles, (3) light scatter out- side the smallest angles (e.g., in the range from 4-12 ° ) shows more sensi- tivity to cell structure, (4) at large angles in the 90 ° range fine internal structure and granularity become important, and (5) back angles (near 180 ° ) show weak signals that seem to be similar in information content to the stronger signals at corresponding forward angles (near 0°), although this may be an artifact caused by reflections of the bright small angle scattered light.
Light scatter from nonspherical cells is affected by cell orientation. One effect of the hydrodynamic focusing of the cell stream in a jet forming orifice is that nonspherical cells tend to be oriented with their long axes parallel to the direction of flow. Such aligned cells can still have different orientations with respect to the laser beam which can result in striking differences in light scatter measurements among essentially identical cells. 34
Standard Measurements and Interpretation
The common light scatter measurements in cell sorter systems are made at forward angles and around 90 °. Forward scatter provides a strong signal with considerable cell size dependence. In appropriate angular ranges it can discriminate live and dead lymphocytes quite well 17 and live and dead cells of less uniform cell types less well. It can also assist in discriminating among cell types. In our work we have found that forward scatter from the 3 to 12 ° range is better than scatter from smaller angles for live-dead discrimination and for distinguishing erythrocytes from lym- phocytes, lymphocytes from monocytes, or lymphocytes from granulo- cytes.
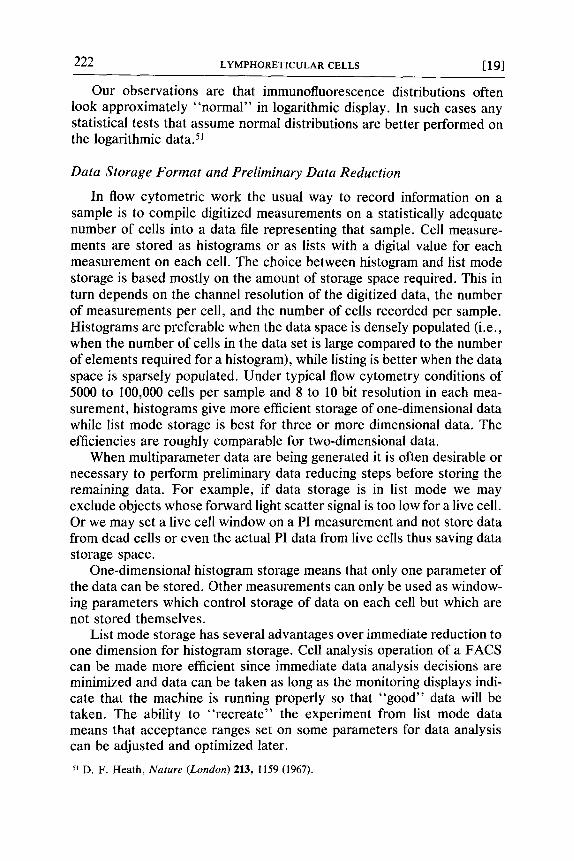
We have found light scatter in the region near 90 ° to be a useful addition to forward scatter in making clear separations among cell types in mixed samples. Figure 2 shows how the two scatter signals taken together distinguish cell types in human blood. In some flow cytometers a fluorescence detector is well placed to measure 90 ° scatter with just a change from color filters to an appropriate neutral density filter to limit the light scatter signal level on the detector. Such a scatter detector may not work well for sorting since the drop forming oscillation modulates the laser light reflected from the jet resulting in "noise" on the scatter detec-
34 M. R. Loken, D. R. Parks, and L. A. Herzenberg, J. Histochem. Cytochem. 25, 790 (1977).

[19] FLUORESCENCE-ACTIVATED CELL SORTING 207
r~
(N
" i
G
i
i ' ' ' Is'e' "" lain' ' If~" " 12m' " 12~' " I ~ ' " h ~ ' ' FORWARD SCATTER
FIG. 2. Discrimination of cell types in human blood by two angles of light scatter. The cell populations are erythrocytes (E), lymphocytes (L), granulocytes (G), and monocytes (M). A linear measure of forward light scatter at 488 nm with an acceptance angle from about 2.5 to 12 ° is shown on the horizontal dimension. The vertical axis plots the logarithm of "90 °" scatter with an acceptance range from about 70 to 110 °. The figure is a superposition of data from several subsamples enriched for different cell types.
tor. We now use a simple fiber opt ic co l lec tor leading to a separa te photo- multiplier tube for large angle scat ter m e a s u r e m e n t s comparab le to 90 ° scat ter . This co l lec tor is p laced next to the f luorescence object ive and be low the plane o f ref lec ted/ ref rac ted laser light. Our sys tem requires redes ign to min imize b a c k g r o u n d light, but it works equal ly well in sort ing o r nonsor t ing condi t ions .
Multiple laser sys t ems open the possibi l i ty o f measur ing light scat ter at two or m o r e wave lengths . Lit t le w o r k has been done in this area , but there has been one repor t o f useful in format ion in dual wave leng th mea- su rements . 35 ( Incidenta l ly , this w o r k was done not with two lasers but with one laser and special laser cavi ty mirrors . )
Light Scatter Standards
Since light sca t te r m e a s u r e m e n t s tend to be quite useful wi thout being measures o f readi ly in terpretable cell proper t ies , it should not be surpris-
~ G. R. Otten and M. R. Loken, Cytometry 3, 182 (1982).

208 LYMPHORETICULAR CELLS [19]
ing that light scatter standards are useful in monitoring system stability and in detecting problems in cell samples but not in making theoretically interesting comparisons. For example, we currently use 1.8-/zm-diameter plastic microspheres for signal standardization (Polysciences, Inc. cat. no. 9719 or 9847). Hybridoma cells are nearly 1000 times as large in volume and scatter about 100 times as much light in our forward scatter measure- ment but are about equal to the microspheres in large angle scatter.
Cell Staining Reagents and Procedures
Fluorescent Reagents
Fluorescent reagents are used in most flow cytometric measurements because the low background possible with fluorescence signals allows high sensitivity and a large dynamic range in the measurements.
For our purposes the large array of fluorescent sources that are rele- vant in flow cytometry can be divided into three categories: (1) intrinsic cellular fluorescences, (2) inherently fluorescent probes, and (3) reagents whose specificity and fluorescent tag are independent. Intrinsic cellular fluorescences can be measured in the UV to give information on the content of particular molecules, 36,37 but usually they form part of the background against which other fluorescences must be measured. Inher- ently fluorescent probes have been used to measure cellular DNA con- tent, protein content, membrane potential, membrane fluidity, intracellu- lar pH, and a number of other properties. In general these reagents provide large fluorescence signals whose measurement is more-or-less straightforward.
In this chapter we are concerned primarily with the third group includ- ing antibodies, lectins, and antigens which bind specifically to appropriate cellular molecules and which are marked with a chromophore of the ex- perimenter's choice. Our use of the term immunofluorescence will gener- ally be applicable to staining with any reagents in this group. The chromo- phore may be attached directly to the binding molecule, or it may be carried on a second step reagent which binds to the first. The second step may be an antibody to the first step molecule, an antibody to a hapten which is coupled to the first step or avidin which binds to biotin coupled to the first step. Two step procedures often give brighter staining than direct coupling of dye to the primary reagent, but the high purity and specificity of monoclonal antibodies make directly labeled reagents adequate for most tasks.
36 j . E. Aubin, J. Histochem. Cytochem. 27, 36 (1979). 37 B. Thorell, Cytometry 2, 39 (1981).

[19] FLUORESCENCE-ACTIVATED CELL SORTING 209
Also, increased interest in multiple immunofluorescence measure- ments has led to more use of directly labeled reagents in order to minimize the possibilities for crossreactions among reagents.
Dyes for Immunofluorescence
An immunofluorescent dye must fulfill several stringent criteria. Since signal brightness is often the limiting factor in immunofluorescent mea- surements, the dye should absorb strongly at wavelengths for which a good excitation source is available and should have a high quantum effi- ciency for fluorescence emission. In addition, it must be possible to couple the dye to an antibody or other specificity-conferring molecule without disrupting that specificity or the dye fluorescence.
Figure 3A, B, C, D, and F shows excitation and emission spectra for a number of dyes that are useful for immunofluorescent-type cell labeling. Fluorescein and rhodamine have been used for many years in microscopy as immunofluorescent dyes. They are small molecules (MW 332 and 479, respectively) which are commonly attached to antibodies or other pro- teins by the reaction of their isothiocyanate derivatives with protein amino groups. Fluorescein is ideally suited to excitation by the argon-ion laser line at 488 nm. The 514.5 nm argon-ion laser line is commonly used to excite rhodamine, but it is not so well matched to the excitation spec- trum of that dye. On the other hand, the mercury arc lamps commonly used in fluorescence microscopy are well matched to excite rhodamine and not nearly so good for fluorescein. Thus good reagents for one means of observation may not be optimal for another.
Texas Red (Molecular Probes, Inc., Johnson City, OR) is a sulfonyl chloride derivative of Sulforhodamine 101 which couples to proteins via their amino groups. It has been used most successfully as an avidin conju- gate although some direct antibody reagents have also been used.
Phycobiliproteins are accessory photosynthetic pigments found in red algae and in cyanobacteria 38,39 that have recently been applied to im- munofluorescent labeling. 4° They harvest solar energy at wavelengths where chlorophyll itself is not efficient and transfer the excitation nonra- diatively to chlorophyll for use in photosynthesis. The principal types of phycobiliproteins are phycoerythrins, phycocyanins, and allophyco- cyanins. Different organisms have somewhat different forms of these mol- ecules. Each whole phycobiliprotein molecule is a complex of several
3~ A. N. Glazer, in "The Evolution of Protein Structure and Function" (D. S. Sigman and M. A. B. Brazier, eds.), p. 221. Academic Press, New York, 1980.
39 A. N. Glazer, Annu. Rev. Microbiol. 36, 173 (1982). 40 V. T. Oi, A. N. Glazer, and L. Stryer, J. Cell Biol. 93, 981 (1982).

210 LYMPHORETICULAR CELLS [19]
A 1 0 0
F L U O R E S C E I N T E X A S RED
r ~
[ I J I.~ I I I~ = I I a I I h~+LhJ I I I I 0 r ~ r r i =, t h , ~ t ~) = I ~, J;4
5 0 0 6 0 0 7 0 0 5 0 0 6 0 0 7 0 0
Z 0
UJ
n- O z 0 I - <C I - 0 x ILl
C D R - P H Y C O E R Y T H R I N A L L O P H Y C O C Y A N I N
o o 5 0 0 6 0 0 7 0 0 5 0 0 6 0 0 7 0 0
E P R O P I D I U M IODIDE F R H O D A M I N E '°°F
0 l-liJalllillJlJllllILllllll 0 ~illlli~'IIii~llllil~'Nil
5 0 0 6 0 0 7 0 0 5 0 0 6 0 0 7 0 0
W A V E L E N G T H (NM)
FIG. 3. Excitation and emission spectra of dyes used for immunofluorescence and of propidium iodide. Excitation spectra (solid lines) and emission spectra (broken lines) were taken with a SPEX Fluorolog instrument and are uncorrected. The vertical scale is in arbitrary units. The arrows in (A), (C), (E), and (F) mark the argon ion laser lines normally used to excite the dyes. The arrowed ranges in (B) and (D) mark the best range for excitation using a tunable dye laser. R-phycoerythrin (C) was from the red alga Gastroclonium coulteri, and the aUophycocyanin (D) was from the cyanobacterium Anabaena variabilis.
polypeptides with open-chain tetrapyrrole chromophores attached. The polypeptide complexes range in form from (a/fl)3 for phycocyanins and allophycocyanins to (a/fl)6y for some phycoerythrins (where a, ~, and y are different polypeptide subunits in the different proteins). Allophyco- cyanins of molecular weight 105,000 carry 6 chromophores; phycoery- thrins of MW 240,000 carry up to 40 chromophores. The spectral proper-

[ 1 9 ] FLUORESCENCE-ACTIVATED CELL SORTING 211
ties of the molecules derive both from the types of chromophores attached and from the protein structure. Some algae even vary the mix of chromophores in response to changes in the spectrum of the light they receive.
As immunofluorescent labels phycobiliproteins have several advan- tages. They can be excited efficiently over a fairly wide range of wave- lengths. Each molecule carrys many chromophores, and the molecules, being naturally bioengineered, maintain higher quantum efficiencies for fluorescence emission than one would expect to obtain from an equivalent number of ordinary dye molecules on a comparably sized protein. At dye- to-antibody coupling ratios near one, phycobiliprotein reagents should exhibit intense fluorescence with minimal interference with binding speci- ficities.
The procedures for coupling phycobiliproteins to specific reagents are just being explored, but information on some approaches that have been tried is contained in references 22, 24, and 40.
Dye-Reagent Considerations in Immunofluorescence
The details of reagent preparation and dye coupling are beyond the scope of this chapter and are the subject of an extensive literature. 4j-43 The pitfalls and limitations of immunofluorescent reagents as used in flow cytometry must be mentioned, however.
The optimum dye to protein ratio for a flow cytometric reagent may be lower than for reagents to be used in visual microscopy since the high sensitivity of flow cytometric measurements means that the low levels of nonspecific staining often found with heavily dye-labeled reagents may be detected and misinterpreted. High coupling ratios may result in consider- able quenching of the dye fluorescence so that fluorescence output is not as great as would be predicted from the optical absorbance of the reagent. This must be taken into account in making quantitative estimates of the reagent bound per ceil.
Reagent and Cell Handling for Immunofluorescent Staining (This Volume I41])
Detailed procedures for immunofluorescent staining are available from various sources. 41,42 We would, however, like to emphasize several spe- cific points. For optimal staining specificity it is important to remove aggregated material from reagents before use. This can be accomplished,
4t D. M. Weir, ed., "Handbook of Experimental Immunology," Vol. 3. Blackwell, Oxford, 1978.
4~ B. B. Mishell and S. M. Shiigi, "Selected Methods in Cellular Immunology." Freeman, San Francisco, California, 1980.
43 j. W. Goding, J. Immunol. Methods 13, 215 (1976).

212 LYMPHORETICULAR CELLS [ 19]
for example, by centrifugation for 10 min at 20-50,000 g in a microfuge or airfuge. We normally incorporate sodium azide at a concentration of 0.1% in staining medium to prevent removal of surface stain by active cellular processes. When large numbers of samples are to be stained, it is conven- ient to do the cell handling in flexible 96-well trays. TM
The use ofpropidium iodide (PI) to mark dead cells so that they can be excluded from analyses has been particularly useful in work involving rare cells or small subpopulations of cells, 45 but we find it worthwhile in almost all fluorescence analyses. PI stains DNA and RNA but it is ex- cluded very effectively by cells with intact plasma membranes. As a last step before FACS analysis we wash the cells in medium containing about I/zg PI per ml (a much lower concentration than that used in saturation staining for DNA quantitation). Several minutes exposure to the dye results in distinct labeling of the dead cells with no detectable effect on live cells. Excitation and emission spectra of PI labeled dead cells are shown in Fig. 3E. It excites well at 488 nm but emits fluorescence mostly above 600 nm. These characteristics make it possible to measure PI along with fluorescein and/or Texas Red as described below (Fluorescence Measurement Systems). Forward light scatter separates live cells from nonnucleated debris and from a fraction of dead cells which depends on the sample. Combining PI staining and forward light scatter criteria we can "gate" incoming data to assure that further analysis is carried out only on live cells.
Fluorescence Analysis
Fluorescence Excitation Sources, Filters, and Detectors
The function of the fluorescence excitation and detection system is to produce signals which accurately reflect the amount of each dye associ- ated with each cell. For good sensitivity in immunofluorescent measure- ments we need to maximize the number of photoelectrons produced at the photomultiplier tube (PMT) photocathode by fluorescence of our dye and minimize interference due to light from other sources. The rate of photon emission by a cell is proportional to (1) the amount of dye associated with the cell, (2) the illumination intensity, 46'47 (3) the extinction coefficient of the dye at the exciting wavelength, and (4) the quantum efficiency of the
44 K. Hayakawa, R. R. Hardy, D. R. Parks, and L. A. Herzenberg, J. Exp. Med. 157, 202 (1983).
45 j. L. Dangl, D. R. Parks, V. T. Oi, and L. A. Herzenberg, Cytometry 2, 395 (1982). 46 At very high excitation intensity dye saturation and photobleaching affect fluorescence
output, 47 but these are small effects in most systems. 47 M. F. Bartholdi, D. C. Sinclair, and L. S. Cram, Cytometry 3, 395 (1983).

[ 1 9 ] F L U O R E S C E N C E - A C T I V A T E D CELL SORTING 213
dye for fluorescence emission. The conversion of fluorescence emission to photoelectrons is governed by (1) the light collection efficiency of the fluorescence optics, (2) the transmission of the optical filters for the light emitted by the dye, and (3) the quantum efficiency of the PMT for produc- ing photoelectrons from the filtered fluorescence. The dye related aspects of the process have been discussed above (Dyes for Immunofluores- cence), and the other aspects are discussed in this section.
The principal excitation sources used in flow cytometry are argon-ion lasers, krypton-ion lasers, tunable dye lasers, and mercury arc lamps. Sensitive measurements of immunofluorescence require intense light sources well matched to the dyes being measured if they are to be made over the short time intervals required for high cell rate analysis and sort- ing. In sorting systems operating at several thousand cells per second the excitation source spot size should be small to minimize the frequency of situations in which more than one cell is in the beam at one time. The requirements for high intensity and a small spot size make arc lamp sources marginal or inadequate for sorting systems. Adequate amounts of fluorescence can be obtained in nonsorting arc lamp systems by illuminat- ing a larger area and by passing the cells through the beam more slowly. The limited intensity of arc lamp-derived illumination is based on funda- mental optical principles which limit secondary spot intensity to be no more than the original source intensity. While an arc lamp is an intense source by ordinary standards, its source intensity is much less than that of a laser of the types used in flow cytometry. Laser beams are not normally used with the beam focused to give the highest possible intensity but rather focused to give high intensity with adequate uniformity across the width of the cell stream.
Cell sorters are at a disadvantage compared to some other flow cytom- eters in terms of light collection. The sorting geometry generally allows only N.A. 0.6-0.75 light collecting lenses while analysis machines may employ N.A. 1.2 immersion lenses. The difference can be as much as a factor of 4 in collection efficiency.
The function of optical masking and filtering in fluorescence measure- ments is basically quite simple: to pass as much light as possible from a particular dye while passing as little light as possible from any other source. The sources to be discriminated against include scattered light from the exciting laser beam, fluorescence of the filters excited by scat- tered laser light, cell autofluorescence, raman scatter in the liquid jet, stray room light, and, of course, fluorescent light from other dyes and excitation sources in multifluorescence systems. Imaging the jet onto a mask with apertures passing light only from the region around each laser/ jet intersection helps to minimize stray light acceptance (see Fig. 4).

214 LYMPHORETICULAR CELLS [19]
Since laser light scattered by a cell is normally several orders of mag- nitude brighter than immunofluorescence, fluorescence filters must have an attenuation approaching l 0 6 at the laser wavelength. Fluorescence of the filters themselves is much less of a problem with interference filters than with colored glass or other absorption filters, but even gel filters (e.g., Kodak Wratten series) can be used if they are kept well away from the detectors. The sensitivity of a detector to cell autofluorescence and to other dyes can be minimized by passing a narrow spectral band near the emission peak of the dye of interest, but narrowing the band decreases collection efficiency for that dye also. The optimum choice of filtering depends on the details of the system, but we have found that interference or interference-plus-absorption filters with a bandwidth of 30 to 40 nm are generally good for single dye measurements and also adaptable to multi- dye work. Such filters can have 50% transmission at a wavelength as close as 20 nm to the exciting laser and >80% transmission in the central region of the band. Depending on the spacing between the laser line and the dye emission peak we have obtained filters which transmit 35-55% of the total dye emission (Becton Dickinson FACS Division, Sunnyvale, CA).
Filters can be tested for blocking of scattered light from the laser by running nonfluorescent particles such as 2-/xm-diameter polyvinyltoluene microspheres (Duke Scientific, Cat. No. 115). Comparing fluorescence detector signals with neutral-density filters and the color filters alternately in the filter holder gives an estimate of the blocking of the laser wave- length by the color filters.
Photomultiplier tubes (PMTs) are used for low level fluorescence mea- surements because they offer very high gain/very low noise amplification of the photoelectron signal produced by the fluorescent light. They also have good linearity over a wide range of signal levels. The spectral sensi- tivity of a PMT depends on the photocathode material. In the visible range, quantum efficiency usually decreases at increasing wavelengths, so it is important to use PMTs that have good red sensitivity if dyes emitting much beyond 600 nm are to be used. PMT dark current, the output due to thermal emission of electrons from the cathode and from the amplifying dynodes, is usually not an important source of noise signals in cell sorters; the main noise sources are invariably unwanted light reaching the de- tector.
Fluorescence Measurement Systems
To illustrate the optical systems, the diagrams in Fig. 4 show the layout of one, two, and three immunofluorescence systems using dyes shown in Fig. 3. The first part shows a system for measuring fluorescein

[ 1 9 ] FLUORESCENCE-ACTIVATED CELL SORTING 215
A FLUORESCEINIPROPIDIUM IODIDE
M A S K
NOZZLE LENS
o . . . . . . . JE'F I] OSJECTIVE ,1SNM L,
I I
5 1 5 - 5 6 0 N M BP I I I
/ t 5 8 0 N M L P
6 0 0 N M L P R E F L
FLUORESCEIN/TEXAS RED/PROPIDIUM IODIDE
I
! i I 5 1 5 - 5 6 0 N M BP I 6 0 0 N M LP I
, s s . . i I I
590
5 1 5 N M LP R E F L 6 1 0 - 6 4 0 N M BP
¢ FLUORESCEIN IPHYCOERYTHRIN IALLOPHYCOCYANIN
I I
6 3 5 - 6 8 0 N M BP I I ! ~ 5 1 5 - 5 6 0 N M B P I I J I M I R R O R ]
/11 / [t8 6 1 5
II 5 1 5 N M LP 5 6 0 N M LP 5 6 0 - 6 0 0 N M BP REFL
FIG. 4. Optical systems for one, two, and three immunofluorescence measurement systems. Schematic diagrams are shown for (A) fluorescein immunofluorescence plus propidium iodide, (B) fluorescein and Texas Red immunofluorescences plus propidium io- dide, and (C) fluorescein, phycoerythrin, and allophycocyanin immunofluorescences. Opti- cal filters are designated by their 50% transmission wavelength(s) and their type: LP, long wavelength passing filter; BP, bandpass filter; LP REFL, long wavelength passing dichroic reflector. Photomultiplier detectors are designated FI, F2, and F3. Some components in these diagrams have been rotated from their actual orientations to allow the drawing to be made in one plane.

216 LYMPHORETICULAR CELLS [19]
immunofluorescence with PI viability gating. An argon-ion 488 nm laser beam excites both fluorescein and PI. Light collected by the objective is imaged onto an aperture which is adjacent to a field lens and a laser- blocking filter. The field lens ensures that all light coming from the objec- tive and passing the mask and filters falls on the sensitive area of the PMTs. It also improves the spatial distribution of the signal on the PMT by imaging the back of the objective onto the PMT face. Such a lens may or may not be necessary depending on the geometry of the system. Light passing the laser blocking filter is divided by a dichroic beamsplitter into components above and below 580 nm, and each of these is filtered further and detected by a PMT. In this system fluorescein fluorescence falls primarily on detector FI and PI fluorescence primarily on F2.
In the second part of Fig. 4 a dye laser beam at 590 nm is added to excite Texas Red. Light from the two laser spots is imaged onto two separate apertures each of which is adjacent to an appropriate laser- blocking filter. The rest of the system is like the previous one. The F1 detector is fluorescein sensitive while the F2 detector measures PI as the cell passes through the 488 nm laser beam and Texas Red as it passes through the 590 nm beam several microseconds later. (This is essentially the system described by Parks et al. z~)
In the third part of Fig. 4 two laser beams are used to excite three immunofluorescences. Light from the laser-jet intersections is imaged onto an aperture and 45 ° degree mirror assembly. Fluorescein and PE fluorescence pass through the aperture and laser blocking filter to a 560 nm dichroic beamsplitter and final signal defining filters. F1 is sensitive to fluorescein while F2 is sensitive to PE. APC fluorescence excited at 615 nm is reflected from the mirror passing through a laser-blocking and band- pass-defining filter to give a signal on detector F3.22
Spectral Overlap Correction When One Laser Excites Two Dyes
In each of the systems described in the previous section two dyes are excited by the 488 nm laser beam. The filters are selected to make each detector much more sensitive to one dye than to the other, but, in general, each detector has some sensitivity for both dyes. Since the relation be- tween the signal components on each detector is linear (e.g., doubling the fluorescein emission doubles the fluorescein dependent signal on both F1 and F2), linear combinations of the two detector signals can be con- structed that represent each of the dyes alone. 4s Stated simply, if we take the sensitivity of detector F1 for fluorescein to be 1 and for PE to be a and if we take the sensitivity of detector F2 for PE to be 1 and for fluorescein
4s M. R. Loken, D. R. Parks, and L. A. Herzenberg, J. Histochem. Cytochem. 25, 899 (1977).

[19] FLUORESCENCE-ACTIVATED CELL SORTING 217
(FL) to be b, the signals from the Fl and F2 detectors are
F1 = FL + aPE (1) F2 = bFL + PE (2)
Subtracting aF2 from F1 gives
FI - aF2 = (1 - ab)FL (3)
a signal proportional only to fluorescein. Similarly, subtracting bFl from F2 gives
F2 - bF1 = (1 - ab)PE (4)
This transformation can be performed simply by making analog combi- nations of the two detector signals in the fluorescence amplifiers. The amounts of each to be mixed are determined by running samples contain- ing only one dye or the other and adjusting the output for the "wrong" dye to be zero. The result is two signals that can be processed like direct detector signals but which are each sensitive to only one dye. For analyti- cal purposes the transformation described above could be performed af- ter-the-fact by processing the recorded data, but we find analog real-time correction to be preferable since the signals we see and which are used to define sorting conditions correspond directly to the final recorded data.
One potential problem in multiple immunofluorescence measurements that we have not observed in practice is resonance energy transfer. Examining the excitation and emission spectra in Fig. 3 we see significant overlap between the emission spectrum of fluorescein and the excitation spectrum of Texas Red. We also see considerable spectral overlap be- tween fluorescein and PE and between PE and APC. In such cases excita- tion of the first dye can result in radiation-less transfer of excitation to the second dye resulting in decreased fluorescence from the one and in- creased fluorescence output from the other compared to the actual amounts of the dyes. For energy transfer to occur with detectable effi- ciency the dye molecules must be in close proximity.
It seems that they are not usually so close in multiple immunofluores- cent staining, but in particular cases, such as labeling two determinants on a single cell surface molecule, energy transfer could be a problem (or perhaps a solution depending on the questions being asked). 49
Fluorescence Measurement Quality
The quality of fluorescence measurements is affected by a number of factors whose influence varies depending on the type of sample and the
49 T. M. Jovin, in "Flow Cytometry and Sorting" (M. Melamed, P. Mullaney, and M. Mendelsohn, eds.), p. 137. Wiley, New York, 1979.

218 LYMPHORETICULAR CELLS [19]
purpose of the measurements. The limiting cases, however, may be con- sidered as one in which we want to measure brightly stained cells as accurately as possible and the other in which we want to distinguish minimally stained cells from unstained. The factors affecting the fluores- cence signal are laser beam intensity, stability and uniformity, fluores- cence collection, filter and PMT efficiency, background light sources, and cell autofluorescence. In all cases the accuracy of measurements is lim- ited by the number of photoelectrons produced by a cell. Increases in laser beam power, light collection efficiency and PMT efficiency at the relevant wavelengths will all increase the absolute signal level. A tradeoff between laser beam intensity and illumination uniformity of the cells de- pends on the beam focusing and the size of the cell stream. Cells following different trajectories in the jet pass through different parts of the laser beam. If the laser beam is tightly focused to obtain higher beam intensity, the uniformity of illumination of different cells may suffer. Since the range of cell trajectories increases with the sample flow rate, observed laser beam uniformity will be best if cell samples are run at high cell concentra- tion and low liquid flow rate. Laser beam stability refers to fluctuations in beam power or spatial distribution over the course of a set of measure- ments.
When low level fluorescence is to be measured, cell autofluorescence may set the real limit on our ability to estimate the reagent fluorescence. Autofluorescence is a function of cell size, cell type, excitation wave- length, and emission detection range. The fluorescent molecules are nor- mal cell constituents like flavins 5° and cytochromes which tend to be found in greater quantity in larger cells. On the other hand cultured cells tend to be more autofluorescent than corresponding fresh cells and dead tissue culture cells can show enough increase in autofluorescence for this to be used as a criterion of nonviability, z5 Cell samples such as spleen and bone marrow include not only lymphocytes and other low autofluores- cence cells but also a variable-sized fraction of much brighter cells which can interfere with efforts to define and characterize small subpopulations of cells by immunofluorescence.
What can we do about autofluorescence? Besides the obvious use of brighter reagents so that the relative effect of autofluorescence is dimin- ished we may be able to use redder reagents and optimize filtering to decrease measured autofluorescence. While good spectra of the auto- fluorescence of ordinary cells are difficult to obtain, it seems that auto- fluorescence emission tends to be broad and that excitation at longer wave-
50 R. C. Benson, R. A. Meyer, M. E. Zaruba, and G. M. McKhann, J. Histochem. Cyto- chem. 27, 44 (1979).

[ 1 9 ] FLUORESCENCE-ACTIVATED CELL SORTING 219
lengths excites less autofluorescence. Taking advantage of this means, first, detecting dye fluorescence through proper band pass filters centered on the main emission range of the dye as described above and, second, bringing red dye systems into fully routine use. One limitation on signal improvements with redder dyes is the decrease in the quantum efficiency of normal PMTs at longer wavelengths so that more light is required to give a particular photoelectron signal.
Fluorescence Standards, Quantitation, and System Calibration
Tuning Samples. When aligning and tuning up a cell sorter it is very convenient to run a sample of uniform particles which give signals on each light scatter and fluorescence detector. Uniformity of the particles in light scatter properties and in fluorescence makes it easier to find optimum adjustment positions and helps to detect problems in the flow system or electronics that degrade measurement quality. In multiple fluorescence conditions we often use a mixture of two types of plastic microspheres as a tuning and calibration sample (e.g., Polysciences, Inc. Cat. No. 9719 and 7769).
Calibration. In order to make valid comparisons from one experiment to another it is useful to have standard calibration conditions so that a particular signal level corresponds to a constant amount of dye per cell. This can be accomplished by adjusting the signals from stable calibration particles to a standard output level. As long as the excitation wavelength and the emission filters and detectors are not changed, it is not necessary that the fluorescence spectrum of the calibration particles match that of the relevant cell labeling dye.
Standardization. True standardization that will allow valid compari- sons of staining levels from one machine or laboratory to another is best accomplished with particles whose fluorescence spectrum is the same as that of the dye being standardized. At present there is no accepted set of stable reference particles with spectra matching immunofluorescence la- bels, but such a set would be quite useful.
Analytical Data and Data Processing
Signal Amplification
In a flow cytometer each cell generates electrical signals while cross- ing each laser beam (or other sensing area). These signals are amplified in linear or logarithmic fashion to yield output signals in the range of volt- ages that the rest of the electronics is designed to handle. The amplifica-

220 LYMPHORETICULAR CELLS [19]
tion usually includes some attenuation of frequency components outside the primary frequency range of the real signals thereby improving the signal-to-noise ratio. The choice between linear and logarithmic amplifica- tion depends on the range of signal levels to be measured and on the types of distributions we expect from the measurements. Logarithmic amplifiers are available for FACS signals which operate well over a 3.5-4.0 decade range (70-80 dB). We have found them to be very well suited to immuno- fluorescence measurements in which a single sample often includes cells with only their autofluorescence, stained cells a few times that bright and stained ceils hundreds of times as bright. A logarithmic amplifier gives good resolution over the whole range. In addition, stained cell popula- tions in logarithmic displays tend to have a symmetrical shape which is helpful in choosing break points between populations for analysis and sorting. What these more "normal" distributions may mean biologically is discussed in the next section.
Logarithmic amplifiers require occasional adjustment to set the output characteristics to give a chosen number of channels between signals that are, for example, a factor of 10 apart. On the other hand, in day-to-day and sample-to-sample operation they require no gain changes or other manipulation.
Linear amplifiers are appropriate for signals that vary over a relatively small range and/or represent biologically linear processes. Most measure- ments of light scatter or cellular DNA content fall in this category. Figure 5 shows a comparison of logarithmic and linear displays of some dual im- munofluorescence data. Dot displays as illustrated in the left panels of the figure represent each cell as a dot located at a point whose x coordinate corresponds to one of the signals derived from the cell and whose y coordinate corresponds to the value of a second measurement on the same cell. Such displays are commonly used to provide immediate visual- ization of two parameter data and are quite valuable for monitoring cell sorter operation. The contour plots illustrated in the right panels of Fig. 5 show the same data in the form of topographic maps of the two dimen- sional histograms of the data. In our experience it is usually easier to distinguish subpopulations of cells and to evaluate and interpret their characteristics when immunofluorescences are displayed logarithmically.
Biological Implications of Log-Normal Data
While we originally began to use logarithmic amplifiers for immuno- fluorescence data just to handle the wide range of observed signals without continual changes in amplifier gain, we have concluded that logarithmic processing is in fact more appropriate biologically in many cases. Statisti- cally speaking (based on the Central Limit Theorem), a signal that results from the sum of many randomly varying quantities tends to give a normal

[19] FLUORESCENCE-ACTIVATED CELL SORTING 221
Log IgM
!,
I .
20
Linear IgD
b 1000 I
i00~ IgD ]
f I )., I
1 I0 100 IgM
15
IgD
10
Log IgD
I
1000
d i s t r i b u t i o n whi le a s ignal r e su l t ing f rom a p r o d u c t o f r a n d o m va r i ab l e s t ends to g ive a l o g - n o r m a l d i s t r i b u t i o n (which looks l ike a n o r m a l d i s t r ibu- t ion in a l o g a r i t h m i c d i sp l ay ) . F o r e x a m p l e , if a cell su r face an t igen w e r e p r o d u c e d b y a n u m b e r o f d i f fe ren t p a t h w a y s w h o s e c o n t r i b u t i o n v a r i e d f rom cel l to cel l , the d i s t r i b u t i o n o f an t igen p e r cell shou ld t end to a no rma l d i s t r i bu t ion . I f the a m o u n t o f the an t igen on the su r face we re c o n t r o l l e d by the mu l t i p l i ca t i ve e f fec t s o f a se r ies o f s y n t h e s i s and t rans- po r t r a t e s , a l og -no rma l d i s t r i bu t i on shou ld resu l t . The l a t t e r is much c l o s e r to ou r u n d e r s t a n d i n g and e x p e c t a t i o n s for mos t cell su r face an- t igens .
FIG. 5. Logarithmic vs linear dot displays and contour maps of dual immunofluorescence data. Mouse spleen cells were stained with fluorescein-conjugated antibody to lgM and biotin-conjugated antibody to IgD which was revealed by a second step of Texas Red avidin. Measurements were made with a two laser FACS. All of the fluorescence data were light scatter gated on the main lymphocyte population. In (a) and (c) each dot represents the measurements on one cell. (b) and (d) show contour plots of the logarithmic and linear data, respectively, with constant "vertical" spacing between contours. The rectangular boxes and broken lines enclose corresponding regions (i.e., the same cell populations) in the two displays.
0 Linear IgM 0 10 20 30 40 50 60 70
IgM
222 LYMPHORETICULAR CELLS [19]
Our observations are that immunofluorescence distributions often look approximately "normal" in logarithmic display. In such cases any statistical tests that assume normal distributions are better performed on the logarithmic data. 5~
Data Storage Format and Preliminary Data Reduction
In flow cytometric work the usual way to record information on a sample is to compile digitized measurements on a statistically adequate number of cells into a data file representing that sample. Cell measure- ments are stored as histograms or as lists with a digital value for each measurement on each cell. The choice between histogram and list mode storage is based mostly on the amount of storage space required. This in turn depends on the channel resolution of the digitized data, the number of measurements per cell, and the number of cells recorded per sample. Histograms are preferable when the data space is densely populated (i.e., when the number of cells in the data set is large compared to the number of elements required for a histogram), while listing is better when the data space is sparsely populated. Under typical flow cytometry conditions of 5000 to 100,000 cells per sample and 8 to 10 bit resolution in each mea- surement, histograms give more efficient storage of one-dimensional data while list mode storage is best for three or more dimensional data. The efficiencies are roughly comparable for two-dimensional data.
When multiparameter data are being generated it is often desirable or necessary to perform preliminary data reducing steps before storing the remaining data. For example, if data storage is in list mode we may exclude objects whose forward light scatter signal is too low for a live cell. Or we may set a live cell window on a PI measurement and not store data from dead cells or even the actual PI data from live cells thus saving data storage space.
One-dimensional histogram storage means that only one parameter of the data can be stored. Other measurements can only be used as window- ing parameters which control storage of data on each cell but which are not stored themselves.
List mode storage has several advantages over immediate reduction to one dimension for histogram storage. Cell analysis operation of a FACS can be made more efficient since immediate data analysis decisions are minimized and data can be taken as long as the monitoring displays indi- cate that the machine is running properly so that "good" data will be taken. The ability to "recreate" the experiment from list mode data means that acceptance ranges set on some parameters for data analysis can be adjusted and optimized later.
5J D. F. Heath, Nature (London) 213, 1159 (1967).

[ 1 9 ] FLUORESCENCE-ACTIVATED CELL SORTING 223
Data Recovery and Auxiliary Information
The long-term usefulness of stored data is enhanced considerably by storage of "notebook" type information on each sample. This can be simple machine information on amplifier gains, etc., but full protocol information on the cells, stains, etc. used to generate the sample is part of the retrievable data in at least one recently implemented system (W. Moore, personal communication).
Data Displays in One and Two Dimensions
Often the most helpful tool in the analysis of complex data is a good visual display. One-dimensional data are conventionally displayed as a histogram of cell frequency in each signal brightness interval. Linear histograms of immunoftuorescence data tend to have large numbers of cells concentrated in the lowest channels and/or falling off the top of the distribution. Logarithmic displays tend to be easier to estimate visually since it is normally possible to have both unstained cells and brightly stained cells well on scale in a single display. It is also easy to define reasonable separation points between the relatively symmetrical peaks corresponding to different populations.
Two-dimensional data can be displayed in several ways including dot displays as illustrated (Fig. 5) and "fishnet" drawings (perspective views of transects) which look like a net draped over a two-dimensional histo- gram of the data. Fishnet drawings viewed in perspective make it easy to visualize the two-dimensional histogram, but we have not found them to be very useful in defining conditions for further analysis. Contour maps as illustrated in Fig. 5 are not so easy to visualize at first, but they can be used more easily to compare different data sets and to define regions for numerical analysis. The spacing between the contour levels in Fig. 5 is a constant, but other contour spacings have been used with some success. Figure 6 shows a single data set displayed with four different contour level definitions. We are finding good results with the method illustrated in Fig. 6B which places contour planes on the two-dimensional histogram so that a constant fraction of the total cells is found between adjacent contours. This assures that minor cell populations will be marked by at least a few contours while major populations are not obscured by an unreadable num- ber of contours.
Three-or-More Dimensional Data
Data with more than two measurements per cell is difficult to display or visualize in its entirety, but it can be dealt with effectively, especially in cases where the measurements can be divided into relatively independent

224 LYMPHORETICULAR CELLS [19]
", , 14+ , . I N , . P . ~ , . p . w , . Iz.~+, I Del, m¢ [ cbl tllllJr
. . . . . . . . l L 12 ' " ~ ' " h m . . . . . . . . h m . . . . . . . .
_a
e l e . , . 14e,. F w , , I L ~ 11~,. Iz.~,. I P r o b o l : , [ l ~r.y l i lg '
J |
ga "S 1.1 . . . . . . . . h 12" " I , d " ' h u . . . . . . . . h w " " . . . . .
?
C II ~I 1211 l m . ~ , , , 14~--.--I+ , I g . . . . J . . . . . J ~ , l , J.~_ L , l Logor tr.l~t~ ~ g
+" , .)I)I
1.1 " " '" '"1 "2"" S" ' l i" ' " . . . . m ' ' ' ' . . . .
1 9 M / £ l ( F t u o r e s c e ( n )
o I " 14" l U la21 I a'=' 12m I
12 l.n ........ la 12" )~'"ho ........ hw ........
I ~ P 1 / £ 1 [ F t u o r e s c e t n ~
FIG. 6. Four different contouring algorithms applied to a single dual immunofluorescence data set. Mouse spleen cells were stained for IgM and IgD and measured on a two laser FACS• The first method gives the ordinary uniform contour spacing (A). In probability contouring (B) the region between adjacent contour levels includes a constant fraction of the cells (10% in this case)• In the logarithmic spacing display (C) each contour level is twice as high as the previous one. The equal area contours (D) are defined to give equal parts of the area of the final two dimensional display (10% in this case) to the region between each successive pair of contour lines.

[19] FLUORESCENCE-ACTIVATED CELL SORTING 225
sets. For example, a 5 measurement system might include forward light scatter, large-angle light scatter, propidium iodide fluorescence (marking dead cells), fluorescein immunofluorescence, and Texas Red immuno- fluorescence. First, we would delineate the cell populations of interest on a two-dimensional display of forward scatter vs large angle scatter (like that illustrated in Fig. 2), eliminating most dead cells, debris, and aggre- gated cells. Then, one-dimensional gating to eliminate PI positive cells removes the remaining dead cells from the selected populations. We could then display the immunofluorescence measurements on each popu- lation of viable cells as a fluorescein vs Texas Red contour plot (as shown in Fig. 5). Analysis of these displays would then lead to numerical results and/or definition of sorting windows, depending on the experiment.
When groups of measurements are not conveniently divided into one- or two-dimensional subgroups, such as in three color immunofluores- cence work, several iterations of analyses among the dimensions may be necessary. With such data "smarter" computer analysis to help reveal and delineate cell populations would be desirable, but as yet we know of no system that is generally applicable to cell sorter data.
Extraction of Numerical Results
The common numerical values used to characterize immunofluores- cent populations are a fraction of the total cells in the population, bounds of the population in various dimensions, and signal level statistics for the population (including mean, median, variance, and coefficient of varia- tion). Defining the division between "positive" and "negative" cells in a sample is often difficult, so that the specific criterion used should be specified in any publication quoting percentage positive cells, etc.
Means calculated on logarithmic data are geometric means with re- spect to the original data. In making certain comparisons, such as average cell fluorescence by FACS and bulk fluorometry, a mean of linear data is appropriate, but for characterizing a cell population that appears rela- tively symmetrical in logarithmic display the mean of the logarithmic data is probably more representative of the typical cell in the population than the linear mean.
Sorting
Sort Decision Making
The transition from cell analysis to sorting is conceptually simple, but actually carrying it out involves further considerations which are the sub-

226 LYMPHORETICULAR CELLS [19]
ject of this section. Understanding these considerations is important in making the best use of cell sorting in particular applications.
Sort decisions can be based on any combination of measurements that can be made in a system designed for sorting. The simplest and most common way to select cells for sorting is to set an acceptance range on each measurement channel and to require each signal from a cell to fall within the acceptance range on the appropriate channel. This defines a rectangle in two dimensions, a rectangular box in three dimensions, etc. Since discrete cell populations tend to have shapes other than rectangles in two parameter displays, sort definitions involving arbitrary polygons, ellipses, or more general shapes would often be useful. In fully computer- ized systems very general sorting criteria can be defined (with the limita- tion that a sort decision must be reached before the cell traverses the length of the jet and is incorporated into a drop).
Drop Forming Processes and Effects
Stabilization of the breakup of the liquid jet into droplets is accom- plished by imposing vibrations at a frequency near the natural drop forma- tion frequency of the jet. For typical jet velocities of 8-10 m/sec the drop formation frequency is about 40 kHz for a 50-~m-diameter jet and 20 kHz for a 100-~m jet. The jet velocity and drop formation frequency can be increased by increasing the pressure inside the nozzle, but the increase cannot be too large or cell viability will be impaired. The vibration fre- quency defines the number of drops produced per second setting an upper limit on the number of theoretically separable events. In practice the number of cells per second that can be sorted with good efficiency is only a fraction of the drop formation rate.
Number of Drops per Sort
Initial sorting decisions are made on a cell-by-cell basis, but execution of sorting requires drop-by-drop charging. In the normal sorting mode any drop which might contain a desired cell and cannot contain an unwanted cell is sorted. In practice several factors make it difficult to predict pre- cisely which drop a cell will be found in so that more than one drop must be assigned as a possible location for each cell. Loss of desired cells due to proximity of unwanted cells is minimized by assigning the smallest number of drops that will definitely contain a particular cell.
The factors limiting how well cells can be assigned to drops are (1) measurement uncertainty in setting the average delay between detection of a cell and breakoff of the drop containing it, (2) changes in the jet and breakoff conditions over time, and (3) the effect of the cells themselves on

[19] FLUORESCENCE-ACTIVATED CELL SORTING 227
the drop forming conditions. In passing through the jet forming orifice, cells behave differently from the surrounding fluid and induce a modula- tion on the jet which interacts with the cyclic modulation produced by the piezoelectric transducer. This changes the drop formation conditions add- ing uncertainty to the cell-to-drop assignment. 52 The amount of uncer- tainty produced increases for larger cells and decreases for larger jet diameter or higher piezoelectric vibration amplitude.
To maintain good recovery of sorted cells it is necessary that a desired cell always be found within the range of drops assigned to it, and con- versely high purity of sorted fractions requires that unwanted cells not be found outside their assigned drops. In practice, when we sort lympho- cytes with a 60- to 80-~m-diameter jet driven at 25-35 kHz, we find that as few as !.5 drops can be assigned per cell. This gives only -+0.25 drop cycle latitude for error in the cell-to-drop assignments, but with care proper conditions can be maintained for hours at a time. (Assigning 1.5 drops means that cells detected during half of the oscillator cycle are safely assigned to a single drop while ceils in the other half cycle might appear in either of two drops both of which must be assigned to the cell. Thus an average of 1.5 drops is assigned.)
Cell Flow Rate and Coincidence Losses in Sorting
In large scale sorting experiments a high cell flow rate is desirable to minimize the time needed to obtain the necessary number of sorted cells. This is particularly desirable in live cell work where cell viability and staining uniformity may decrease over time. The problem is that at higher cell flow rates the fraction of desired cells lost due to proximity of un- wanted cells ("coincidences") increases, thus diminishing the returns.
The theoretical recovery rate for given sorting conditions can be cal- culated as follows53 :
A desired cell will be found in one of the particular drops assigned to it. If that drop is not in the assigned proximity of an unwanted cell, the
52 R. T. Stovel, J. Histochem. Cytochem. 25, 813 (1977). ~3 This calculation assumes that all cells are properly analyzed and that there is no cell
clumping. Actual analysis electronics have some "dead" time following the appearance of a cell during which any new cells will not be analyzed. Real cell samples are likely to show some degree of clumping which results in a larger fraction of cells occurring close to other cells than would otherwise be expected. The result is to decrease actual recoveries some- what from the theoretical expectation. The sorting mode modeled in this calculation has been called coincidence "out" or "normal" by Becton Dickinson, "anticoincidence on" by Coulter, and "charge gate" by Ortho. For the Becton Dickinson coincidence " in" or "full deflection envelope," or Ortho "anticoincidence," the calculation is the same ex- cept that 2n replaces n in the equations.

228 LYMPHORETICULAR CELLS [19]
desired cell will be sorted and recovered. Assigning n drops per cell this condition is equivalent to having a region of n drops centered on the drop in question which does not contain the expected center position of any unwanted cells. At a drop frequencyfand running R cells per second with a fraction a of desired cells, the rate of unwanted cells is (1 - a)R. Assuming that cells appear randomly, the probability that any drop con- tains the expected center position of no unwanted cells is calculated from the Poisson distribution for zero events
e(0) = exp(-m) (5)
where m is the mean rate of events per drop which is in this case the ratio of the unwanted cell rate to the drop rate. Thus
m = (1 - a)R/ f (6)
The probability that the n drop region around a wanted cell contains no unwanted cell center positions is P(O) n so that the expected fraction of desired cells actually sorted and recovered E is
E = P ( O ) n = exp(-mn) = exp[-(1 - a)Rn/f] (7)
Thus, the cell flow rate giving any particular sorting efficiency is pro- portional to the drop formation rate and inversely proportional to the number of drops assigned per cell. The sorting rate S in cells per second is
S = aRE (8)
The recovery efficiency (expressed as percent) is illustrated in Fig. 7A as a function of cell flow rate for a particular choice of drop rate and fraction of desired cells. Note, for example, that the cell rate giving a particular recovery rate is twice as high for 1.5 drop sorting as for 3 drop sorting. Figure 7B shows the calculated absolute sorting rate for desired cells as a function of cell flow rate. The curves in Fig. 7C show the recovery efficiency and the recovery rate in generalized form as a func- tion of M (= mn above), the mean number of unwanted cells per sorting interval.
The choice of a cell flow rate depends somewhat on the availability of extra cells to be sorted and on the analysis dead time of the system. Actual recoveries may be significantly lower than estimated here if the electronic dead time in the anslysis system is long, or if there is consider- able clumping of cells in the sample. In general, we tend to use cell flow rates giving mean M of approximately 0.3 which gives an estimated 74% recovery and a cell collection rate 60% of the theoretical maximum. To cover all cell losses including cells remaining in the tubes, cells used to set up the initial sorting conditions, etc., we try to start with a sample twice

[19] F L U O R E S C E N C E - A C T I V A T E D C E L L S O R T I N G 229
A 1 0 0
s o
0 0 uJ r r
0
A 2000
1000
uJ ¢c 0
0
C
t i i ~ I I I i I I I i i i I J I I
0 5 10 15
CELL FLOW RATE (10 3 SEC -1)
/ /
/ / ' /
I i I I I ~ I ! ! I ! I ~ I I I I I
5 10 15
CELL FLOW RATE (103 SEC -1 )
1.0
0.5
/ /
i1/""
.,// "/
J ' I I I t , , ~ I ,
0 0 . 5 1 . 0
M
0 . 5
0 . 4 M X E
0.3
0 . 2
0.1
0
FIG. 7. Theoretical cell sorting recovery rates as a function of cell flow rate. (A) and (B) illustrate the expected sorting results for the particular situation of drop frequency 30,000 per second and a 20% population to be sorted. (A) shows the fraction of the input cells from the selected population that would be sorted with 1.5, 2, and 3 drops assigned to a cell. Note that for any particular percentage recovery rate the allowable cell flow rate is twice as high with i.5 drop sorting as with 3 drop sorting. (B) shows the sorting rate for selected cells in total cells per second. (C) shows the sorting efficiency (E) and a parameter proportional to the total sorted cell rate (M x E) in generalized form as a function of M, the mean number of unwanted cells per sorting interval. The straight broken lines in (B) and (C) show the total input rate for the selected cell population

230 LYMPHORETICULAR CELLS [19]
as large as would be needed to supply the required sorted cells at 100% efficiency.
Sorting Procedure Details
The following suggestions and comments are designed to help prevent some common problems in sorting and to clarify procedures.
Maintaining Cell Viability. If the system sheath fluid is just normal saline, cells can become unhappy during the time they are held in the sort collecting vessel. In such cases the collecting vessel should be prestocked with buffered medium containing extra protein (e.g., serum) so that good conditions can be maintained as cells and saline are added. It is also helpful to mix the liquid in the collection vessel occasionally. For more sensitive cells we use RPMI (without pH indicator dye) as sheath fluid. Some cell types, such as mouse splenocytes, retain best viability when both the cell supply tube and the sorted fractions are kept ice cold.
Drop Drive Interference with Optical Measurements. In jet-in-air in- terrogation systems the sort drop forming vibrations can produce ripples on the jet surface which give oscillations in the reflected/refracted band of light. The oscillations can appear as periodic noise on the detectors. This causes the most trouble when a fluorescence type detector is used to measure 90 ° light scatter, but fluorescence or forward light scatter detec- tors may also be affected. In our experience the disturbance of the jet at the laser interrogation point tends to be greater for large diameter jets than for small. Such interference can be decreased by lowering the ampli- tude of the drop forming vibration, but this may result in greater uncer- tainty in assigning cells to drops.
Charge Buildup in Collection Vessels. Since the deflected drops are electrically charged, a significant potential can build up on insulated col- lectors to the point of repelling newly sorted drops away from the vessel and even attracting oppositely charged drops from the other side in two fraction sorting. Normally only plastic vessels are good enough insulators to hold much charge. A grounded wire in contact with the liquid in the vessel will solve the problem.
Selecting the Optimum Sort Delay Setting. In order to sort at 1.5 drops per cell it is necessary to set the delay between cell detection and drop charging quite accurately. The appropriate delay can be estimated by measuring the drop-forming frequency and the distance between free drops to obtain a velocity and using that with a measurement of the distance from the laser-jet intersection to the drop breakoff point to give a delay time. However, because of electronic delays in the system, differ- ences between the free drop velocity and the cell-in-jet velocity, etc. a

[ 1 9 ] FLUORESCENCE-ACTIVATED CELL SORTING 231
correction must be added or subtracted to obtain the best delay estimate. Once established, the correction is a constant if the drop frequency, sheath fluid pressure, and laser-to-drop-breakoff distance are not changed too much. We measure the optimum delay by sorting easily identified microspheres at several delay settings near an initial estimate and count- ing the number of microspheres actually recovered. Sorting about 50 single drop deflections into a pool on a slide allows a good estimate of the recovery rate. The optimum delay can be found by fitting the counts at various delay settings using the model that the recovery should be 100% at the best delay setting, and it should fall linearly to 0% at delays one drop cycle longer or shorter than the optimum.
Sterile (Aseptic) Sorting. Sterile sorting can be carried out routinely with no great difficulty. In our laboratory there are usually 2 days of sterile sorting per week. Since collection vessels may be open to the air for many minutes during a sort, it is best to keep the surrounding areas clean and avoid air turbulence in the vicinity.
Reanalysis o f Sorted Fractions. It is often desirable to evaluate the purity of sorted fractions by reanalyzing a small portion of each fraction. Special care is required in cleaning the input lines leading to the nozzle since cells tend to remain after long sorts, and the sample for reanalysis is usually at low concentration. A good test is to run a "sample" of cell-free medium to see that very few extraneous cells will be included in the reanalysis.
Rare Cell Selection and Isolation
The FACS can be a very powerful tool in the identification and isola- tion of rare cells. The applications include enrichment of fetal cells from maternal blood, 54 selection of hybridoma variants producing different classes of immunoglobulin from the parent line, 45,55 isolation of cells in- corporating and expressing a new gene in DNA transformation, 56 and selection of cells with increased gene copy number. 57,~8
Multiparameter gating is very useful in eliminating artifacts due to dead cells, debris, etc. which would otherwise greatly outnumber the rare cells being sought. In selection of cells from tissue culture populations most of the artifacts would not grow in subsequent culture, but their elimination in the analysis makes it possible to identify the regions in ~4 G. M. Iverson, D. W. Bianchi, H. M. Cann, and L. A. Herzenberg, J. Prenatal Diagn. 1,
61 0981). 55 j. L. Dangl and L. A. Herzenberg, J. lmmunol. Methods 52, 1 (1982). ~6 p. Kavathas and L. A. Herzenberg, Proc. Natl. Acad. Sci. U.S.A. 80, 524 (1983). ~7 R. N. Johnston, S. M. Beverley, and R. T. Schimke, Proc. Natl. Acad. Sci. U.S.A. 80,
3711 (1983). s8 p. Kavathas, and L. A. Herzenberg, Nature (London) 306, 385 (1983).

232 LYMPHORETICULAR CELLS [19]
which rare cells should be sought more accurately and to make better estimates of the frequency of rare cells.
With cell populations growing in culture the selection process can include several cycles of sorting for enrichment with intervening growth periods. FACS direct cloning of selected rare cells is usually effective when they have been enriched to a frequency in the range of 0.1-0.01% of the total.
Estimates of the frequency of rare cell types can sometimes be ex- tended beyond what can be derived reliably from FACS analytical data alone by sorting a known number of selected cells into each well of a culture tray. For example, if secreted antibody from one hybridoma vari- ant can be detected in a well that was stocked with 25 cells, then a sort of 1 cell per I000 with 25 cells in each of 40 wells would give a frequency estimate among 1,000,000 (i.e., 1000 x 25 x 40) cells examined. 59
Special sorting modes are sometimes useful in selecting extremely rare cells. These include "coincidence override" mode, in which the drops assigned to a desired cell are sorted without regard to what other cells may be carried along, and fluorescence triggering mode in which low fluorescence cells are ignored by the electronics. Fluorescence triggering is useful only if the cells being sought are part of a small proportion of brighter fluorescent cells. These modes allow the use of high cell flow rates that would lead to unacceptable analysis and/or sorting coincidence losses in normal sorting. In appropriate cases we have obtained useful enrichment of cells present at frequencies of a few in 108 by sorting at a flow rate of 30,000 cells per second. In such cases pure samples can be obtained by resorting the cells obtained in the first sort using normal sorting conditions.
Applications in Lymphoid Cell Analysis
Characterization of Lymphoid Cell Subpopulations
For all their diversity of function most lymphocytes look pretty much alike. FACS analysis and sorting using a variety of monoclonal antibodies to cell surface molecules oflymphocytes are now making it possible for us to define and study functional lymphoid subpopulations with a precision that is not available from other techniques. In particular, quantitative multiparameter measurements of light scatter and two or more immun0- fluorescences are revealing subpopulations that are not uniquely defined by any single antigen/monoclonal antibody.
59 T. J. Kipps and L. A. Herzenberg, in "The Handbook of Experimental Immunology" (D. M. Weir, L. A. Herzenberg, and C. C. Blackwell, eds.), 4th ed. In press.

[19] FLUORESCENCE-ACTIVATED CELL SORTING 233
Here we will discuss primarily work in our laboratory on mouse lymphoid cell subpopulations, but similar work has been done on human lymphoid cells, often with strikingly parallel results. 6° The original dis- tinction between B and T cells using heterologous antisera to immunoglob- ulin or the Thy-! antigen led to FACS sorting of each type and initial functional studies. T cell subsets including helper or suppressor/cytotoxic functions were found using cytotoxic antisera, but monoclonal antibodies have facilitated more detailed study.
In our laboratory FACS analysis was used to screen hundreds of unselected hybridomas for production of antibodies binding to lympho- cyte subpopulations. 6~ This allowed concentrated efforts on the most promising hybridomas which turned out to include cell lines producing antibodies to Thy-1, Ly-l(Lyt-l) , and Lyt-2, among others. FACS studies with these antibodies 62,63 showed that Lyt-2 is represented on a fraction of Thy-1 positive spleen and lymph node cells, and that the amount per cell is rather uniform. Antibody to Ly-1 stained a number of cells about equal to the total Thy-1 positive population, although the range of staining brightness among Ly-1 positive cells was large. The implication from these results that Lyt-2 positive cells in spleen or lymph node are also Ly- 1 positive was in conflict with expectations from previous cytotoxicity- based studies. Studies were undertaken using cytotoxicity plus FACS analysis, additive staining with FACS analysis and two color FACS anal- ysis to resolve the question. 63
Cytotoxic depletion with various concentrations of antibody to Ly-I plus complement followed by staining with a different antibody to Ly-1 and FACS analysis showed that, in general, the cells with larger amounts of Ly-1 were more susceptible to lytic attack with anti-Ly-1. Samples stained with anti-Ly-1 alone were compared with samples additively stained with anti-Ly-1 plus anti-Lyt-2 plus anti-Lyt-3. (Anti-Lyt-3 was added just to increase staining brightness since it stains the same cell population as anti-Lyt-2.) The other antibodies did not add any cells to the number stained by anti-Ly-1 alone, but they did remove cells from the dull staining portion of the Ly-1 staining histogram, resulting in a new brightly stained peak in the distribution. This indicates that the Lyt-2 positive cells
~ J. A. Ledbetter, R. L. Evans, M. Lipinski, C. Cunningham-Rundles, R. A. Good, and L. A. Herzenberg, J. Exp. Med. 153, 310 (1981).
61 j. A. Ledbetter and L. A. Herzenberg, lmmunol. Rev. 4"7, 63 (1979). 6z H. S. Micklem, J. A. Ledbetter, L. A. Eckhardt, and L. A. Herzenberg, in "Regulatory T
Lymphocytes" (B. Pernis and H. J. Vogel, eds.), p. 119. Academic Press, New York, 1980.
63 j. A. Ledbetter, R. V. Rouse, H. Spedding Micklem, and L. A. Herzenberg, J. Exp. Med. 152, 280 (1980).

234 LYMPHORETICULAR CELLS [19]
are Ly-1 positive but tend to have low levels of Ly-1. Two color staining with fluorescein-labeled anti-Lyt-2 and rhodamine-labeled anti-Ly-1 also indicated that the Lyt-2 positive cells carry low amounts of Ly-1. At that time we had only a single laser fluorescein/rhodamine system for two color immunofluorescence. 47 The two color staining and additive staining were both used since two color staining, although easily interpreted, gave suboptimal data quality, while additive staining gave good measurements whose interpretation was more difficult.
As described above (Fluorescence Measurement Systems), systems are now available which give uncompromised dual immunofluorescence measurements. Our two laser dual immunofluorescence system has been used to define several mouse B cell subpopulations which do not have known unique antigenic markers. The original subsets were defined on the basis of quantitative dual immunofluorescence for IgM and IgD. Compar- ing staining patterns among cell samples derived from different lymphoid tissues, different mouse strains and individuals of different ages, it was possible to discern three different but antigenically overlapping popula- tions. 64,65 These were designated populations I (lgD high, lgM low), II (IgD high, IgM high), and II1 (IgD low, IgM high).
The dual immunofluorescence system has also allowed us to identify a Ly-1 positive B cell population whose relatively bright staining for IgM separates it from the IgM negative cells with similar Ly-1 staining. 44 As illustrated in Fig. 8 real staining for Ly-1 is present even though the population is not fully resolved from IgM positive, Ly-1 negative cells. It has been known for some time that spleen cells from NZB "autoimmune" mice secrete IgM in vitro. FACS sorting and culture of Ly-1 B cells from such mice has shown that this small fraction of the B cells probably accounts for all of the "spontaneous" IgM secretion. 44
In some cases even dual immunofluorescence cannot readily resolve antigen expression patterns. In our efforts to characterize expression of the recently defined antigen BLA-1 (recognized by the monoclonal anti- body 53-10.1), two color analysis of BLA-1, IgM, and IgD by pairs did not yield an unequivocal determination of the relative expression of the three antigens. To obtain full information cells were stained for all three anti- gens, and measurements were taken on the system diagrammed in Fig. 4C. zz CBA spleen cells were stained with fluorescein anti-IgM, biotin anti- IgD revealed by phycoerythrin avidin, and allophycocyanin anti-BLA-1. Figure 9 illustrates the analysis.
64 R. R. Hardy, K. Hayakawa, J. Haaijman, and L. A. Herzenberg, Nature (London) 297, 589 (1982).
65 R. R. Hardy, K. Hayakawa, J. Haaijman, and L. A. Herzenberg, in "Immunoglobulin D: Structure and Function" (G. J. Thorbecke and G. A. Leslie, eds.), p. 112. New York Acad. Sci., New York, 1982.

[19] FLUORESCENCE-ACTIVATED CELL SORTING 235
3 'I g I
. J
I~M/£1 CFluoresceln3
? $ ..J
I9M/£l CFtuoresce in)
FIG. 8. Demonstration of Ly-I B cells by two-color FACS analysis. (A) shows NZB spleen cells stained with fluorescein anti-lgM and biotin anti-Ly-I revealed by Texas Red avidin. The box encloses IgM bright, Ly-I positive cells. (B) shows a control staining in which the biotin reagent is anti-Lyt-2. In this case very few cells are found in the boxed region. NZB mice tend to have more Ly-I B cells than most other mouse strains.
Two color analyses had shown that all IgM-bearing (B) cells in the spleens of young (2 week) mice express the BLA-1 antigen whereas the majority of B cells in adult (>2 month) spleen do not express this antigen. Three color analyses with IgM/IgD and BLA-I demonstrated that popula- tion I B cells (the late-arising B cell population) constitute this BLA-1 negative group. Interestingly, the IgM/IgD pattern of the BLA-1 positive cells in adult spleen is very similar to the IgM/IgD pattern of B cells from spleens of young mice. This result suggests to us that these BLA-1 posi- tive B cells found in adult spleen are less "mature" compared to BLA-I negative B cells.
Phenotyping of Leukemias Using Cell Surface Markers
Identifying the type of proliferating cell in lymphoid neoplasms is important in making an accurate diagnosis, in predicting clinical charac- teristics, and in understanding the biology of the disease. 66 Patient groups based on cell morphology and enzyme histochemistry have not been ade- quate to guide staging and treatment. Staining with a panel of monocional antibodies offers promise of more consistent grouping. FACS measure- ments can be particularly valuable in some cases since light scatter mea-
6~ R. A. Warnke and M. P. Link, Annu. Rev. Med. 34, 117 (1983).

236 LYMPHORETICULAR CELLS [19]
_l
o ¢n
ol!
i , u.
|
Prolxlb t t ~r.~ d llllt
"""IsiG"' h ' i " "I1~"" ~u ' "12"~' ' I~'m"" I~'~"" J
. L A - 1 ( , ,ec)
A
B 1 Protxlb ( l It.y 2X
! " " ' " ' " h X'~'"'he " " " ' ""'hm" " " "-" I I ~M(F I )
(: " ] Probal)(| [r.y lSg
. s--
I. i . . . . . . . . h It " g " ' h e . . . . . . . . I~ee . . . . . . .
IsM(~I)
]
Probab f L [r44 111~
|
s
I., . . . . . . . I1 12' 1 s '"111 . . . . . . . . lain . . . . . . . .
l lM(Fn)
FIG. 9. Three-color immunofluorescence analysis for IgM, lgD and BLA-1 on CBA spleen cells. (A) shows an ungated display of BLA-1 vs forward light scatter with boxes enclosing BLA-1 negative and BLA-1 positive lymphocytes. (B) and (C) show lgM vs IgD displays of the BLA-1 negative and BLA-1 positive lymphocyte groups, respectively, as defined by the boxes in (A). (D) shows lgM vs IgD staining of spleen cells from a 2-week old CBA mouse. Note the similarity in pattern between the BLA-1 positive cells in the adult (C) a n d the total Ig positive cells in the juvenile.
surements and quantitative fluorescence can be used to identify a leuke- mic cell population and define its phenotype even though it is not the major cell population.
The basic results of phenotyping with various monoclonal antibodies have been (1) that each leukemia usually shows a single cell surface phenotype which is the same in initial presentation and in relapses, imply-

[19] FLUORESCENCE-ACTIVATED CELL SORTING 237
ing a lack of clonal evolution, and (2) that lymphomas and leukemias generally represent normal but arrested differentiation states, but some seem to have nonnormal phenotypes.
Such phenotyping has been useful diagnostically in distinguishing T CLLs, which express mature T cell markers of helper or cytotoxic/sup- pressor types and do not express thymic T cell antigens, from T ALLs which do express thymic markers. So far, typing for myeloid vs lymphoid cells and for T cell or non-T cell type among lymphoid cells has been shown to be important, but the clinical value of more detailed phenotyp- ing has not yet been proven (R. A. Miller, personal communication).
Detection of Small Numbers of Monoclonal B Lymphoeytes in Human Blood
Ault 67 has used FACS analysis of staining for K and ;~ immunoglobulin light chains on aliquots from a single blood sample to detect monoclonal B lymphocyte populations. Knowledge of such populations may be an im- portant clinical indicator in lymphoma patients. The basis for the test is that in normal human blood the distributions of staining for K and X light chains are broad and quite similar. A monoclonal B cell population typi- cally has a narrower distribution of staining and expresses only one light chain leading to a difference in the shapes of K and ;~ staining histograms.
Ault compared the histograms by normalizing them to the same num- ber of stained cells and calculating the Kolmogorov-Smirnov D statistic from the difference between the two cumulative frequency distributions. The statistic should be linearly related to the fraction of monoclonal cells in the sample. The test was found to detect monoclonal populations in the 10% range routinely and populations below I% in some cases. In tests on patients with lymphoid tumors, circulating monoclonal cells were found in a number of persons whose circulating cells were not detectably abnor- mal in the usual assays.
Other Applications
Amplification of the Gene for Dihydrofolate Reductase (dhfr)
FACS selection has been used to demonstrate and investigate sponta- neous changes in copy number of the dhfr gene. Similar techniques could be used to amplify genes in order to facilitate gene cloning, analyze gene products, etc.
The basic prerequisite is having a fluorescent probe which marks a product of the gene within or on the surface of viable cells. The FACS application involves sterile sorting and single probe analysis.
my K. A. Ault, N. Engl. J. Med. 300, 1401 (1979).

238 LYMPHORETICULAR CELLS [19]
The drug methotrexate inactivates the enzyme dhfr which is necessary for normal cell proliferation. Methotrexate-resistant cell lines derived by exposure to gradually increasing concentrations of the drug show in- creased dhfr gene copy number and correspondingly increased enzyme production. 68 Using fluorescein conjugated methotrexate as a probe for FACS selection Johnston et al. 57 have shown that gene copy number variants occur spontaneously and are not just a product of drug-induced metabolic stress. Chinese hamster ovary (CHO) cells were grown in me- dium supplemented to prevent toxic effects of the probe, and 10 cycles of FACS selection for the brightest 2-5% of the cells were carried out with 7- to 12-day growth periods between FACS sorts. The resulting cell popu- lations were 50 times as brightly staining as the parent and showed 40-fold amplification of the dhfr gene. Also cell lines previously drug selected for increased dhfr were FACS selected for increased or decreased dhfr. The FACS analysis data at each stage in the various selections made it possi- ble to estimate the increase or decrease in gene copies per cell division giving values of 0.02 for one drug-amplified population and 0.001 for a recent subclone from a nonamplified line.
Selection o f DNA Transfected Cells
Kavathas and Herzenberg 56 have used the FACS for efficient isolation and cloning of DNA transformed cells expressing cell surface molecules not expressed by the parent cell line. Thymidine kinase-deficient (TK-) mouse L cells were cotransformed with human DNA and herpes simplex virus TK gene. Culture in a selective medium (HAT) was used to elimi- nate cells which had not incorporated the TK gene. Cotransformation and growth in selective medium enriches for cells that have incorporated hu- man DNA since cells that accept any DNA tend to incorporate a lot including both human and TK genes. Aliquots of the surviving cells were stained with monoclonal antibodies to several human T cell differentiation antigens, and the brightest 0.1-0.5% of live cells were sorted and cul- tured. After growth the cultures were restained and bright staining cells were FACS cloned. This procedure yielded stable transformants for sev- eral T cell differentiation antigens including Leu-1 and Leu-2.
Several Leu-2 transformant lines have subsequently been selected for increased Leu-2 expression using the original selecting reagent and sev- eral cycles of FACS sorting. The resulting gene amplified lines contain many copies per cell of the Leu-2 gene and express up to 40 times as much Leu-2 protein as the original transformant. 58
The cell lines produced in this way are expected to be useful in gene cloning and in analysis of the gene products, and the selection techniques
68 p. C. Brown, R. N. Johnston, and R. T. Schimke, Symp. Soc. Dev. Biol. 41, 197 (1983).

[19] FLUORESCENCE-ACTIVATED CELL SORTING 239
are applicable to any cell surface molecule or other gene product that can be fluorescent labeled in viable ceils. It should be possible to carry out transformations without the drug marker and TK cotransformation, but in that case one or two more cycles of FACS selection and growth would probably be required.
Evaluation of lnducible Enzyme Activity in Single Cells by Measurement of Decreased Substrate Fluorescence
Flow cytometric analysis has been used by Watson 69 to monitor the kinetics of enzymatic production of fluorescent product from a fluoro- genic substrate. He was able to discriminate between cells from different cell lines at appropriate time points in a kinetic observation. Miller and Whitlock v° have taken a similar approach following the disappearance of an already fluorescent substrate to investigate factors affecting inducible enzyme activity in the aryl hydrocarbon hydroxylase (AHH) system which is involved in the metabolism of a variety of environmental contam- inants and carcinogens. They showed that after cells are exposed to the fluorescent substrate benzo[a]pyrene (BP), the rate of decrease in fluores- cence is directly related to aryl hydrocarbon hydroxylase activity in the cells. FACS measurement of the residual benzo[a]pyrene fluorescence (excitation 351 n m + 364 nm; emission near 405 nm) allowed them to select cells with high or low enzyme activity compared to the general population.
Using the Hepa lc lc7 mouse hepatoma cell line, which can be induced to increase AHH activity by exposure to chemicals such as benz[a]an- thracene or 2,3,7,8-tetrachlorodibenzo-p-dioxin (TCDD), they labeled both basal and induced cell samples with BP, and, after appropriate incu- bation to allow the substrate to be partially metabolized, they sorted fractions with high and low AHH activity. After 3-5 rounds of selection and growth populations were obtained with AHH activity significantly different from those of the parent populations.
Miller and Whitlock 7~ have also investigated the induction of AHH by TCDD as a function of inducer concentration and time of exposure. At a TCDD concentration giving maximal induction of Hepalc lc7 cells the population was found to be homogeneous with respect to the rate of induction, but at very low TCDD concentrations heterogeneity was ob- served in the rate of induction. In low activity variant clones (isolated after a combination of FACS sorting for low activity and selection by exposure to toxic concentrations of BP) induction heterogeneity was
69 j . V. Watson, Cytometry 1, 143 (1980). 7o A. G. Miller and J. P. Whitlock, Jr., J. Biol. Chem. 256, 2433 (1981). 71 A, G. Miller and J. P. Whitlock, Jr., Mol. Cell. Biol. 2, 625 (1982).

240 LYMPHORETICULAR CELLS [19]
found even with maximal inducing concentrations of TCDD. Sorting high activity cells from the induced heterogeneous populations resulted in pop- ulations which, after several weeks of culture, were again heterogeneous and indistinguishable from the original population implying that the he- terogeneity in induction sensitivity is transient and nonheritable. The au- thors suggest that the differences may be due to cell cycle phase.
Human Placental Cell Analysis and HLA mRNA in Trophoblast Cells
Work in our laboratory originating from efforts to isolate human fetal cells from maternal blood 54,72 has led to analysis of the cell populations found in the placenta 73 and to an investigation of the lack of cell surface HLA on the major cell population found in placental cell suspensions. Cell suspensions obtained by trypsin digestion of placental tissue were stained with Texas Red-labeled antibody to Trop-2 TM and with fluorescein- labeled antibody to a common framework determinant of HLA-A, B, and C. Two laser FACS analysis revealed 5 cell populations (Fig. 10). Only population A was actually positive for Trop-2; population B consisted of large, highly autofluorescent cells. Microscopy on sorted fractions showed population C to be erythrocytes while populations D and E in- cluded at least some white blood cells. Two-color FACS analysis with the HLA-A,B,C antibody and an antibody to a particular HLA type, in a case where the mother and fetus had an appropriate difference in that type, showed that populations D and E were of mixed fetal and maternal origin while population B was only fetal. Quinacrine Y-body analysis of sorted cell fractions (in a case where the fetus was male) indicated that popula- tions A and B were of fetal origin.
The most interesting observation was the lack of HLA antigen expres- sion on cells of population A, the major fetal-derived population. This may be related to maternal acceptance of the fetal allograft. The origin of this lack of HLA expression was traced by sorting population A cells with special care to maintain high purity and preparing messenger RNA from the cells. 75 In a Northern blot analysis with probes for HLA and /3z- microglobulin the cells were shown to be extremely low in HLA mRNA compared to other cells and somewhat low in fl2-microgobulin mRNA.
72 L. A. Herzenberg, D. W. Bianchi, J. Schroder, H. M, Cann, and G. M. Iverson, Proc. Natl. Acad. Sci. U.S.A. 76, 1453 (1979).
73 M. Kawata and L. A. Herzenberg, J. Exp. Med. (in press). 74 M. Lipinski, D. R. Parks, R. V. Rouse, and L. A. Herzenberg, Proc. Natl. Acad. Sci.
U.S.A. 78, 5147 (1981). 75 M. Kawata, K. Sizer, S. Sekiya, J. R. Parnes, and L. A. Herzenberg, Cancer Res.
(in press).

[19] FLUORESCENCE-ACTIVATED CELL SORTING 241
ProbcIb [ L t '~l 61~
A
, t . . . . . . . . h k ' 'lg'"lal . . . . . . . . tam . . . . ""* H L A
FIG. 10. Placental cell populations revealed by dual immunofluorescence measurements of Trop-2 and HLA. The antibody to HLA was directly fluoresceinated while the antibody to Trop-2 was biotin labeled and revealed with Texas Red avidin.
Thus the lack of H L A express ion on these cells is primarily due to tran- scriptional regulation of H L A chain message rather than to regulation of t ranspor t to the cell surface or other post transcript ional control.
Conclusions
Over the last several years the power of FACS analysis and sorting has been increasing rapidly in areas that are useful in work on lymphoid cell subpopulat ions and in the other areas discussed in this article. This has been due largely to the availability of an expanding array of mono- clonal antibodies, to the use of new dyes and measurement sys tems for immunof luorescence and to improvements in data handling sys tems to take advantage of the greater information generating capacity.
We look forward to continued expansion of analytical capabilities, including some additional measu remen t parameters , and to modest im- p rovement s in cell sorting rates. Eventual ly , detailed division of lymphoid cell populat ions into truly specific functional units should be possible with appropr ia te combinat ions of monoclonal antibodies.
Acknowledgments
We thank Mr. Wayne Moore for mathematical and computer discussions, Richard Stovel for his illustrations, Randy Hardy for discussions and figures, and Richard Sweet for his criticism of the manuscript. This work was supported by N.1.H. Grant GM-17367.
![A method for determining electrophoretic and …...[4,5]. Current techniques for measuring electrophoretic mo-bility include an electroacoustic method [6], electrophoretic light scattering](https://img.dokumen.tips/doc/110x75/5f08e22b7e708231d4242f99/a-method-for-determining-electrophoretic-and-45-current-techniques-for-measuring.jpg)