Embed Size (px)
Citation preview

1
Electronic Supporting Information:
Enzyme-free colorimetric assay of serum uric acid
Raj Kumar Bera, Anakuthil Anoop and C. Retna Raj*
Department of Chemistry, Indian Institute of Technology, Kharagpur 721308, India
Experimental Section
Materials. HAuCl4, NaBH4, 2-TU, and UA were purchased from Sigma-Aldrich. All
other chemicals used in this investigation were of analytical grade and used without
further purification.
Instrumentation. Electronic absorption spectra were recorded with CARY 5000 UV-
visible-NIR spectrophotometer. Fourier transform infrared spectroscopic (FTIR)
measurements were performed with Perkin Elmer FTIR spectrophotometer RX1. TEM
measurements were performed using JEOL Model JEM-2010 microscope with an
operating voltage of 200 kV.
Synthesis of 2-TU functionalized Au nanoparticles. In a typical synthesis, 40 µL of
HAuCl4 (30 mM) was mixed with 90 µL of 2-TU (1 mM) and 2.8 mL of water. The
reducing agent NaBH4 (70 µL of 22 mM) was added to the mixture under vigorous
stirring. The total volume of the sample was 3 mL and the final concentration of HAuCl4,
2-TU and NaBH4 was 0.4 mM, 30 µM and 0.51 mM, respectively. The stirring was
continued for 40 min. and the resulting wine red colored 2-TU functionalized Au
nanoparticle solution was stored at room temperature. The final concentration of HAuCl4,
2-TU and NaBH4 are 0.4, 0.03, and 0.51 mM, respectively. The molar ratio of 2-TU to
HAuCl4 is 0.075:1. The pH of the colloidal nanoparticles was measured to be 5.6.
Electronic Supplementary Material (ESI) for Chemical CommunicationsThis journal is © The Royal Society of Chemistry 2011
2
It should be mentioned here that the nanoparticles synthesized at higher
concentration (>30 M) were not stable, presumably due to the self-aggregation (please
refer the spectra given in ESI15 on page no 18) and they cannot be effectively used for
the sensing of UA.
Synthesis of unfunctionalized Au nanoparticles: In a typical synthesis, 70 µL of
NaBH4 (22 mM) was added to an aqueous solution containing 0.4 mM of HAuCl4 under
vigorous stirring and the stirring was continued for 40 min.
Synthesis of citrate-stabilized Au nanoparticles: Citrate-stabilized Au nanoparticles
were prepared according to the literature procedure with slight modification.1 Briefly, 0.9
mL of 39 mM of sodium citrate dihydrate was added to the boiling solution of HAuCl4
(9.1 mL, 0.9 mM) and stir for 30 min and the resulting wine red colored citrate-stabilized
Au nanoparticle stored at room temperature.
Sensing of UA. Typically, an aqueous solution of UA (5 L of 150 µM) was gradually
added to the colloidal 2-TU functionalized Au nanoparticle (3 mL) and the spectrum was
recorded after 1 min.
Real sample analysis. In order to minimize the matrix effect due to high molecular
weight proteins, the serum samples were diluted by 10 times and filtered using 3 kDa
molecular weight cut off (MWCO) micro-centrifuge filter. The filtered serum samples
(25 µL) were injected into 2-TU functionalized nanoparticles and the optical spectrum
was recorded after 1 min. After registering the spectrum, the sample was spiked with
known concentration of UA and recovery was calculated from the spectral response after
the spike.
1. G. Frens, Nature Phys. Sci., 1973, 241, 20.
Electronic Supplementary Material (ESI) for Chemical CommunicationsThis journal is © The Royal Society of Chemistry 2011
3
DFT calculations : The density functional calculation in gas phase were performed using
model system; 2-(methylthio)pyrimidine-4(3H)-one (MeTU) was chosen to represent 2-
TU functionalized nanoparticles. Because AA exist as a monoionic species at pH>4.2
(first pKa = 4.17, J. Am. Chem. Soc. 1935, 57, 1929), the ascorbate anion was considered
in the calculation. All geometris were fully optimized using TURBOMOLE program
package (TURBOMOLE V6.2 2010, a development of University of Karlsruhe and
Forschungszentrum Karlsruhe GmbH, 1989-2007, TURBOMOLE GmbH, 1989-2007,
TURBOMOLE GmbH, since 2007 available from http://www.turbomole.com). B97-D
functional in conjunction with def2-SVP bais set was used.
Electronic Supplementary Material (ESI) for Chemical CommunicationsThis journal is © The Royal Society of Chemistry 2011

4
Figure ESI1
(a) UV-vis spectrum, (b) TEM image and (c) particle size distribution plot of 2-TU
functionalized Au nanoparticles
360 480 600 720 840
0.2
0.4
0.6
0.8
1.0 (a)
Wavelength(nm)
Ab
sorb
an
ce
0 5 10 15 20 25 30 35 40 450
8
16
24
32
40(c)
Particle size, nm
Ab
un
dan
ce(%
)
Electronic Supplementary Material (ESI) for Chemical CommunicationsThis journal is © The Royal Society of Chemistry 2011

5
Figure ESI2
FTIR spectra of (a) 2-TU and (b) 2-TU functionalized Au nanoparticles.
Frequency Assignment
3350 cm-1
N–H stretching
3080 cm-1
C–H stretching
1700 cm-1
C=O stretching
1567 cm-1
N–H in plane bending
1000 2000 3000 4000
1567 cm-1
1567 cm-1
3080 cm-1
3080 cm-1
1700 cm-1
1700 cm-1
3350 cm-1
3350 cm-1
(b)
(a)
Wavenumber (cm-1
)
Tra
nsm
itta
nce
(%
T)
Electronic Supplementary Material (ESI) for Chemical CommunicationsThis journal is © The Royal Society of Chemistry 2011

6
Figure ESI3
TEM image of 2-TU functionalized Au nanoparticles in presence of UA (4 µM).
Electronic Supplementary Material (ESI) for Chemical CommunicationsThis journal is © The Royal Society of Chemistry 2011

7
Figure ESI4
UV-vis spectra of (a) citrate-stabilized and (b) unfunctionalized Au nanoparticles in
presence and absence of UA (10 µM). Inset shows TEM image Au nanoparticles. The
procedure for the synthesis of citrate-stabilized and unfunctionalized nanoparticles are
given on page 2 of ESI.
400 600 800 10000.0
0.5
1.0
1.5
2.0
2.5(a)
10 M
5 M
0 M
Wavelength(nm)
Ab
sorb
an
ce
480 600 720 840
0.2
0.4
0.6
0.8
1.0 (b)
Wavelength (nm)
Ab
sorb
an
ce
10 M
5 M0 M
Electronic Supplementary Material (ESI) for Chemical CommunicationsThis journal is © The Royal Society of Chemistry 2011
8
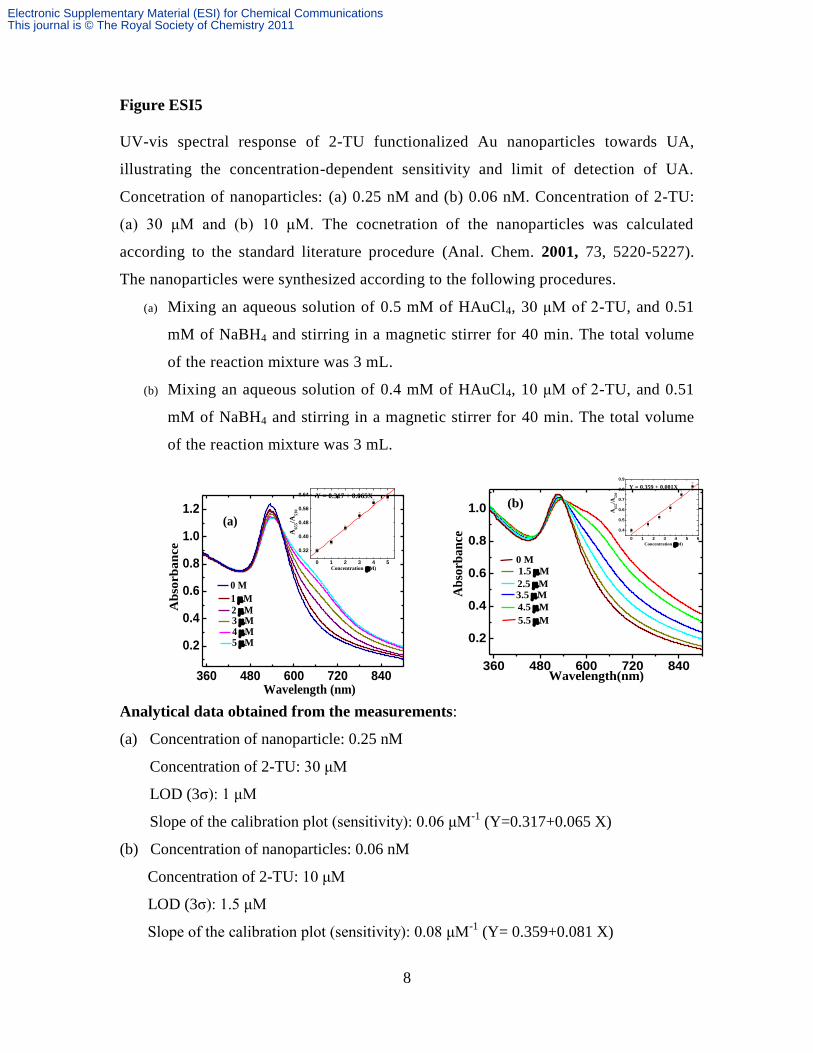
Figure ESI5
UV-vis spectral response of 2-TU functionalized Au nanoparticles towards UA,
illustrating the concentration-dependent sensitivity and limit of detection of UA.
Concetration of nanoparticles: (a) 0.25 nM and (b) 0.06 nM. Concentration of 2-TU:
(a) 30 μM and (b) 10 μM. The cocnetration of the nanoparticles was calculated
according to the standard literature procedure (Anal. Chem. 2001, 73, 5220-5227).
The nanoparticles were synthesized according to the following procedures.
(a) Mixing an aqueous solution of 0.5 mM of HAuCl4, 30 μM of 2-TU, and 0.51
mM of NaBH4 and stirring in a magnetic stirrer for 40 min. The total volume
of the reaction mixture was 3 mL.
(b) Mixing an aqueous solution of 0.4 mM of HAuCl4, 10 μM of 2-TU, and 0.51
mM of NaBH4 and stirring in a magnetic stirrer for 40 min. The total volume
of the reaction mixture was 3 mL.
Analytical data obtained from the measurements:
(a) Concentration of nanoparticle: 0.25 nM
Concentration of 2-TU: 30 μM
LOD (3σ): 1 μM
Slope of the calibration plot (sensitivity): 0.06 μM-1
(Y=0.317+0.065 X)
(b) Concentration of nanoparticles: 0.06 nM
Concentration of 2-TU: 10 μM
LOD (3σ): 1.5 μM
Slope of the calibration plot (sensitivity): 0.08 μM-1
(Y= 0.359+0.081 X)
360 480 600 720 840
0.2
0.4
0.6
0.8
1.0
1.2
5 M4 M3 M2 M
1 M
0 M
(a)
Wavelength (nm)
Ab
sorb
an
ce
0 1 2 3 4 5
0.32
0.40
0.48
0.56
0.64
A6
55/A
53
0
Concentration (M)
Y = 0.317 + 0.065X
360 480 600 720 840
0.2
0.4
0.6
0.8
1.0
5.5 M
4.5 M
3.5 M2.5 M
1.5 M
0 M
(b)
Wavelength(nm)
Ab
sorb
an
ce 0 1 2 3 4 5 6
0.4
0.5
0.6
0.7
0.8
0.9
Y = 0.359 + 0.081X
Concentration (M)
A6
55/A
53
0
Electronic Supplementary Material (ESI) for Chemical CommunicationsThis journal is © The Royal Society of Chemistry 2011

9
Figure ESI6
UV-vis spectra of 2-TU functionalized Au nanoparticle in presence of different
concentrations of UA. Inst shows the calibration plot. Different concentrations of UA
were individually added to the sample vials of freshly prepared functionalized
nanoparticles.
480 600 720 840
0.2
0.4
0.6
0.8
1.0
Wavelength(nm)
Ab
sorb
an
ce
0 1 2 3 4
0.4
0.6
0.8
1.0Y=0.36+0.17x
Concentration (M)
A6
55/A
53
0
Electronic Supplementary Material (ESI) for Chemical CommunicationsThis journal is © The Royal Society of Chemistry 2011

10
Figure ESI7
UV-vis spectra of 2-TU functionalized nanoparticles in the presence of UA (2.5 µM) at
different time intervals.
480 600 720 840
0.2
0.4
0.6
0.8
1.0
10 min
5 min
1 min
Wavelength(nm)
Ab
sorb
an
ce
Electronic Supplementary Material (ESI) for Chemical CommunicationsThis journal is © The Royal Society of Chemistry 2011

11
Figure ESI8
(a) Absorption spectra illustrating the selectivity of the optical sensing method towards
UA using 2-TU functionalized Au nanoparticles and (b) Plot illustrating the selectivity
of UA assay. The ratio of A655/A530 is plotted against analyets. Concentration of the
analytes: 0.1 mM each.
400 600 800 10000.0
0.2
0.4
0.6
0.8
1.0
NaClGlucose
l-DOPA
APAA
DA
UA
Wavelength(nm)
Ab
sorb
an
ce
0.2
0.4
0.6
0.8
1.0
NaC
lA
AD
AUA
AP
L-D
OPA
Glu
cose
A6
55/A
53
0
Electronic Supplementary Material (ESI) for Chemical CommunicationsThis journal is © The Royal Society of Chemistry 2011

12
Figure ESI9
Structure of 2-(methylthio)pyrimidin-4(3H)-one and ascorbate anion.
HN N
S
CH3
O
2-(methylthio)pyrimidin-4(3H)-one
OO
HO
HO
O OH
Ascorbate
Electronic Supplementary Material (ESI) for Chemical CommunicationsThis journal is © The Royal Society of Chemistry 2011

13
Figure ESI10
The hydrogen bonding interaction UA with the MeTU based on the DFT calculation. The
theoretical calculation indicates that up to 6 units of MeTU can have favorable hydrogen
bonding interaction with one molecule of UA.
Electronic Supplementary Material (ESI) for Chemical CommunicationsThis journal is © The Royal Society of Chemistry 2011
14
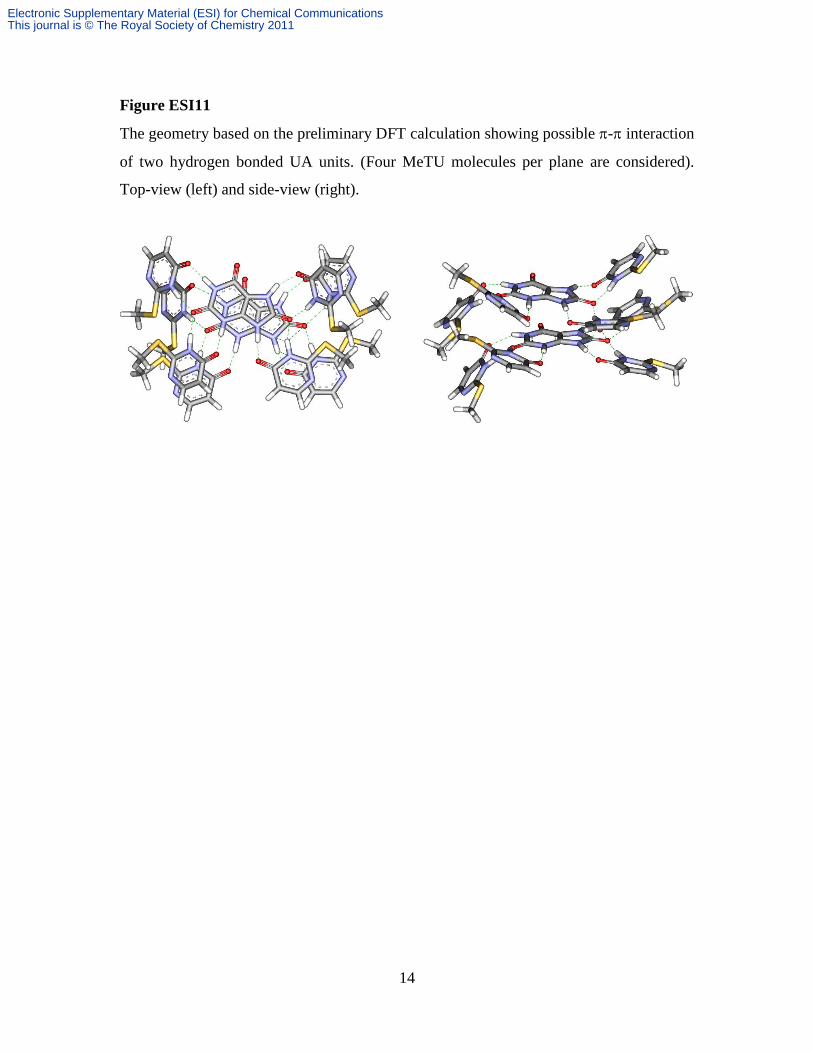
Figure ESI11
The geometry based on the preliminary DFT calculation showing possible - interaction
of two hydrogen bonded UA units. (Four MeTU molecules per plane are considered).
Top-view (left) and side-view (right).
Electronic Supplementary Material (ESI) for Chemical CommunicationsThis journal is © The Royal Society of Chemistry 2011
15
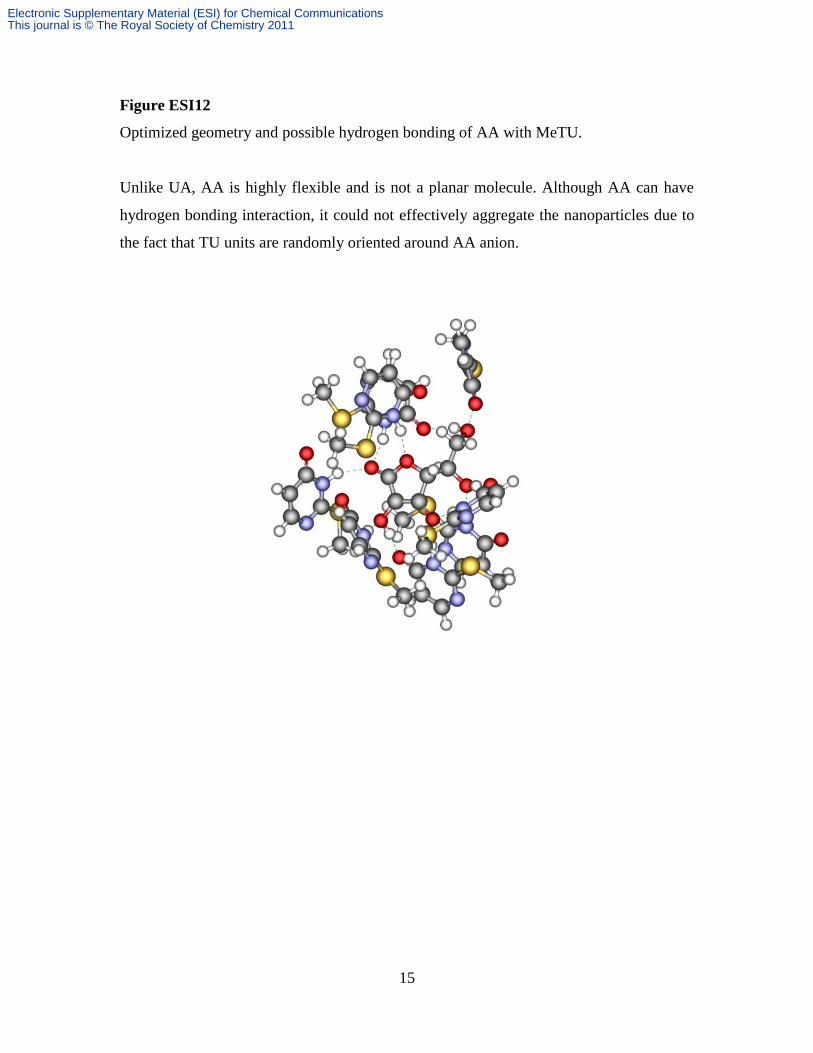
Figure ESI12
Optimized geometry and possible hydrogen bonding of AA with MeTU.
Unlike UA, AA is highly flexible and is not a planar molecule. Although AA can have
hydrogen bonding interaction, it could not effectively aggregate the nanoparticles due to
the fact that TU units are randomly oriented around AA anion.
Electronic Supplementary Material (ESI) for Chemical CommunicationsThis journal is © The Royal Society of Chemistry 2011

16
Figure ESI13
UV-vis spectral profile illustrating the selectivity of the colorimetric method. Different
concentrations of interfering analyte (a) glucose and (b) 4-acetamidophenol were
progressively added to the functionalized nanoparticles.
400 600 800
0.2
0.4
0.6
0.8
1.0 (a)
Wavelength(nm)
Ab
sorb
an
ce
100 M
80 M
60 M 40 M 20 M 0 M
480 600 720 840
0.2
0.4
0.6
0.8
1.0(b)
Wavelength(nm)
Ab
sorb
an
ce100 M
80 M 60 M
40 M
20 M 0 M
Electronic Supplementary Material (ESI) for Chemical CommunicationsThis journal is © The Royal Society of Chemistry 2011

17
Figure ESI14
Absorbance vs time plot at 655 nm in presence of real sample analysis.
0.0 0.2 0.4 0.6 0.8 1.0
0.29
0.30
0.31
0.32
0.33
0.34
Time (min)
Ab
sorb
an
ce a
t 6
50
nm
Electronic Supplementary Material (ESI) for Chemical CommunicationsThis journal is © The Royal Society of Chemistry 2011

18
Figure ESI15
UV-vis spectra of Au nanoparticles synthesized at different concentration of 2-TU.
The above spectra illustrate the self-aggregation of nanoparticles while increasing the
concentration of 2-TU. The surface plasmon band gradually shifts to higher wavelength
side and the spectral response is very broad, possibly due to the self-aggregation of the
nanoparticles. The colloidal nanoparticle is not stable for long time; the particles
gradually settle down in the sample vial.
360 480 600 720 840
0.2
0.4
0.6
0.8
1.0
90 M
80 M
70 M
50 M
40 M
30 M
10 M
Wavelength(nm)
Ab
sorb
an
ce
Electronic Supplementary Material (ESI) for Chemical CommunicationsThis journal is © The Royal Society of Chemistry 2011