Embed Size (px)
Citation preview

Low Temperature Physics/Fizika Nizkikh Temperatur, 2014, v. 40, No. 4, pp. 389–399
Electronic structure, Fermi surface and dHvA effect in YIn3, LuIn3, and YbIn3
V.N. Antonov Institute of Metal Physics, 36 Vernadsky Street, 03680 Kiev-142, Ukraine
E-mail: [email protected]
Received June 26, 2013
The electronic structure, Fermi surface, angle dependence of the cyclotron masses and extremal cross sections of the Fermi surface of RIn3 (R = Y, Lu, and Yb) compounds were investigated from first principles using the fully relativistic Dirac linear muffin-tin orbital method. The effect of the spin-orbit (SO) interaction and Cou-lomb repulsion U in a frame of the LDA+SO+U method on the Fermi surface, orbital dependence of the cyclo-tron masses, and extremal cross sections of the Fermi surface are examined in details. A good agreement with experimental data of cyclotron masses and extremal cross sections of the Fermi surface was achieved.
PACS: 75.50.Cc Other ferromagnetic metals and alloys; 71.20.Lp Intermetallic compounds; 71.15.Rf Relativistic effects.
Keywords: Fermi surface, band structure, rare earth compounds.
1. Introduction
The de Haas–van Alphen (dHvA) effect is an oscillato-ry variation of the diamagnetic susceptibility as a function of a magnetic field strength (B). The method provides de-tails of the extremal areas of a Fermi surface (FS). The first experimental observation of this behavior was made by Wander Johannes de Haas and his student P.M. van Al-phen in 1930 [1]. They have measured a magnetization M of semimetal bismuth as a function of the magnetic field and found that the magnetic susceptibility M/B is a period-ic function of the reciprocal of the magnetic field (1/B). Similar oscillatory behavior has been also observed in magnetoresistance (so-called the Shubnikov–de Haas ef-fect). The dHvA phenomenon was explained by Landau [2] as a consequence of the quantization of closed electron-ic orbits in a magnetic field. The electrons in a metal exist only as a series of orbitally quantized states in a magnetic field. Because the number of occupied Landau levels changes with the magnetic field, on sweeping the magnetic field one observes oscillations in the magnetization which are periodic in an inverse magnetic field.
Although the magnetic oscillations were discovered as long as 1930 in bismuth, it was nearly 20 years before the effect was found in other metals [3]. Bismuth contains very few conduction electrons and so has a very small Fermi surface. The significance of a small Fermi surface is that the oscillations being of low frequency and requiring only modest magnetic field are particularly easy to observe.
Higher fields and more sensitive techniques are necessary for seeing the oscillations in most other metals and it was mainly for this reason that the effect was not more widely observed until the late 1940s, while the very high frequen-cy oscillations associated with the large Fermi surfaces of monovalent noble and alkali metals were observed only in the late 1950s [4].
The connection between the oscillations and the Fermi surface was pointed out independently by I.M. Lifshitz (1950) and by Onsager (1951), fortunately at just the time when the oscillations were being discovered in more and more metals. For majority of the metals the oscillation proved to be much more complicated than those in bismuth. It was Lifshitz–Onsager formulation that provided the key to unraveling the rather complicated experimental data.
Onsager during his visit Cambridge in 1951 pointed out that the change in 1/B through a single period of oscillation was determined by the remarkably simple relation
1 1 2= = = ,F
ePF B cS
π ∆
(1)
where P is the period of the dHvA oscillation in 1/B, F is the dHvA frequency, and FS is any extremal cross-sectional area of the Fermi surface in a plane normal to the magnetic field. Later Onsager published his idea in Ref. 5. Similar idea has been proposed by I.M. Lifshitz in an un-published lecture in Academy of Sciences of Ukraine in 1950. Later on I.M. Lifshitz and A.M. Kosevich derived
© V.N. Antonov, 2014
V.N. Antonov
a rigorous general form of the oscillatory magnetization which gives not only the oscillation frequency but also their amplitude and phase [6,7].
If the z axis is taken along the magnetic field, then the area of a Fermi-surface cross section at height zk is ( )zS k and the extremal areas FS are the values of ( )zS k at the
zk where ( )/ = 0.z zS k k Thus maximum and minimum cross sections are among the extremal ones. Since altering the magnetic field direction brings different extremal areas into play, all extremal areas of the Fermi surface can be mapped out. From the temperature and field dependences of the dHvA amplitude, the cyclotron effective mass *cm can be determined. The mean free path l can be also estimated from the simple relations: 2= ,F FS kπ 2= ,F c Fk m v and
= ,Fl τv where Fk is half of the caliper dimension of a circular FS and Fv is the Fermi velocity. Although, the dHvA experiment needs high-quality single crystals as well as low temperatures down to 30 mK and strong mag-netic fields up to 170 kOe, it provides quite precious in-formation on the Fermi surface of crystals.
De Haas–van Alphen effect is a powerful tool to ex-plore the electronic structure of metals. To prove it we consider two examples in the present study. First, we com-pare the band structure and Fermi surface of isostructural and isoelectronic compounds YIn3 and LuIn3. We will show that even a small change of the Fermi-surface proper-ties associated with the relativistic effects can be precisely detected by the dHvA measurements.
The second example is strongly correlated YbIn3 com-pound with divalent Yb2+ ions. For this compound we per-formed three independent fully relativistic band structure calculations. The 4f electrons have been considered as: (1) itinerant electrons using the local density approxima-tion (LDA+SO); (2) fully localized, putting them in the core; and (3) partly localized using the LDA+SO+U ap-proximation. We will show that the dHvA method can be suited as ideal method for the decision which approxima-tion is more correct for the description of the electronic structure of lanthanide crystals.
The de Haas–van Alphen oscillations in LuIn3 and YbIn3 were measured by Nojiri et al. [8]. They also calcu-lated angular dependence of the dHvA frequency in YbIn3 using 4f-localized model in a frame of full potential linear augmented plane wave (FLAPW) method. They found quite good agreement between the theory and the experi-ment for high-frequency ellipsoidal type ,α ,β and γ orbits. Although, the agreement with the experiment for the low-frequency δ orbits was worse and the ξ orbits were not described at all. The angular dependencies of the de Haas–van Alphen frequencies and the corresponding cyclotron masses for YIn3 were determined by Pluzhnikov et al. [9]. The dHvA frequency branches were in the range from 2.3⋅106 to 105⋅106 Oe. For all of them cyclotron mass-es were found to be light; their values were between 0.2 m0 and 0.8 m0. Fermi-surface properties in rare earth (R) and
actinide (An) compounds of RX3 (X = Al, Ga, In, Si, Ge, Sn, Pb), AnX3, RTIn5 (T: transition metal), and AnTGa5 are presented in recent review article by Onuki and Settati [10].
The paper is organized as follows. Section 2 presents the details of the calculations. Section 3 is devoted to the electronic structure as well as the Fermi surface, angle de-pendence of the cyclotron masses and extremal cross sec-tions of the Fermi surface in RIn3 (R = Y, Lu, and Yb) using the fully relativistic linear muffin-tin orbital (LMTO) band structure method. The results are compared with available experimental data. Finally, the results are sum-marized in Sec. 4.
2. Computational details
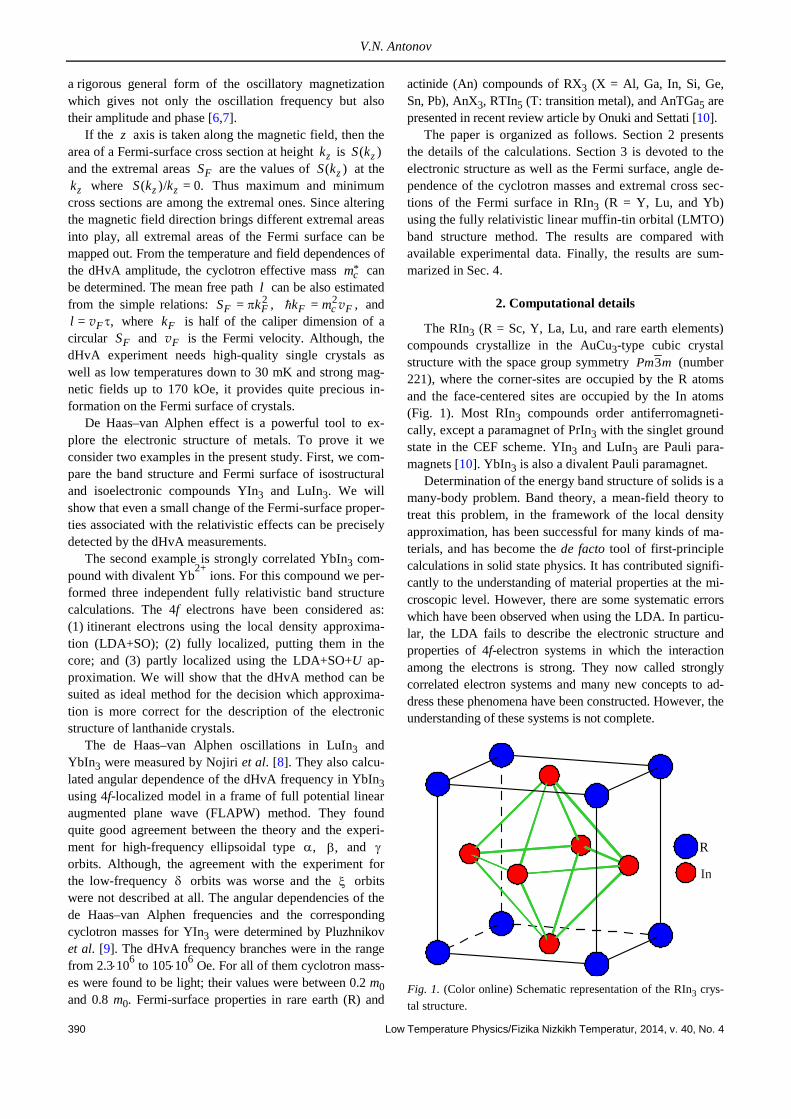
The RIn3 (R = Sc, Y, La, Lu, and rare earth elements) compounds crystallize in the AuCu3-type cubic crystal structure with the space group symmetry 3Pm m (number 221), where the corner-sites are occupied by the R atoms and the face-centered sites are occupied by the In atoms (Fig. 1). Most RIn3 compounds order antiferromagneti-cally, except a paramagnet of PrIn3 with the singlet ground state in the CEF scheme. YIn3 and LuIn3 are Pauli para-magnets [10]. YbIn3 is also a divalent Pauli paramagnet.
Determination of the energy band structure of solids is a many-body problem. Band theory, a mean-field theory to treat this problem, in the framework of the local density approximation, has been successful for many kinds of ma-terials, and has become the de facto tool of first-principle calculations in solid state physics. It has contributed signifi-cantly to the understanding of material properties at the mi-croscopic level. However, there are some systematic errors which have been observed when using the LDA. In particu-lar, the LDA fails to describe the electronic structure and properties of 4f-electron systems in which the interaction among the electrons is strong. They now called strongly correlated electron systems and many new concepts to ad-dress these phenomena have been constructed. However, the understanding of these systems is not complete.
Fig. 1. (Color online) Schematic representation of the RIn3 crys-tal structure.
R
In
390 Low Temperature Physics/Fizika Nizkikh Temperatur, 2014, v. 40, No. 4

Electronic structure, Fermi surface and dHvA effect in YIn3, LuIn3, and YbIn3
Fig. 2. (Color online) Energy band structure and total DOS [in states/(cell⋅eV)] of YIn3 (full blue curves) and LuIn3 (dashed red curves).
DOS
43210123
Γ X M Γ R M X R 2 40
YIn3 LuIn3
Ener
gy, e
V
There are actually different attempts to improve the LDA to treat correlated electrons: GW approach, dynam-ical mean-field theory, time-dependent density functional theory, self-interaction correction, and LDA+U method being the most used ones [11,12]. To account better for the on-site f-electron correlations, we have adopted as a suita-ble model the LDA+U approach [13,14].
A rigorous formulation for the quasiparticle properties of solids is the Green function approach. The self-energy
1 10= G G− −Σ − of the single-particle Green function G is
energy dependent and yields the correlation corrections to the single-particle (mean-field) approximation to the quasi-particle excitation spectrum described by 0G . With a num-ber of plausible assumptions, the LDA+U approach has been related to the so-called GW approximation to Σ in Ref. 15. Already the simplest random phase approximation applied to Σ for the Hubbard model yields a jump of ( )Σ ε at the Fermi level Fε by the Hubbard U. The more elabo-rate analysis of Ref. 15 results in a correlation correction to the mean-field approximation of the self-energy, which is
eff /2U downward below the Fermi level and eff /2U up-ward above the Fermi level. As mean-field theory in a crystal describes always a delocalized situation and the LDA Kohn–Sham potential is a well proved approximation to the self-energy of weakly correlated situations [16], the suggestion is
( , ; ) ( ) ( )LDA′ ′Σ ε ≈ δ − +r r r r rv
eff [ ( ) ( )] ,2m F F m
UP P+ θ ε − ε − θ ε − ε (2)
where mP is the projector onto a strongly correlated m state.
The LDA+U approach simply uses (2) to replace the LDA Kohn–Sham potential in the self-consistency loop. This can be considered as a rough approximation to .Σ Since the potential shift is taken to be constant in space, it does not deform the Kohn–Sham orbital .mϕ However, it shifts the levels of strongly correlated motion away from the Fermi level and thus removes incorrect hybridization with conduction states, which would spoil the calculated ground-state spin density. On the other hand, being also understood as an approximation to ,Σ it hopefully yields for the Kohn–Sham band structure the same quality of a working approximation to the quasiparticle excitation spectrum as it does in the case of weakly correlated metals. Estimates for effU may be obtained from constrained den-sity functional calculations or from GW calculations in which case the approach is parameter-free. Most reliable are those results which do not very sensitively depend on the actual value of effU within a certain reasonable range.
The calculations of the electronic structure and Fermi-surface properties of RIn3 compounds were performed using the fully relativistic spin-polarized Dirac LMTO method [17,18] in the atomic sphere approximation (ASA)
with the combined correction term taken into account. We used the von Barth–Hedin parameterization [19] for the ex-change-correlation potential. Brillouin zone (BZ) integra-tions were performed using the improved tetrahedron meth-od [20]. For obtaining the self-consistent solution we used 286 k points in the irreducible part of the BZ. For the calcu-lation of the Fermi-surface properties we used extended mash with 22945 k points in the irreducible part of the BZ.
We have adopted the LDA+U method [13] as a different level of approximation to treat the electron–electron correla-tions. The LDA+U method has proved to be an efficient and reliable tool for calculating the electronic structure of sys-tems where the Coulomb interaction is strong enough to cause localization of the electrons. We used the rotationally invariant LDA+U method described in details in our previ-ous paper [14]. The effective on-site Coulomb repulsion U was considered as an adjustable parameter and was chosen to 7.0 eV. For the exchange integral J the value of 0.82 eV estimated from constrained LDA calculations was used.
3. Results and discussion
3.1. YIn3 and LuIn3
3.1.1. Energy band structure. The Y atom in YIn3 has no f electrons in valence band (4f 0 configuration). On the other hand, Lu possesses 14 f electrons in valence band (4f
14 configuration). In our theoretical LDA calculation of the Fermi properties of LuIn3 we treated 4f electrons as valence states as well as fully localized ones putting them in core. We found identical FSs for these two approxima-tions. We can conclude that 4f states in LuIn3 are strongly localized and have no influence on their Fermi properties. Figure 2 presents the energy band structure and total density of states (DOS) of YIn3 (full lines) and LuIn3 (dashed lines). The partial DOSs for YIn3 are shown in Fig. 3. The crystal field at the Y (Lu) site (Oh point symmetry) causes the split-ting of Y (Lu) d orbitals into a doublet ge 23 1
(z
d−
and
2 2 )x y
d−
and triplet 2gt ( ,xyd ,xzd and ).yzd The crystal
field at the In site (D4h point symmetry) causes the splitting of In p orbitals into a singlet 2ua ( )xp and a doublet ue
Low Temperature Physics/Fizika Nizkikh Temperatur, 2014, v. 40, No. 4 391

V.N. Antonov
( yp and ).zp There is a significant In p–Y d hybridization
in the valence band. If one moves from YIn3 to LuIn3 the p valence bandwidth is slightly increasing due to the increas-ing extension of the corresponding atomic wave functions. The relativistic effects decrease the center of gravity of Lu 6s valence bands in comparison with the Y 5s bands.
Although, the energy band structures of YIn3 and LuIn3 compounds are very similar (Fig. 2), there are some signif-icant differences in the band positions. For example, the 8th empty energy band at the R symmetry point shifts downwards by 1.4 eV in LuIn3 in comparison with the YIn3 due to the relativistic effects. Also the 4th occupied energy band in the M symmetry point is shifted down-wards by 0.5 eV in LuIn3. Both these bands are predomi-nantly of s character (Lu 6s in LuIn3 and Y 5s in YIn3). However, such dramatic change in the position of some energy bands has small influence on the relative positions which cross the .Fε Two energy bands cross the Fε in both the compounds: the 6th and 7th energy bands in YIn3 and the 13th and 14th ones in LuIn3. These bands have predominantly Y (Lu) d 2( )gt and In p ( )ue characters. However, there is at least one visible difference in these bands behavior. In the RΓ − symmetry direction the 6th energy band lays below Fε in YIn3, however, the corre-sponding 13th band in LuIn3 crosses the Fε at around 1/3 distance from Γ to R points. As a result, LuIn3 possesses closed electron sheet centered around Γ point in compari-son with open one in YIn3 (see below).
3.1.2. Fermi surface. The electronic configuration of Y atom is [Kr] 0 1 24 4 5 ,f d s while the configuration of Lu
atom is [Xe] 14 1 24 5 6 ,f d s the valence electrons of In atom
are 2 15 5 .s p The total number of valence electrons is 12 in YIn3 and 26 in LuIn3. Therefore, both YIn3 and LuIn3 are a compensated metals with equal number of electrons and holes, or equal volume of the electron and hole Fermi sur-faces. Figure 4 shows the Fermi surface of YIn3, the corre-sponding Fermi surface for LuIn3 can be found in Ref. 8 (Fig. 2). The Fermi surfaces of YIn3 and LuIn3 are very similar and consist of three kinds of major parts. Among them, the nearly spherical electron Fermi surface centered at the corner R points (Fig. 4, lower panel) originated from the 7th energy band in YIn3 and 14th band in LuIn3; a complex open along the <100> direction hole surface centered at Γ point (Fig. 4, upper panel) from the 6th
Fig. 3. (Color online) Partial DOSs of YIn3.
Fig. 4. (Color online) The calculated hole sheets from the 6th energy band (upper panel) and electron sheet of the Fermi surface around R symmetry point from the 7th energy band (lower panel) in YIn3.
392 Low Temperature Physics/Fizika Nizkikh Temperatur, 2014, v. 40, No. 4

Electronic structure, Fermi surface and dHvA effect in YIn3, LuIn3, and YbIn3
energy band in YIn3 and 13th band in LuIn3; and almost spherical in topology electron Fermi surface at Γ point. The last sheet of the Fermi surface derived from the 6th energy band in YIn3 and 13th band in LuIn3 has different topology in these compounds. It is closed in LuIn3 and open in the <111> direction in YIn3. The difference is clearly seen in Fig. 5 where we present the calculated Fer-mi-surface cross-section areas of YIn3 and LuIn3 in the plane perpendicular to the <111> direction at the 1/3 dis-tance between the Γ and R points.
Figure 6 presents the calculated Fermi-surface cross-section areas of YIn3 (left column) and LuIn3 (right col-umn) in the planes perpendicular to the z direction and cross R symmetry point (upper row), cross Γ point (low-er row) and in the planes at 1/3 (the second row from the bottom) and 2/3 (the third row from the bottom) distances between the planes crossed the Γ and R points. The cross-sections areas of almost spherical FSs centered in R points (red dashed curves) are almost identical in the shape and size for YIn3 and LuIn3. The cross sections for electron and hole FSs centered in Γ point are also similar in both com-pounds in the plane z = 0 (lower row in Fig. 6). However, for other three planes the cross sections are significantly differ from each other in YIn3 and LuIn3 not only in size but also in topology. These differences are well reflected in the experimentally measured dHvA frequencies.
Figure 7 shows the angular dependence of the dHvA fre-quency in YIn3 and LuIn3 for field directions in the (110) and (110) planes. The black full squares represent the results of dHvA experimental measurements by Pluzhnikov et al. [9] in YIn3 (left panel) and by Nojiri et al. [8] in LuIn3 (right panel). Branch α originates from the band 7-electron FS centered in R point in YIn3 (14-electron FS in LuIn3) with the nearly spherical topology, while the others originate from the band 6-hole and 6-electron FSs centered in Γ point. The electron FSs around R point have almost
identical form and slightly different size in YIn3 and LuIn3. As a result, they have similar Fermi-surface cross-section areas (α orbits) at all the planes (Fig. 7). The 1β branch originates from the belly orbit in the band 6-electron FS in YIn3 (13-electron in LuIn3) centered at the Γ point. As we pointed out above, LuIn3 possesses closed
Fig. 5. (Color online) The calculated Fermi-surface cross-section areas of YIn3 and LuIn3 in the plane perpendicular to the <111> direction at the 1/3 distance between the Γ and R points. The full blue curves present the cross sections of surfaces centered in Γ point (for the 6th and 13th energy bands in YIn3 and LuIn3, respectively); the red dashed curves show the cross sections of electron FSs centered in R point (for the 7th and 14th energy bands in YIn3 and LuIn3, respectively).
YIn3 LuIn3Fig. 6. (Color online) The calculated Fermi-surface cross-section areas of YIn3 (left column) and LuIn3 (right column) in the planes perpendicular to the z direction and cross R symmetry point (upper row), cross Γ point (lower row) and in the planes at 1/3 (the second row from the bottom) and 2/3 (the third row from the bottom) distances between the planes crossed the Γ and R points. The red dashed curves present electron almost spherical FSs centered in R points for the 7th and 14th energy bands in YIn3 and LuIn3, respectively. The full blue curves present the cross sections of hole and electron surfaces centered in Γ point.
R
( 0 0.5)0, ,
X
M
R
Γ X
M
( 0 0.5)0, ,
( 0 0. )0, , 333 ( 0 0. )0, , 333
( 0 0. )0, , 167 ( 0 0. )0, , 167
( 0 0)0, , ( 0 0)0, ,
YIn3 LuIn3
Γ
Low Temperature Physics/Fizika Nizkikh Temperatur, 2014, v. 40, No. 4 393

V.N. Antonov
electron sheet centered around Γ point in comparison with open one in YIn3. As a result, the 1β orbit appears in a whole angle interval in LuIn3 and restricted angle intervals in YIn3 (±35° around <100> direction and ±15° around <111> direction). The 3β orbits are also placed on the band 6-electron FS in YIn3 (13-electron in LuIn3) centered at the Γ point. The γ orbits in both the compounds have similar angular field dependence.
The orbits in the region of the low dHvA frequencies (F < 0.1 T) correspond to small sheets of open 6-hole FS in YIn3 (13-hole in LuIn3) centered at the Γ point. They are sensitive to peculiarities of the electronic structure and have not much similarity between dHvA spectra in YIn3 and LuIn3. Especially, there is a very small σ orbit in LuIn3 originated from small ellipsoid type FS sheets at the open 13-hole FS cross sections in LuIn3 which is absent in YIn3.
Fig. 7. (Color online) The calculated (open red and blue circles) and experimentally measured (black full squares) in YIn3 [9] (left pan-el) and LuIn3 (right panel) [8] angular dependences of the dHvA oscillation frequencies.
Fig. 8. (Color online) The calculated angular dependence of the cyclotron masses (open red and blue circles) in YIn3 (left panel) and LuIn3 (right panel) and experimentally measured ones for YIn3 [9] (black full squares).
–1
0
–1
0
0 30 60 90 120 0 30 60 90 120Angle, deg Angle, deg
YIn3 LuIn3(100) (110) (100) (110)α
β
ε1
ε2
δ
γ
α
β
β
ε1
ε2
δ
<110> <100> <111> <110> <110> <100> <111> <110>
mcmc
γ
394 Low Temperature Physics/Fizika Nizkikh Temperatur, 2014, v. 40, No. 4

Electronic structure, Fermi surface and dHvA effect in YIn3, LuIn3, and YbIn3
The theory reasonably well reproduces the experimen-tally measured frequencies for the ,α 1,β 3,β ,γ 1,δ 2 ,δ
1,ε and 2ε orbits. However, we were not able to detect low-frequency δ orbits near the <111> direction observed experimentally. Instead, we found an additional two branches with higher frequencies near the <111> direction in LuIn3 which were not detected experimentally. The small σ orbits are detected only at the (110) plane in LuIn3, however, we observed them almost in all angle in-terval. We also found an additional two branches with higher frequencies near the <111> and <110> directions in YIn3 which were not detected experimentally.
Figure 8 shows the theoretically calculated angular de-pendence of the cyclotron masses ( )bm in YIn3 and LuIn3 and the experimentally measured masses *( )cm in YIn3 in the <110> and <111> and <100> symmetry directions [9]. The cyclotron effective masses were determined from the temperature dependences of the amplitudes of the dHvA oscillations. The cyclotron masses were found to be rela-tively light in both the compounds. Their values were be-tween –0.9 m0 and 0.5 m0. Cyclotron masses for the α orbits have almost constant angle dependence and equal to around 0.4 m0. We found a stronger angle field dependence for the 1β orbit in LuIn 3 than in YIn3. The β orbits was found to be strongly anisotropic in both compounds.
We note that band cyclotron effective masses mb are renormalized by the electron–phonon interaction * =cm = (1 ),bm + λ where λ is the constant of the electron–phonon interaction. By comparing the experimentally measured cyclotron masses with band masses we can esti-mate the .λ It is strongly varied on the orbit type and mag-netic direction. We estimate the constant of the electron–phonon interaction to be equal to 0.45 and 0.46 for the 1ε and 2ε hole orbits, respectively, with H || <110>. The con-stant λ for the electron orbits is equal to 0.48 for the α orbit with magnetic field along <100> direction. For the γ and δ orbits with H || <100> the λ was found to be equal to 0.8 and 0.34, respectively.
3.2. YbIn3
3.2.1. Electronic structure. The 4f-electron lanthanide compounds are usually treated by a 4f-localized model (4f electrons in core). The localized 4f-electron picture is a good starting point in description of the electronic structure of lanthanides. On the other hand, there are several inter-esting phenomena such as metal–insulator transitions, va-lence fluctuations in the Kondo effect, heavy fermion be-havior, superconductivity, and so on. All these effects strongly depend on the hybridization between 4f and con-duction electrons and cannot be described correctly in the 4f-localized model.
YbIn3 is a Pauli paramagnet with the divalent property of Yb2+ [21] (4f14 configuration). The divalent property of YbIn3 is clear from the lattice constants of RIn3 [10], where the lattice constant of YbIn3 deviates from the lan-
thanide contraction [21]. An important issue is the energy position of the occupied 4f
14 states in the electron band structure of YbIn3. It is well known that LDA usually gives a wrong energy position for the 4f states in rare-earth compounds. For nonzero 4f occupation it places the 4f states right at the Fermi level [22,23] in contradiction to various experimental observations. In the case of Gd com-pounds or divalent Yb2+ compounds the LDA places the 4f states too close to the Fermi energy [12,24].
Figure 9 shows the fully relativistic energy band struc-ture of YbIn3. In these calculations the 4f states have been considered as: (1) itinerant using the local density approx-imation, (2) fully localized, treating them as core states, and (3) partly localized using the LDA+U approximation. On the first glance all three approximations produce simi-lar electronic structure in the close vicinity of .Fε The differences are in small details. In the LDA approximation fully occupied 4f states of Yb2+ are situated at –0.3 eV and –1.65 eV below the Fermi level for the 4f7/2 and 4f5/2 states, respectively. The corresponding 4f7/2,5/2 states in the LDA+U approach are located around –1.3 and –2.65 eV below Fermi level. Such shifting of the 4f-levels affects the Fermi surface because the 4f electrons directly contribute to the conduction electrons.
Fig. 9. Self-consistent fully relativistic energy band structure and total DOS (in states/(unit cell⋅eV)) calculated for YbIn3 treating the 4f states as: (1) fully localized with 4f in core (upper panel); (2) itinerant LDA approximation (middle panel); and (3) partly localized in the LDA+U abroach (lower panel).
Low Temperature Physics/Fizika Nizkikh Temperatur, 2014, v. 40, No. 4 395
V.N. Antonov
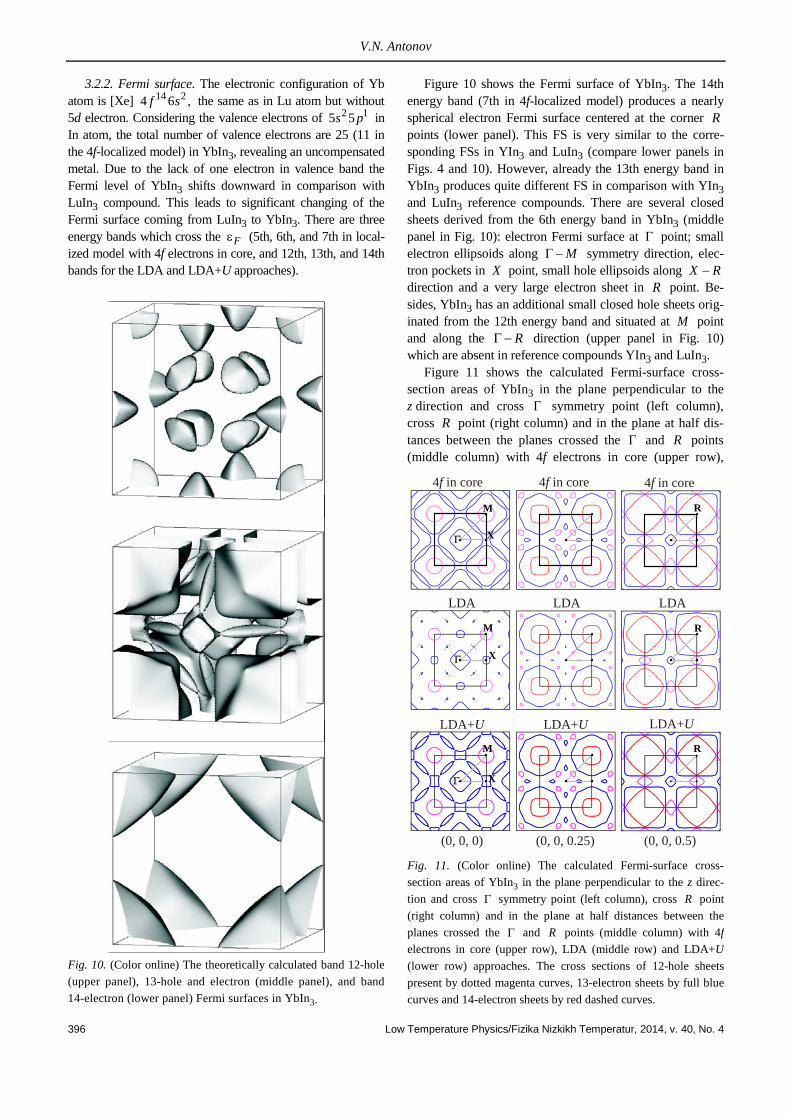
3.2.2. Fermi surface. The electronic configuration of Yb atom is [Xe] 14 24 6 ,f s the same as in Lu atom but without 5d electron. Considering the valence electrons of 2 15 5s p in In atom, the total number of valence electrons are 25 (11 in the 4f-localized model) in YbIn3, revealing an uncompensated metal. Due to the lack of one electron in valence band the Fermi level of YbIn3 shifts downward in comparison with LuIn3 compound. This leads to significant changing of the Fermi surface coming from LuIn3 to YbIn3. There are three energy bands which cross the Fε (5th, 6th, and 7th in local-ized model with 4f electrons in core, and 12th, 13th, and 14th bands for the LDA and LDA+U approaches).
Figure 10 shows the Fermi surface of YbIn3. The 14th energy band (7th in 4f-localized model) produces a nearly spherical electron Fermi surface centered at the corner R points (lower panel). This FS is very similar to the corre-sponding FSs in YIn3 and LuIn3 (compare lower panels in Figs. 4 and 10). However, already the 13th energy band in YbIn3 produces quite different FS in comparison with YIn3 and LuIn3 reference compounds. There are several closed sheets derived from the 6th energy band in YbIn3 (middle panel in Fig. 10): electron Fermi surface at Γ point; small electron ellipsoids along MΓ − symmetry direction, elec-tron pockets in X point, small hole ellipsoids along X R− direction and a very large electron sheet in R point. Be-sides, YbIn3 has an additional small closed hole sheets orig-inated from the 12th energy band and situated at M point and along the RΓ − direction (upper panel in Fig. 10) which are absent in reference compounds YIn3 and LuIn3.
Figure 11 shows the calculated Fermi-surface cross-section areas of YbIn3 in the plane perpendicular to the z direction and cross Γ symmetry point (left column), cross R point (right column) and in the plane at half dis-tances between the planes crossed the Γ and R points (middle column) with 4f electrons in core (upper row),
Fig. 10. (Color online) The theoretically calculated band 12-hole (upper panel), 13-hole and electron (middle panel), and band 14-electron (lower panel) Fermi surfaces in YbIn3.
Fig. 11. (Color online) The calculated Fermi-surface cross-section areas of YbIn3 in the plane perpendicular to the z direc-tion and cross Γ symmetry point (left column), cross R point (right column) and in the plane at half distances between the planes crossed the Γ and R points (middle column) with 4f electrons in core (upper row), LDA (middle row) and LDA+U (lower row) approaches. The cross sections of 12-hole sheets present by dotted magenta curves, 13-electron sheets by full blue curves and 14-electron sheets by red dashed curves.
R
R
R
X
M
X
M
X
M
4 in coref
LDA
LDA+U
4 in coref 4 in coref
LDALDA
LDA+U LDA+U
(0, 0, 0) (0, 0, 0.25) (0, 0, 0.5)
396 Low Temperature Physics/Fizika Nizkikh Temperatur, 2014, v. 40, No. 4

Electronic structure, Fermi surface and dHvA effect in YIn3, LuIn3, and YbIn3
LDA (middle row) and LDA+U (lower row) approaches. The cross sections of 12-hole sheets presented by dotted magenta curves, 13-electron and hole sheets by full blue curves and 14-electron sheets by red dashed curves. All three approximations used in the calculations produce similar in topology but different in size cross-sections are-as in the planes 2 /aπ (0, 0, 0.25) and 2 /aπ (0, 0, 0.5). It is interesting to note that cross-section areas obtained with 4f electrons in core and LDA+U approach are closer to each other than to the LDA calculations. For the plane z = 0 all three approximations produce completely different cross-section areas not only in the size but also in topology. A careful comparison of the dHvA results with the results of energy band calculations is therefore necessary to make conclusion which method is more correct for the descrip-tion of the Fermi-surface properties of YbIn3.
Figure 12 shows the theoretically calculated angular dependence of the dHvA frequency in YbIn3 for field di-rections in the (100) and (110) planes using the 4f-localized model (left panel) and LDA approximation (right panel). The black full squares represent the results of dHvA experimental measurements by Nojiri et al. [8]. From the theoretical calculations we found that the branch α originates from the band 14-electron FS centered in R point (7-electron FS with 4f in core) with the nearly spher-ical topology. The β branch originates from the belly orbit in the band 13-electron FS in YbIn3 (6-electron in 4f-localized model) centered at the Γ point. The nature of these two orbits is the same as the α and 1β orbits in YIn3 and LuIn3. There is an excellent agreement between the experiment and theory with 4f electron in core for α orbit, but the LDA approach slightly underestimates the frequen-
cies for this orbit. The fully localized model overestimates and the LDA approach underestimates the frequencies for the β orbit. The π orbit originates from the extremal cross sections of large 13-electron FS centered in R point.
The orbits ,δ 1,2 ,ε and 1,2ξ in the region of the low dHvA frequencies (F < 0.1 T) correspond to small sheets of closed 12-hole FSs situated at M point and along the
RΓ − direction (upper panel in Fig. 10) as well as to small 13-electron ellipsoids along MΓ − symmetry direction, 13-electron pockets in X point, and small 13-hole ellip-soids along X R− direction. They are sensitive to the pe-culiarities of the electronic structure and have not much similarity with the dHvA experimental data for the 4f-localized model as well as for the LDA approach. Espe-cially, 4f-localized model strongly overestimates the size of the δ orbits, however, the LDA calculations equally underestimate their size. Both the approaches clearly re-produce the 1,2ε and 1,2ξ orbits.
On the other hand, the calculations in the LDA+U ap-proach describes the low-frequency orbits quite well (see Fig. 13). This approach also improve the agreement with the experiment for the β orbits. We can conclude that the inclusion of strong Coulomb repulsion in 4f shell is very important for the correct description of the Fermi-surface properties of YbIn3.
Figure 14 shows the theoretically calculated angular dependence of the cyclotron masses in YbIn3 using the LDA+U approach. The cyclotron masses were found to be relatively light in YbIn3 as it was also in YIn3 and LuIn3 (compare Figs. 8 and 14). The cyclotron masses in YbIn3 values are between –0.9 m0 and 0.5 m0. The largest cyclotron masses were obtained for the high-frequency π
Fig. 12. (Color online) The calculated and experimentally measured [8] (black full squares) angular dependence of the dHvA oscillation frequencies in YbIn3 with 4f electrons in core (left panel) and LDA (right panel). The orbits from the 13-hole and electron sheets present by blue circles, 14-electron sheets by red circles and 12-hole sheets by magenta circles.
Low Temperature Physics/Fizika Nizkikh Temperatur, 2014, v. 40, No. 4 397

V.N. Antonov
electron orbits (0.71–0.78 m0). Cyclotron masses for the α orbits have almost constant angle dependence and equal to 0.4 m0. The masses for the ,π β as well as the 1,2ξ orbits are also have relatively weak angle dependence. The mass-es for the hole δ orbits were found to be strongly aniso-tropic in YbIn3.
4. Summary
The electronic structure, the Fermi surface, angle de-pendence of the cyclotron masses, and extremal cross sec-tions of the Fermi surface of YIn3, LuIn3, and YbIn3 have been studied using the fully relativistic linear muffin-tin orbital method. The Fermi surfaces of YIn3 and LuIn3 are very similar and consist of three kinds of major parts: the nearly spherical large electron Fermi surface centered at the corner R points, a complex open along the <100> direction hole surface centered at Γ point, and almost spherical in topology electron Fermi surface at Γ point. The last sheet of the Fermi surface is closed in LuIn3 and open in the <111> direction in YIn3. The difference in topology and small dif-ferences in the size of FS sheets of these two compounds while almost invisible in the band structure picture were clearly detected by the dHvA measurements.
The cyclotron masses were found to be relatively light in both compounds. Their values are between –0.9 m0 and 0.5 m0. Cyclotron masses for the α orbits have almost con-stant angle dependence and equal to around 0.4 m0. We found a stronger angle field dependence for the 1β orbit in LuIn3 than in YIn3. The β orbits were found to be strongly anisotropic in both compounds. The constant of the electron–phonon interaction λ is strongly varied on the or-bit type and magnetic direction. We estimate the constant of the electron–phonon interaction in YIn3 to be equal to 0.45 and 0.46 for the 1ε and 2ε hole orbits, respectively, with H || <110>. The constant λ for the electron orbits is equal to 0.48 for the α orbit with magnetic field along <100> direc-tion. For the γ and δ orbits with H || <100> the λ was found to be equal to 0.8 and 0.34, respectively.
The second example, considered in this study, is strong-ly correlated YbIn3 compound with divalent Yb2+ ions. For this compound we performed three independent fully relativistic band structure calculations. The 4f electrons have been considered as: (1) itinerant electrons using the local density approximation (LDA+SO); (2) fully local-ized, putting them in the core; and (3) partly localized us-ing the LDA+SO+U approximation. The Fermi surface of YbIn3 consists of a nearly spherical 14-electron Fermi sur-face centered at the corner R points; the 13th energy band produces the electron Fermi surface at Γ point, small elec-tron ellipsoids along MΓ − symmetry direction, electron pockets in X point, small hole ellipsoids along X R− direction, and a very large electron sheet in R point; there are also small closed 12-hole sheets situated at M point and along the RΓ − direction.
The 4f-localized model and the LDA approximation reasonably well reproduces the experimentally measured frequencies for the ,π ,α and β orbits. The orbits in the region of the low dHvA frequencies (the ,δ 1,2 ,ε and 1,2ξ orbits) are very sensitive to the peculiarities of the elec-tronic structure. These orbits are clearly reproduced by the 4f-localized model as well as by the LDA approach. On the
Fig. 13. (Color online) The calculated with the LDA+U approach and experimentally measured [8] (black full squares) angular dependence of the dHvA oscillation frequencies in YbIn3. The orbits from the 13-hole and electron sheets present by blue cir-cles, 14-electron sheets by red circles and 12-hole sheets by ma-genta circles.
Fig. 14. (Color online) The calculated angular dependence of the cyclotron masses in YbIn3 using the LDA+U approach (open blue, red and magenta circles present masses for the 13-hole and electron, 14-electron and 12-hole sheets, respectively).
398 Low Temperature Physics/Fizika Nizkikh Temperatur, 2014, v. 40, No. 4

Electronic structure, Fermi surface and dHvA effect in YIn3, LuIn3, and YbIn3
other hand, the calculations in the LDA+U approach quite well describes the low-frequency orbits. The cyclotron masses in YbIn3 were found to be between –0.9 m0 and 0.5 m0. The largest cyclotron masses were obtained for the high-frequency π electron orbits (0.71–0.78 m0). Cyclo-tron masses for the α orbits have almost constant angle dependence and equal to 0.4 m0. The masses for the ,π β as well as the 1,2ξ orbits are also have relatively weak angle dependence. The masses for the hole δ orbits was found to be strongly anisotropic in YbIn3.
In conclusion we found that the Fermi-surface proper-ties of YIn3 and LuIn3 can be relatively well described by the LDA approach. But the conventional LDA band calcu-lations fails to describe the Fermi surface of YbIn3 due to wrong position of the 4f states (too close to the ).Fε The Fermi-surface properties of YbIn3 are also purely de-scribed by the 4f-localized model because the 4f electrons directly contribute to the conduction electrons. On the other hand, the LDA+U approach relatively well de-scribes the Fermi surface of YbIn3. We can conclude that the inclusion of strong Coulomb repulsion in 4f shell is very important for the correct description of the Fermi-surface properties of YbIn3.
Even nowadays more than 80 year after discovery, de Haas–van Alphen effect is very popular and provides a powerful tool to explore the electronic structure of metals due to its high sensitivity to the peculiarities of the electronic structure. The dHvA method can be regarded as an ideal method for the decision which approximation is more cor-rect for the description of the electronic structure of crystals.
Acknowledgments
This work was supported by the National Academy of Sciences of Ukraine in the framework of the State Target Scientific and Technology Program “Nanotechnology and Nanomaterials” for 2010–2014 (No. 0277092303) and Im-plementation and Application of Grid Technologies for 2009–2013 (No. 0274092303).
1. W.J. de Haas and P. M. van Alphen, Proc. Sect. Sci. K. Ned. Akad. Wet. 33, 1106 (1930).
2. L. Landau, Z. Phys. 64, 629 (1930). 3. D. Shoenberg, Magnetic Oscillations in Metals, Cambridge
University Press, Cambridge (1984). 4. D. Shoenberg, Proc. Roy. Soc. A 379, 1 (1982). 5. L. Onsager, Philos. Mag. 43, 1006 (1952). 6. I.M. Lifschitz and A.M. Kosevich, Dokl. Acad. Scienc. USSR
96, 963 (1954). 7. I.M. Lifschitz and A.M. Kosevich, Zh. Eksp. Teor. Fiz. 29,
730 (1955). 8. S. Nojiri, Y. Katayama, D. Aoki, N. Suzuki, K. Sugiyama,
R. Settai, Y. Inada, Y. Onuki, and H. Harima, Physica B 281, 747 (2000).
9. V.B. Pluzhnikov, A. Czopnik, and I.V. Svechkarev, Physica B 212, 375 (1995).
10. Y. Onuki and R. Settai, Fiz. Nizk. Temp. 38, 119 (2012) [Low Temp. Phys. 38, 89 (2012)].
11. V.V. Nemoshkalenko and V.N. Antonov, Computational Methods in Solid State Physics, Gordon and Breach, Amsterdam (1998).
12. V. Antonov, B. Harmon, and A. Yaresko, Electronic Structure and Magneto-Optical Properties of Solids, Kluwer, Dordrecht (2004).
13. V.I. Anisimov, J. Zaanen, and O.K. Andersen, Phys. Rev. B 44, 943 (1991).
14. A.N. Yaresko, V.N. Antonov, and P. Fulde, Phys. Rev. B 67, 155103 (2003).
15. V.I. Anisimov, F. Aryasetiawan, and A.I. Lichtenstein, J. Phys.: Condens. Matter 9, 767 (1997).
16. L. Hedin and B.I. Lundqvist, J. Phys. C 4, 2064 (1971). 17. O.K. Andersen, Phys. Rev. B 12, 3060 (1975). 18. V.V. Nemoshkalenko, A.E. Krasovskii, V.N. Antonov, V.N.
Antonov, U. Fleck, H. Wonn, and P. Ziesche, Phys. Status Solidi B 120, 283 (1983).
19. U. von Barth and L. Hedin, J. Phys. C 5, 1629 (1972). 20. P.E. Blöchl, O. Jepsen, and O.K. Andersen, Phys. Rev. B 49,
16223 (1994). 21. I. Harris and G. Raynor, J. Less-Common Met. 9, 7 (1965). 22. V.N. Antonov, B.N. Harmon, and A.N. Yaresko, Phys. Rev.
B 63, 205112 (2001). 23. V.N. Antonov, B.N. Harmon, and A.N. Yaresko, Phys. Rev.
B 66, 165208 (2002). 24. V.N. Antonov, B.N. Harmon, A.N. Yaresko, and A.P.
Shpak, Phys. Rev. B 76, 184422 (2007).
Low Temperature Physics/Fizika Nizkikh Temperatur, 2014, v. 40, No. 4 399