Embed Size (px)
Citation preview

Electronic Arts Reports Q4 and Full Year FY20 Financial Results REDWOOD CITY, CA – May 5, 2020 – Electronic Arts Inc. (NASDAQ: EA) today announced preliminary financial results for its fiscal fourth quarter and full year ended March 31, 2020. News and ongoing updates regarding EA and its games are available on EA’s blog at www.ea.com/news. “We’re humbled to see people around the world connecting through our games during this unprecedented period,” said CEO Andrew Wilson. “Our focus continues to be on everything we can do for our people, our players, and our communities. Thanks to the amazing dedication and determination of our teams at Electronic Arts, we’re able to deliver the games, experiences and content choices that our players are looking for during this challenging time.” “We’ve had a strong year. Our results this quarter prove the value of the live services path we’ve been on now for a decade. The breadth and depth of our live services give the flexibility we need at times like this to meet player needs,” said COO and CFO Blake Jorgensen. “I want to thank everyone at EA for rising to the challenge. People across the company have shown extraordinary innovation, energy and ingenuity. Learnings from this period will forever change the way we work at EA.” Selected Operating Highlights and Metrics
• Digital net bookings* for the fiscal year was $4.052 billion, up 9% year-over-year and now represents 78% of total net bookings.
• FIFA 20 has more than 25 million unique players to date. • Madden NFL 20 reached the highest engagement levels in franchise history. • Apex LegendsTM was the most downloaded free-to-play game on PS4 in calendar 2019. • Star Wars Jedi: Fallen OrderTM has more than 10 million unique players to date. • In every quarter of fiscal 2020, monthly average players in The Sims 4TM were higher than
the comparable period in the prior year.
* Net bookings is defined as the net amount of products and services sold digitally or sold-in physically in the period. Net bookings is calculated by adding total net revenue to the change in deferred net revenue for online-enabled games and mobile platform fees. Selected Financial Highlights and Metrics All financial measures are presented on a GAAP basis.
• Net cash from operating activities was $498 million for the quarter and $1.797 billion for the fiscal year.
• EA repurchased 2.7 million shares for $291 million during the quarter, bringing the total for the last twelve months to 12.3 million shares for $1.207 billion.

2
Quarterly Financial Highlights
The following GAAP-based financial data and tax rate of 18% was used internally by company management to adjust its GAAP results in order to assess EA’s operating results:
For more information about the nature of the GAAP-based financial data, please refer to EA’s Form 10-Q for the fiscal quarter ended December 31, 2019.
2020 2019(in $ millions, except per share amounts)Digital net revenue 1,219 1,065 Packaged goods and other net revenue 168 173 Total net revenue 1,387 1,238 Net income 418 209 Diluted earnings per share 1.43 0.69 Operating cash flow 498 599
Value of shares repurchased 291 301Number of shares repurchased 2.7 3.2
Three Months EndedMarch 31,
(in $ millions)Statement of Operations
Acquisition-related
expenses
Change in deferred net
revenue (online-enabled games)
Mobile platform fees
Stock-basedcompensation
Total net revenue 1,387 - (131) (43) - Cost of revenue 269 (3) - (43) (1) Gross profit 1,118 3 (131) - 1 Total operating expenses 717 (6) - - (90)
Operating income 401 9 (131) - 91 Interest and other income, net 13 - - - - Income before provision for income taxes 414 9 (131) - 91
Number of shares used in computation: Diluted 292
GAAP-Based Financial DataThree Months Ended March 31, 2020
3
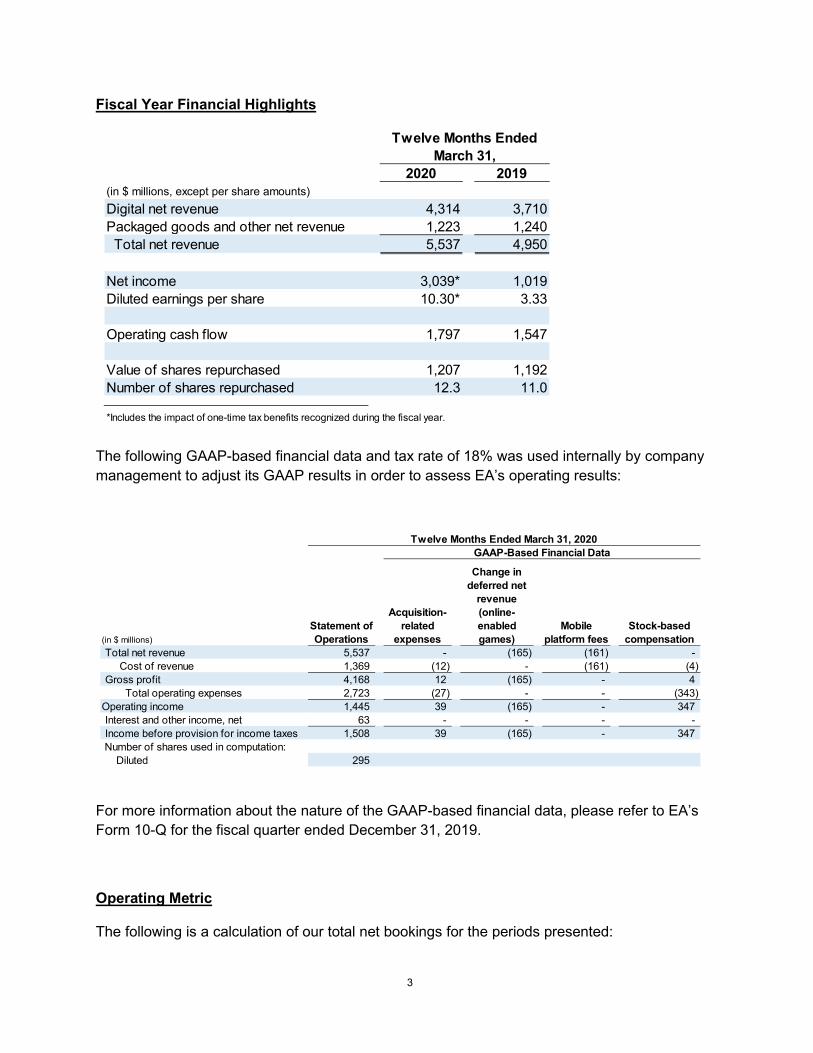
Fiscal Year Financial Highlights
The following GAAP-based financial data and tax rate of 18% was used internally by company management to adjust its GAAP results in order to assess EA’s operating results:
For more information about the nature of the GAAP-based financial data, please refer to EA’s Form 10-Q for the fiscal quarter ended December 31, 2019.
Operating Metric The following is a calculation of our total net bookings for the periods presented:
2020 2019(in $ millions, except per share amounts)Digital net revenue 4,314 3,710 Packaged goods and other net revenue 1,223 1,240 Total net revenue 5,537 4,950 Net income 3,039* 1,019 Diluted earnings per share 10.30* 3.33
Operating cash flow 1,797 1,547
Value of shares repurchased 1,207 1,192 Number of shares repurchased 12.3 11.0
Twelve Months Ended March 31,
*Includes the impact of one-time tax benefits recognized during the fiscal year.
(in $ millions)Statement of Operations
Acquisition-related
expenses
Change in deferred net
revenue (online-enabled games)
Mobile platform fees
Stock-basedcompensation
Total net revenue 5,537 - (165) (161) - Cost of revenue 1,369 (12) - (161) (4) Gross profit 4,168 12 (165) - 4 Total operating expenses 2,723 (27) - - (343)
Operating income 1,445 39 (165) - 347 Interest and other income, net 63 - - - - Income before provision for income taxes 1,508 39 (165) - 347
Number of shares used in computation: Diluted 295
Twelve Months Ended March 31, 2020GAAP-Based Financial Data

4
Impact of COVID-19 on our Business Operations and Outlook We have focused on actions to support our people, our players, and our communities around the world affected by the COVID-19 pandemic. Substantially all of our global workforce has shifted to work from home, and our primary focus continues to be the safety and well-being of our employees. Our IT, security and digital platform teams mobilized to add capacity to our remote working systems to scale to a fully distributed workforce. Throughout this time, our studio teams have continued to deliver live service content while working from home. We launched our “Stay Home, Play Together” initiative to bring our players together when physical distancing is keeping us apart, and we’ve delivered dozens of Stay & Play programs to date, from special community livestreams and giveaways, to athletes and celebrities playing our games with fans. Our esports teams have conducted major online tournaments, and we’ve executed or plan to execute in the coming months more than 100 celebrity, athlete, community and charity online esports events. With more people staying at home, we have experienced, and are continuing to experience, heightened levels of engagement and live services net bookings growth to date. The full extent of the impact of the COVID-19 pandemic to our business, operations and financial results will depend on numerous evolving factors that we are not able to predict. The key risks to EA’s business are set forth under the heading “Forward-Looking Statements” in this release. Business Outlook as of May 5, 2020 The following forward-looking statements reflect expectations as of May 5, 2020. Electronic Arts assumes no obligation to update these statements. Results may be materially different and are affected by many factors detailed in this release and in EA’s annual and quarterly SEC filings. Fiscal Year 2021 Expectations – Ending March 31, 2021 Beginning in fiscal year 2021, we will make two changes to the way we report net bookings.
• First, we will report mobile bookings gross of platform fees, instead of net, to align with industry practice. This will result in a gross up in net bookings but no change to underlying profit.
• Second, we will update the presentation of net bookings by composition to focus on full game and live services sales & other, in line with the direction we continue to drive the business.
2020 2019 2020 2019(in $ millions)Total net revenue 1,387 1,238 5,537 4,950 Change in deferred net revenue (online-enabled games) (131) 173 (165) 182 Mobile platform fees (43) (47) (161) (188) Net bookings 1,213 1,364 5,211 4,944
Three Months Ended March 31,
Twelve Months Ended March 31,

5
Our fiscal year 2021 guidance reflects both of these changes. Where relevant, financial data for fiscal 2020 is recast for comparability. Please refer to our FY21 Financial Reporting Update on our IR website for additional information. Financial metrics:
• Net revenue is expected to be approximately $5.525 billion. o Change in deferred net revenue (online-enabled games) is expected to be
approximately $25 million. • Net income is expected to be approximately $978 million. • Diluted earnings per share is expected to be approximately $3.35. • Operating cash flow is expected to be approximately $1.575 billion. • The Company estimates a share count of 292 million for purposes of calculating fiscal
year 2021 diluted earnings per share.
Operational metric:
• Net bookings is expected to be approximately $5.550 billion. For comparison purposes, if fiscal 2020 were to be recast in the same way, we would have reported net bookings of $5.375 billion.
In addition, the following outlook for GAAP-based financial data and a long-term tax rate of 18% are used internally by EA to adjust our GAAP expectations to assess EA’s operating results and plan for future periods:
Twelve Months Ended
Twelve Months Ending
March 31, 2020 March 31, 2021 Actuals Outlook
(in $ millions)Full game 1,783 1,700 Live services & other 3,592 3,850 Total net bookings recast 5,375 5,550 Platform fee* (164) (190) Total net bookings as currently reported 5,211 5,360
*Fee charged by third-party providers on various platforms, including mobile.

6
First Quarter Fiscal Year 2021 Expectations – Ending June 30, 2020
Financial metrics: • Net revenue is expected to be approximately $1.220 billion.
o Change in deferred net revenue (online-enabled games) is expected to be approximately $(220) million.
• Net income is expected to be approximately $270 million. • Diluted earnings per share is expected to be approximately $0.93. • The Company estimates a share count of 291 million for purposes of calculating first
quarter fiscal year 2021 diluted earnings per share. Operational metric:
• Net bookings is expected to be approximately $1.000 billion. For comparison purposes, if the first fiscal quarter of 2020 were to be recast in the same way, we would have reported net bookings of $782 million.
In addition, the following outlook for GAAP-based financial data and a long-term tax rate of 18% are used internally by EA to adjust our GAAP expectations to assess EA’s operating results and plan for future periods:
GAAP Guidance
Acquisition-related
expenses
Change in deferred net
revenue (online-enabled games)
Stock-based compensation
(in $ millions)Total net revenue 5,525 - 25 - Cost of revenue 1,382 - - - Operating expense 2,850 (20) - (430) Income before provision for income taxes 1,270 20 25 430 Net income 978
Number of shares used in computation:Diluted shares 292
Twelve Months Ending March 31, 2021 GAAP-Based Financial Data

7
For more information about the nature of the GAAP-based financial data, please refer to EA’s Form 10-Q for the fiscal quarter ended December 31, 2019.
Conference Call and Supporting Documents
Electronic Arts will host a conference call on Tuesday, May 5, 2020 at 2:00 pm PT (5:00 pm ET) to review its results for the fiscal fourth quarter and year ended March 31, 2020 and its outlook for the future. During the course of the call, Electronic Arts may disclose material developments affecting its business and/or financial performance. Listeners may access the conference call live through the following dial-in number (866) 393-4306 (domestic) or (734) 385-2616 (international), using the Conference ID 3759016 or via webcast at EA’s IR Website at http://ir.ea.com. EA has posted a slide presentation and a financial model of EA’s historical results and guidance. After the conference call, EA will also post the prepared remarks and the transcript from the conference call on EA’s IR Website. A dial-in replay of the conference call will be available until May 19, 2020 at (855) 859-2056 (domestic) or (404) 537-3406 (international) using pin code 3759016. An audio webcast replay of the conference call will be available for one year on EA’s IR Website. Forward-Looking Statements Some statements set forth in this release, including the information relating to EA’s fiscal 2021 expectations under the heading “Business Outlook as of May 5, 2020,” and other information regarding EA's fiscal 2021 expectations contain forward-looking statements that are subject to change. Statements including words such as “anticipate,” “believe,” “expect,” “intend,” “estimate,” “plan,” “predict,” “seek,” “goal,” “will,” “may,” “likely,” “should,” “could” (and the negative of any of these terms), “future” and similar expressions also identify forward-looking statements. These forward-looking statements are not guarantees of future performance and reflect management’s current expectations. Our actual results could differ materially from those discussed in the forward-looking statements.
GAAP Guidance
Acquisition-related
expenses
Change in deferred net
revenue (online-enabled games)
Stock-based compensation
(in $ millions)Total net revenue 1,220 - (220) - Cost of revenue 210 - - - Operating expense 635 (5) - (90) Income before provision for income taxes 374 5 (220) 90 Net income 270
Number of shares used in computation:Diluted shares 291
GAAP-Based Financial Data Three Months Ending June 30, 2020

8
Some of the factors which could cause the Company’s results to differ materially from its expectations include the following:
• The Impact of the COVID-19 Pandemic: Continued disruptions, postponements or cancellations of sports seasons and sporting events around which the Company seeks to launch games and provide live services; worsening economic conditions that negatively impact discretionary consumer spending and consumer demand; the closure of several of the Company’s key locations, including its global headquarters in Redwood City, California and key studios across North America, Europe and Asia which could impact (1) the Company’s ability to meet product and live service development schedules, (2) the effectiveness of the Company’s quality controls and game testing measures, and (3) the Company’s ability to conduct normal business operations; the inability of third-party developers with whom the Company has partnerships to meet product development schedules; sustained closures of the physical stores of key retail partners and deterioration in the financial condition of such retail partners; delays in the release date and the decreased unit volume of next-generation consoles from the Company’s platform partners; volatility in foreign currency exchange rates; and other risks related to the COVID-19 pandemic that may be unforeseen as of the date of this release.
• General Business Risks: Sales of the Company’s products and services; the
Company’s ability to develop and support digital products and services, including managing online security and privacy; outages of our products, services and technological infrastructure; the Company’s ability to manage expenses; the competition in the interactive entertainment industry; governmental regulations; the effectiveness of the Company’s sales and marketing programs; the Company’s ability to realize the anticipated benefits of acquisitions; the Company’s ability to predict consumer preferences among competing platforms; the Company’s ability to develop and implement new technology; changes in our tax rates or tax laws timely development and release of the Company’s products and services; and the consumer demand for, and the availability of an adequate supply of console hardware units.
In addition, other factors which could cause the Company’s results to differ materially from its expectations are described in Part II, Item 1A of Electronic Arts’ latest Quarterly Report on Form 10-Q under the heading “Risk Factors” as well as in other documents we have filed with the Securities and Exchange Commission, including our Annual Report on Form 10-K for the fiscal year ended March 31, 2019. These forward-looking statements are current as of May 5, 2020. Electronic Arts assumes no obligation to revise or update any forward-looking statement for any reason, except as required by law. In addition, the preliminary financial results set forth in this release are estimates based on information currently available to Electronic Arts. While Electronic Arts believes these estimates are meaningful, they could differ from the actual amounts that Electronic Arts ultimately reports in its Annual Report on Form 10-K for the fiscal year ended March 31, 2020. Electronic Arts assumes no obligation and does not intend to update these estimates prior to filing its Form 10-K for the fiscal year ended March 31, 2020. About Electronic Arts Electronic Arts (NASDAQ: EA) is a global leader in digital interactive entertainment. The Company develops and delivers games, content and online services for Internet-connected

9
consoles, mobile devices and personal computers. In fiscal year 2020, EA posted GAAP net revenue of $5.5 billion. Headquartered in Redwood City, California, EA is recognized for a portfolio of critically acclaimed, high-quality brands such as EA SPORTS™ FIFA, Battlefield™, Apex Legends™, The Sims™, Madden NFL, Need for Speed™, Titanfall™ and Plants vs. Zombies™. More information about EA is available at www.ea.com/news. EA SPORTS, Battlefield, The Sims, Need for Speed, Apex Legends and Plants vs. Zombies are trademarks of Electronic Arts Inc. STAR WARS © & TM 2019 Lucasfilm Ltd. All rights reserved. John Madden, NFL and FIFA are the property of their respective owners and used with permission. For additional information, please contact: Chris Evenden John Reseburg Vice President, Investor Relations Vice President, Corporate Communications 650-628-0255 650-628-3601 [email protected] [email protected]

ELECTRONIC ARTS INC. AND SUBSIDIARIES Unaudited Condensed Consolidated Statements of Operations
(in $ millions, except per share data)
Three Months Ended
March 31, Twelve Months Ended
March 31,
2020 2019 2020 2019 Net revenue 1,387 1,238 5,537 4,950 Cost of revenue 269 276 1,369 1,322
Gross profit 1,118 962 4,168 3,628 Operating expenses:
Research and development 402 398 1,559 1,433 Marketing and sales 167 229 631 702 General and administrative 142 123 506 460 Acquisition-related contingent consideration — 11 5 14 Amortization of intangibles 6 5 22 23
Total operating expenses 717 766 2,723 2,632 Operating income 401 196 1,445 996 Interest and other income (expense), net 13 23 63 83 Income before provision for (benefit from) income taxes 414 219 1,508 1,079 Provision for (benefit from) income taxes (4 ) 10 (1,531 ) 60 Net income 418 209 3,039 1,019 Earnings per share
Basic 1.44 0.70 10.37 3.36 Diluted 1.43 0.69 10.30 3.33
Number of shares used in computation Basic 290 299 293 303 Diluted 292 301 295 306

Results (in $ millions, except per share data) The following table reports the variance of the actuals versus our guidance provided on January 30, 2020 for the three months ended March 31, 2020 plus a comparison to the actuals for the three months ended March 31, 2019.
Three Months Ended March 31,
2020 2020 2019
Guidance Variance Actuals Actuals
Net revenue Net revenue 1,325 62 1,387 1,238 GAAP-based financial data
Change in deferred net revenue (online-enabled games)1 (131 ) — (131 ) 173 Mobile platform fees2 (42 ) (1 ) (43 ) (47 )
Cost of revenue Cost of revenue 257 12 269 276 GAAP-based financial data
Acquisition-related expenses (3 ) — (3 ) (1 ) Stock-based compensation — (1 ) (1 ) (1 ) Mobile platform fees2 (42 ) (1 ) (43 ) (47 )
Operating expenses Operating expenses 724 (7 ) 717 766 GAAP-based financial data
Acquisition-related expenses (7 ) 1 (6 ) (16 ) Stock-based compensation (94 ) 4 (90 ) (72 )
Income before tax Income before tax 359 55 414 219 GAAP-based financial data
Acquisition-related expenses 10 (1 ) 9 17 Change in deferred net revenue (online-enabled games)1 (131 ) — (131 ) 173 Mobile platform fees2 — — — — Stock-based compensation 94 (3 ) 91 73
Tax rate used for management reporting 18 % 18 % 18 % Earnings per share
Basic 1.06 0.38 1.44 0.70 Diluted 1.05 0.38 1.43 0.69
Number of shares Basic 291 (1 ) 290 299 Diluted 293 (1 ) 292 301
1The change in deferred net revenue (online-enabled games) in the unaudited condensed consolidated statements of cash flows does not necessarily equal the change in deferred net revenue (online-enabled games) in the unaudited condensed consolidated statements of operations primarily due to the impact of unrecognized gains/losses on cash flow hedges.
2Mobile Platform Fees differ from Platform Fees due to fees on platforms other than mobile.

ELECTRONIC ARTS INC. AND SUBSIDIARIES Unaudited Condensed Consolidated Balance Sheets
(in $ millions) March 31, 2020 March 31, 20193
ASSETS Current assets:
Cash and cash equivalents 3,768 4,708
Short-term investments 1,967 737
Receivables, net 461 623
Other current assets 321 313
Total current assets 6,517 6,381 Property and equipment, net 449 448
Goodwill 1,885 1,892
Acquisition-related intangibles, net 53 87
Deferred income taxes, net 1,903 35
Other assets 305 114
TOTAL ASSETS 11,112 8,957
LIABILITIES AND STOCKHOLDERS’ EQUITY Current liabilities:
Accounts payable 68 113
Accrued and other current liabilities 1,052 1,052
Deferred net revenue (online-enabled games) 945 1,100
Senior notes, current, net 599 —
Total current liabilities 2,664 2,265 Senior notes, net 397 994
Income tax obligations 373 233
Deferred income taxes, net 1 2
Other liabilities 216 132
Total liabilities 3,651 3,626 Stockholders’ equity:
Common stock 3 3
Retained earnings 7,508 5,358
Accumulated other comprehensive loss (50 ) (30 ) Total stockholders’ equity 7,461 5,331
TOTAL LIABILITIES AND STOCKHOLDERS’ EQUITY 11,112 8,957
3Derived from audited consolidated financial statements.

ELECTRONIC ARTS INC. AND SUBSIDIARIES Unaudited Condensed Consolidated Statements of Cash Flows
(in $ millions) Three Months Ended
March 31, Twelve Months Ended March 31,
2020 2019 2020 20193
OPERATING ACTIVITIES Net income 418 209 3,039 1,019
Adjustments to reconcile net income to net cash provided by operating activities:
Depreciation, amortization and accretion 39 37 150 145 Acquisition-related contingent consideration 5 14 5 14 Stock-based compensation 91 73 347 284 Change in assets and liabilities
Receivables, net 340 183 164 (88 ) Other assets (41 ) (65 ) 35 (24 ) Accounts payable (3 ) 24 (36 ) 59 Accrued and other liabilities (145 ) (120 ) 119 3 Deferred income taxes, net (78 ) 73 (1,871 ) (16 ) Deferred net revenue (online-enabled games) (128 ) 171 (155 ) 151
Net cash provided by operating activities 498 599 1,797 1,547 INVESTING ACTIVITIES
Capital expenditures (40 ) (35 ) (140 ) (119 ) Proceeds from maturities and sales of short-term investments 767 733 2,142 1,688 Purchase of short-term investments (738 ) (198 ) (3,359 ) (1,342 ) Acquisitions, net of cash acquired — — — (58 )
Net cash provided by (used in) investing activities (11 ) 500 (1,357 ) 169 FINANCING ACTIVITIES
Proceeds from issuance of common stock 28 25 62 61 Cash paid to taxing authorities for shares withheld from employees (5 ) (6 ) (91 ) (122 ) Repurchase and retirement of common stock (291 ) (301 ) (1,207 ) (1,192 ) Payment of contingent consideration (32 ) — (122 ) —
Net cash used in financing activities (300 ) (282 ) (1,358 ) (1,253 ) Effect of foreign exchange on cash and cash equivalents (22 ) 4 (22 ) (13 ) Change in cash and cash equivalents 165 821 (940 ) 450 Beginning cash and cash equivalents 3,603 3,887 4,708 4,258 Ending cash and cash equivalents 3,768 4,708 3,768 4,708
3Derived from audited consolidated financial statements.

ELECTRONIC ARTS INC. AND SUBSIDIARIES
Unaudited Supplemental Financial Information and Business Metrics
(in $ millions, except per share data)
Q4 Q1 Q2 Q3 Q4 YOY %
FY19 FY20 FY20 FY20 FY20 Change
Net revenue Net revenue 1,238 1,209 1,348 1,593 1,387 12 %
GAAP-based financial data Change in deferred net revenue (online-enabled games)1 173 (427 ) (35 ) 428 (131 ) Mobile platform fees2 (47 ) (39 ) (36 ) (43 ) (43 )
Gross profit Gross profit 962 1,022 943 1,085 1,118 16 %
Gross profit (as a % of net revenue) 78 % 85 % 70 % 68 % 81 % GAAP-based financial data
Acquisition-related expenses 1 2 2 5 3 Change in deferred net revenue (online-enabled games)1 173 (427 ) (35 ) 428 (131 ) Mobile platform fees2 — — — — — Stock-based compensation 1 1 1 1 1
Operating income Operating income 196 415 268 361 401 105 %
Operating income (as a % of net revenue) 16 % 34 % 20 % 23 % 29 % GAAP-based financial data
Acquisition-related expenses 17 8 10 12 9 Change in deferred net revenue (online-enabled games)1 173 (427 ) (35 ) 428 (131 ) Stock-based compensation 73 73 92 91 91
Net income Net income 209 1,421 854 346 418 100 %
Net income (as a % of net revenue) 17 % 118 % 63 % 22 % 30 % GAAP-based financial data
Acquisition-related expenses 17 8 10 12 9 Change in deferred net revenue (online-enabled games)1 173 (427 ) (35 ) 428 (131 ) Stock-based compensation 73 73 92 91 91
Tax rate used for management reporting 18 % 18 % 18 % 18 % 18 % Diluted earnings per share 0.69 4.75 2.89 1.18 1.43 107 %
Number of diluted shares used in computation Basic 299 297 295 292 290 Diluted 301 299 296 294 292
1The change in deferred net revenue (online-enabled games) in the unaudited condensed consolidated statements of cash flows does not necessarily equal the change in deferred net revenue (online-enabled games) in the unaudited condensed consolidated statements of operations primarily due to the impact of unrecognized gains/losses on cash flow hedges.
2Mobile Platform Fees differ from Platform Fees due to fees on platforms other than mobile.

ELECTRONIC ARTS INC. AND SUBSIDIARIES
Unaudited Supplemental Financial Information and Business Metrics
(in $ millions)
Q4 Q1 Q2 Q3 Q4 YOY
% FY19 FY20 FY20 FY20 FY20 Change
QUARTERLY NET REVENUE PRESENTATIONS Net revenue by composition
Full game downloads 169 132 180 286 211 25 %
Live services 714 731 573 677 832 17 %
Mobile4 182 186 169 161 176 (3 %)
Total digital 1,065 1,049 922 1,124 1,219 14 %
Packaged goods and other 173 160 426 469 168 (3 %)
Total net revenue 1,238 1,209 1,348 1,593 1,387 12 %
Total digital 86 % 87 % 68 % 71 % 88 % Packaged goods and other 14 % 13 % 32 % 29 % 12 %
Total net revenue % 100 % 100 % 100 % 100 % 100 % GAAP-based financial data
Full game downloads 44 (57 ) (5 ) 31 (21 ) Live services 131 (227 ) (80 ) 316 (43 ) Mobile4 — (25 ) (11 ) 16 5
Total digital 175 (309 ) (96 ) 363 (59 ) Packaged goods and other (2 ) (118 ) 61 65 (72 )
Total change in deferred net revenue (online-enabled games) by composition1 173 (427 ) (35 ) 428 (131 ) Mobile platform fees2 (47 ) (39 ) (36 ) (43 ) (43 )
Net revenue by platform Console 826 760 923 1,163 928 12 %
PC/Browser 217 249 242 257 269 24 %
Mobile 190 196 177 169 185 (3 %)
Other 5 4 6 4 5 — Total net revenue 1,238 1,209 1,348 1,593 1,387 12 %
GAAP-based financial data Console 87 (344 ) 8 388 (143 ) PC/Browser 88 (59 ) (31 ) 24 7 Mobile (2 ) (25 ) (11 ) 16 5 Other — 1 (1 ) — — Total change in deferred net revenue (online-enabled games) by platform1 173 (427 ) (35 ) 428 (131 ) Mobile platform fees2 (47 ) (39 ) (36 ) (43 ) (43 )
1The change in deferred net revenue (online-enabled games) in the unaudited condensed consolidated statements of cash flows does not necessarily equal the change in deferred net revenue (online-enabled games) in the unaudited condensed consolidated statements of operations primarily due to the impact of unrecognized gains/losses on cash flow hedges.
2Mobile Platform Fees differ from Platform Fees due to fees on platforms other than mobile.
4Mobile Digital: excludes non-Digital mobile items such as licensing

ELECTRONIC ARTS INC. AND SUBSIDIARIES
Unaudited Supplemental Financial Information and Business Metrics
(in $ millions)
Q4 Q1 Q2 Q3 Q4 YOY %
FY19 FY20 FY20 FY20 FY20 Change
CASH FLOW DATA Operating cash flow 599 158 37 1,104 498 (17 %) Operating cash flow - TTM 1,547 1,585 1,748 1,898 1,797 16 % Capital expenditures 35 45 27 28 40 14 % Capital expenditures - TTM 119 132 128 135 140 18 % Repurchase and retirement of common stock 301 305 306 305 291 (3 %)
DEPRECIATION Depreciation expense 31 30 30 29 31 —
BALANCE SHEET DATA Cash and cash equivalents 4,708 3,533 2,940 3,603 3,768 Short-term investments 737 1,654 1,943 1,999 1,967
Cash and cash equivalents, and short-term investments 5,445 5,187 4,883 5,602 5,735 5 % Receivables, net 623 329 856 798 461 (26 %)
STOCK-BASED COMPENSATION Cost of revenue 1 1 1 1 1 Research and development 49 49 61 60 59 Marketing and sales 9 7 10 10 10 General and administrative 14 16 20 20 21
Total stock-based compensation 73 73 92 91 91